Sales Growth Comparison Chart & Table Template for PowerPoint & Google Slides

Description
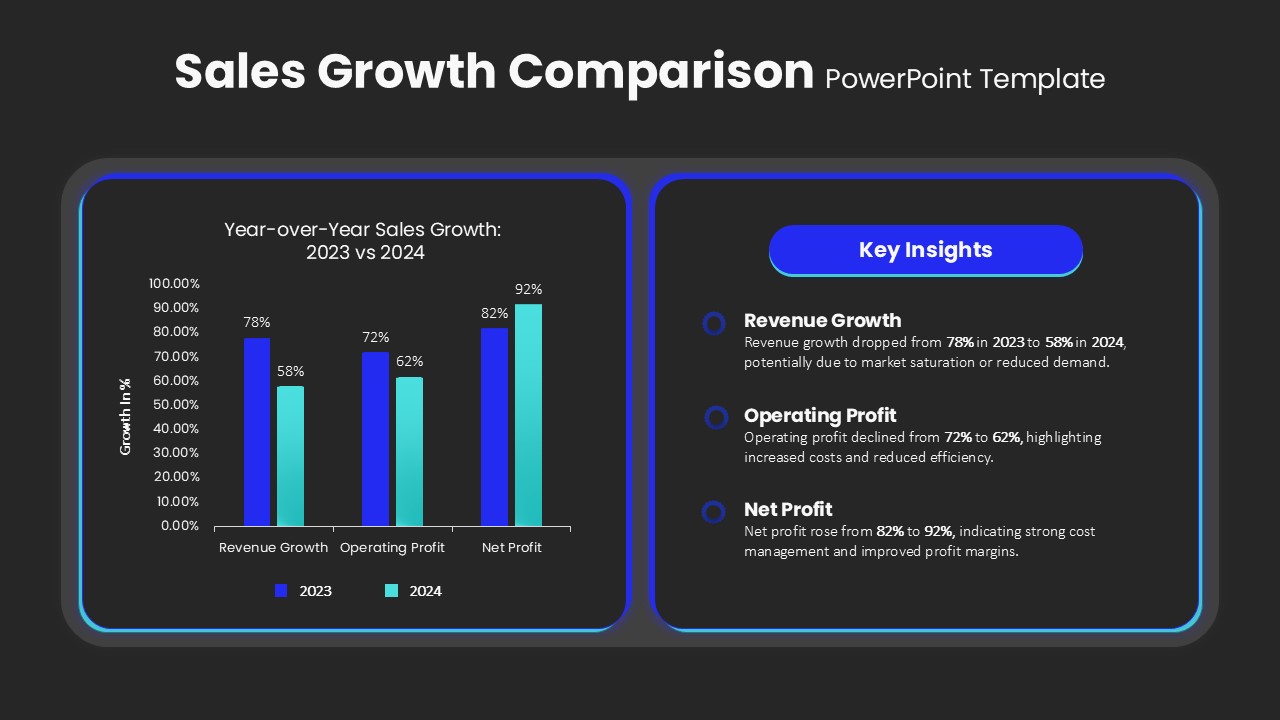
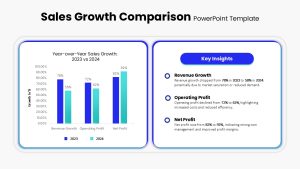
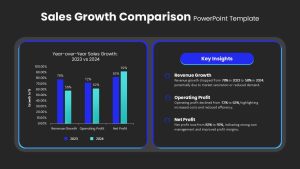
Showcase year-over-year and monthly sales performance with this two-slide Sales Growth Comparison template pack. The first slide features a dual bar chart comparing 2023 vs 2024 growth for Revenue, Operating Profit, and Net Profit—all framed in a rounded-corner container. A “Key Insights” callout on the right uses bold headlines, circular icons, and concise text to highlight the drop in revenue and operating profit alongside net profit gains.
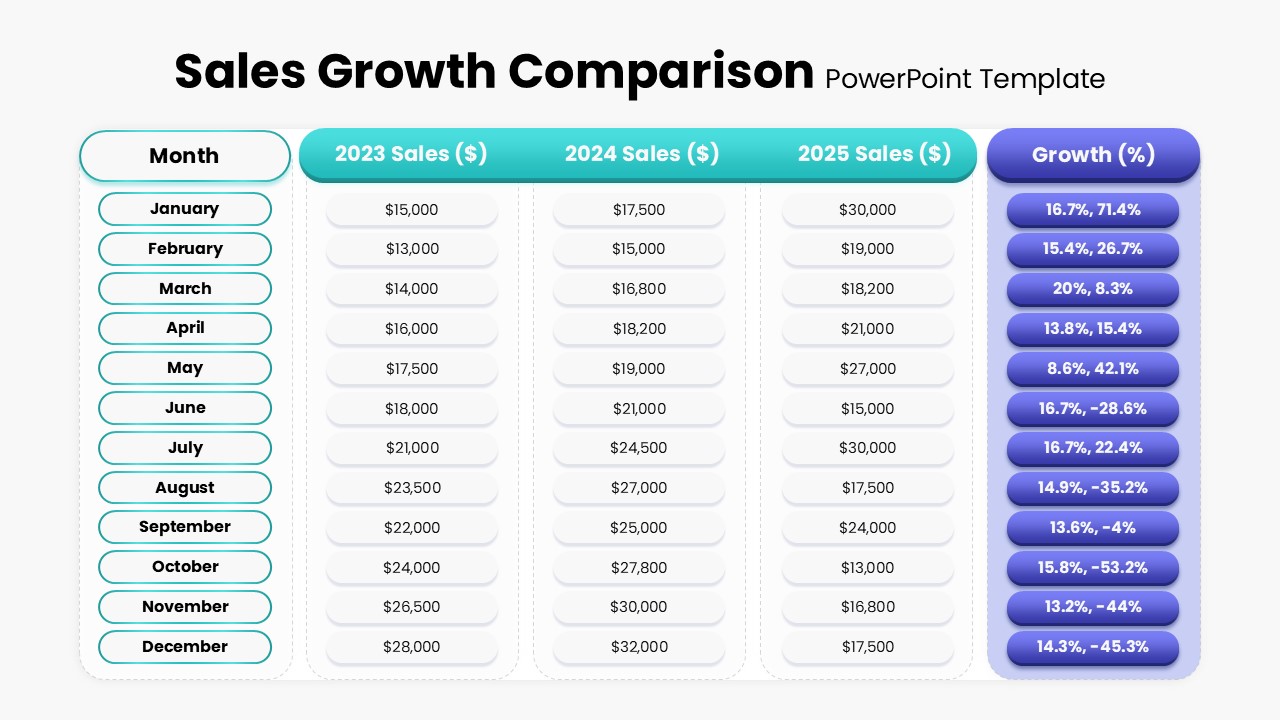
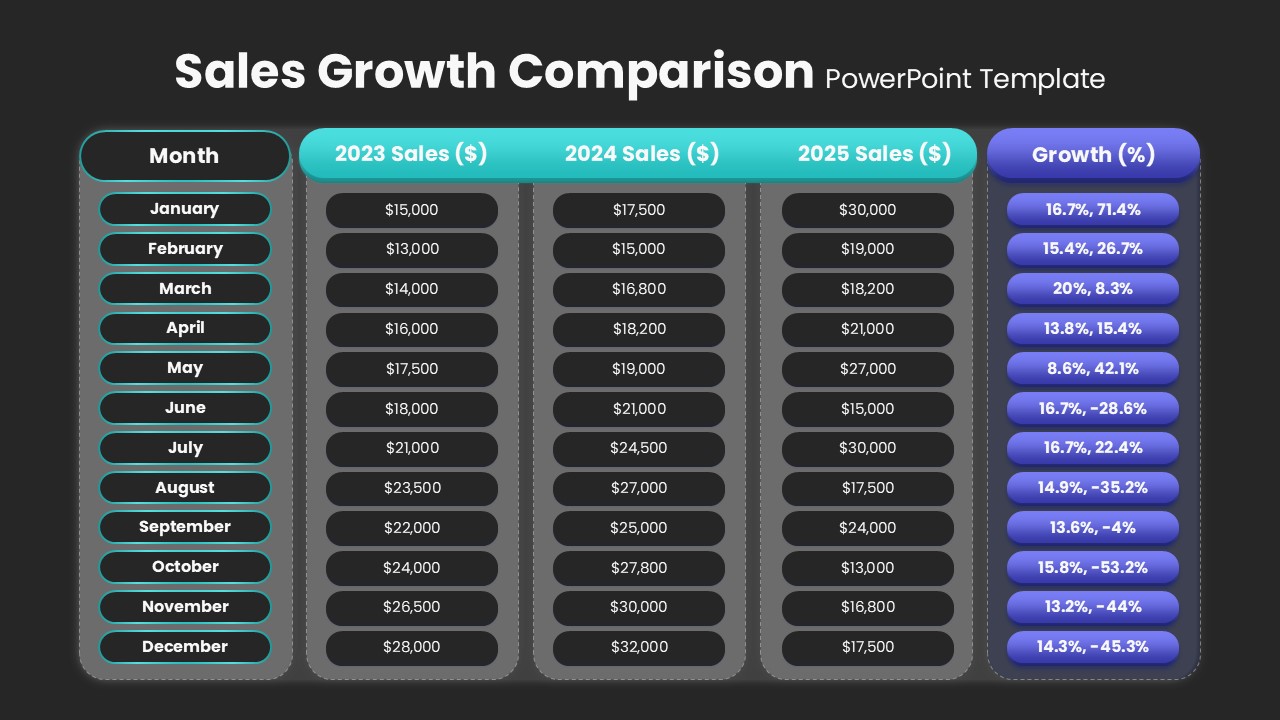
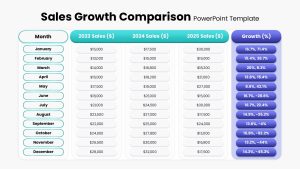
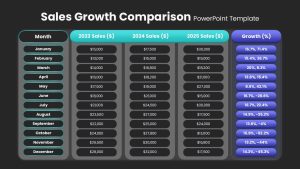
The second slide delivers a detailed monthly sales table for 2023, 2024, and 2025, with a vibrant Growth (%) column emphasized by pill-shaped backgrounds. Months are listed in a bordered panel; sales figures appear in subtly shaded, rounded cells for readability. Both slides use a clean white background, consistent typography, and master layouts to ensure seamless edits.
Built on master slides, simply swap in your chart data via Excel links in PowerPoint or manual entries in Google Sheets. The modular design lets you duplicate or reorder slides for additional years or KPIs. Repurpose the table for regional breakdowns, product line comparisons, or budget reviews by adjusting headers and applying your corporate palette. Pre-formatted cell styles and data labels maintain consistency, while vector shapes and charts remain crisp at any resolution.
Whether you’re running quarterly reviews, board presentations, or investor briefings, this template pack streamlines slide creation and enforces brand standards—so you can focus on insights and recommendations.
Who is it for
Financial analysts, sales managers, and executives will leverage these slides to illustrate performance trends, drive data-led discussions, and support strategic decision-making in quarterly reports or stakeholder briefings.
Other Uses
Adapt this pack for marketing ROI comparisons, product line performance, expense tracking, or KPI dashboards. Update labels, swap chart types, and customize colors to suit any data-driven narrative.
Login to download this file

Item ID
SB04836
Related Templates

Two-Option Bar Chart Comparison Table Template for PowerPoint & Google Slides
Comparison

Growth Arrow for Progress & Growth template for PowerPoint & Google Slides
Arrow
Simple Comparison Table Template for PowerPoint & Google Slides
Comparison
Four-Tier Pricing Comparison Table Template for PowerPoint & Google Slides
Comparison
Four-Plan Pricing Table Comparison Template for PowerPoint & Google Slides
Comparison
Dynamic Multicolor Comparison Table Template for PowerPoint & Google Slides
Comparison

Comparison Pricing Table Infographic Template for PowerPoint & Google Slides
Comparison Chart
Five-Option Text Boxes Table Comparison Template for PowerPoint & Google Slides
Business Report
Product Feature Comparison Table Template for PowerPoint & Google Slides
Comparison Chart
Comparison Table Presentation Template for PowerPoint & Google Slides
Table
Colorful Comparison Table Presentation Template for PowerPoint & Google Slides
Table
Colorful Business Data Comparison Table Template for PowerPoint & Google Slides
Table
Five Column Comparison Table Layout Template for PowerPoint & Google Slides
Comparison
Pros and Cons Comparison Table Template for PowerPoint & Google Slides
Comparison Chart
Sales Growth Dashboard: KPI Gauge & Line Template for PowerPoint & Google Slides
Revenue
Business Growth Metaphor Chart Template for PowerPoint & Google Slides
Business
Growth Curve Line Chart Visualization Template for PowerPoint & Google Slides
Charts
Annual Growth Trend Analysis Chart template for PowerPoint & Google Slides
Business Report
Comparison Bar Chart template for PowerPoint & Google Slides
Comparison Chart
Four Section Comparison Chart Diagram Template for PowerPoint & Google Slides
Infographics
Interactive Product Comparison Bar Chart Template for PowerPoint & Google Slides
Bar/Column
Comparison Chart Overview template for PowerPoint & Google Slides
Comparison Chart
Tornado Chart Data Comparison Slide Template for PowerPoint & Google Slides
Bar/Column
Radar Chart Product Comparison Template for PowerPoint & Google Slides
Comparison Chart

BMI Category Comparison Chart Template for PowerPoint & Google Slides
Comparison
Circular Product Comparison Chart Template for PowerPoint & Google Slides
Comparison Chart
Pugh Matrix Decision Comparison Chart Template for PowerPoint & Google Slides
Comparison Chart
Dynamic Benchmarking Comparison Chart Template for PowerPoint & Google Slides
Comparison Chart
People Demographic Comparison Chart Template for PowerPoint & Google Slides
Comparison
Clustered Bar Chart Comparison Template for PowerPoint & Google Slides
Bar/Column
Business Timeline Comparison Bar Chart Template for PowerPoint & Google Slides
Comparison Chart
Grouped Column Chart Comparison Template for PowerPoint & Google Slides
Bar/Column
Multiple Line Chart Comparison Template for PowerPoint & Google Slides
Comparison Chart
Mirror Bar Chart Comparison Template for PowerPoint & Google Slides
Bar/Column
Free Versatile Product Comparison Chart Template for PowerPoint & Google Slides
Charts
Free
Dynamic Bar-of-Pie Chart Comparison Template for PowerPoint & Google Slides
Pie/Donut
ESG Initiatives Comparison Chart Template for PowerPoint & Google Slides
Business
Quarterly Revenue Comparison Bar Chart Template for PowerPoint & Google Slides
Bar/Column
Competitor Comparison Chart Design Template for PowerPoint & Google Slides
Comparison
Profile Comparison Chart template for PowerPoint & Google Slides
Comparison Chart
Skills Gap Analysis Comparison Chart Template for PowerPoint & Google Slides
Gap
Feasibility Matrix Comparison Chart Template for PowerPoint & Google Slides
Comparison Chart
Quarterly Comparison Pie Chart Template for PowerPoint & Google Slides
Pie/Donut
Professional Table of Organization Chart Template for PowerPoint & Google Slides
Org Chart
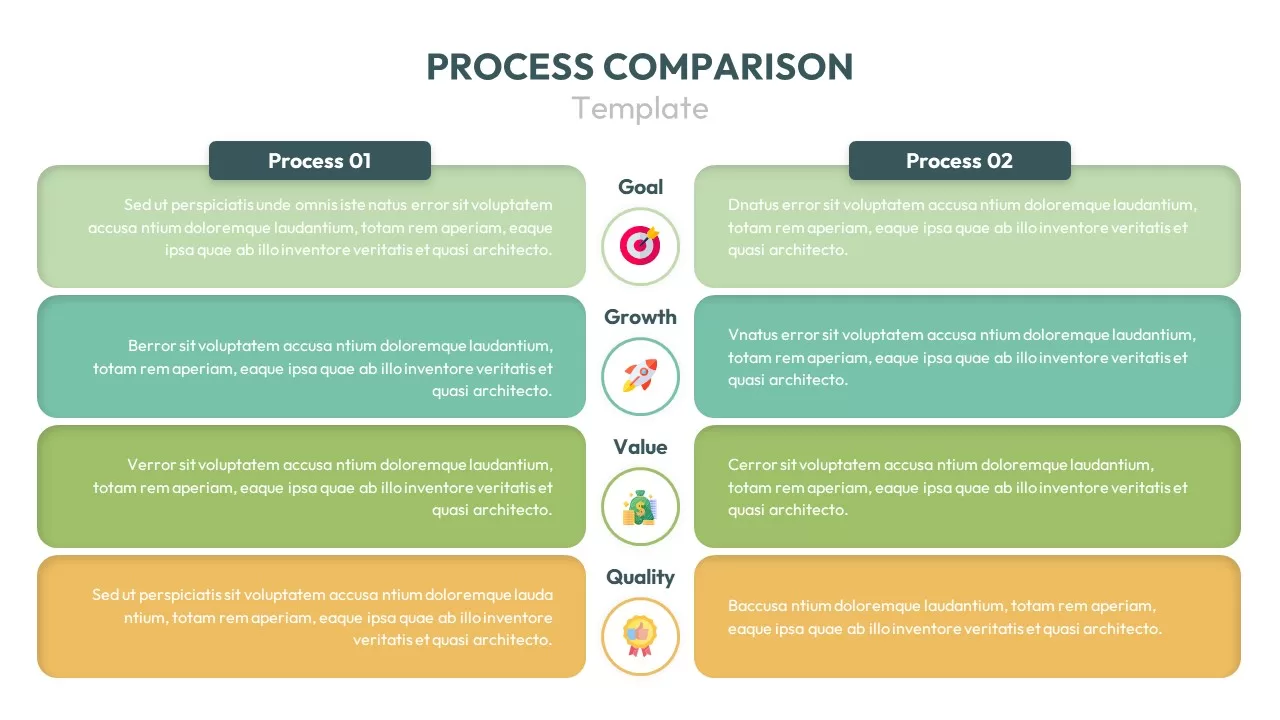
Process Comparison Chart for PowerPoint & Google Slides
Infographics

3D Column Chart with Data Table for PowerPoint & Google Slides
Bar/Column
Sales vs Budget Performance Chart Template for PowerPoint & Google Slides
Bar/Column
Car Sales Market Share Pie Chart Template for PowerPoint & Google Slides
BCG
Quarterly Sales Review Bar Chart Template for PowerPoint & Google Slides
Bar/Column
Sales Bar Chart for PowerPoint & Google Slides
Bar/Column

Comparison Donut Chart PowerPoint Template and Keynote
Pie/Donut
Service Zoom Feature Slides Comparison template for PowerPoint & Google Slides
Process
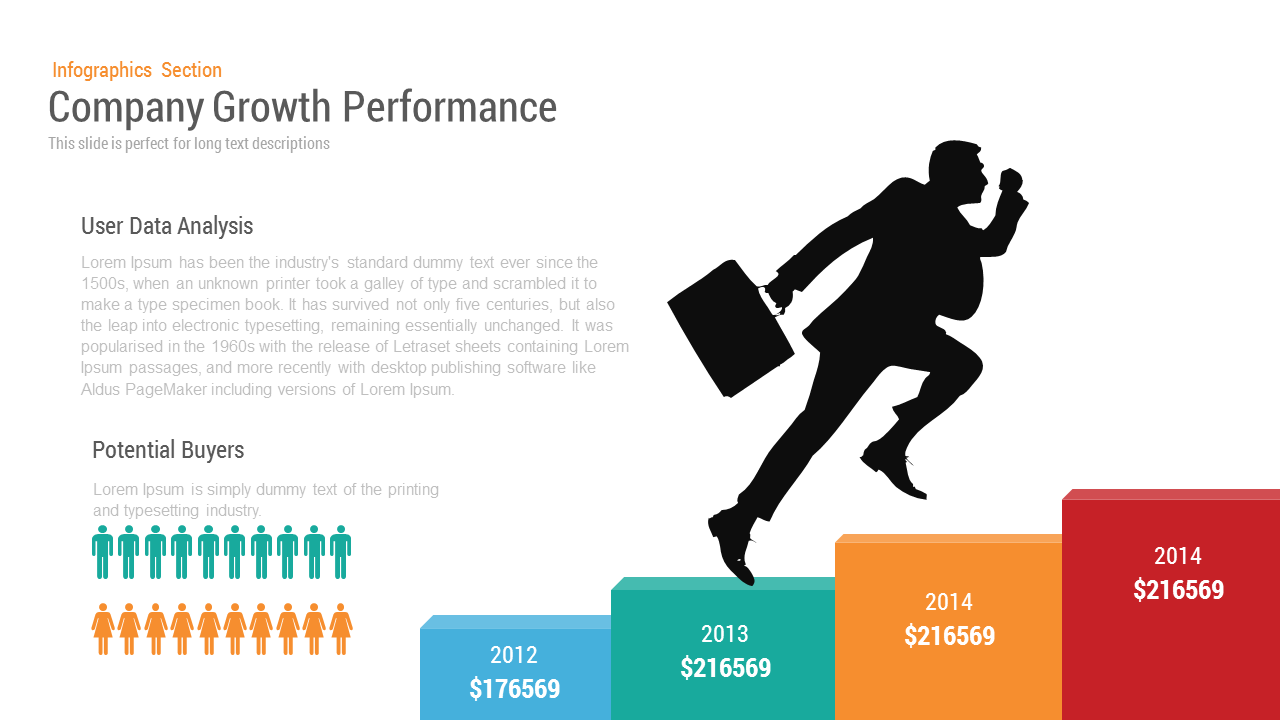
Company Growth template for PowerPoint & Google Slides
Charts
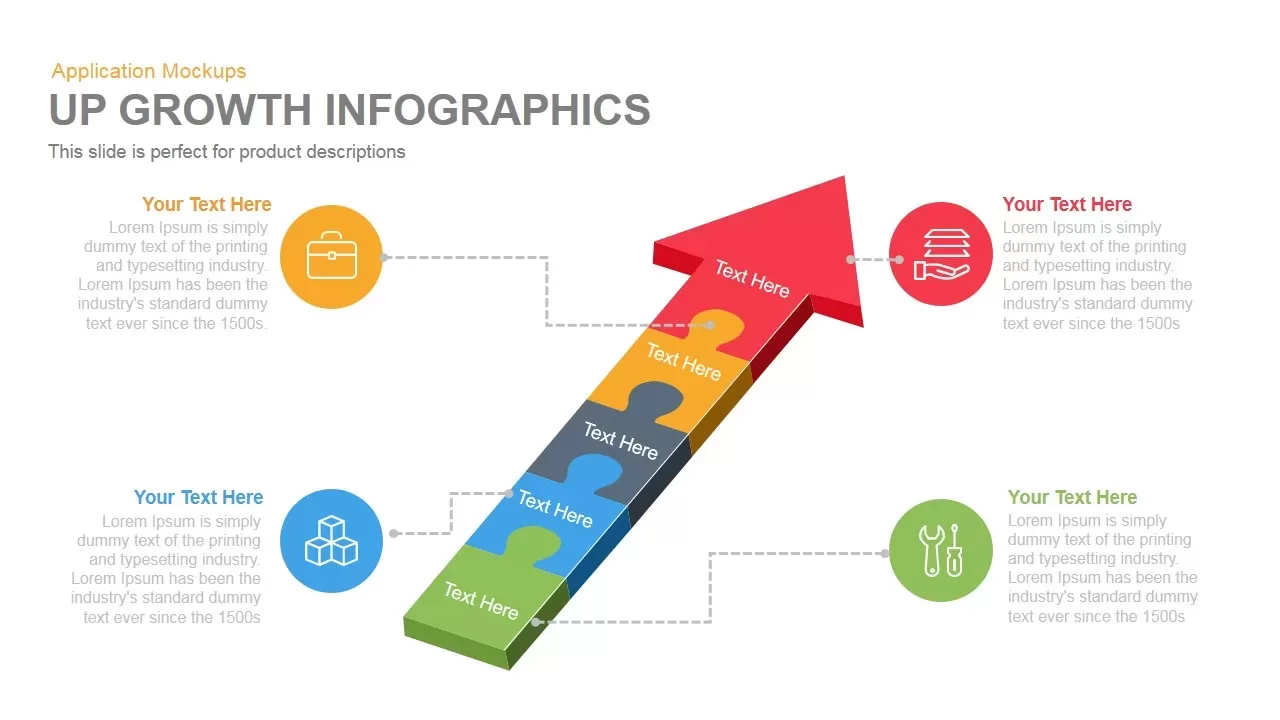
Growth Infographics template for PowerPoint & Google Slides
Arrow
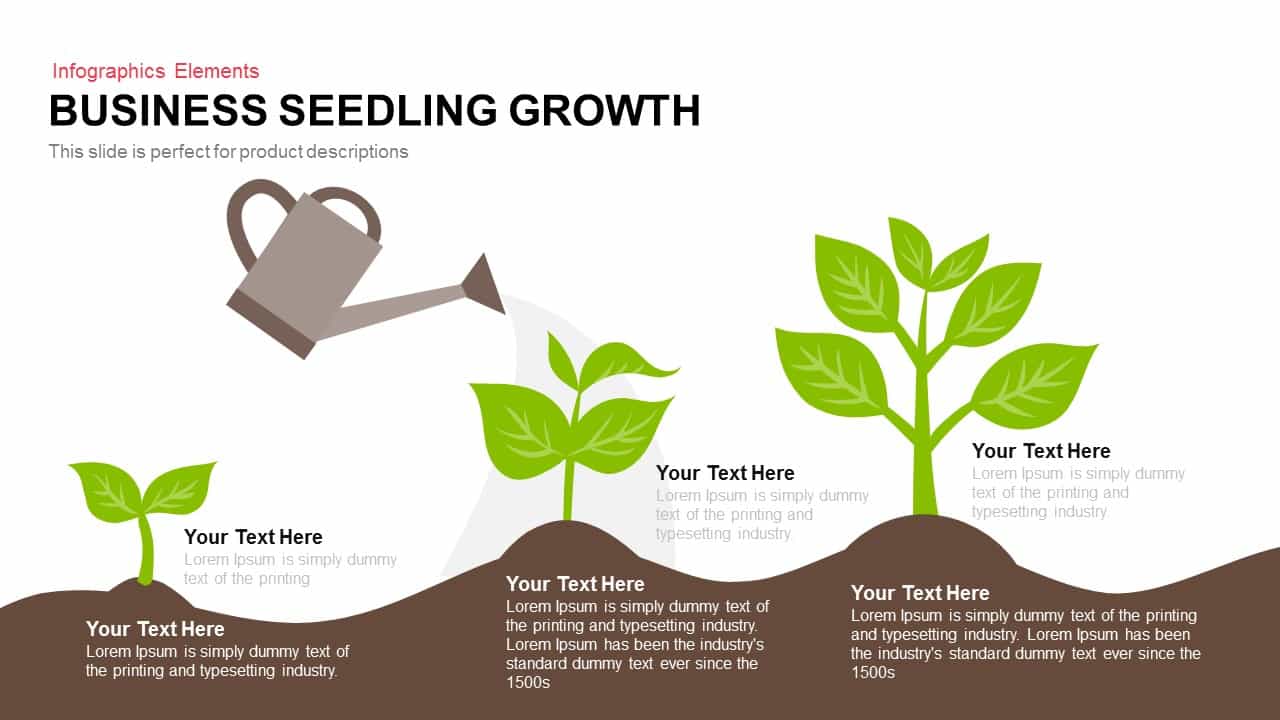
Business Seedling Growth Template for PowerPoint & Google Slides
Infographics
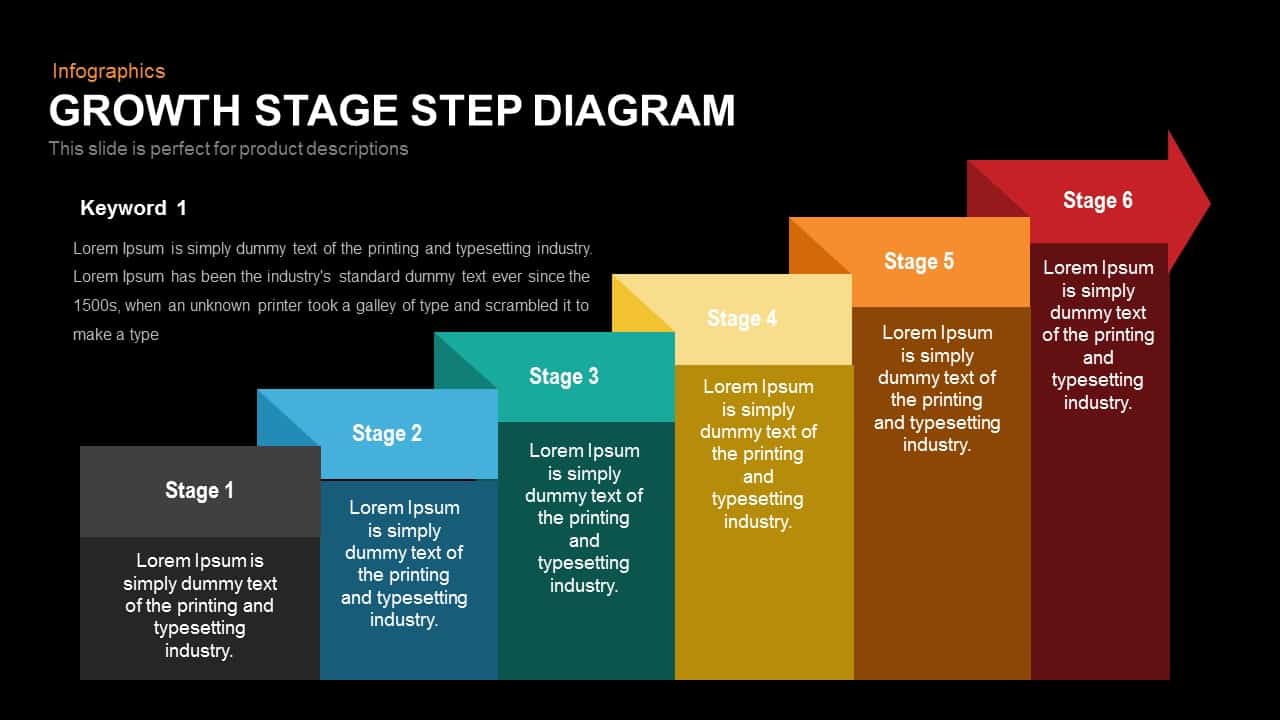
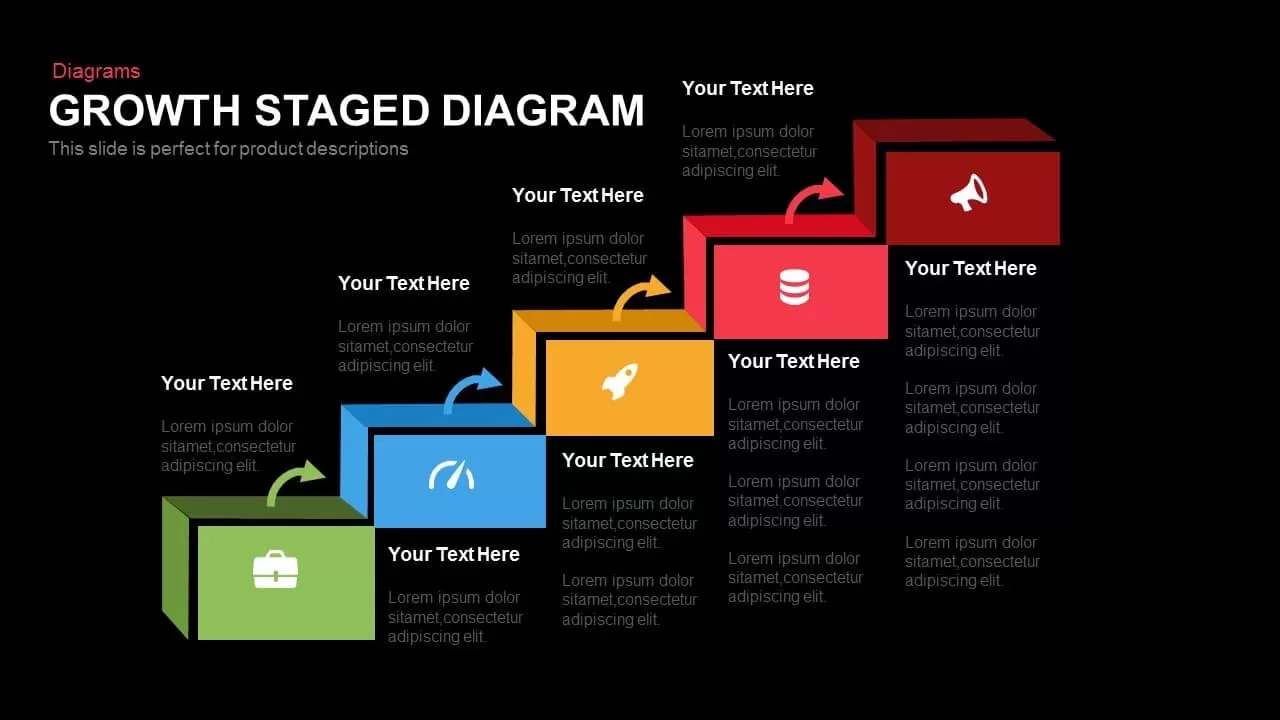
Growth Stage Diagram template for PowerPoint & Google Slides
Process
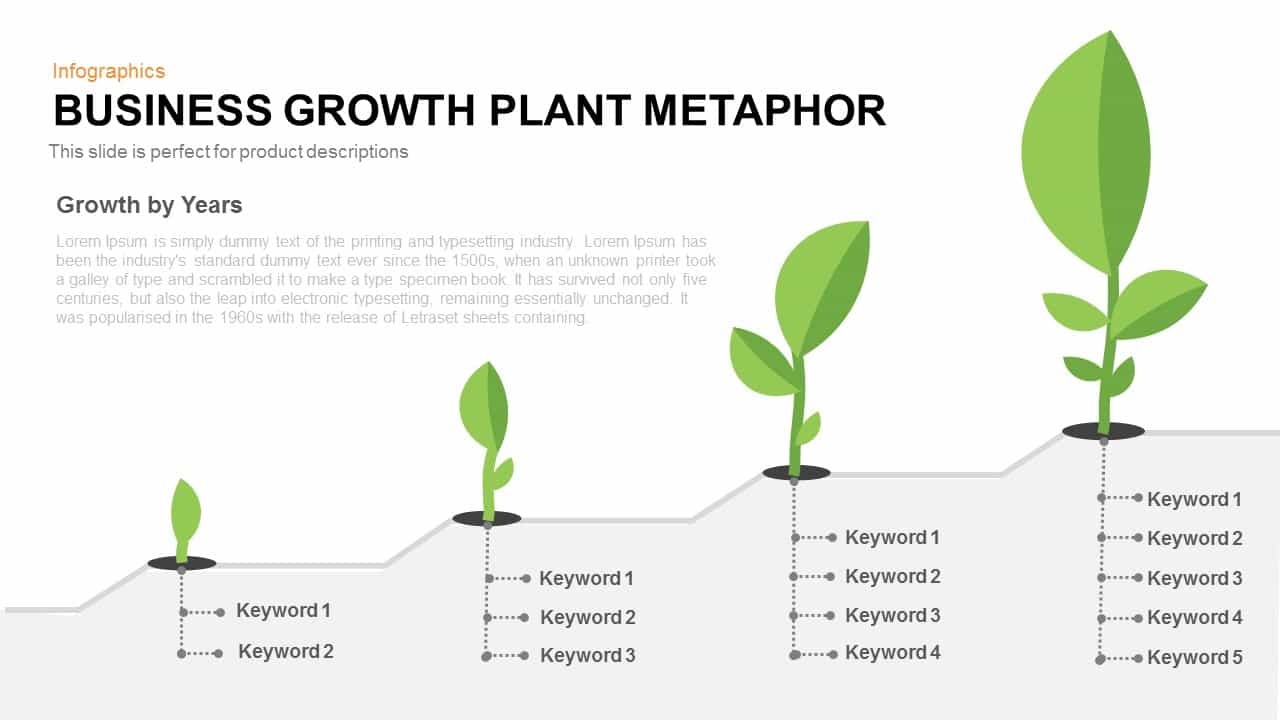
Business Growth Plant Metaphor Timeline Template for PowerPoint & Google Slides
Business Strategy
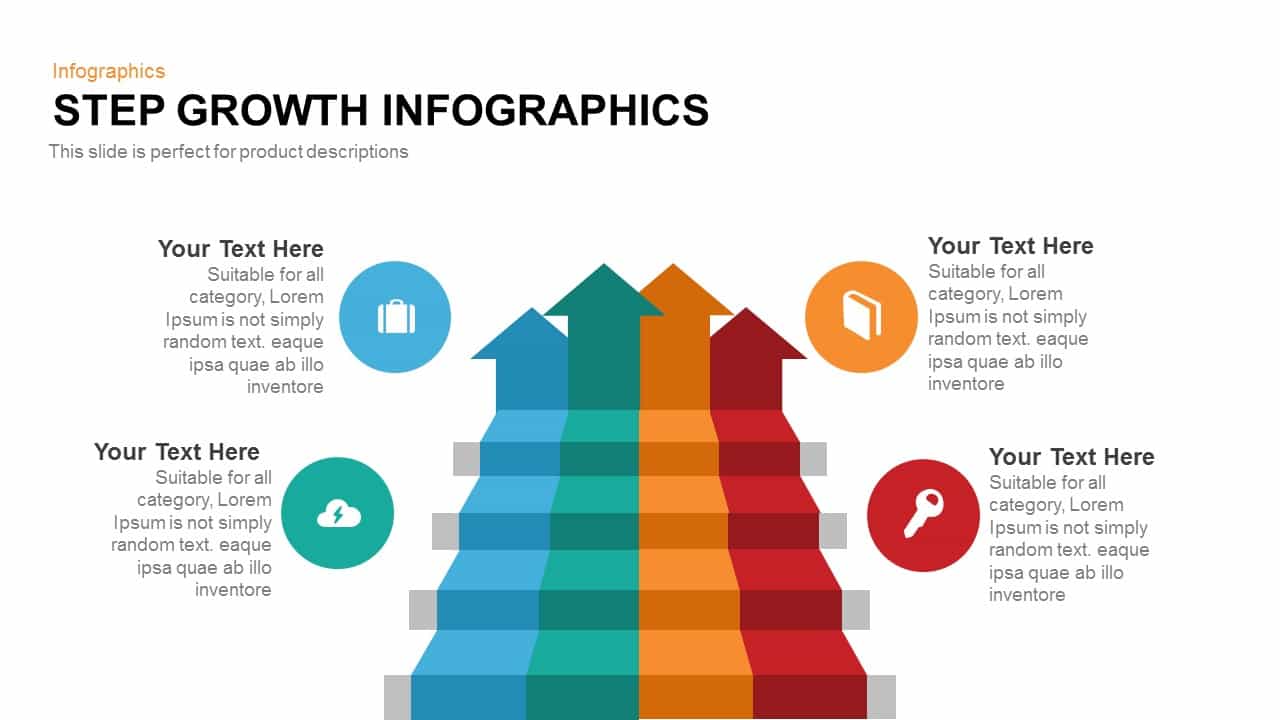
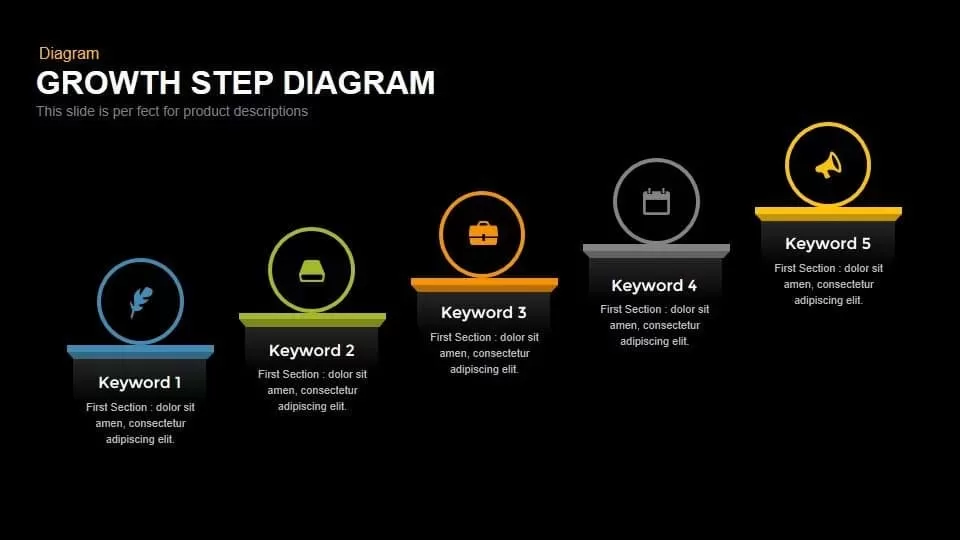
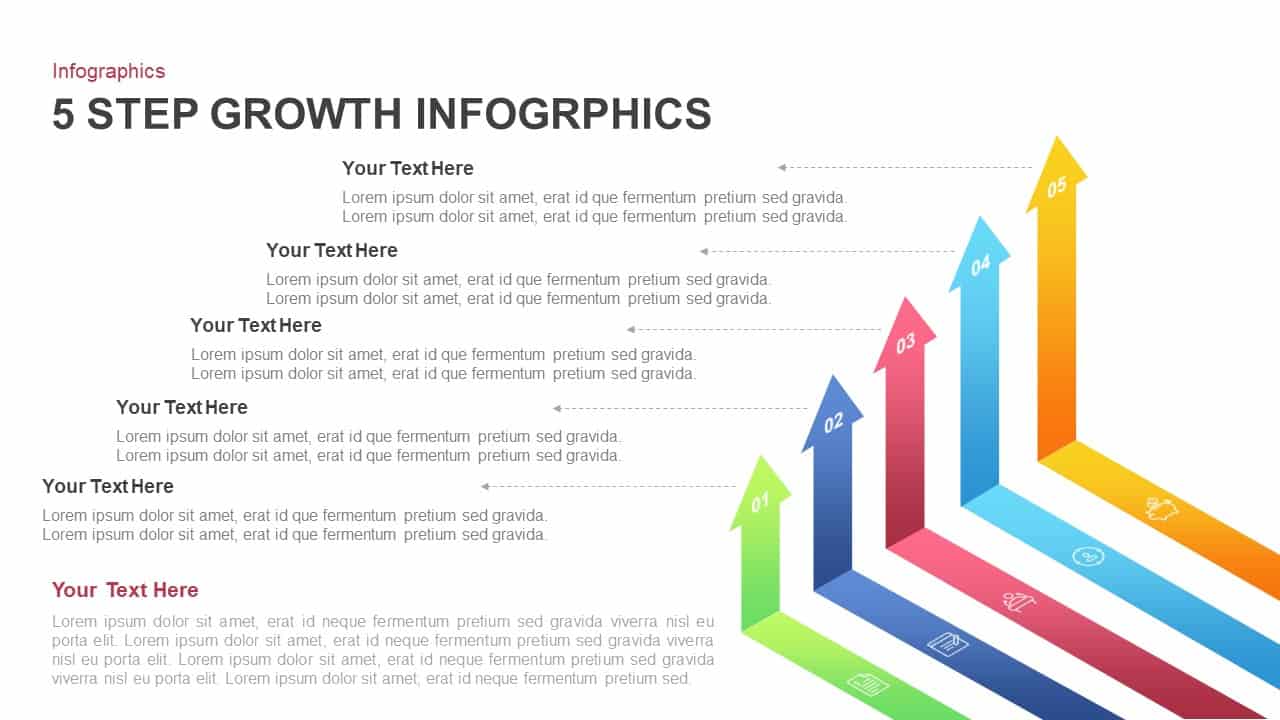
Modern Step Growth Infographics Template for PowerPoint & Google Slides
Process
Five 3D Growth Arrow Infographic Slide Template for PowerPoint & Google Slides
Arrow
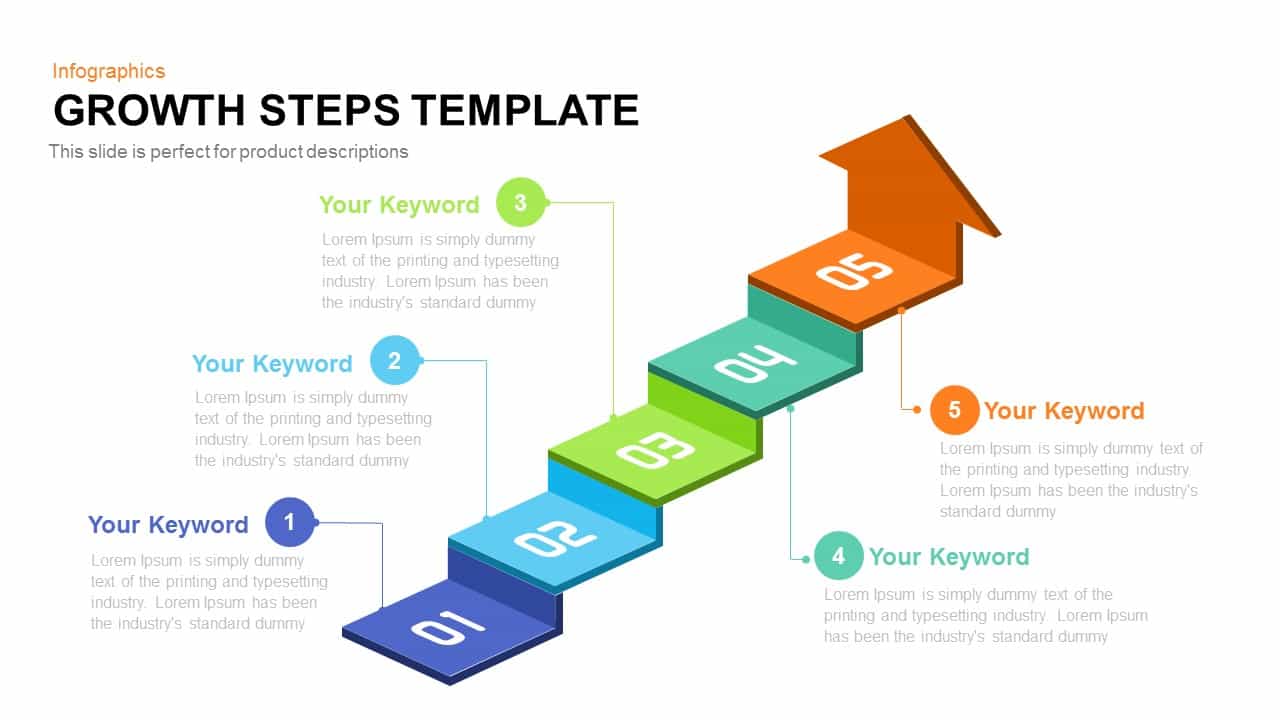
5-Step Growth Staircase Infographic Template for PowerPoint & Google Slides
Process
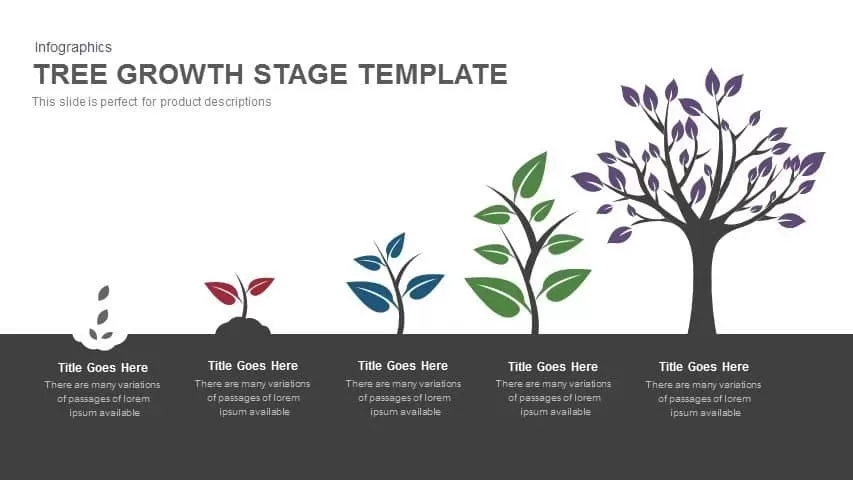
Tree Growth Stage Infographic Template for PowerPoint & Google Slides
Timeline
Five-Step Growth Stage Staircase Diagram Template for PowerPoint & Google Slides
Process

Modern Five-Step Growth Diagram Template for PowerPoint & Google Slides
Process
Improvement Growth Arrow Metaphor Template for PowerPoint & Google Slides
Bar/Column
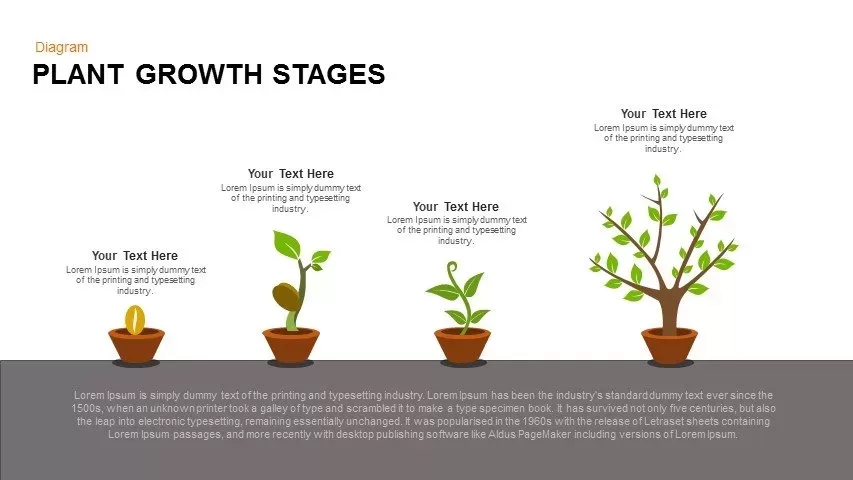
Editable Plant Growth Stages Diagram Template for PowerPoint & Google Slides
Process
Growth Sign Board Infographics template for PowerPoint & Google Slides
Timeline
Six Stage Incremental Growth template for PowerPoint & Google Slides
Timeline
4 Step Revenue Growth Flow Diagram Template for PowerPoint & Google Slides
Process
Dynamic Growth Arrow Step Infographic Template for PowerPoint & Google Slides
Process
Business Growth Ladder to Cloud Metaphor Template for PowerPoint & Google Slides
Vision and Mission
4-Step Growth & Success Infographics Template for PowerPoint & Google Slides
Accomplishment
5-Step Growth Arrow Infographics Template for PowerPoint & Google Slides
Arrow
Greiner Growth Model Six-Phase Diagram Template for PowerPoint & Google Slides
Business Models
5-Stage Financial Growth Timeline Template for PowerPoint & Google Slides
Timeline
Ansoff Growth Matrix Strategy Diagram Template for PowerPoint & Google Slides
Business Strategy
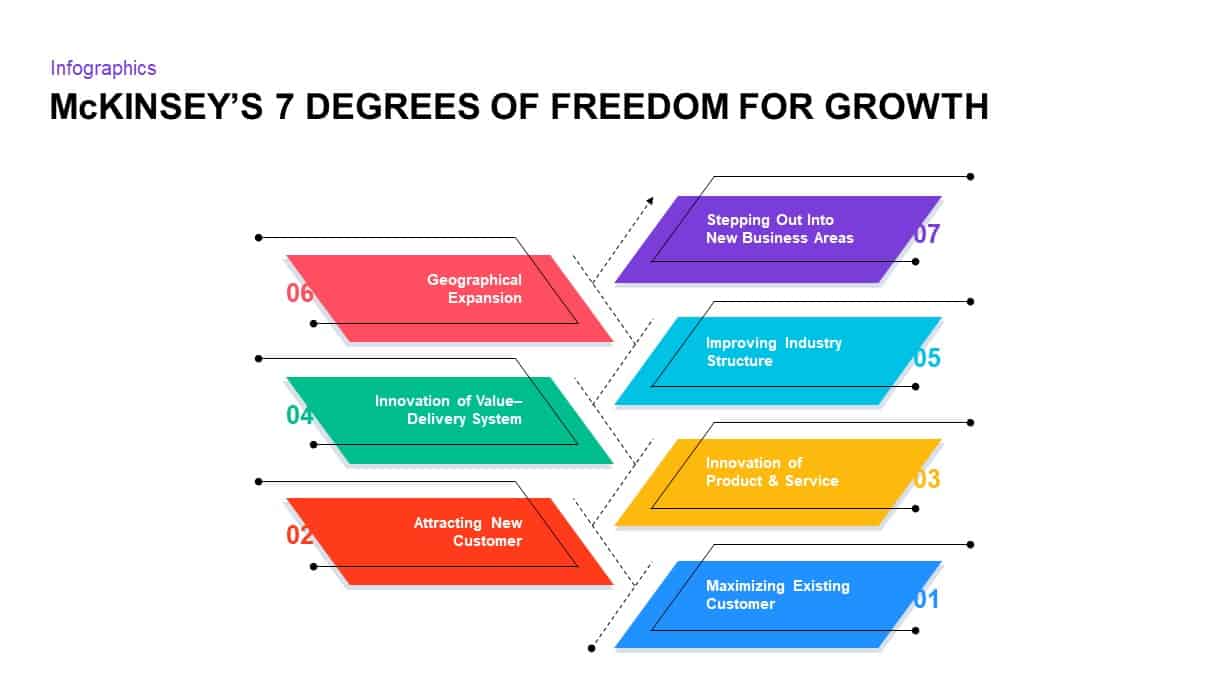
McKinsey’s 7 Degrees of Freedom Growth Template for PowerPoint & Google Slides
Process
Greiner’s Growth Model Curve template for PowerPoint & Google Slides
Infographics
Business Growth Plant Infographics Pack Template for PowerPoint & Google Slides
Process
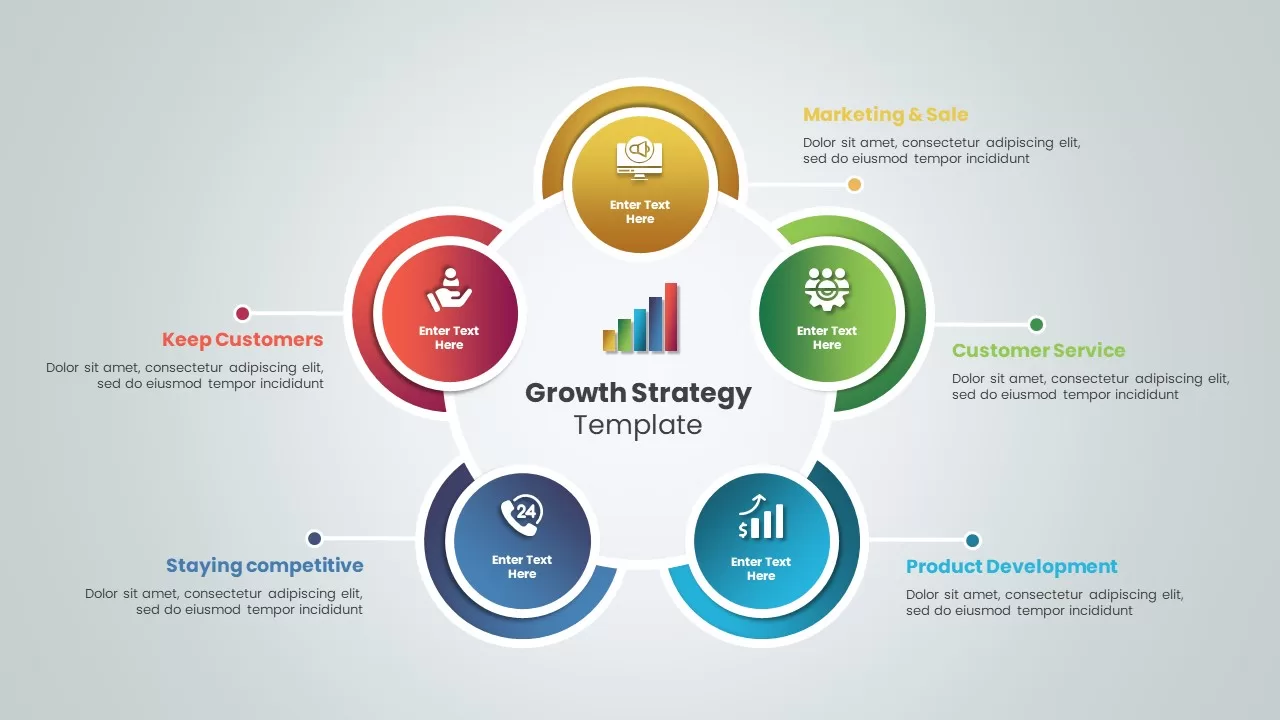
Growth Strategy Circular Diagram Template for PowerPoint & Google Slides
Circular
Data-driven GDP Growth Infographic Pack Template for PowerPoint & Google Slides
Infographics
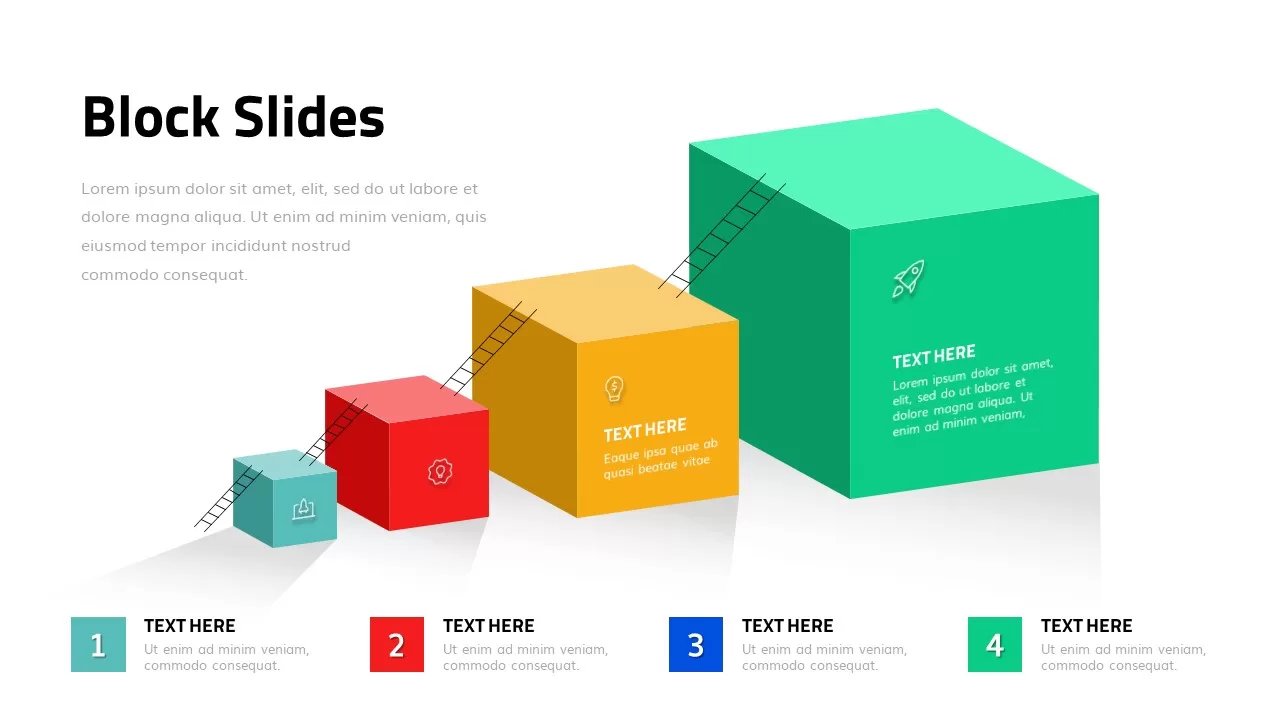
3D Growth Blocks Template for PowerPoint & Google Slides
Process
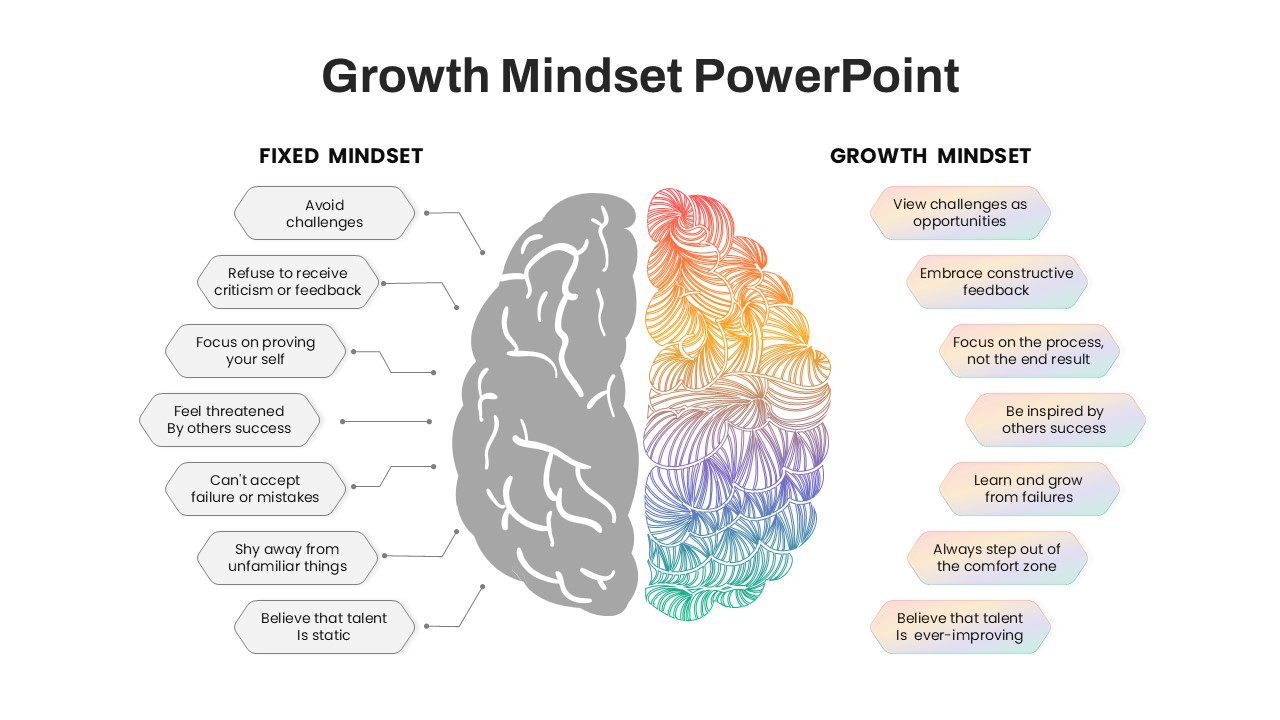
Growth vs Fixed Mindset Diagram Template for PowerPoint & Google Slides
Comparison
Abraham Maslow Growth Quote Slide Template for PowerPoint & Google Slides
Vision and Mission
Three-Stage S Curve Growth Diagram Template for PowerPoint & Google Slides
Process
Dynamic Investment & Finance Growth Template for PowerPoint & Google Slides
Finance
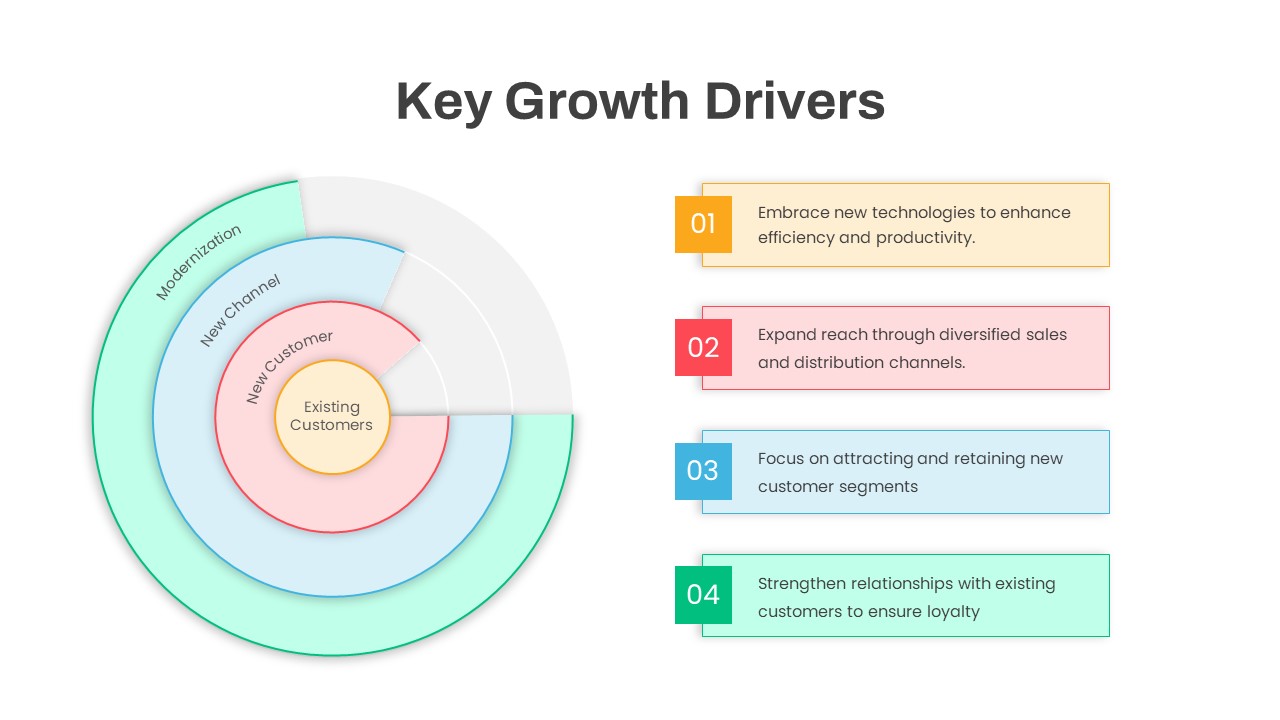
Circular Key Growth Drivers Diagram Template for PowerPoint & Google Slides
Circular
Business Growth Strategies Matrix Template for PowerPoint & Google Slides
Comparison

Growth Plant Nurture Business Development Template for PowerPoint & Google Slides
Decks
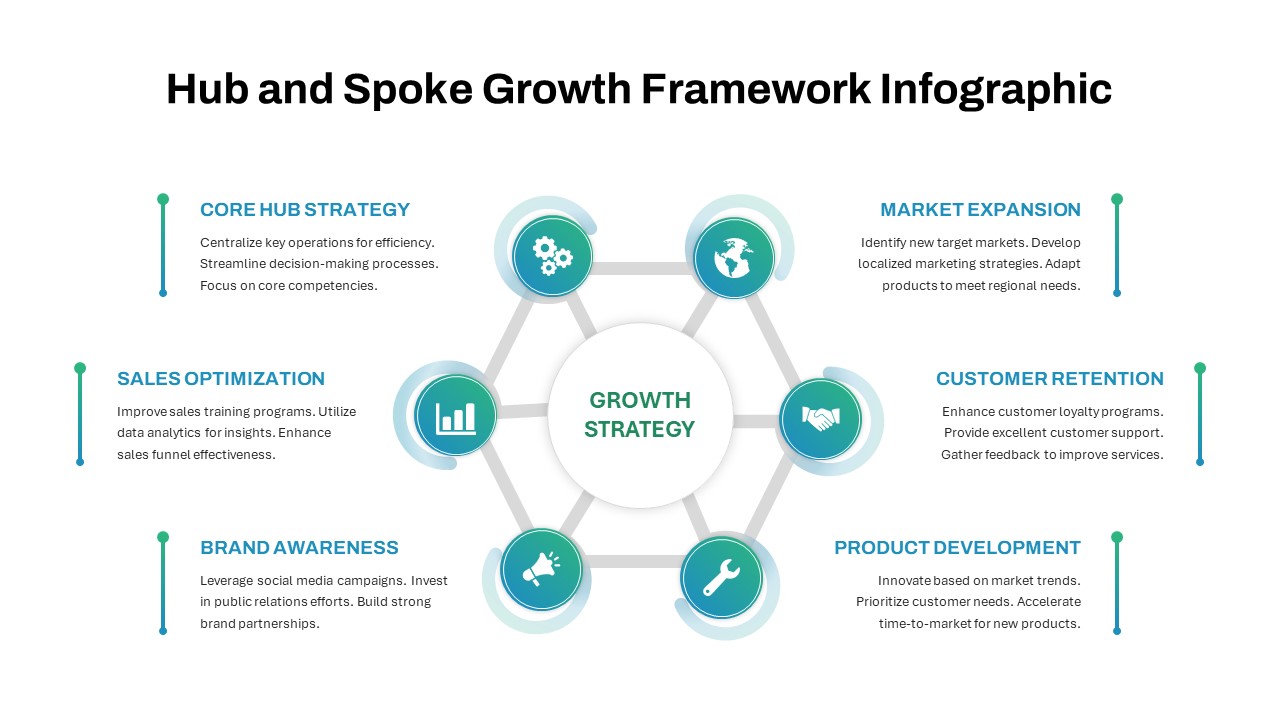
Hub and Spoke Growth Framework Template for PowerPoint & Google Slides
Circular

Quarterly Net Interest Income Growth Template for PowerPoint & Google Slides
Bar/Column
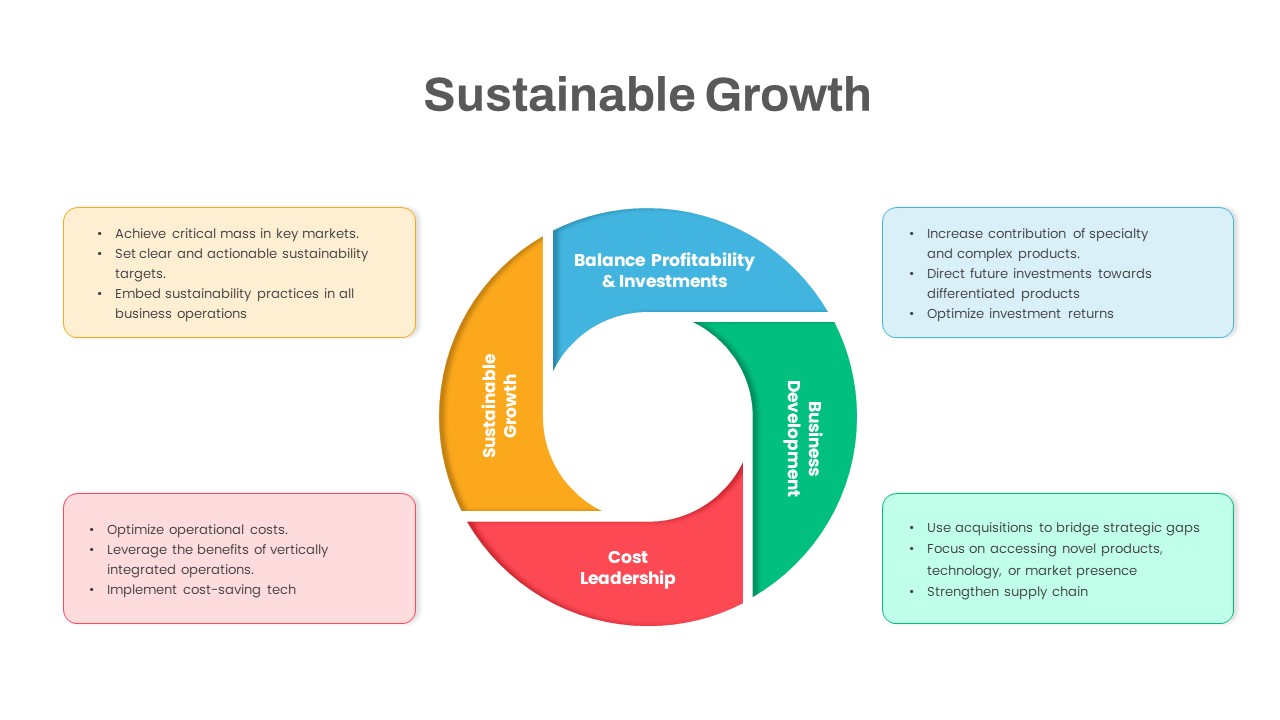
Sustainable Growth Circular Diagram Template for PowerPoint & Google Slides
Circular
Fixed vs Growth Mindset Matrix Template for PowerPoint & Google Slides
Comparison
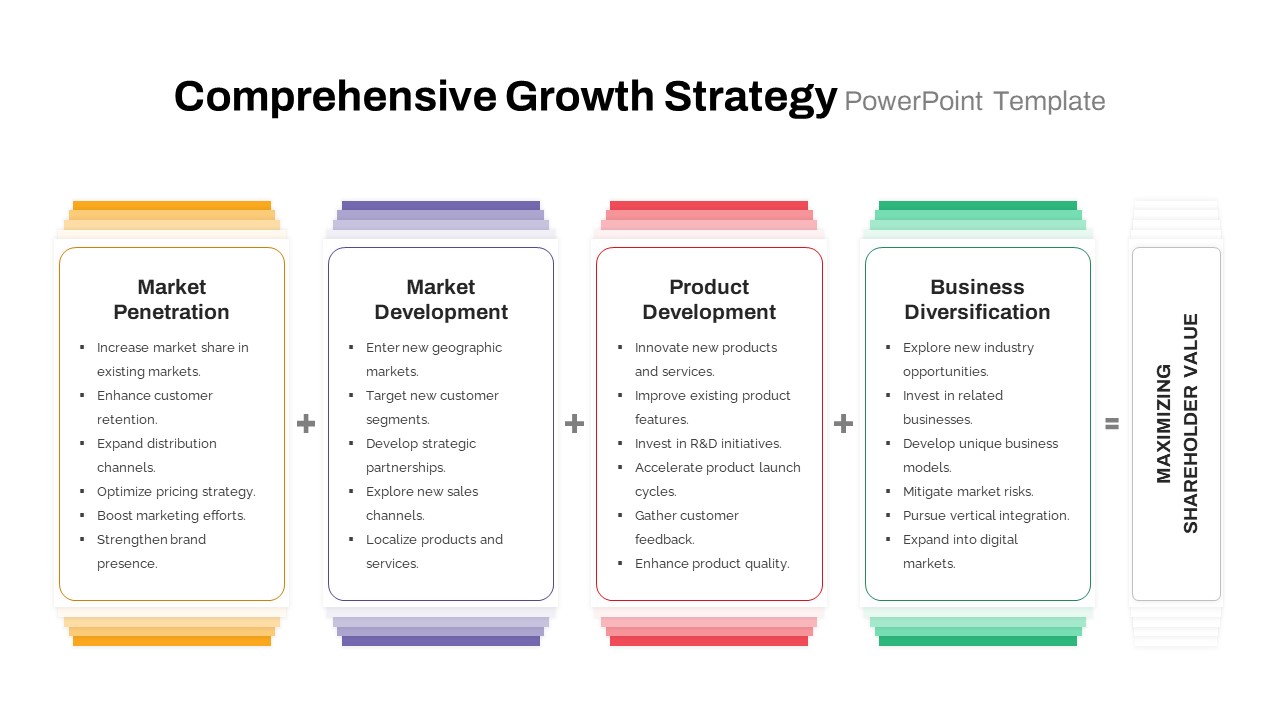
Comprehensive Growth Strategy Cards Template for PowerPoint & Google Slides
Infographics
Ansoff Growth Matrix Professional Template for PowerPoint & Google Slides
Comparison
Modern Growth Hacking Venn Diagram Template for PowerPoint & Google Slides
Circular
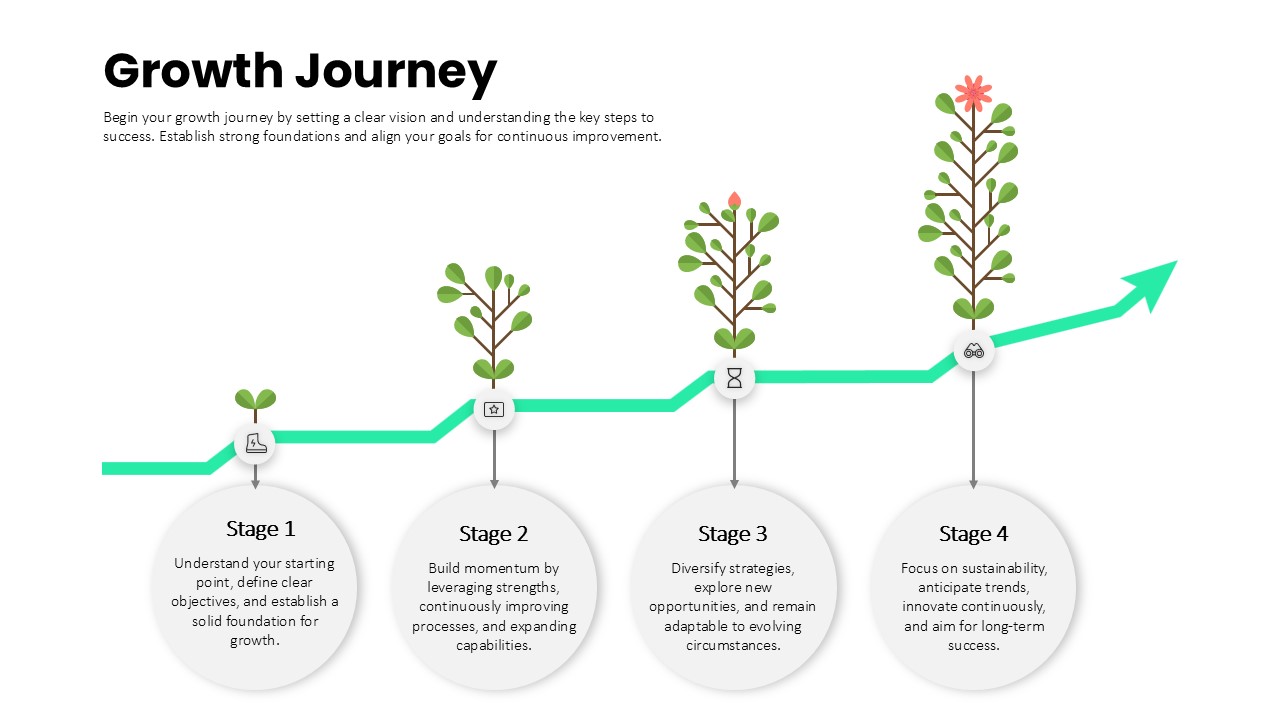
Growth Journey Stages Process template for PowerPoint & Google Slides
Business Strategy
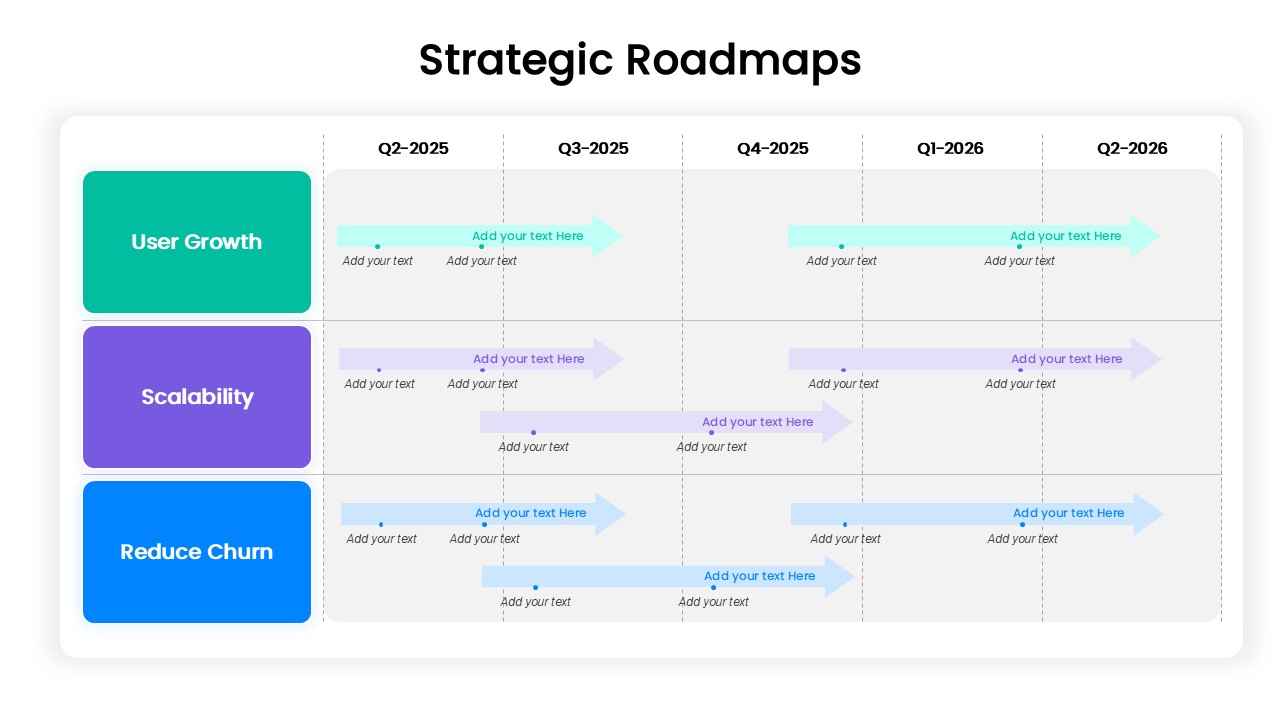
Strategic Roadmap for User Growth, Scalability, and Reducing Churn template for PowerPoint & Google Slides
Business
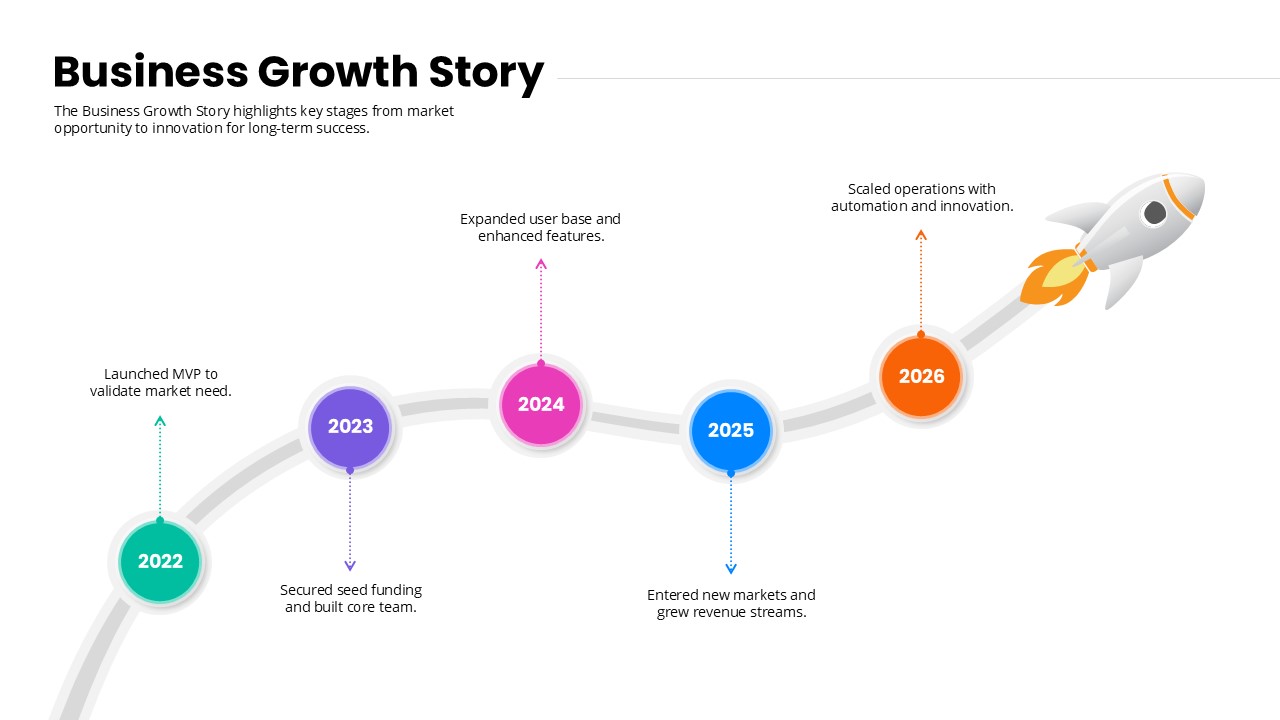
Business Growth Story timeline template for PowerPoint & Google Slides
Timeline
Personal Growth Overview Template for PowerPoint & Google Slides
Business
Ansoff Growth Matrix Template for PowerPoint & Google Slides
Business Strategy