Quarterly Network Volume Analysis Template for PowerPoint & Google Slides

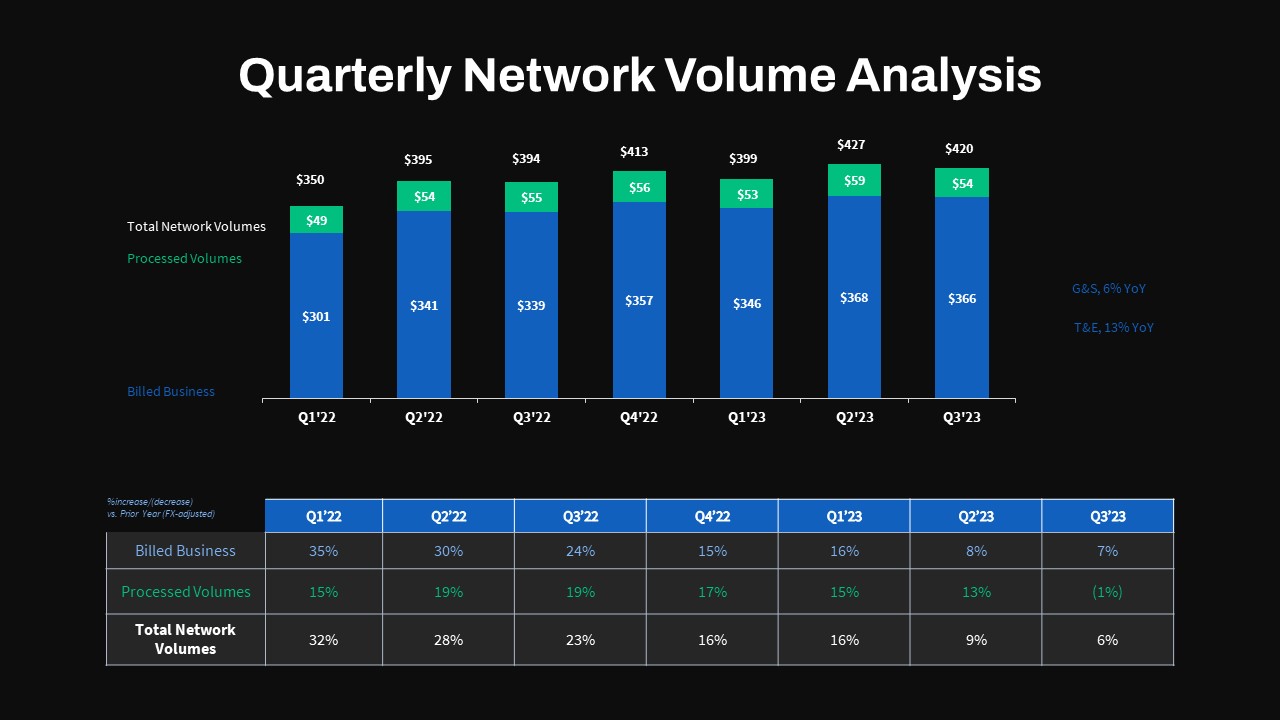

Leverage this quarterly network volume analysis template to showcase stacked volume trends and year-over-year performance at a glance. The slide features a clean, white background with bold dark headings, a customizable stacked column chart comparing billed business and processed volumes across seven quarters, and a concise legend. Below the chart, an editable table details percentage changes versus the prior year—ideal for highlighting growth rates and volatility. Subtle gridlines and vector shapes ensure visual hierarchy, while a customizable navigation icon adds a polished, interactive touch.
Designed for rapid customization, master slides let you adjust data labels, swap out colors, and update chart series without disrupting formatting. Simply replace placeholder values with your own figures, edit table text, or tweak axis scales in seconds. Theme-aware color palettes propagate automatically, preserving brand consistency across all chart elements. Vector-based graphics guarantee razor-sharp rendering on any screen or projector.
Beyond network volumes, this layout adapts seamlessly to any stacked-bar or volume-comparison scenario—sales pipelines, production outputs, resource utilization, or financial KPIs. Resize the table, add or remove quarters, or introduce additional data series to fit your narrative. The modular design streamlines storytelling, making complex data readily digestible for executive briefings, board meetings, or investor updates.
Fully compatible with PowerPoint and Google Slides, this template maintains full editability and resolution-independence across platforms. Global theme settings enable one-click updates to fonts, colors, and effects, letting you deliver professional-quality presentations with minimal prep time.
Who is it for
Financial analysts, CFOs, investor relations teams, and operations managers will benefit from this slide when reporting quarterly revenue, processing volumes, or operational metrics. Consultants and corporate strategists can leverage it for data-driven briefings and performance reviews.
Other Uses
Repurpose this layout for sales performance dashboards, production volume reports, resource allocation charts, or any comparative timeline analysis that uses stacked bars and detailed tables.
Login to download this file

Item ID
SB04300
Related Templates

Cost-Volume-Profit Analysis Diagram Template for PowerPoint & Google Slides
Finance
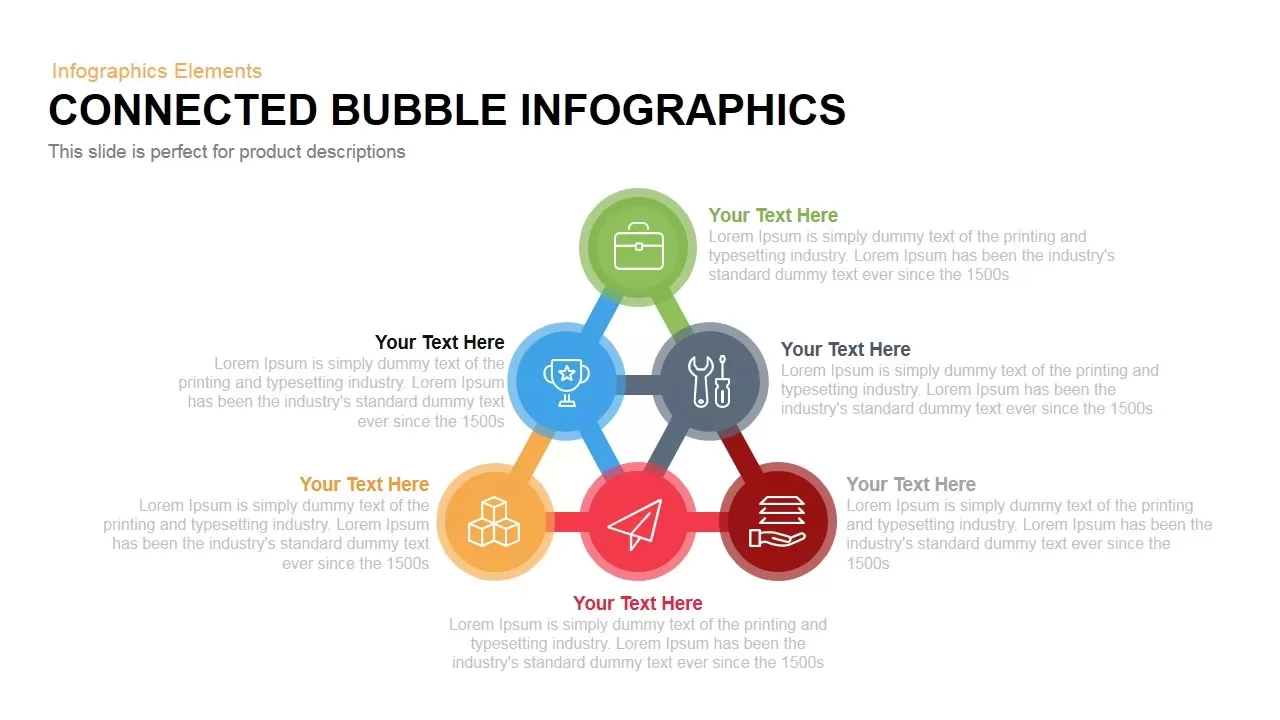
Connected Bubble Network Infographic Template for PowerPoint & Google Slides
Circular
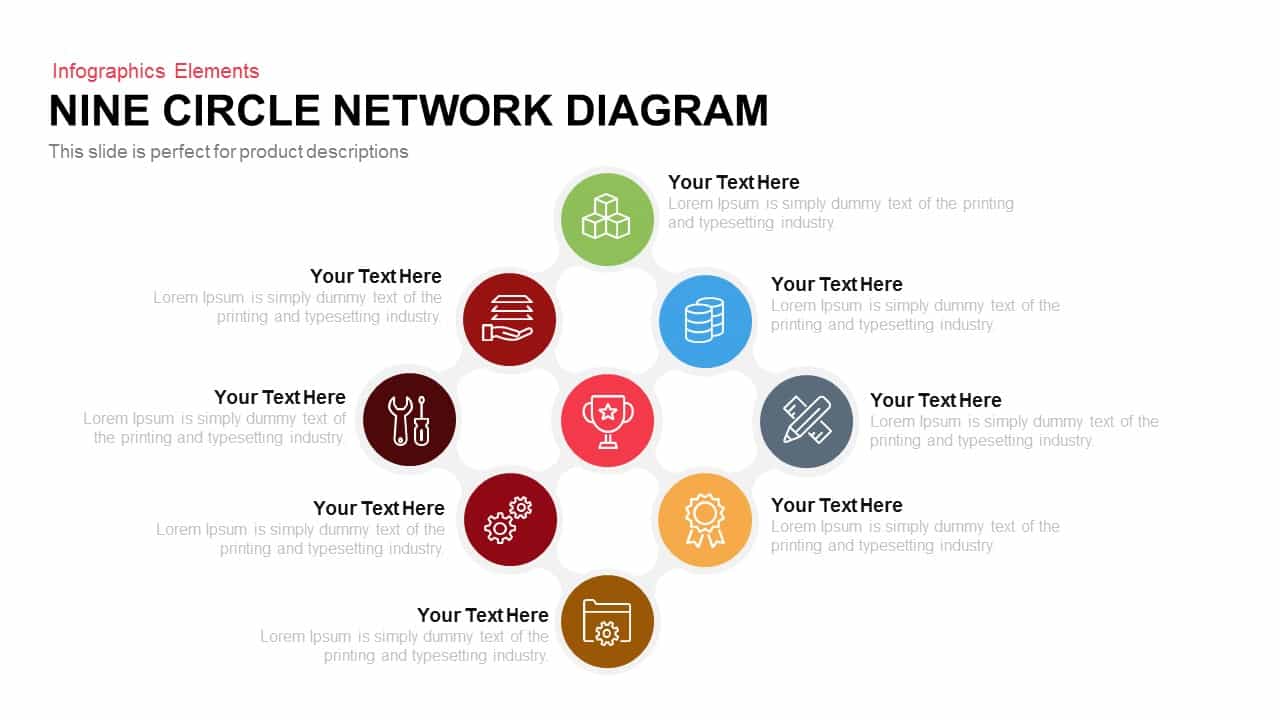
Modern Nine Circle Network Diagram Template for PowerPoint & Google Slides
Circular
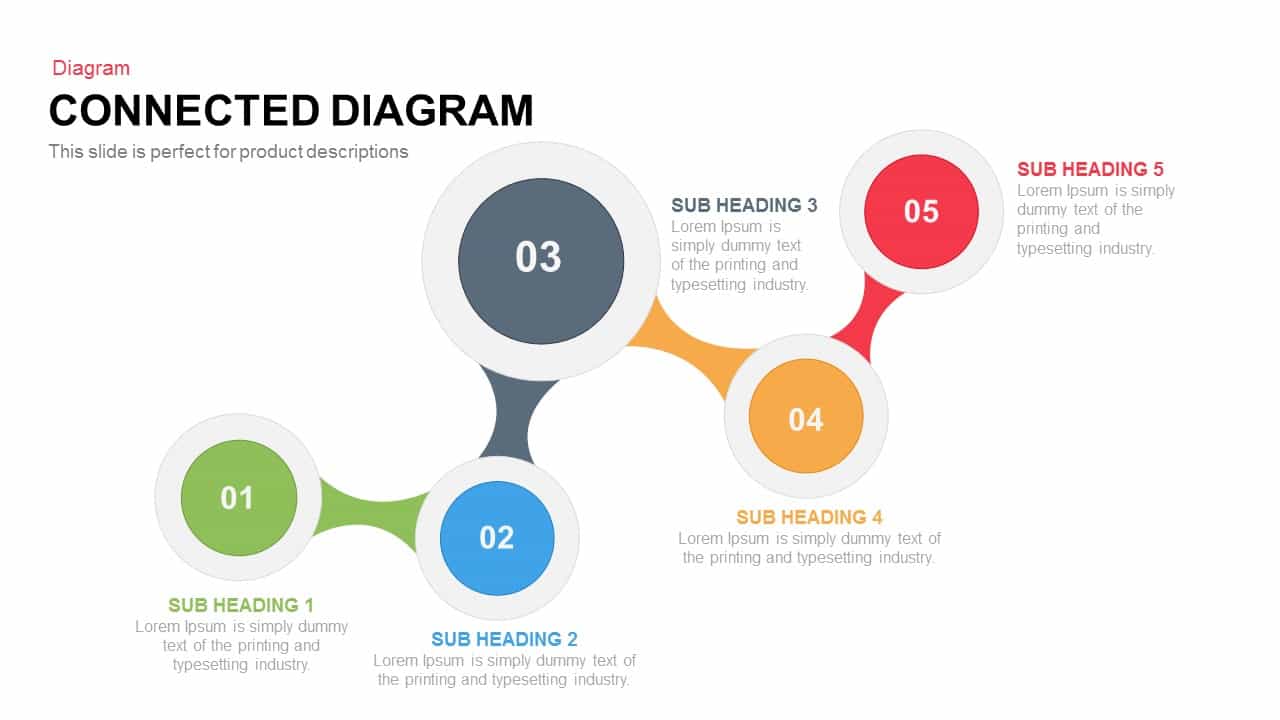
Interactive Connected Network Diagram Template for PowerPoint & Google Slides
Process
Social Media Mind Network Infographic Template for PowerPoint & Google Slides
Digital Marketing
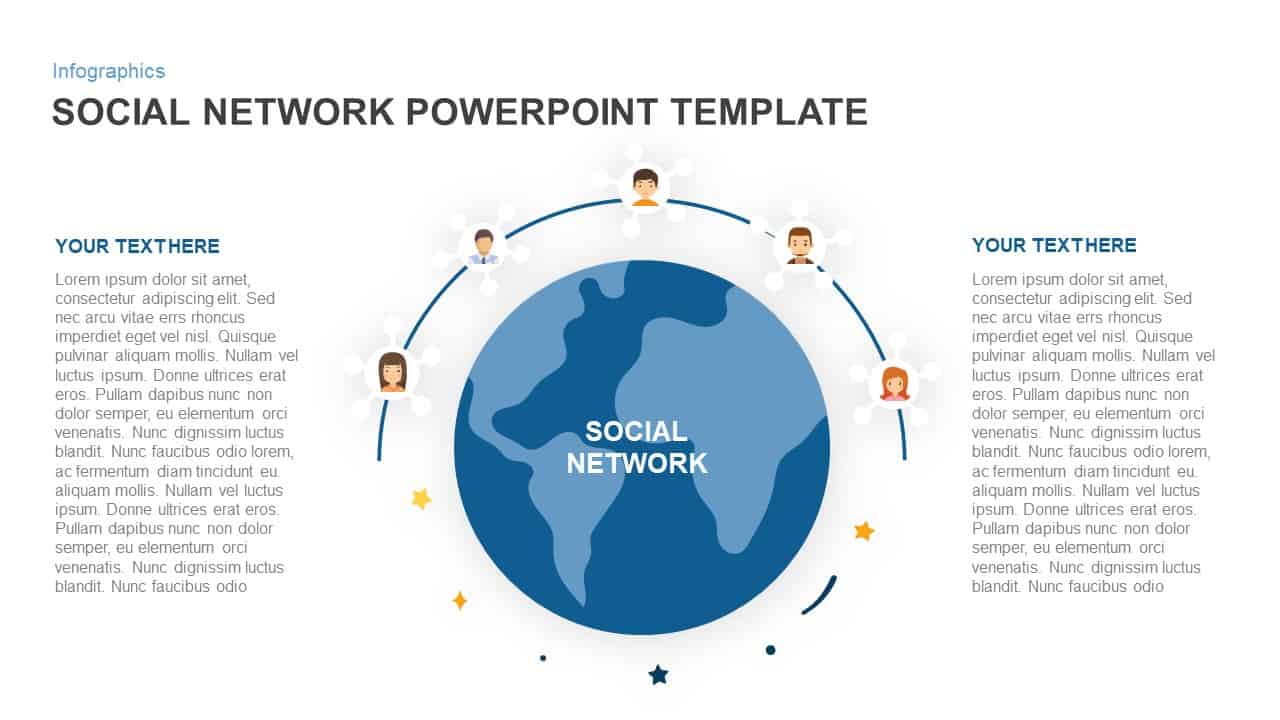
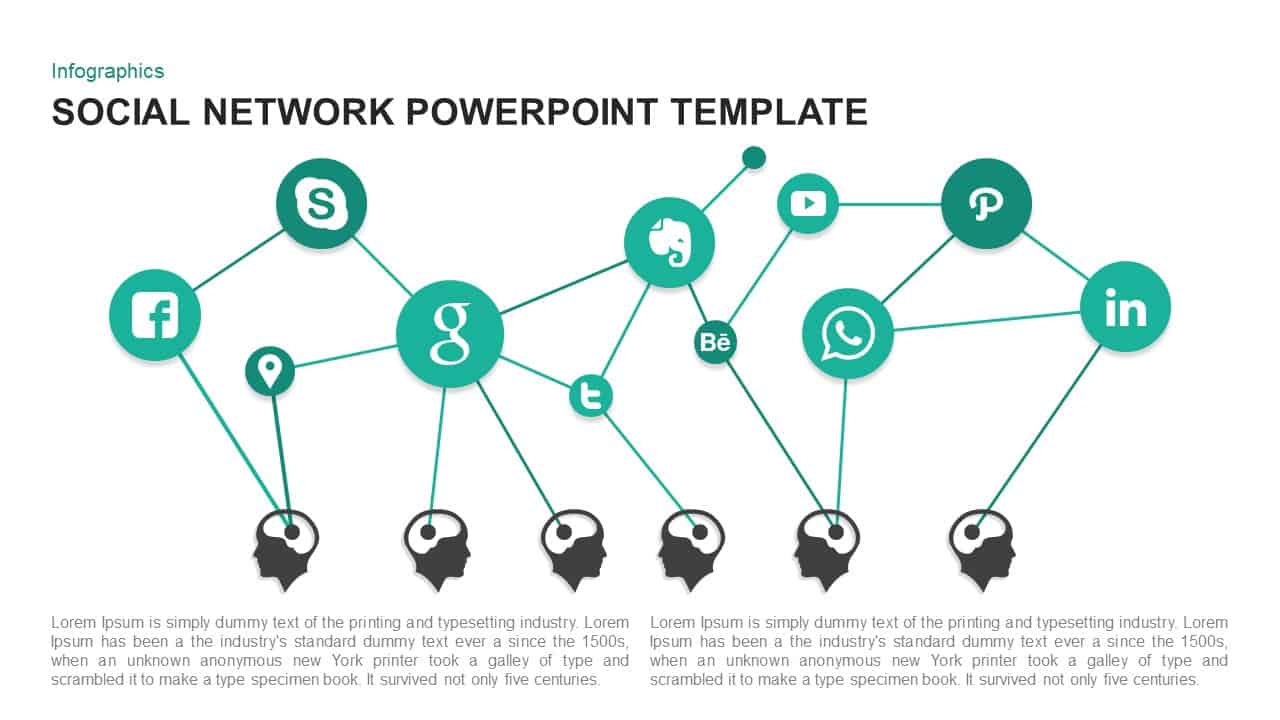
Social Network Connectivity Infographic Template for PowerPoint & Google Slides
Infographics
Social Network Infographic Diagram Template for PowerPoint & Google Slides
Digital Marketing
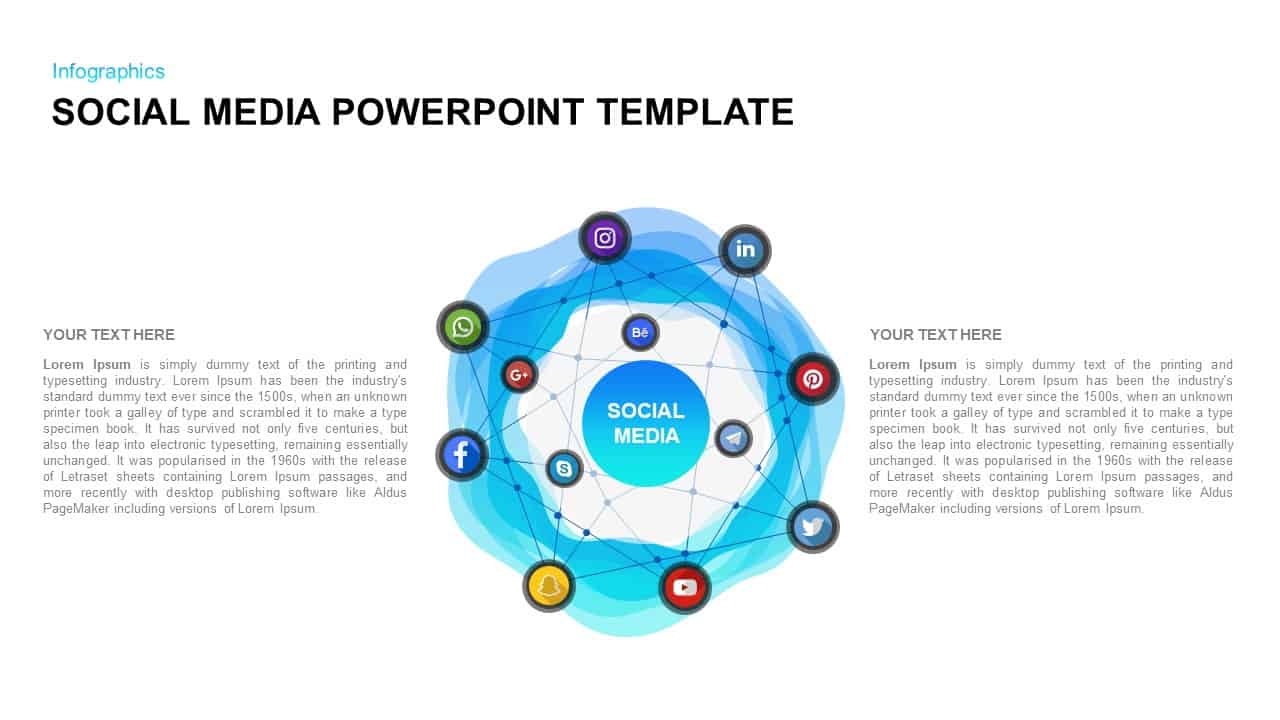
Social Media Network Infographic Template for PowerPoint & Google Slides
Circular
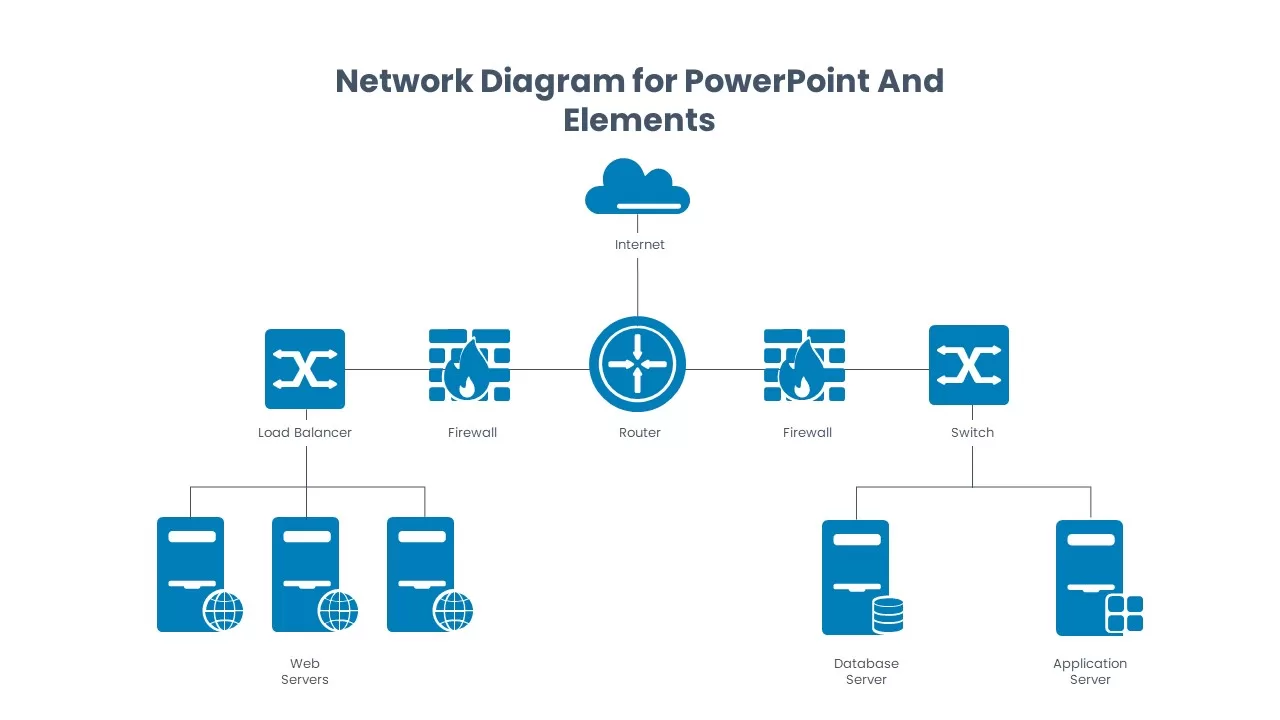
Network Diagram Elements and Icons Pack Template for PowerPoint & Google Slides
Information Technology
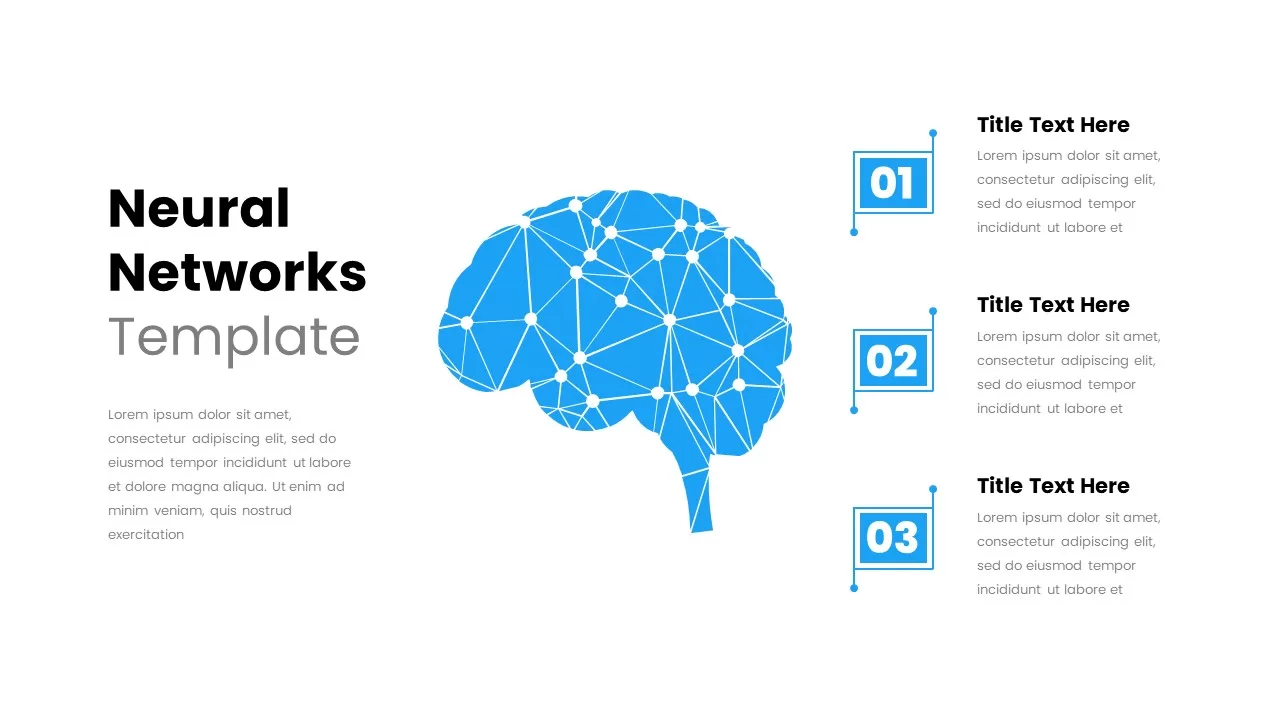
Neural Network Brain Infographic Template for PowerPoint & Google Slides
Process
Social Media Community Network Slide Template for PowerPoint & Google Slides
Circular
Free Big Data Network Visualization Template for PowerPoint & Google Slides
Circular
Free
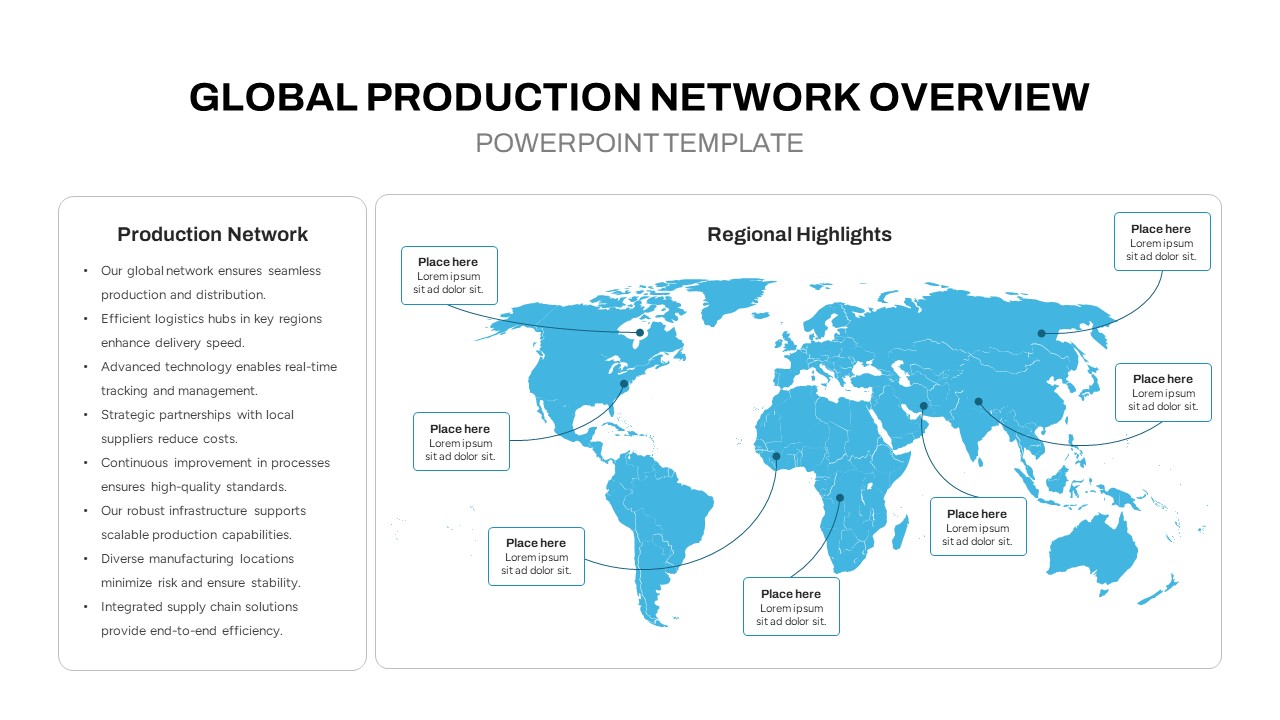
Global Production Network Overview Map Template for PowerPoint & Google Slides
World Maps
5Cs of Network Effect Circular Diagram Template for PowerPoint & Google Slides
Circular
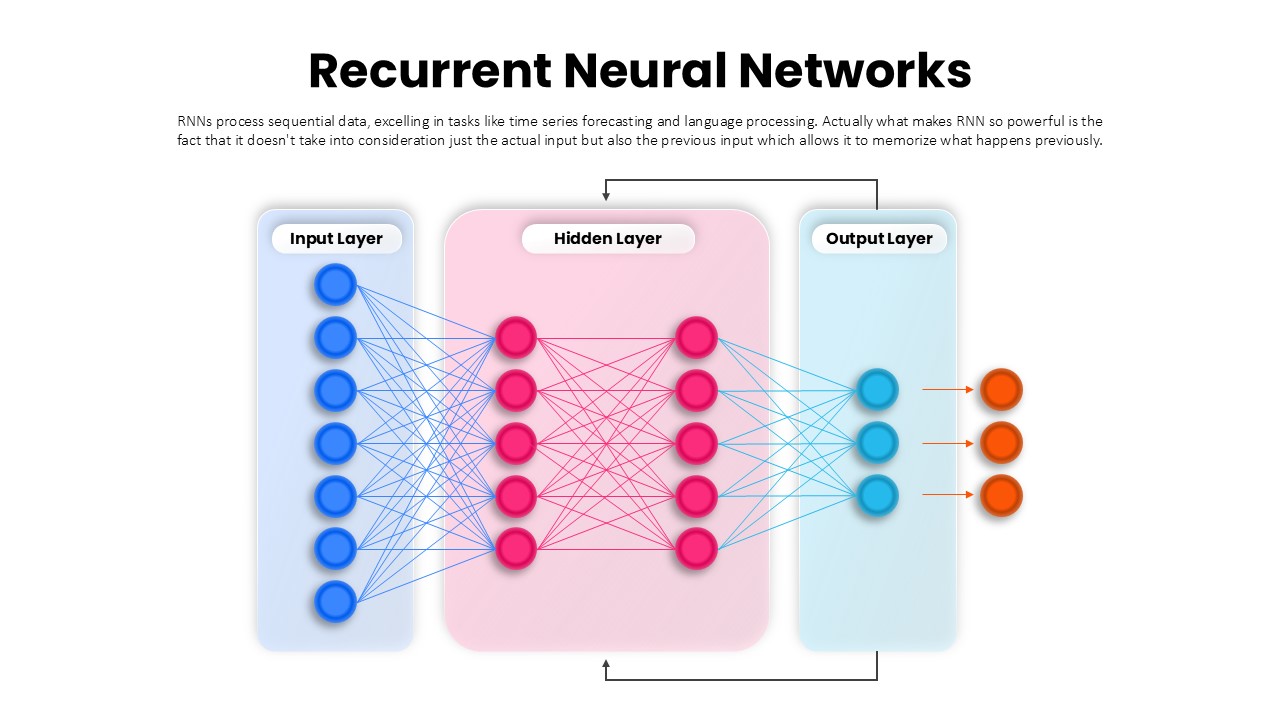
Recurrent Neural Network Architecture Template for PowerPoint & Google Slides
AI
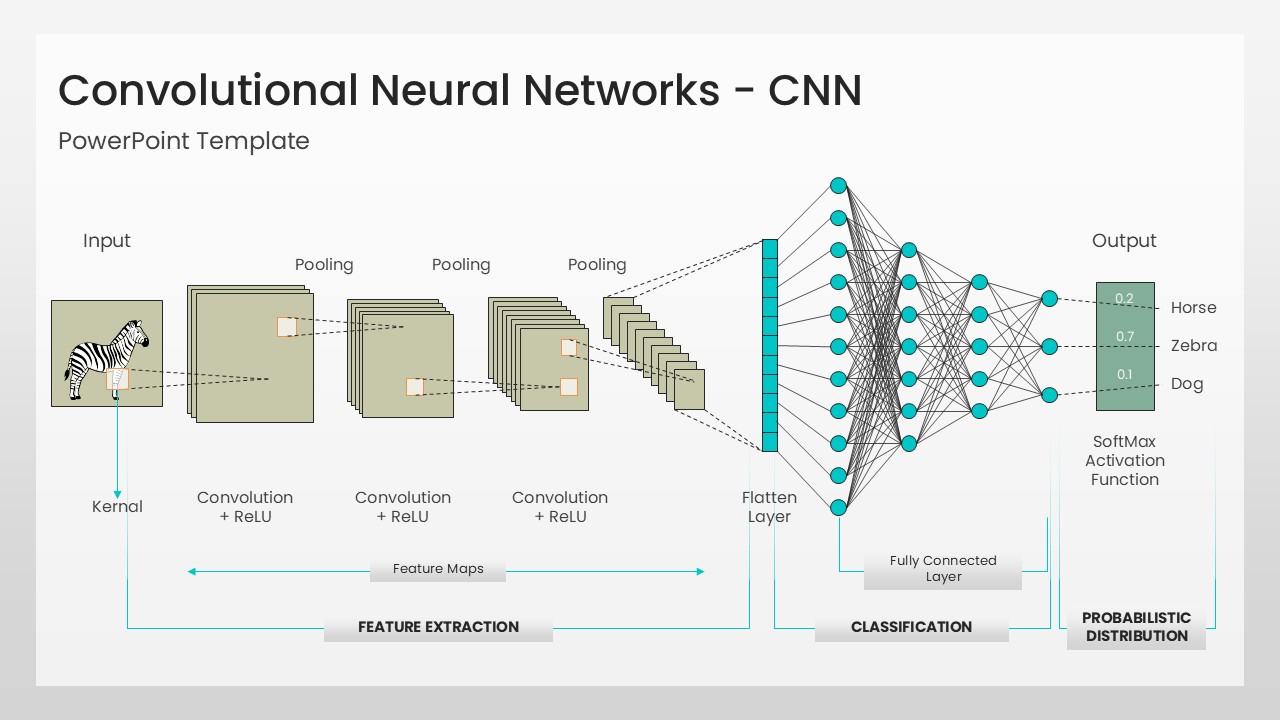
Convolutional Neural Network Architecture Template for PowerPoint & Google Slides
Machine Learning
Network Effects Template for PowerPoint & Google Slides
Software Development
Social Media Network Hub Diagram Slide for PowerPoint & Google Slides
Process
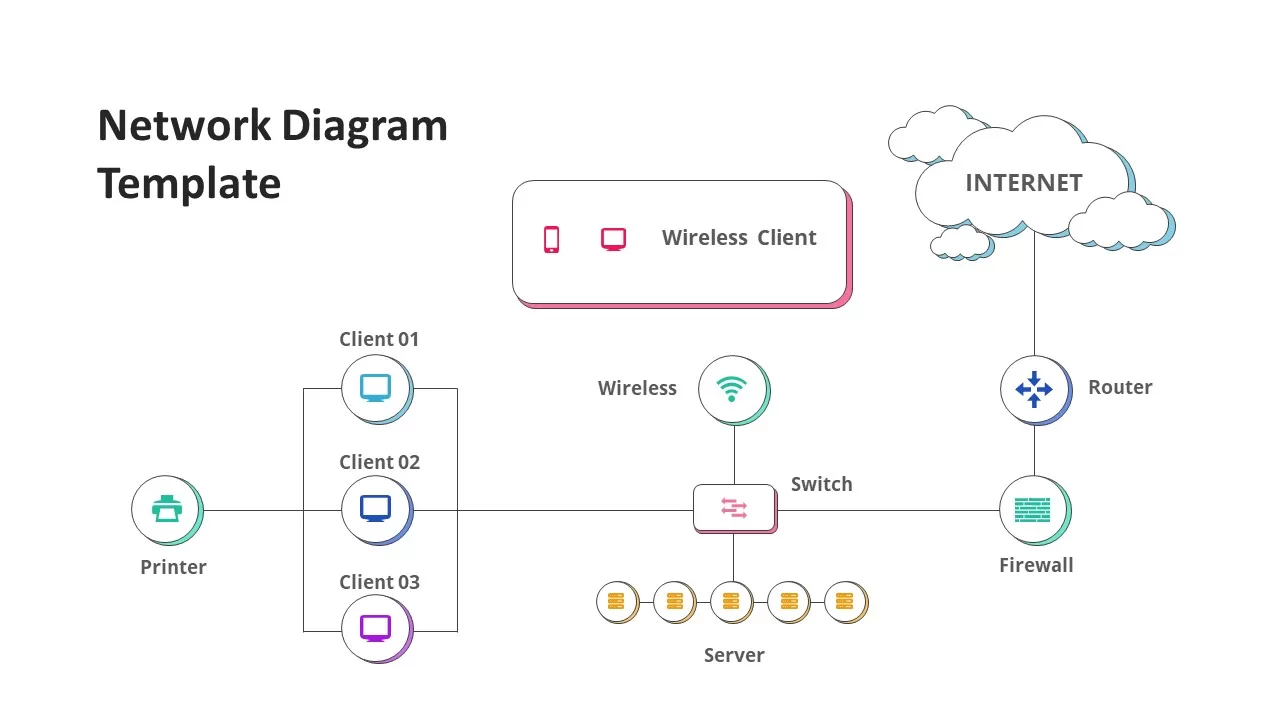
Network Diagram Infographics for PowerPoint & Google Slides
Technology
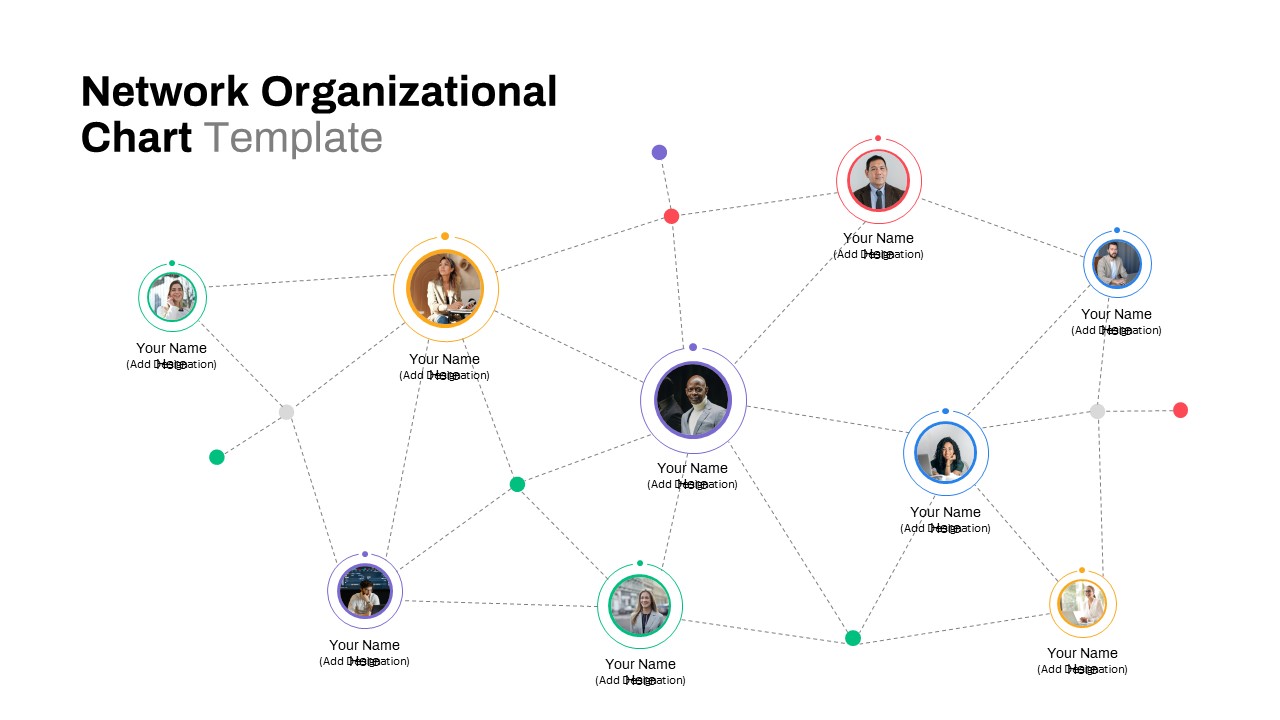
Network Organizational Chart for PowerPoint & Google Slides
Business
Cybersecurity Network Theme for PowerPoint & Google Slides
Information Technology
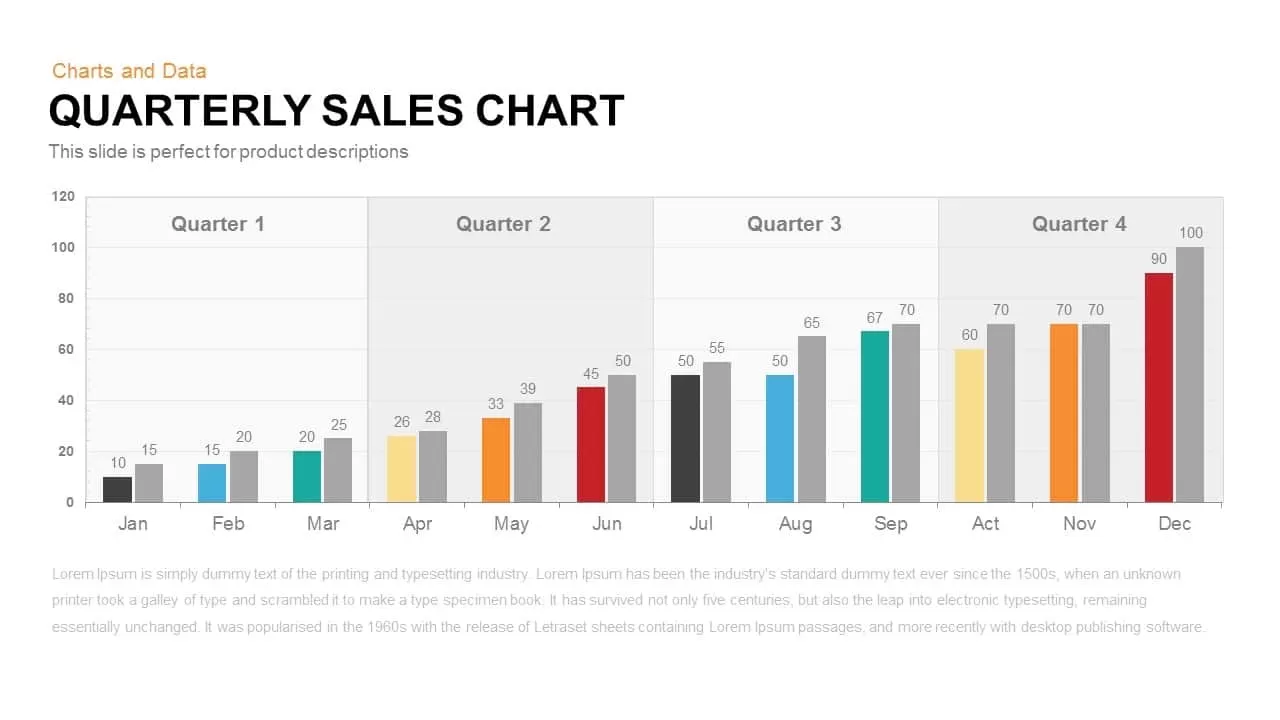
Quarterly Sales template for PowerPoint & Google Slides
Bar/Column
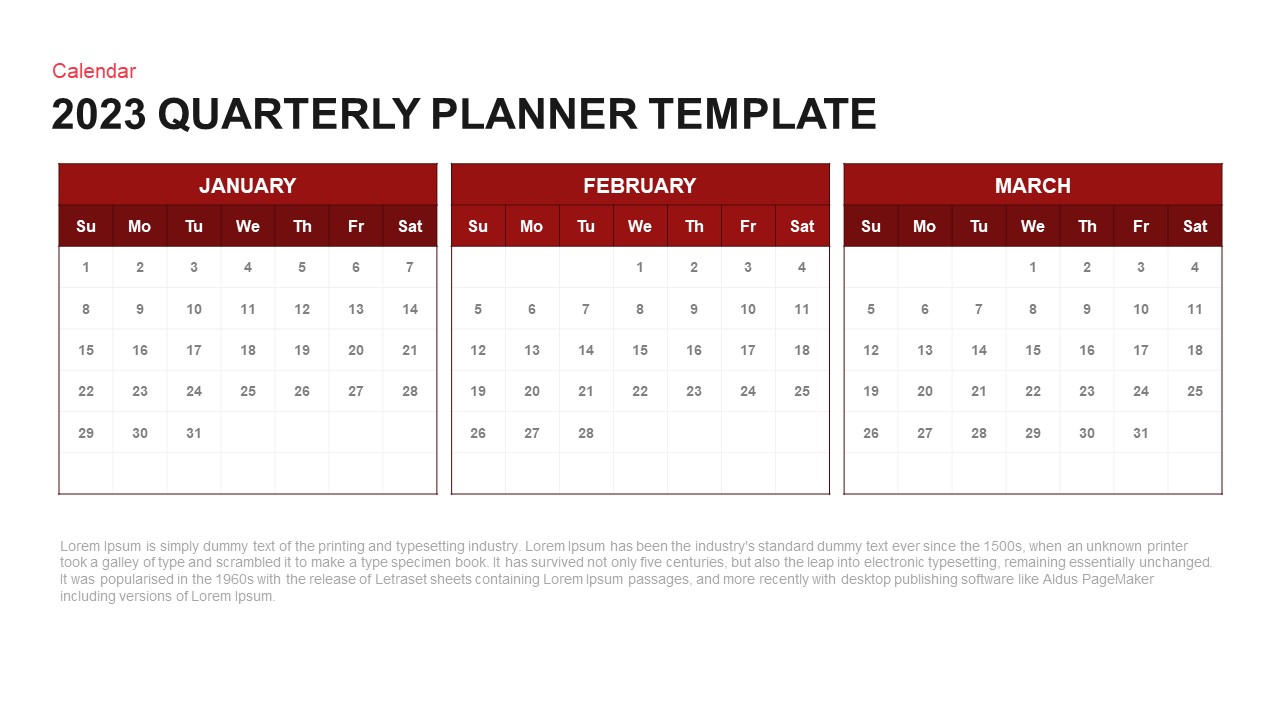
Quarterly Planner Calendar Layout Template for PowerPoint & Google Slides
Project
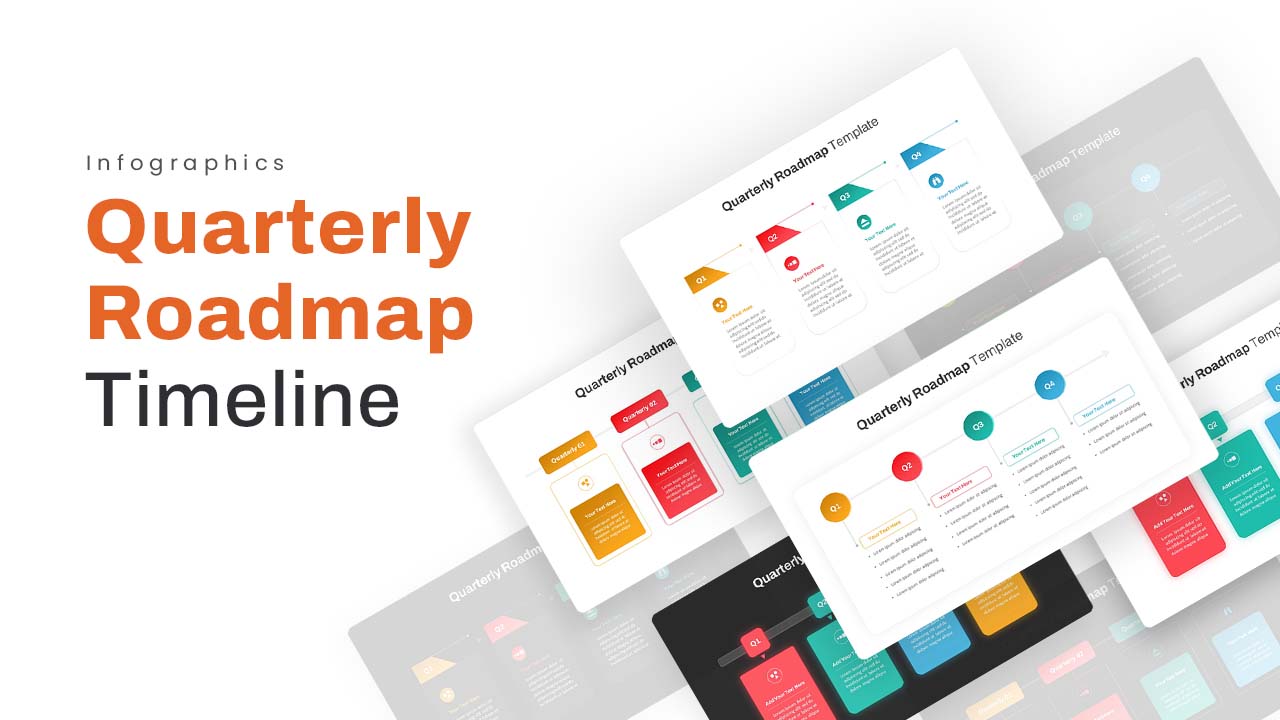
Quarterly Roadmap Timeline Infographic Template for PowerPoint & Google Slides
Timeline
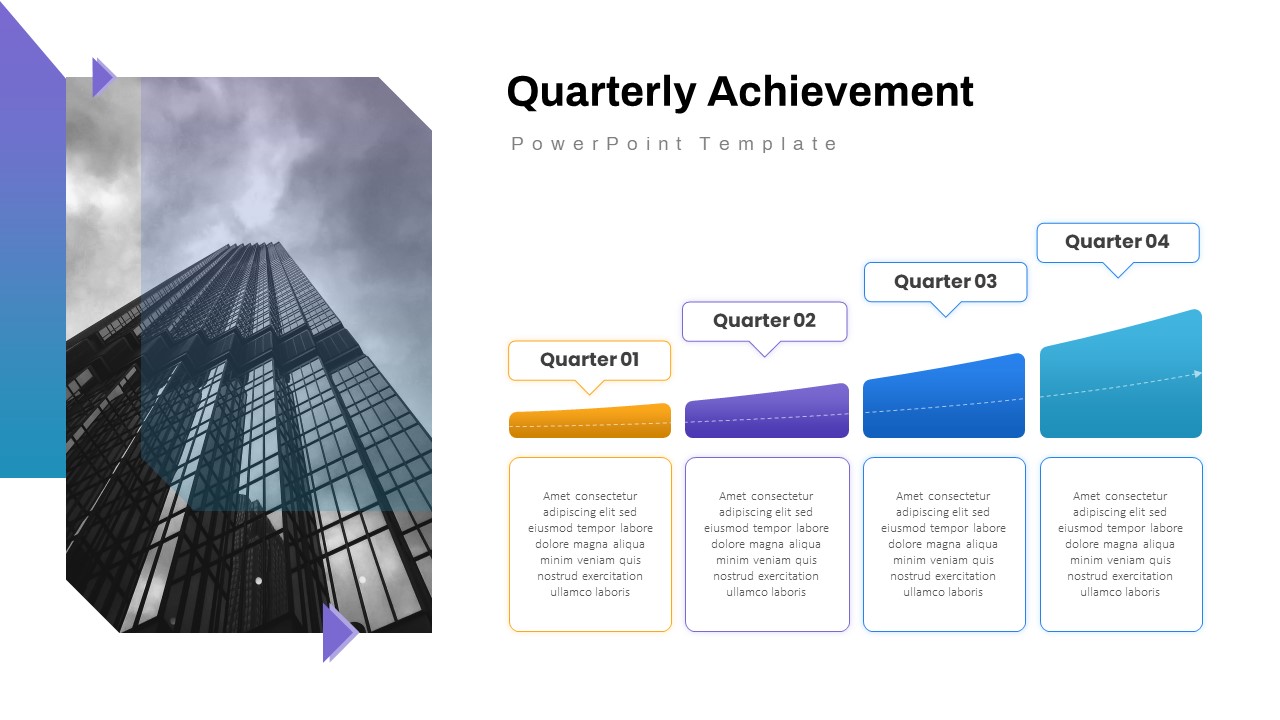
Quarterly Achievement Progress Template for PowerPoint & Google Slides
Accomplishment
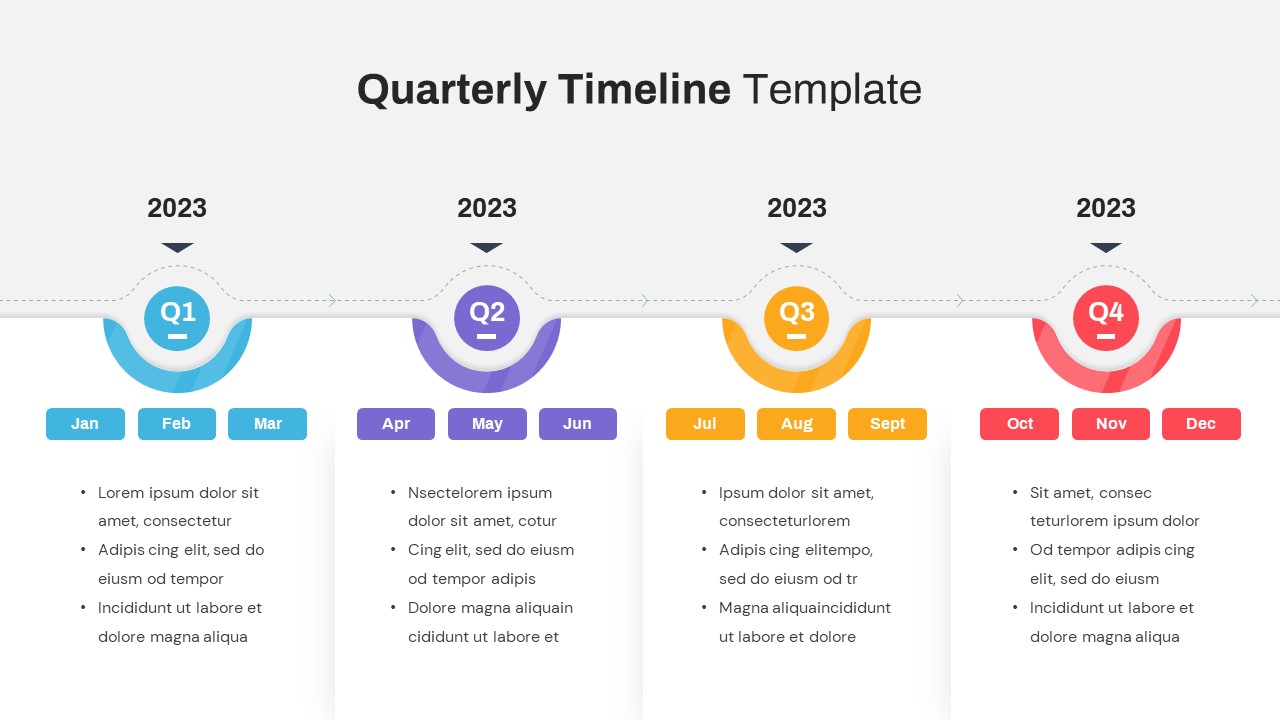
Quarterly Timeline Infographic Template for PowerPoint & Google Slides
Timeline
Free Quarterly Business Review Dashboard Template for PowerPoint & Google Slides
Business
Free
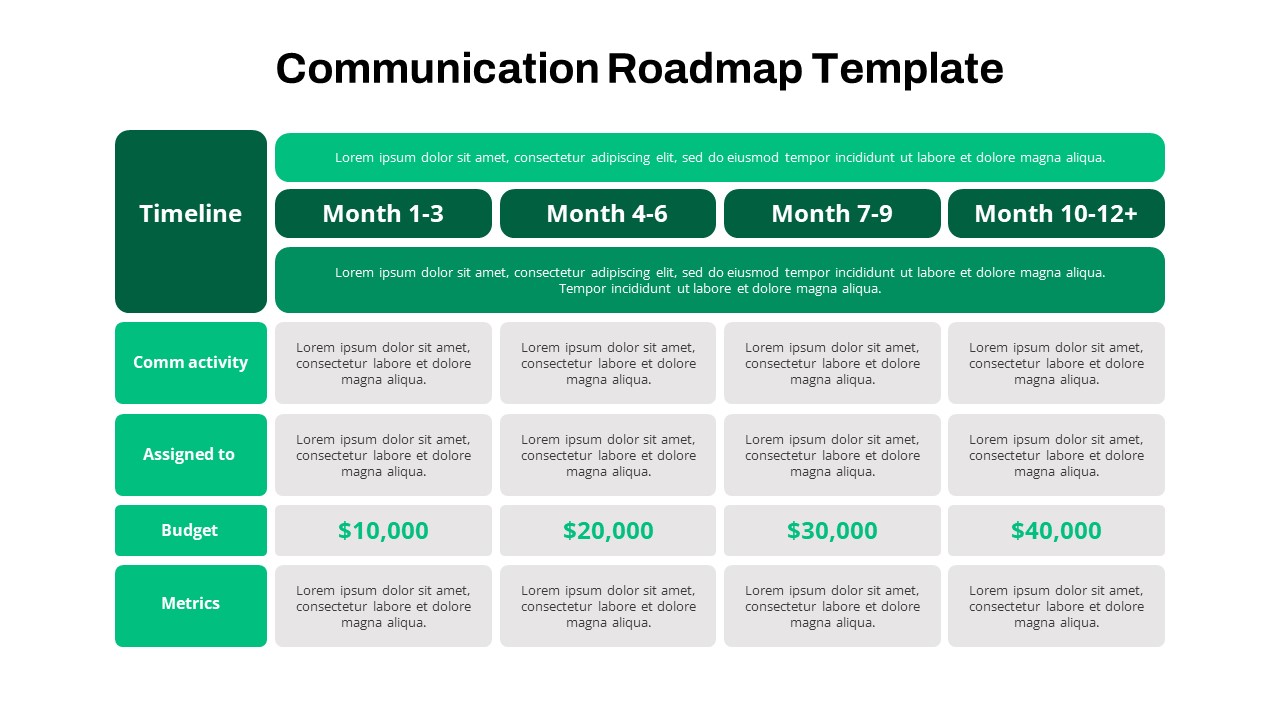
Quarterly Communication Roadmap Grid Template for PowerPoint & Google Slides
Marketing
Quarterly Credit Loss Provisions Chart Template for PowerPoint & Google Slides
Bar/Column
Quarterly Financial Summary Dashboard Template for PowerPoint & Google Slides
Business Report
Quarterly Gross Profit Rate Chart Template for PowerPoint & Google Slides
Revenue
Quarterly Business Review Dashboard Template for PowerPoint & Google Slides
Pitch Deck
Quarterly Revenue Comparison Bar Chart Template for PowerPoint & Google Slides
Bar/Column

Quarterly Net Interest Income Growth Template for PowerPoint & Google Slides
Bar/Column
Quarterly Sales Review Bar Chart Template for PowerPoint & Google Slides
Bar/Column
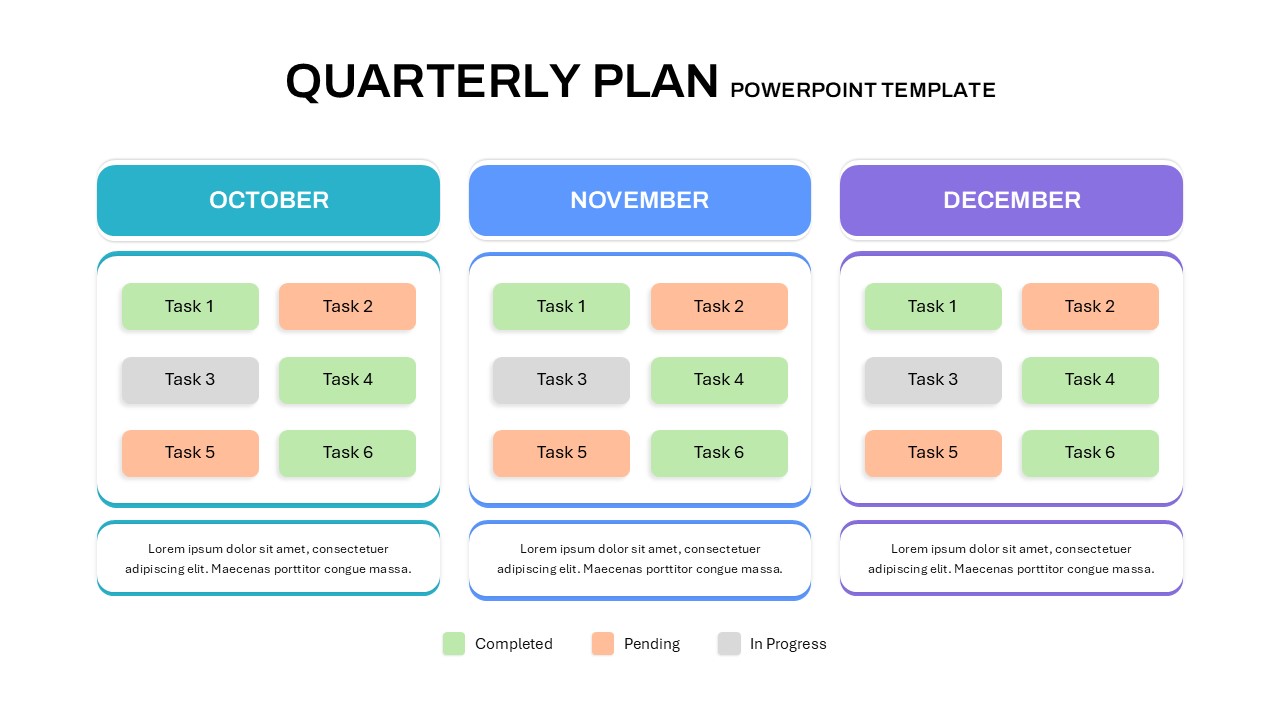
Quarterly Plan Template for PowerPoint & Google Slides
Project Status

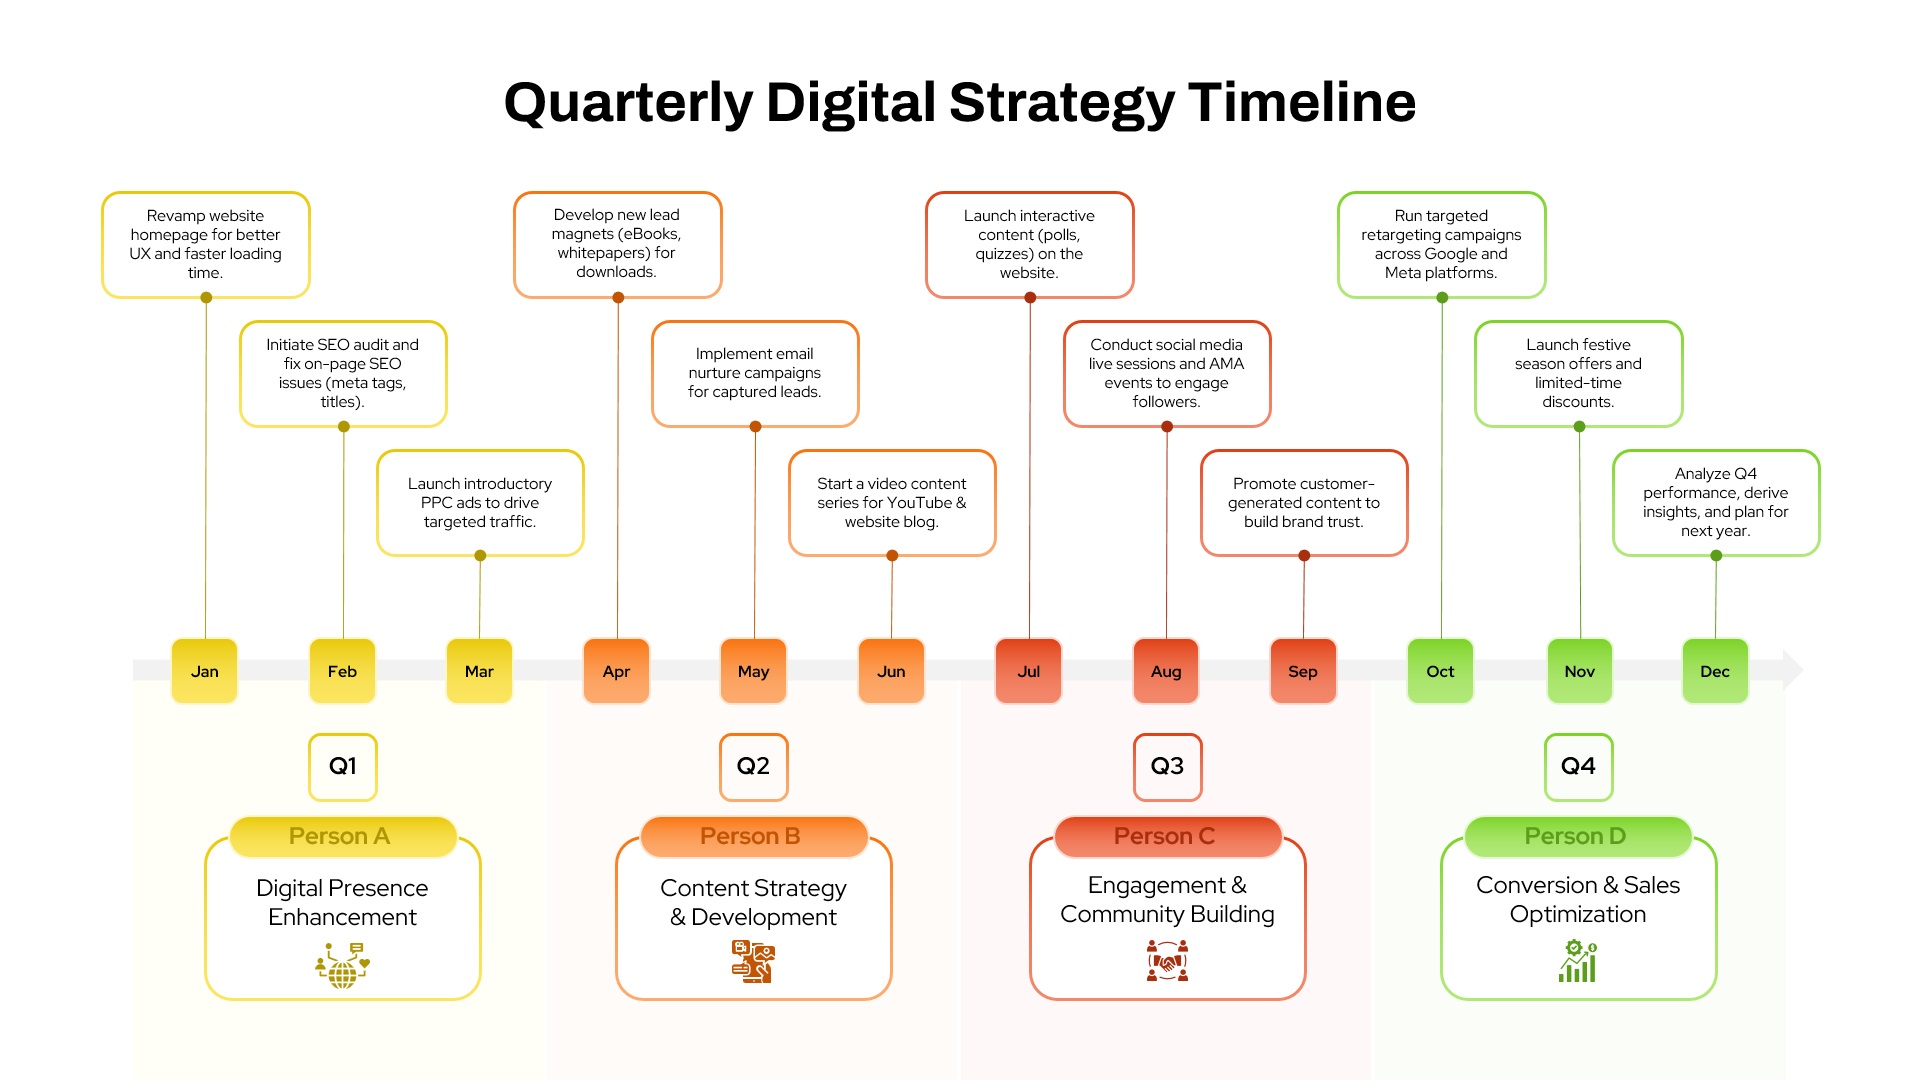
Quarterly Digital Strategy Timeline template for PowerPoint & Google Slides
Digital Marketing
Quarterly Gantt Chart with Today Marker Template for PowerPoint & Google Slides
Gantt Chart
Quarterly Comparison Pie Chart Template for PowerPoint & Google Slides
Pie/Donut
PEST Analysis PowerPoint Template for PowerPoint & Google Slides
Business Strategy
Mobile Data Analysis Chart template for PowerPoint & Google Slides
Charts
Line Graph Analysis template for PowerPoint & Google Slides
Charts
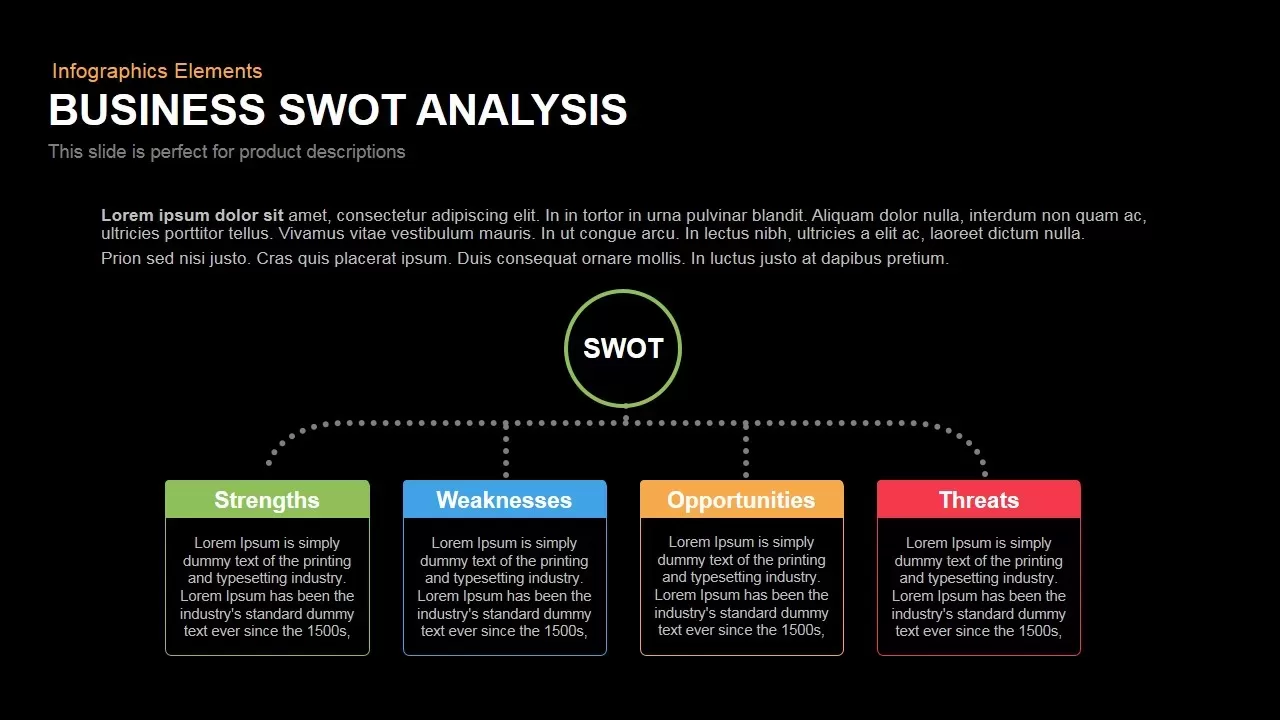
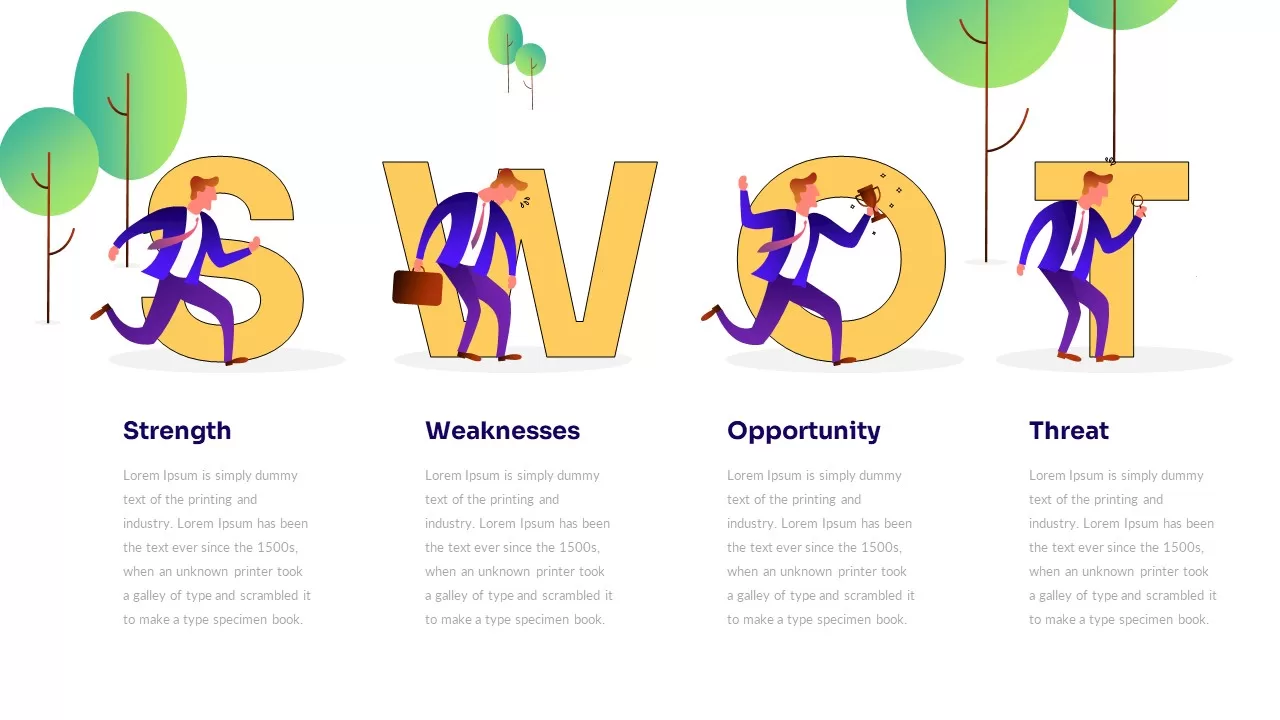
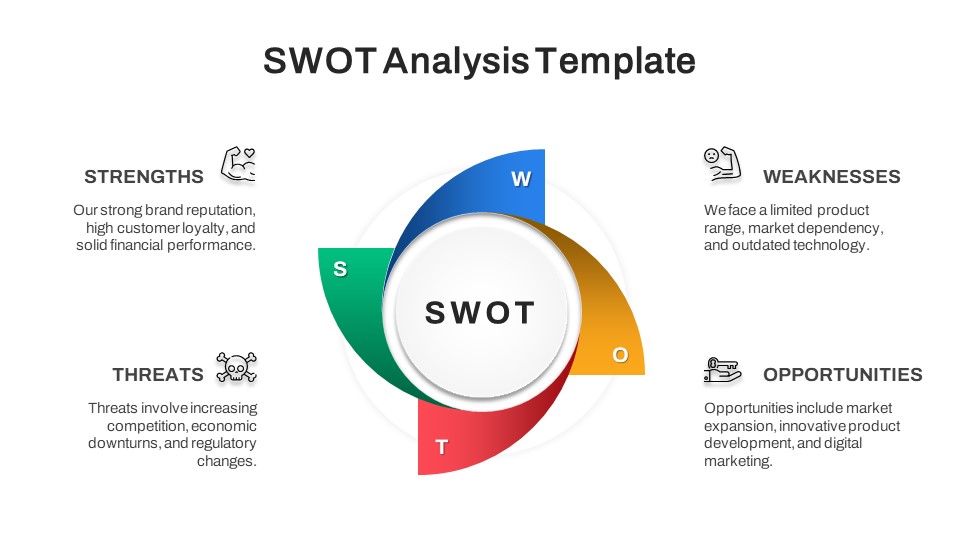
Box Business SWOT Analysis Template for PowerPoint & Google Slides
SWOT
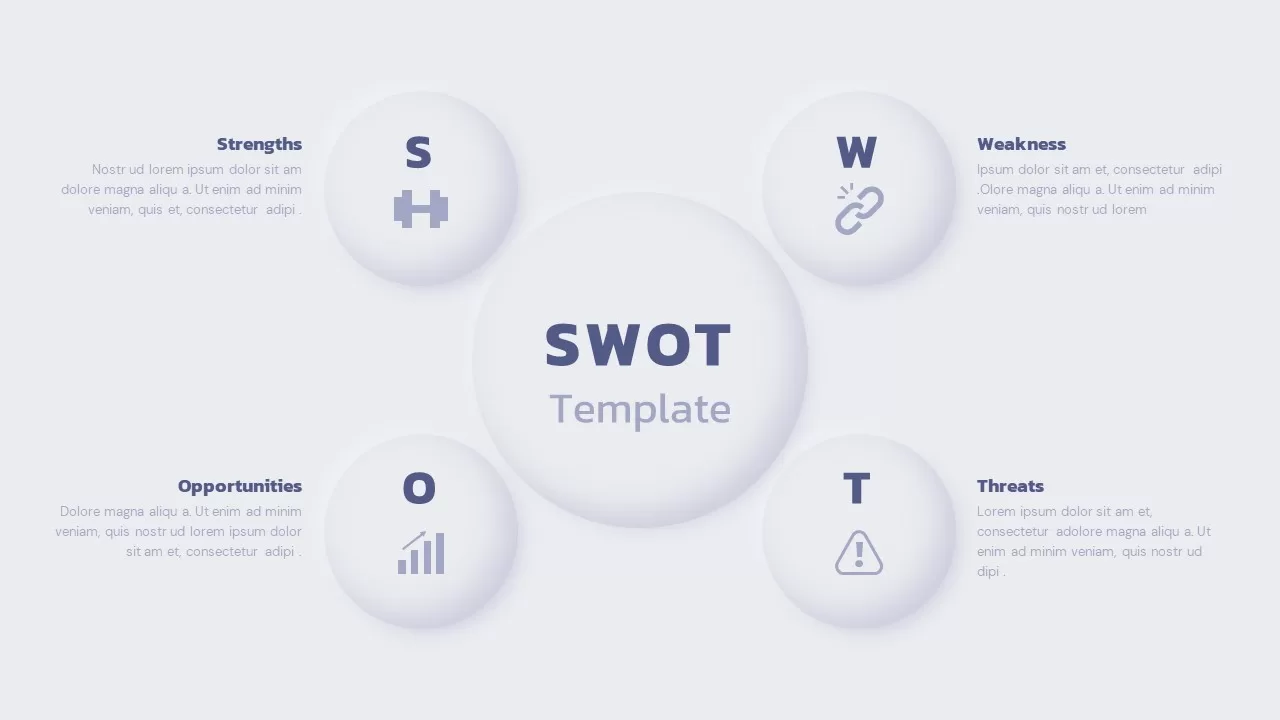
Modern Circle SWOT Analysis Diagram Template for PowerPoint & Google Slides
SWOT

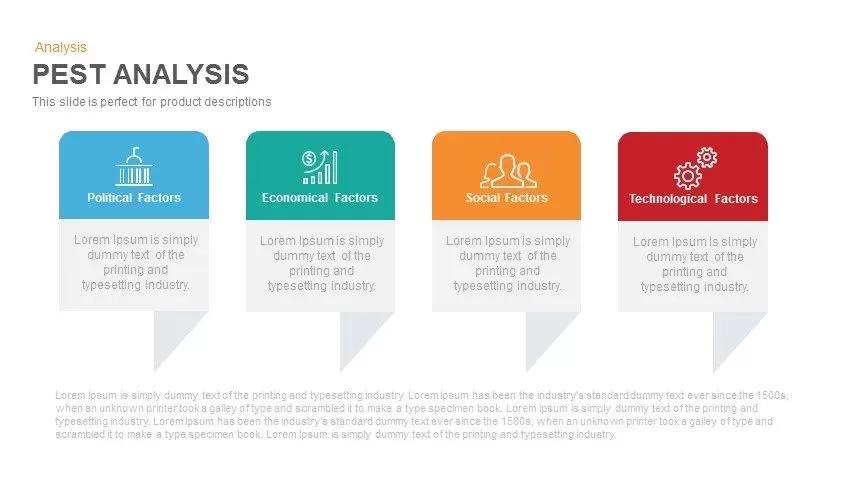
PEST Analysis Template for PowerPoint & Google Slides
PEST
Professional PESTEL Analysis Diagram Template for PowerPoint & Google Slides
PEST
Interactive Gap Analysis Puzzle Diagram Template for PowerPoint & Google Slides
Gap
Fishbone Diagram Analysis Template for PowerPoint & Google Slides
Flow Charts
Employee Skill Analysis Dashboard Template for PowerPoint & Google Slides
Employee Performance
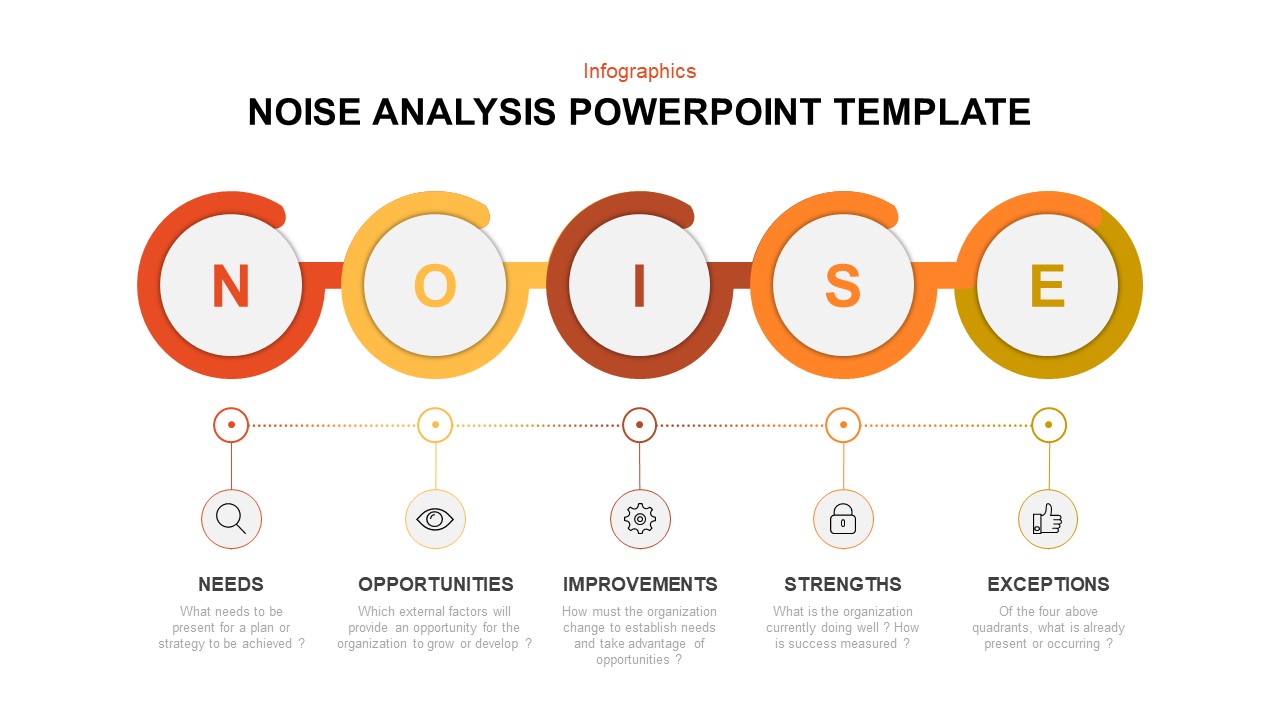
Modern Noise Analysis Infographic Template for PowerPoint & Google Slides
Process
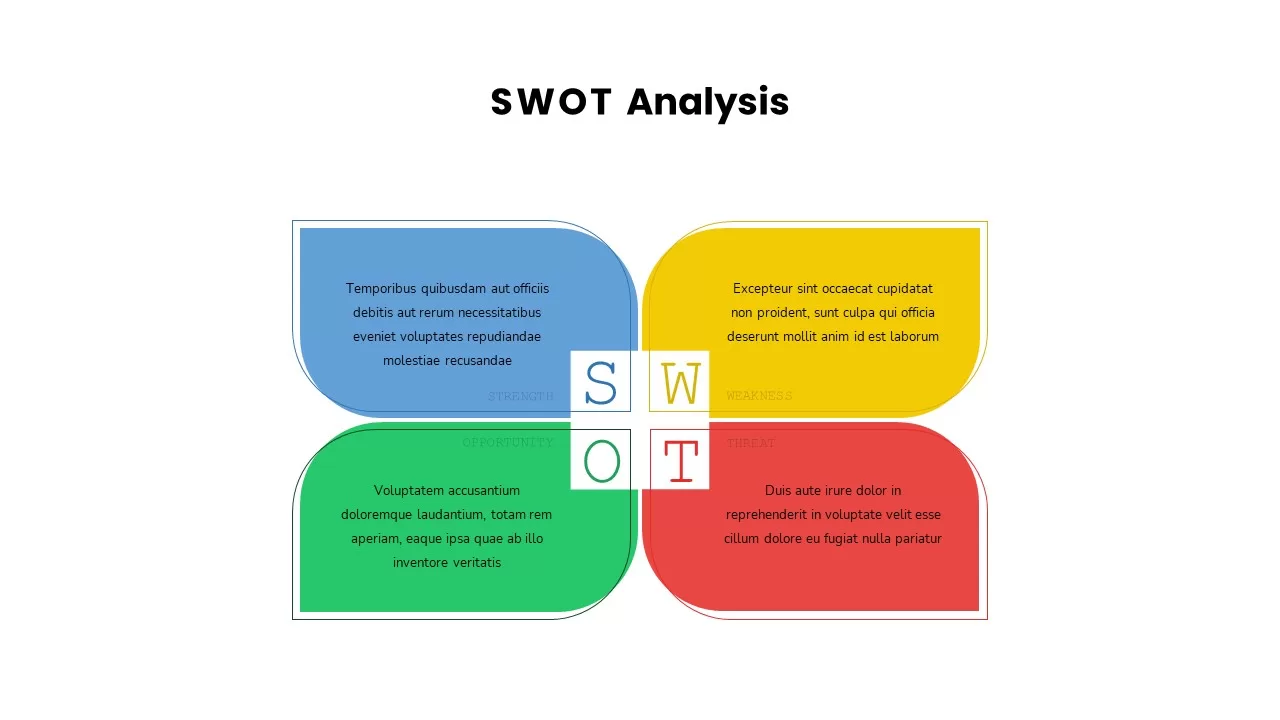
Four-Quadrant SWOT Analysis Diagram Template for PowerPoint & Google Slides
SWOT
Interactive 3D Puzzle SWOT Analysis Slide Template for PowerPoint & Google Slides
SWOT
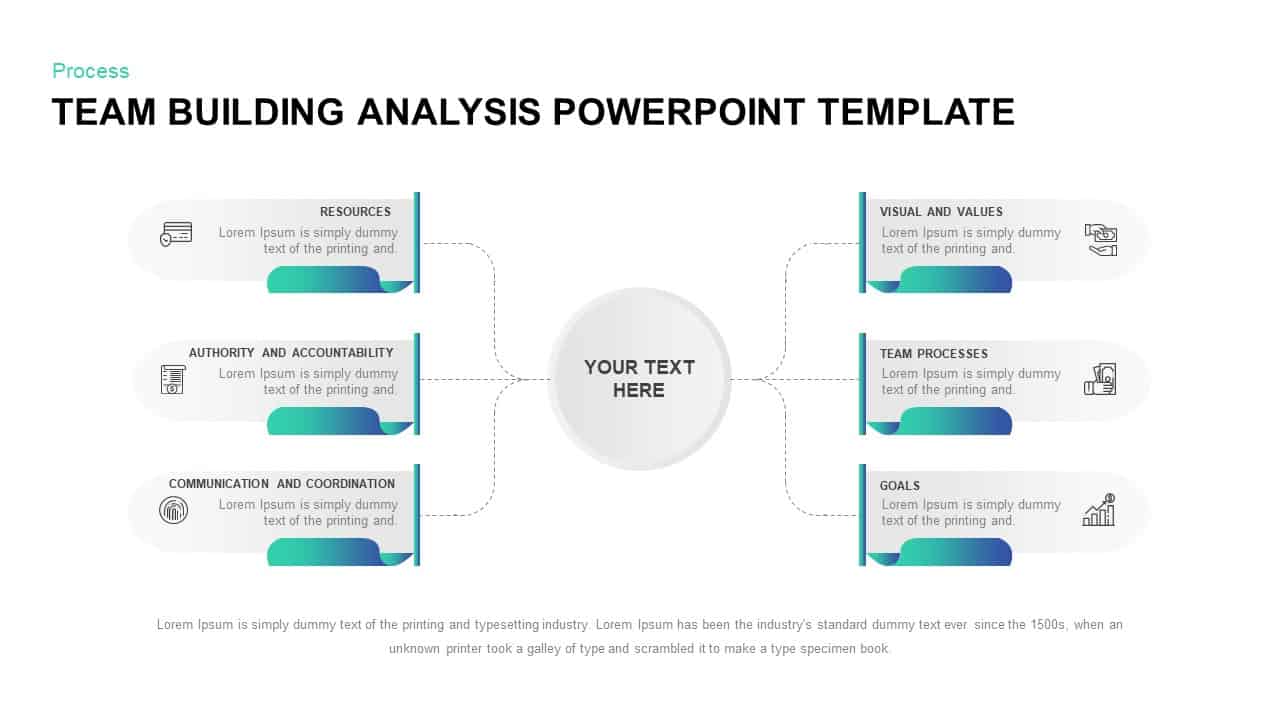
Team Building Hub-and-Spoke Analysis Template for PowerPoint & Google Slides
Process
Illustrated Business SWOT Analysis Template for PowerPoint & Google Slides
SWOT

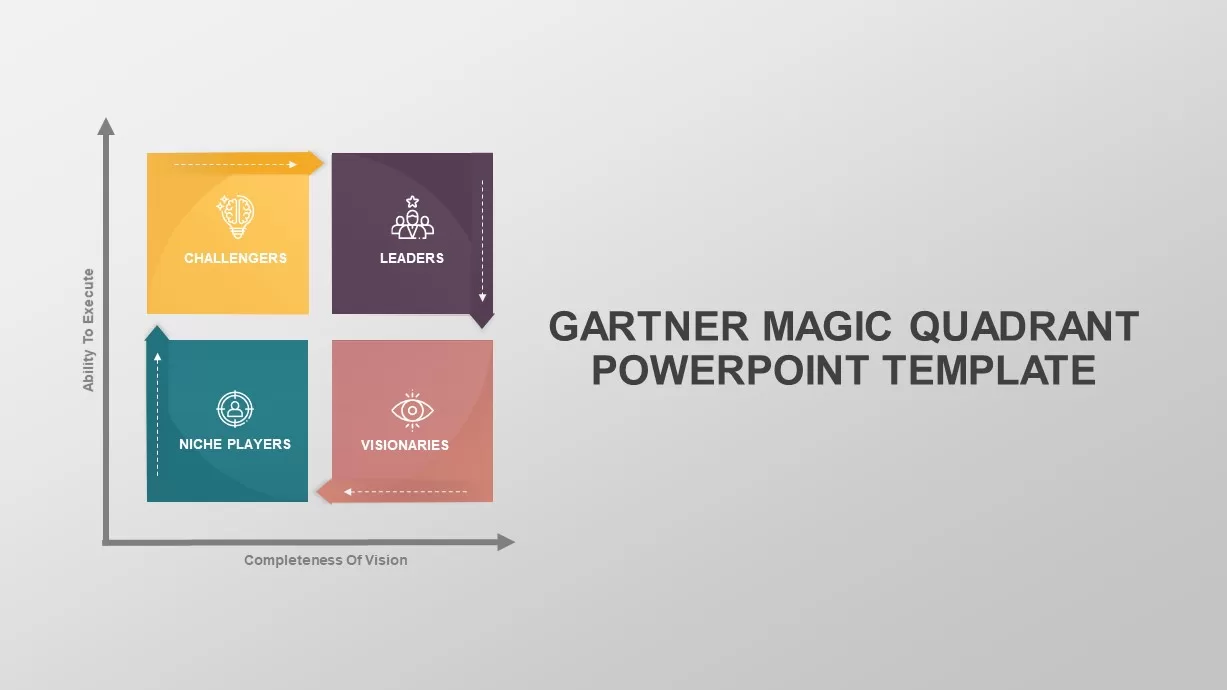
Gartner Magic Quadrant Analysis Template for PowerPoint & Google Slides
Business
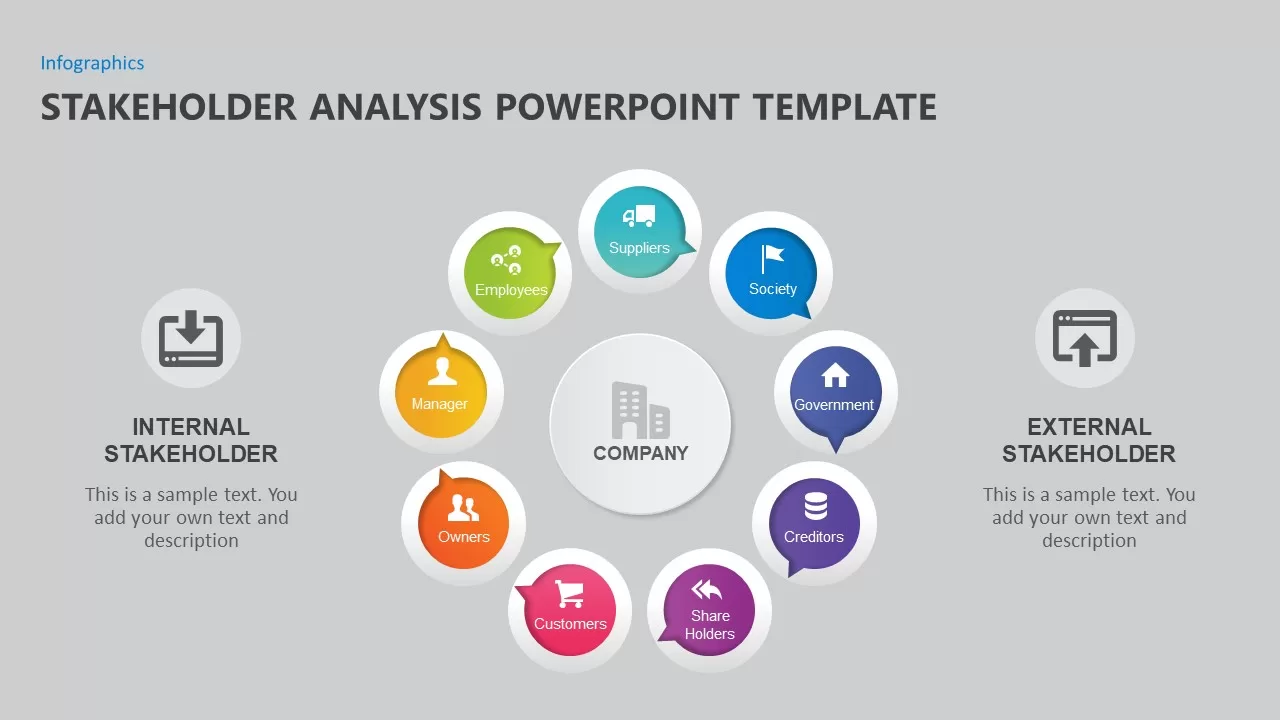
Stakeholder Analysis Template for PowerPoint & Google Slides
Business
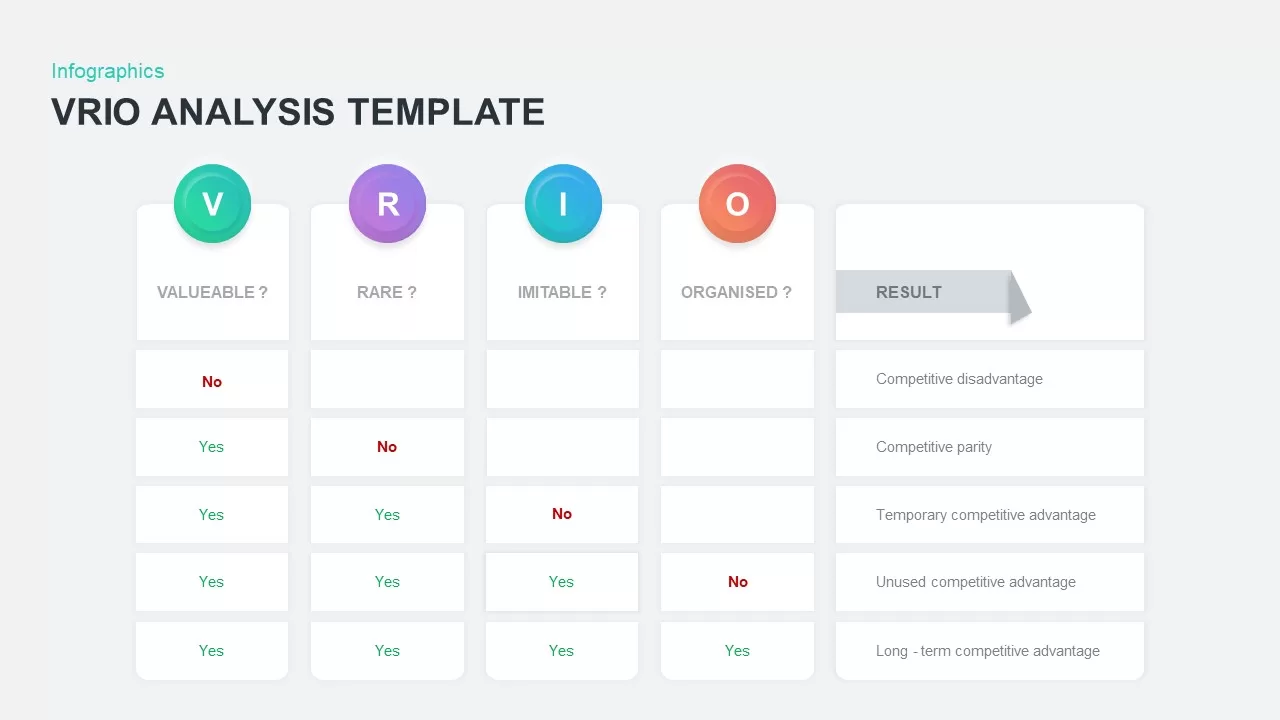
VRIO Analysis Infographic Template for PowerPoint & Google Slides
Business Strategy
IQ Scale Analysis Diagram template for PowerPoint & Google Slides
Employee Performance
SWOT Analysis Grid Infographic Template for PowerPoint & Google Slides
SWOT
Circular SWOT Analysis Infographic Template for PowerPoint & Google Slides
SWOT
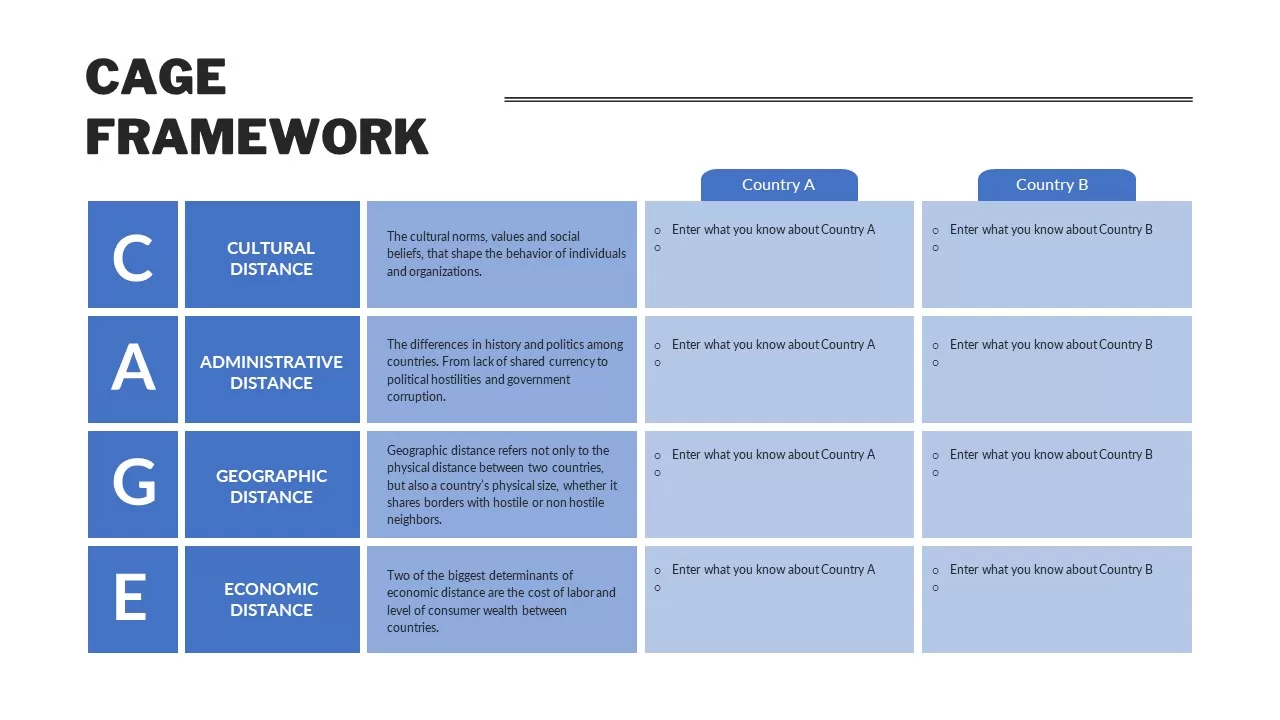
CAGE Distance Analysis Framework Template for PowerPoint & Google Slides
Competitor Analysis
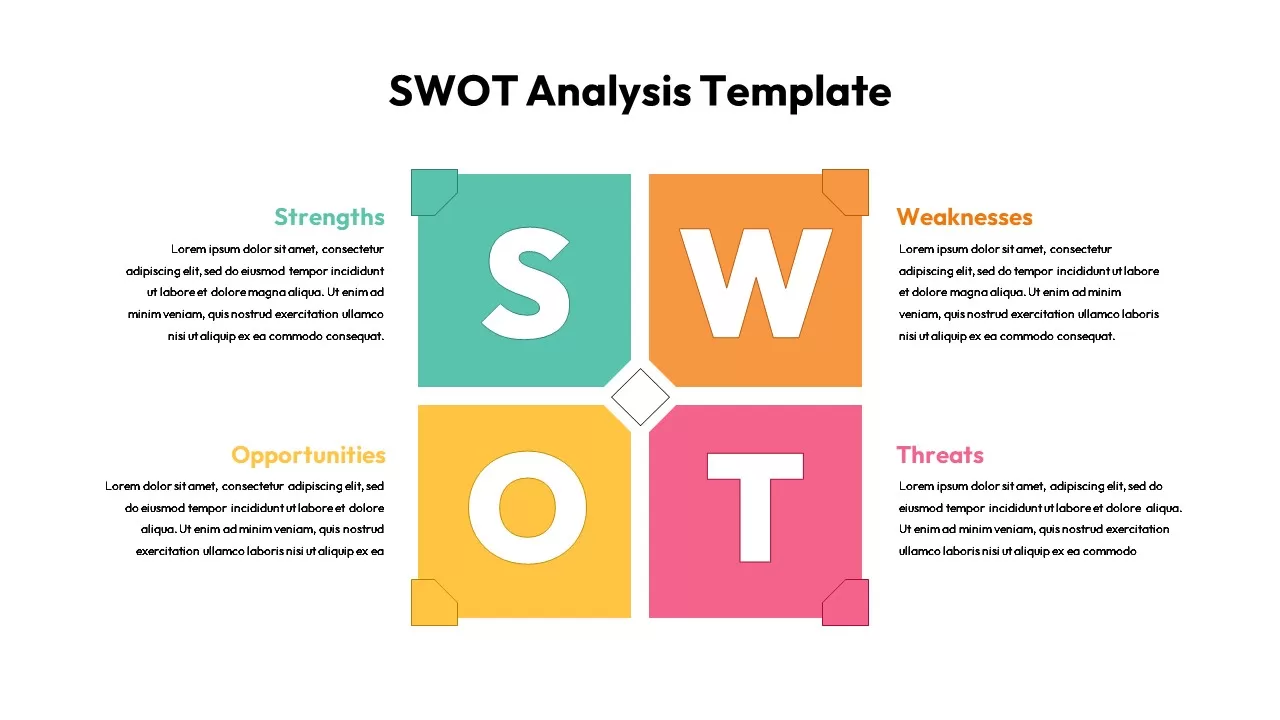
Modern Colorful SWOT Quadrant Analysis Template for PowerPoint & Google Slides
SWOT
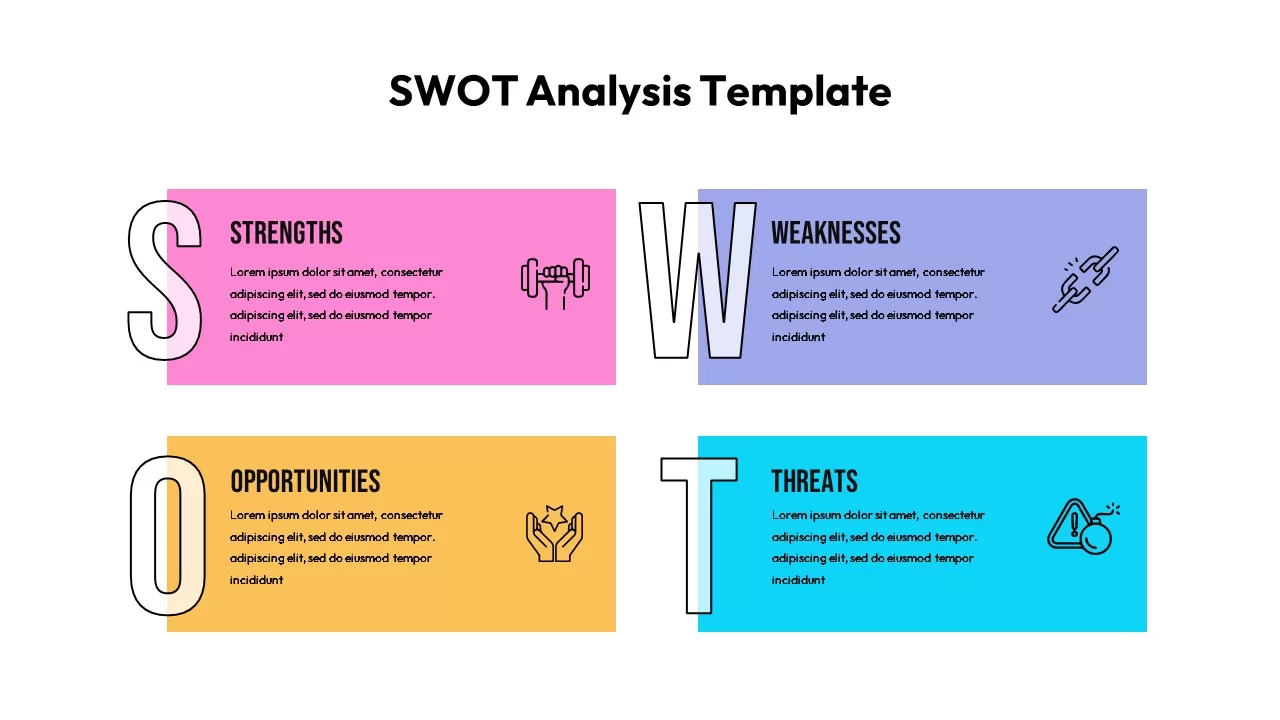
Colorful SWOT Analysis Quadrant Template for PowerPoint & Google Slides
SWOT
Colorful Vertical SWOT Analysis Layout Template for PowerPoint & Google Slides
SWOT
SWOT Analysis Overview template for PowerPoint & Google Slides
Business
SWOT Analysis Quadrant template for PowerPoint & Google Slides
Business Strategy
SWOT Analysis Blocks template for PowerPoint & Google Slides
Business Strategy
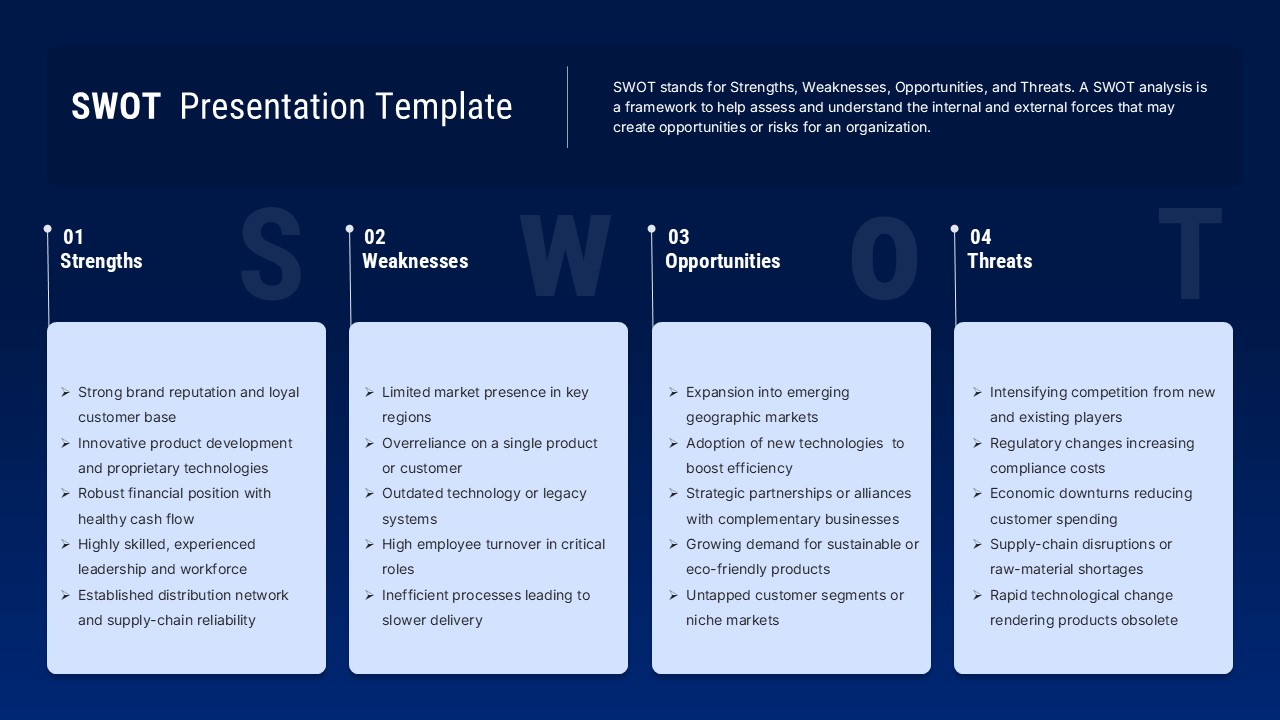
SWOT Analysis Template for PowerPoint & Google Slides
Business Strategy

Free SWOT Analysis Template for PowerPoint & Google Slides
SWOT
Free
SWOT Analysis template for PowerPoint & Google Slides
SWOT
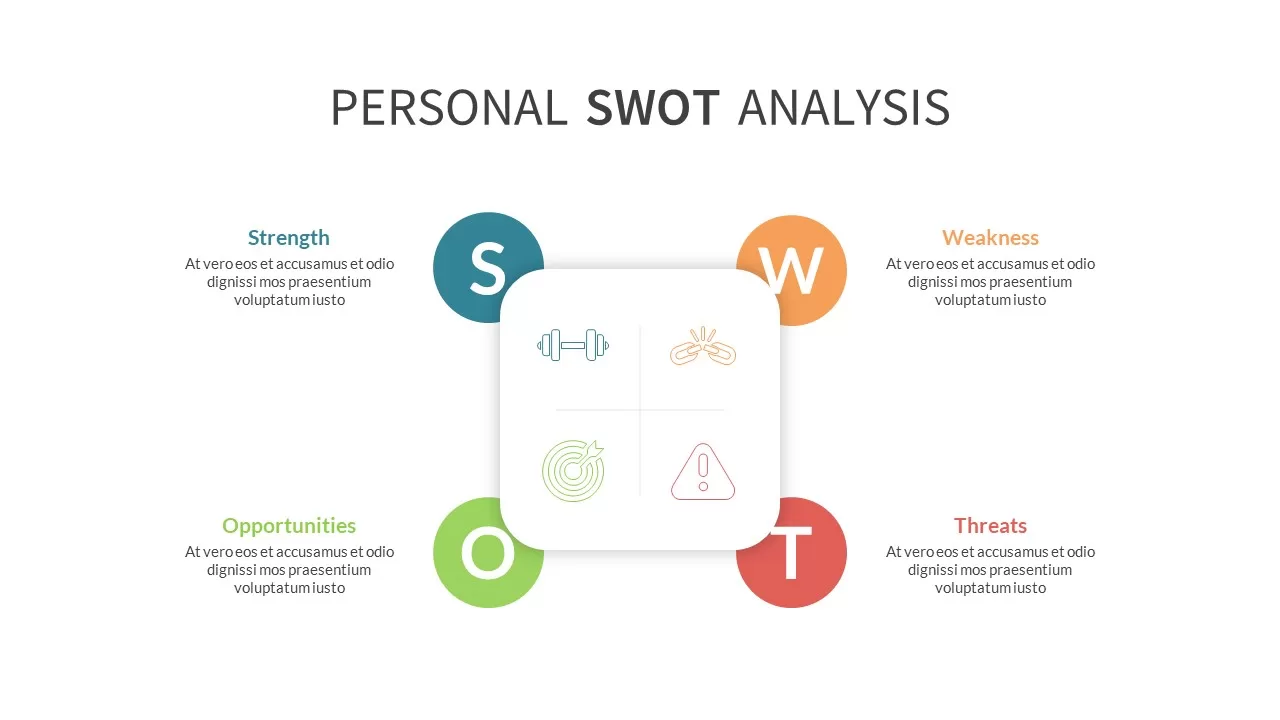
Photo Personal SWOT Analysis Callouts Template for PowerPoint & Google Slides
SWOT
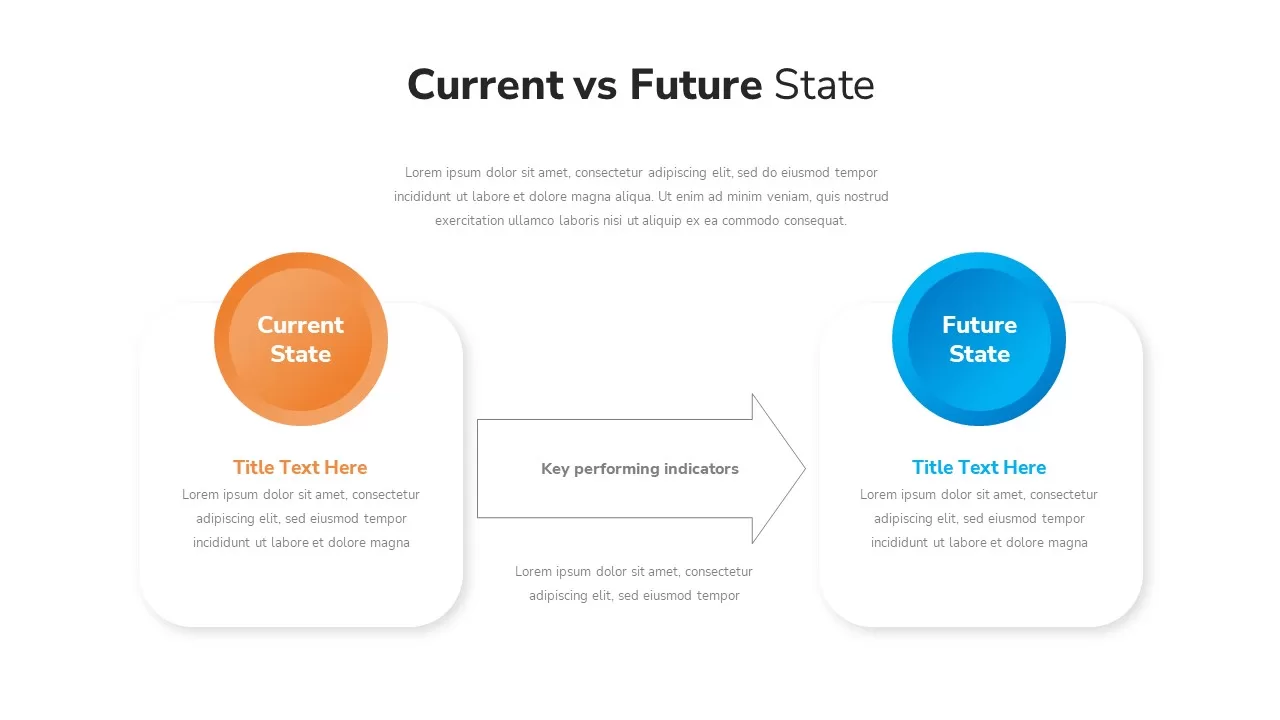
Current vs Future State Analysis template for PowerPoint & Google Slides
Comparison
Cost Benefit Analysis Comparison Template for PowerPoint & Google Slides
Comparison
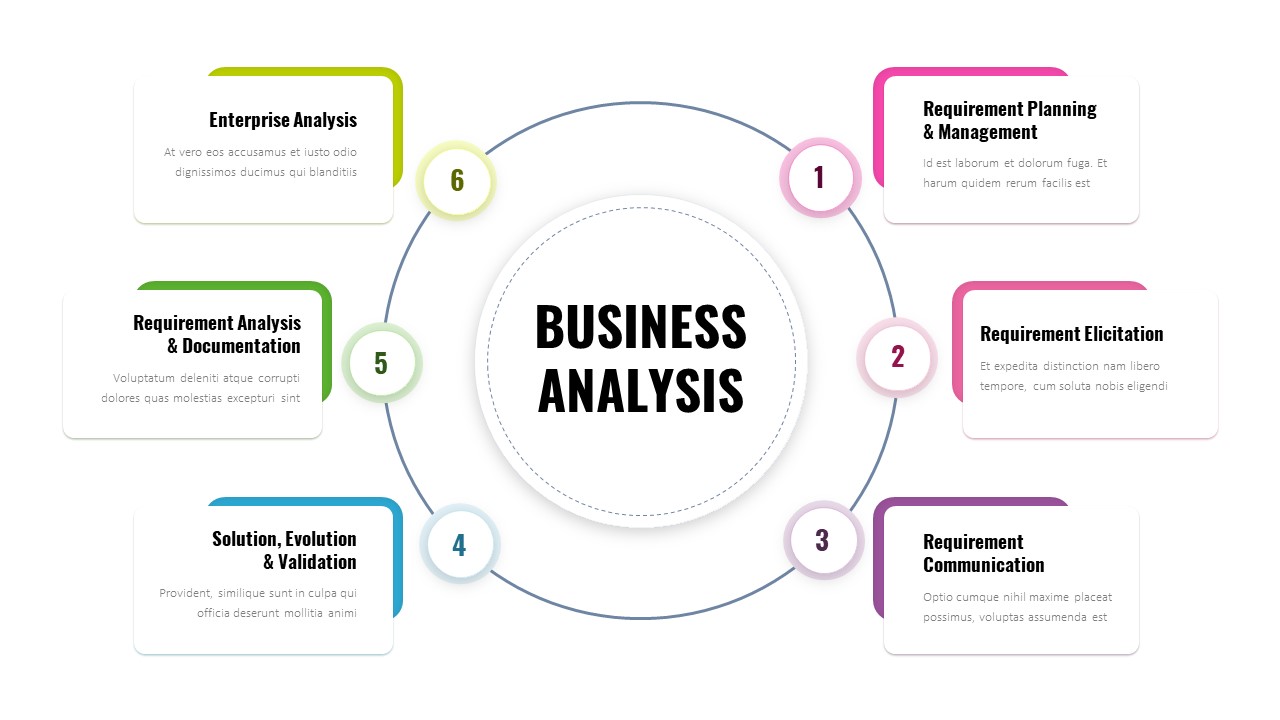
Six-Step Business Analysis Template for PowerPoint & Google Slides
Process
Vendor Comparison Analysis template for PowerPoint & Google Slides
Comparison Chart
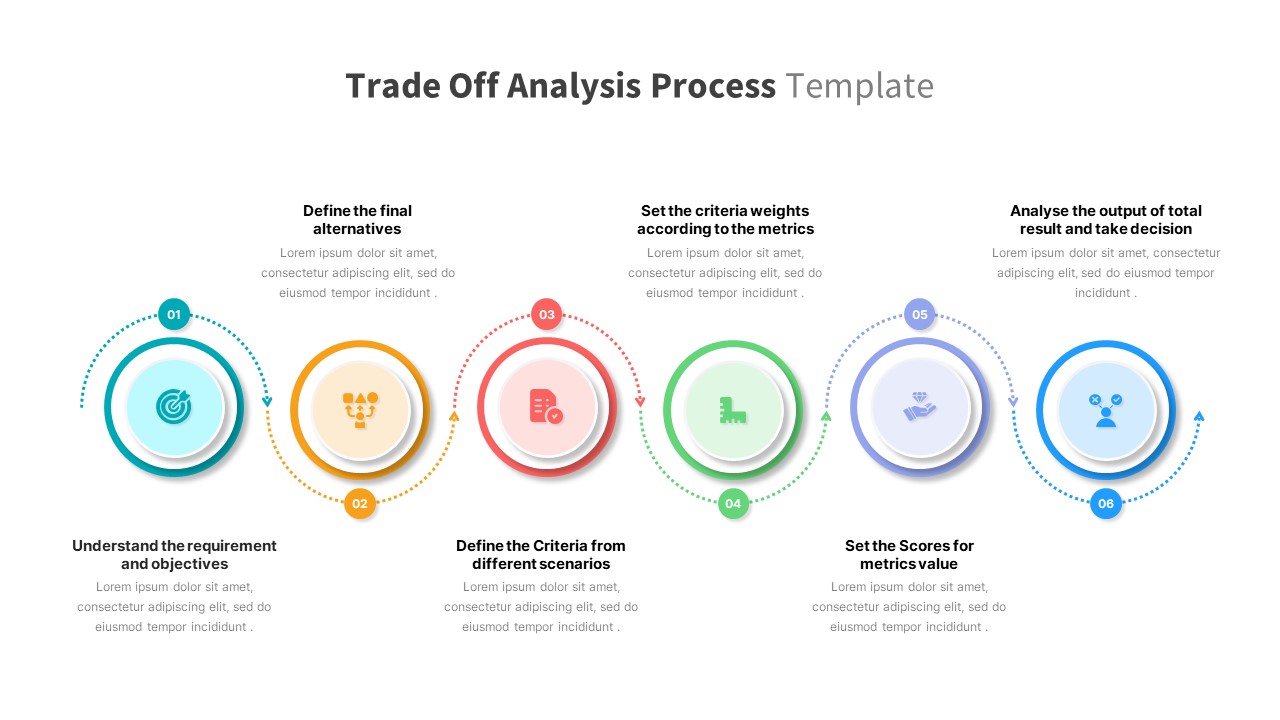
Trade Off Analysis Process template for PowerPoint & Google Slides
Process
Business Process Analysis Cycle Diagram Template for PowerPoint & Google Slides
Business Strategy
Simple Scatter Chart Analysis Template for PowerPoint & Google Slides
Comparison Chart
Simple Area Chart Data Trends Analysis Template for PowerPoint & Google Slides
Comparison Chart
Free Root Cause Analysis Fishbone Diagram Template for PowerPoint & Google Slides
Process
Free
Colorful SWOT Analysis Diagram Template for PowerPoint & Google Slides
SWOT
Expanding Margins Analysis Bar Chart Template for PowerPoint & Google Slides
Charts
Annual Growth Trend Analysis Chart template for PowerPoint & Google Slides
Business Report
Dynamic Financial Analysis Line Chart Template for PowerPoint & Google Slides
Finance
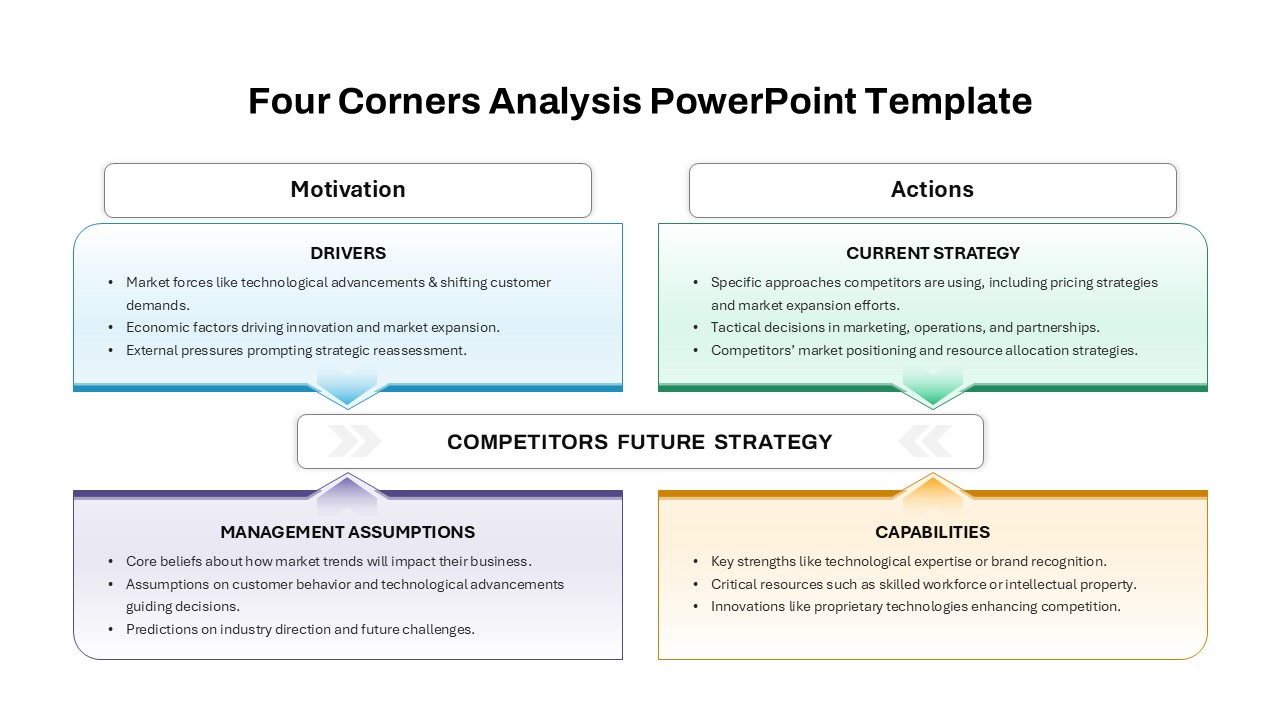
Four-Corners Strategic Analysis Quadrant Template for PowerPoint & Google Slides
SWOT
DESTEP Marketing Analysis Diagram Template for PowerPoint & Google Slides
Circular
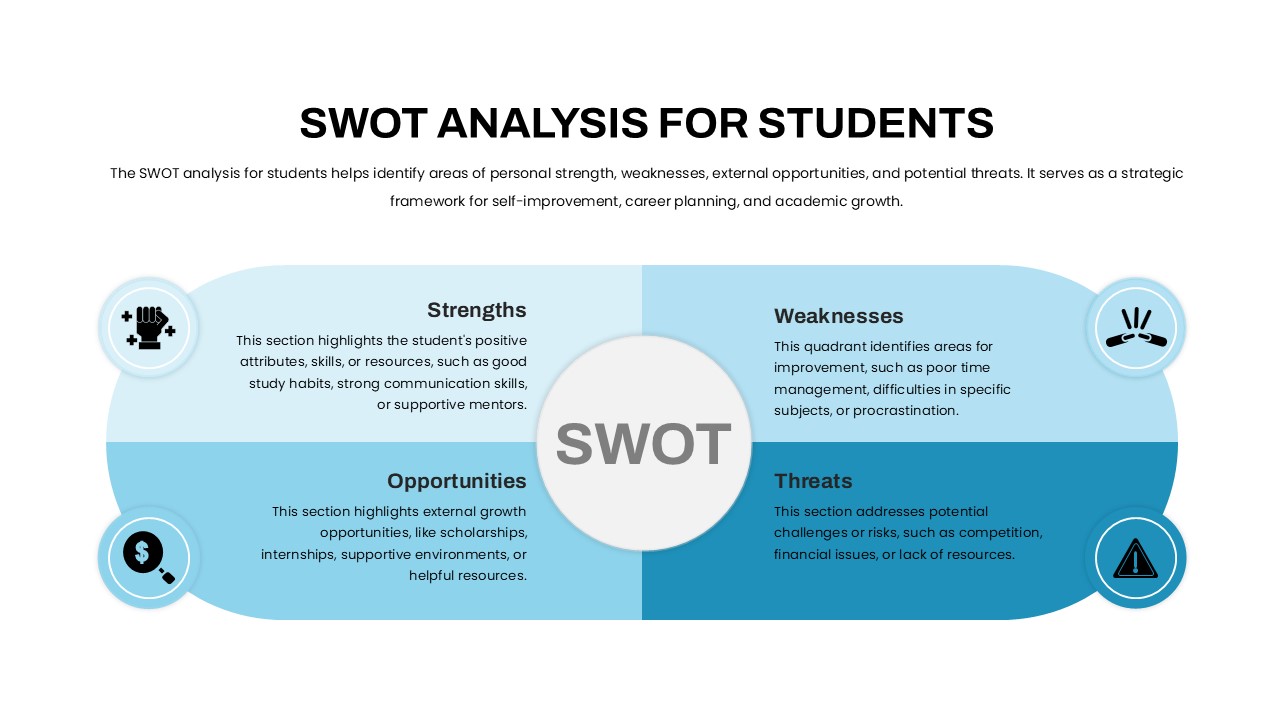
Student SWOT Analysis Framework Template for PowerPoint & Google Slides
SWOT
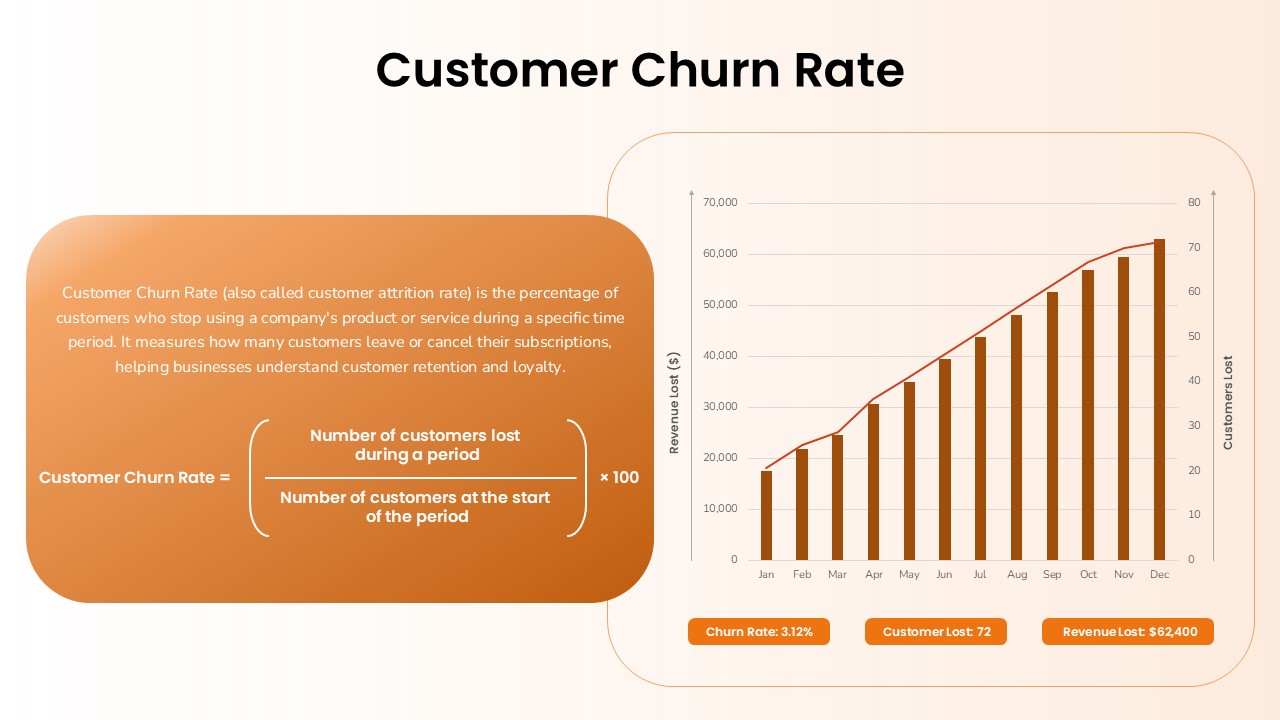
Customer Churn Rate Analysis template for PowerPoint & Google Slides
Business Report
Turnover Analysis Dashboard Template for PowerPoint & Google Slides
Employee Performance
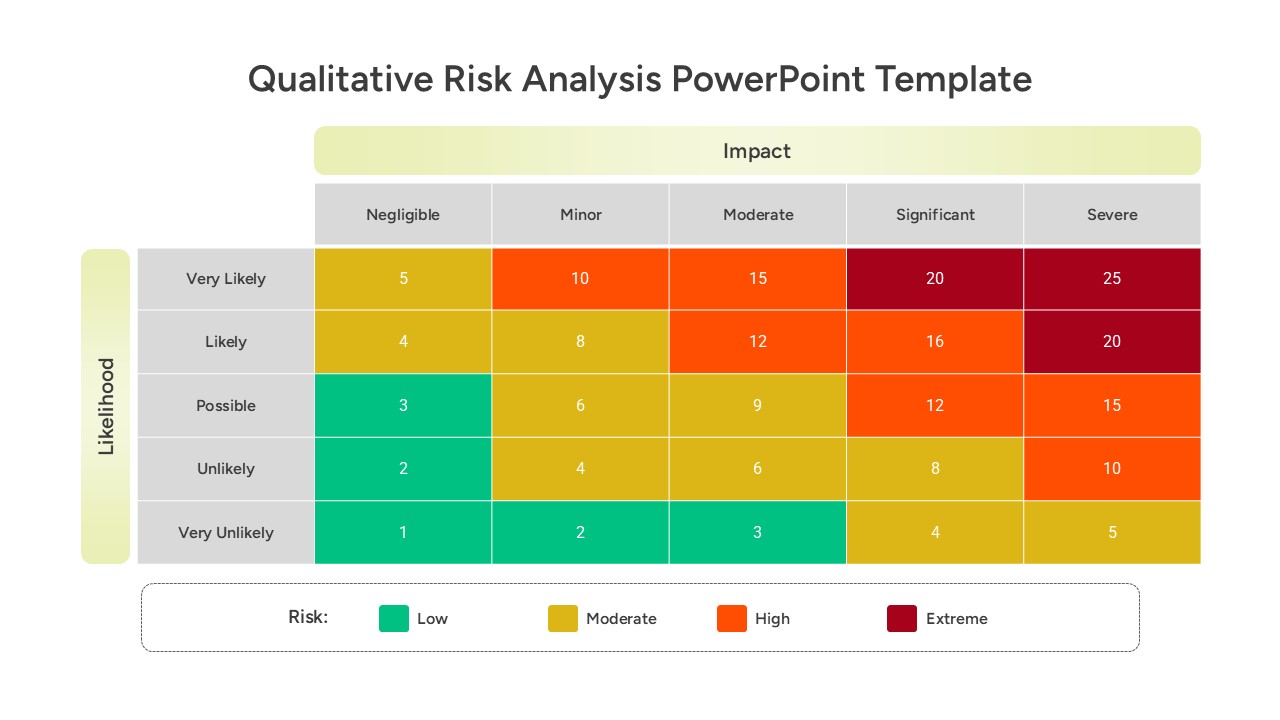
Qualitative Risk Analysis template for PowerPoint & Google Slides
Business
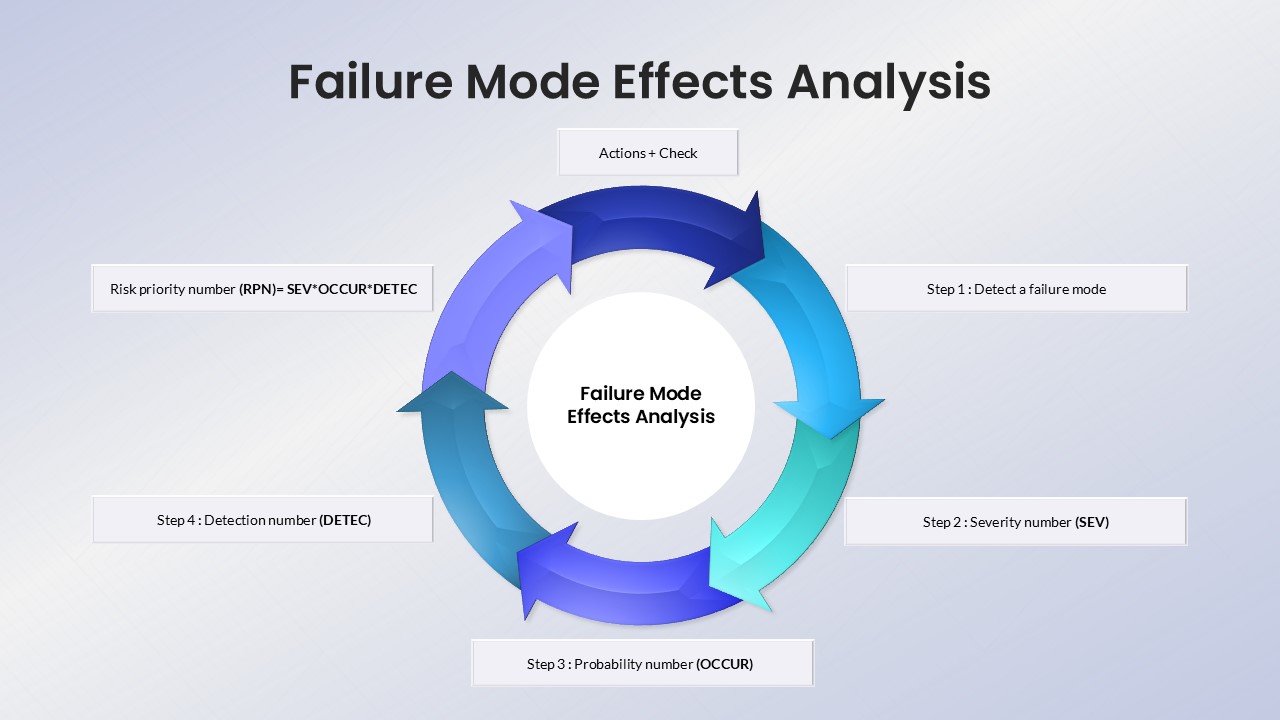
Failure Mode Effects Analysis (FMEA) Slide Template for PowerPoint & Google Slides
Process
Quantitative Risk Analysis Matrix template for PowerPoint & Google Slides
Risk Management
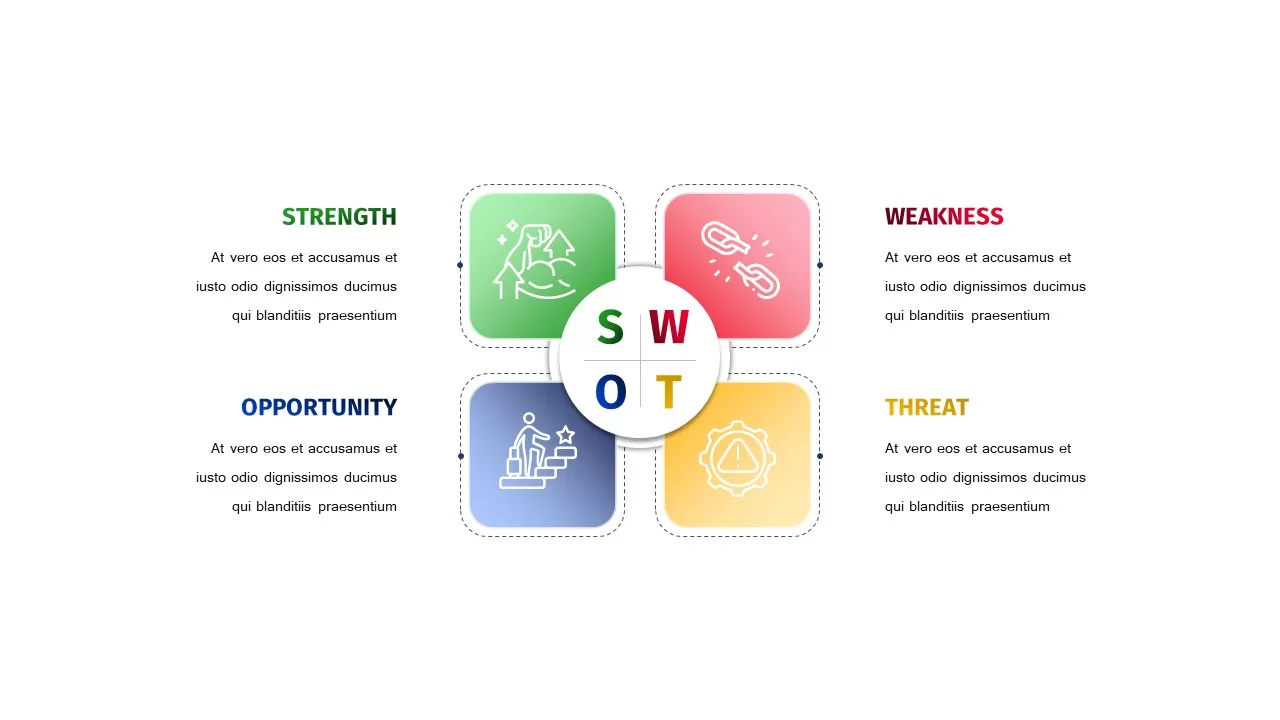
Colorful SWOT Analysis Quadrant Template for PowerPoint & Google Slides
SWOT
Blue SWOT Analysis Presentation Template for PowerPoint & Google Slides
SWOT
SWOT Analysis Infographic with Circular Icons Template for PowerPoint & Google Slides
SWOT
Multi Color SWOT Analysis Quadrant Template for PowerPoint & Google Slides
SWOT
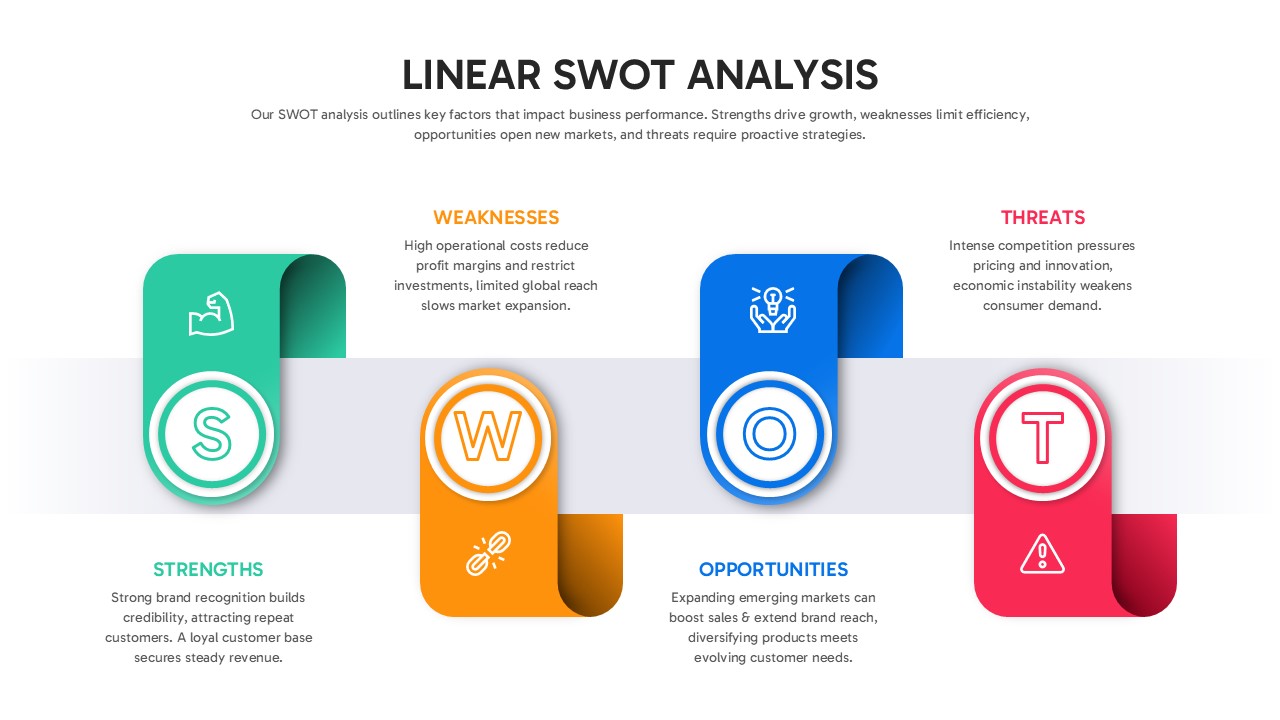
Linear SWOT Analysis Slide Template for PowerPoint & Google Slides
SWOT
Personal SWOT Analysis Matrix Cards Template for PowerPoint & Google Slides
SWOT
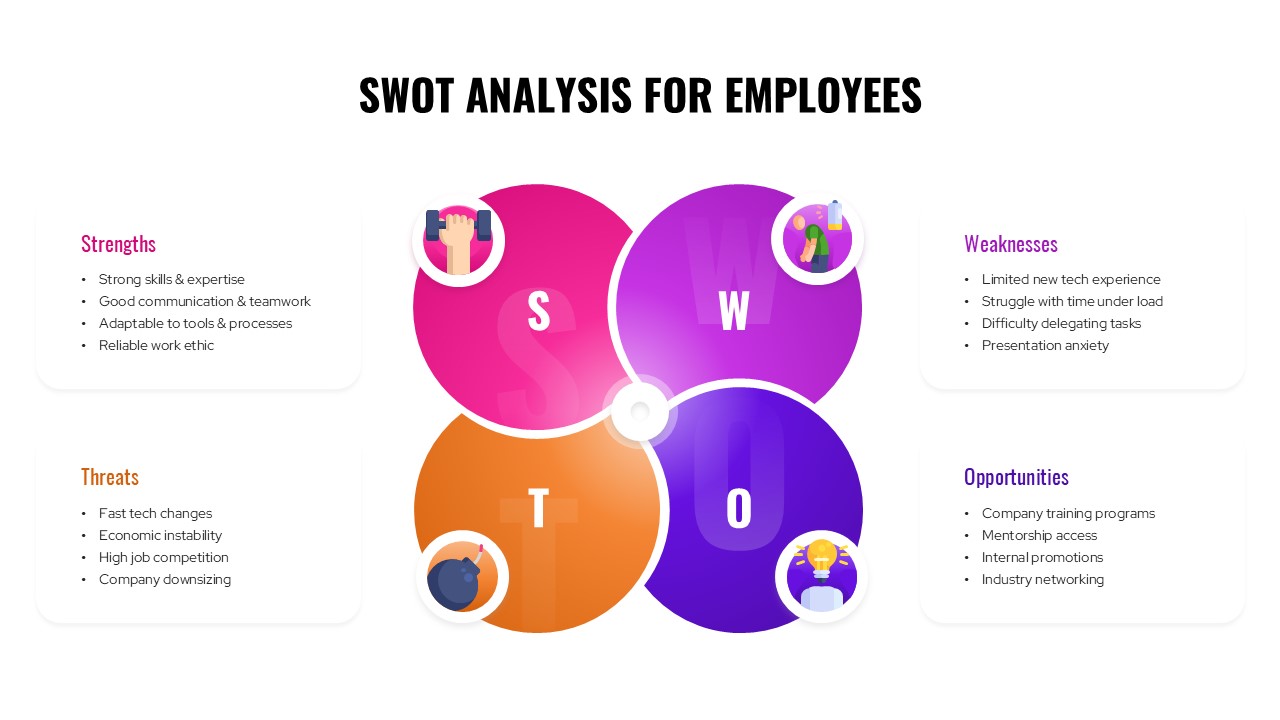
SWOT Analysis For Employees Template for PowerPoint & Google Slides
SWOT
Financial Gap Analysis Framework Template for PowerPoint & Google Slides
Finance