Global Economy Market Trends Analysis Template for PowerPoint & Google Slides
Description
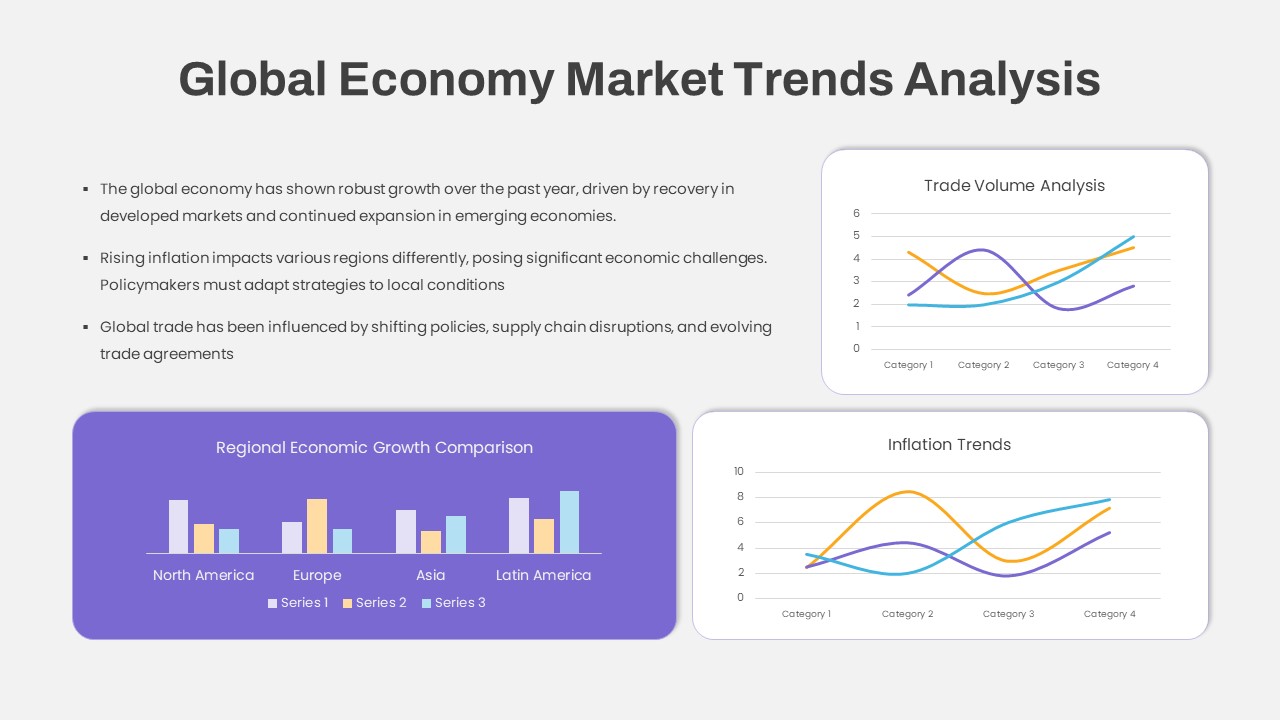
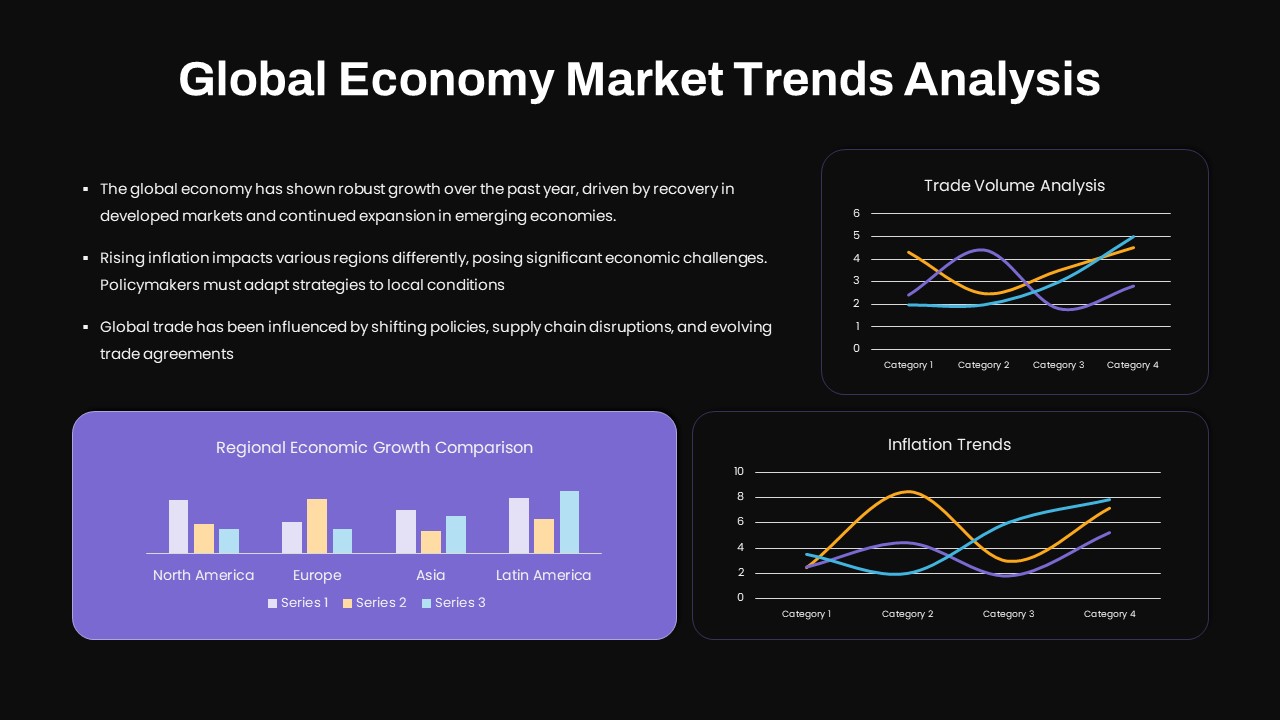
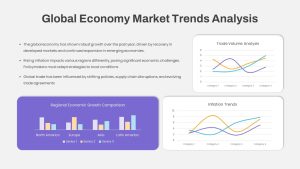
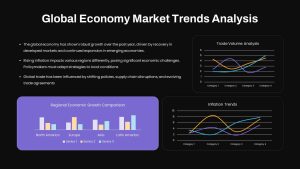
Leverage this Global Economy Market Trends Analysis template to deliver a data-driven overview of key economic indicators on a single, polished slide. The top left panel introduces three concise bullet points—global growth drivers, regional inflation impacts, and evolving trade dynamics—using clear typography and ample white space. On the right, two rounded-corner chart frames present line-chart analyses: Trade Volume Analysis at the top and Inflation Trends below, each using distinct color lines to map category performance across four periods.
Anchoring the slide, a full-width bar-chart panel in vibrant purple contrasts with the white background to showcase a Regional Economic Growth Comparison across North America, Europe, Asia, and Latin America. Three color-coded series allow audiences to instantly compare growth metrics side-by-side, while a simple legend reinforces clarity. Subtle drop shadows and consistent iconography ensure each element stands out without visual clutter.
Fully editable in both PowerPoint and Google Slides, this template is built on master layouts with vector shapes, intuitive text placeholders, and customizable color palettes. Swap chart data or adjust axes in seconds, replace the purple background to match corporate style guidelines, or reposition text blocks to highlight your most critical insights. Whether you’re briefing executive teams, training analysts, or presenting at industry conferences, this slide accelerates preparation and elevates your data storytelling.
Who is it for
Economic analysts, financial advisors, policy makers, market researchers, and investor relations teams
Other Uses
Quarterly business reviews, boardroom presentations, academic lectures, client proposals, and regional performance reports
Login to download this file

Item ID
SB04420
Related Templates

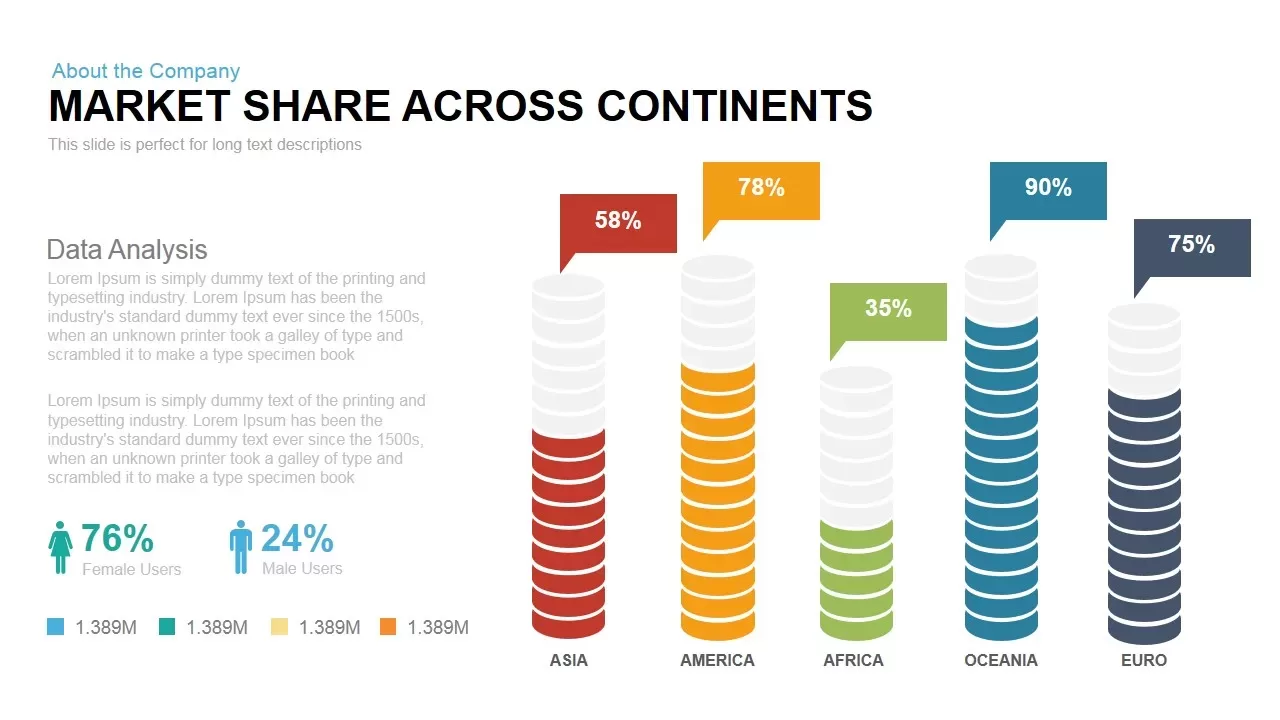
Global Market Share Cylinder Chart Template for PowerPoint & Google Slides
Bar/Column
Free Global Market Distribution Map Template for PowerPoint & Google Slides
World Maps
Free
Simple Area Chart Data Trends Analysis Template for PowerPoint & Google Slides
Comparison Chart
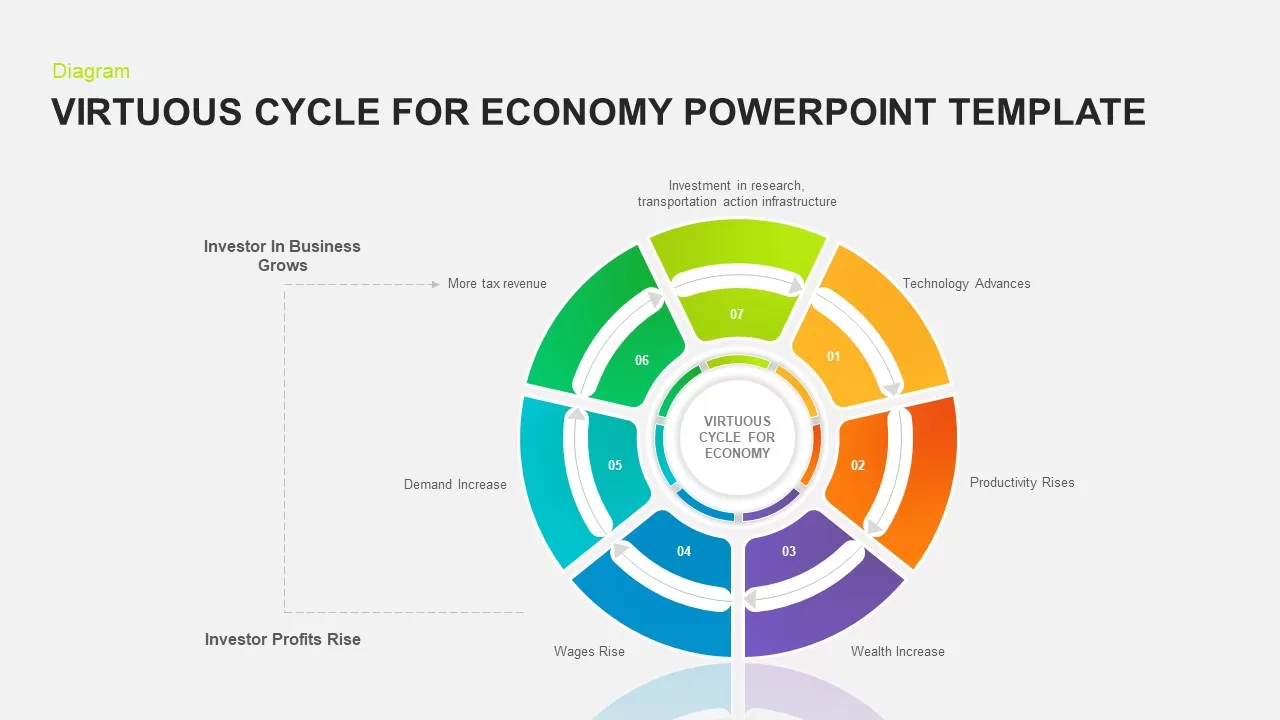
7-Step Virtuous Economy Cycle Diagram Template for PowerPoint & Google Slides
Process
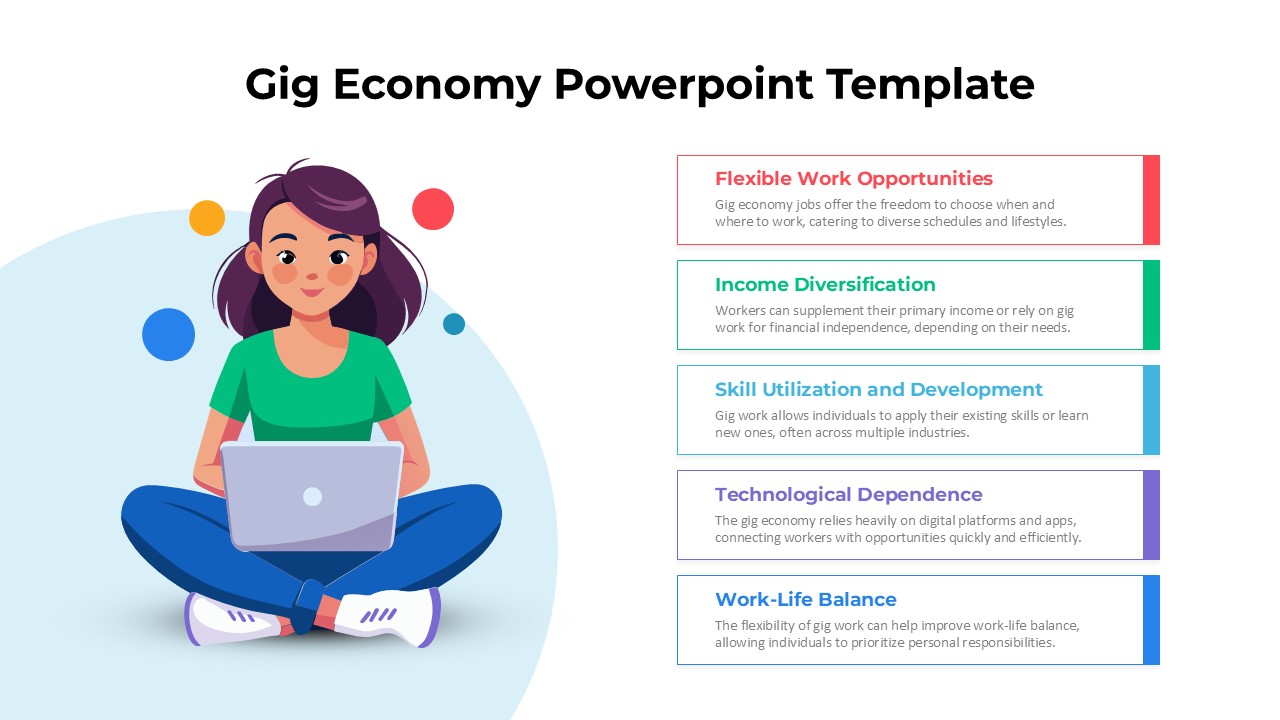
Gig Economy Infographic One-Pager Template for PowerPoint & Google Slides
Comparison
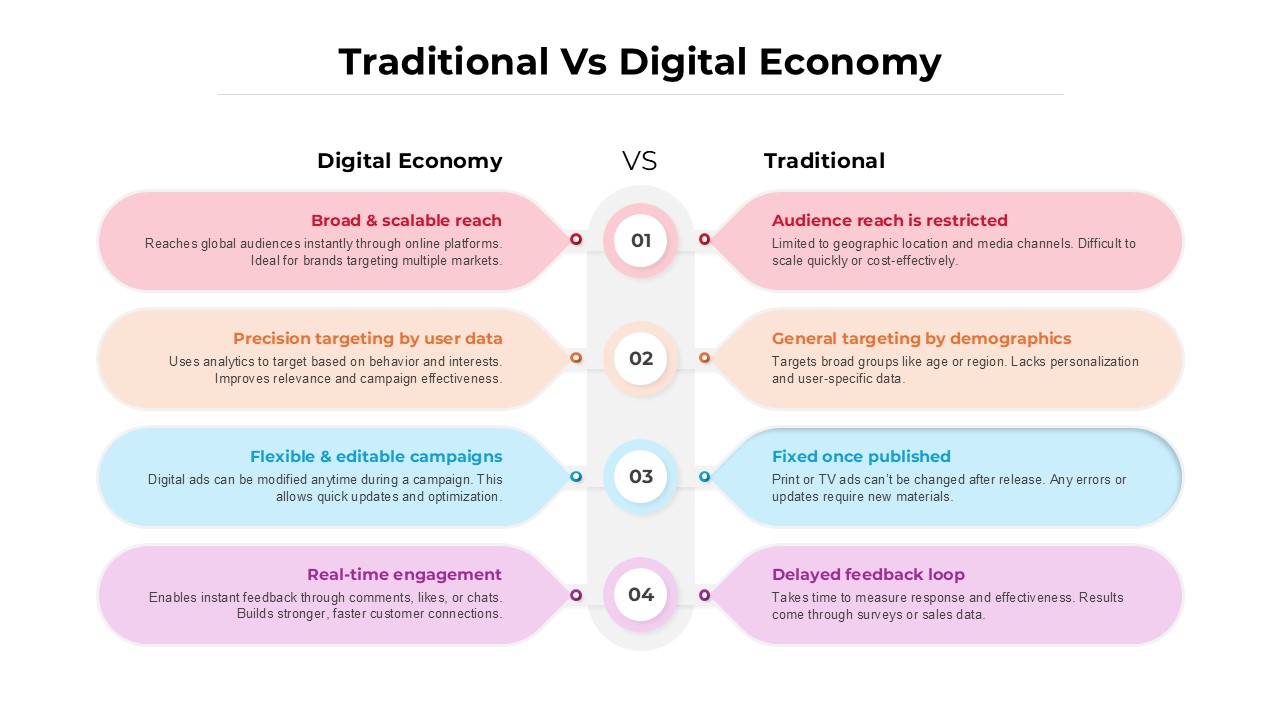
Traditional vs Digital Economy Template for PowerPoint & Google Slides
Comparison
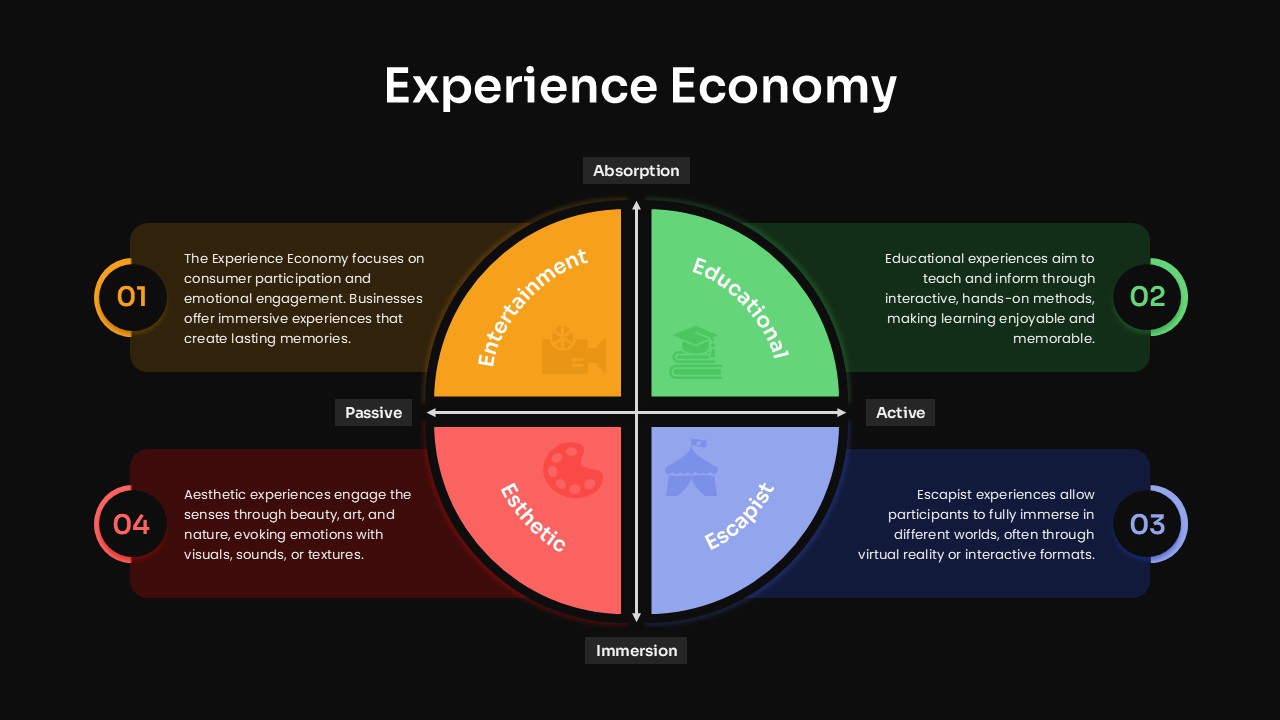
Experience Economy Quadrant Diagram Template for PowerPoint & Google Slides
Circular
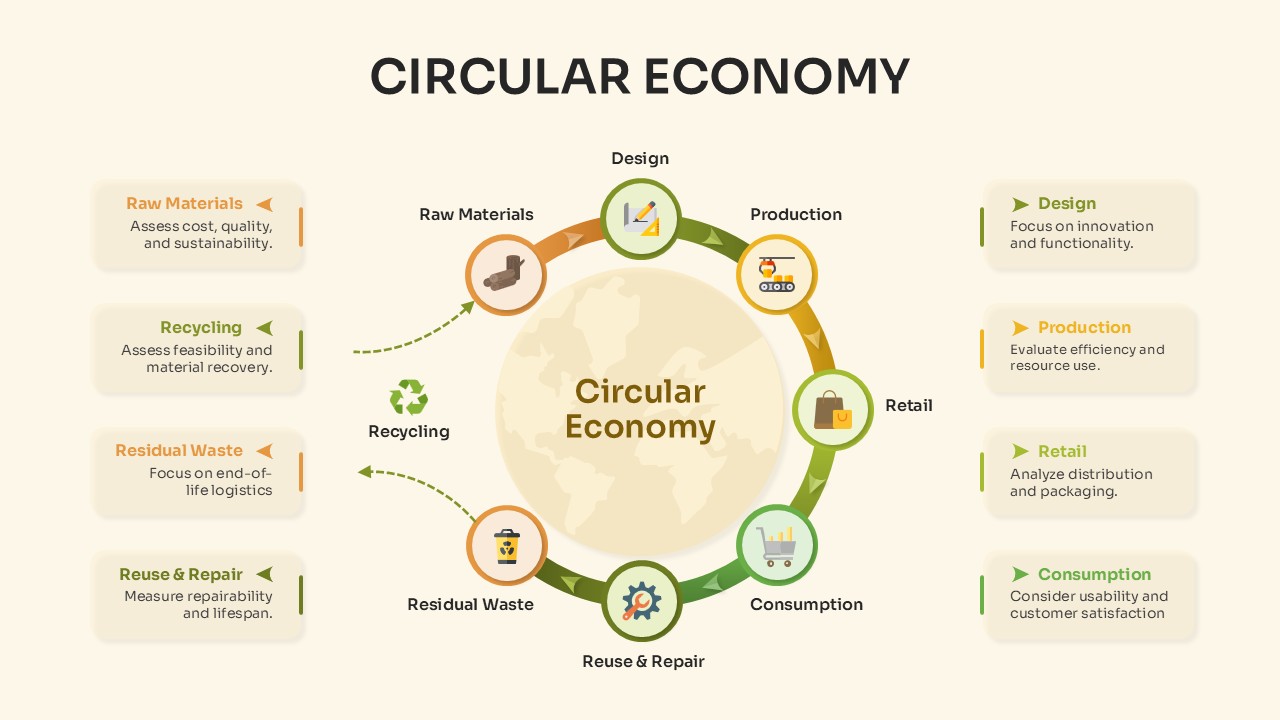
Circular Economy Process Overview Template for PowerPoint & Google Slides
Circular

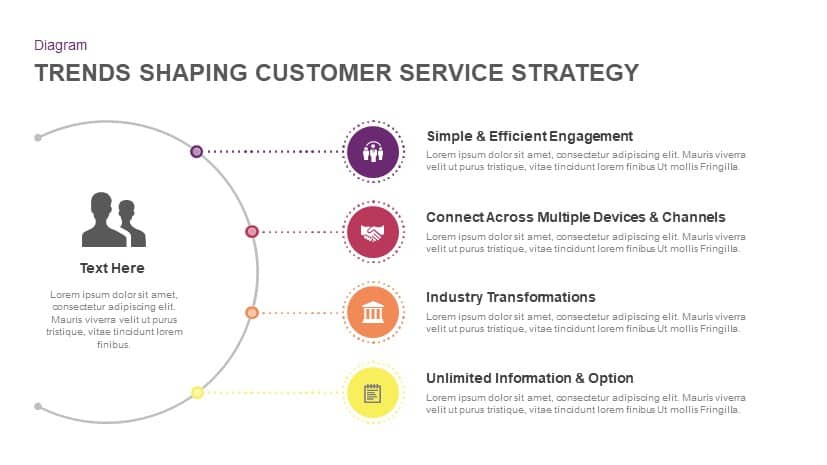
Trends Shaping Customer Service Strategy template for PowerPoint & Google Slides
Marketing
Animated Business Trends Creative Deck Template for PowerPoint & Google Slides
Pitch Deck
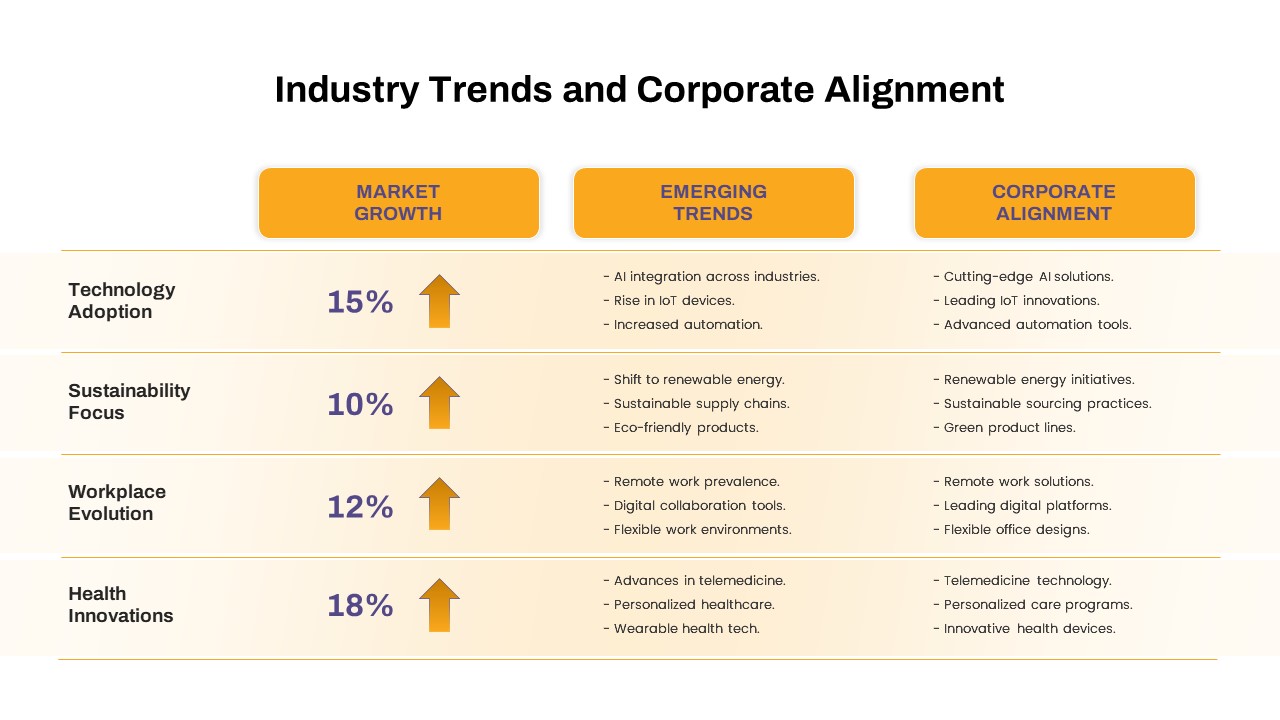
Industry Trends & Corporate Alignment Template for PowerPoint & Google Slides
Business Strategy
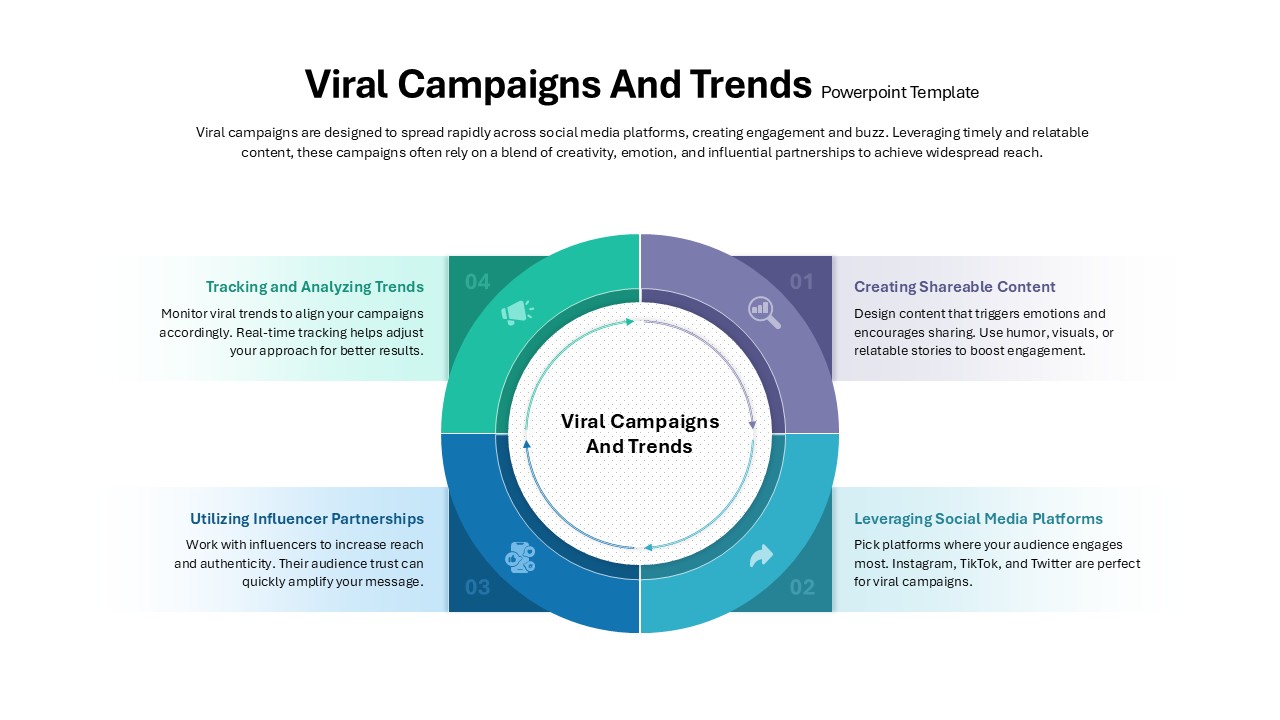
Viral Campaigns and Trends Strategy for PowerPoint & Google Slides
Advertising
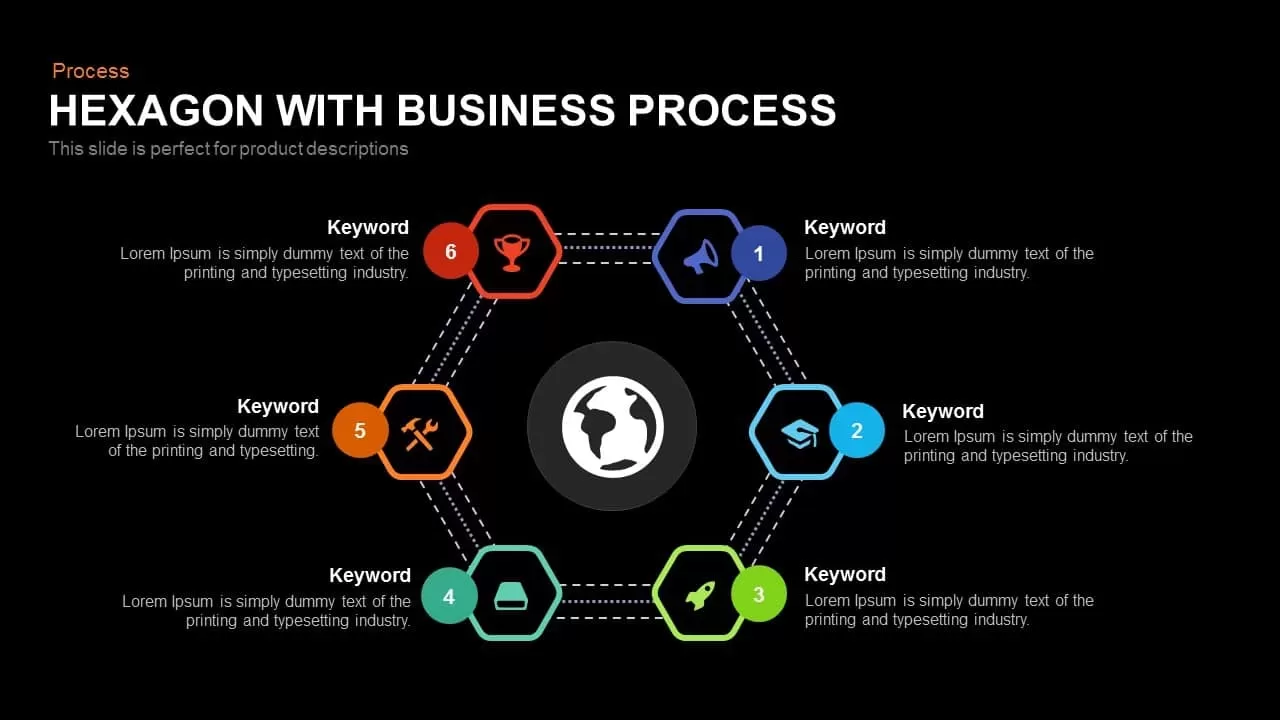
Global Hexagon Six-Step Business Process Template for PowerPoint & Google Slides
Process

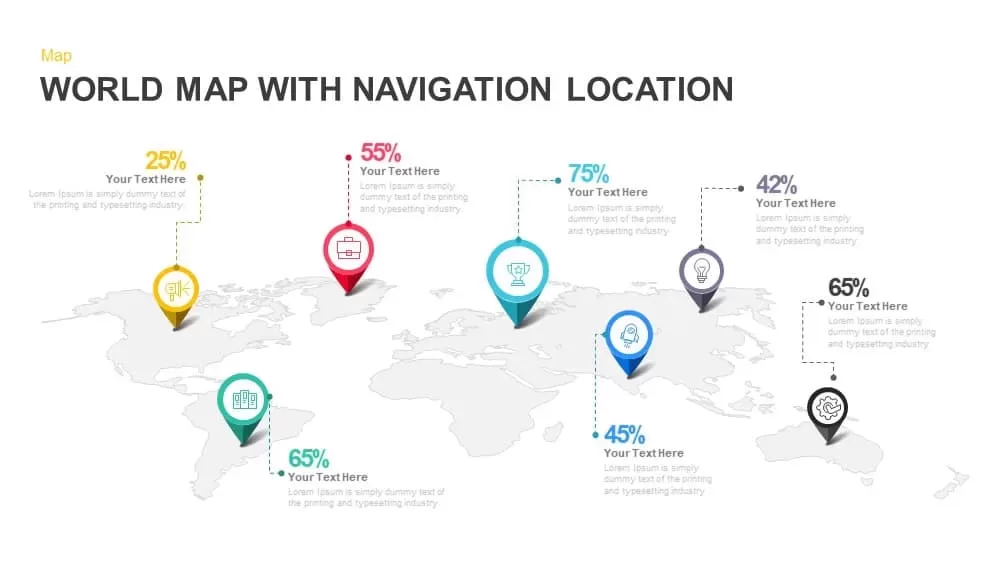
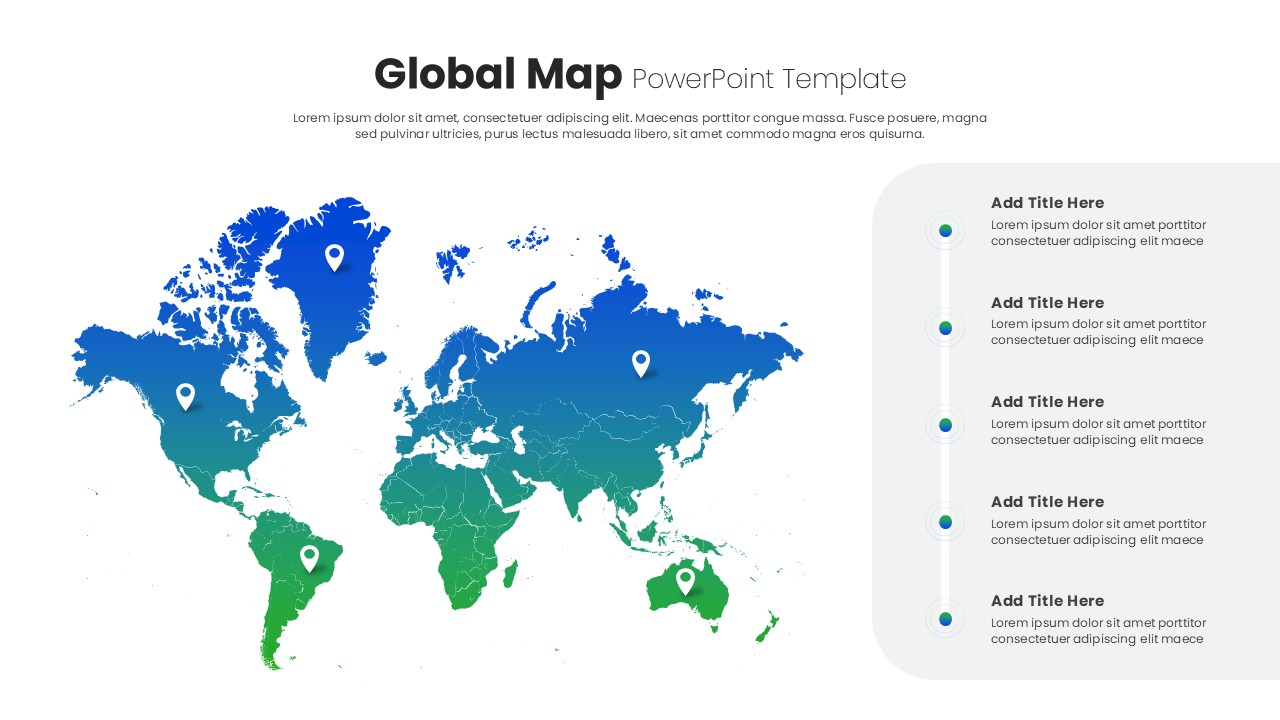
Global Map with Location Markers Template for PowerPoint & Google Slides
World Maps
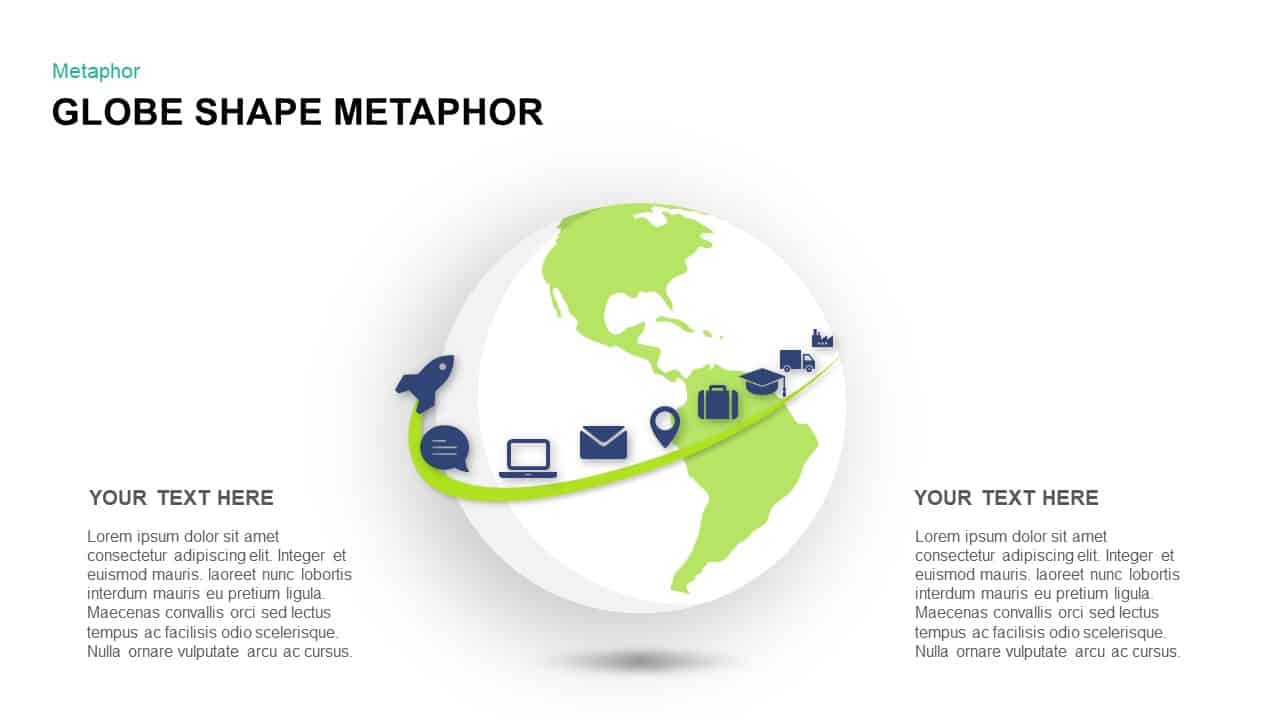
Global Business Pathway Metaphor Template for PowerPoint & Google Slides
Opportunities Challenges
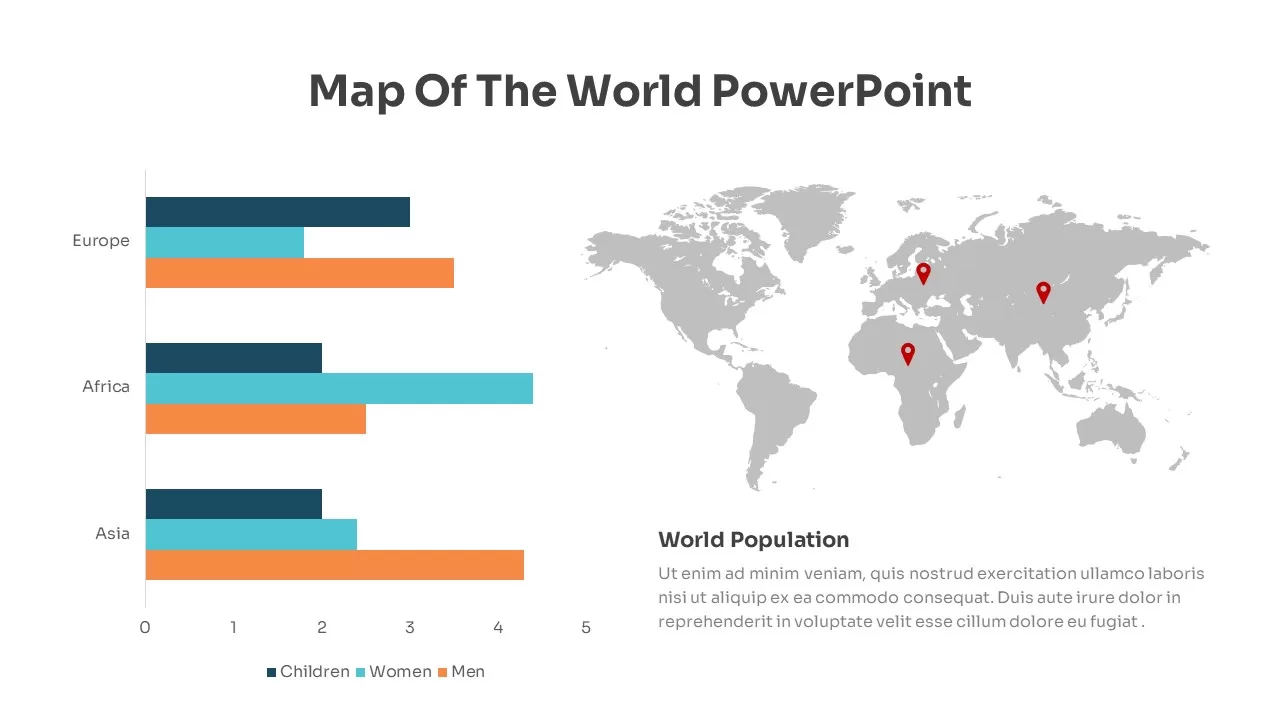
Global Population Demographics & Map Template for PowerPoint & Google Slides
Bar/Column
Statistics & Global Metrics Infographic Template for PowerPoint & Google Slides
Bar/Column
Free Global Warming Infographic Comparison Template for PowerPoint & Google Slides
Comparison Chart
Free

Modern Global Travel Presentation Template for PowerPoint & Google Slides
Decks
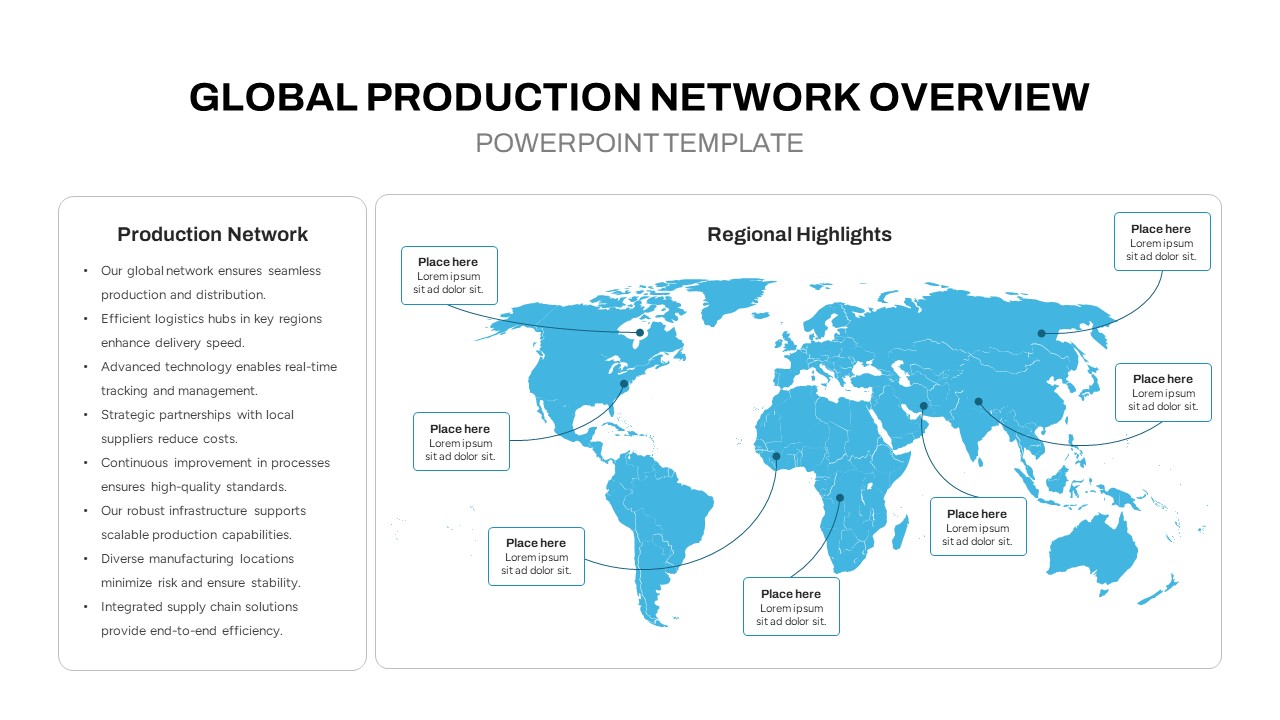
Global Production Network Overview Map Template for PowerPoint & Google Slides
World Maps
Free Dynamic Global Warming Presentation Template for PowerPoint & Google Slides
Pitch Deck
Free
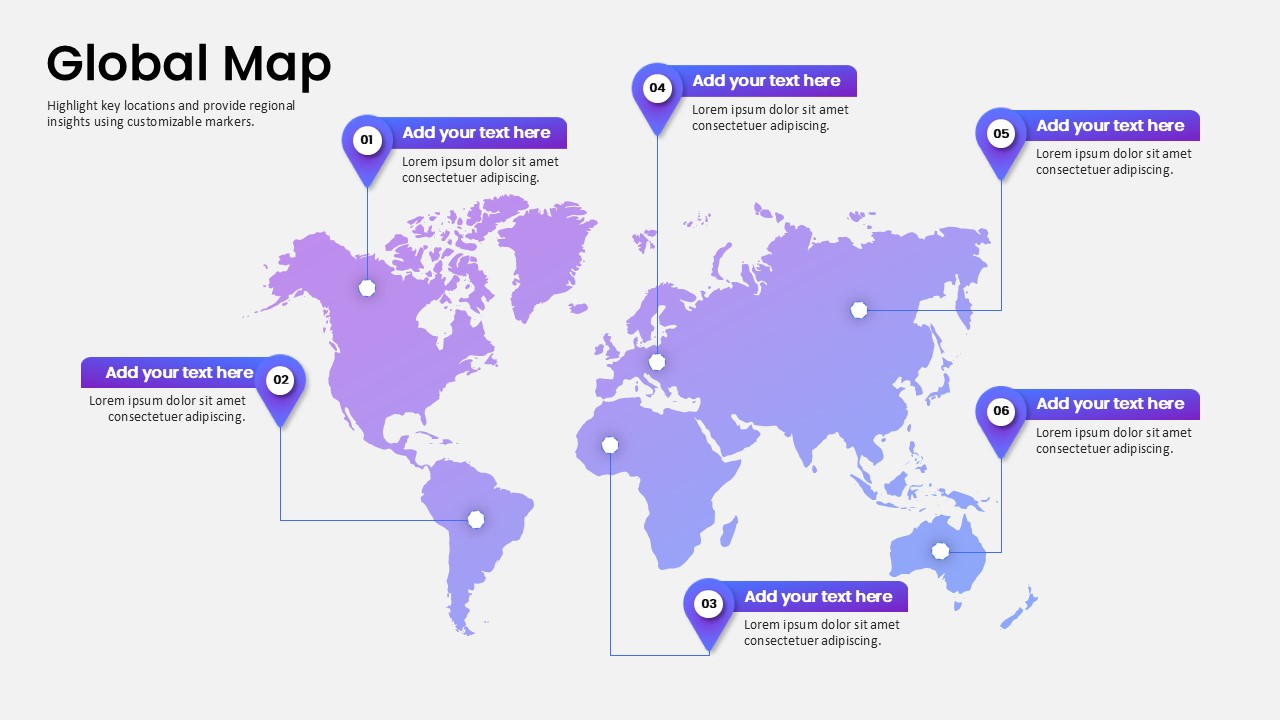
Global Map Highlighting Key Locations template for PowerPoint & Google Slides
World Maps
Global Health Initiatives Presentation Template for PowerPoint & Google Slides
Health
Global Map with Pinpoint Markers template for PowerPoint & Google Slides
Business
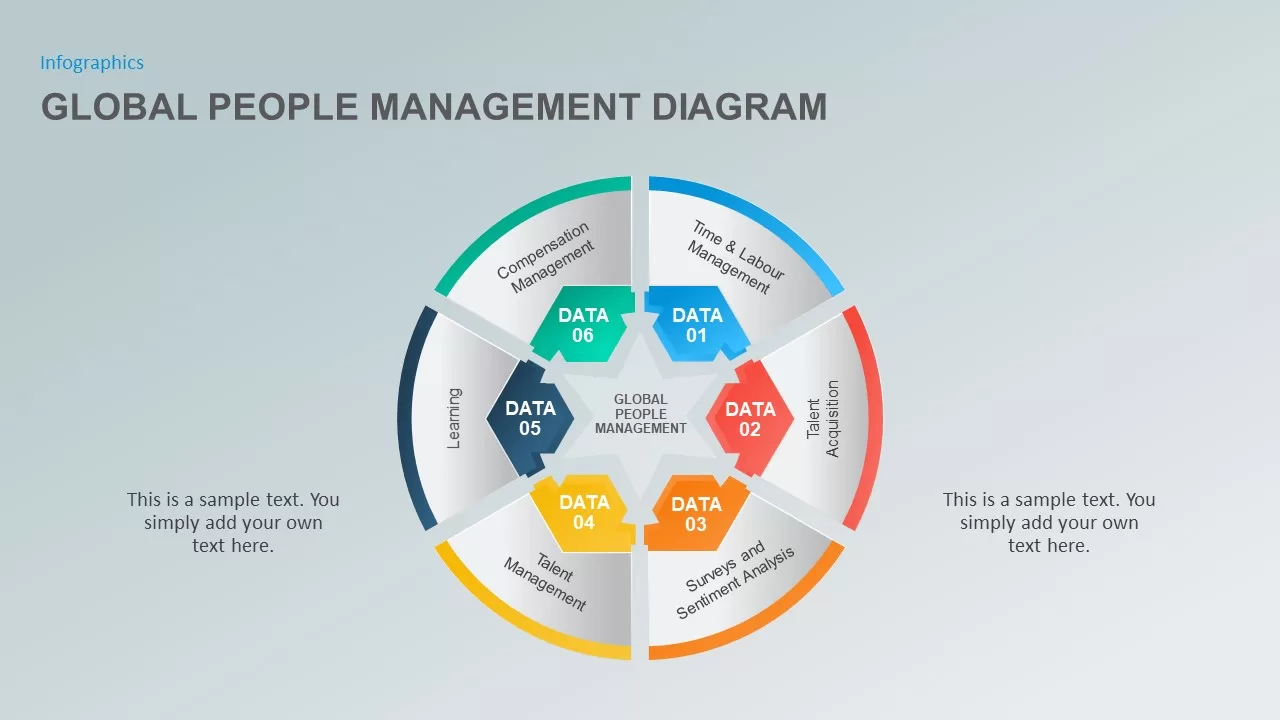
The Global People Management Diagram for PowerPoint & Google Slides
Business Models
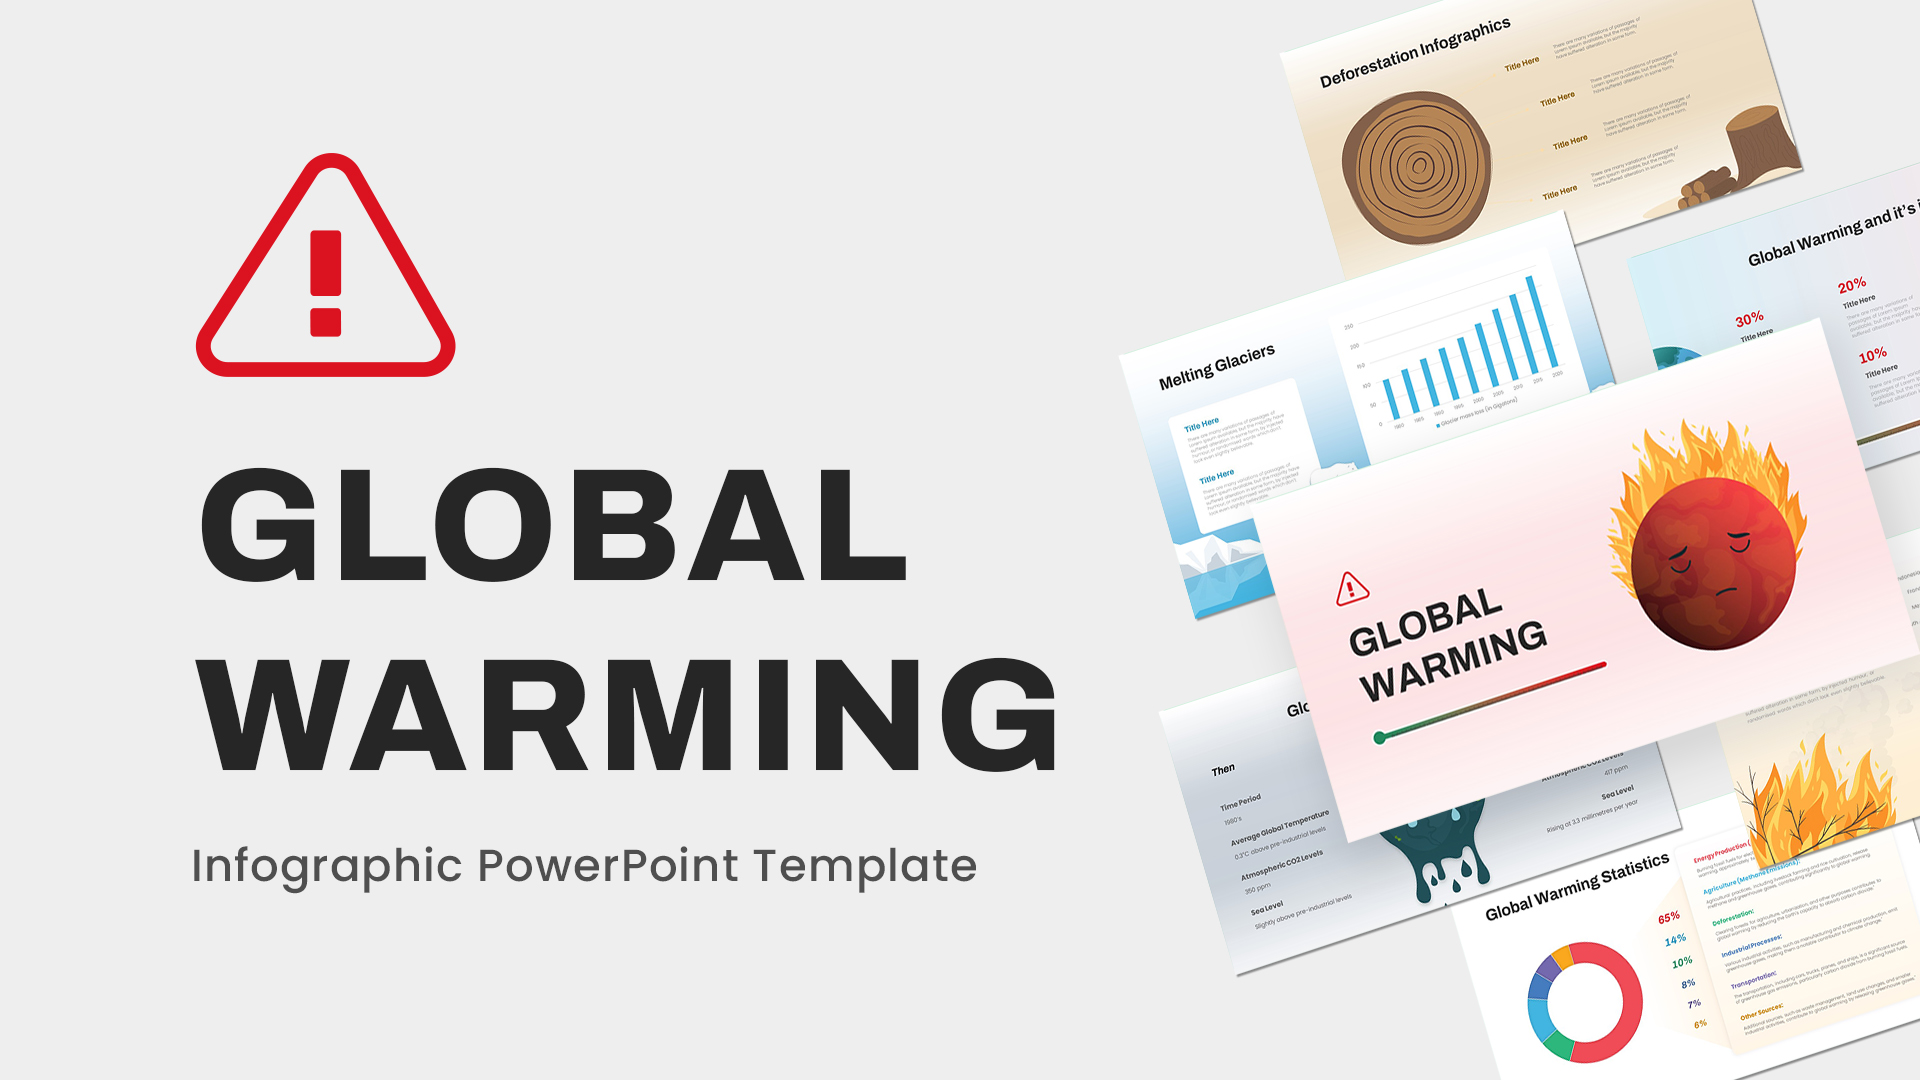
Global Warming Infographic for PowerPoint & Google Slides
Infographics
Business Case Deck with Market Analysis Template for PowerPoint & Google Slides
Business Report
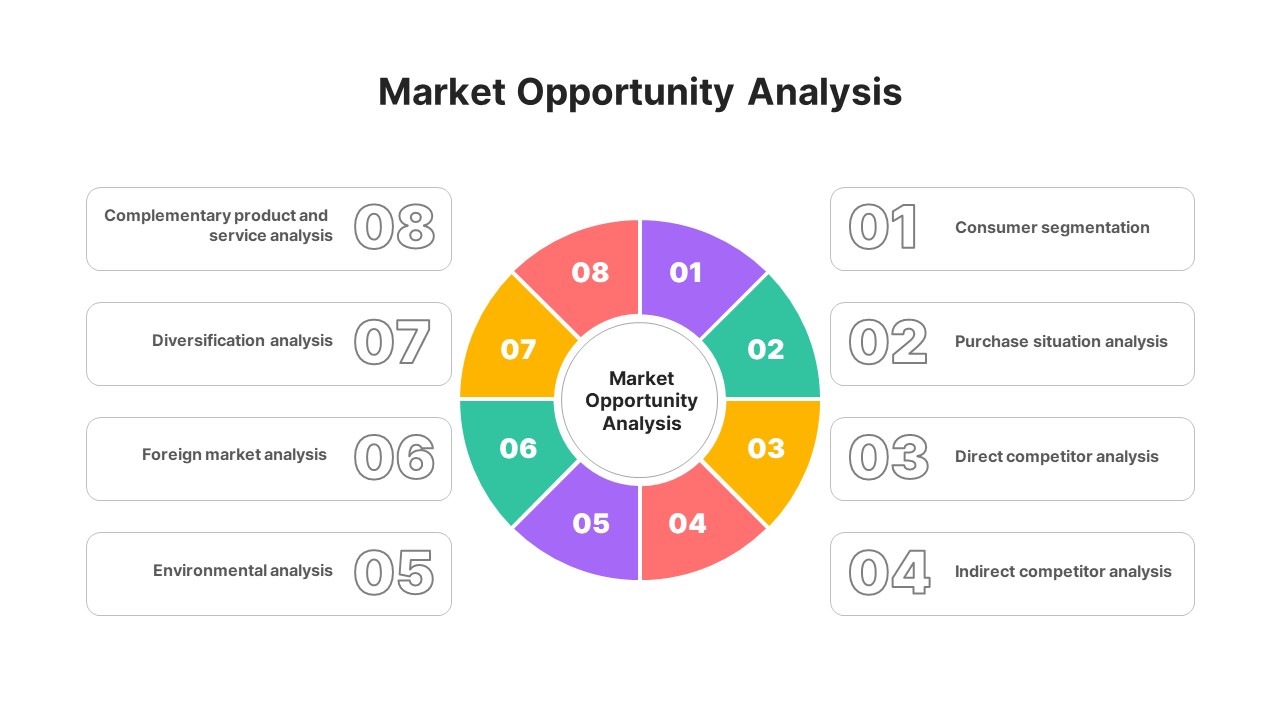
Market Opportunity Analysis Wheel template for PowerPoint & Google Slides
Business Strategy
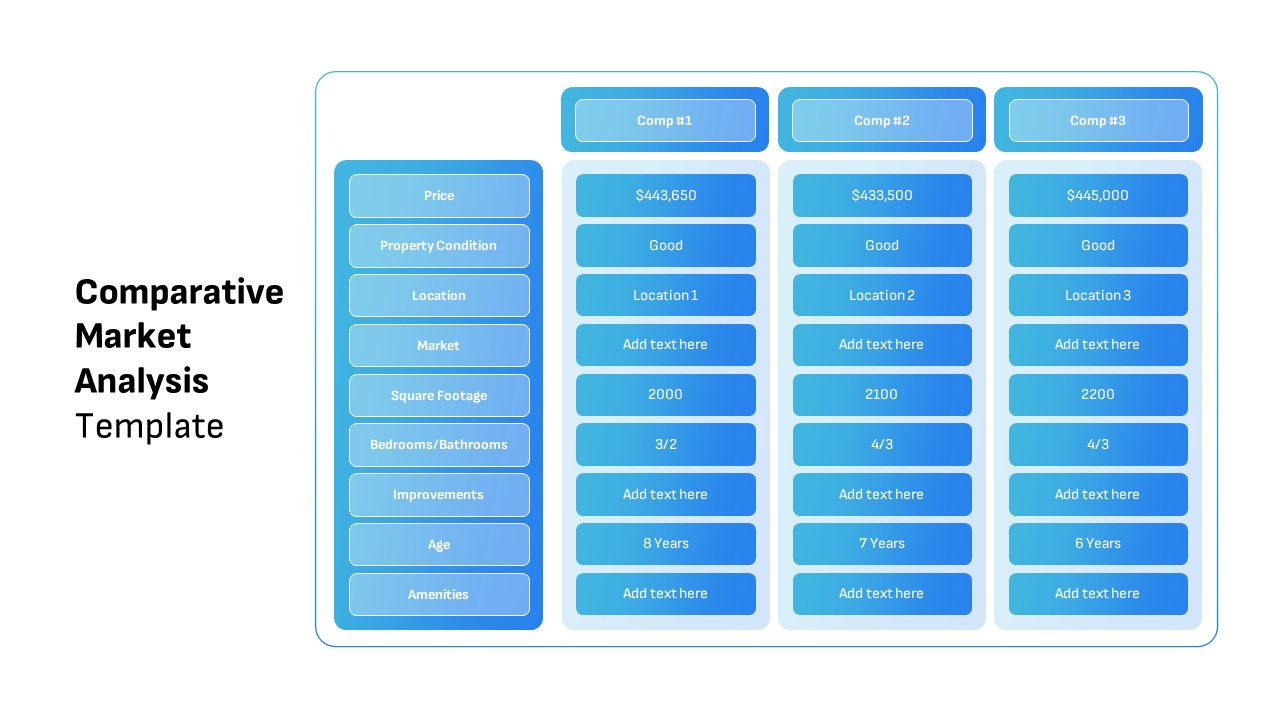
Comparative Market Analysis Template for PowerPoint & Google Slides
Comparison
Neon Dark Stock Market Analysis Template for PowerPoint & Google Slides
Pitch Deck
Free
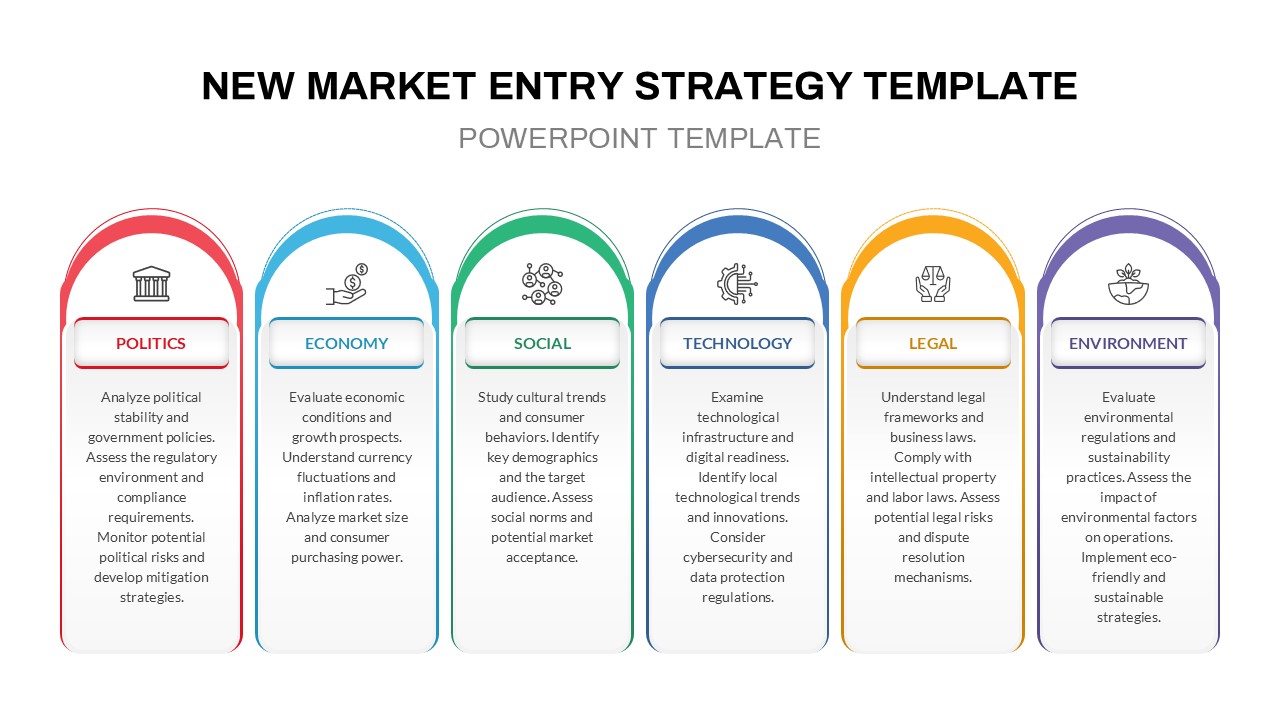
PESTLE Analysis for Market Entry Template for PowerPoint & Google Slides
PEST
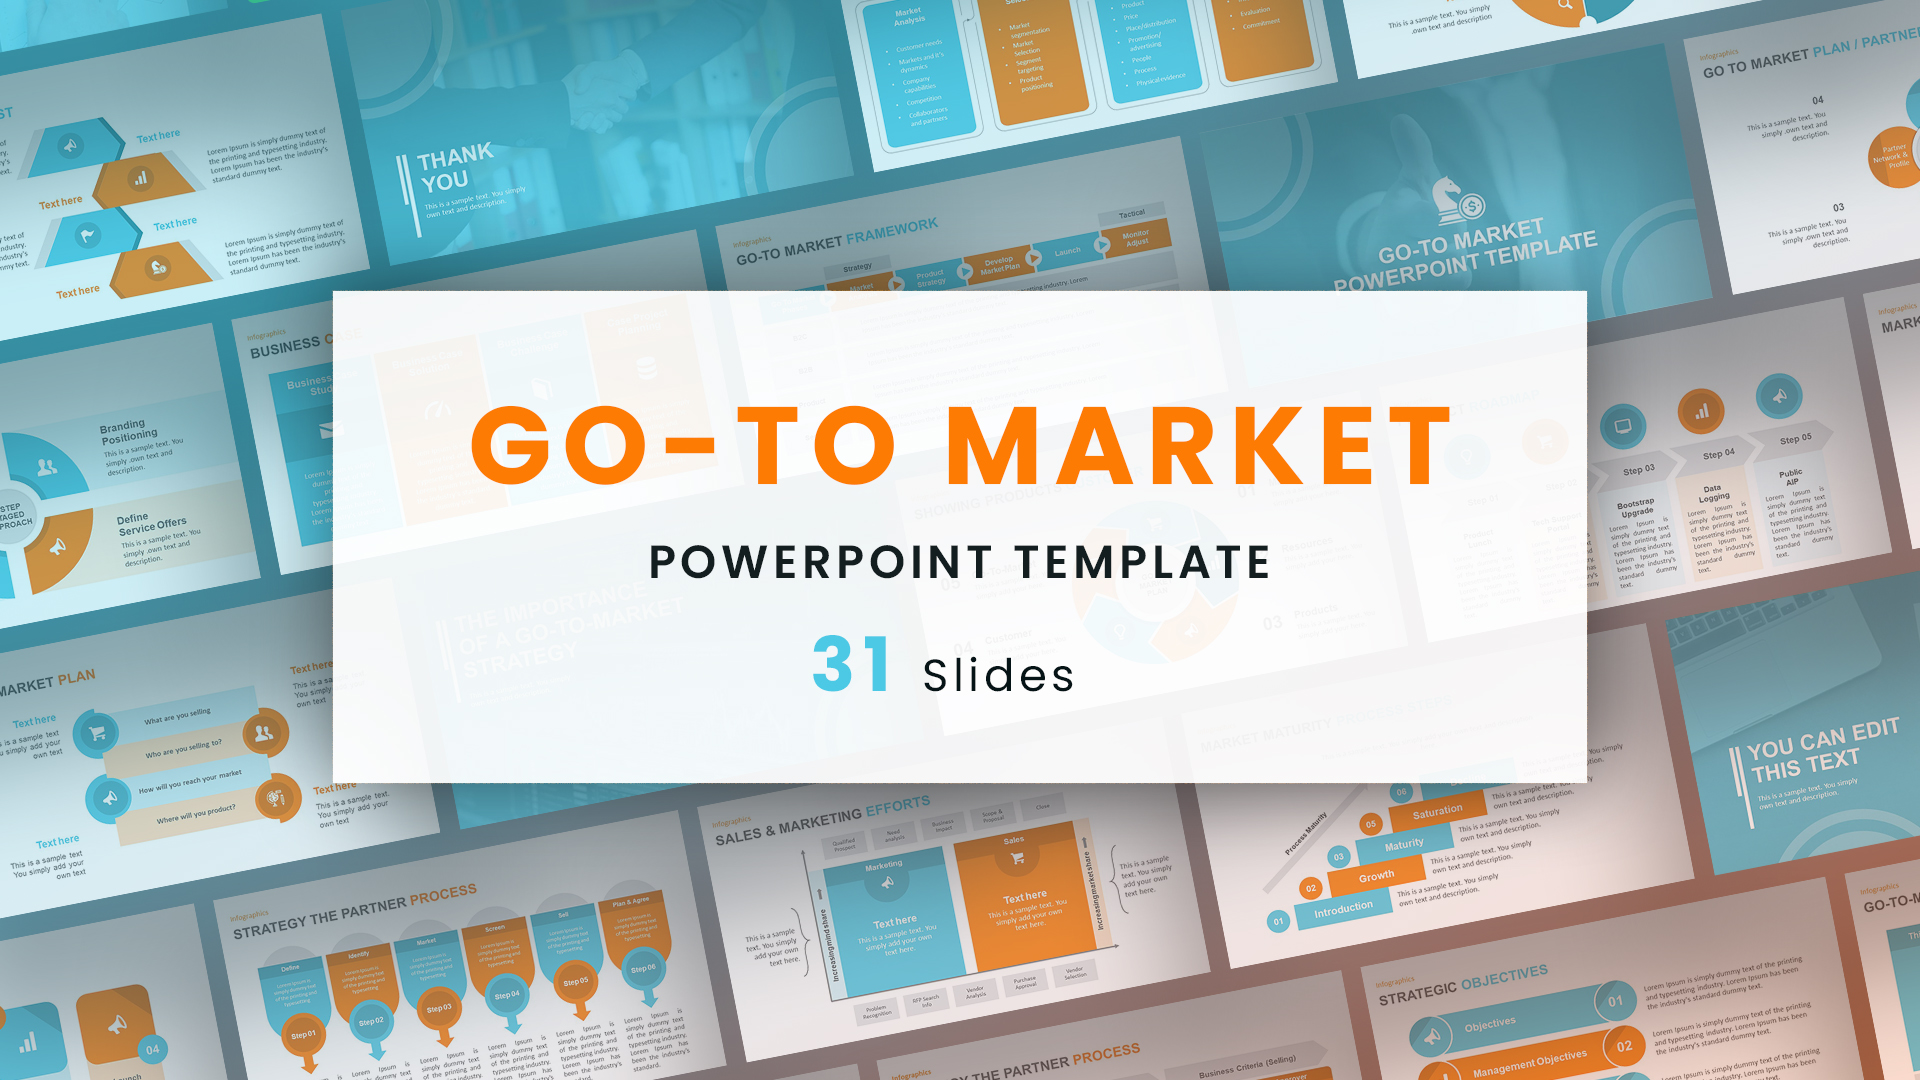
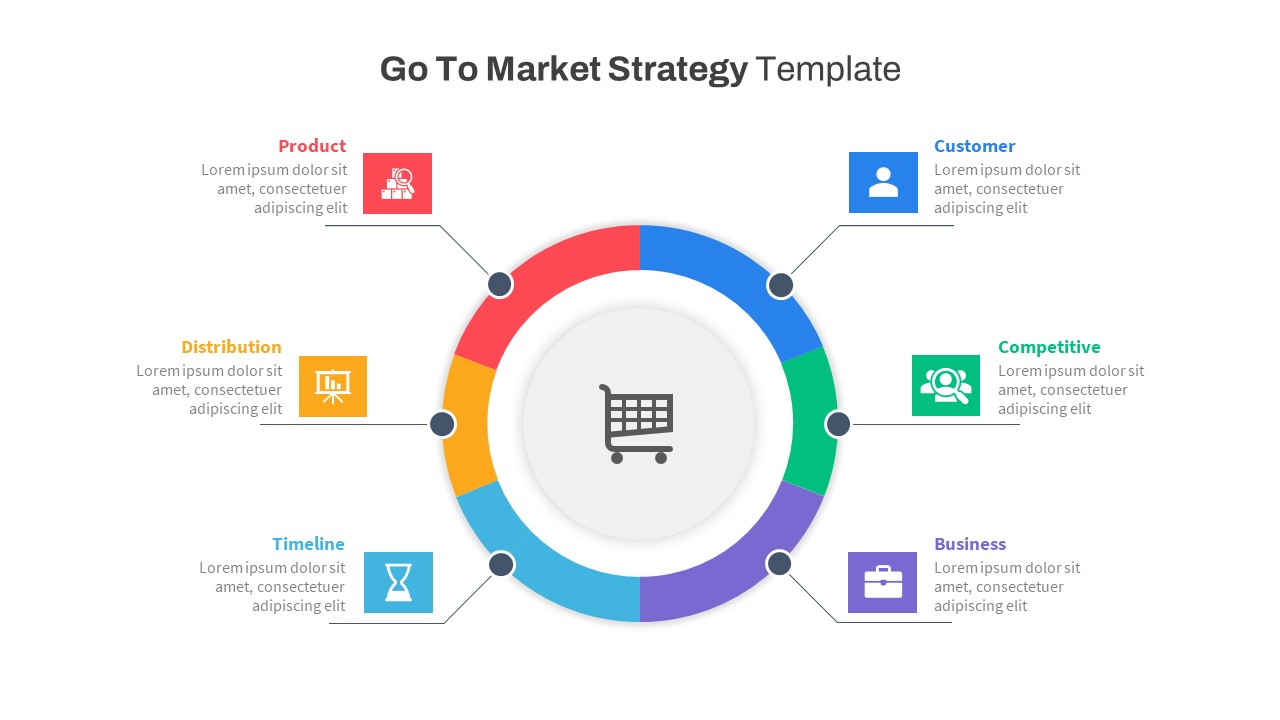
Go-to-Market Strategy PowerPoint Template for PowerPoint & Google Slides
Marketing
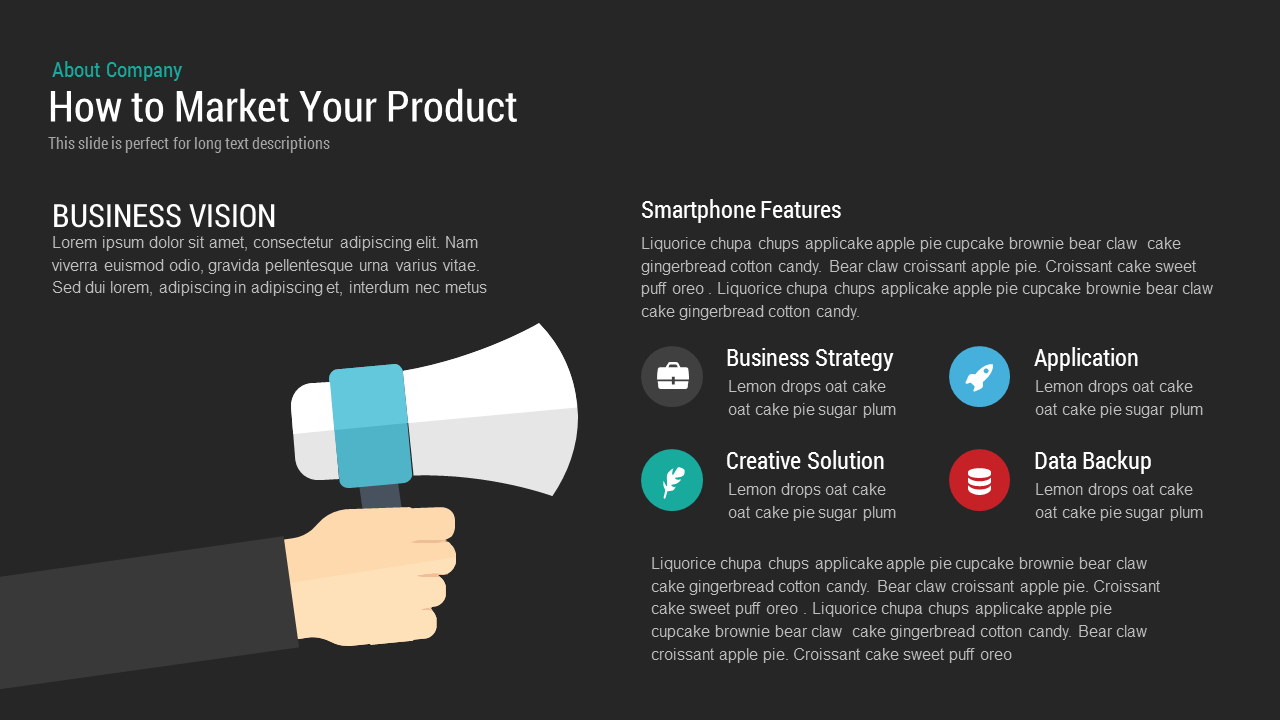
How to Market Your Product template for PowerPoint & Google Slides
Business Strategy
Free
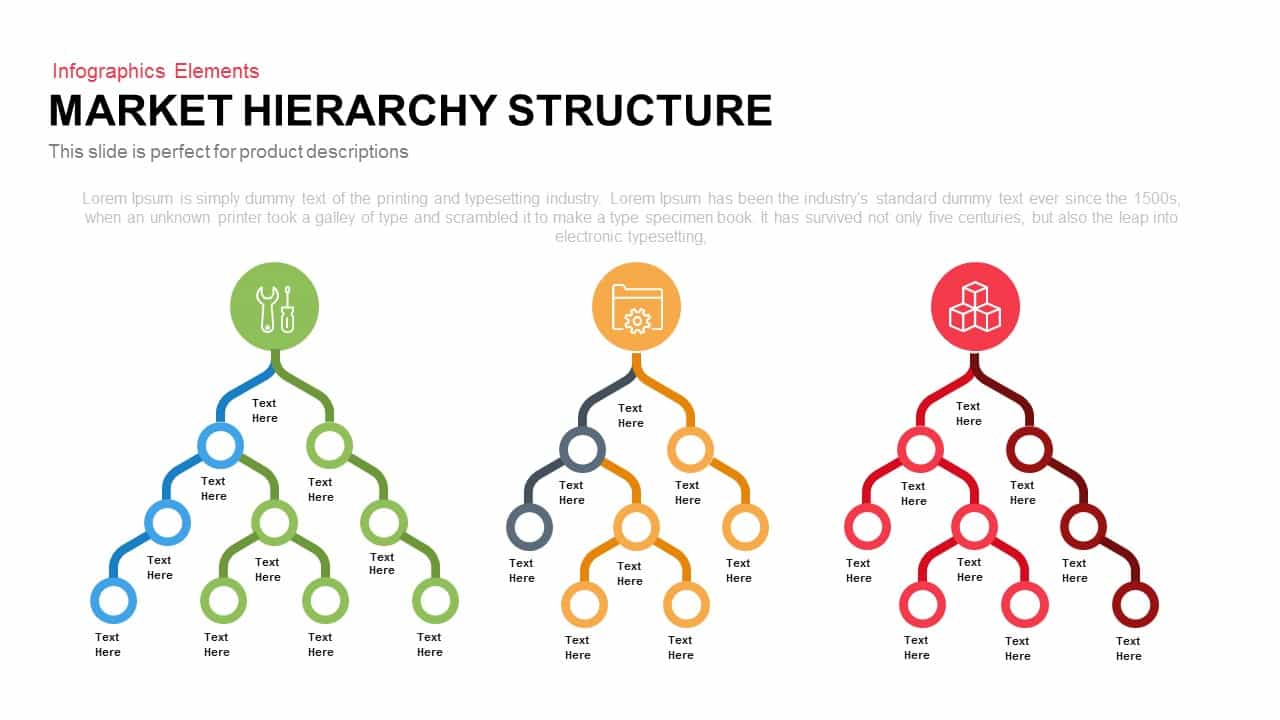
Market Hierarchy Structure Infographic template for PowerPoint & Google Slides
Org Chart
Market Development Matrix Chart Template for PowerPoint & Google Slides
Comparison Chart
Social Media Market Share Pie Charts Template for PowerPoint & Google Slides
Pie/Donut
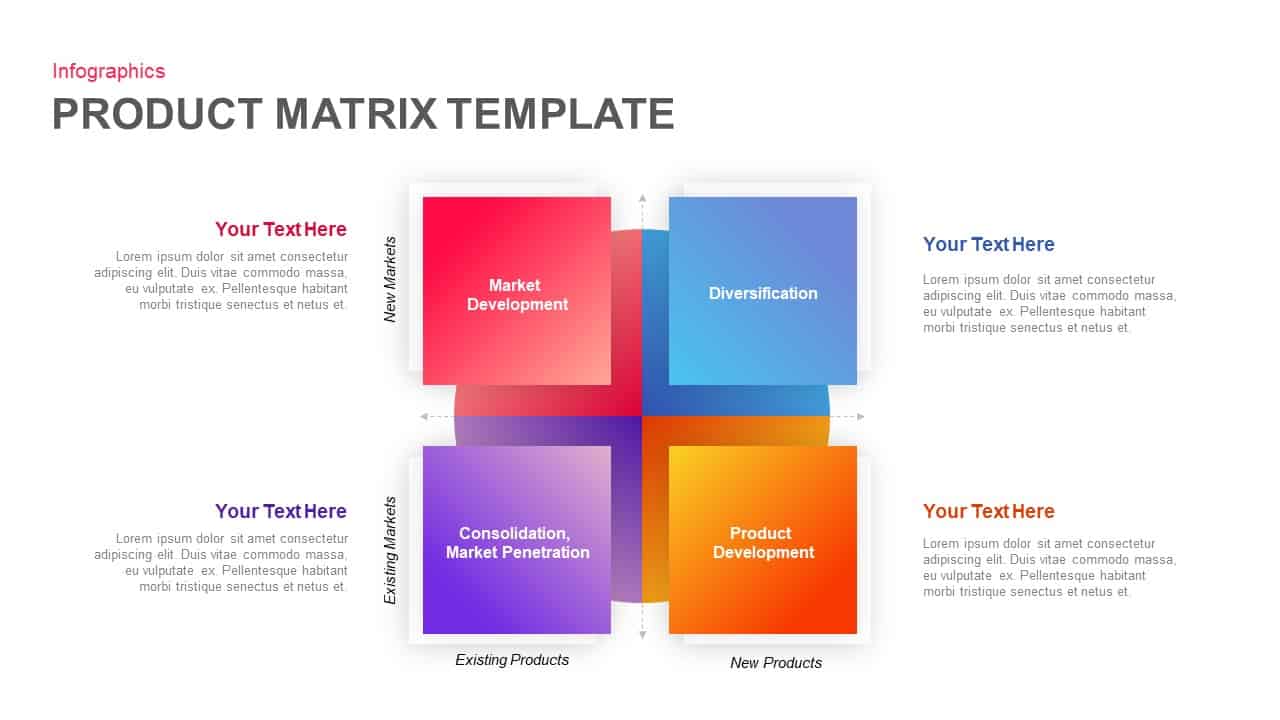
Product Market Expansion Matrix Template for PowerPoint & Google Slides
Business
Car Sales Market Share Pie Chart Template for PowerPoint & Google Slides
BCG
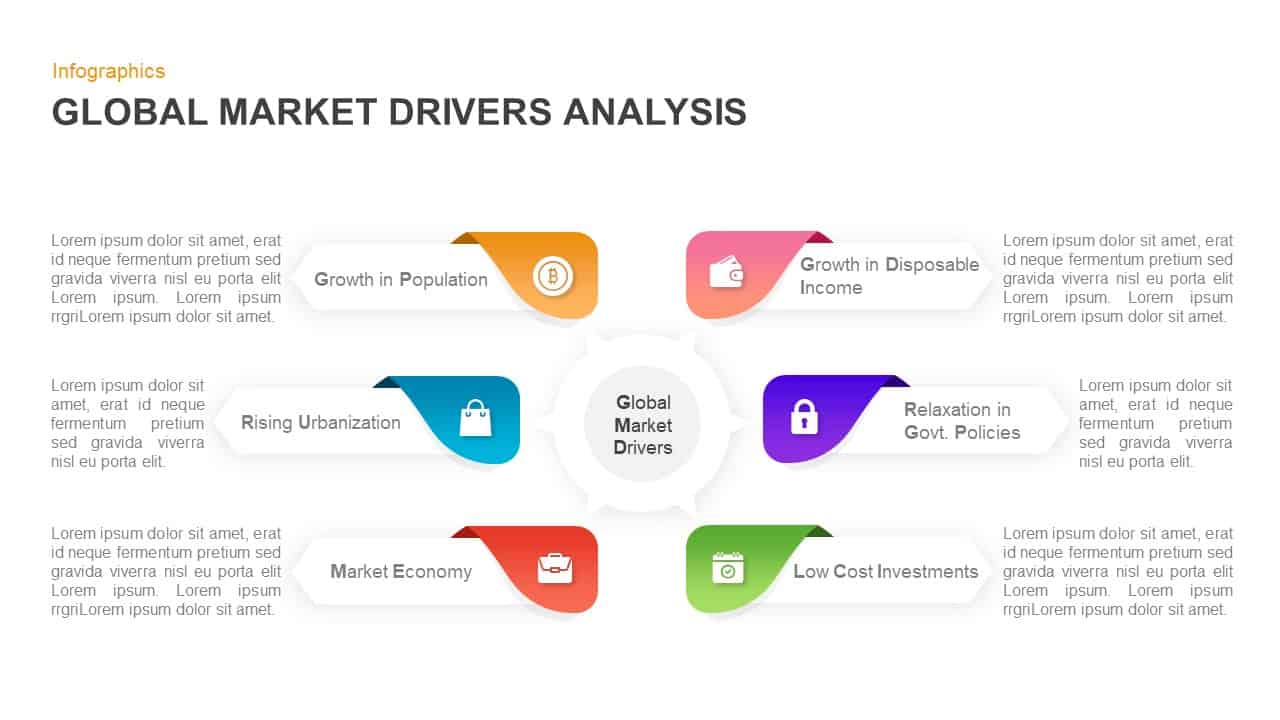
Circular Market Drivers Infographic Template for PowerPoint & Google Slides
Circular

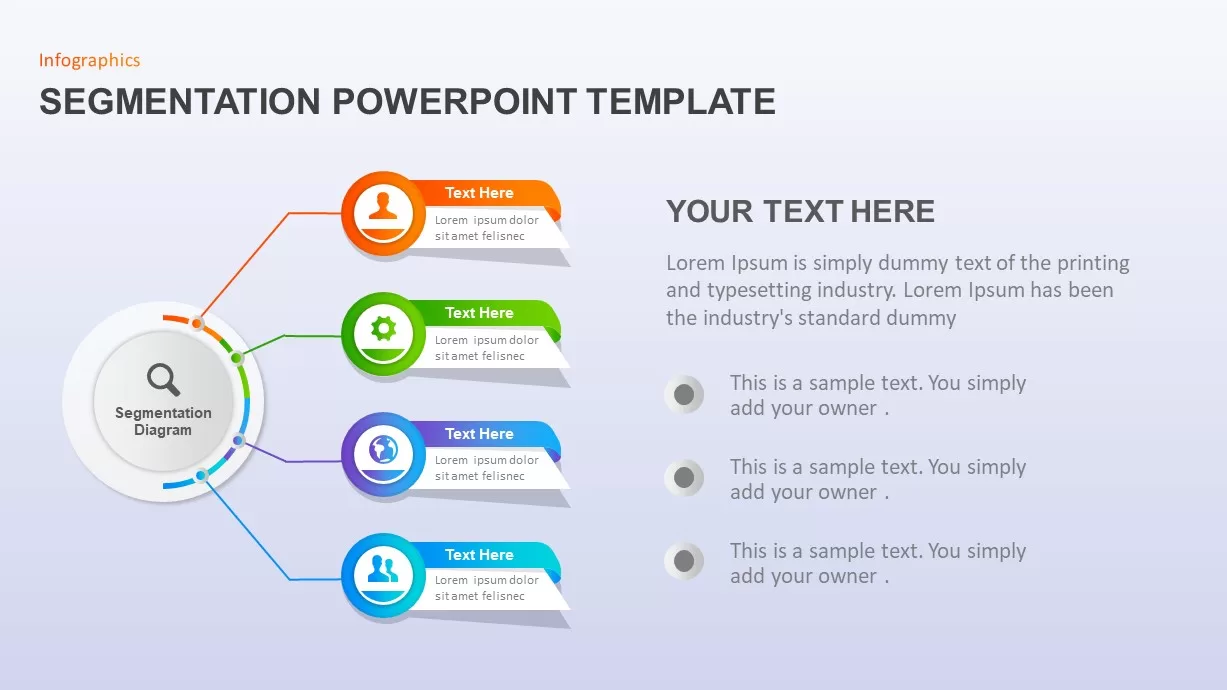
Market Segmentation & STP Infographics Pack Template for PowerPoint & Google Slides
Marketing
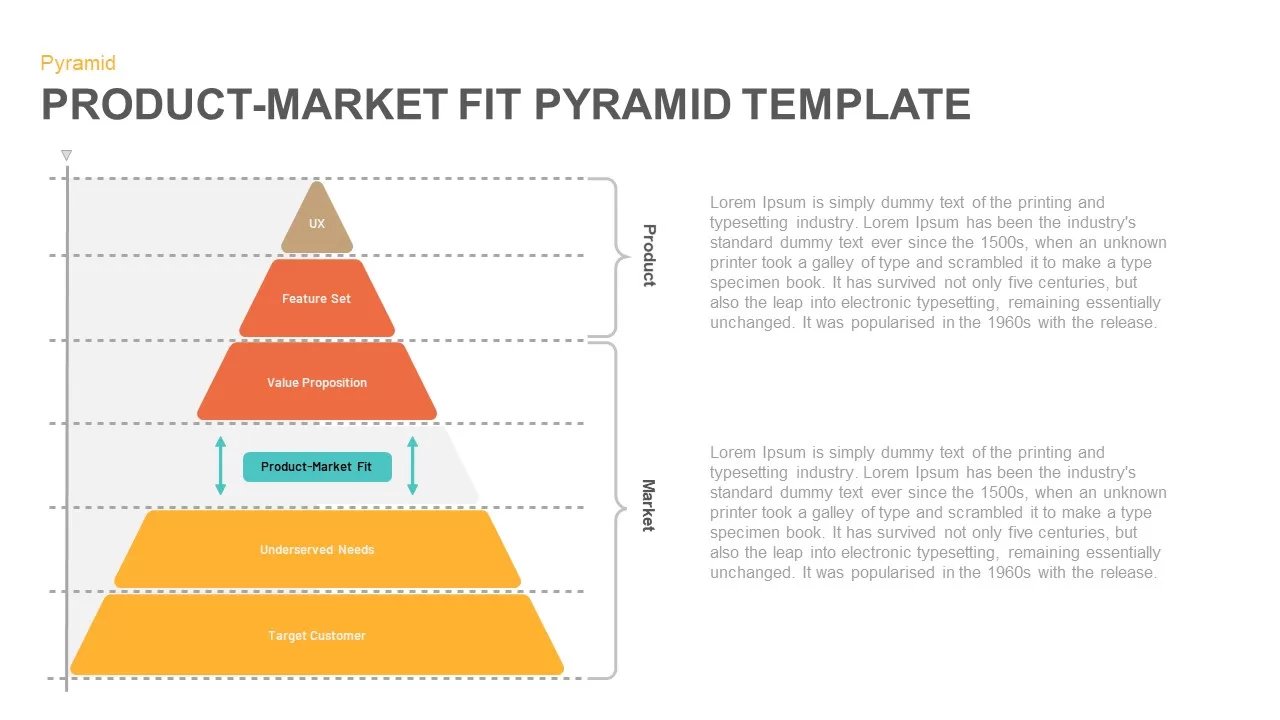
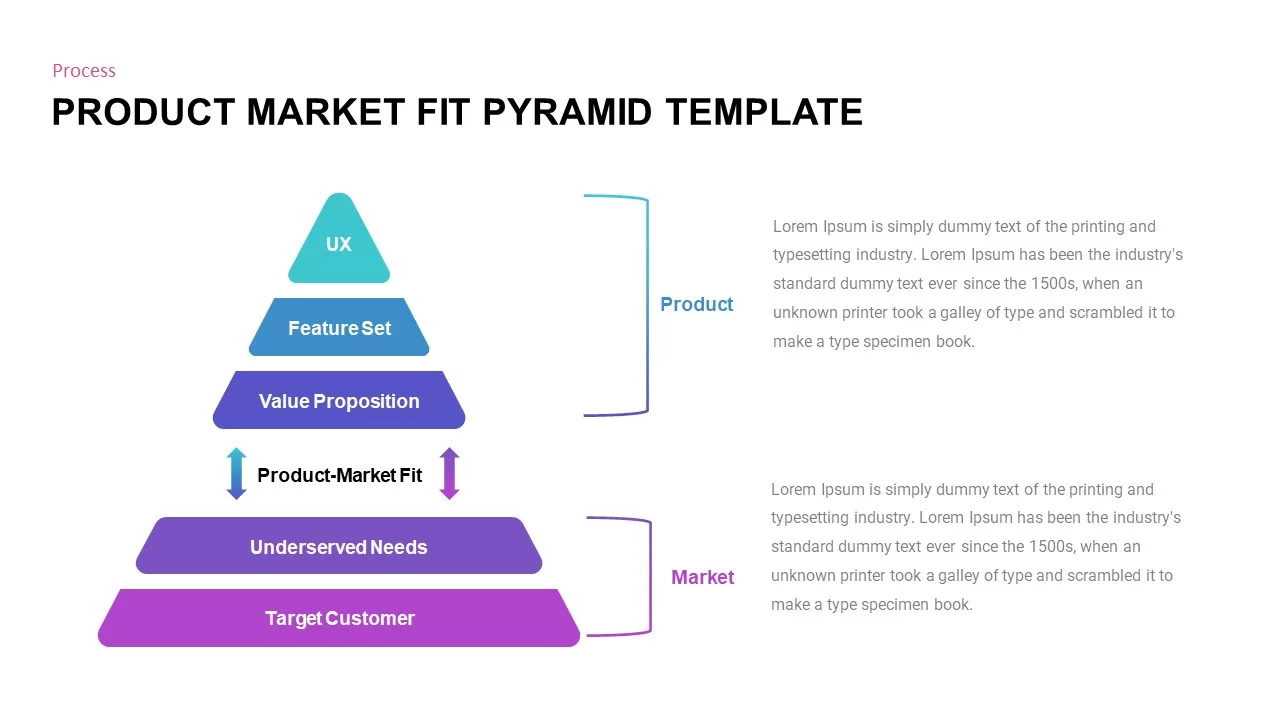
Product-Market Fit Pyramid template for PowerPoint & Google Slides
Pyramid
Professional Product Market Fit Pyramid Template for PowerPoint & Google Slides
Pyramid
Business Review Deck with Market Updates Template for PowerPoint & Google Slides
Company Profile
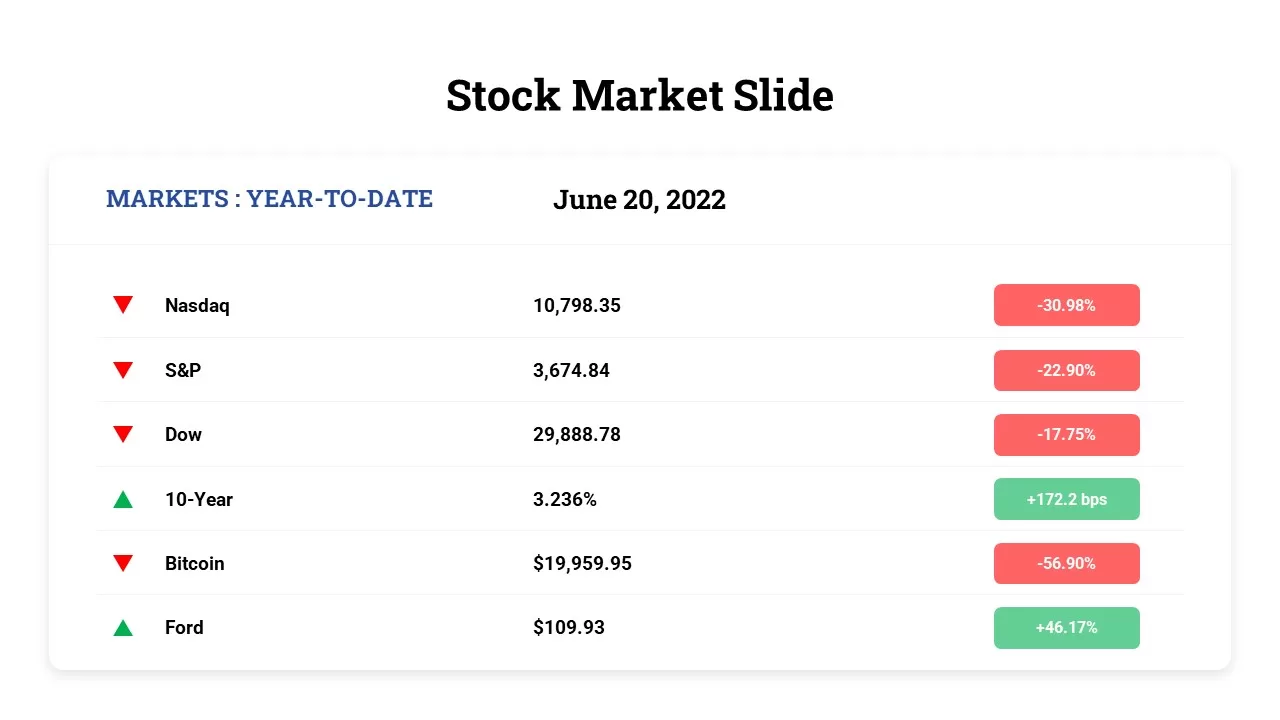
Free Stock Market Performance Overview template for PowerPoint & Google Slides
Finance
Free
Bull and Bear Stock Market Dashboard Template for PowerPoint & Google Slides
Infographics
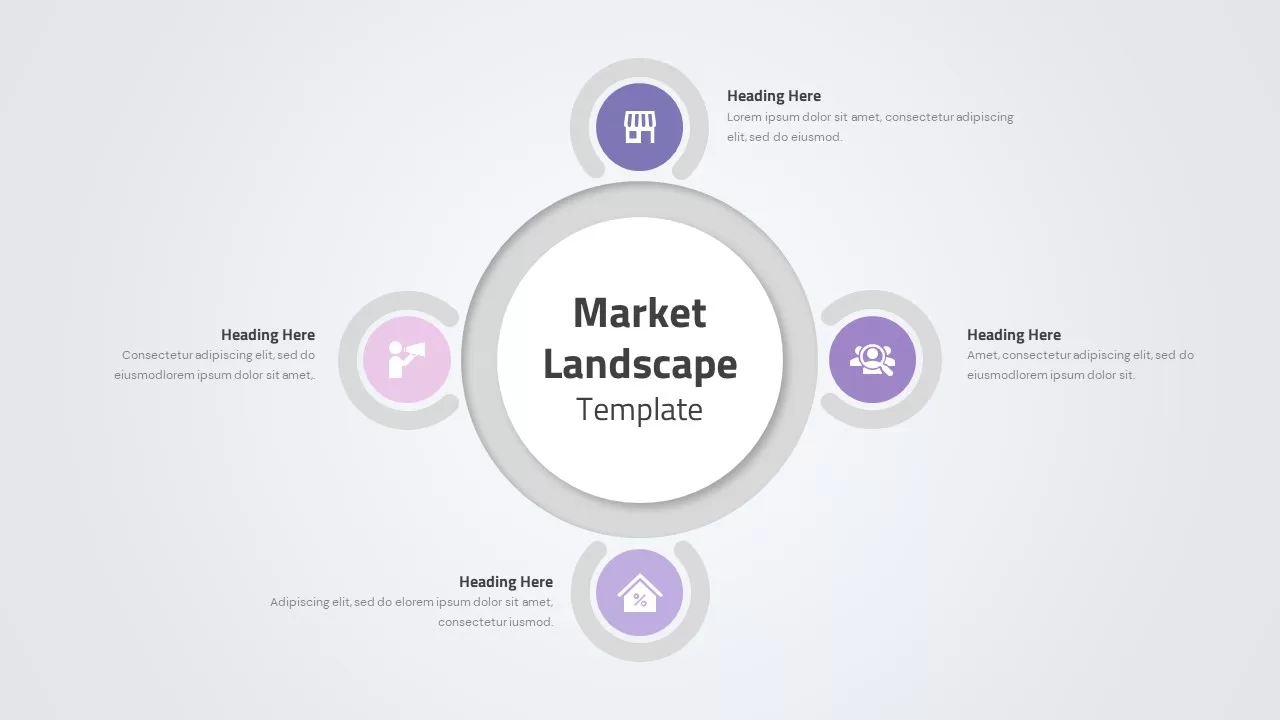
Market Landscape Hub and Spoke Diagram Template for PowerPoint & Google Slides
Infographics
Circular Go To Market Strategy Template for PowerPoint & Google Slides
Business Strategy
Free
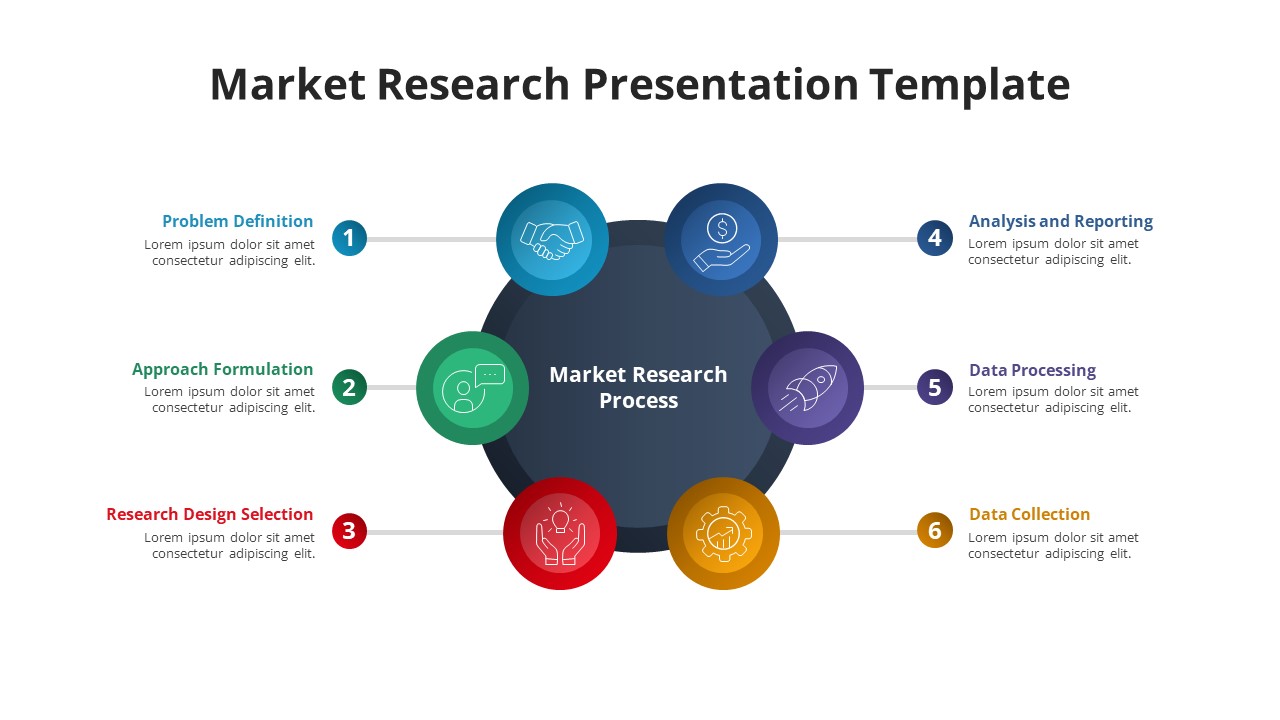
Free Six-Phase Market Research Process Template for PowerPoint & Google Slides
Process
Free
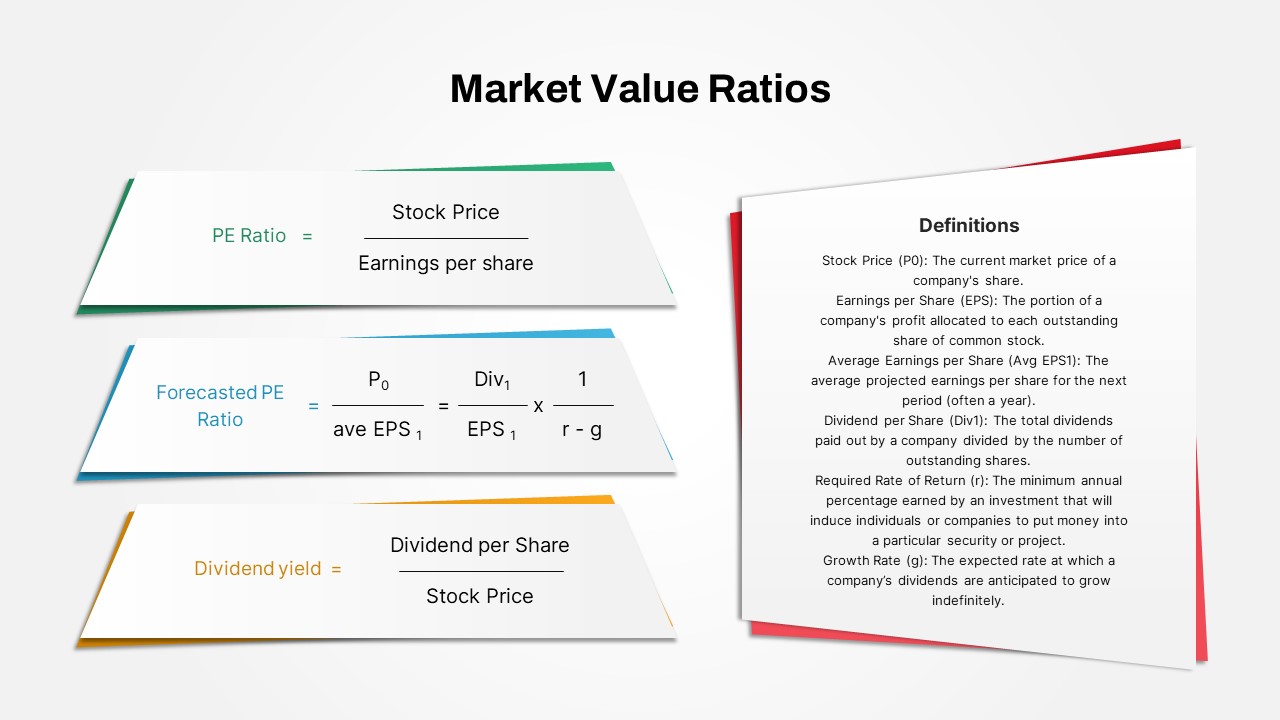
Market Value Ratios Formula Overview Template for PowerPoint & Google Slides
Business Report
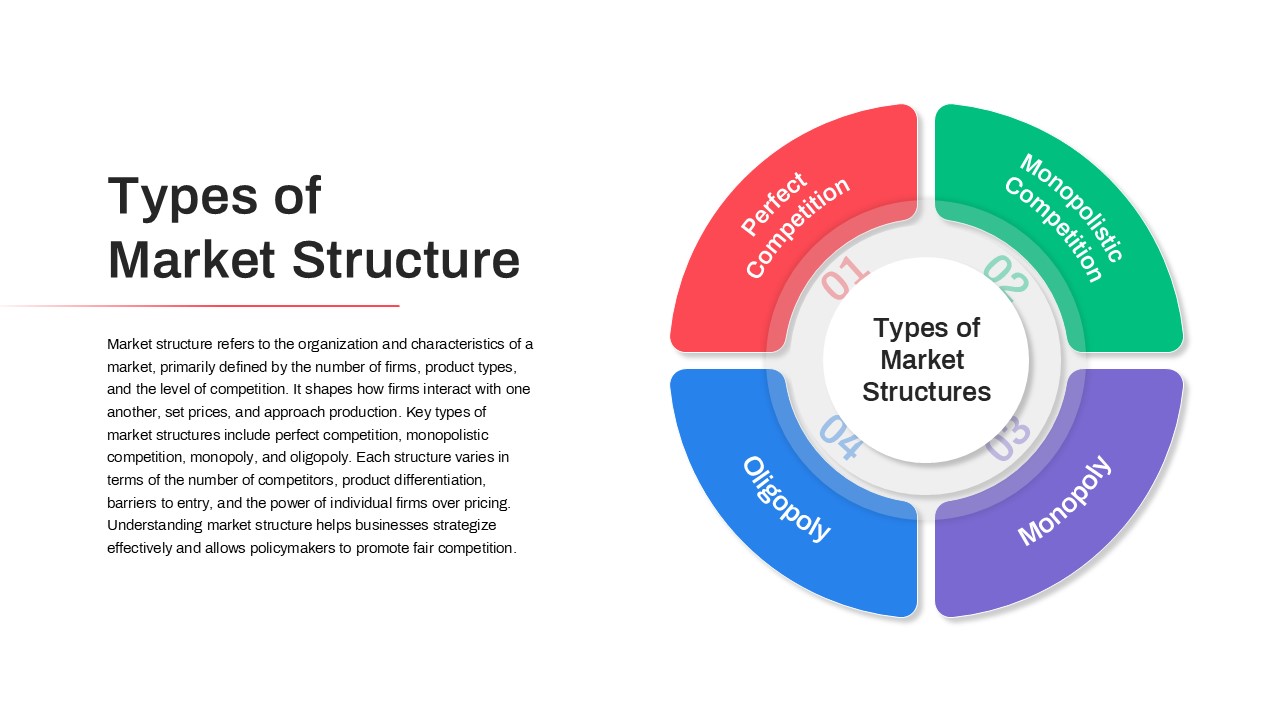
Types of Market Structure Infographic Template for PowerPoint & Google Slides
Comparison
Market Validation Metrics Overview Template for PowerPoint & Google Slides
Business
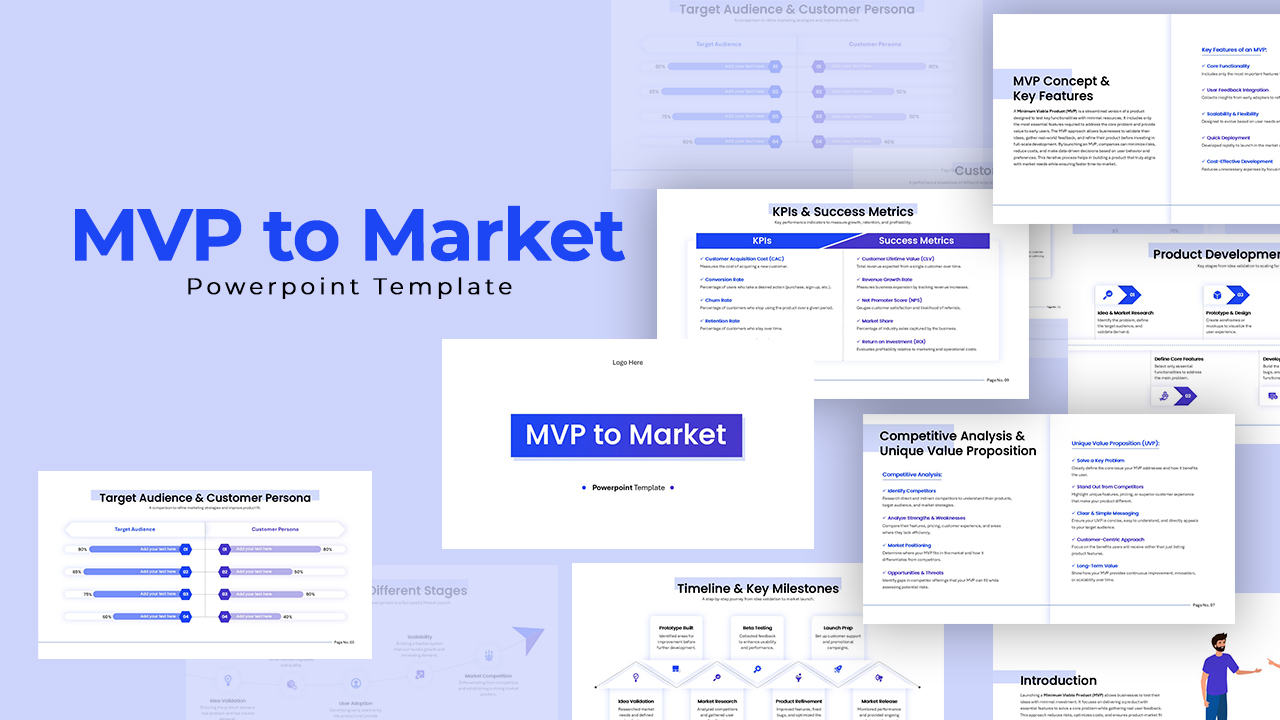
MVP to Market Strategy Pitch Deck Template for PowerPoint & Google Slides
Pitch Deck
Market Share Comparison Diagram Template for PowerPoint & Google Slides
Comparison Chart
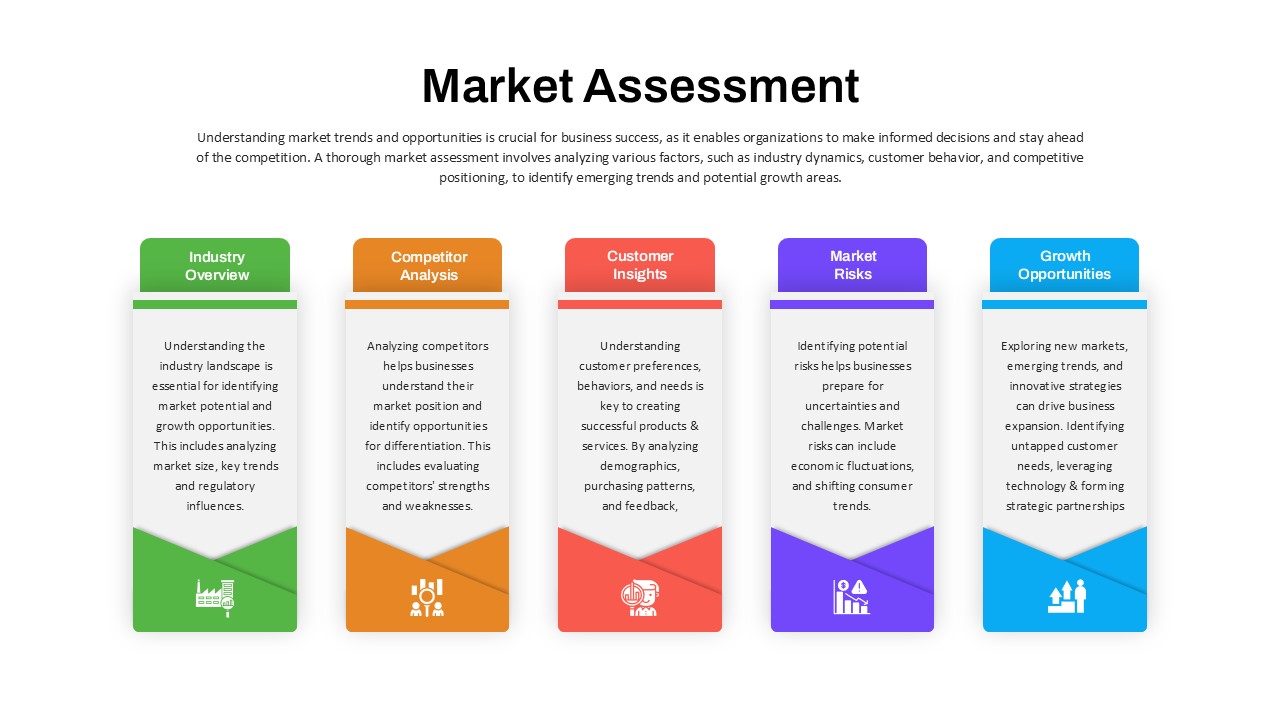
Market Assessment Infographic Slide Template for PowerPoint & Google Slides
Process
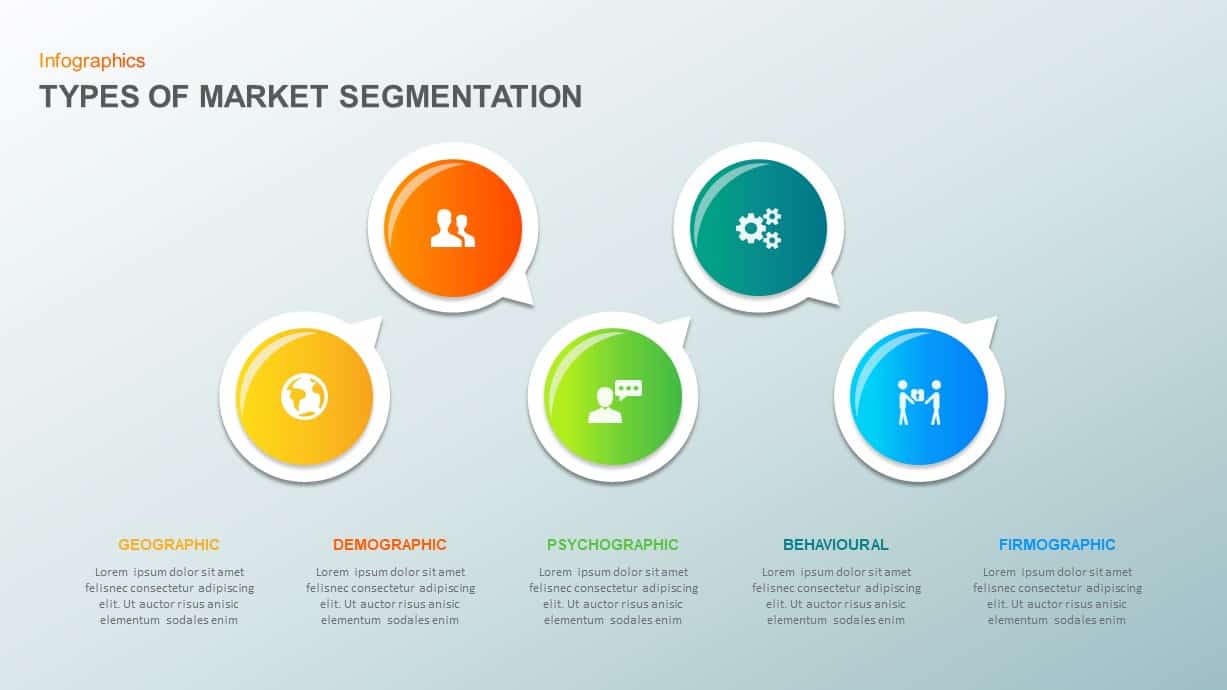
5 Types of Market Segmentation PowerPoint Template
Marketing
PEST Analysis PowerPoint Template for PowerPoint & Google Slides
Business Strategy
Mobile Data Analysis Chart template for PowerPoint & Google Slides
Charts
Creative Data Analysis Bar Chart template for PowerPoint & Google Slides
Bar/Column
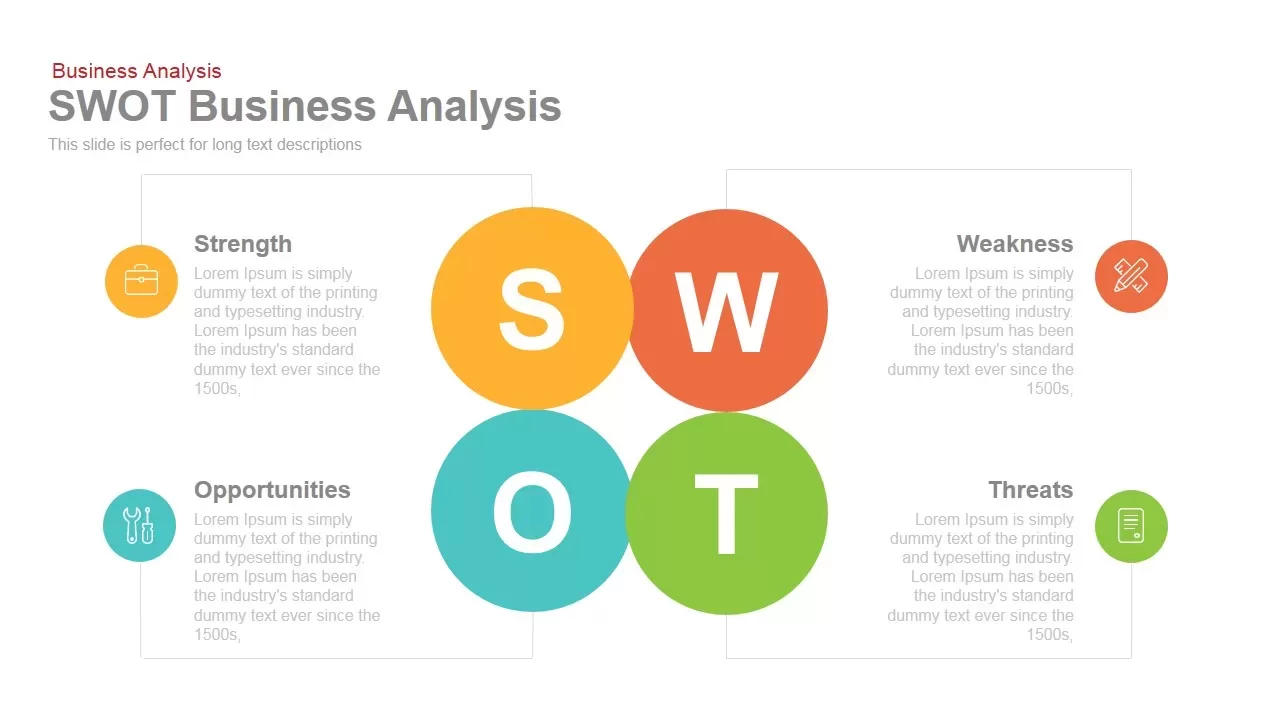
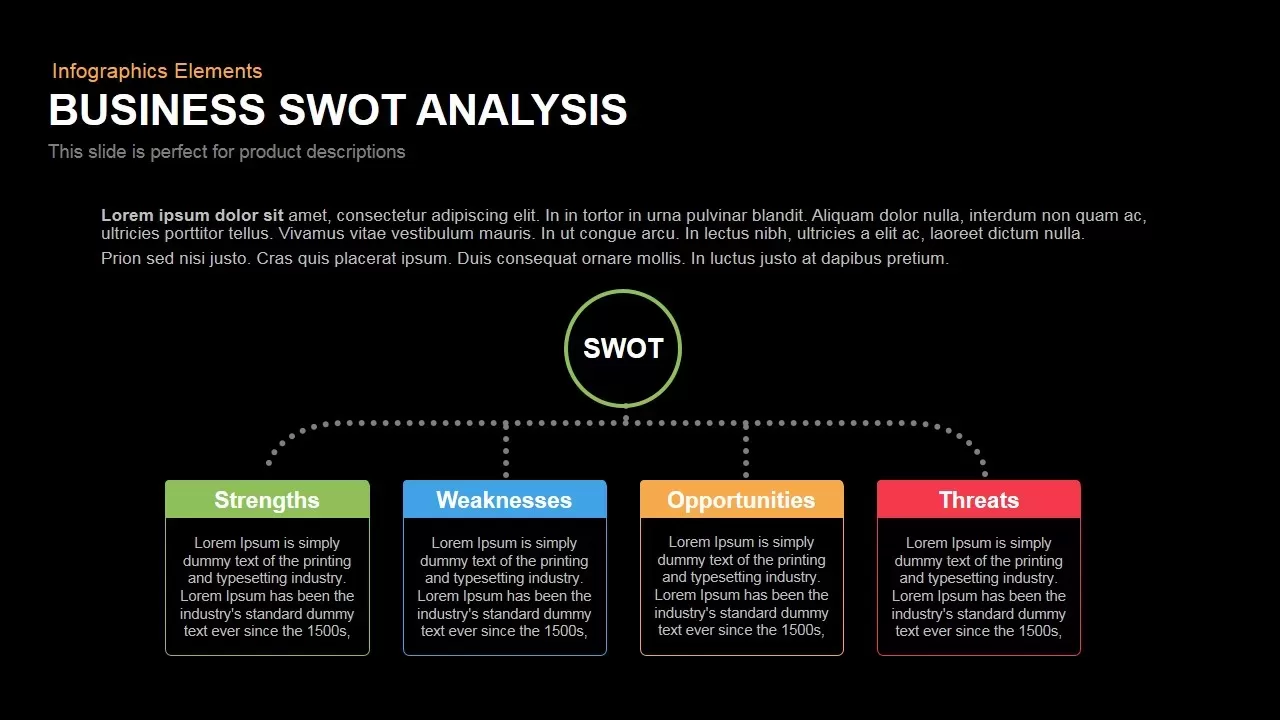
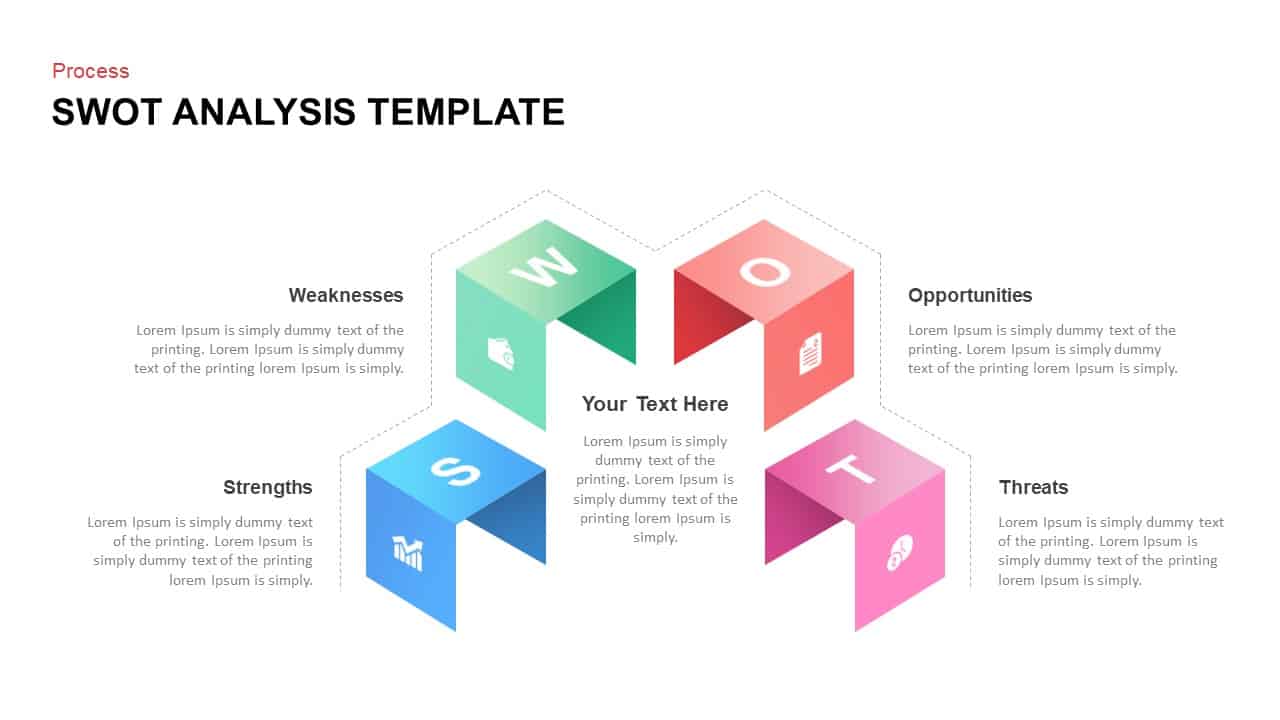
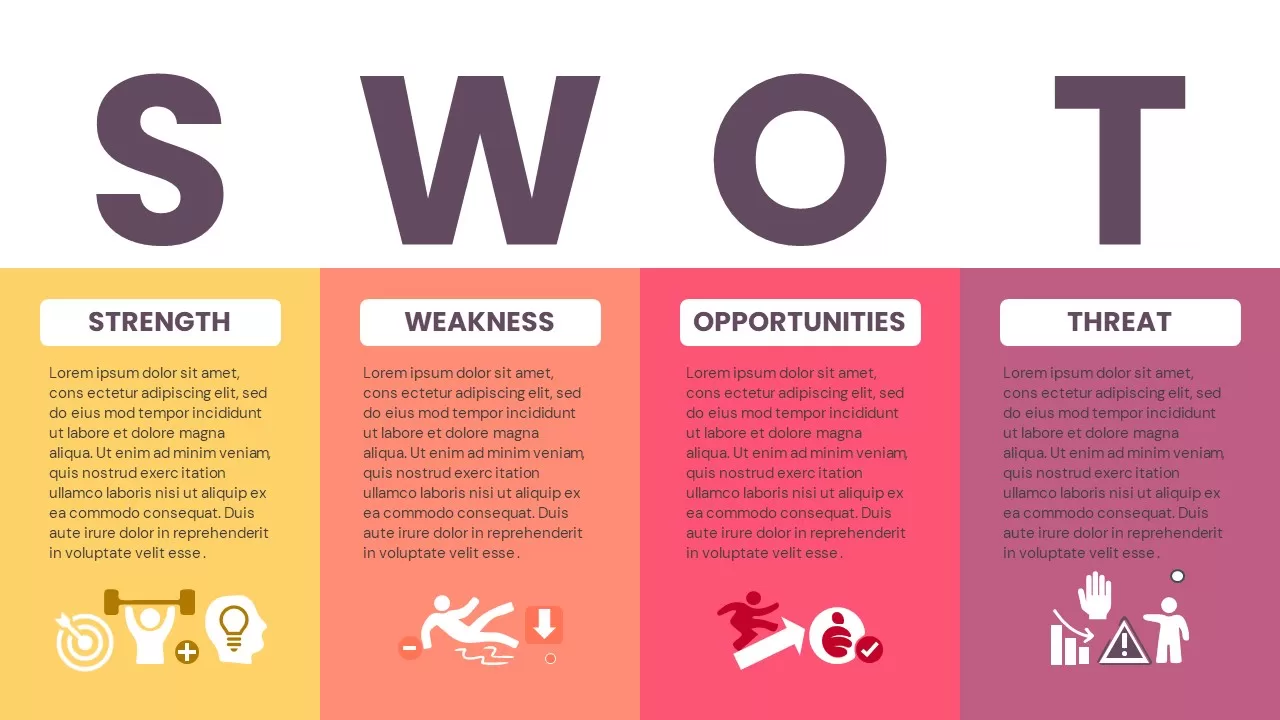
SWOT Business Analysis template for PowerPoint & Google Slides
SWOT
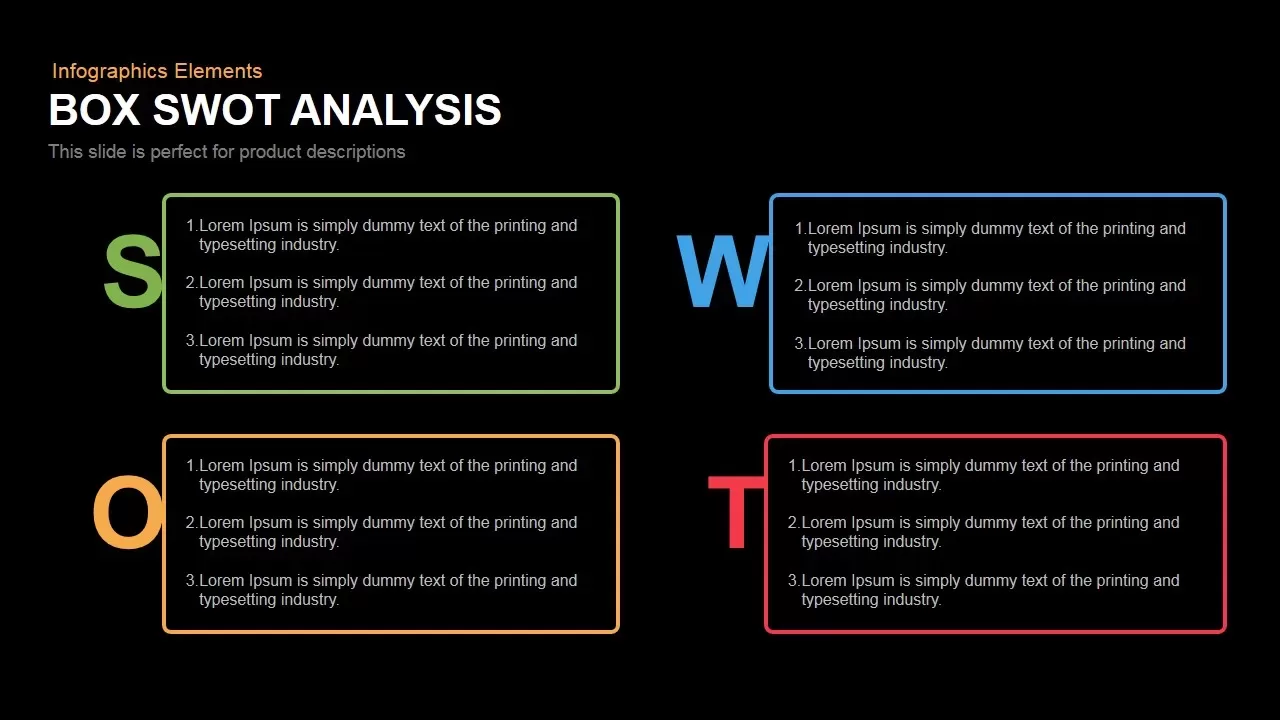
Box SWOT Analysis Infographic Template for PowerPoint & Google Slides
SWOT
Box Business SWOT Analysis Template for PowerPoint & Google Slides
SWOT
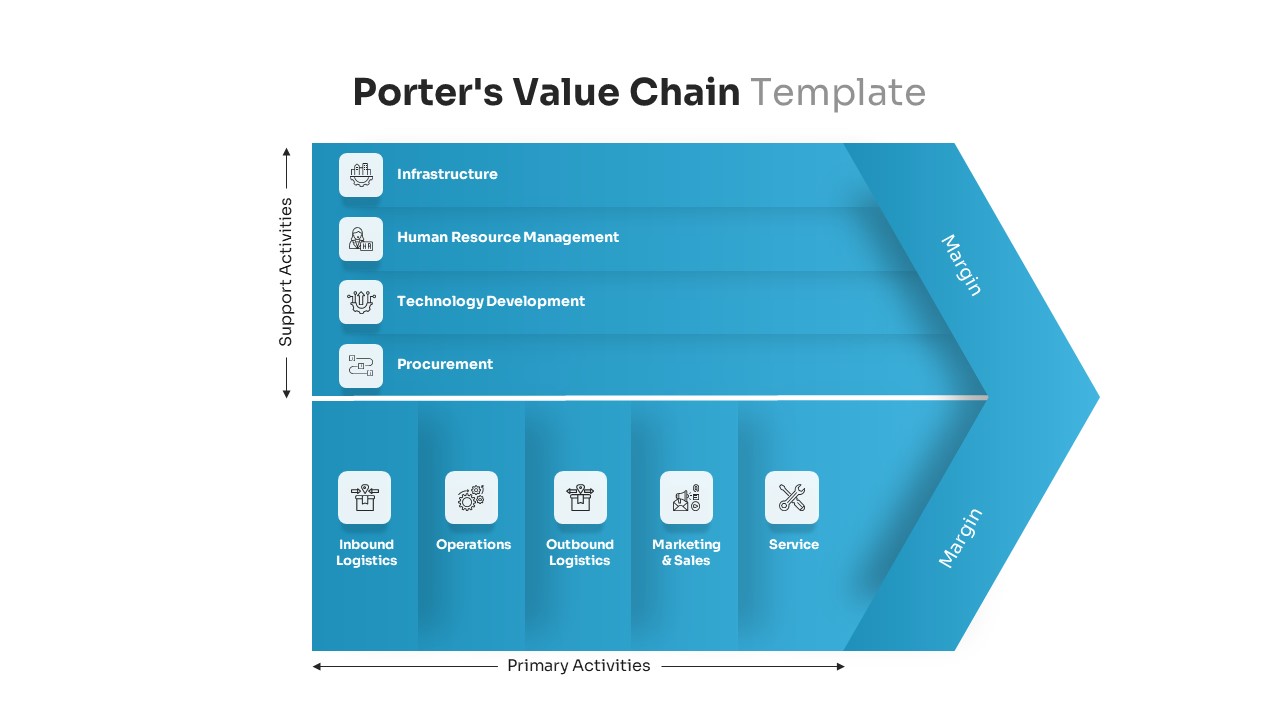
Porter’s Value Chain Analysis Diagram Template for PowerPoint & Google Slides
Business Strategy

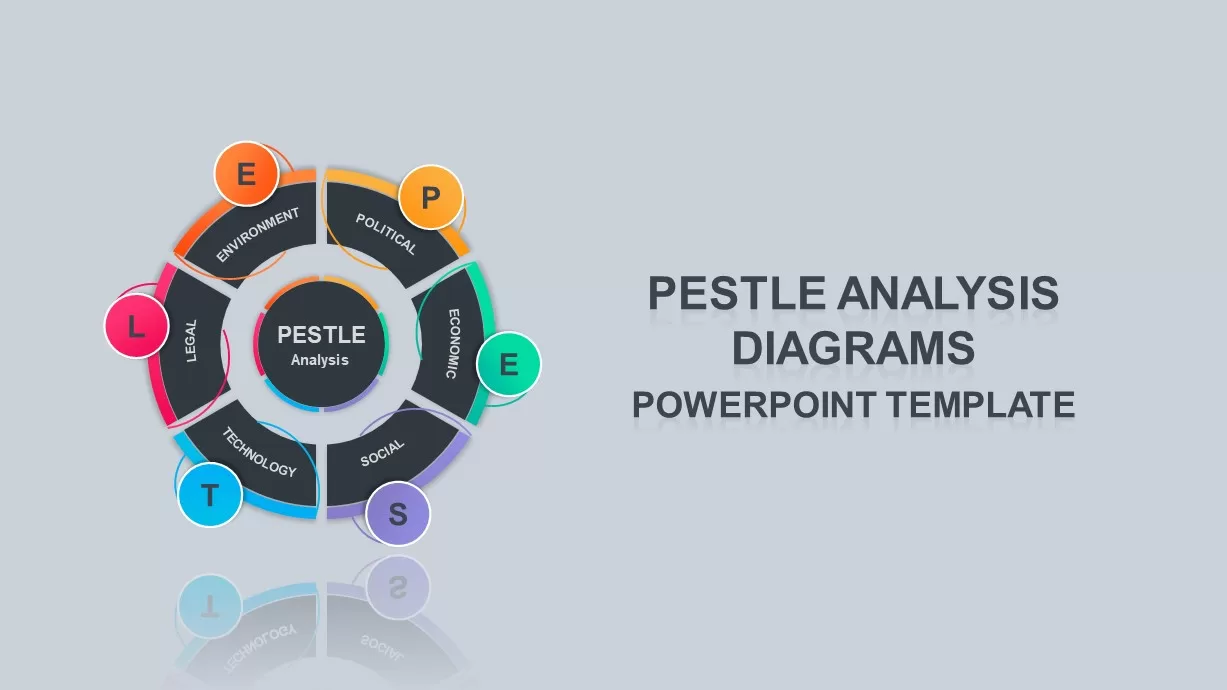
Professional PESTEL Analysis Diagram Template for PowerPoint & Google Slides
PEST
Fishbone Diagram Analysis Template for PowerPoint & Google Slides
Flow Charts
Employee Skill Analysis Dashboard Template for PowerPoint & Google Slides
Employee Performance
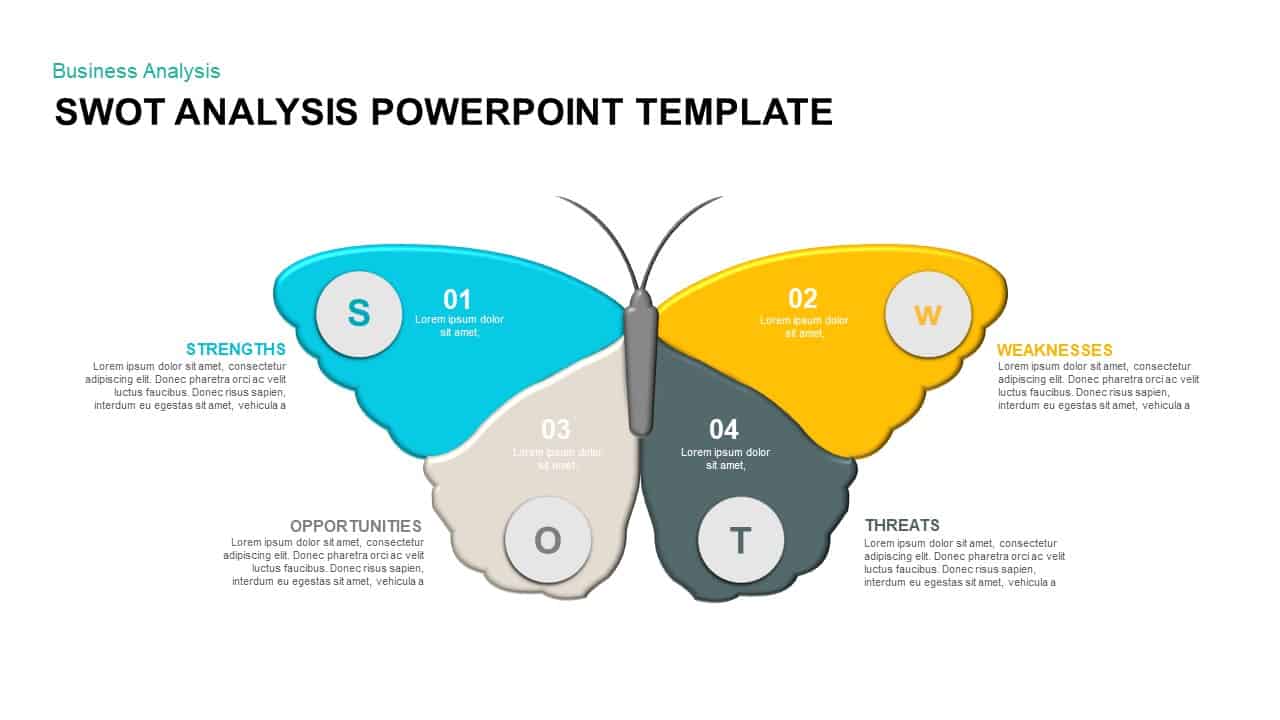
Butterfly SWOT Analysis Diagram Template for PowerPoint & Google Slides
SWOT
Versatile SWOT Analysis Slide Collection Template for PowerPoint & Google Slides
SWOT
3D Cube SWOT Analysis Infographic Template for PowerPoint & Google Slides
SWOT
PESTLE and PEST Strategic Analysis Diagrams Template for PowerPoint & Google Slides
Business Strategy
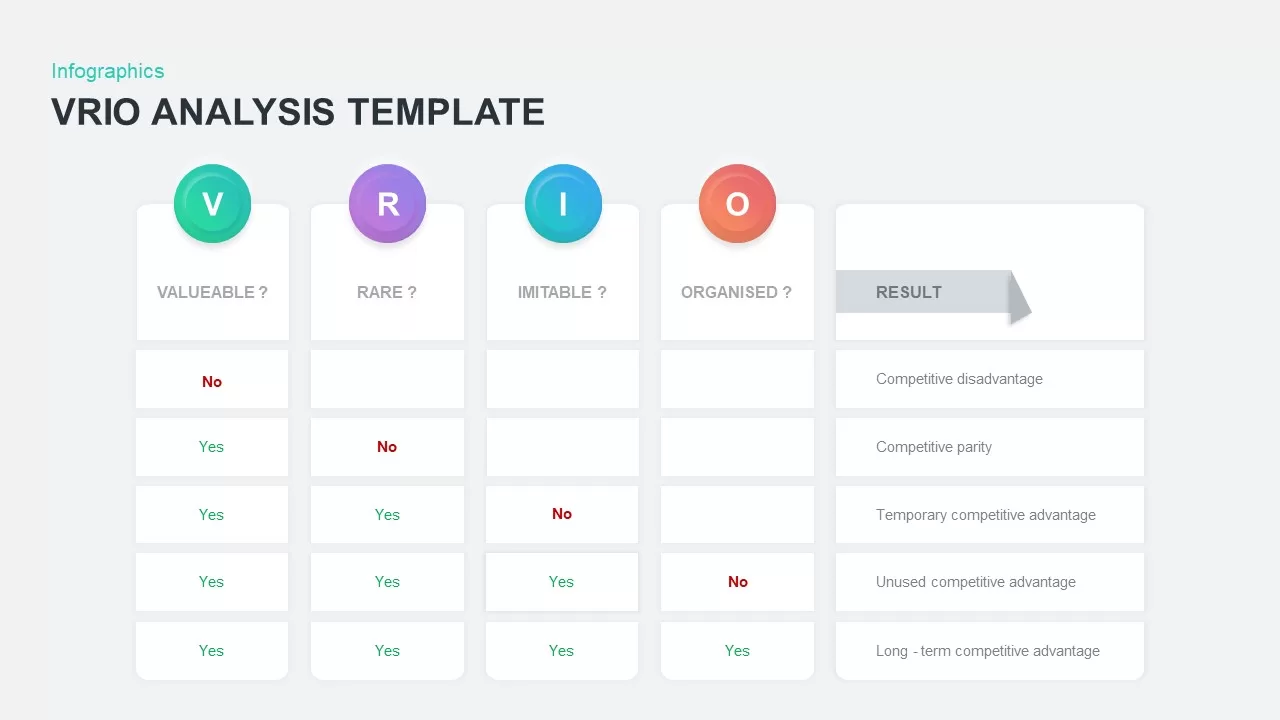
VRIO Analysis Infographic Template for PowerPoint & Google Slides
Business Strategy
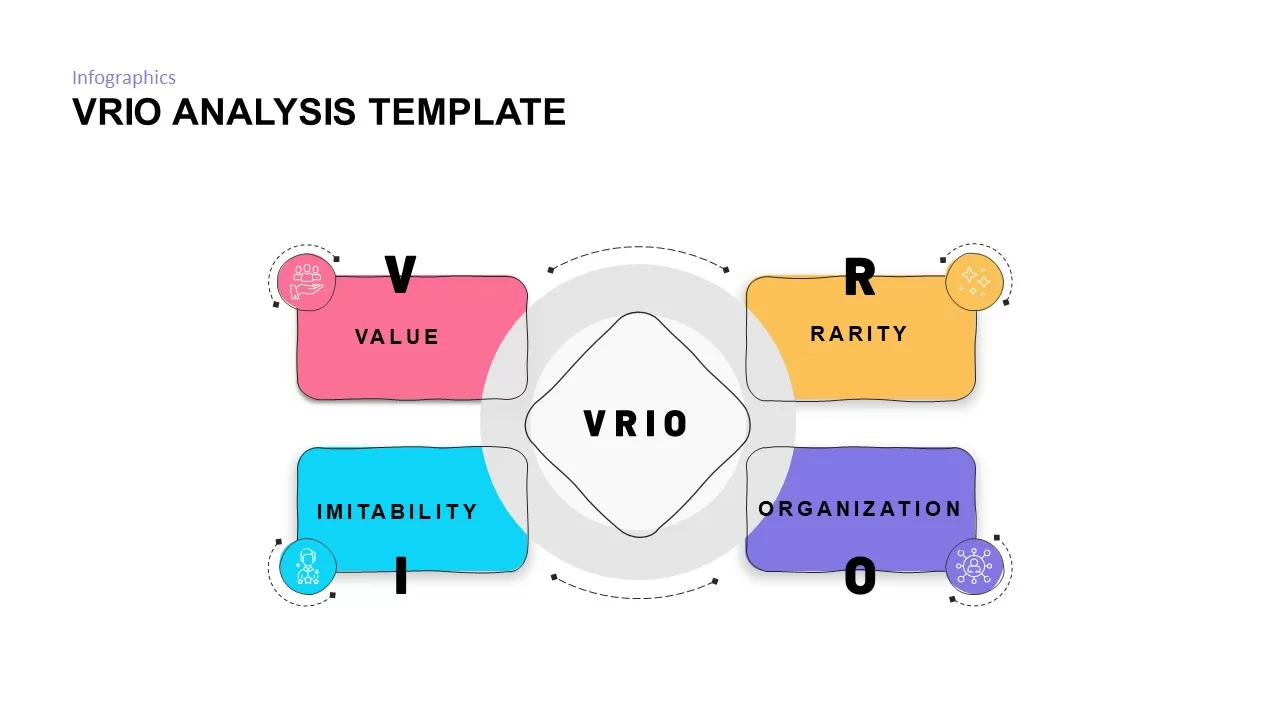
VRIO Analysis Framework template for PowerPoint & Google Slides
Business Strategy
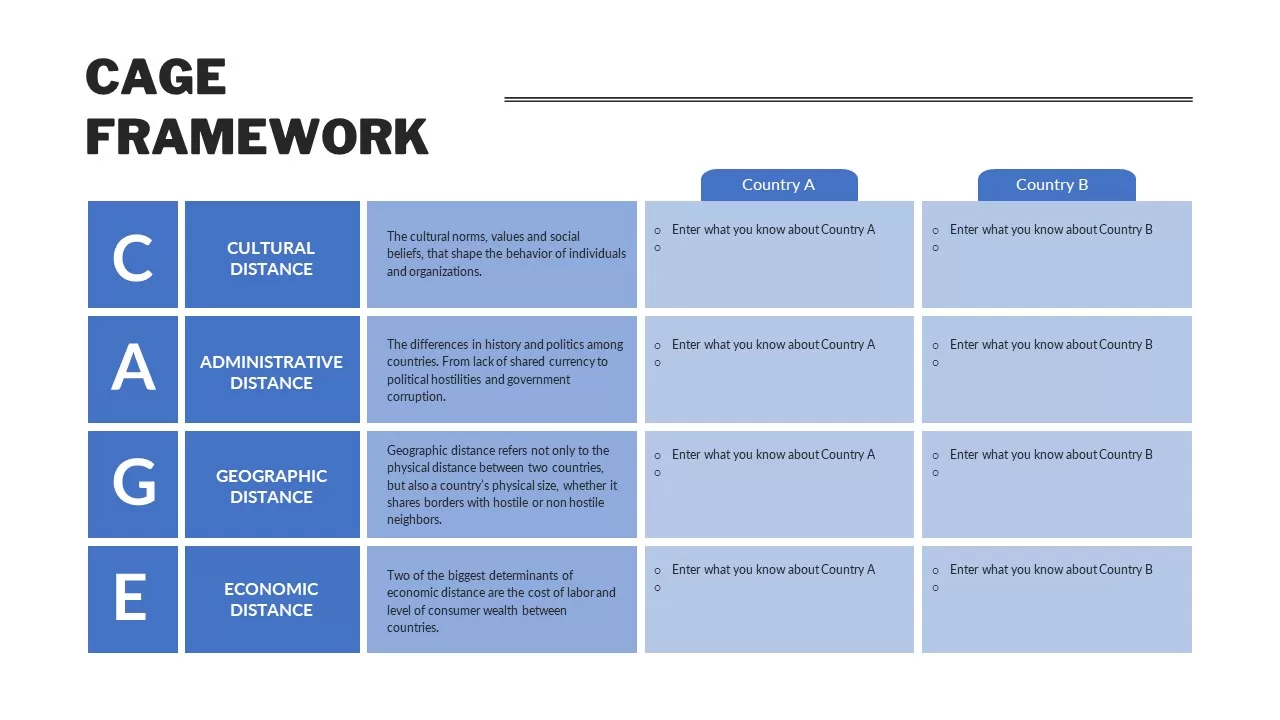
CAGE Distance Analysis Framework Template for PowerPoint & Google Slides
Competitor Analysis
Comprehensive Risk Impact Analysis Template for PowerPoint & Google Slides
Risk Management
Colorful SWOT Analysis Quadrant Template for PowerPoint & Google Slides
SWOT
SWOT Analysis Framework template for PowerPoint & Google Slides
SWOT
SWOT Analysis Quadrant template for PowerPoint & Google Slides
Business Strategy
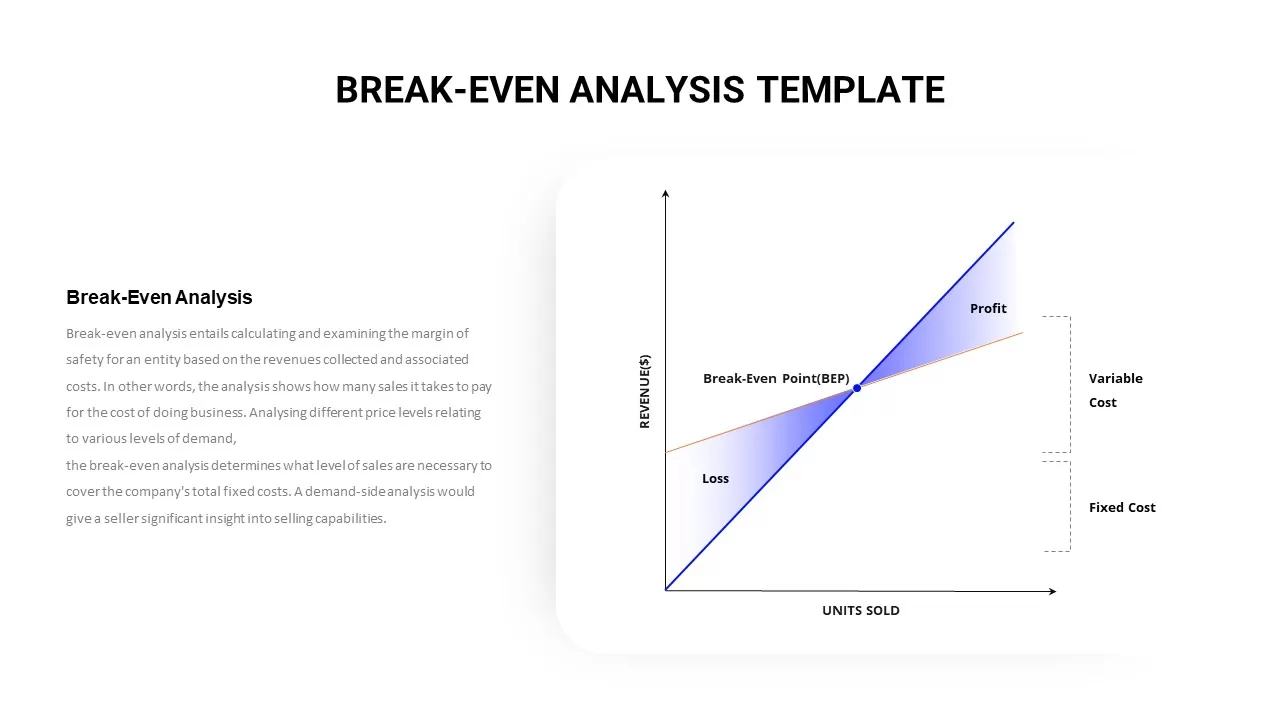
Break-Even Analysis Infographic Template for PowerPoint & Google Slides
Revenue
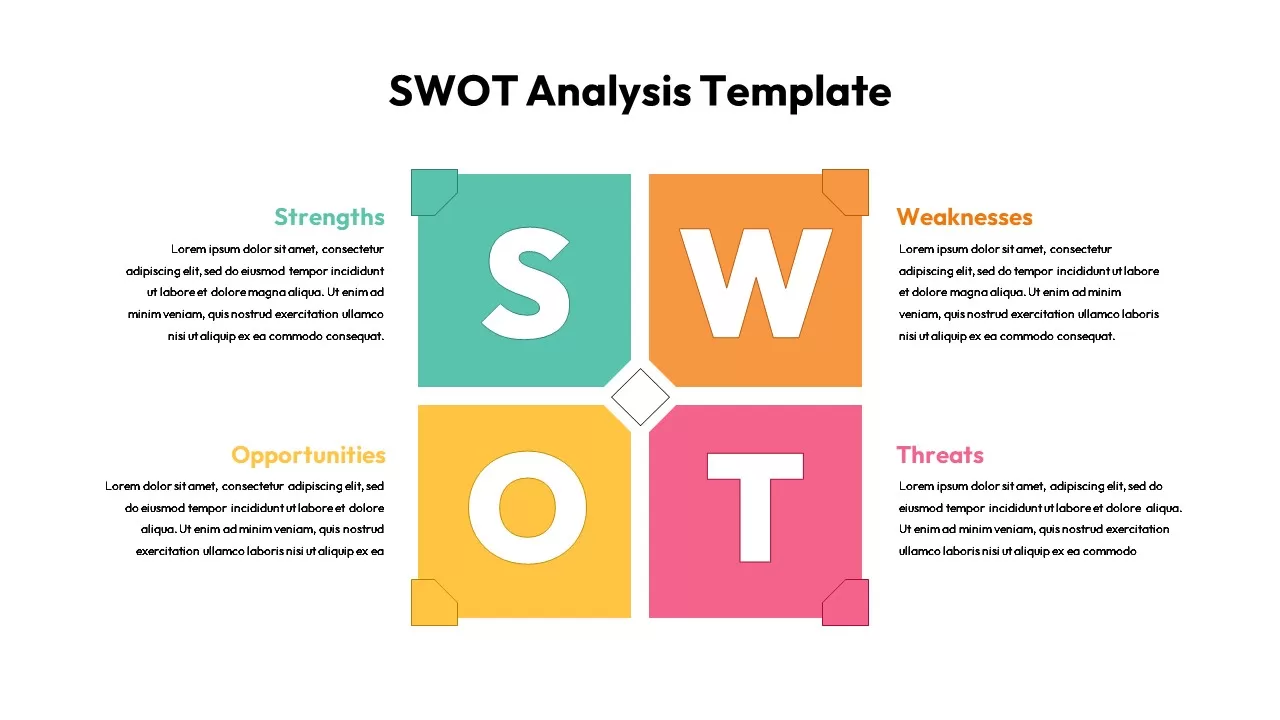
SWOT Analysis template for PowerPoint & Google Slides
SWOT
Current vs Future State Analysis template for PowerPoint & Google Slides
Comparison
Heat Map Analysis Template for PowerPoint & Google Slides
Risk Management
Checkmate Slide for Competitor Analysis Template for PowerPoint & Google Slides
Competitor Analysis
Cost Benefit Analysis Comparison Template for PowerPoint & Google Slides
Comparison
Six-Step Business Analysis Diagram template for PowerPoint & Google Slides
Circular
Vendor Analysis Criteria and Scoring template for PowerPoint & Google Slides
Business
Social Media Analysis Metrics Slide Deck Template for PowerPoint & Google Slides
Digital Marketing
Population Pyramid Chart Analysis Template for PowerPoint & Google Slides
Bar/Column
Simple Scatter Chart Analysis Template for PowerPoint & Google Slides
Comparison Chart
Waterfall Bar Chart Analysis Template for PowerPoint & Google Slides
Bar/Column
Proportional Area Chart Analysis Template for PowerPoint & Google Slides
Comparison Chart
Cost-Volume-Profit Analysis Diagram Template for PowerPoint & Google Slides
Finance
Quarterly Network Volume Analysis Template for PowerPoint & Google Slides
Business Report
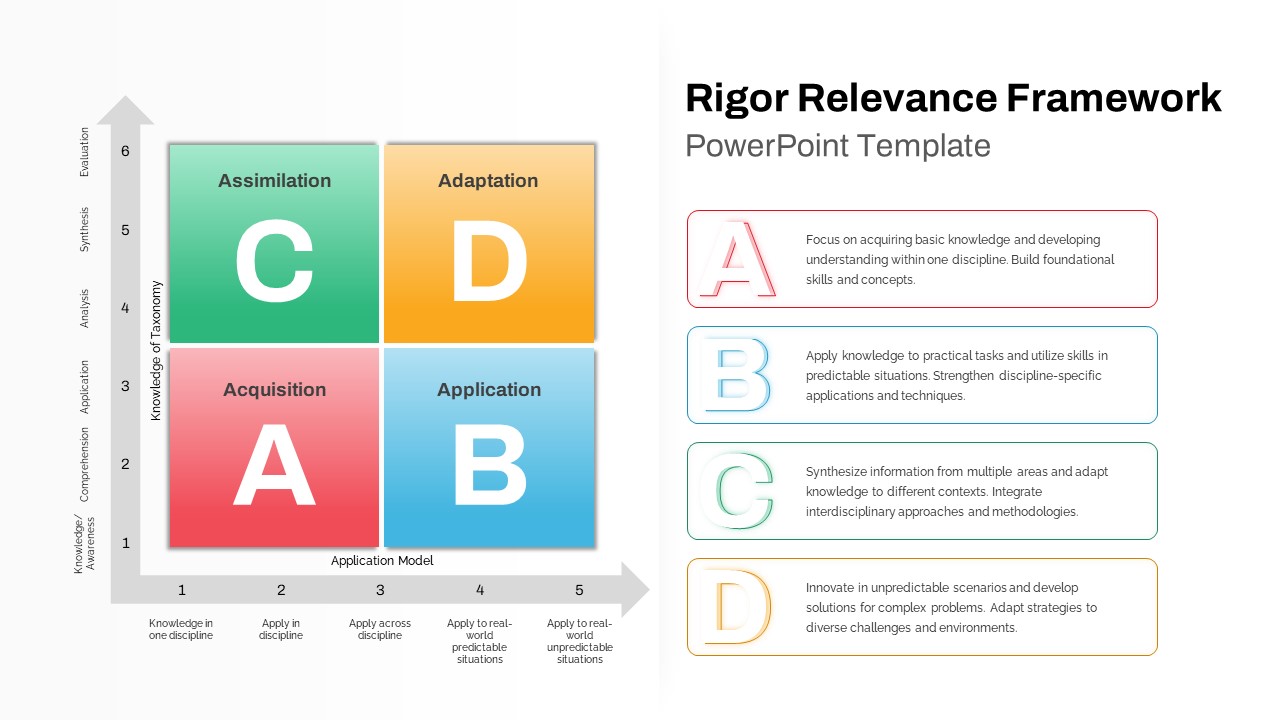
Rigor Relevance Framework Analysis Template for PowerPoint & Google Slides
Comparison
Bottleneck Process Analysis Diagram Template for PowerPoint & Google Slides
Process
Quantitative Risk Analysis Matrix template for PowerPoint & Google Slides
Risk Management
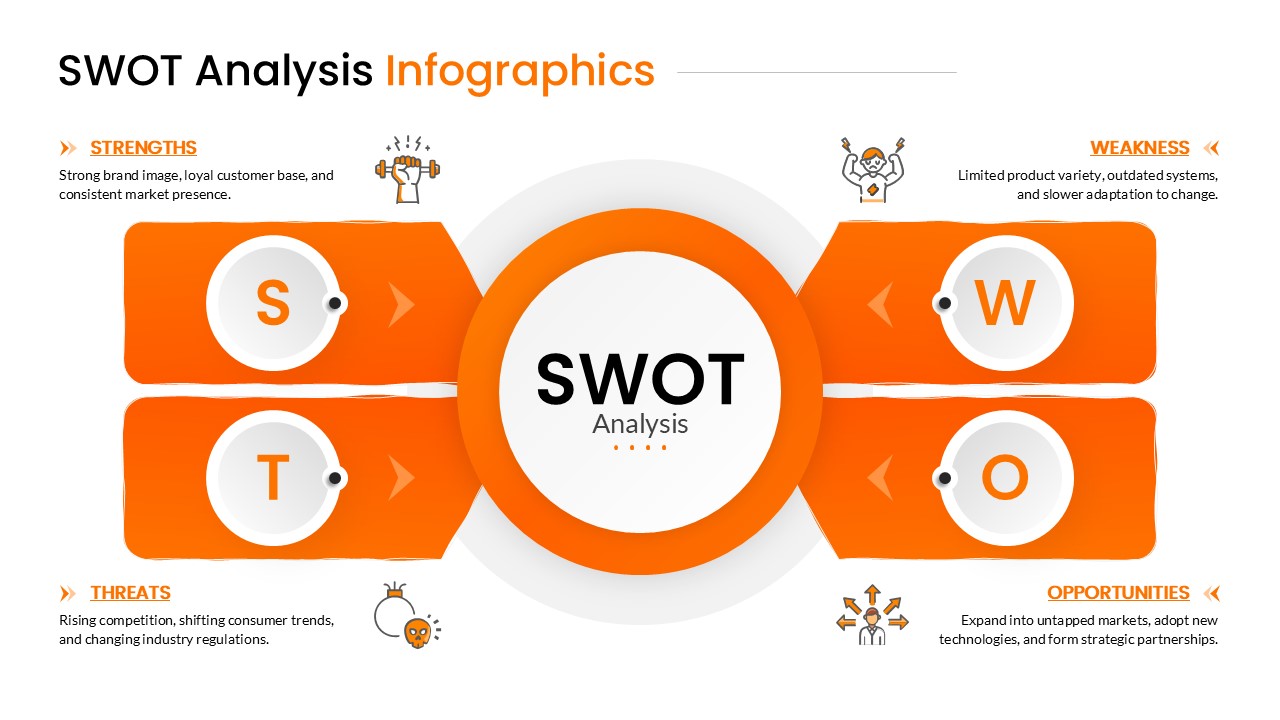
SWOT Analysis Infographic with Circular Icons Template for PowerPoint & Google Slides
SWOT
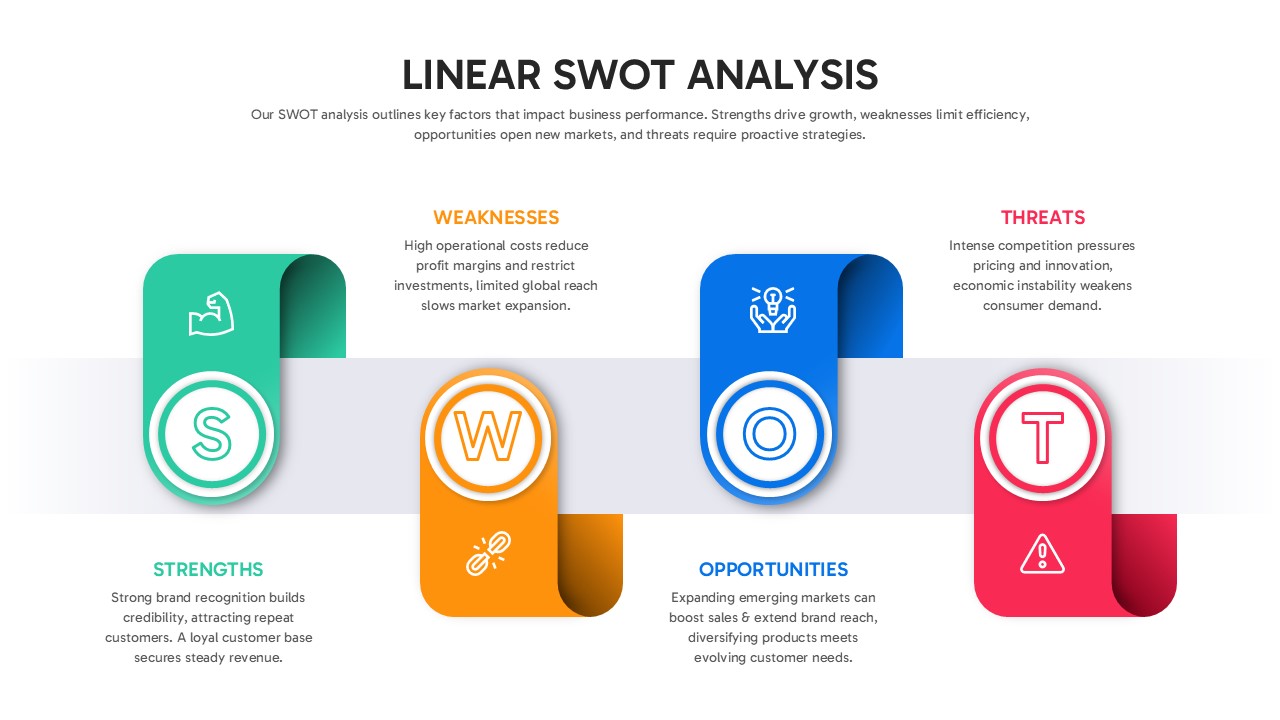
Linear SWOT Analysis Slide Template for PowerPoint & Google Slides
SWOT
Orange SWOT Analysis Infographic Template for PowerPoint & Google Slides
SWOT
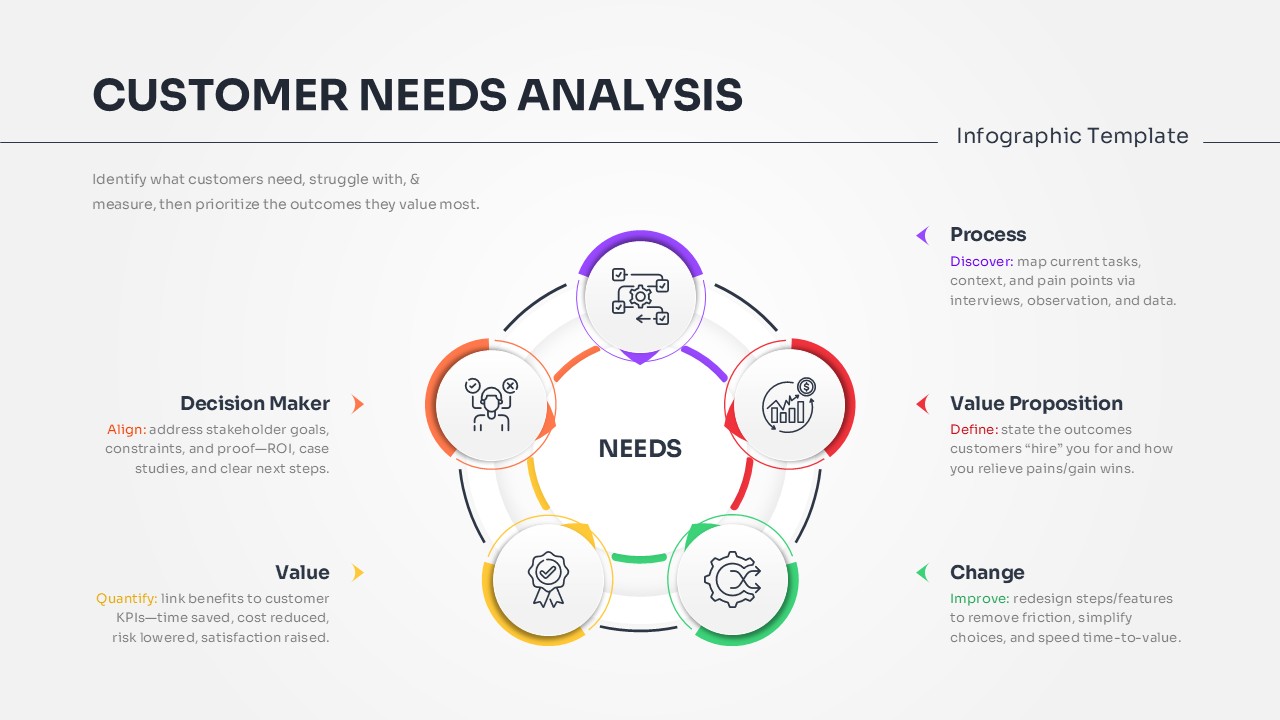
Customer Needs Analysis Template for PowerPoint & Google Slides
Customer Experience
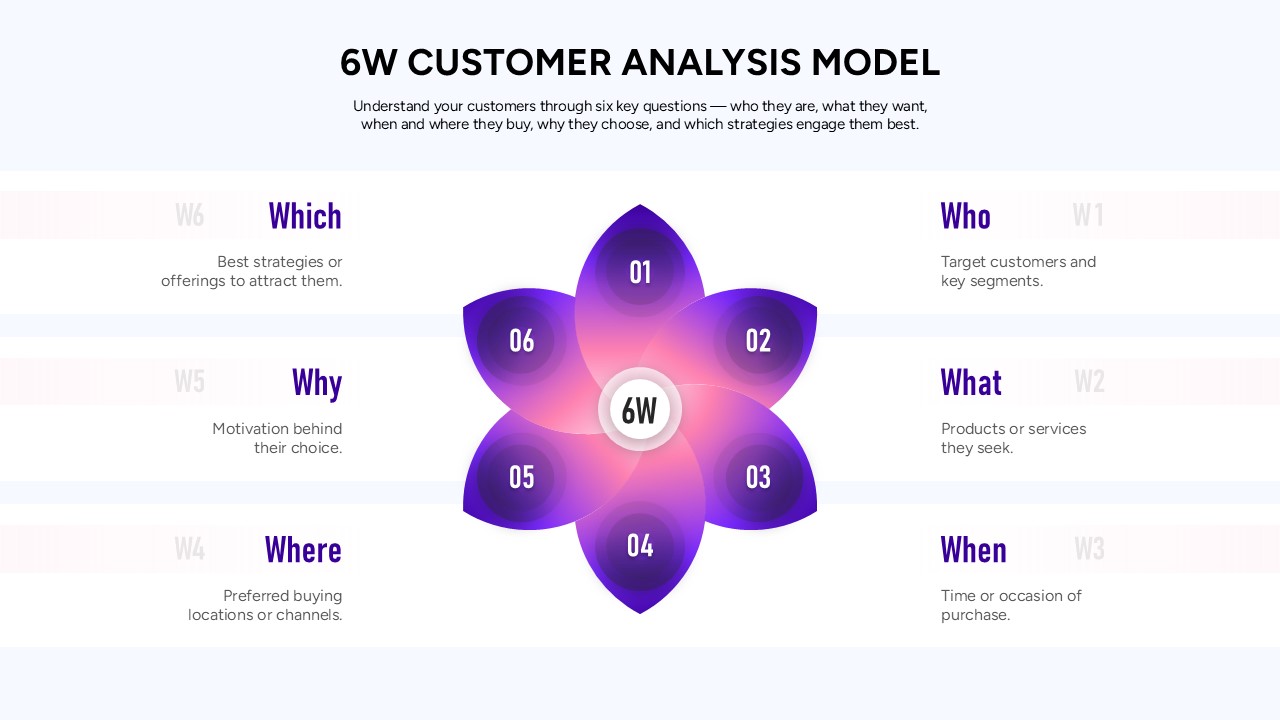
6W Customer Analysis Model Template for PowerPoint & Google Slides
Customer Experience
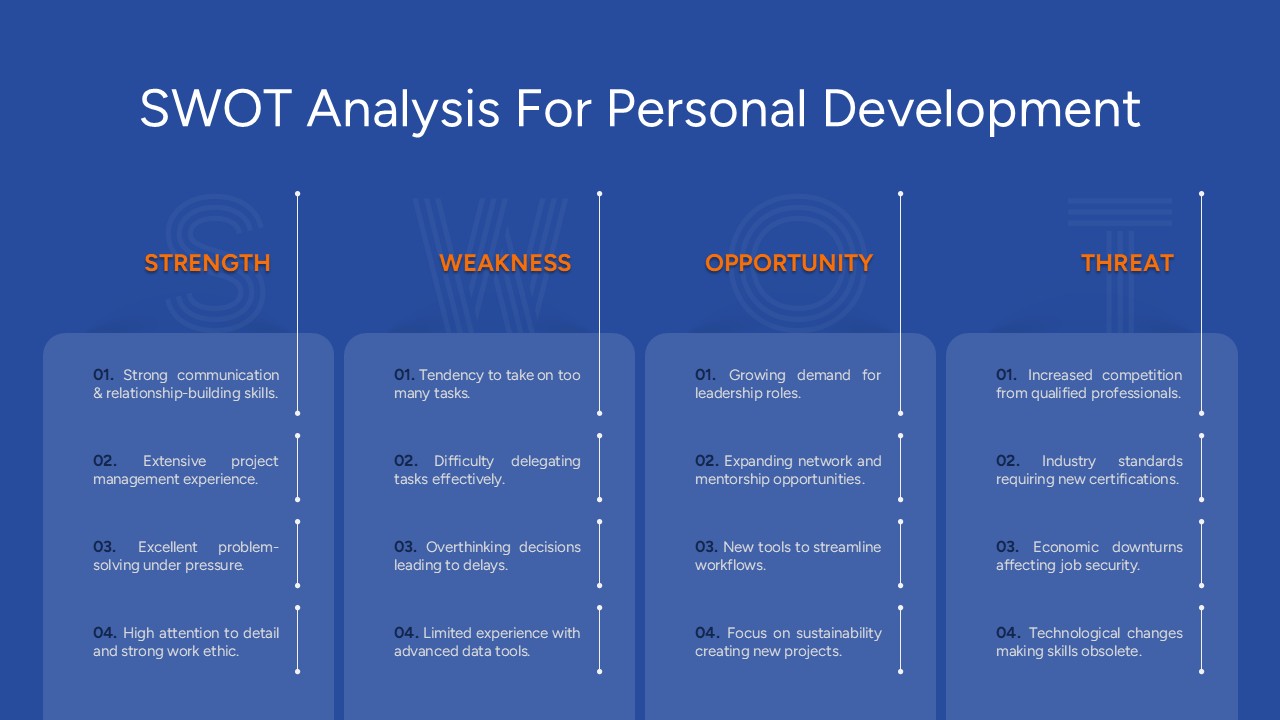
Free SWOT Analysis for Personal Development Template for PowerPoint & Google Slides
SWOT
Free