Financial Snapshot PowerPoint Template
Financial PowerPoint Template for Statistical Display
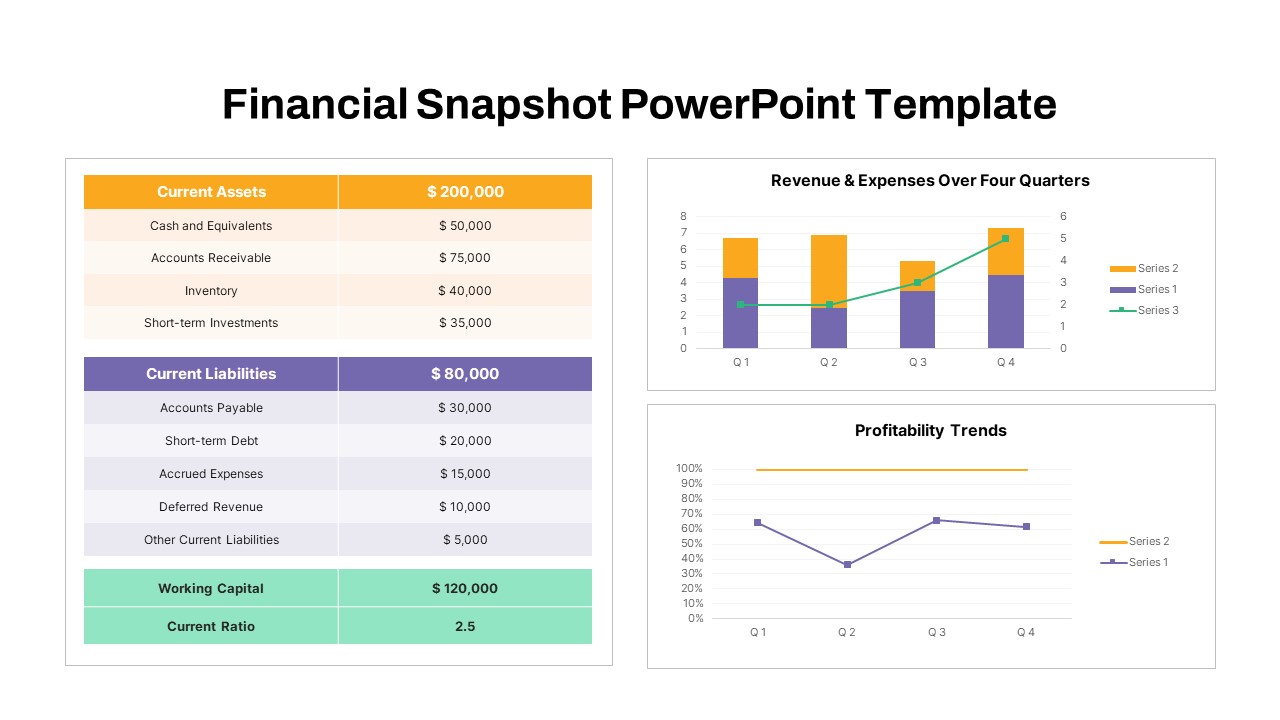
The Financial Snapshot PowerPoint Template is a professional presentation tool crafted to highlight your company’s financial metrics using a statistical diagram. Featuring a bar chart, line chart, and a table ppt for easy financial summary presentation, this template simplifies showcasing key achievements and future projections. It’s fully editable and ideal for corporations, SMEs, and business enterprises, offering a clear overview of current assets, liabilities, revenue, expenses over four months, and profitability trends. With its concise One-Pager slide, stakeholders and clients gain valuable insights into your company’s progress, understanding your strategic objectives management and identifying growth opportunities effectively.
How to provide financial snapshots in PowerPoint?
To provide financial snapshots in PowerPoint, start by selecting key financial metrics such as revenue, expenses, profitability, and financial ratios. Use charts like bar graphs for trends over time, pie charts for the composition of expenses or revenues, and tables for detailed figures. Highlight important points with annotations or callouts. Ensure data clarity with minimal text and visual clutter, using consistent colors and formatting. Emphasize comparisons, such as year-over-year or quarter-over-quarter performance, to provide context. Use slide transitions and animations sparingly to guide the audience’s focus. Conclude with actionable insights and recommendations to enhance understanding and decision-making based on the financial snapshots presented.
Uses of financial snapshot PowerPoint?
The Financial Snapshot PowerPoint serves various crucial purposes in business presentations. It is instrumental in summarizing financial performance metrics such as revenue, expenses, and profitability in a visually compelling format. This tool aids in presenting quarterly results to stakeholders, providing clarity on financial trends and highlighting key metrics for strategic decision-making. It simplifies complex financial data for diverse audiences, including executives, investors, and board members, facilitating informed discussions and actions. Moreover, the template enhances transparency and accountability by offering a clear overview of financial health and progress against goals, ultimately supporting effective communication and alignment across organizational levels.
Login to download this file


