Be On The Target Template for PowerPoint & Google Slides
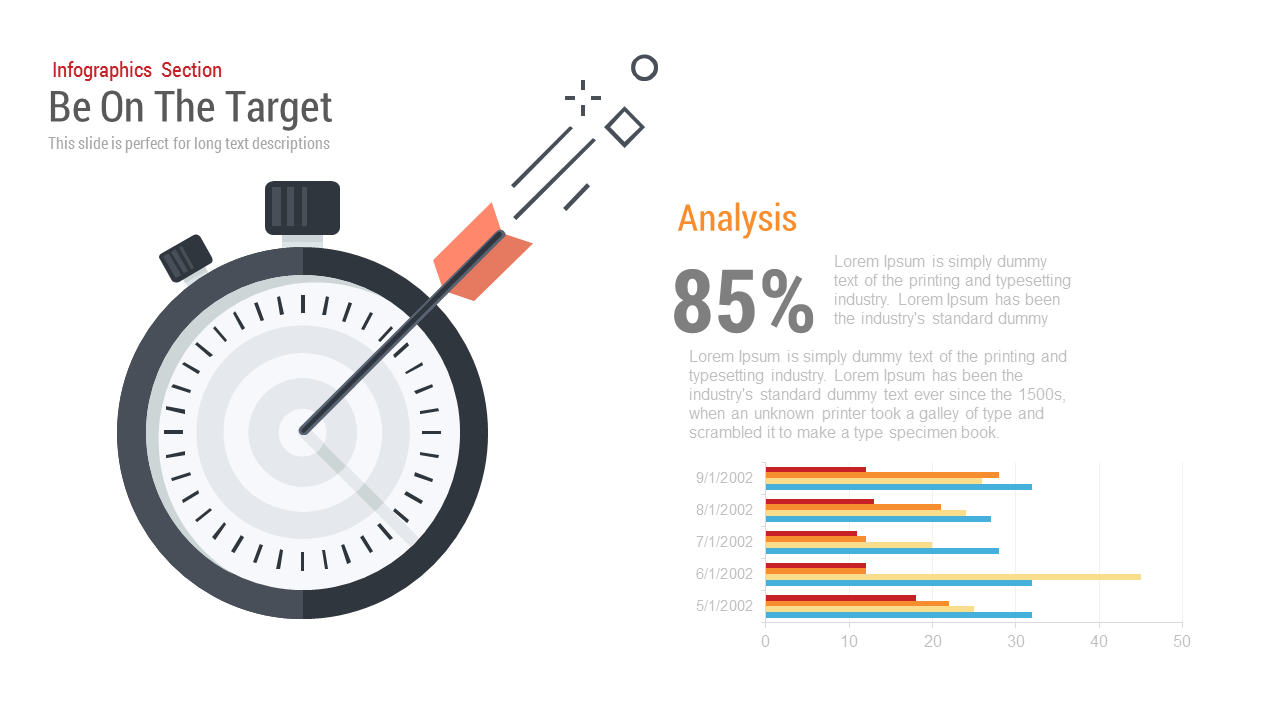

The Be On The Target Template gives business professionals and strategy teams a focused way to present performance analysis, KPIs, and goal-tracking data to their audiences. This template suits corporate strategy reviews, quarterly business reports, and data-driven presentations where visual clarity matters.
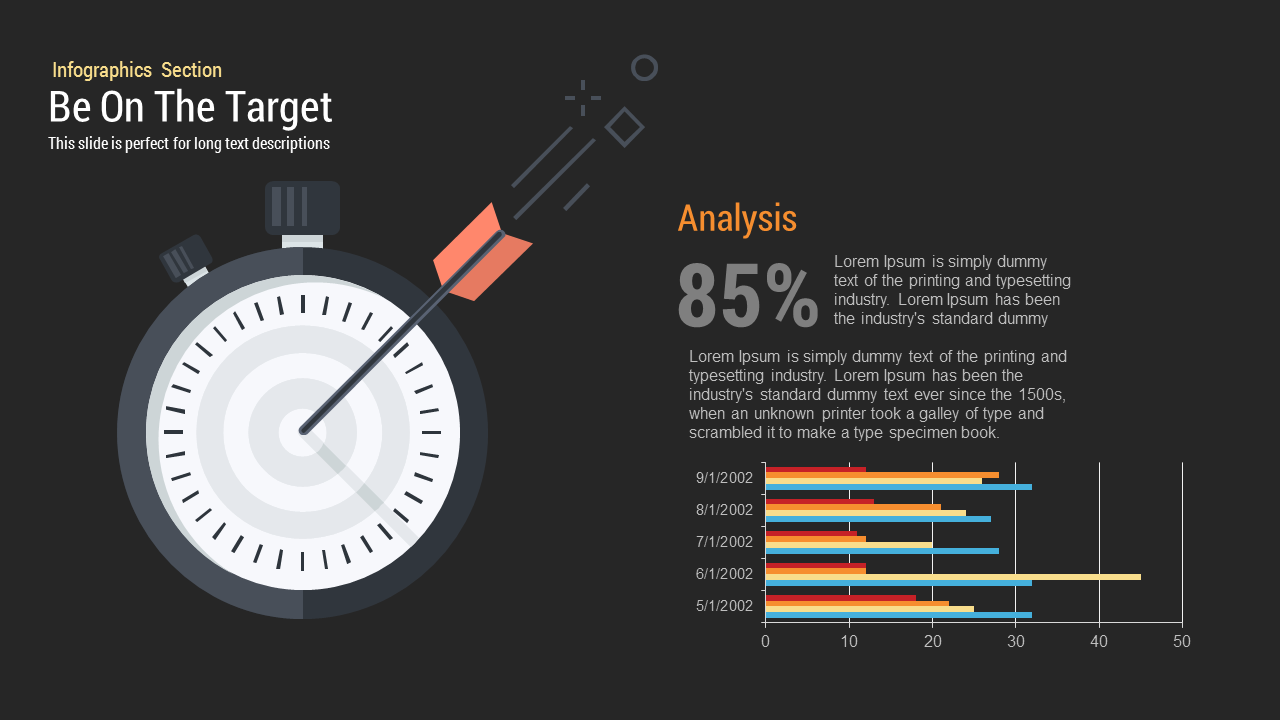
The template features a single-slide layout built around a bold infographic theme. The left side displays a detailed stopwatch illustration styled as a target board, with a dart hitting the center to reinforce the goal-achievement concept. The right side carries the analytical content: a large “85%” stat with supporting descriptive text, a short paragraph for extended commentary, and a horizontal grouped bar chart showing date-based comparisons across five time periods from May 2002 to September 2002. The chart uses four color-coded bars per row in red, orange, yellow, and blue, making it easy to compare multiple data series at a glance. The overall color palette is light and neutral with orange accent text headings for contrast.
All shapes, icons, chart elements, and text boxes are fully editable in PowerPoint and Google Slides. Users can swap the placeholder statistics, update the bar chart data, change accent colors to match their brand, and replace the descriptive body text with real content. The template is compatible with PowerPoint 2016 and later, Office 365, and Google Slides.
Download the Be On The Target Template and present your performance data with focus and visual impact today.
Login to download this file

Item ID
SB00003
Related Templates

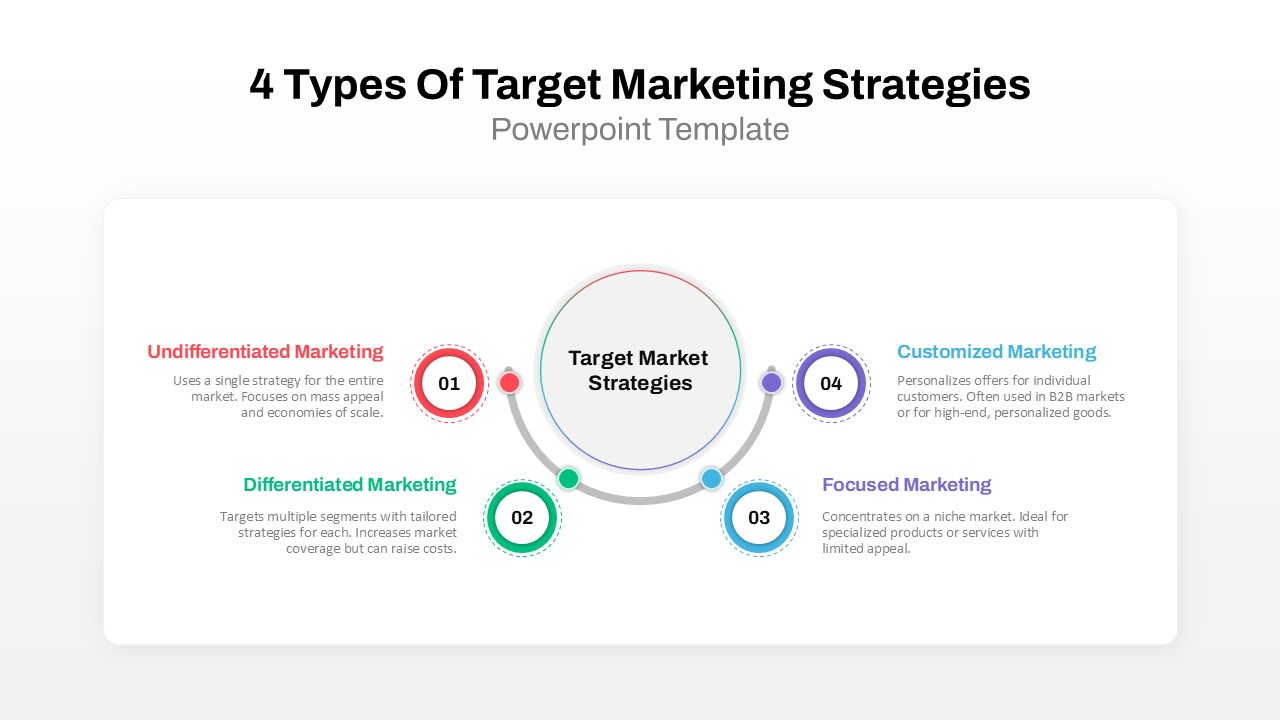
4 Types of Target Marketing Strategies PowerPoint Template for PowerPoint & Google Slides
Comparison
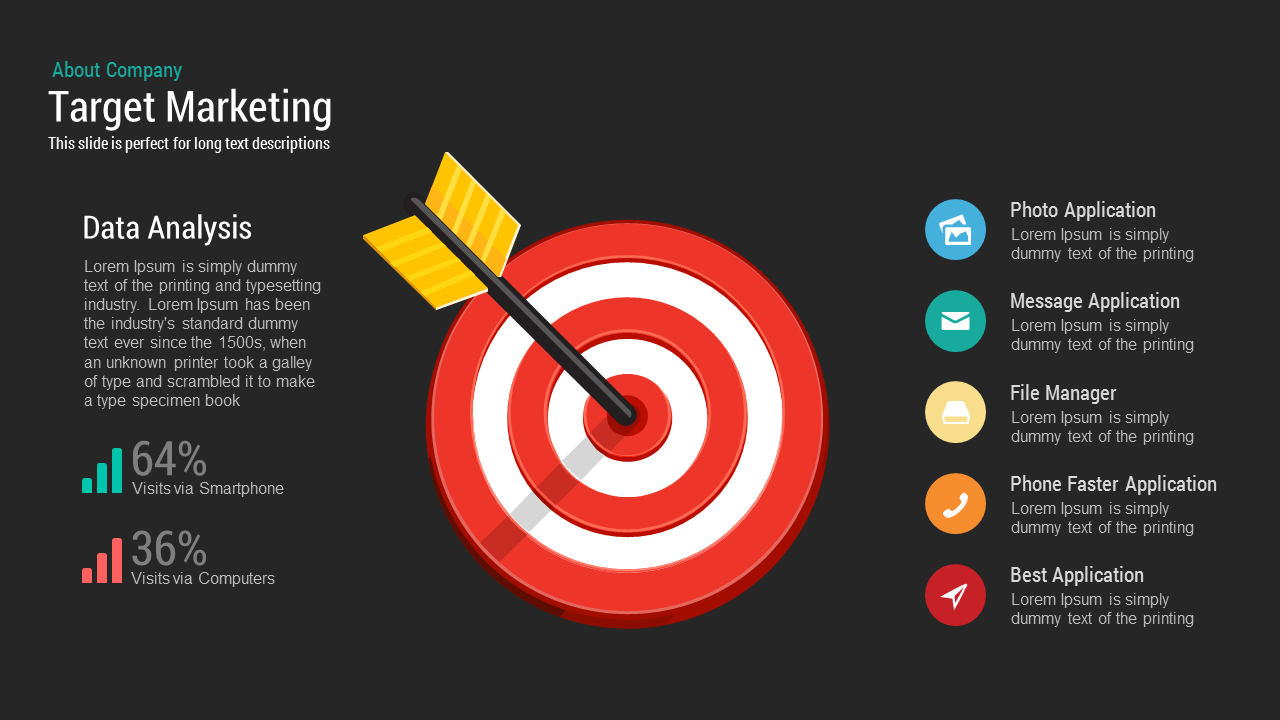
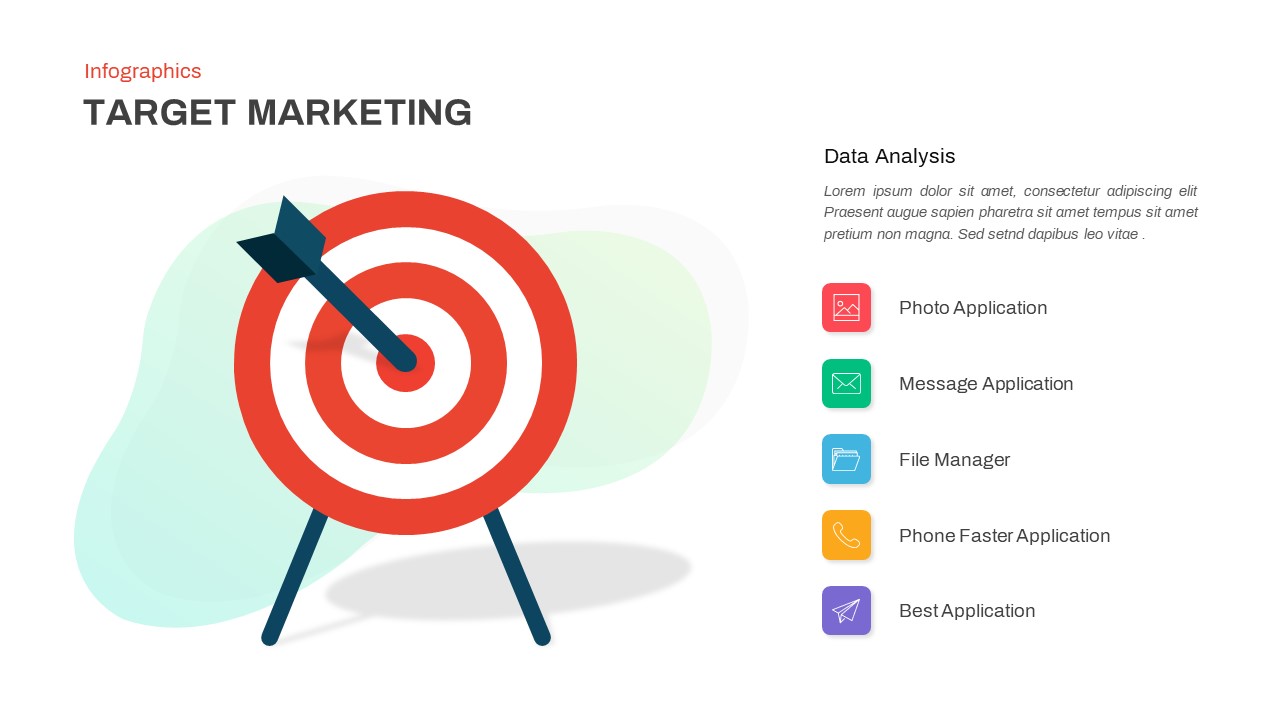
Target Marketing template for PowerPoint & Google Slides
Business
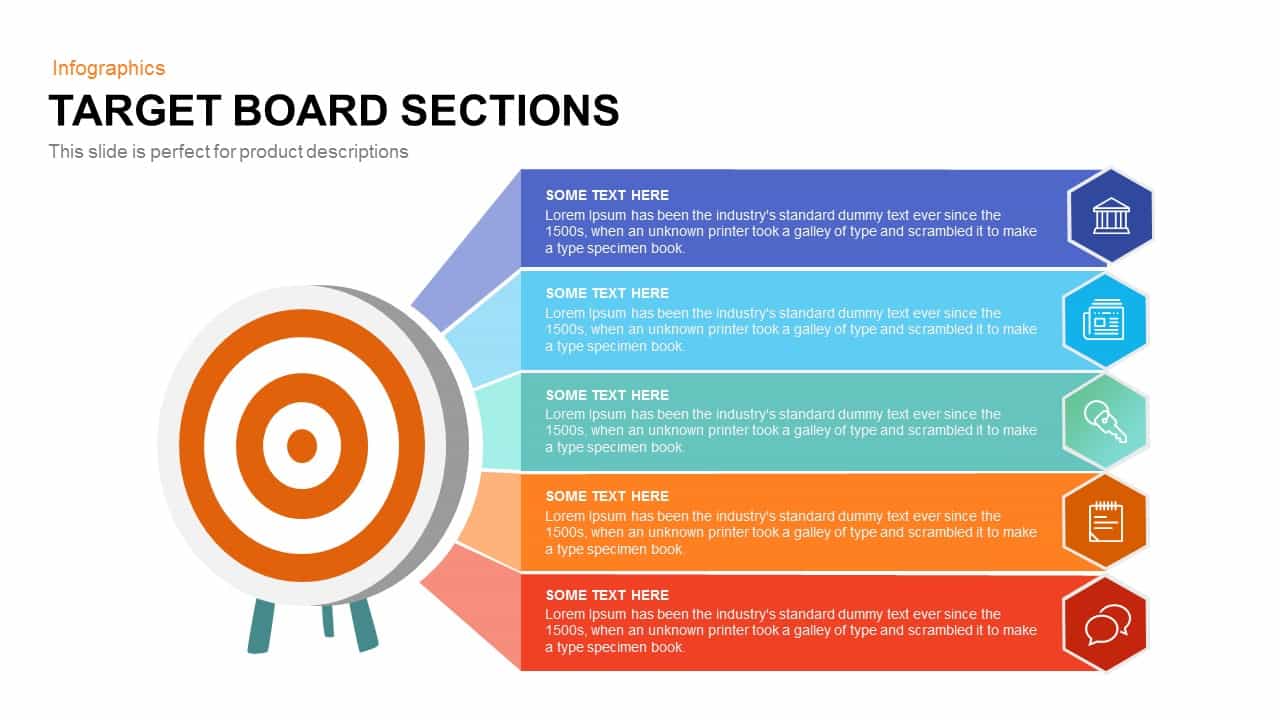
Target Board Sections Circular Diagram Template for PowerPoint & Google Slides
Circular
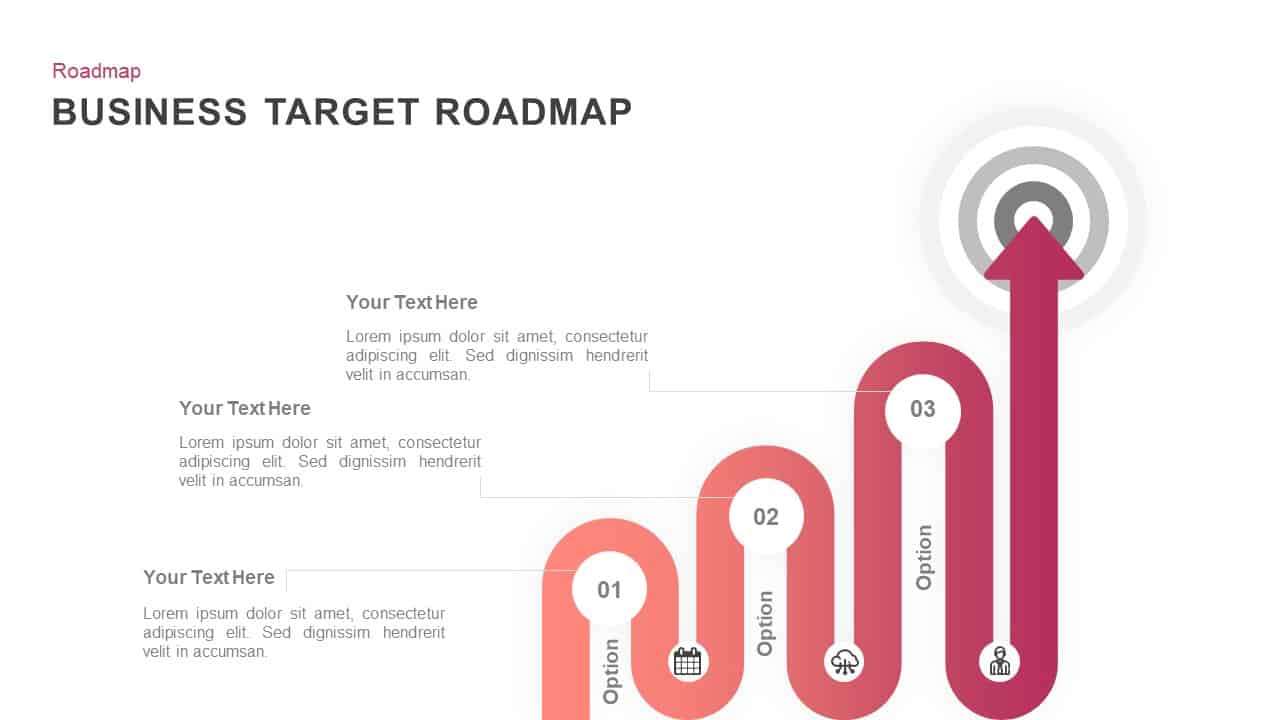
Business Target Milestone Roadmap Template for PowerPoint & Google Slides
Roadmap
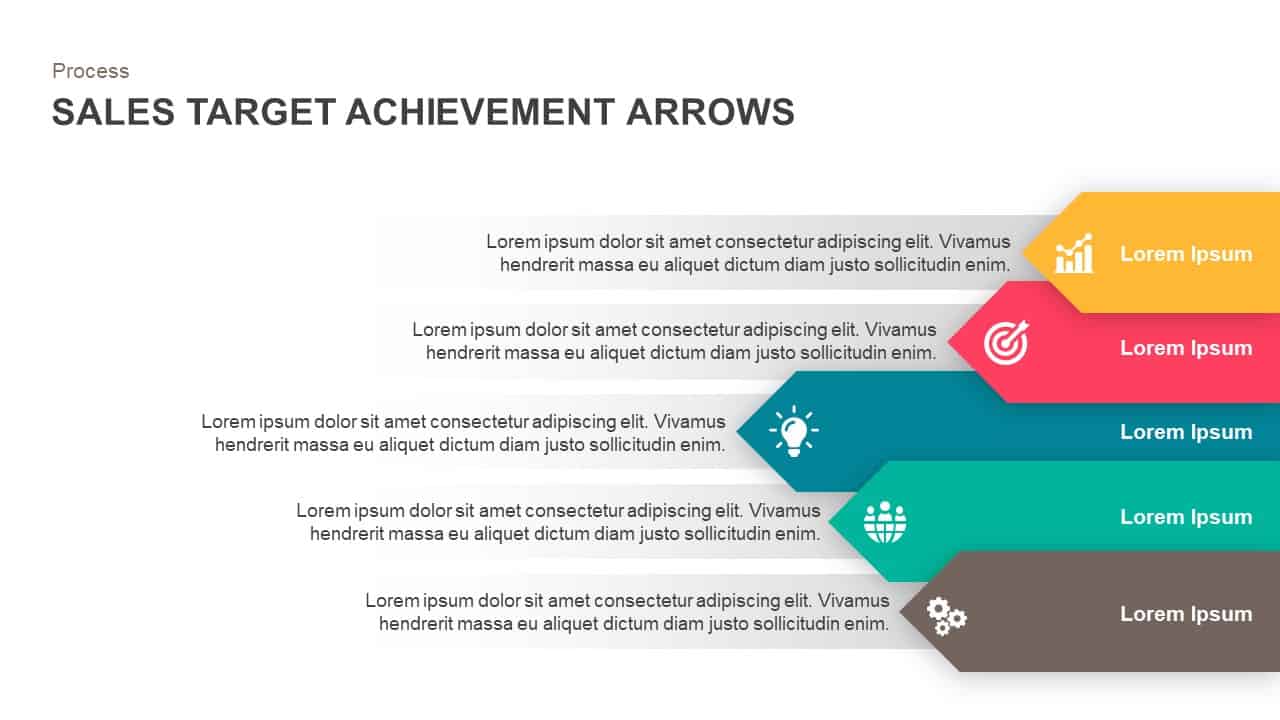
Sales Target Achievement Arrows Template for PowerPoint & Google Slides
Arrow
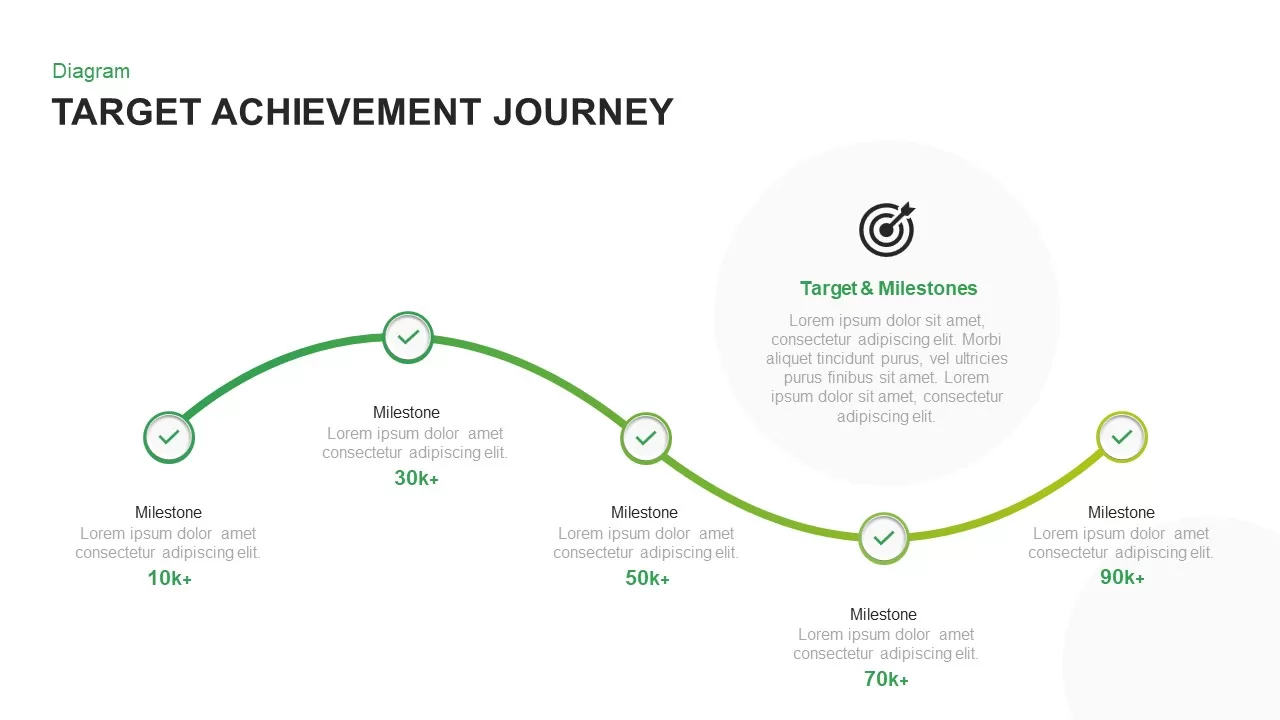
Target Achievement Milestone Curve Template for PowerPoint & Google Slides
Roadmap
Target Market Infographic Slide Pack Template for PowerPoint & Google Slides
Infographics
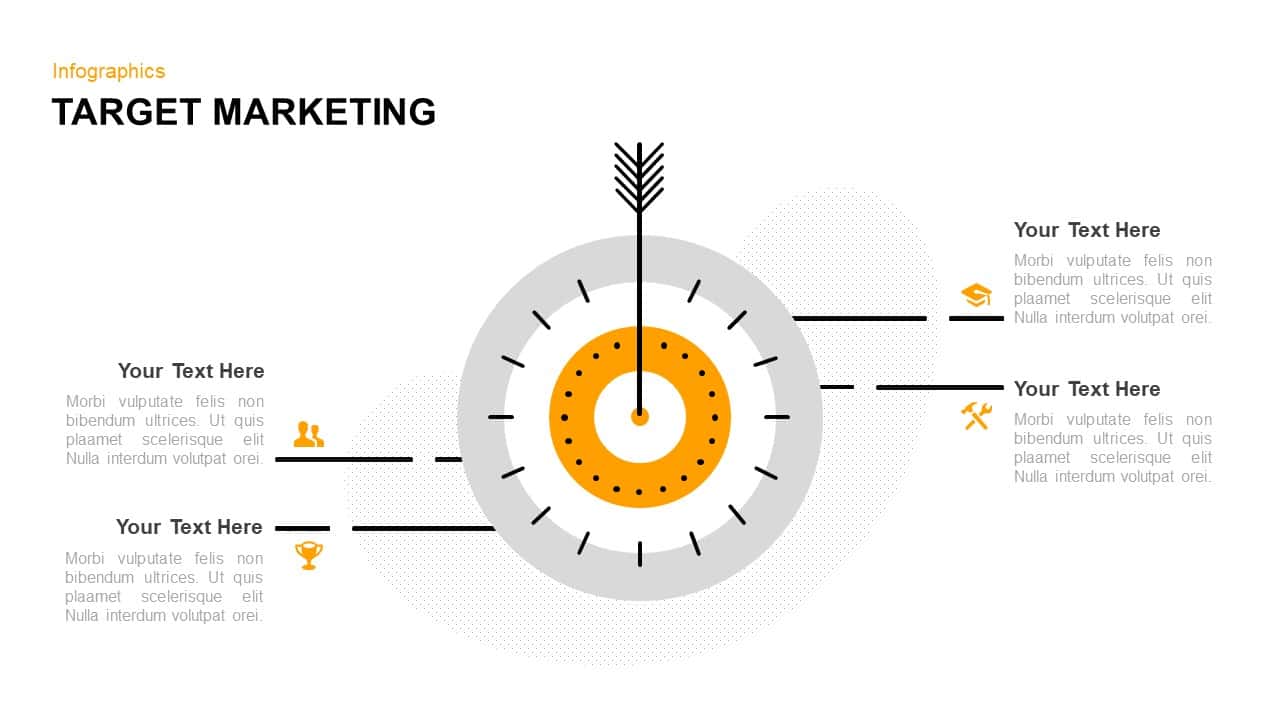
Target Marketing Infographic Callouts Template for PowerPoint & Google Slides
Circular
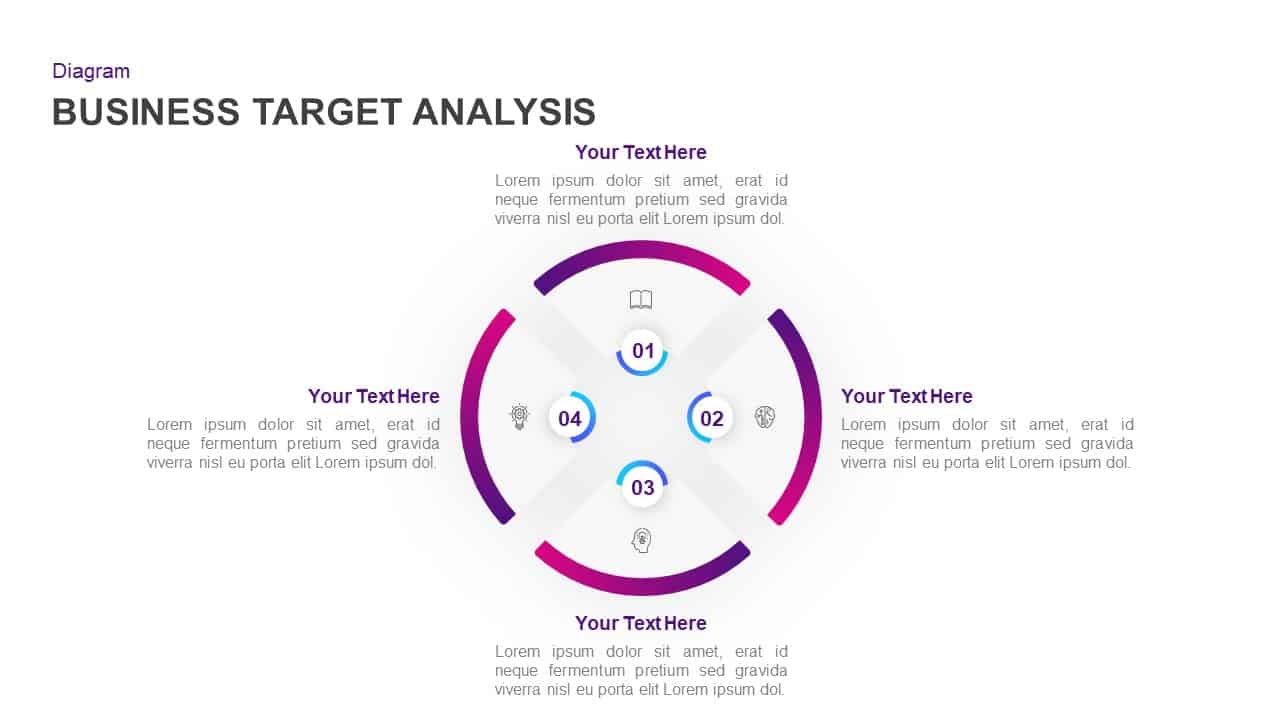
Business Target Analysis Diagram Template for PowerPoint & Google Slides
Circular
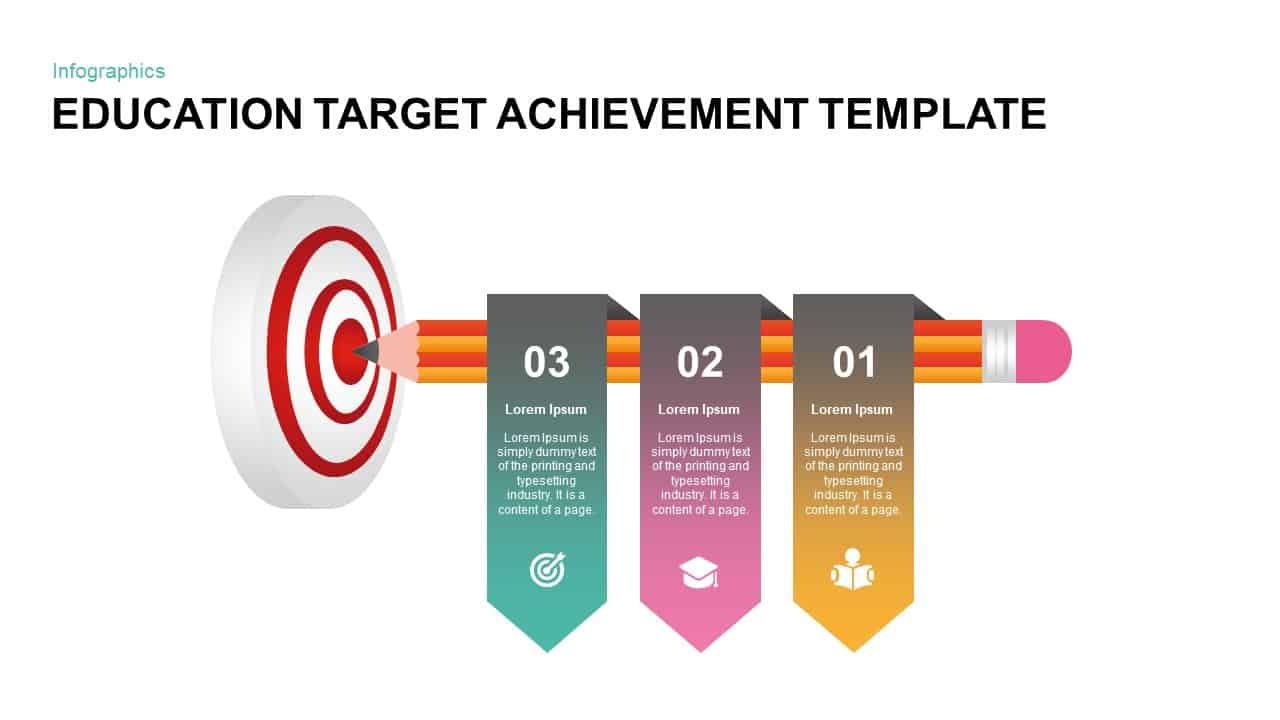
Education Target Achievement Infographic Template for PowerPoint & Google Slides
Goals
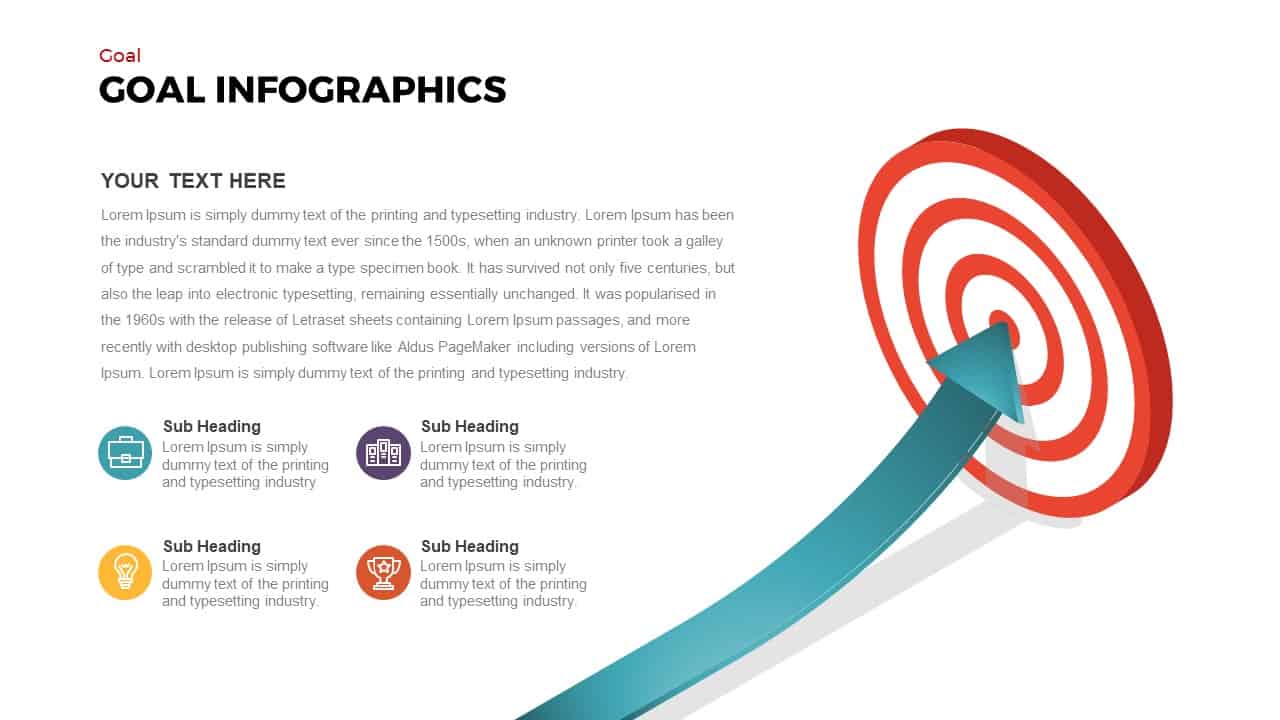
Goal Arrow and Target Infographic Template for PowerPoint & Google Slides
Goals
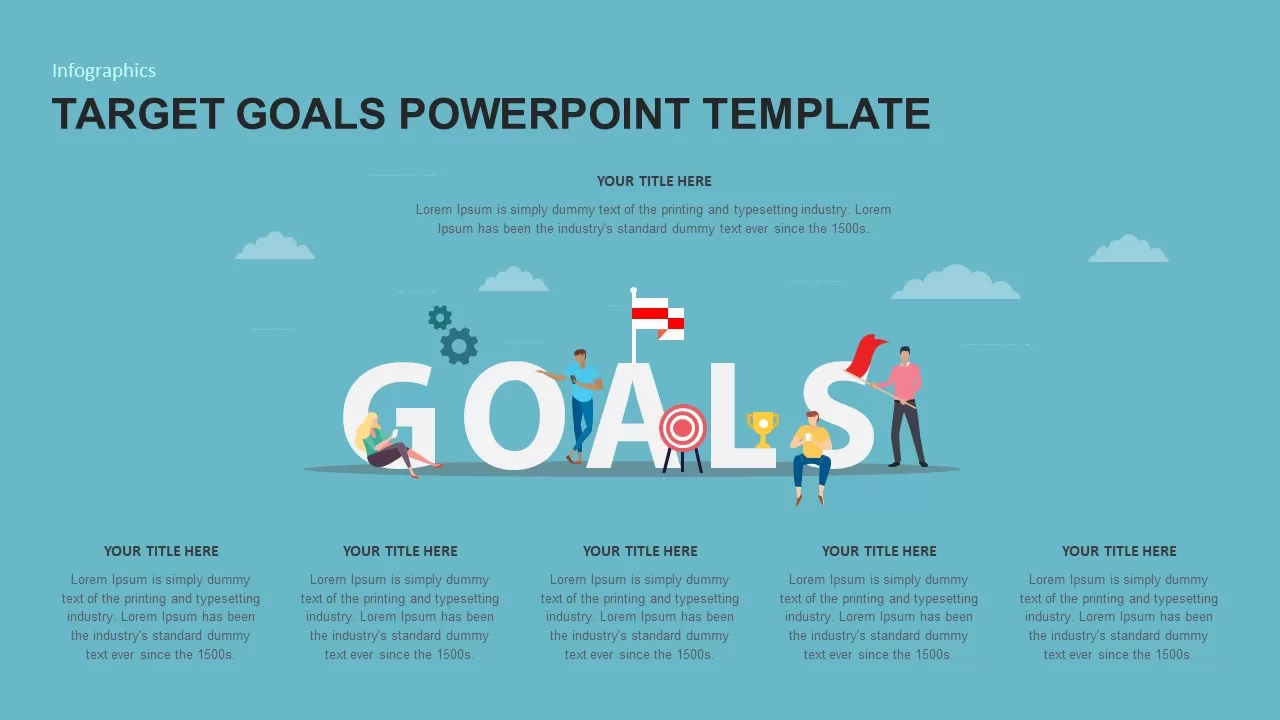
Target Goals Infographic Slide Template for PowerPoint & Google Slides
Goals
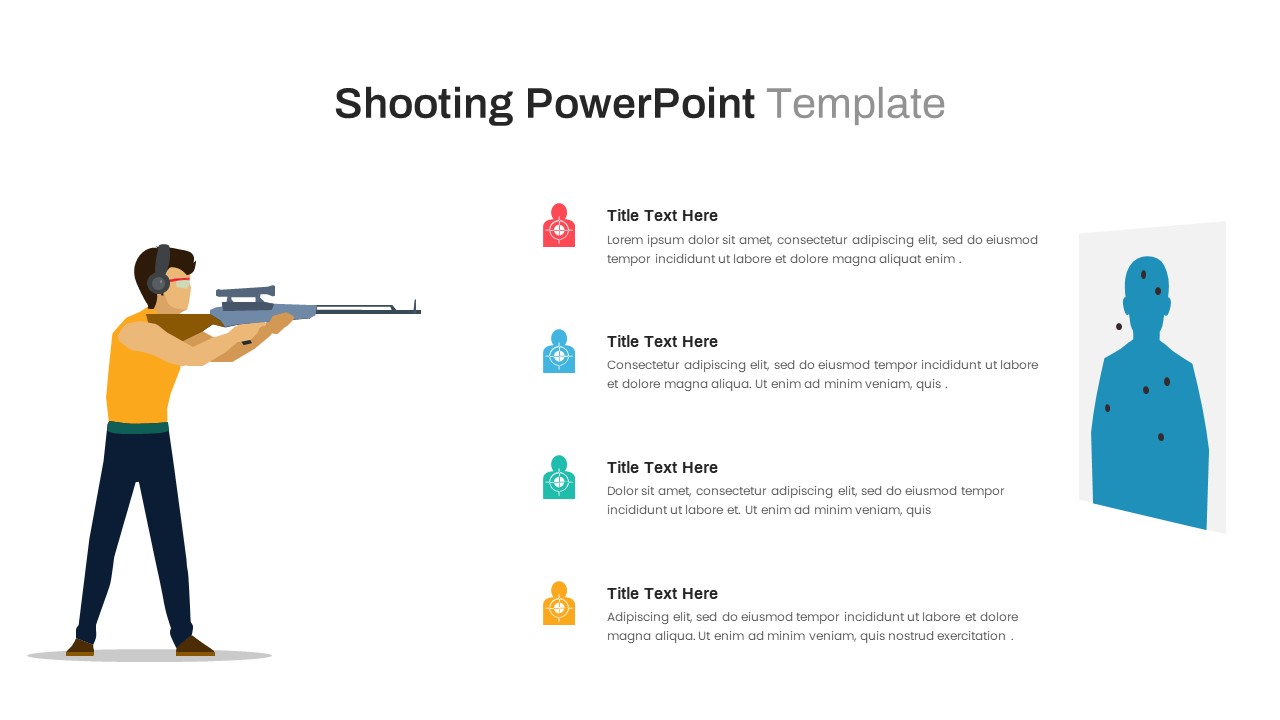
Shooting Target Process Infographic Template for PowerPoint & Google Slides
Process
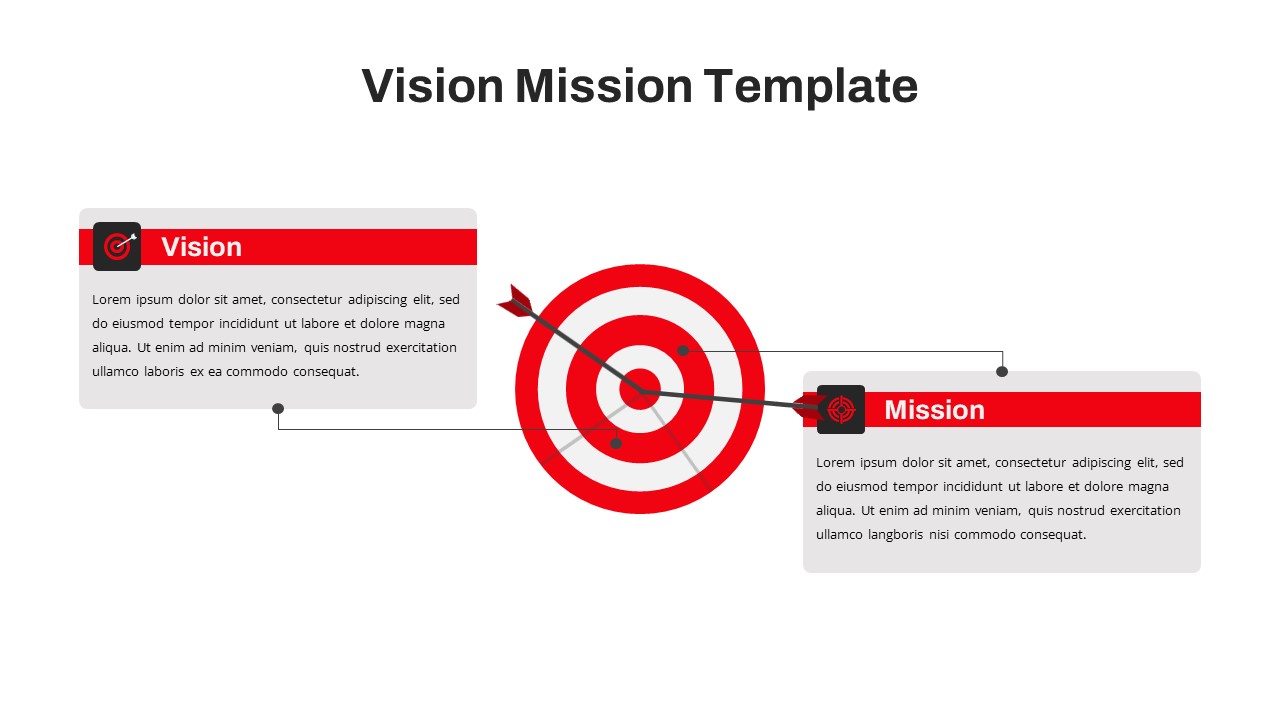
Vision Mission Statement PowerPoint and Google Slides Template
Vision and Mission
Free
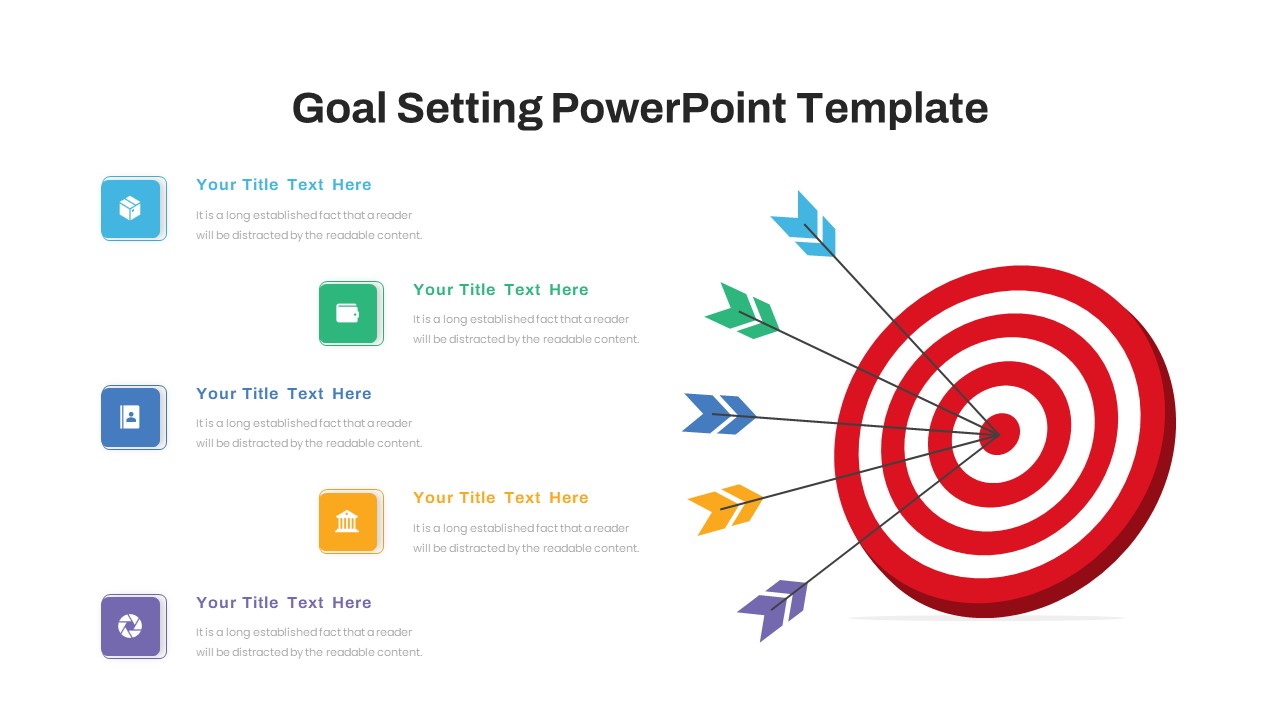
Free Goal Setting PowerPoint Template
Goals
Free
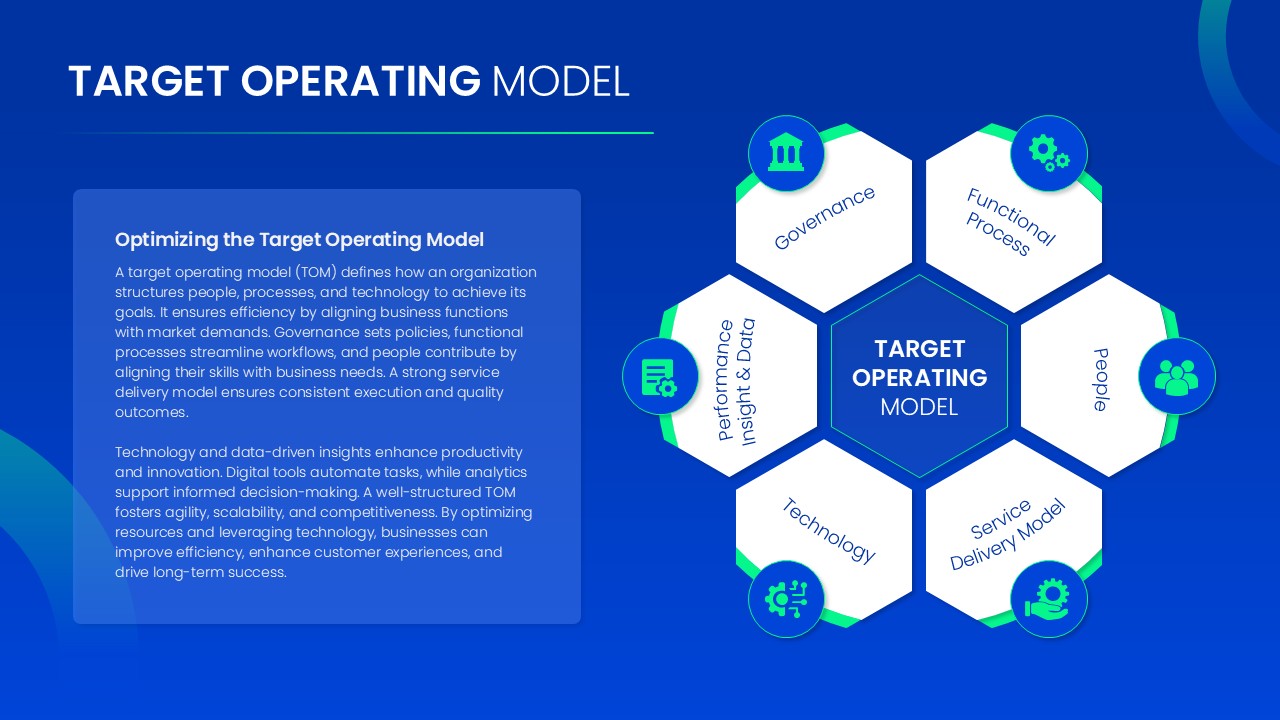
Target Operating Model Diagram Template for PowerPoint & Google Slides
Business Strategy
Two-Box Analysis & Target Comparison Template for PowerPoint & Google Slides
Comparison
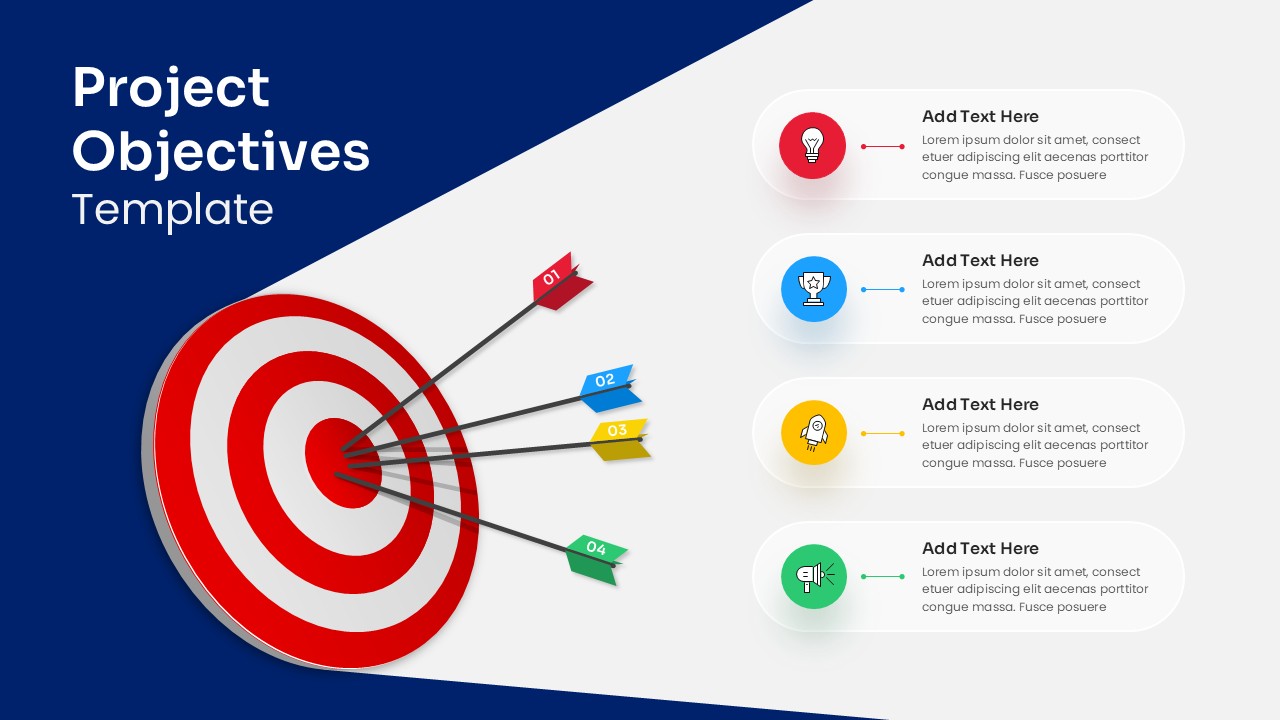
Project Objectives Target Diagram Template for PowerPoint & Google Slides
Goals

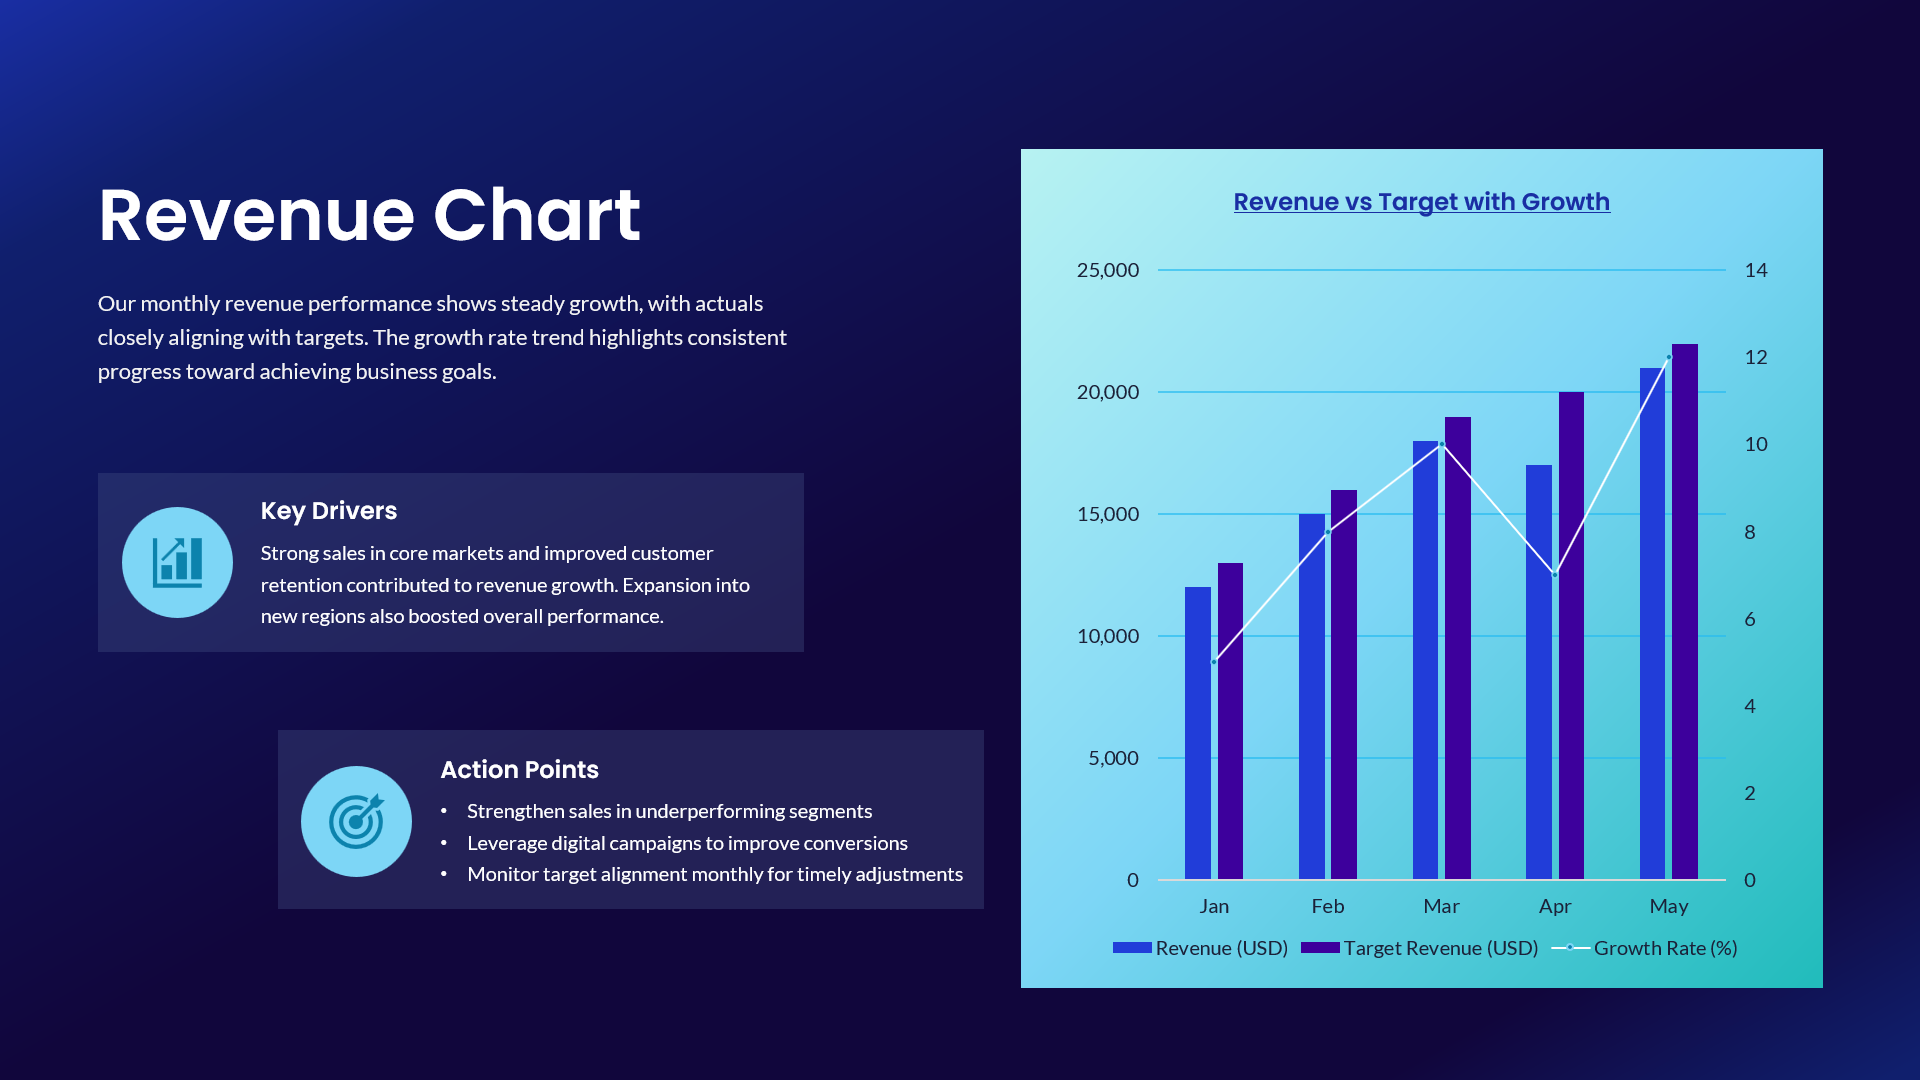
Revenue vs Target Growth Chart Template for PowerPoint & Google Slides
Revenue
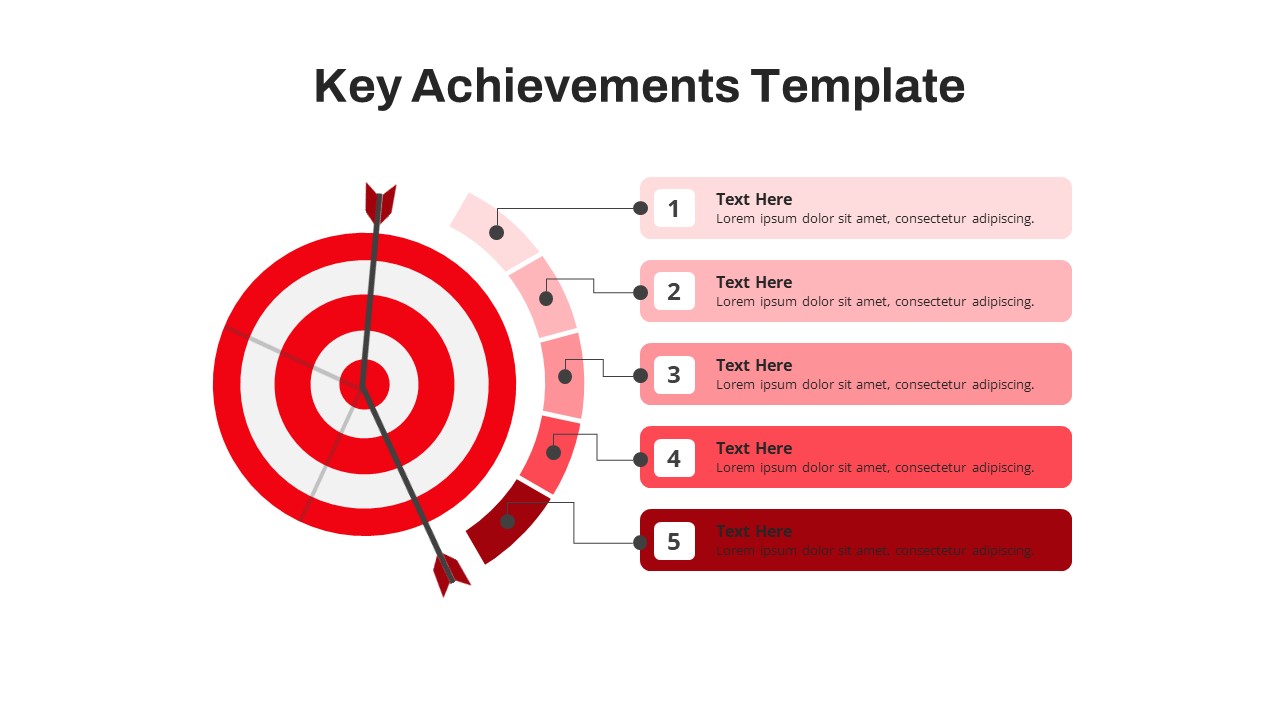
Free Key Achievements Template
Accomplishment
Free
4 Step Process PowerPoint & Google Slides Template for PowerPoint & Google Slides
Process