
- How does the fishbone diagram work?
- Ishikawa fishbone diagram examples for PowerPoint Presentation
- Fishbone Diagram Template PowerPoint and Keynote
- Fishbone Infographic PowerPoint Template
- Fishbone timeline template
- Fishbone Diagram Template
- Fishbone Template for PowerPoint Presentation
- Fishbone Template for PowerPoint
- Cause and Effect Diagram Template for PowerPoint and Keynote Slide
- Fishbone template for PowerPoint presentation
- Fishbone diagram PowerPoint template and keynote slide
- Fishbone Diagram PowerPoint Template
- Fishbone Diagram PowerPoint Template
- Fishbone diagram template for PowerPoint and Keynote Slide
- Kaizen PowerPoint Template Bundle
- Kaizen ppt template
- Fishbone diagram template for PowerPoint and keynote slide
- Fishbone diagram with multiple branches
- Fishbone template in PowerPoint arrow design
- Root cause analysis with semi-circle fishbone branches
- Fishbone diagram in dark background
- Cause and effect template for PowerPoint
- QC tool PowerPoint Template
- 6 M analysis template for PowerPoint and Keynote
20+ Ishikawa fishbone diagram examples you could use for your research presentation


Fishbone diagram is a visualization tool used for identifying and organizing possible causes of a problem or effect. Ishikawa fishbone diagram examples provide a plethora of PowerPoint templates to visualize research outcomes in the fishbone structure. It is used for root cause analysis since problem solutions lie down at the root of the problem.
How does the fishbone diagram work?
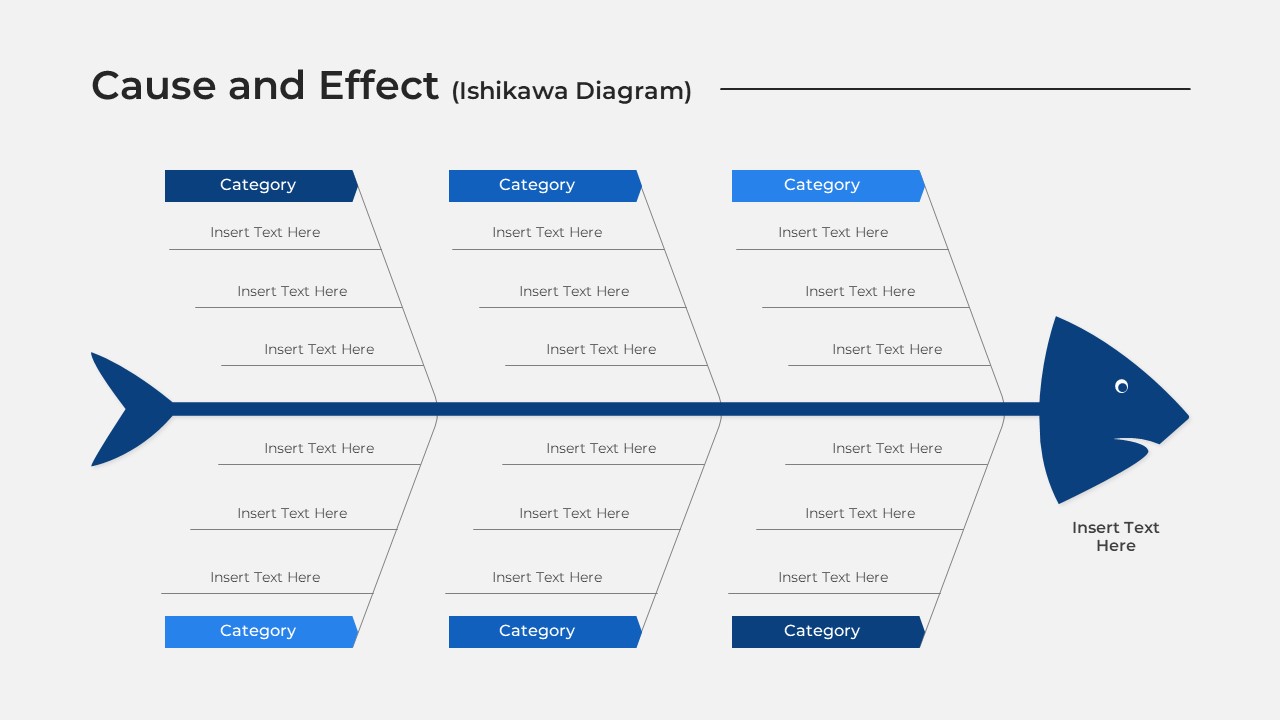
The fishbone diagram, also known as the Ishikawa diagram or cause-and-effect diagram, operates by visually organizing potential causes of a problem into various categories. It consists of a central horizontal line representing the problem, with diagonal lines branching off like the skeleton of a fish. These branches represent different categories of potential causes, such as people, processes, equipment, environment, and materials. Subsequently, each branch further subdivides into specific factors contributing to the problem. By systematically dissecting the issue into its underlying causes, the fishbone diagram facilitates comprehensive problem analysis and enables teams to identify root causes and develop effective solutions.
The use of Ishikawa fishbone diagram examples is associated with the research presentation. The main body of the fishbone represents the problem or effect while the small bone’s branching out represents different categories of potential causes. These categories typically include:
- Methods: Processes, procedures, or techniques involved.
- Machines: Equipment or tools used in the process.
- Materials: Raw materials, components, or substances involved.
- Manpower: People involved in the process, including their skills and training.
- Measurement: Metrics, standards, or methods of collecting data.
- Environment: Surrounding conditions, including physical, social, or cultural factors.
Given the widespread utility of fishbone diagrams across various industries, we’ve curated a selection of 20 + Ishikawa fishbone examples available for your convenience. Utilizing these templates streamlines the process, eliminating unnecessary clutter and enabling smoother analysis. With these resources at your disposal, you can efficiently dissect complex issues and explore potential causes with greater clarity and ease.
Ishikawa fishbone diagram examples for PowerPoint Presentation
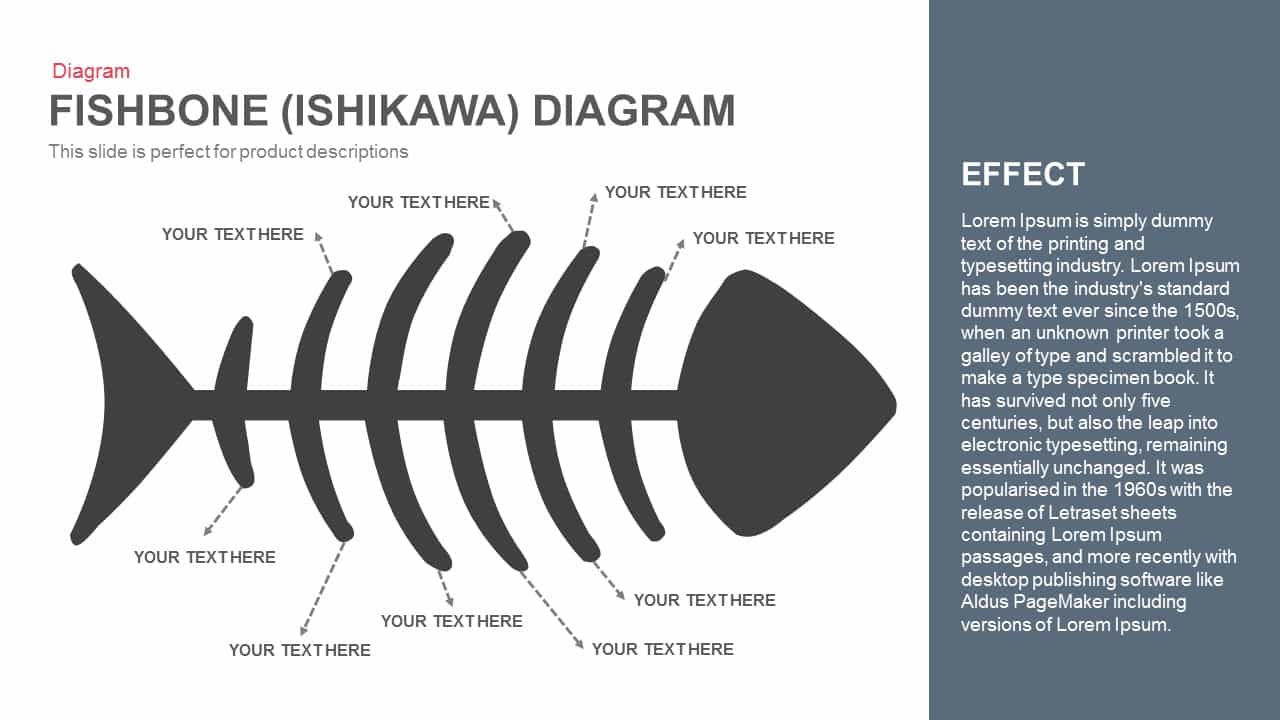
Fishbone Diagram Template PowerPoint and Keynote
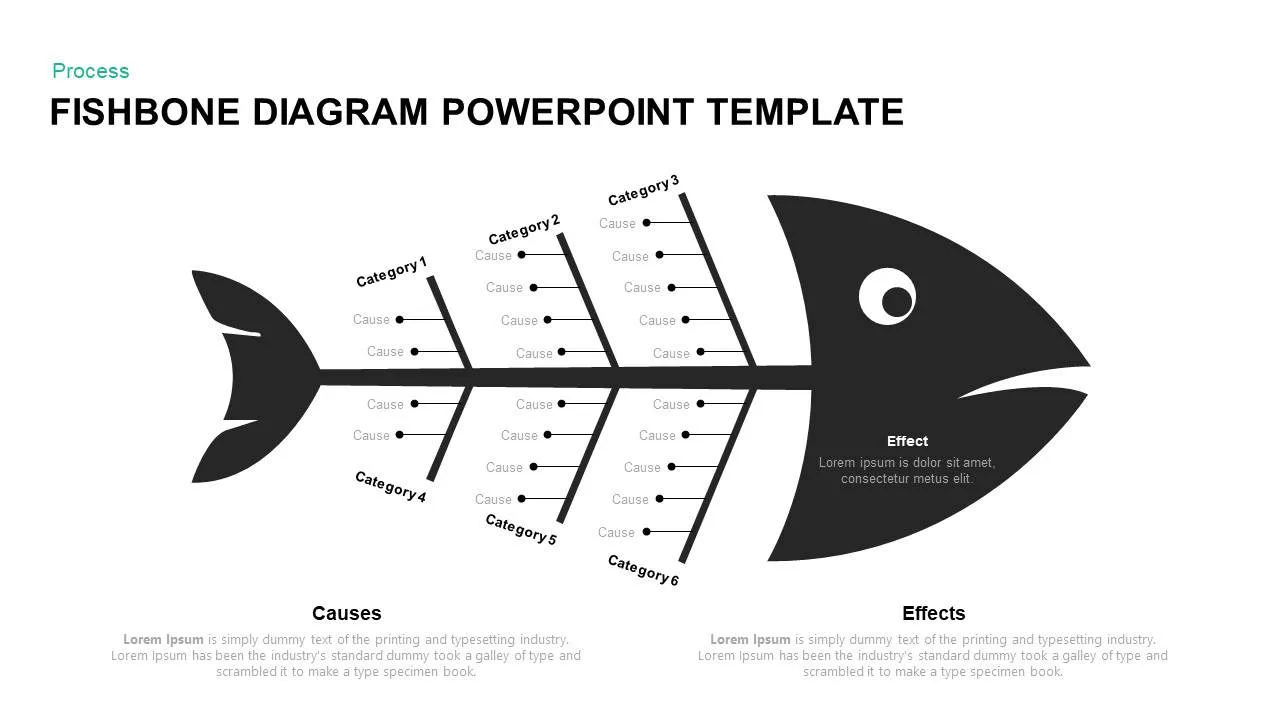
Use this enchanting fishbone template to display research statistics and inference. This is fish art with a spine, bones, and branches that easily enable you to present cause and effect. Here, the head and tail of the fish seem original, whereas the middle body shows its skeletons.
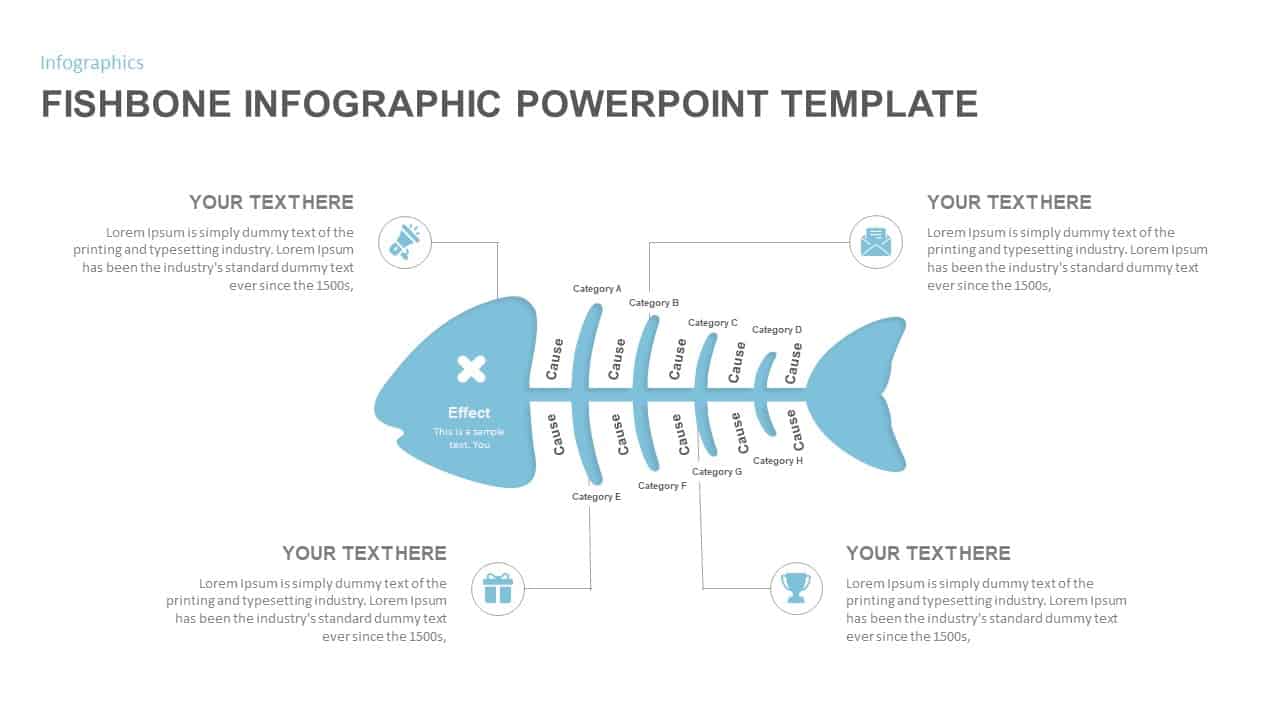
Fishbone Infographic PowerPoint Template
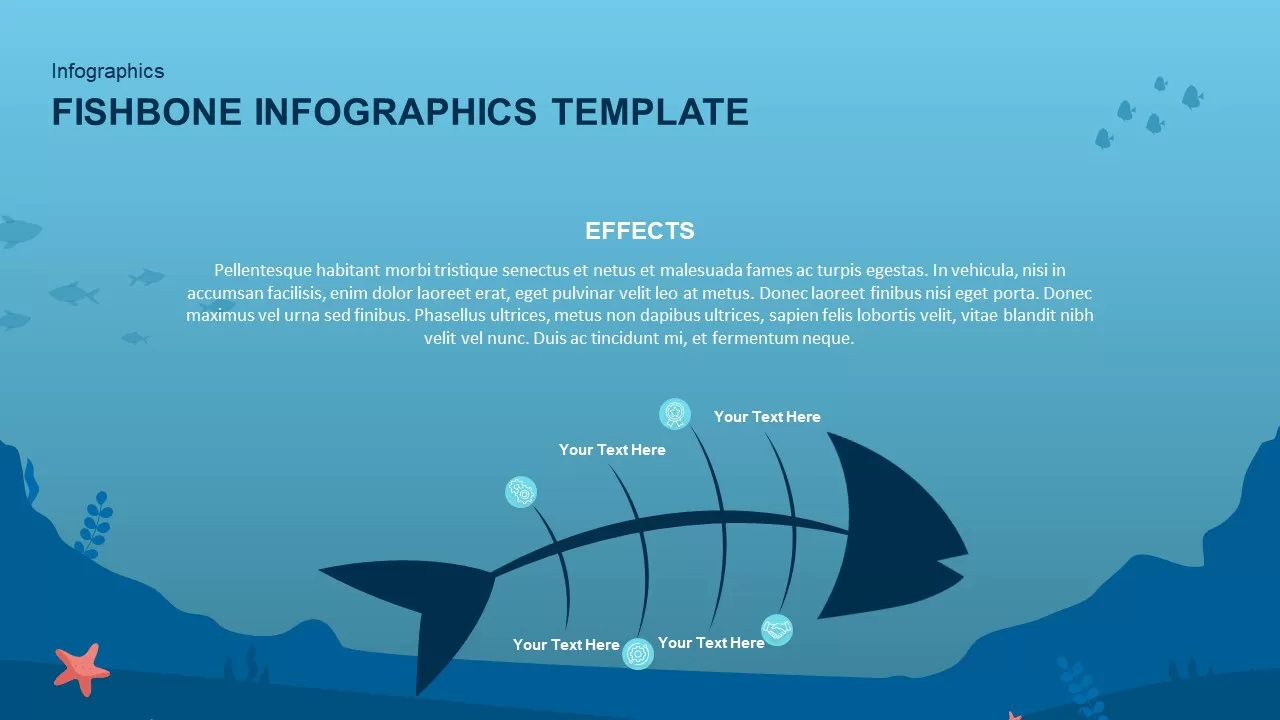
Outline the changes in your business with our deep blue sea fishbone diagram. This aesthetic creation ensures undivided attention with your root cause analysis presentation. it is created in a dark and light background and a fishbone under a blue sea. The presenters can show the effect on the head and cause in the bone.
Fishbone timeline template
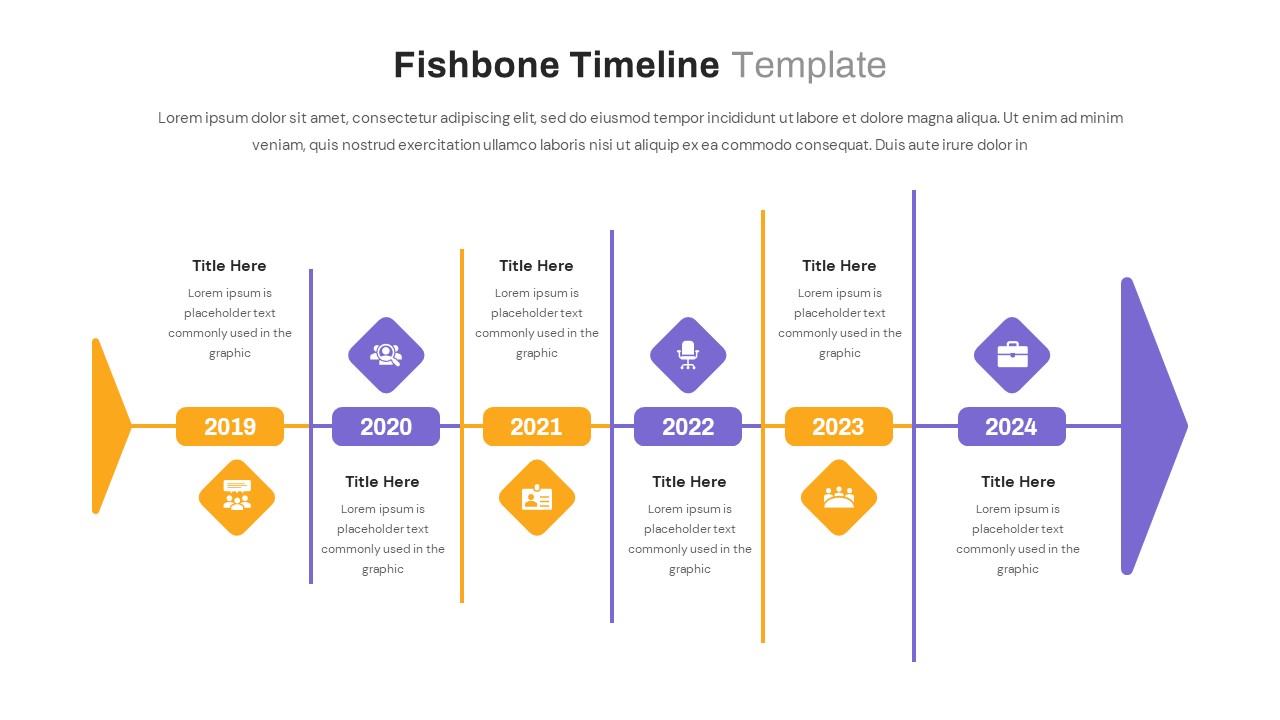
Create a sequential presentation using this fishbone timeline template. It helps organize cause and effects in a timeline fashion with its elements and shows how the causes create an effect. Besides, it can be used as an alternative timeline to overcome routine boredom. Insert your updates into this chronological fishbone.
Fishbone Diagram Template
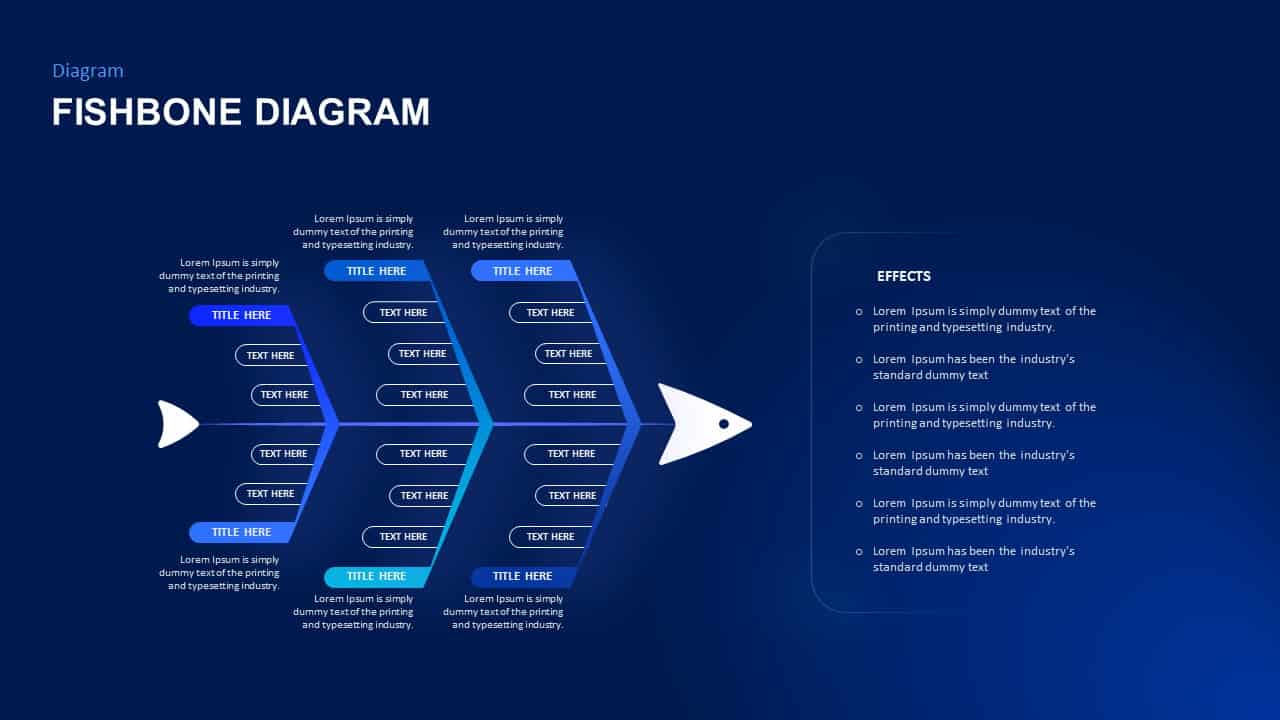
This fishbone template is enriched with text edit areas to denote problems and causes. This is an arrow PowerPoint fishbone with a sharp head and arrow tail. Each bone has sub-branches on either side. Besides, there is a separate column for showing the effects in bullet point text holders. The dark and light variant background in a bluish tone produces a natural sea backdrop.
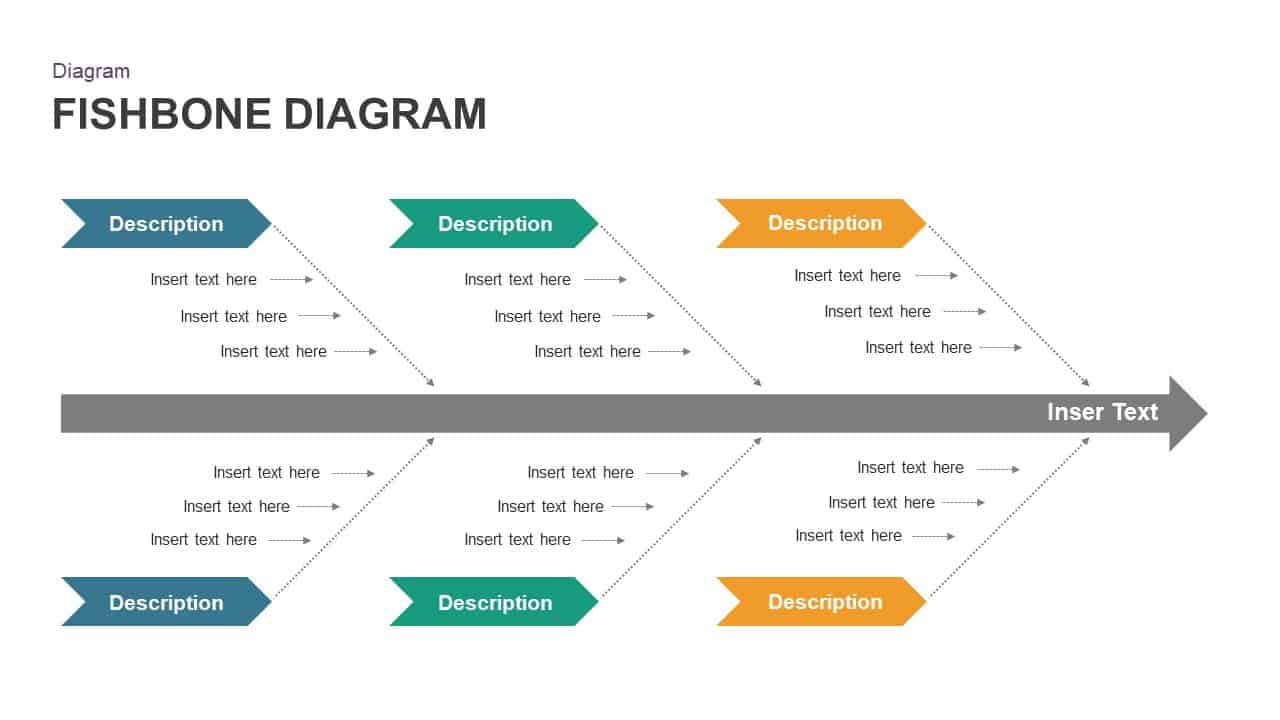
Fishbone Template for PowerPoint Presentation
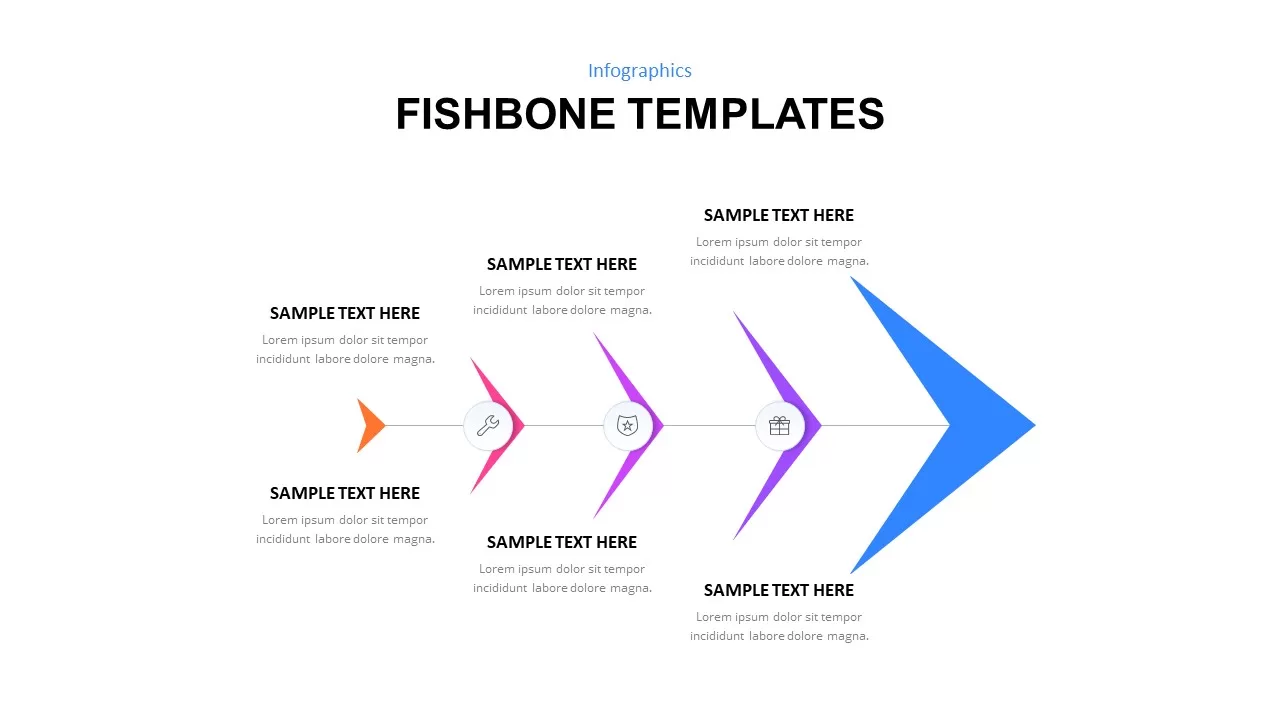
Insert your problem analysis using the chevron arrow fishbone design. This is a modulated fishbone with colored branches without sub-branches. Each branch has infographic icons to support your problem statement. You can show product marketing trends and product acceptance using this simple fishbone diagram.
Fishbone Template for PowerPoint
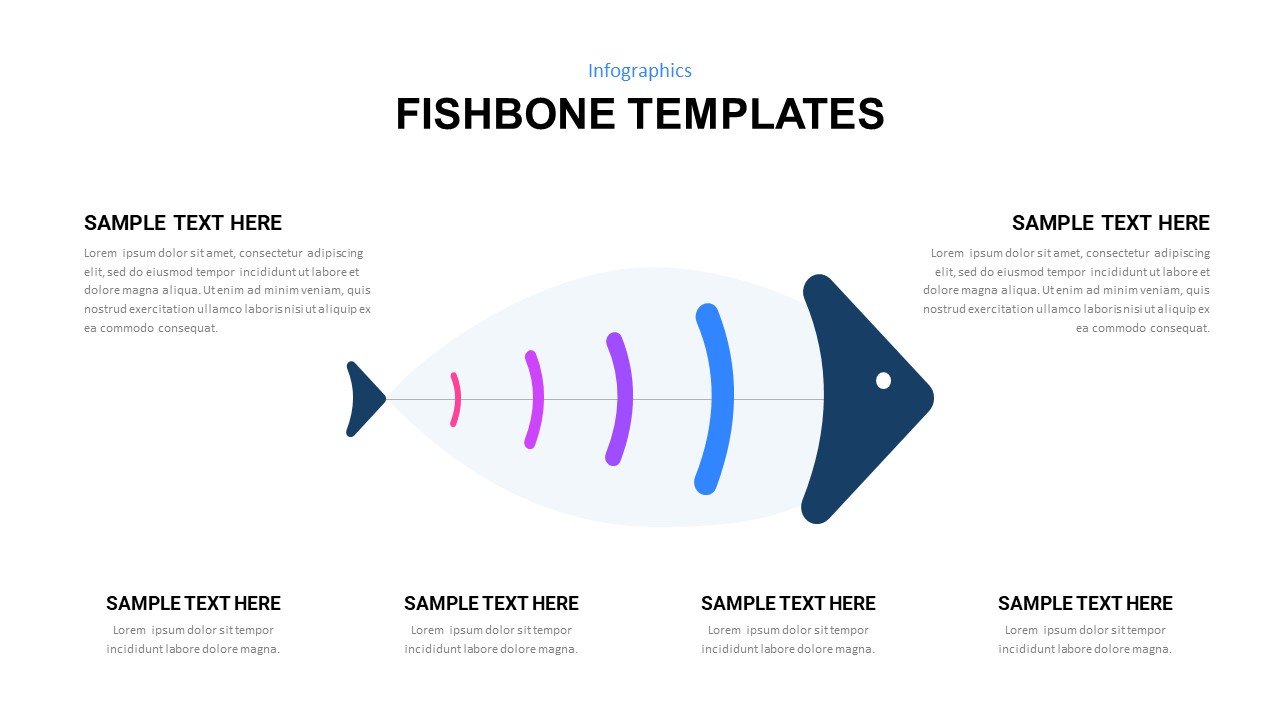
Categorize potential causes of a problem in an organized manner by employing this fishbone presentation diagram. It allows you to break the whole process into a simple slide design. This transparent fish shows its bones in shadow design with elaborate text zones.
Cause and Effect Diagram Template for PowerPoint and Keynote Slide
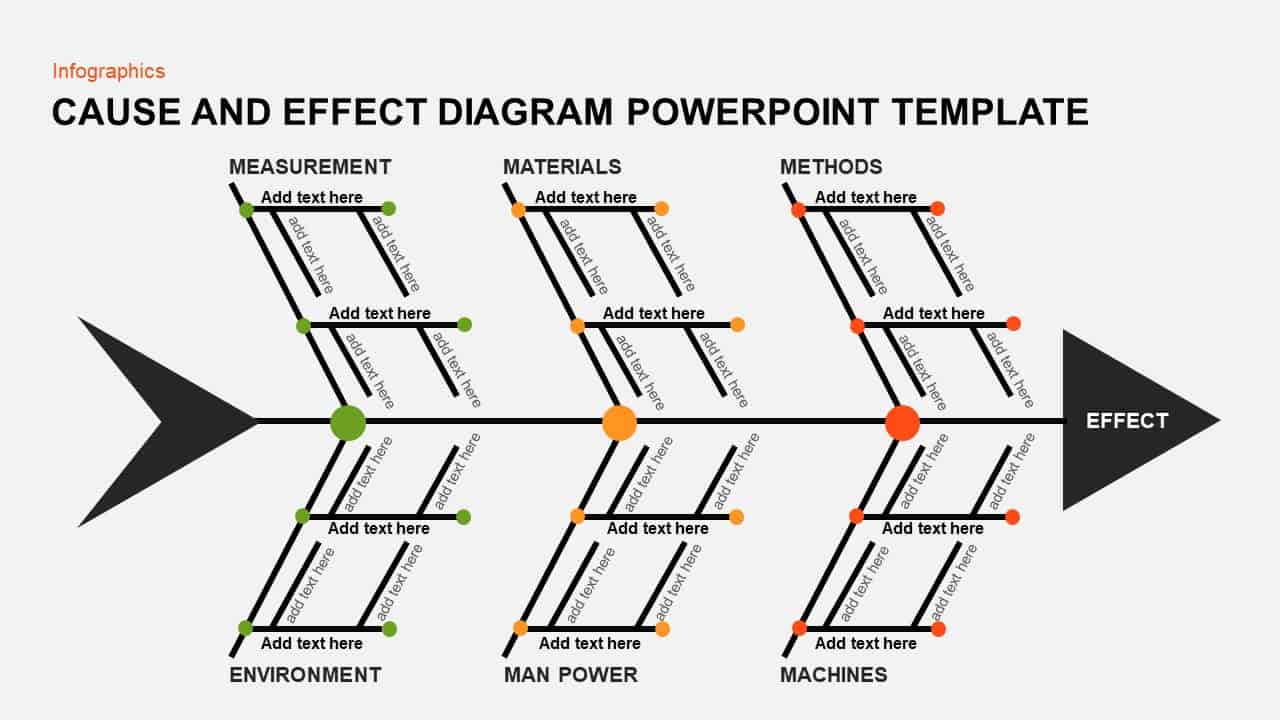
This cause and effect diagram is a complex creation to insert multiple causes and their sub-divisions in bones. Each bone spurts out vertical and parallel sub-bones to brief the problem statement. Once you identify the causes, you can insert it into the bone areas. You can categorize your causes into six and show the sub-variables in branches. The black and white diagram is filled with color spots to highlight each cause.
Fishbone template for PowerPoint presentation
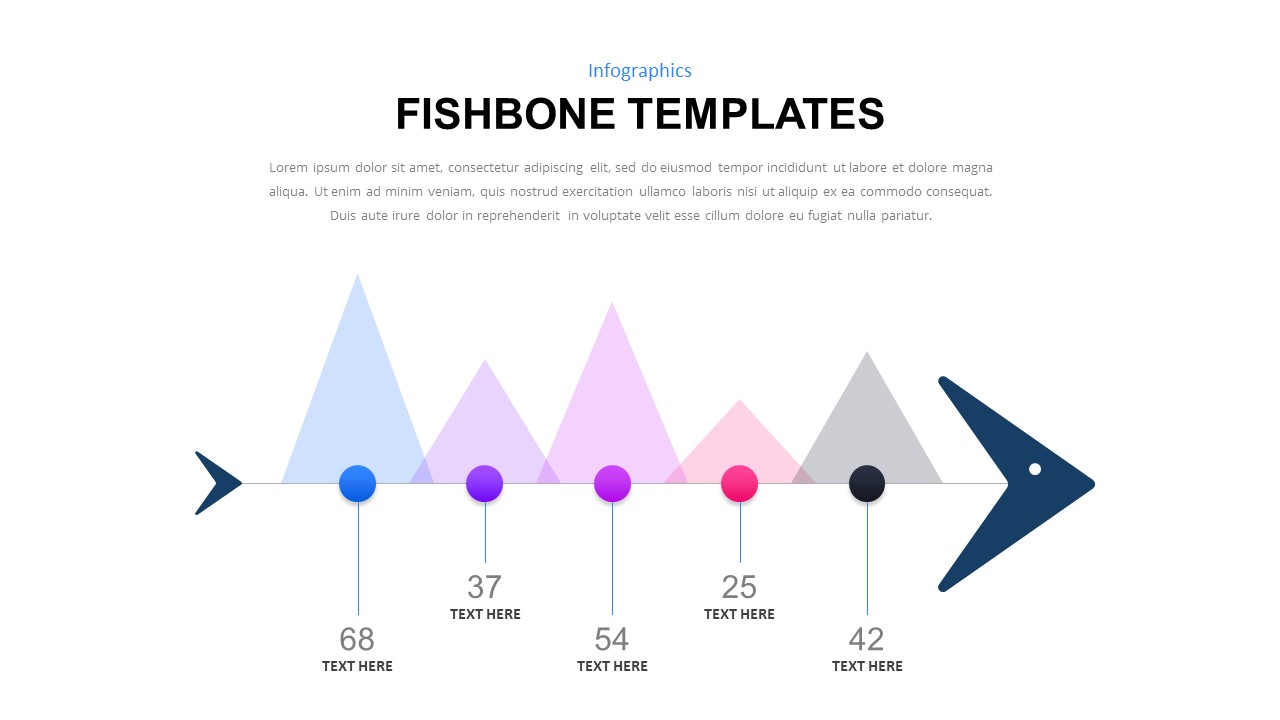
Use differently created fishbone PPT templates to show chase problems and causes. This is a creative fishbone made without typical bones. It’s like a metric slide to display the intensity of the causes in asymmetrical mountain graphs. This area chart-style fishbone diagram allows you to prioritize causes with mountain heights.
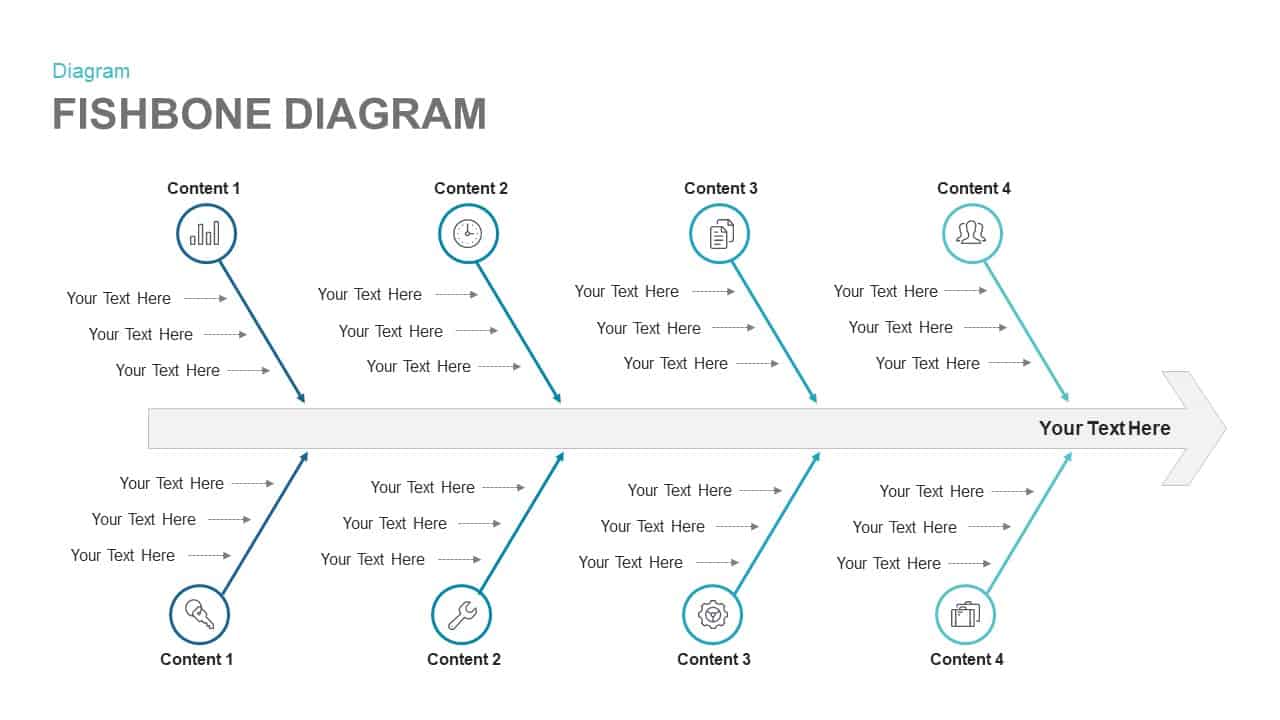
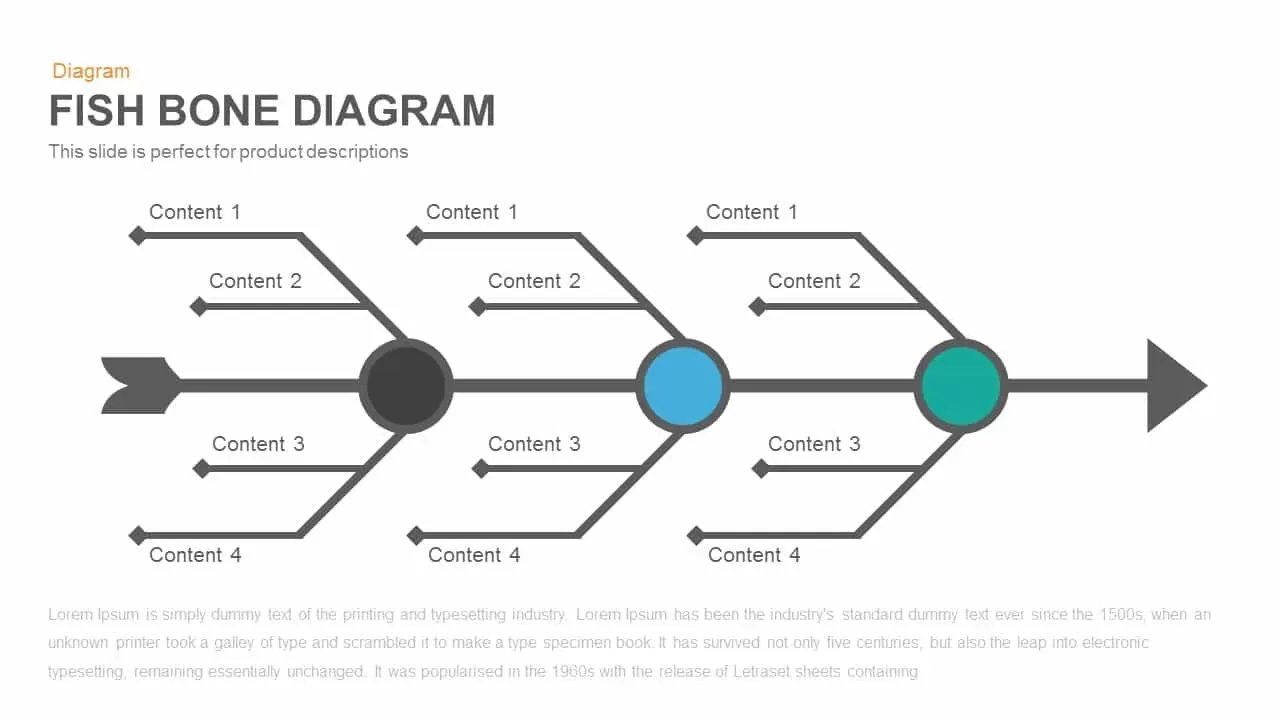
Fishbone diagram PowerPoint template and keynote slide
Create your problem statement elegantly with this bolded fishbone diagram template. It gives a straightforward view of your points with a 12-step presentation design. You can show causes on the bottom and top of each bone a detailed text area on the right-hand side. Trace your cause and suggest remedies with this visual fishbone chart.
Fishbone Diagram PowerPoint Template
Utilize the infographic fishbone diagram PowerPoint template to illustrate the logical connections of research findings. This fishbone PPT template offers a visually engaging design for presenting root cause analyses of problems. It is ideal for academic research institutes and business establishments to identify the logical connections within a phenomenon.
Fishbone Diagram PowerPoint Template
Classify various causes and visualize through a neat and clean fishbone ppt template. Utilize the fishbone diagram framework to pinpoint various bottlenecks impeding business operations across processes, equipment, personnel, materials, management, and environmental factors. Populate each branch with concrete reasons, easing conflict resolution within your team. Act now to streamline operations effectively.
Fishbone diagram template for PowerPoint and Keynote Slide
This PowerPoint keynote template adopts a fishbone structure, featuring a head, bones, and spine. Each bone symbolically unveils distinct causes, categorized accordingly. The fish’s head signifies the interconnected and interdependent effects of these causes.
Kaizen PowerPoint Template Bundle
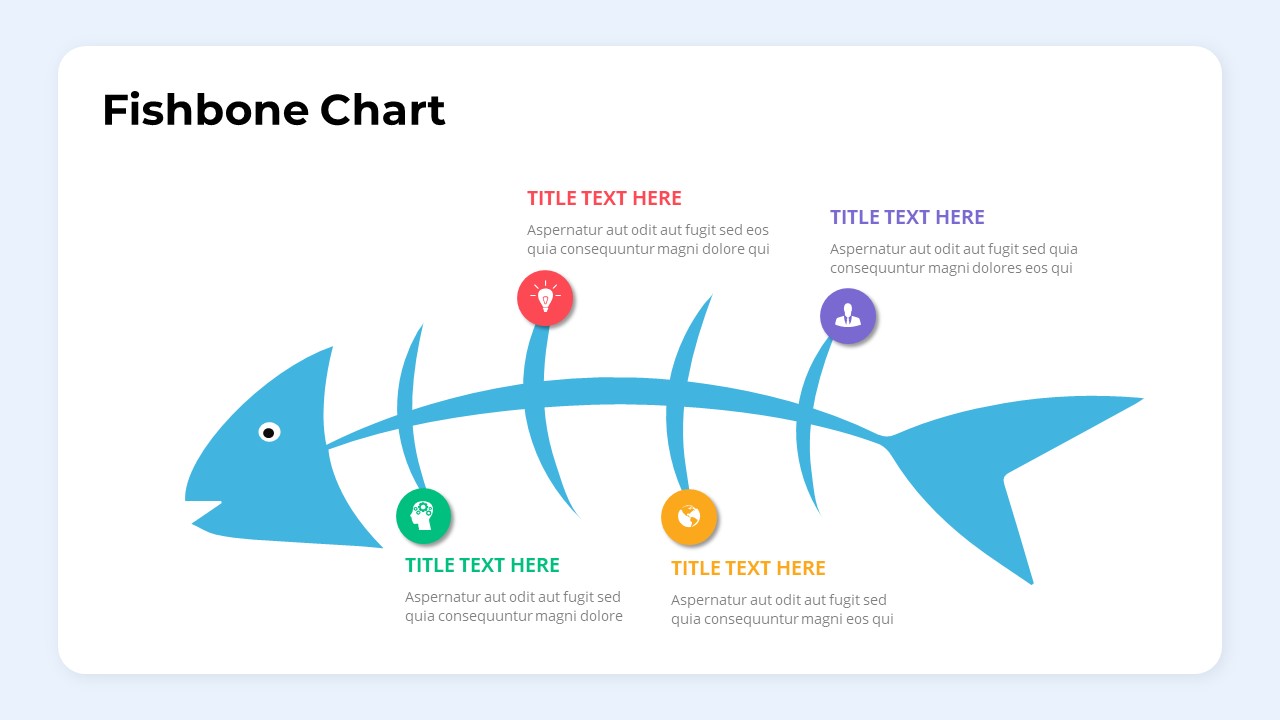
Choose the root cause analysis fishbone template from the Kaizen PowerPoint deck. The fishbone in the curved fish image presents four causes of an effect. The spine, head, tail, and bones are filled in blue color tones, while the infographic clipart is in red, green, violet, and yellow circles. This natural fishbone image ensures maximum audience participation.
Kaizen ppt template
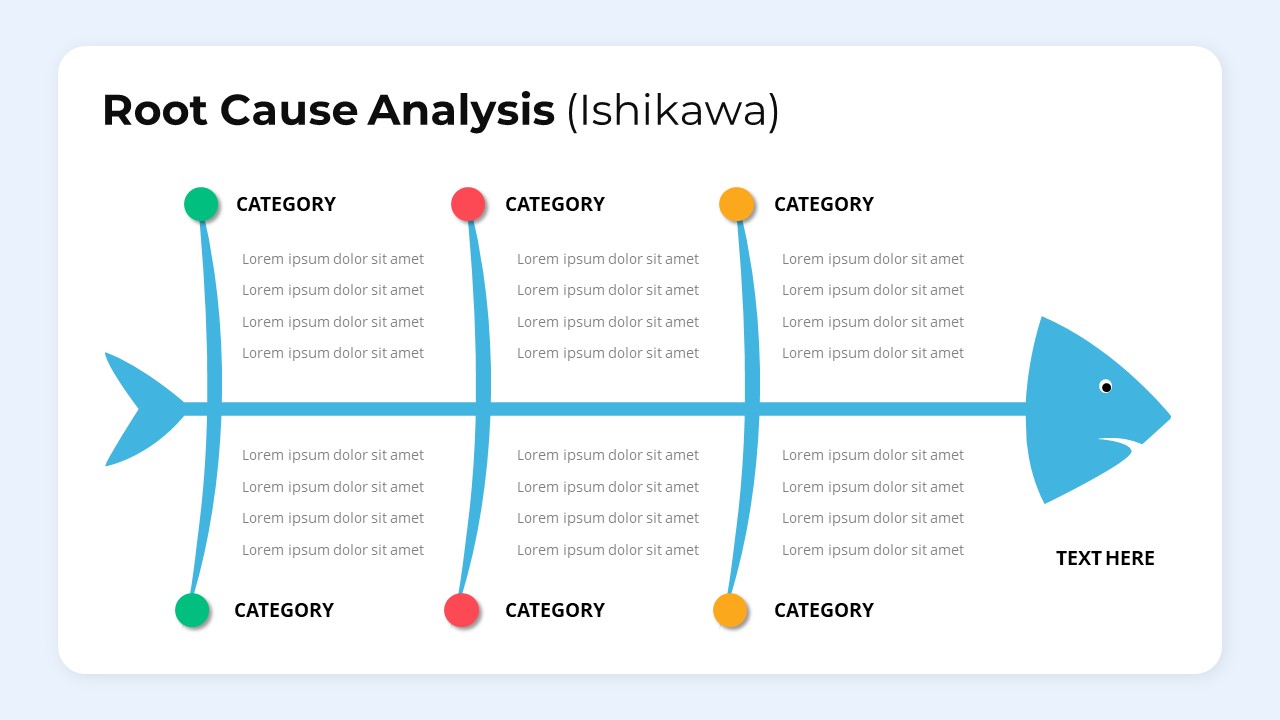
Research PowerPoint presentation needs creative diagrams to organize content in a logical sequence. This Ishikawa diagram presents six categories to show the causes behind an effect. Problem statements can be inserted in the head and causes can be shown on bones.
Fishbone diagram template for PowerPoint and keynote slide
This excellent PowerPoint template employs a fishbone structure to illustrate the generation of effects by multiple causes. The head signifies the impact, while the bones along the spine represent core issues, with subbranches enabling the inclusion of sub-causes. Download this professional fishbone example for versatile presentations.
Fishbone diagram with multiple branches
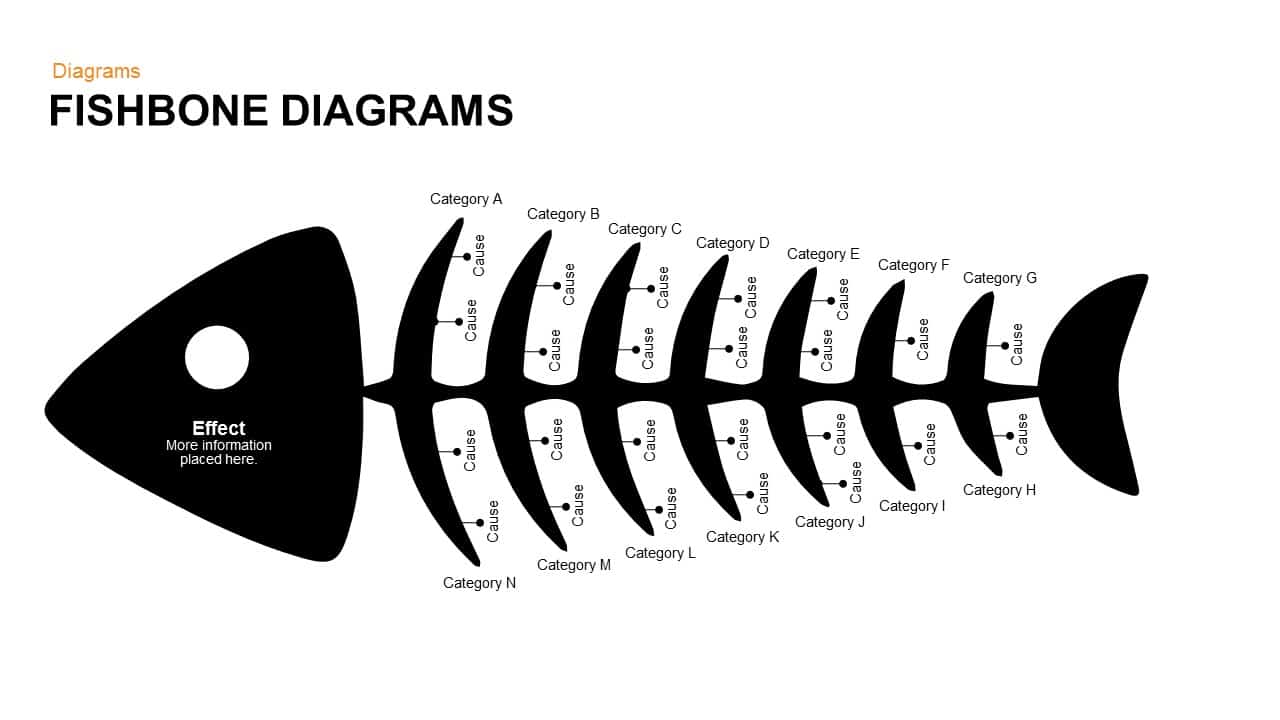
If you want a fishbone template to showcase multiple causes, this diagram perpetuates your topic through a single slide. It allows you to add 14 categories and 28 causes for your research presentation. Each bone symbolizes different causes categorized alphabetically. The head of the fish signifies that the effects of these diverse causes are interconnected and interdependent.
Fishbone template in PowerPoint arrow design
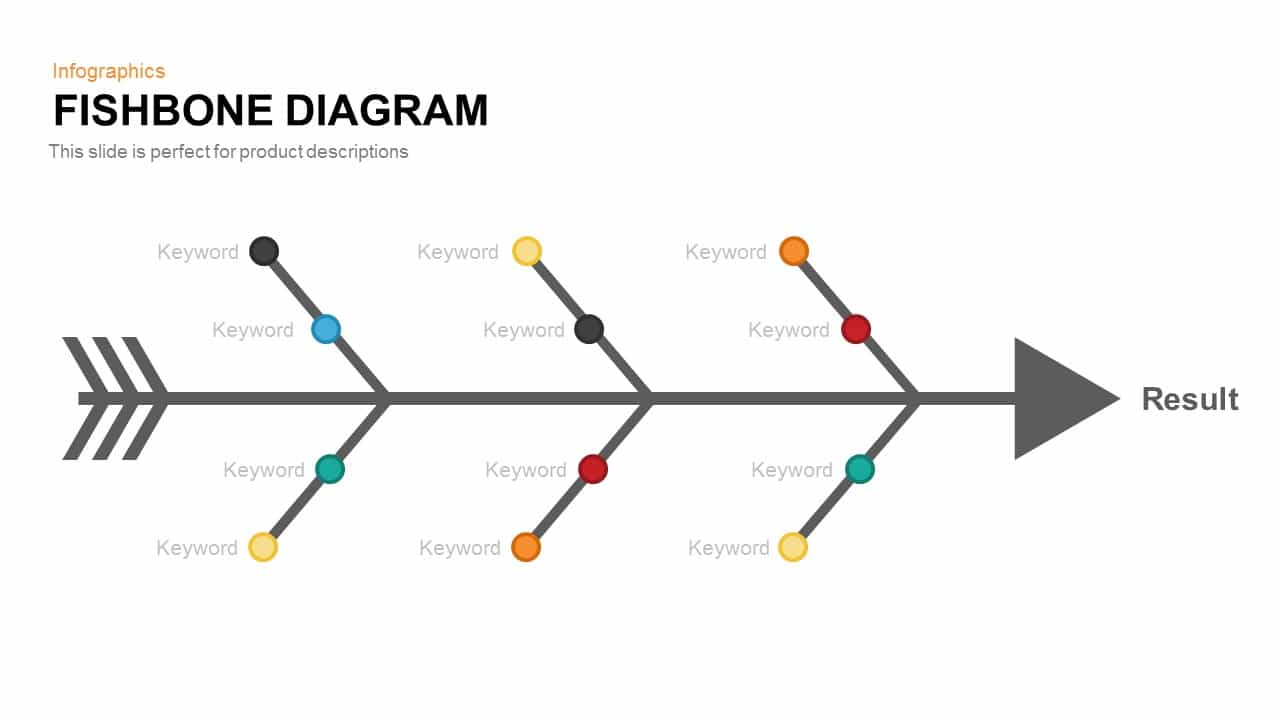
Illuminating branches of the fishbone design gives a distinct design for data presentation. The skeletal outline of a fish is illustrated with a horizontal arrow and three diagonal lines on each side of the arrow, denoting the proper structure of its bones.
Root cause analysis with semi-circle fishbone branches
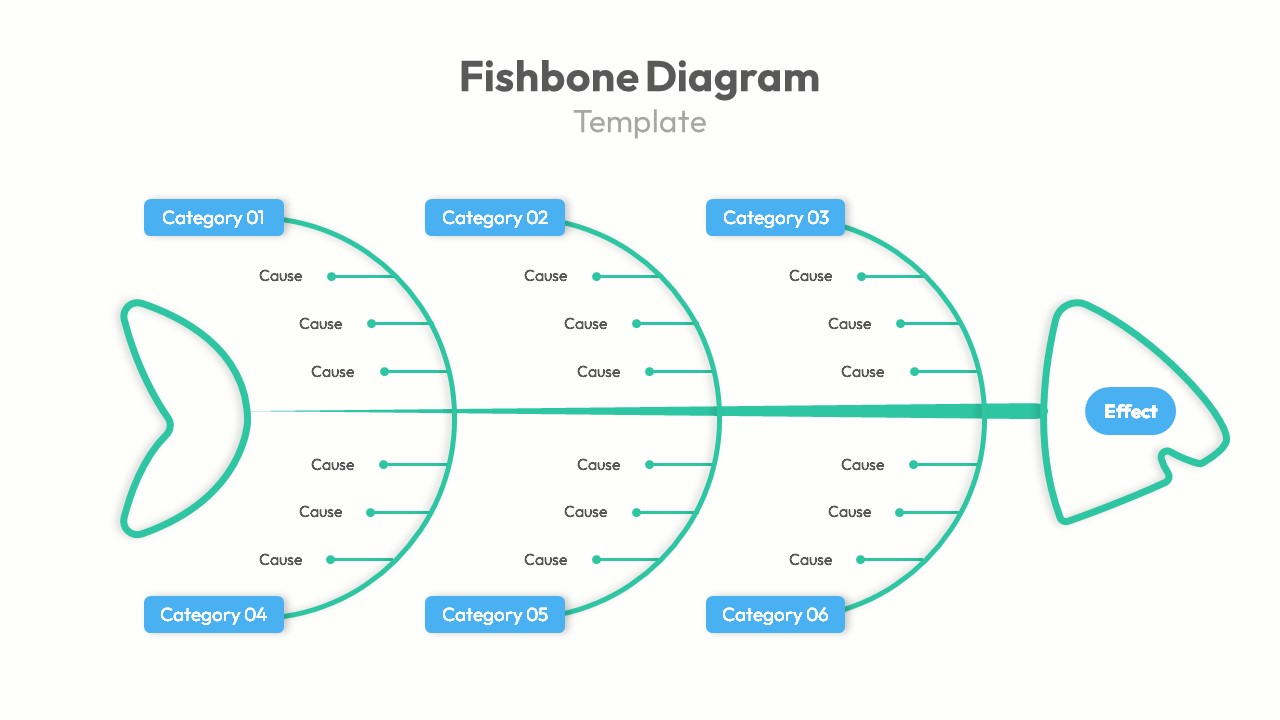
Structural changes in fishbone design can attract an audience with 100% participation. This root cause analysis diagram is a classy fishbone art with arched bones and a beautiful head and tail. The green and blue mix template allows the presenter to edit the entire structure using the PowerPoint edit menu.
Fishbone diagram in dark background
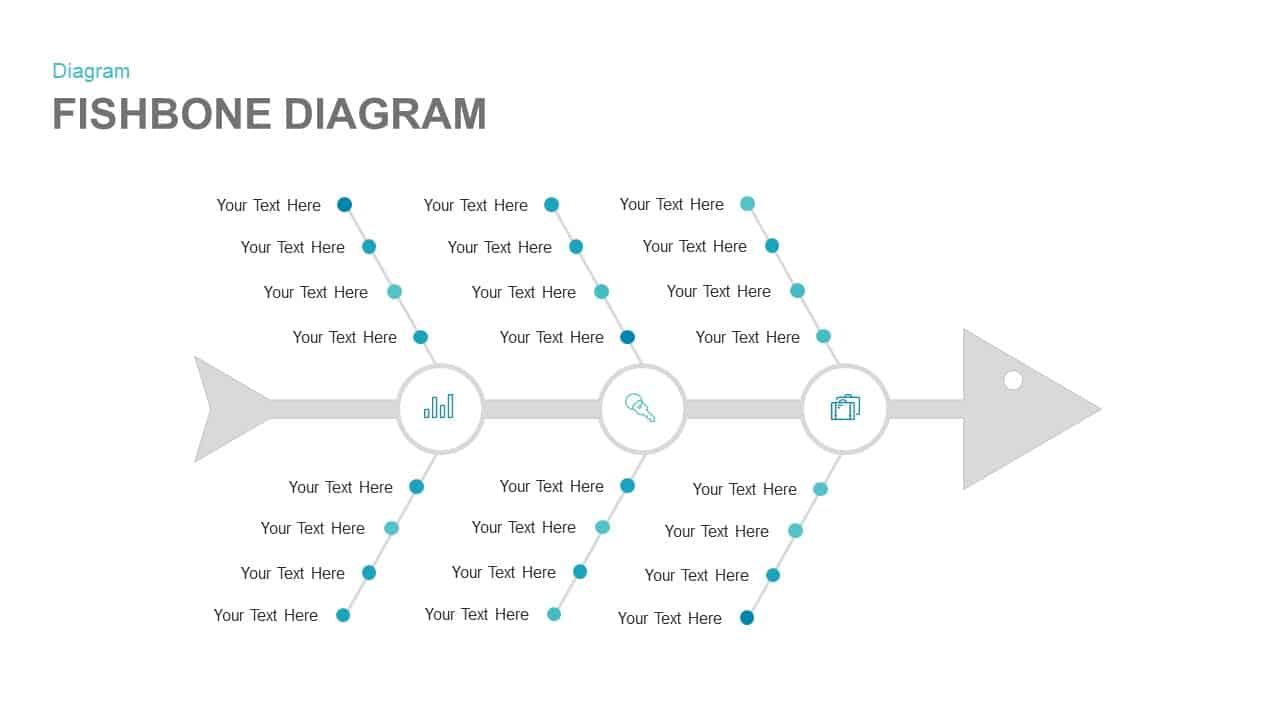
The template illustration, resembling a fishbone, comprises circles, straight lines, and arrowheads. Three circles are depicted along the spine arrow, with two branches extending from each circle, connecting on both sides. This pattern repeats for the other two circles, resulting in six branches on each side of the bone.
Cause and effect template for PowerPoint
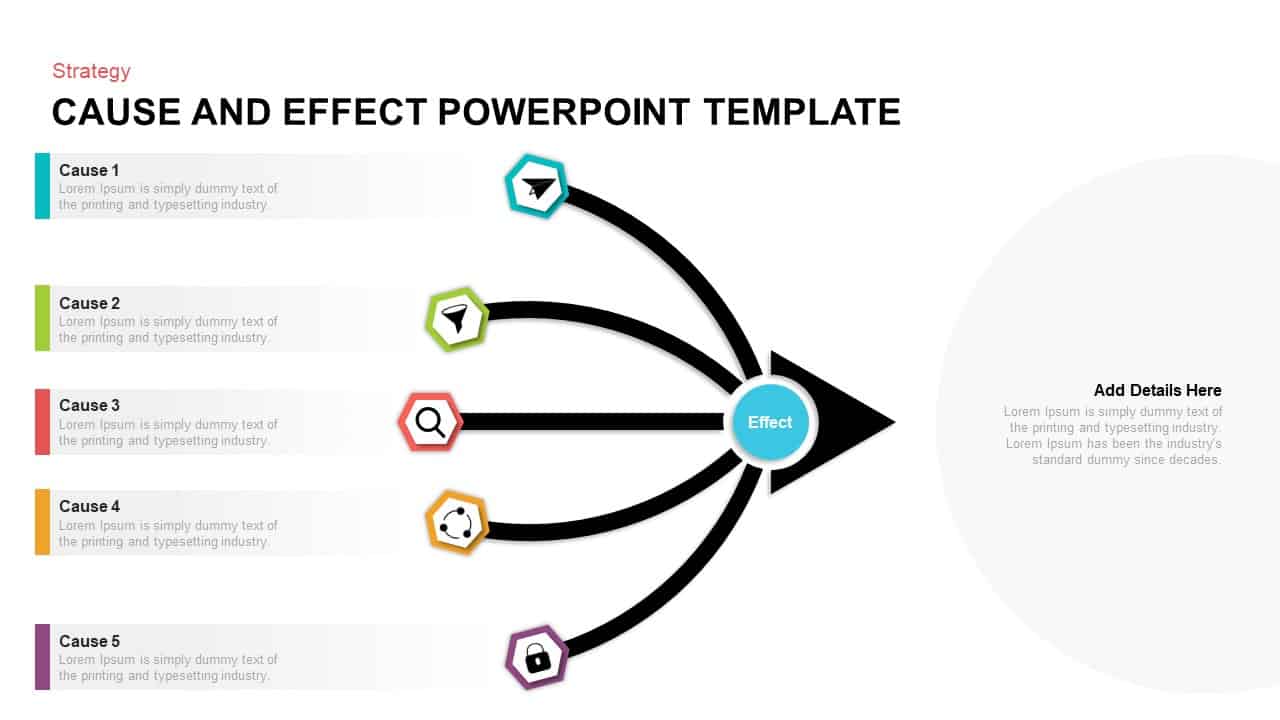
Another stunning design for cause-and-effect analysis. This PowerPoint presentation elegantly showcases multiple causes leading to a single effect. Users can employ this template for research endeavors that delve into the underlying logic of processes or effects on a broad scale. Use the detailed text description areas and symbolic infographic icons for a precise presentation.
QC tool PowerPoint Template
Fishbone diagram is a quality control tool. It visually represents potential causes contributing to a particular problem or outcome, aiding in identifying root causes for quality issues. By organizing factors into categories, it aids in thorough analysis and effective problem-solving in quality management processes.
6 M analysis template for PowerPoint and Keynote
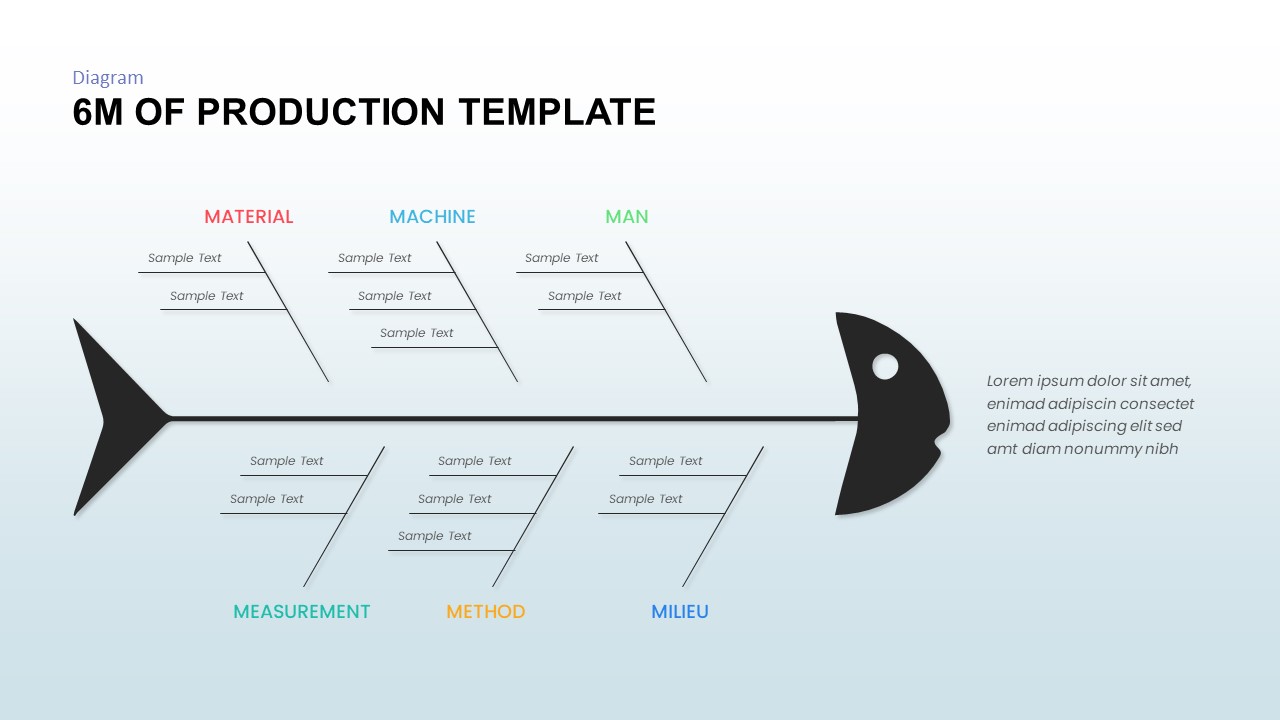
Use this fishbone template for 6M analysis. The bone is categorized as Material, Machine, Man, Measurement, Method, and Milieu. This template is perfectly suited for conducting 6M analysis within production and manufacturing contexts, aiding the identification of root causes behind issues.
No matter your industry, fishbone analysis would be a perfect tool to find out the root causes of a problem. You can download these Ishikawa fishbone diagram examples to inform all the contributing causes to your associates and stakeholders.
Related Articles
-
 October 28th, 2022
30 60 90 Day Plan for New Managers – Benefits, Uses, Examples + PPT Templates
Blog Post -
 April 30th, 2025
Best ‘About Me’ Presentation Templates to Introduce Yourself
Blog Post -
 May 10th, 2024
Top 10 Tips for Selecting Professional PowerPoint Templates for Marketing Presentations
Blog Post