
A Guide To Create Fishbone Diagram Template In PowerPoint


Have you ever faced a situation where you were unable to determine the root cause of a problem? It can be chaotic to brainstorm possible causes, and it can be frustrating to chase shadows to find the real offender. A Fishbone Diagram can help in this situation! This effective visual tool offers a methodical way to examine issues and pinpoint their root causes.
This guide will equip you with the knowledge to create your own fishbone diagram templates in PowerPoint, transforming messy brainstorming sessions into clear and actionable roadmaps for problem-solving.

What is a Fishbone Diagram?
A fishbone diagram, also known as an Ishikawa diagram or a cause-and-effect diagram, is an effective visual aid for identifying a problem’s root cause. Its name comes from its skeleton-like shape, which reduces possible causes to a simple, well-organized structure. With the primary categories of probable causes branching out like a backbone, the problem itself is positioned at the “head” of the fish. Smaller branches that represent particular reasons within each category emerge from these categories, which are together known as the 7Ms (People, Methods, Machines, Materials, Measurement, Environment, and Management) in the manufacturing industry.
This enables you to gradually dig deeper and find the fundamental causes of a problem. Fishbone diagrams have several benefits. Their graphic structure makes it easier to analyze potential reasons and brainstorm ideas. Through methodical investigation of many categories, you can probe further to identify the source of the issue—groups who have this increased understanding work together more effectively and communicate more effectively. In the end, figuring out the underlying reason gives you the ability to create more focused fixes and successfully handle the issue.
Step-by-Step Guide to Creating a Fishbone Diagram Template in PowerPoint
While PowerPoint doesn’t offer built-in Fishbone Diagram templates, fear not! Here’s how to create your own using readily available tools:
1. Launch PowerPoint and Create a New Slide: Begin by opening a new PowerPoint presentation and creating a blank slide.
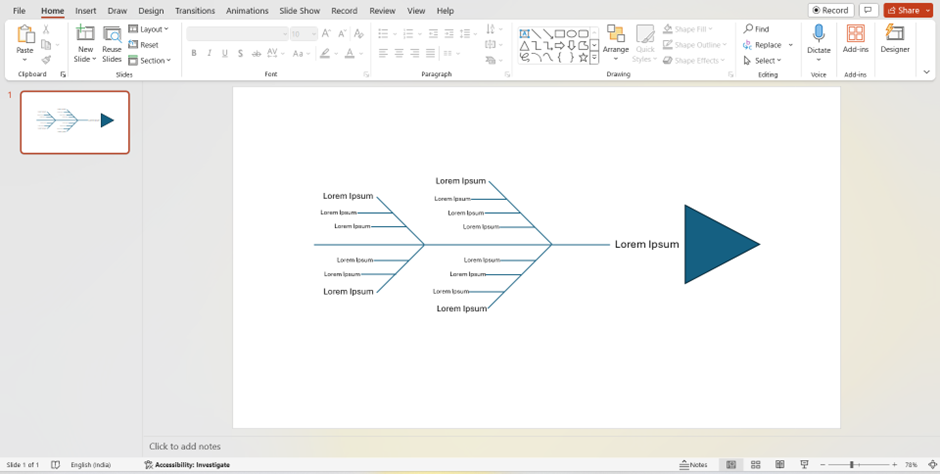
2. Draw the Fishbone Structure: Utilize the “Shapes” tool within PowerPoint. Use lines, arrows, and other shapes to construct the basic skeleton of the fish. Draw a horizontal line representing the backbone, with a triangle shape positioned at the right end signifying the “head” of the fish.
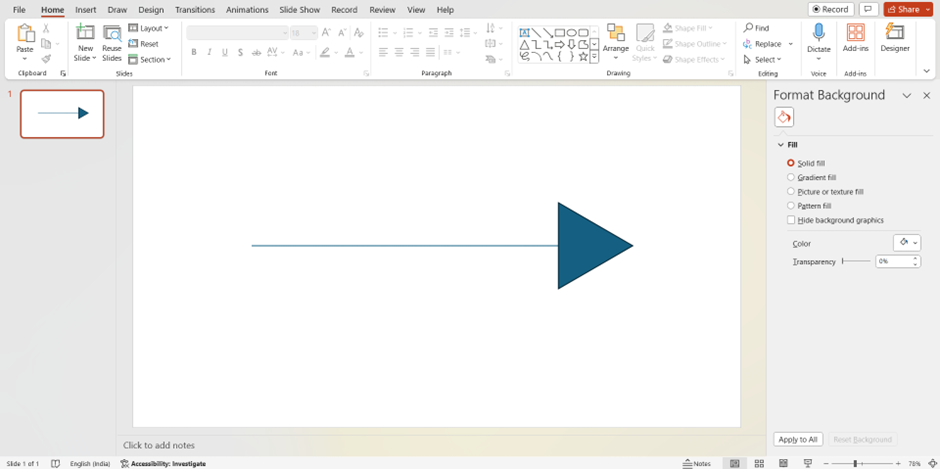
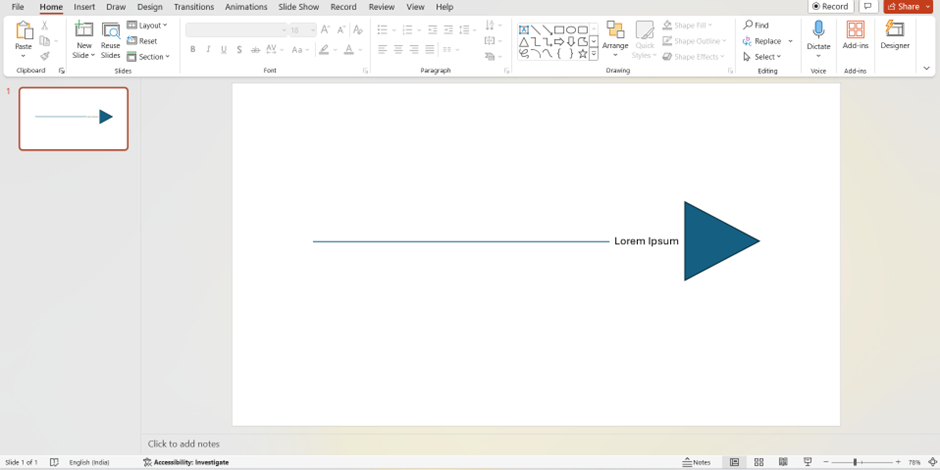
3. Define the Problem Statement: Insert text at the intersection of the vertical and horizontal lines (the “head”). Clearly define the problem you’re trying to solve within this text box.
4. Identify Main Cause Categories: Draw diagonal lines branching off the main backbone. These will represent your chosen categories of potential causes (e.g., People, Methods, Materials). Label each branch with its corresponding category using text boxes positioned near the backbone.
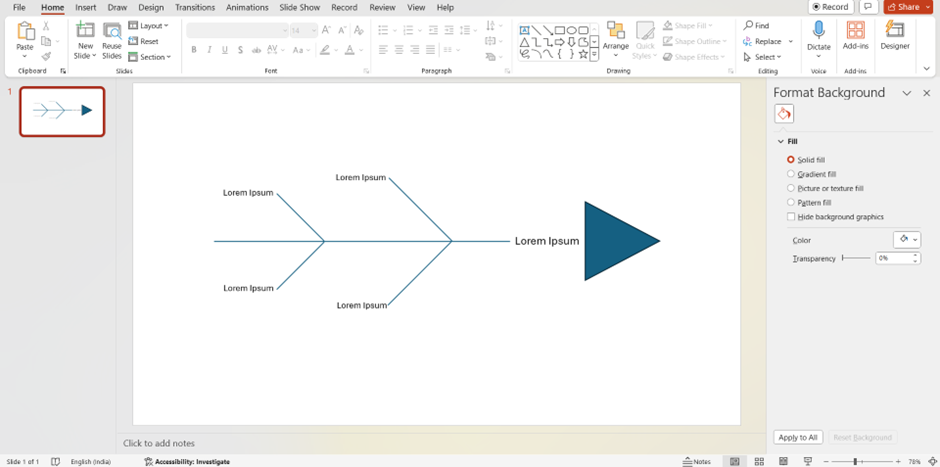
5. Brainstorm Specific Causes: Now comes the brainstorming part! Within each category branch, use smaller lines and texts to list specific causes that might be contributing to the overall problem. Encourage collaboration by involving others in this brainstorming process.
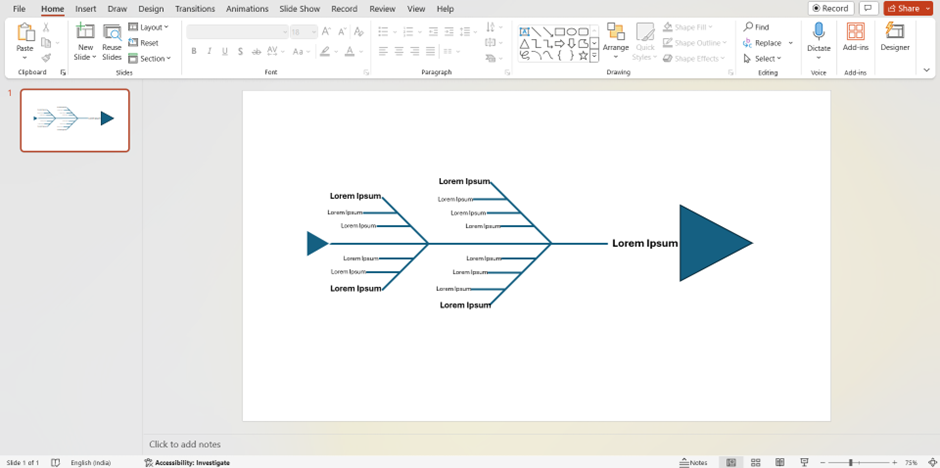
6. Customize and Enhance: PowerPoint offers a variety of formatting options. Use different colors, line styles, and fonts to differentiate between categories and sub-causes. You can also incorporate icons or symbols to enhance visual clarity.
7. Save Your Template: Once your Fishbone Diagram is complete, save the slide as a template for future use. This will save you time and ensure consistency when creating Fishbone Diagrams for various problems.
Try These Pre-Designed Fishbone PowerPoint Templates
Try these fishbone diagram templates for PowerPoint to demonstrate the versatility and provide a better idea of how to tailor the categories for multiple scenarios:
1. Fishbone Timeline Template
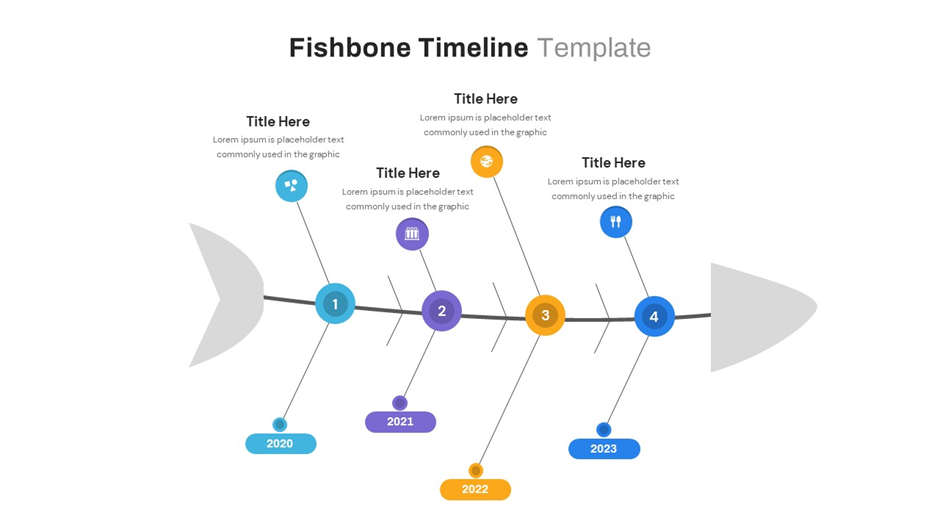
This fishbone timeline template provides two layout possibilities for showing a sequence of events and their underlying causes. The first pattern employs a horizontal chronology with events arranged in a line and causes connected diagonally, suggesting a fishbone. This is important for demonstrating cause-and-effect linkages between events across time. The second pattern is a classic fishbone diagram, which is normally used for problem-solving but has been altered to depict event chronology. This structure provides a better overview of all causes and effects. Both styles are excellent for planning and visualizing project timetables, which include important events, milestones, and potential barriers. It is available in black and white, with options for 6- or 4-step presentations, and may be customized in size, color, and shape.
2. Fishbone Template for PowerPoint Presentation
There are many use cases for fishbone templates like this, for example, marketing teams can use it to understand why a product’s sales are low. The diagram is editable and can be customized to fit the specific problem you’re facing.
3. Fishbone Infographic PowerPoint Template
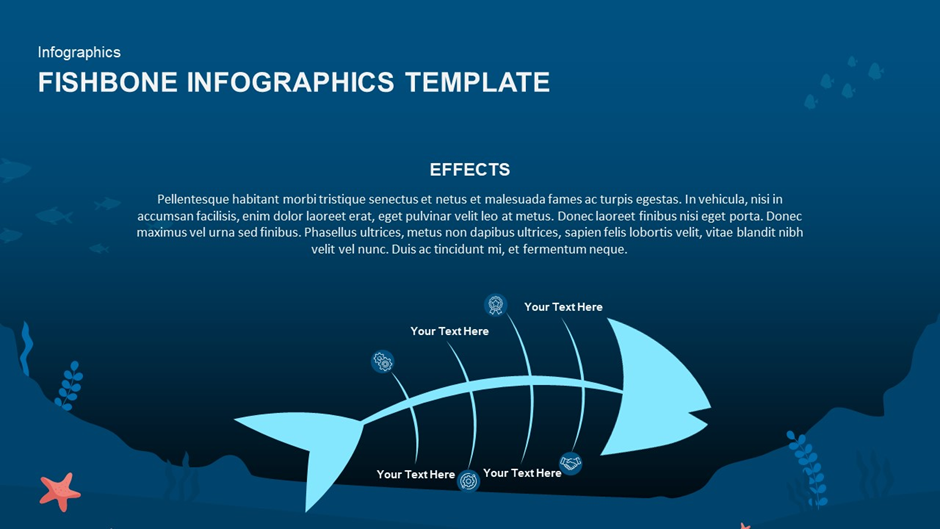
This is another fishbone template, that looks more like an actual fish bone, under the ocean. It can be used in presentations that need a little creativity, for example during a school presentation.
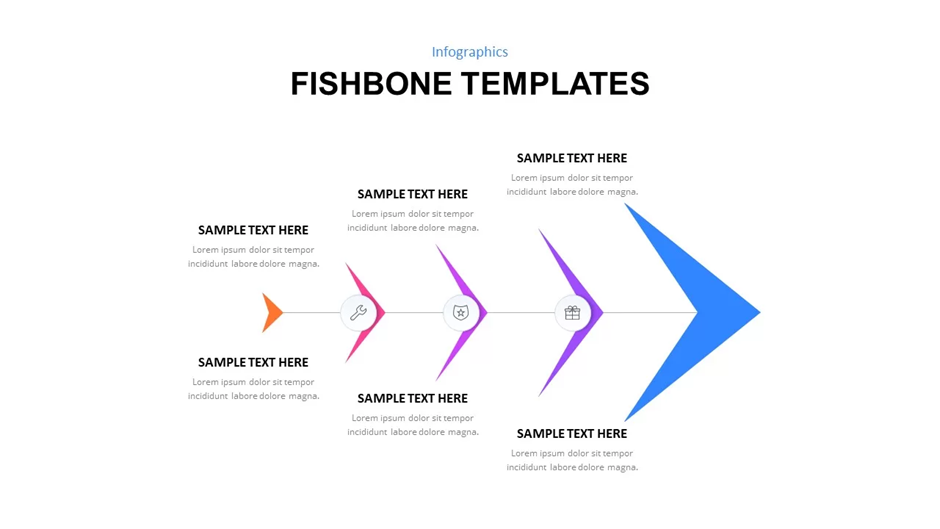
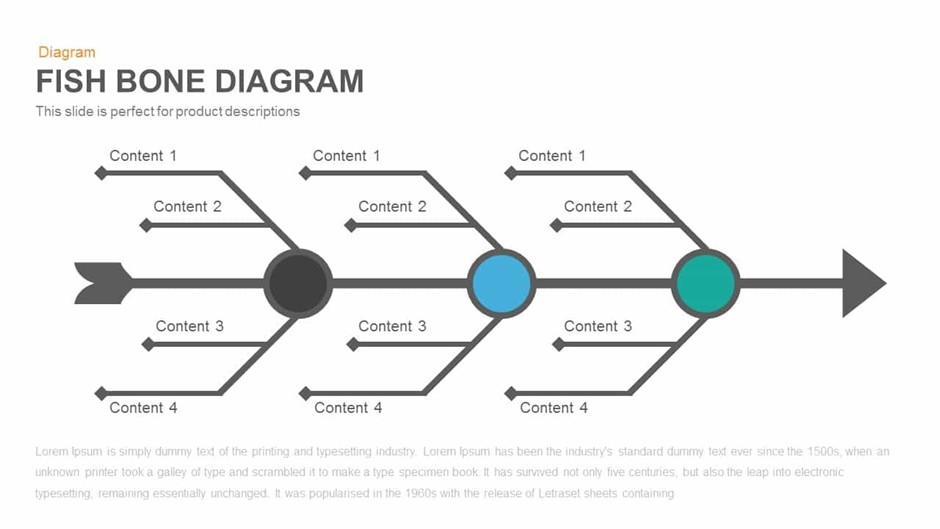
4. Fishbone Diagram Template for PowerPoint and Keynote Slide
This type of diagram is useful in various fields for identifying the factors that contribute to an event or phenomenon. It helps you understand the cause-and-effect relationships between variables and can be used to analyze complex data sets.
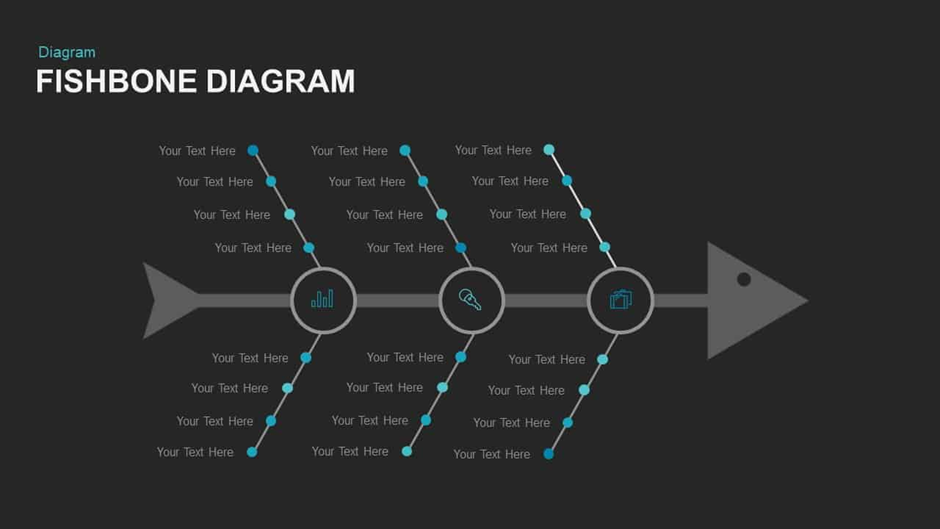
5. Fishbone Diagram PPT Template and Keynote Slide
This fishbone design allows you to see cause-and-effect linkages between different components. The template has many circles and branches where you may add text to represent various stages or concepts that lead to a single outcome. It can be utilized in a variety of situations, including managerial hierarchy presentations, assessing product-consumer relationships, and doing post-mortem analysis to discover core causes of problems.
Conclusion
By creating your own Fishbone Diagram template in PowerPoint, you empower yourself to break down complex issues into manageable components. The visual layout fosters clear communication and collaboration, allowing you to involve others in brainstorming potential causes.
You can also try pre-designed fishbone PowerPoint templates from SlideBazaar which will save you valuable time when encountering new problems. They are editable and easy to work with. Thus, the next time you encounter a complicated problem, don’t allow the root cause to elude you. Accept the ability of fishbone diagram templates! Problem-solving can be turned from a tedious to a clear and confident route toward the solution by utilizing its visual structure and systematic methodology.
Related Articles
-
 June 12th, 2024
How to Use Sections in PowerPoint
Blog Post -
 August 30th, 2022
How to Crop a Picture in PowerPoint
PowerPoint How To -
 December 11th, 2023
PowerPoint Tips You Should Know in 2026
Blog Post