Use of Funds Donut Chart Infographic Template for PowerPoint & Google Slides


Description
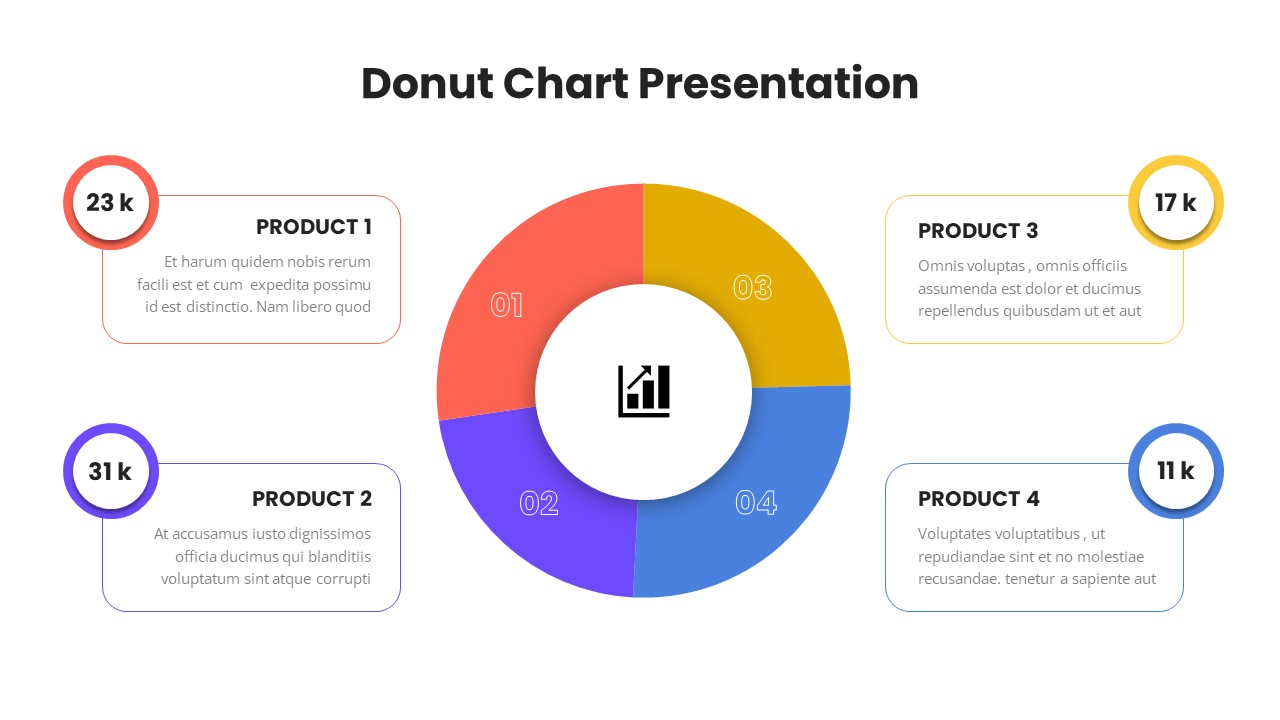
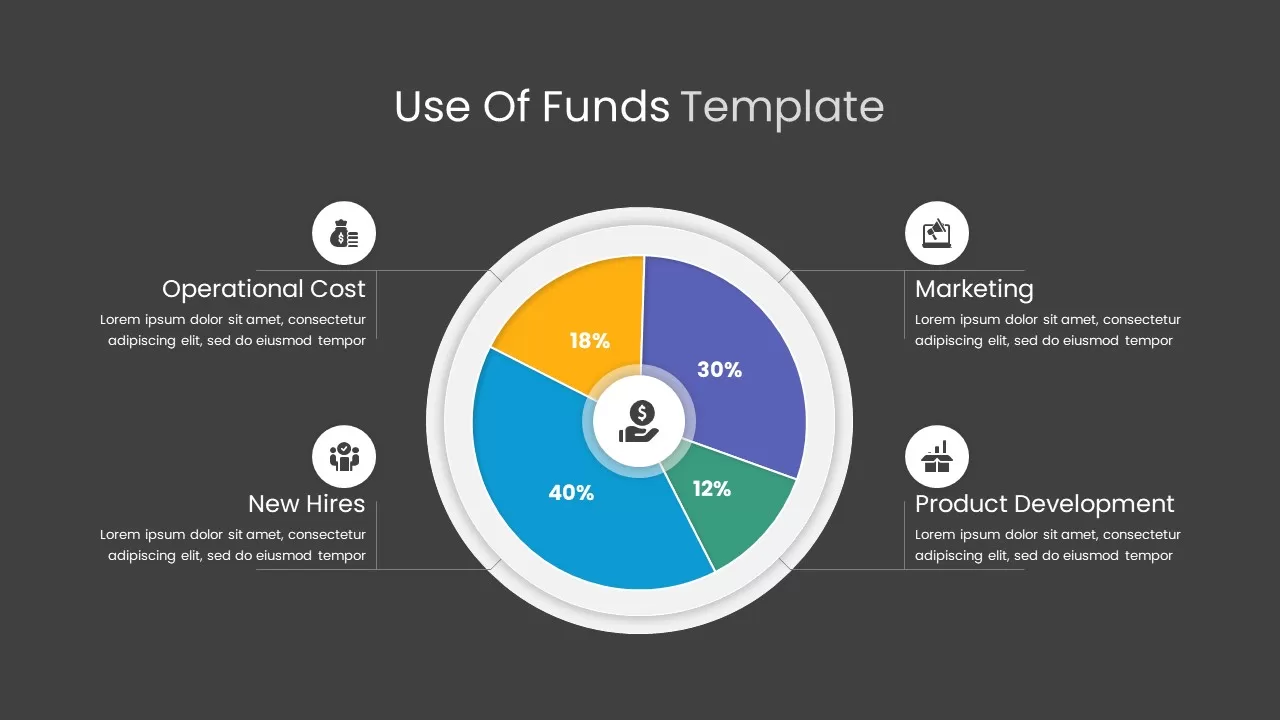
Effortlessly illustrate budget distribution with this use-of-funds donut chart slide, enabling audiences to grasp allocation at a glance. A central circular infographic features four vividly colored segments—new hires (40%), marketing (30%), operational costs (18%), and product development (12%)—each with clear percentage labels. Connector lines link slices to text blocks and icon placeholders, offering contextual details that reinforce financial insights.
Built on fully editable master slides, every element can be customized in seconds without disrupting layout harmony. Swap icons by dragging and dropping new graphics, update segment labels in-line, and apply brand-specific color swatches using the built-in palette. Auto-align guides, grouping features, and locked layers ensure consistent spacing and alignment when you reposition or resize segments, preserving the slide’s professional aesthetic through rapid iterations.
Optimize audience engagement with preset entrance and emphasis animations that sequentially reveal each chart segment or connector line. High-resolution vector assets maintain crisp visuals across large-format displays, local projectors, and remote-call screens. The slide automatically preserves alignment and formatting between PowerPoint and Google Slides, eliminating version-control issues and export errors. Seamlessly scale the infographic for print collateral or dashboards without quality loss, thanks to fully vector-based design.
Whether you’re presenting venture capital allocations, departmental budgets, or nonprofit funding proposals, this use-of-funds donut chart provides a clear, compelling framework for financial storytelling. Leverage the versatile layout for quarterly reports, board meetings, or investor pitches, and adapt the slide’s modular segments to suit any funding scenario in seconds.
Designed for versatility, you can quickly add or remove segments to match any number of cost centers, export the infographic for executive summaries, or integrate it into broader pitch decks seamlessly.
Who is it for
Financial analysts, CFOs, and budgeting teams will benefit from this slide when presenting fund allocation, departmental spending, or capital deployment plans. Startup founders, nonprofit directors, and board members can also leverage it to communicate resource distribution and funding priorities.
Other Uses
Repurpose this infographic for expense breakdowns, revenue source analyses, grant distribution maps, or campaign budget overviews. Use the circular framework to depict market share, resource allocation, or performance metrics in any business context.
Login to download this file

Item ID
SB02303
Related Templates

Eight Section Donut Chart Infographic Template for PowerPoint & Google Slides
Pie/Donut
Premium

30-60-90 Day Donut Chart Plan Infographic Template for PowerPoint & Google Slides
Timeline
Premium
Donut Chart template for PowerPoint & Google Slides
Pie/Donut
Premium
Donut Chart template for PowerPoint & Google Slides
Pie/Donut
Premium
Donut Chart Split Template for PowerPoint & Google Slides
Charts
Premium
Success Key Diagram with Donut Chart Template for PowerPoint & Google Slides
Pie/Donut
Premium
Cost Reduction Strategy Donut Chart Template for PowerPoint & Google Slides
Pie/Donut
Premium
Donut Chart Data Breakdown template for PowerPoint & Google Slides
Pie/Donut
Premium
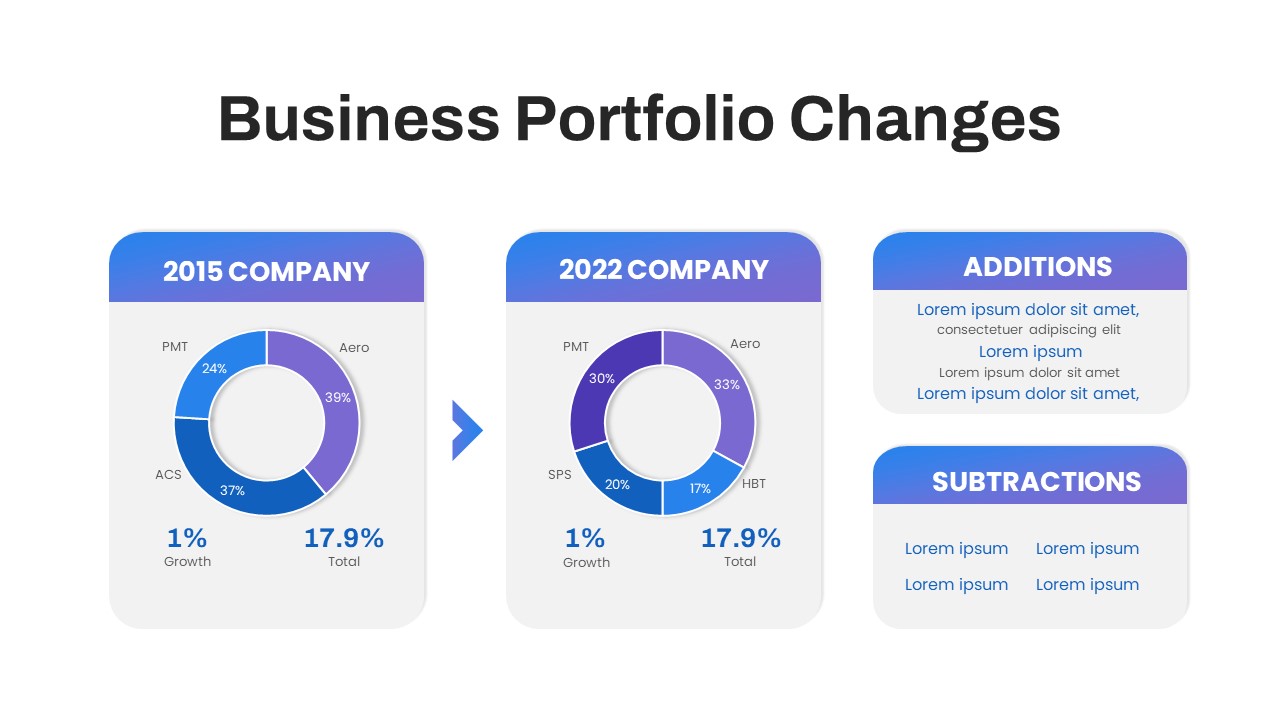
Business Portfolio Changes Donut Chart Template for PowerPoint & Google Slides
Pie/Donut
Premium
Technical Skills Donut Chart Overview Template for PowerPoint & Google Slides
HR
Premium
Marketing Budget Allocation Donut Chart Template for PowerPoint & Google Slides
Marketing
Premium
Donut Chart for PowerPoint & Google Slides
Pie/Donut
Premium
Donut Chart for PowerPoint & Google Slides
Pie/Donut
Premium
Donut Chart for PowerPoint & Google Slides
Pie/Donut
Premium
Donut Chart Presentation for PowerPoint & Google Slides
Pie/Donut
Premium

Comparison Donut Chart PowerPoint Template and Keynote
Pie/Donut
Premium
Donut Split Analysis template for PowerPoint & Google Slides
Pie/Donut
Premium
Budget Forecast Dashboard & Donut Charts Template for PowerPoint & Google Slides
Pie/Donut
Premium
Quad Chart Infographic Pack of 8 Slides Template for PowerPoint & Google Slides
Comparison Chart
Premium
Simple Organizational Chart Infographic Template for PowerPoint & Google Slides
Org Chart
Premium
Five-Stage People Infographic Chart template for PowerPoint & Google Slides
Process
Premium
Statistics Infographic & KPI Bar Chart Template for PowerPoint & Google Slides
Bar/Column
Premium
3D pie chart infographic template for PowerPoint & Google Slides
Pie/Donut
Premium
3D Pyramid Column Chart Infographic Template for PowerPoint & Google Slides
Bar/Column
Premium
Segmented Pie Chart Infographic with Icons for PowerPoint & Google Slides
Pie/Donut
Premium
Free Professional Gantt Chart Pack – 4 Slides Template for PowerPoint & Google Slides
Gantt Chart
Free
Google Ads Optimization & Performance Infographic Template for PowerPoint & Google Slides
Digital Marketing
Premium
SQ3R Study Strategy Infographic Slides Template for PowerPoint & Google Slides
Business Strategy
Premium
Six Double Diamond Infographic Slides Template for PowerPoint & Google Slides
Process
Premium

Sales Process Infographic Slides Pack Template for PowerPoint & Google Slides
Process
Premium
Casino/Poker Chips Infographic Slides template for PowerPoint & Google Slides
Business Strategy
Premium
Agenda Infographic Pack of 2 Slides Template for PowerPoint & Google Slides
Agenda
Premium
Four Options Infographic Slides Template for PowerPoint & Google Slides
Comparison
Premium
Game Plan Infographic Slides Pack Template for PowerPoint & Google Slides
Infographics
Premium
Circle Strategy Creative Chart template for PowerPoint & Google Slides
Business Strategy
Premium
Four Square Chart template for PowerPoint & Google Slides
Charts
Premium
Creative SWOT Chart template for PowerPoint & Google Slides
SWOT
Premium
Organization Chart template for PowerPoint & Google Slides
Org Chart
Premium
Three-Year Bar Chart template for PowerPoint & Google Slides
Charts
Premium
Market Development Matrix Chart Template for PowerPoint & Google Slides
Comparison Chart
Premium
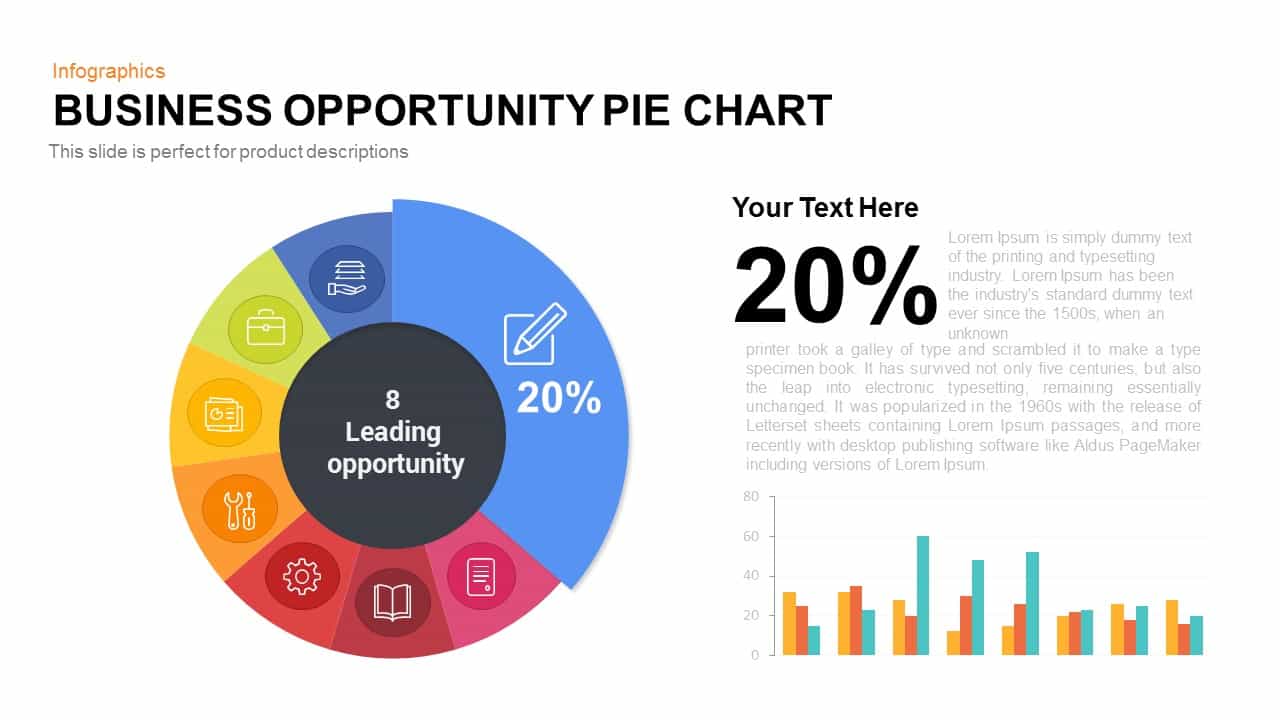
Business Opportunity Pie Chart Template for PowerPoint & Google Slides
Pie/Donut
Premium
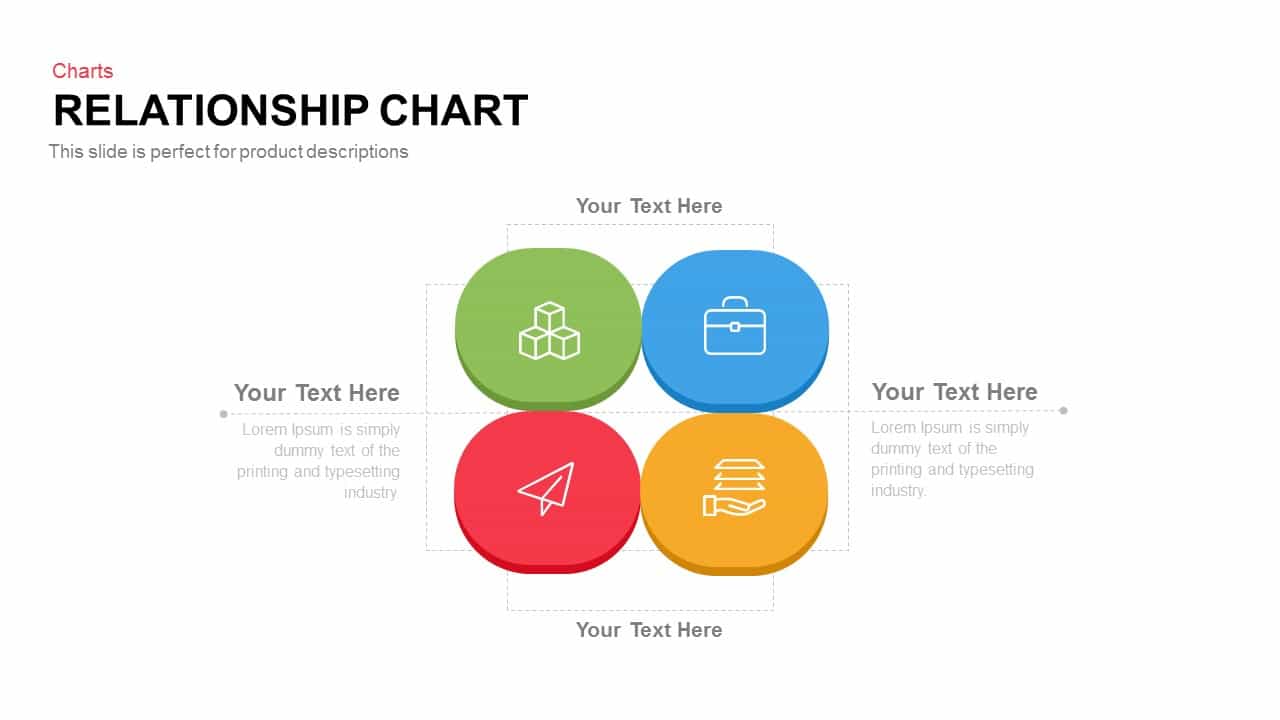
Relationship Chart template for PowerPoint & Google Slides
Flow Charts
Premium
Horizontal Multi-Level Hierarchy Chart template for PowerPoint & Google Slides
Org Chart
Premium

Monthly Reports Bar Chart template for PowerPoint & Google Slides
Bar/Column
Premium
Product Usage Analytics Dashboard Chart Template for PowerPoint & Google Slides
Bar/Column
Premium
Sales vs Budget Performance Chart Template for PowerPoint & Google Slides
Bar/Column
Premium
Interactive Product Comparison Bar Chart Template for PowerPoint & Google Slides
Bar/Column
Premium
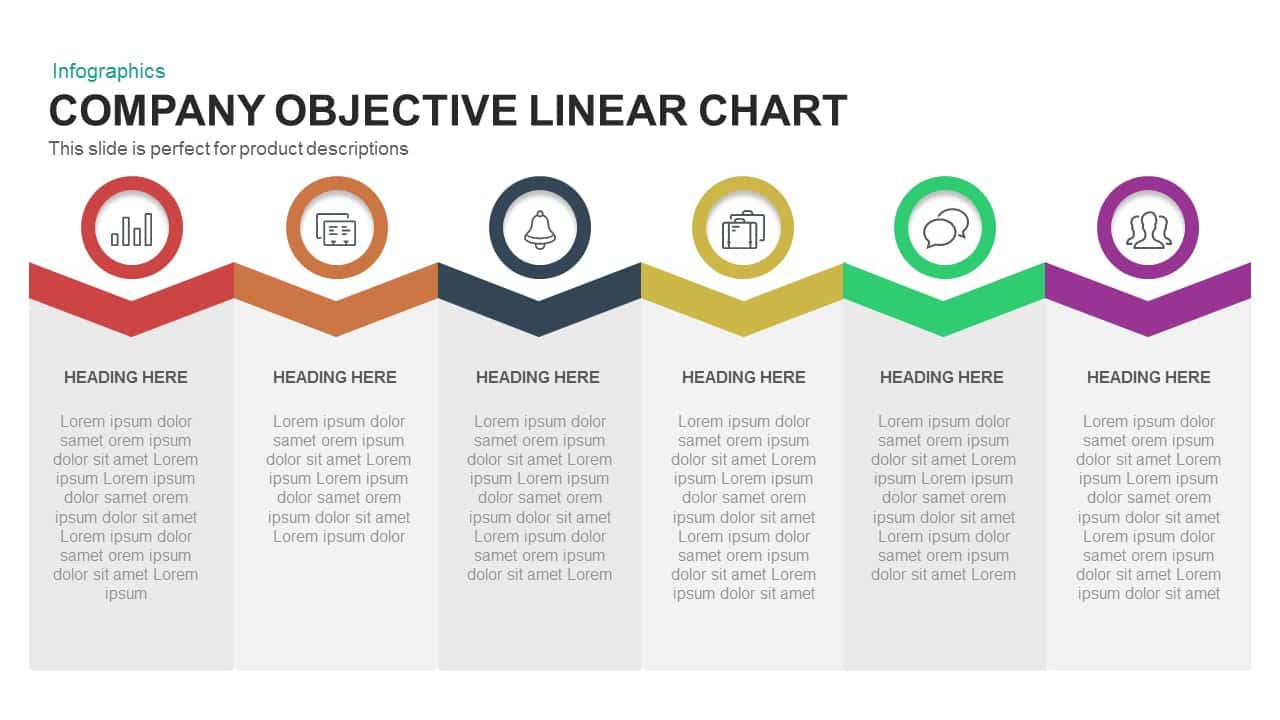
Company Objective Linear Chart Template for PowerPoint & Google Slides
Flow Charts
Premium

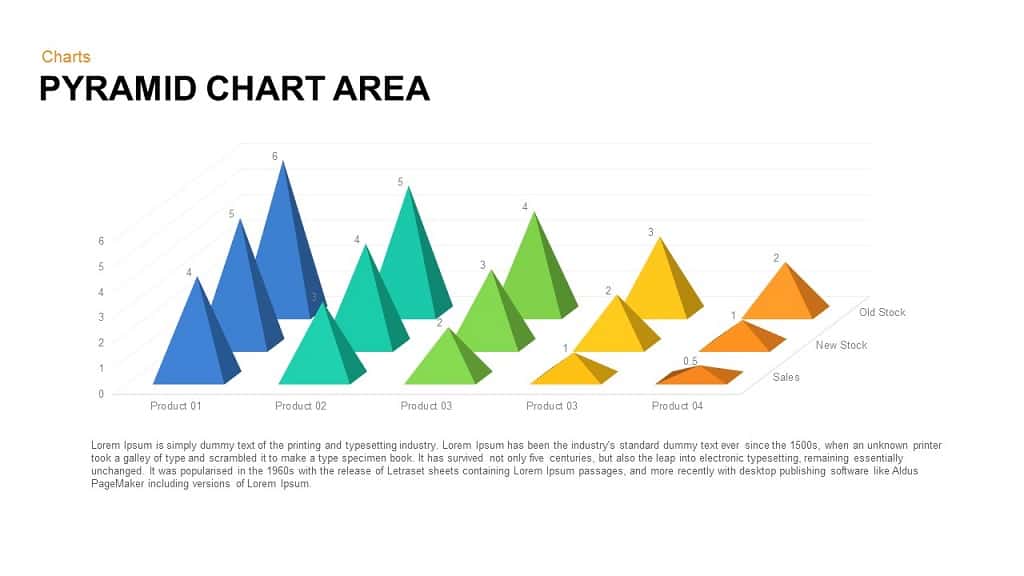
Pyramid Chart Area template for PowerPoint & Google Slides
Pyramid
Premium
Comparison Chart Overview template for PowerPoint & Google Slides
Comparison Chart
Premium
Project Team Structure Org Chart Template for PowerPoint & Google Slides
Org Chart
Premium
Isometric Organizational Structure Chart Template for PowerPoint & Google Slides
Org Chart
Premium
Four-Step Onion Chart Process Template for PowerPoint & Google Slides
Charts
Premium
RASCI Responsibility Matrix Chart Template for PowerPoint & Google Slides
Business
Premium
File Structure Organization Chart Template for PowerPoint & Google Slides
Org Chart
Premium
Capital Structure Dynamic Split Chart Template for PowerPoint & Google Slides
Comparison Chart
Premium
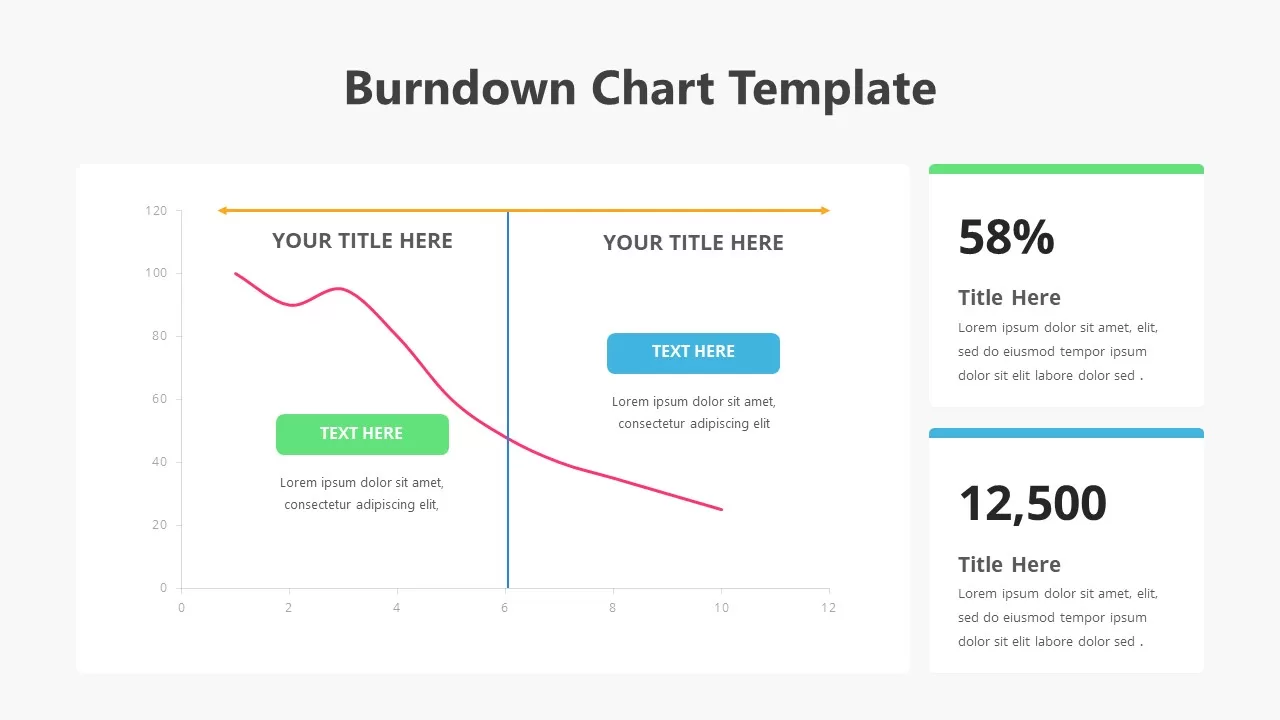
Burndown Chart Template for PowerPoint & Google Slides
Charts
Premium
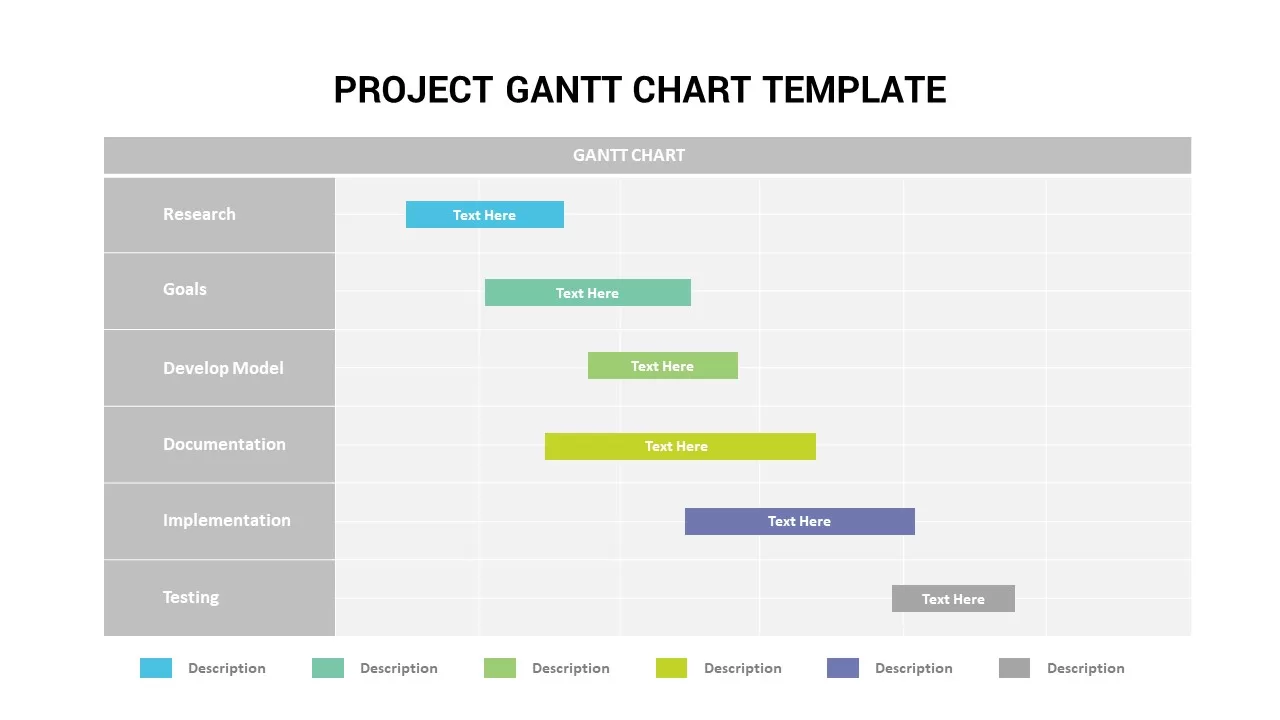
Project Gantt Chart template for PowerPoint & Google Slides
Gantt Chart
Premium
Pugh Matrix Decision Comparison Chart Template for PowerPoint & Google Slides
Comparison Chart
Premium
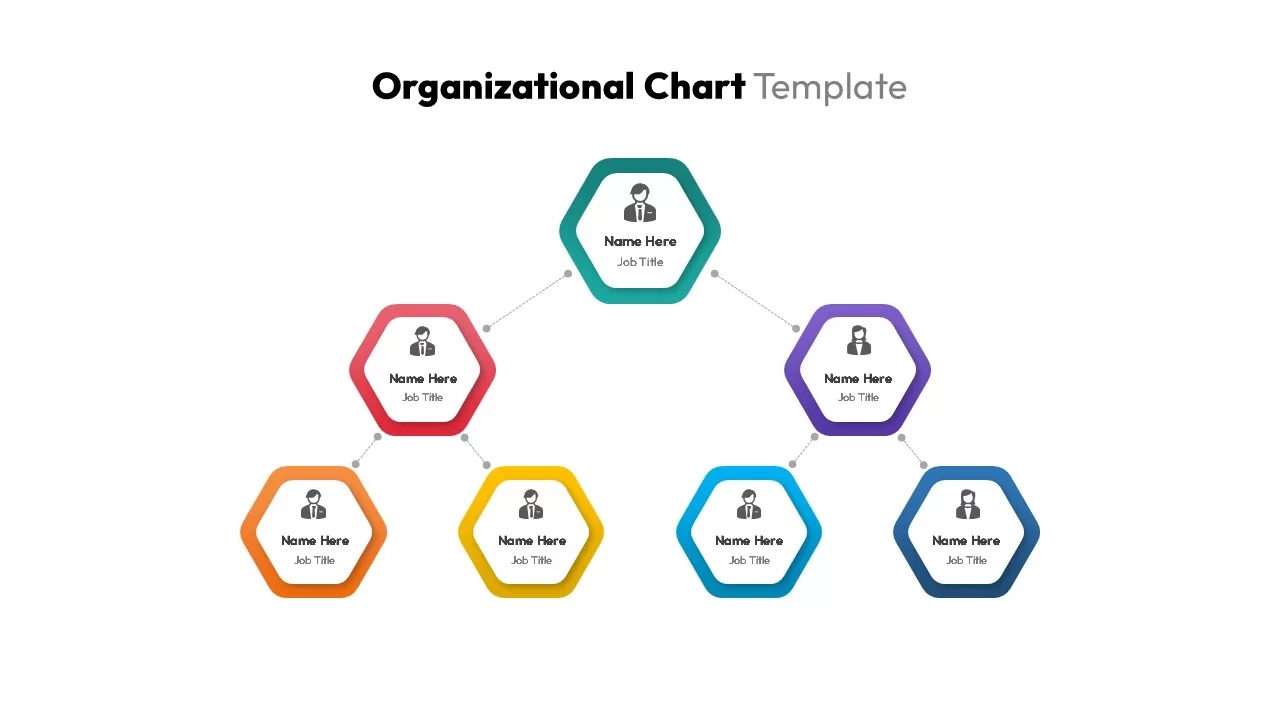
Organizational Chart Structure template for PowerPoint & Google Slides
Business Plan
Premium
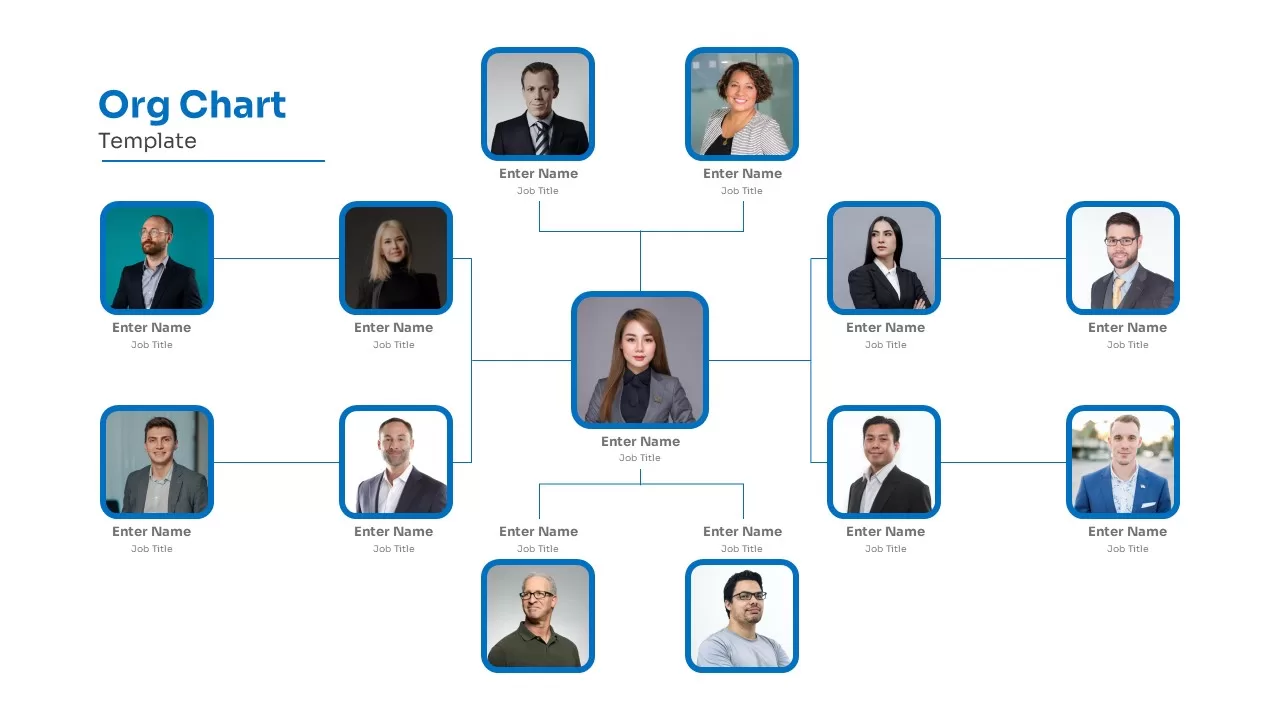
Organizational Chart Template for PowerPoint & Google Slides
Our Team
Premium
Organizational Chart template for PowerPoint & Google Slides
Org Chart
Premium
Flow Chart template for PowerPoint & Google Slides
Flow Charts
Premium
Divisional Organizational Chart Diagram Template for PowerPoint & Google Slides
Org Chart
Premium
Monthly Recurring Revenue KPI Bar Chart Template for PowerPoint & Google Slides
Bar/Column
Premium
MABA Attractiveness Matrix Chart Template for PowerPoint & Google Slides
Comparison Chart
Premium
Comprehensive Hiring Process Flow Chart Template for PowerPoint & Google Slides
Flow Charts
Premium
People Demographic Comparison Chart Template for PowerPoint & Google Slides
Comparison
Premium
Population Pyramid Chart Analysis Template for PowerPoint & Google Slides
Bar/Column
Premium
Combination Bar and Line Chart Template for PowerPoint & Google Slides
Bar/Column
Premium
Free Editable Simple Column Chart Slide Template for PowerPoint & Google Slides
Bar/Column
Free
Minimal Multi-Year Column Chart Template for PowerPoint & Google Slides
Bar/Column
Premium
Waterfall Column Chart Analysis Template for PowerPoint & Google Slides
Bar/Column
Premium
Professional Clustered Column Chart Template for PowerPoint & Google Slides
Bar/Column
Premium
Simple Scatter Chart Analysis Template for PowerPoint & Google Slides
Comparison Chart
Premium
XY Bubble Chart Data Visualization Template for PowerPoint & Google Slides
Comparison Chart
Premium
Arrow Line Chart Template for PowerPoint & Google Slides
Comparison Chart
Premium
Colorful Four-Segment Wheel Chart Template for PowerPoint & Google Slides
Circle
Premium
Forecast Chart with Confidence Bounds Template for PowerPoint & Google Slides
Comparison Chart
Premium
Four Quadrant Scatter Chart Analysis Template for PowerPoint & Google Slides
Comparison Chart
Premium
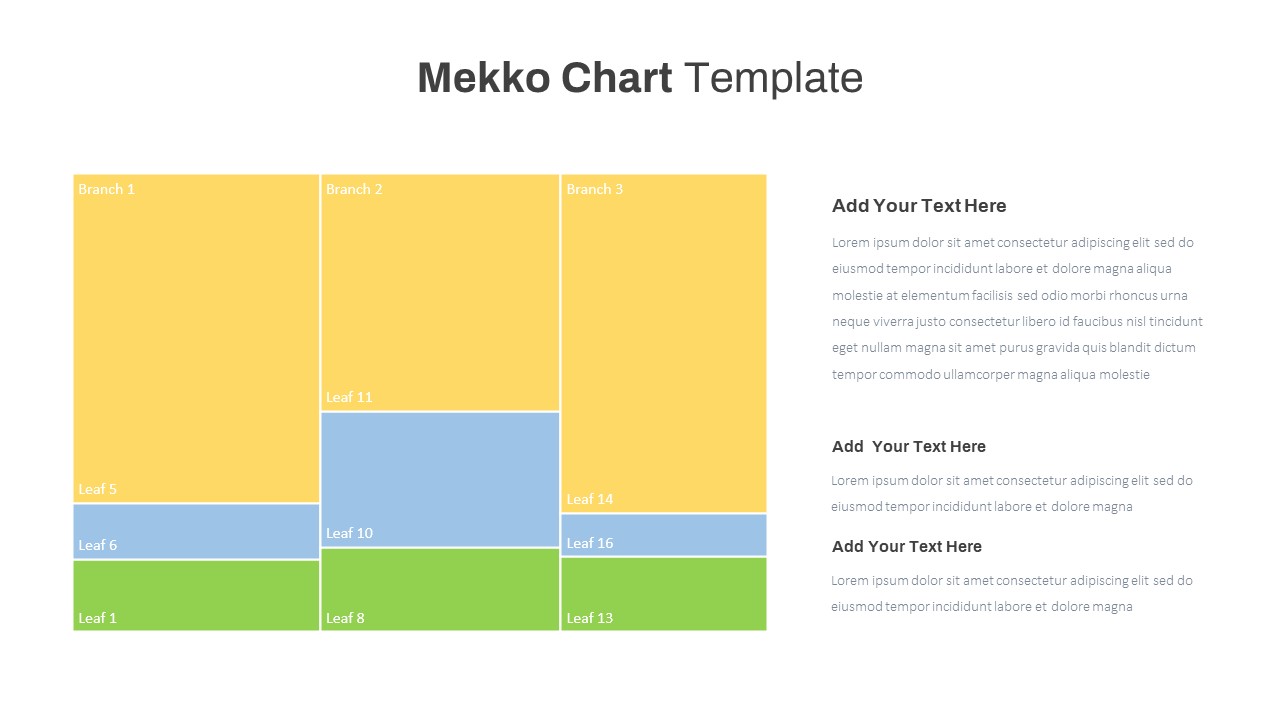
Mekko Chart with Segmented Branches & Leaves Template for PowerPoint & Google Slides
Bar/Column
Premium
Five-Phase Horizontal Timeline Chart Template for PowerPoint & Google Slides
Timeline
Premium
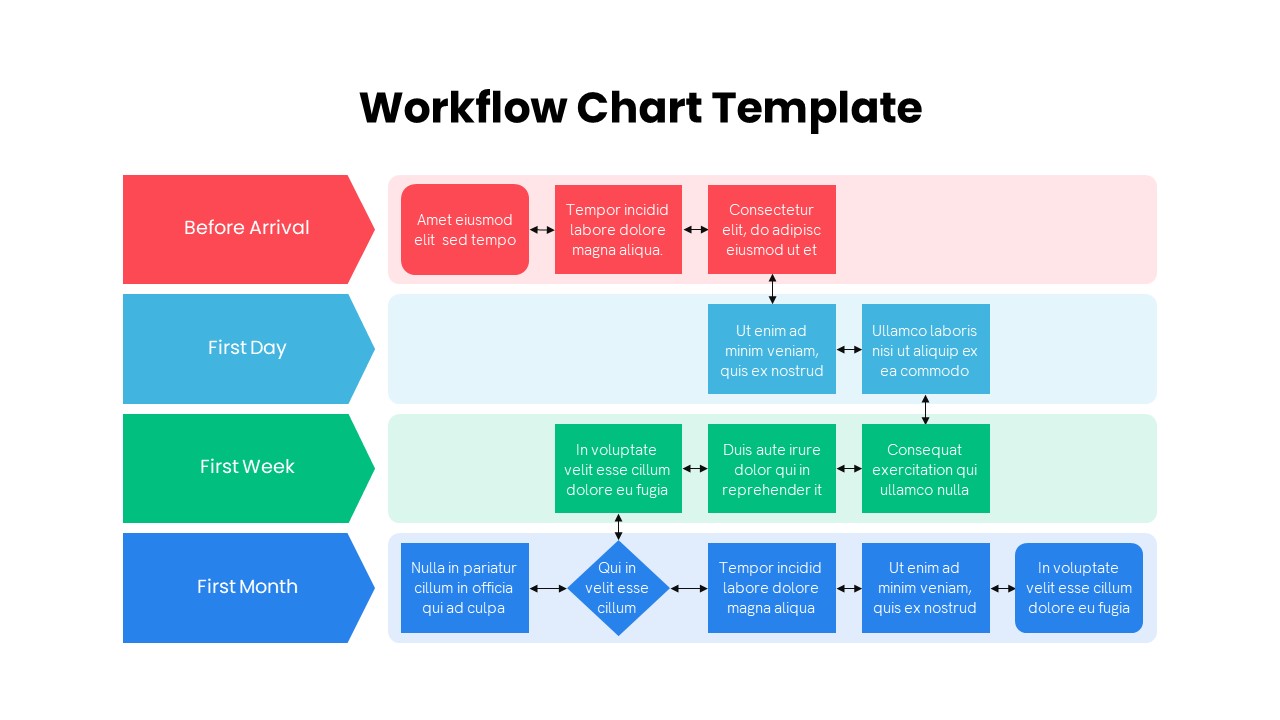
Colorful Multistage Workflow Chart Template for PowerPoint & Google Slides
Flow Charts
Premium
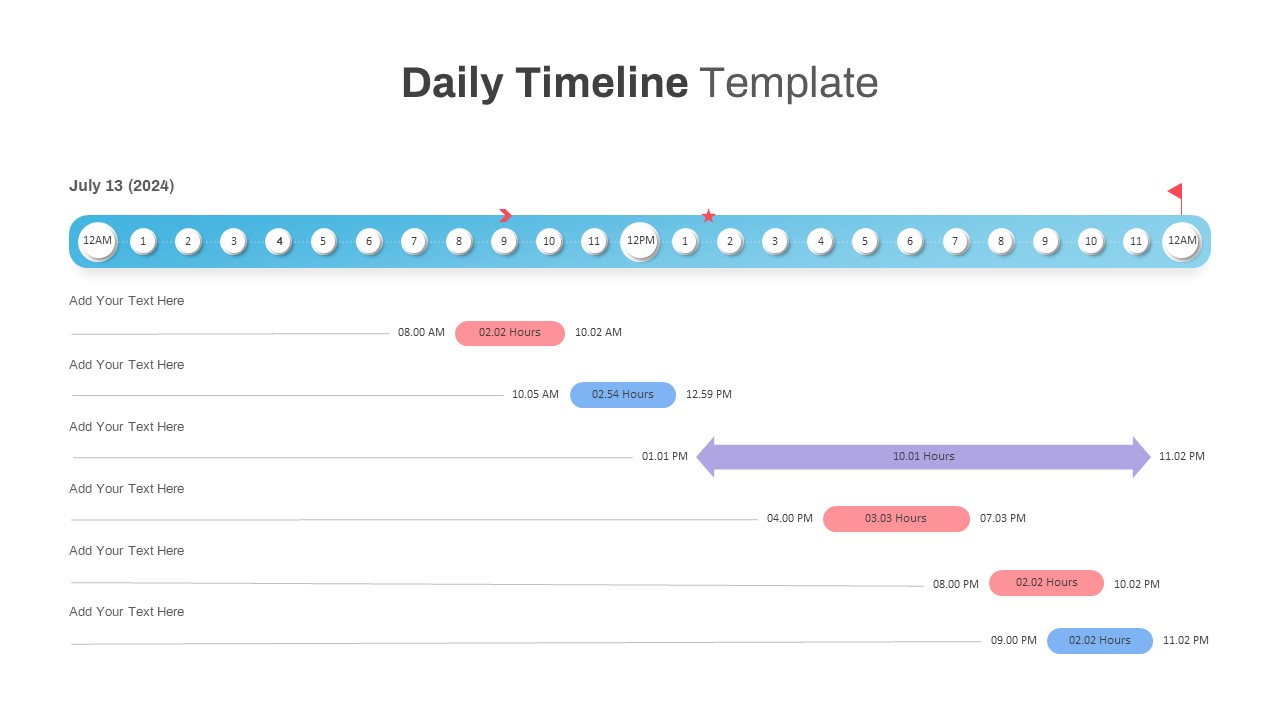
Interactive Daily Timeline Schedule Chart Template for PowerPoint & Google Slides
Timeline
Premium
Mirror Bar Chart Comparison Template for PowerPoint & Google Slides
Bar/Column
Premium
Free Learning Retention Pyramid Chart Template for PowerPoint & Google Slides
Pyramid
Free
Multi-Variation Circular Chart Diagram Template for PowerPoint & Google Slides
Circle
Premium
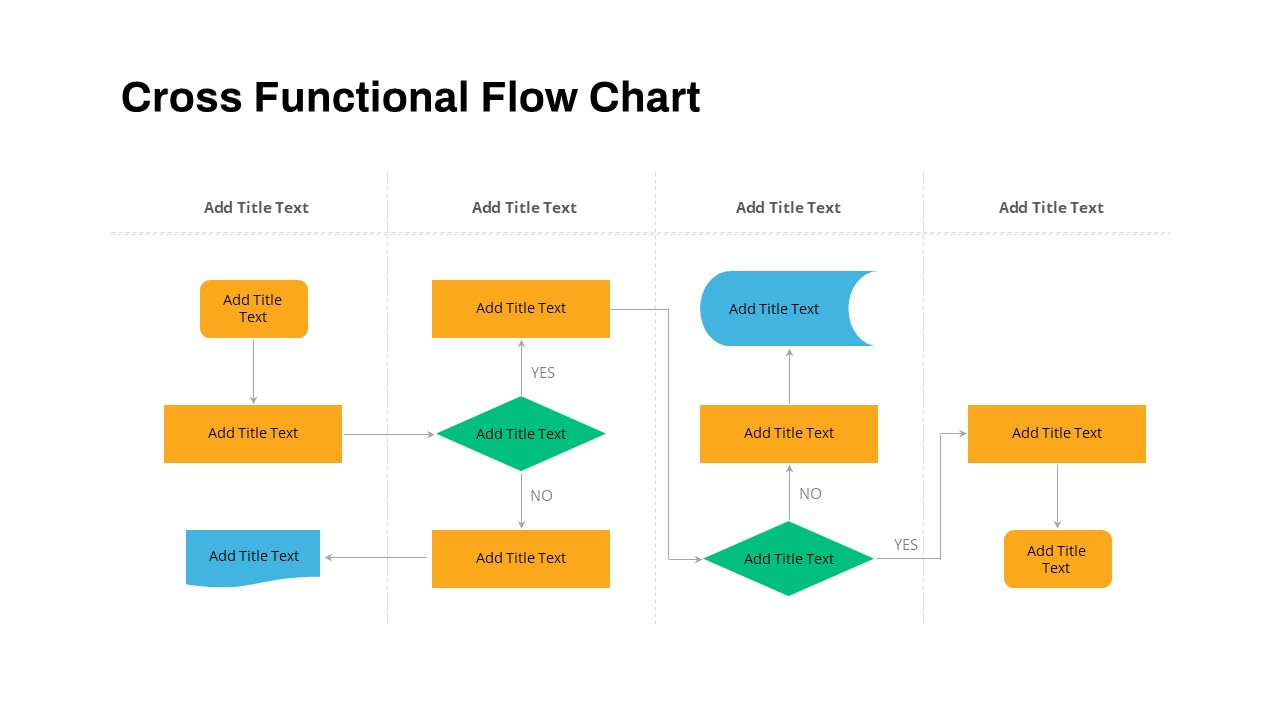
Cross Functional Swimlane Flow Chart Template for PowerPoint & Google Slides
Flow Charts
Premium
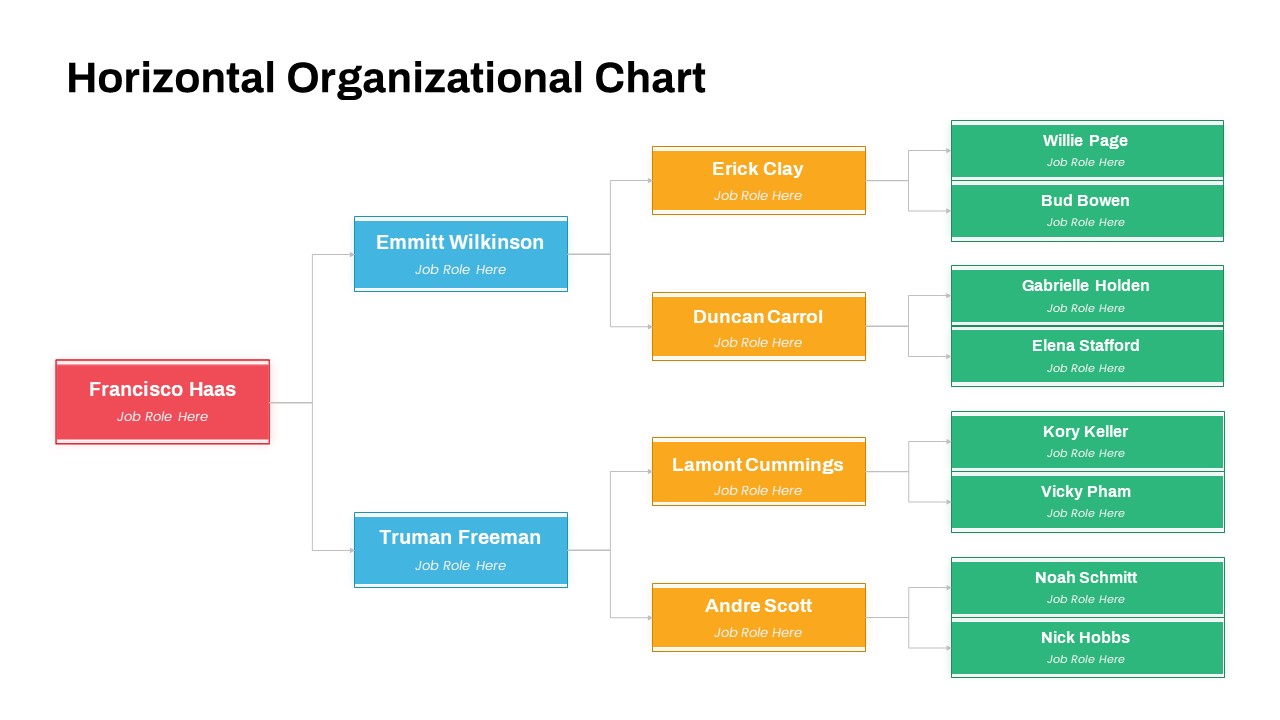
Horizontal Organizational Chart Template for PowerPoint & Google Slides
Org Chart
Premium
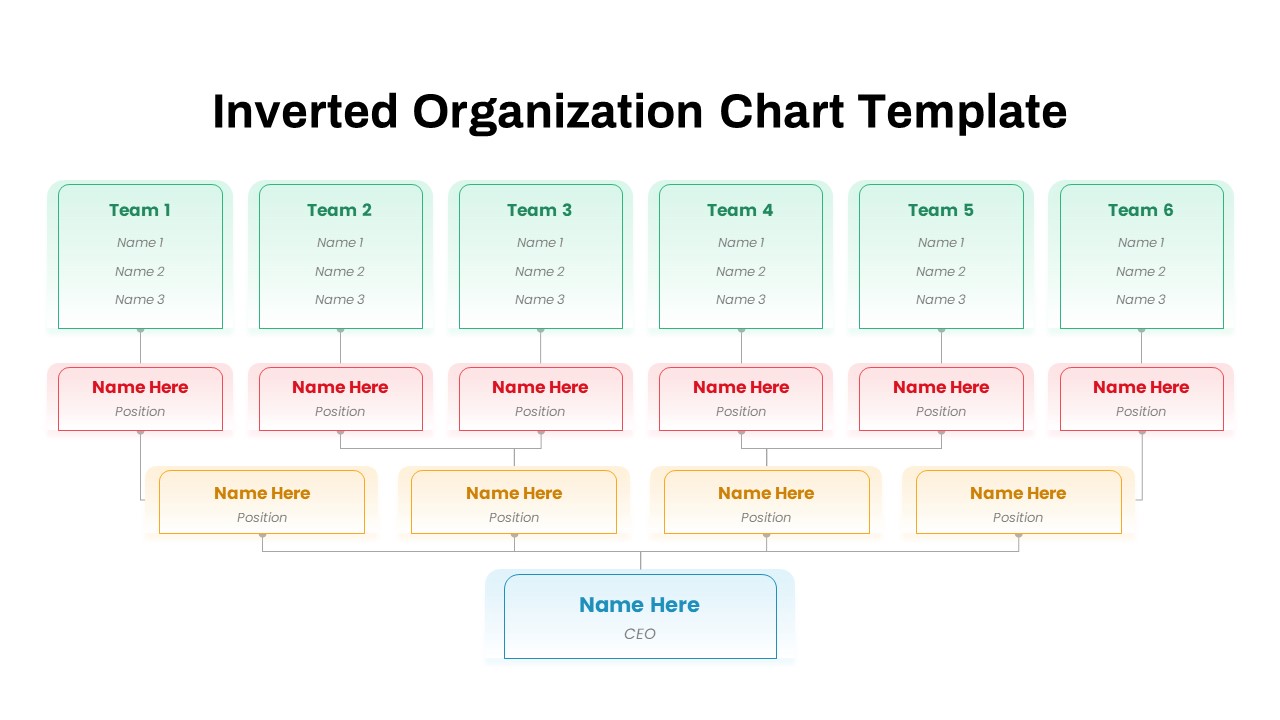
Inverted Organization Chart Diagram Template for PowerPoint & Google Slides
Org Chart
Premium
Modern Multi-Color Polar Chart Diagram Template for PowerPoint & Google Slides
Circle
Premium
Segmented Scatter Chart Data Visualization Template for PowerPoint & Google Slides
Business Strategy
Premium
Decision Matrix & Prioritization Chart Template for PowerPoint & Google Slides
Comparison Chart
Premium
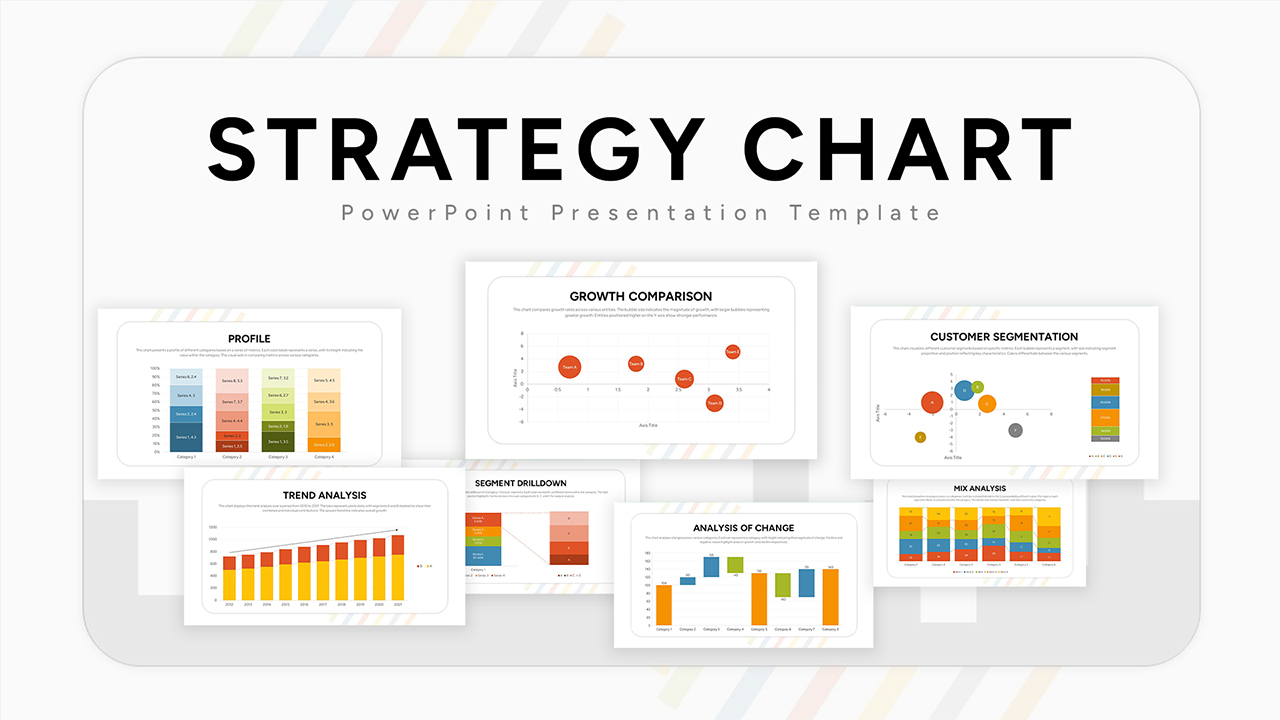
Ultimate Strategy Chart Presentation Template for PowerPoint & Google Slides
Charts
Premium
Data Analysis Bar Chart with Insights Template for PowerPoint & Google Slides
Bar/Column
Free
Project Tracker Timeline Gantt Chart Template for PowerPoint & Google Slides
Project Status
Premium
Event Planning Gantt Chart template for PowerPoint & Google Slides
Business
Premium
Feasibility Matrix Comparison Chart Template for PowerPoint & Google Slides
Comparison Chart
Premium
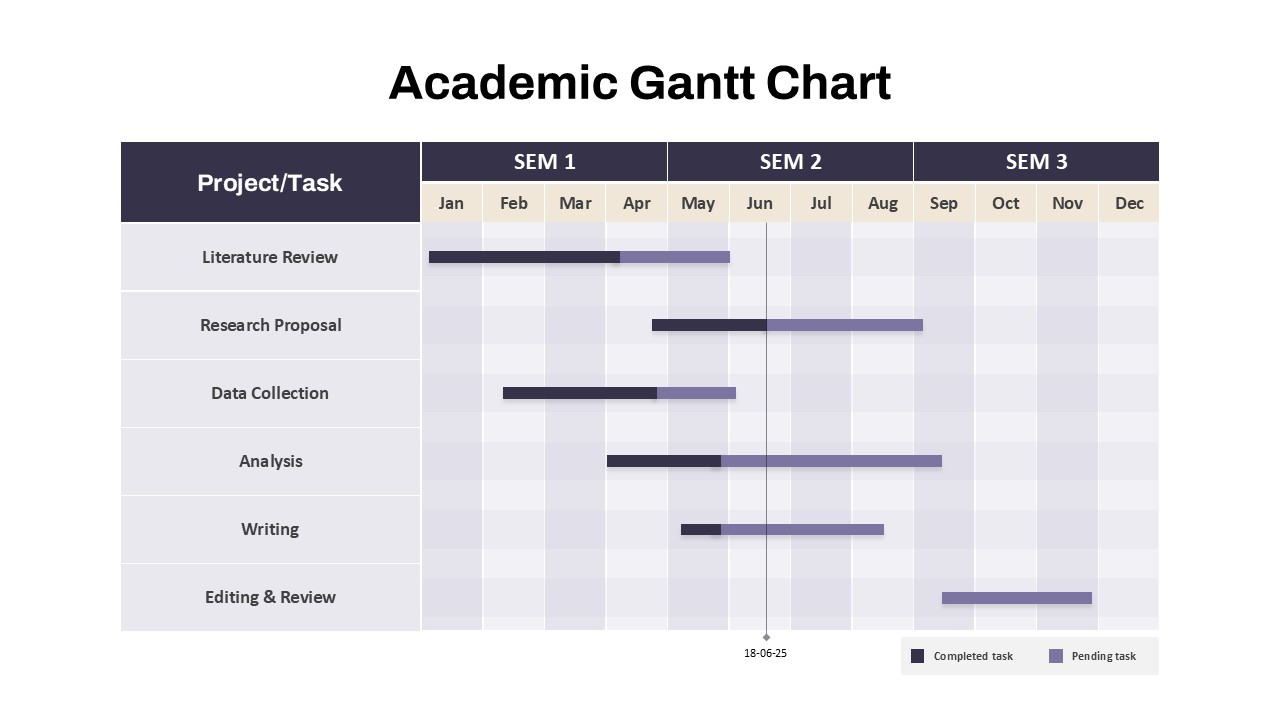
Academic Gantt Chart template for PowerPoint & Google Slides
Business
Premium
Bar Gantt Chart Template for PowerPoint & Google Slides
Gantt Chart
Premium