RAG Status Infographic Comparison Template for PowerPoint & Google Slides


Description
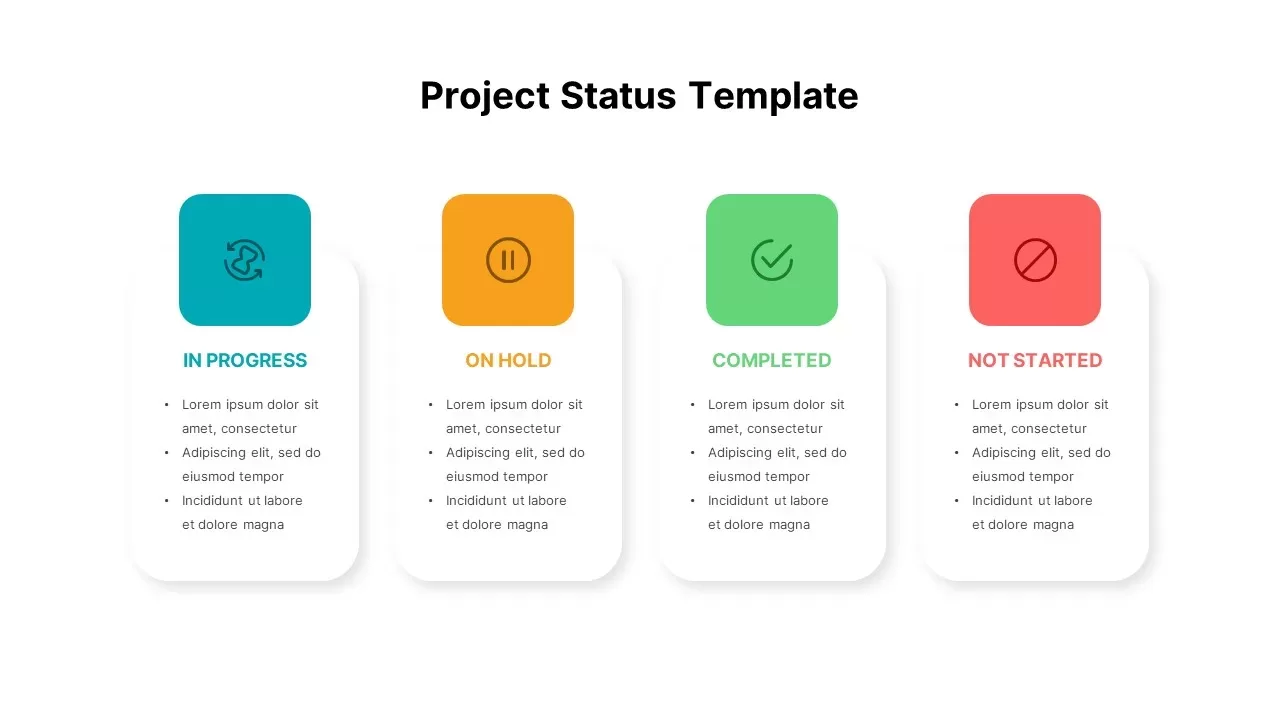
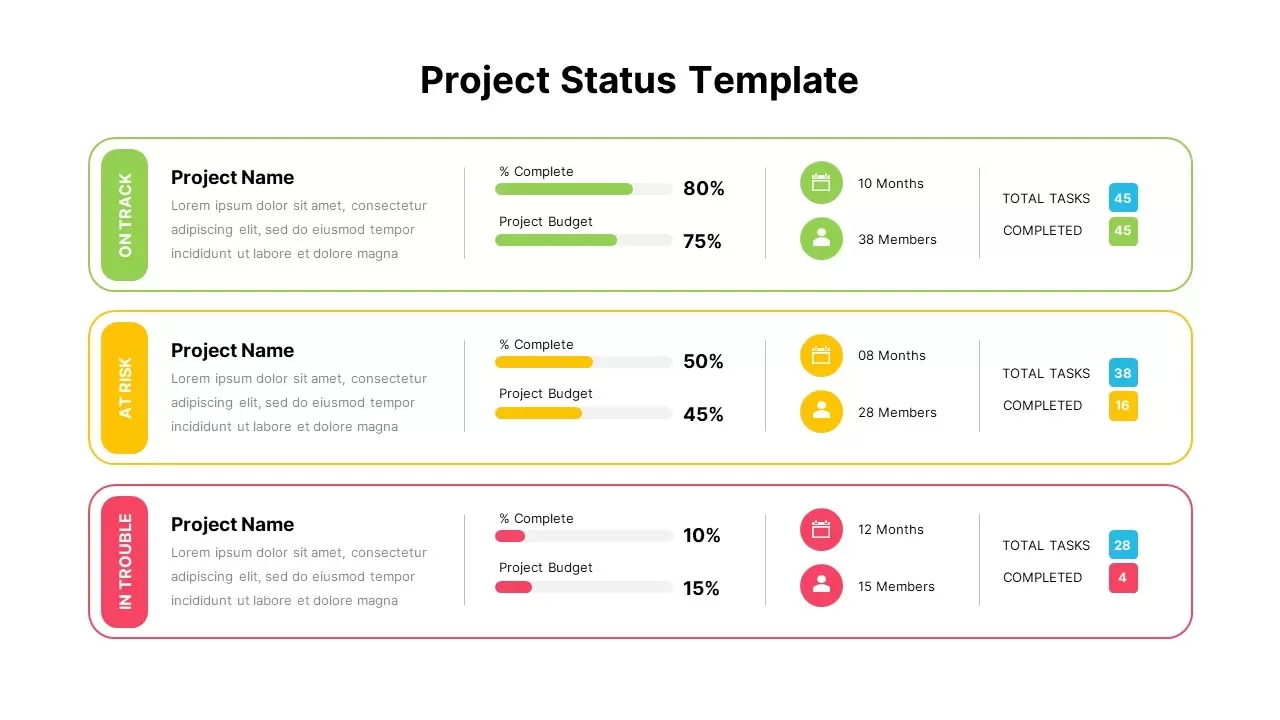
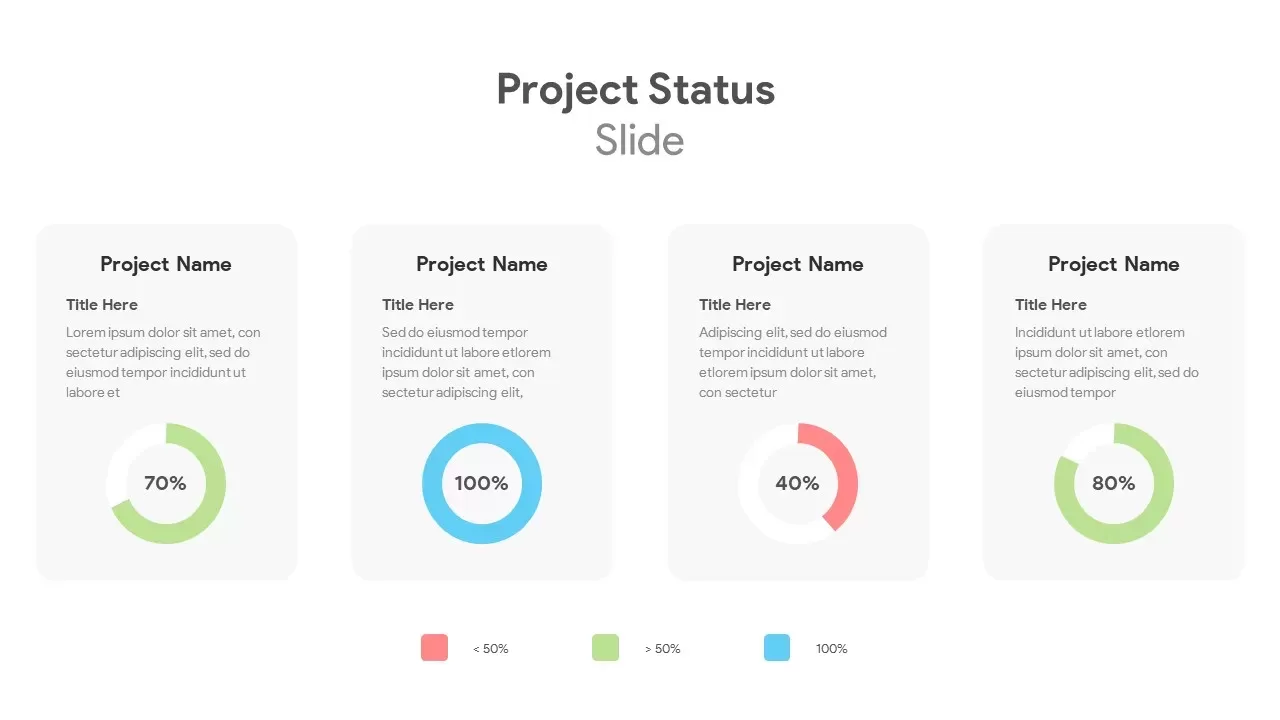
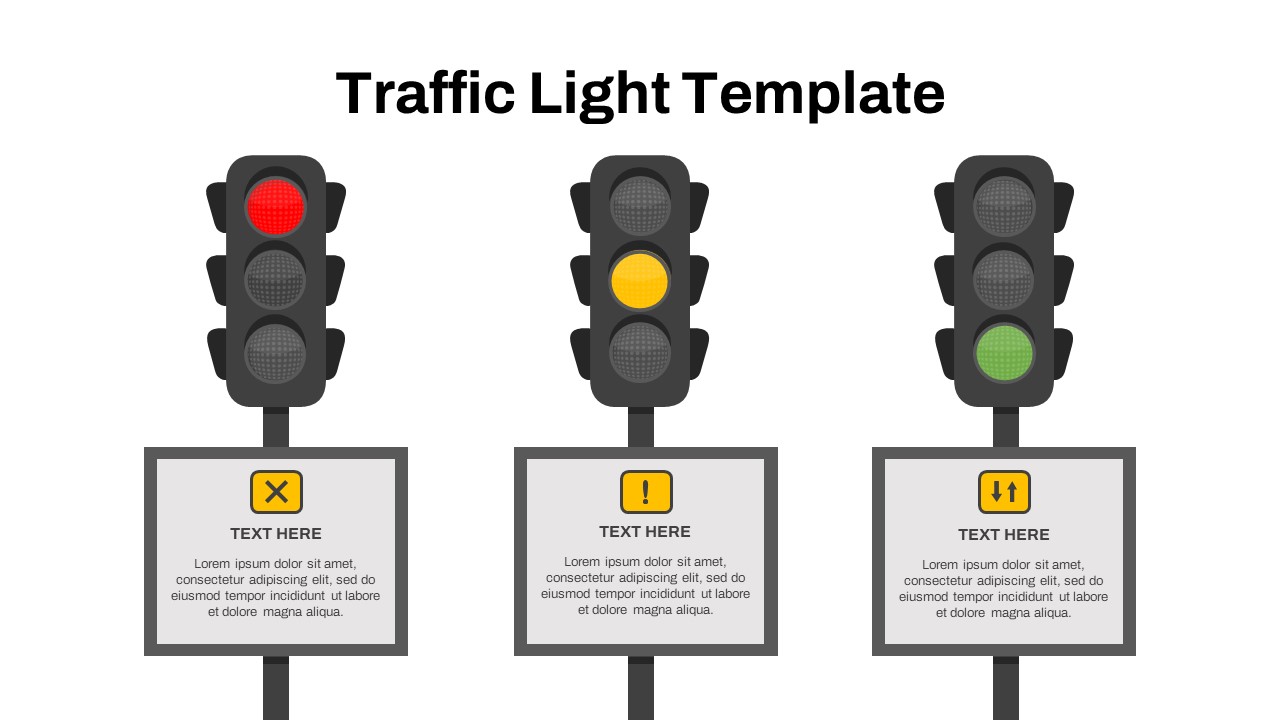
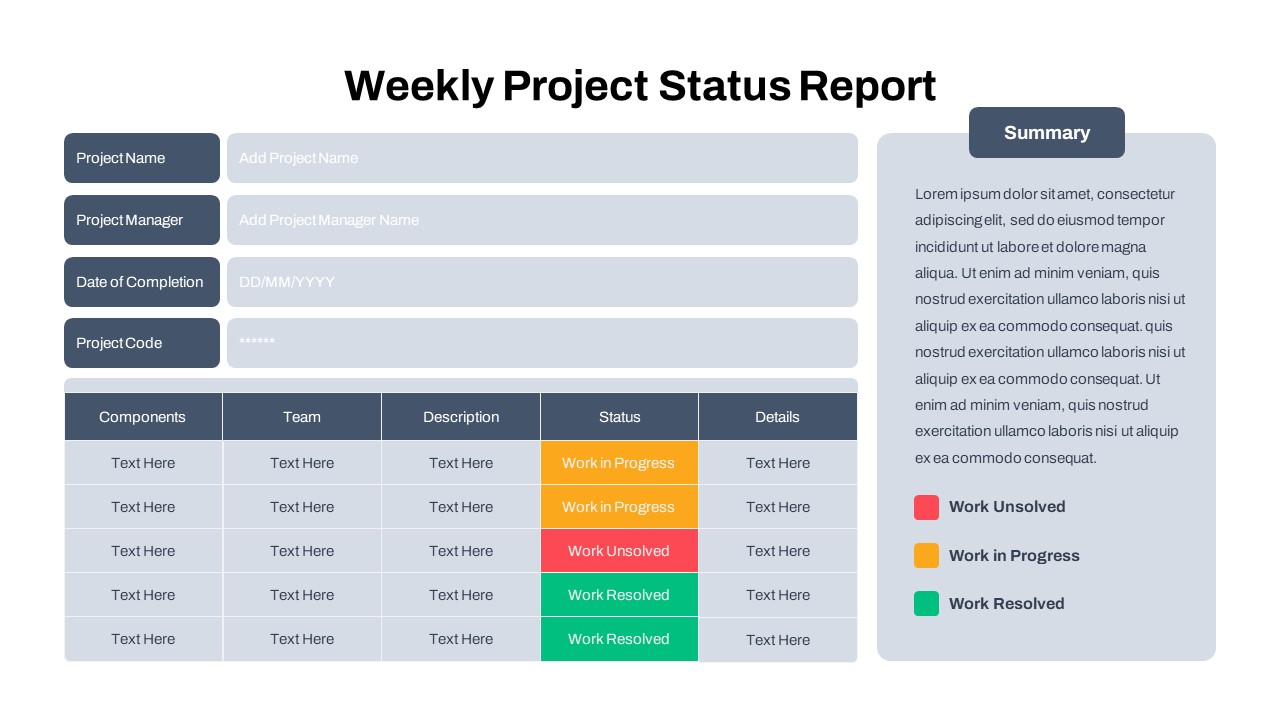
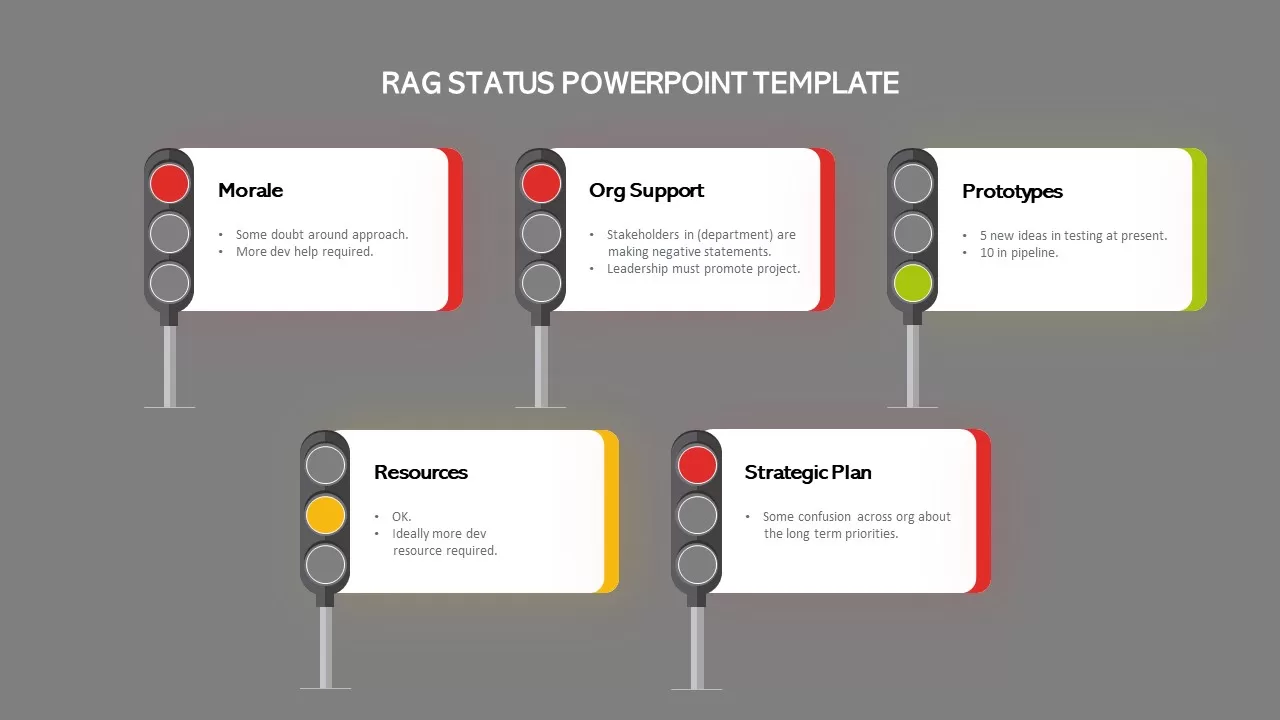
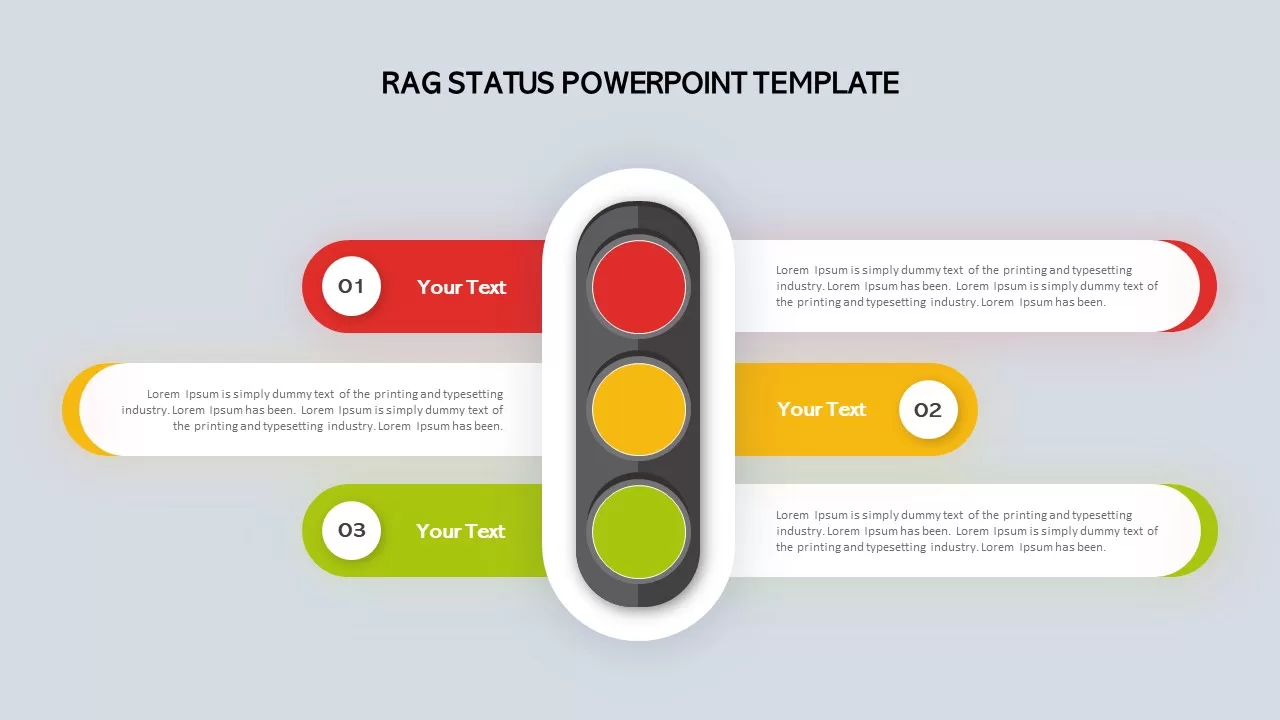
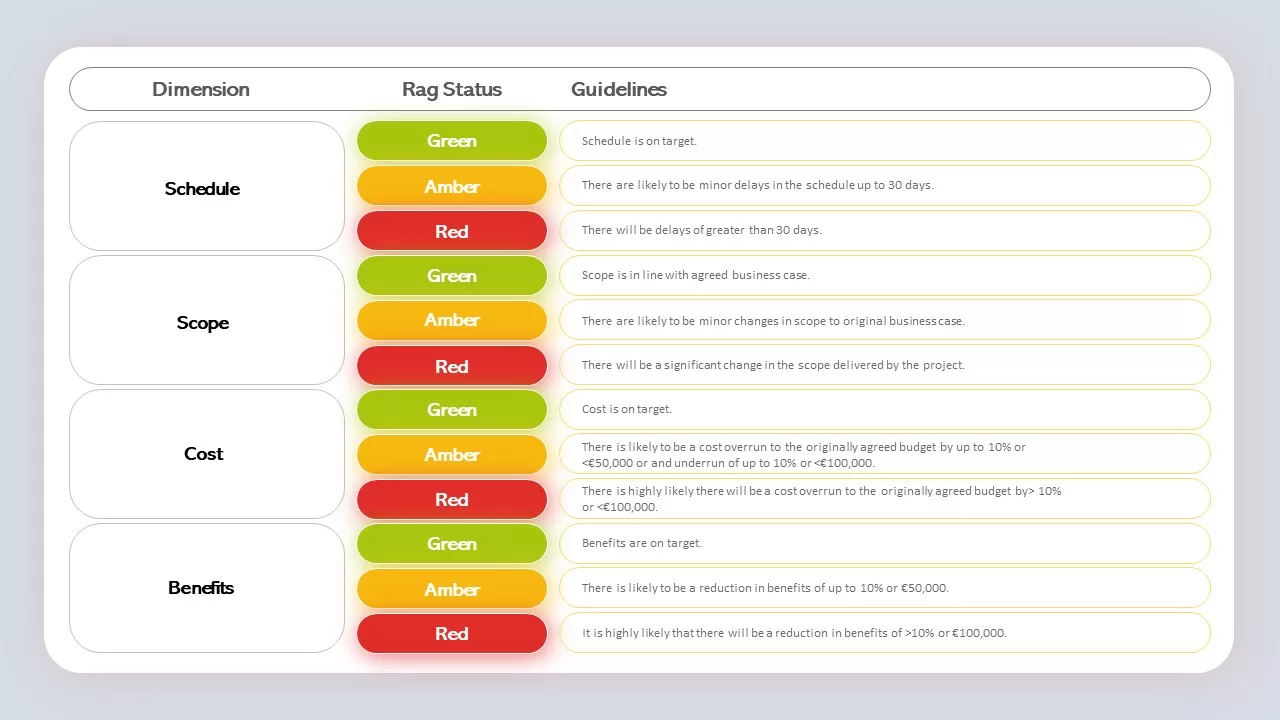
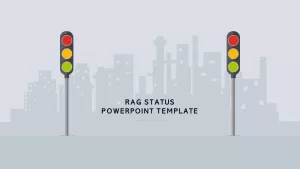
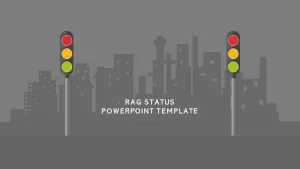
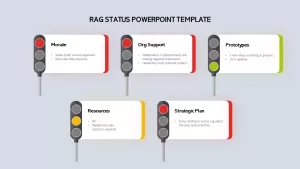
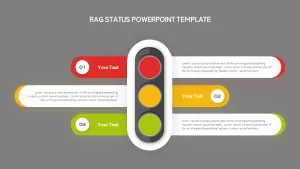
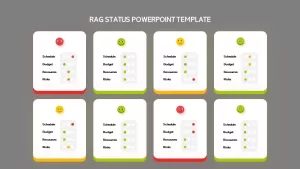
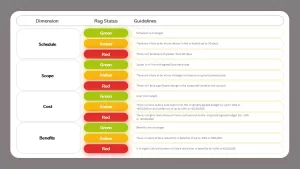
Showcase project health and performance at a glance with this RAG status infographic template. Capitalize on the universally recognized Red-Amber-Green traffic lights to clearly signal stop, caution, and go for key dimensions like schedule, budget, resources, risks, scope, and benefits.
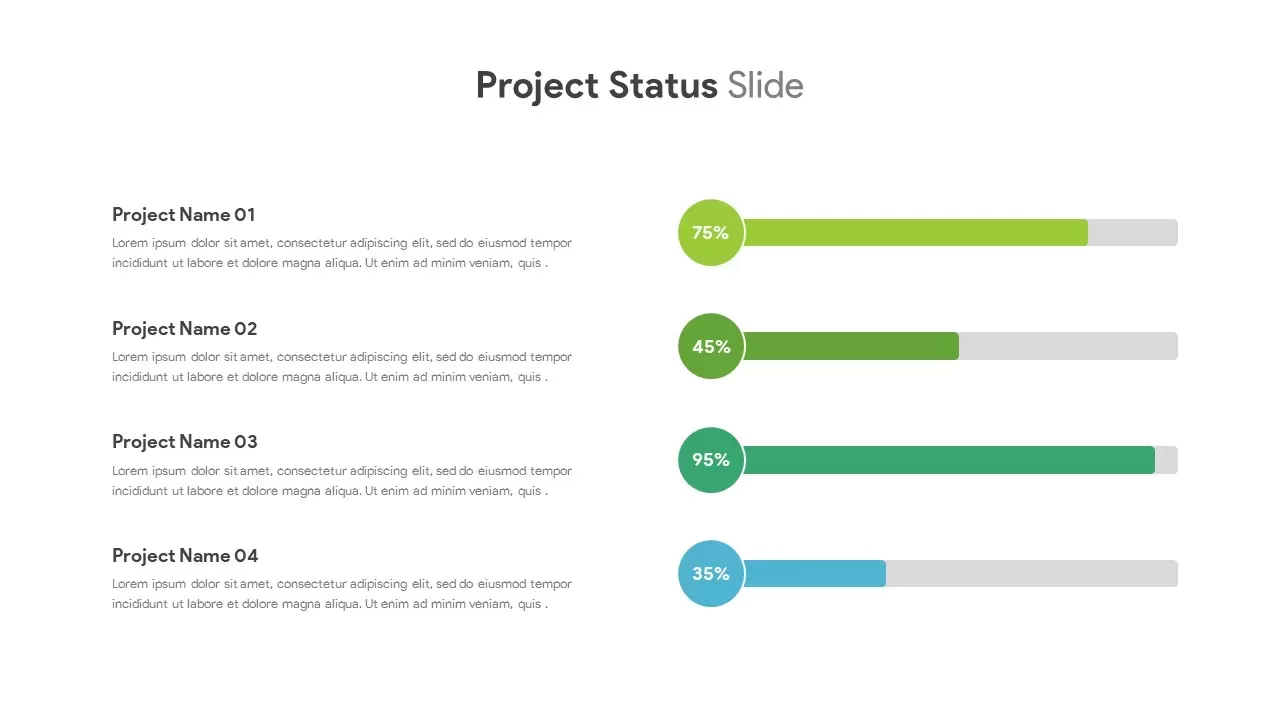
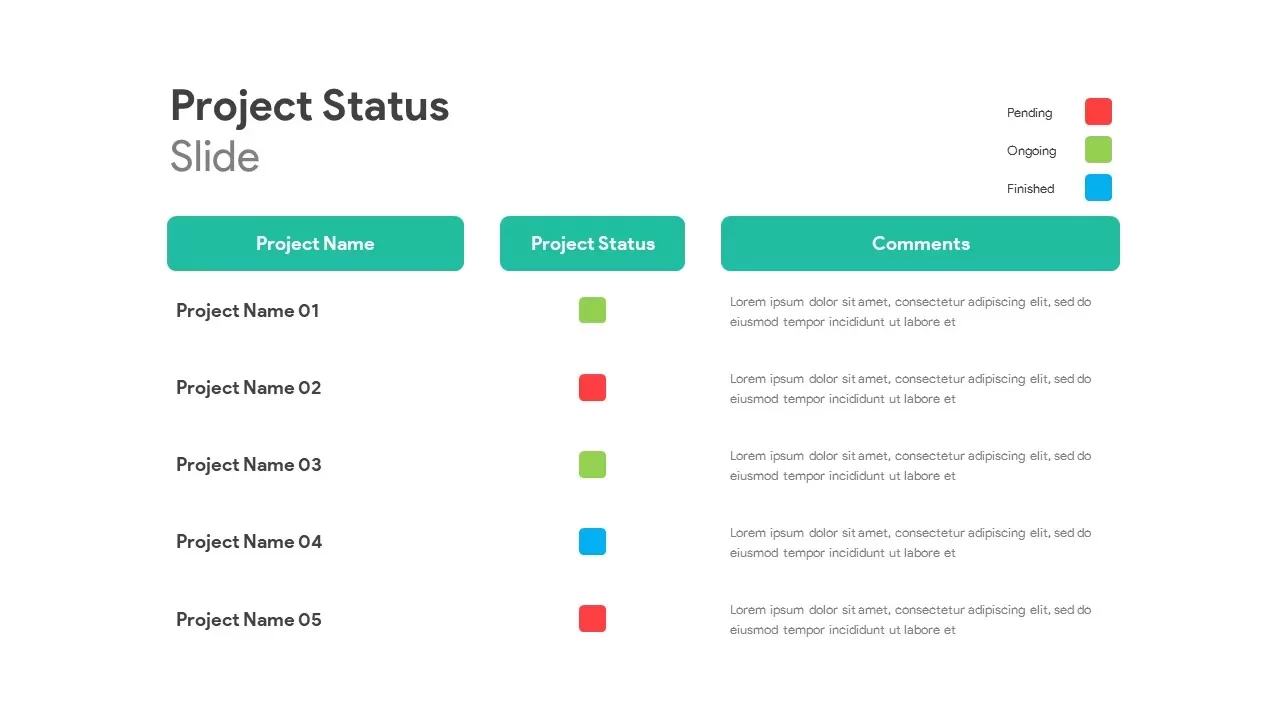
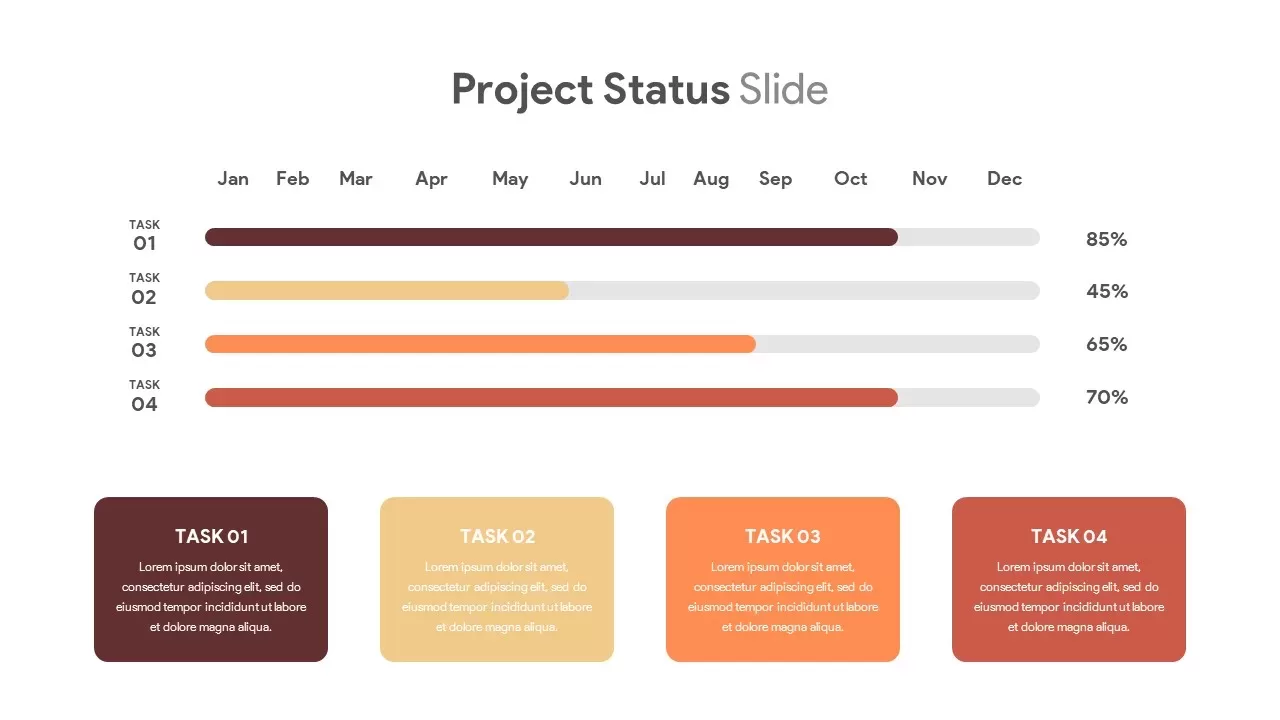
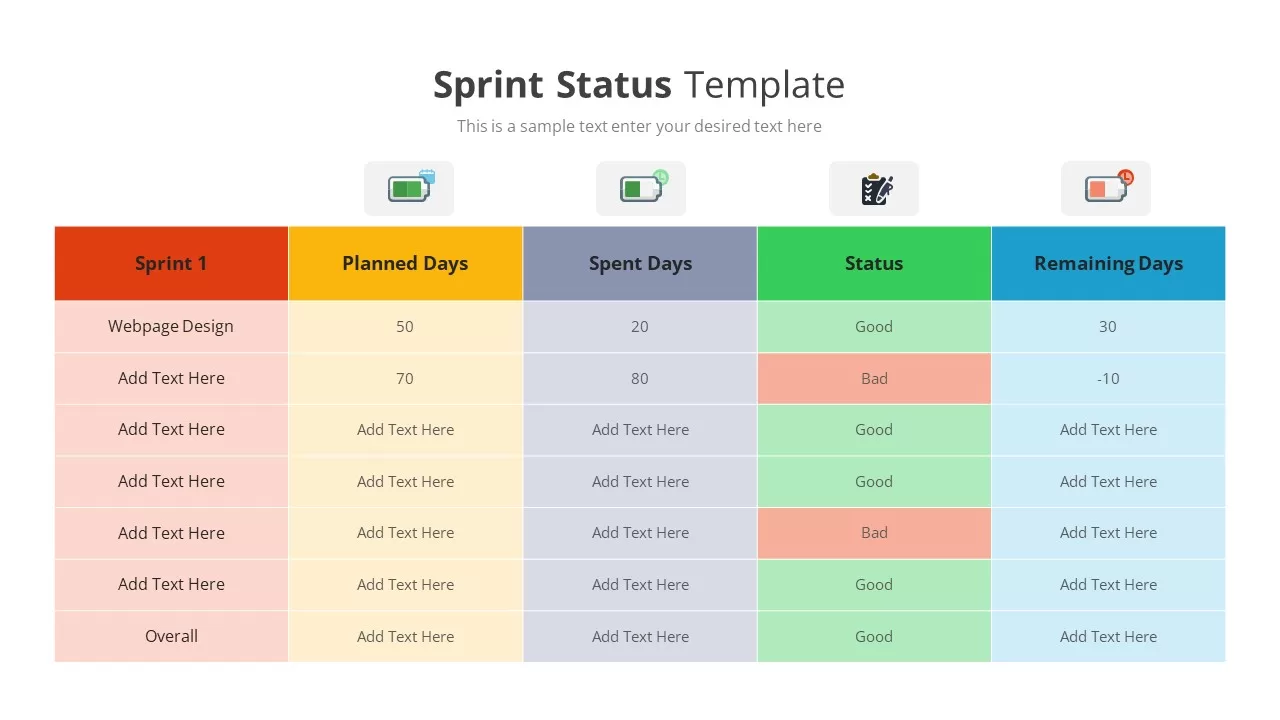
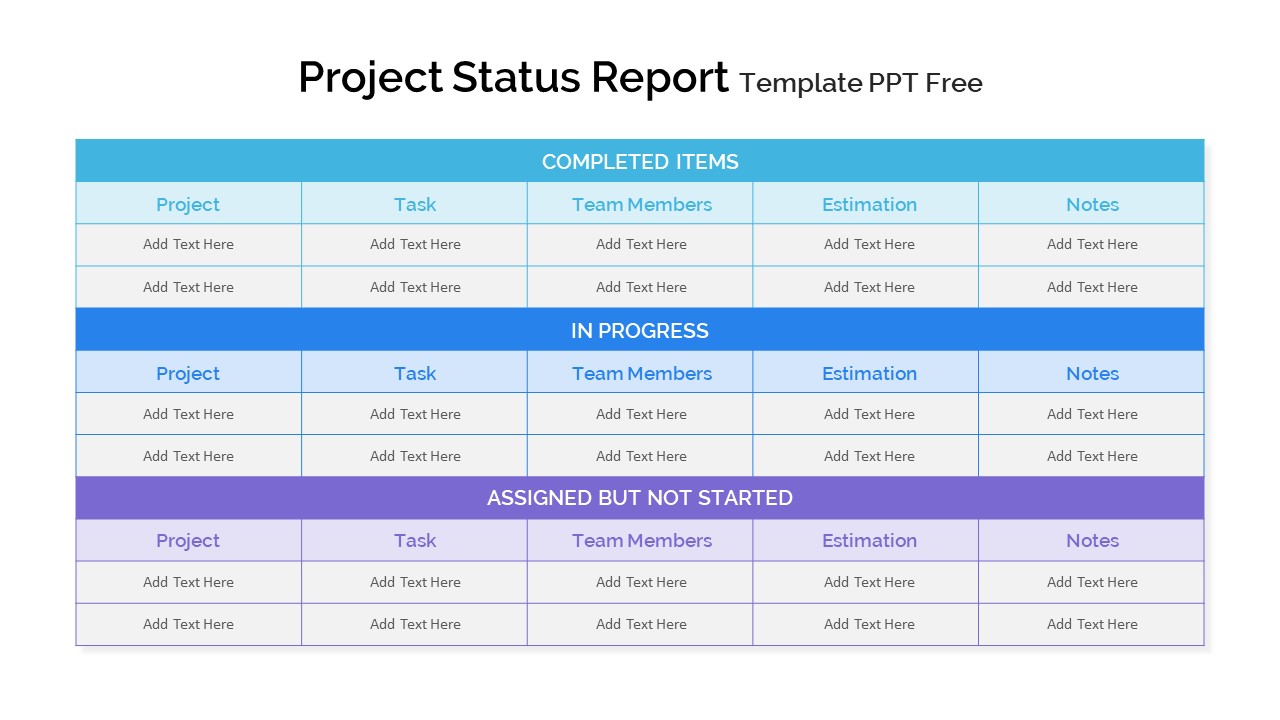
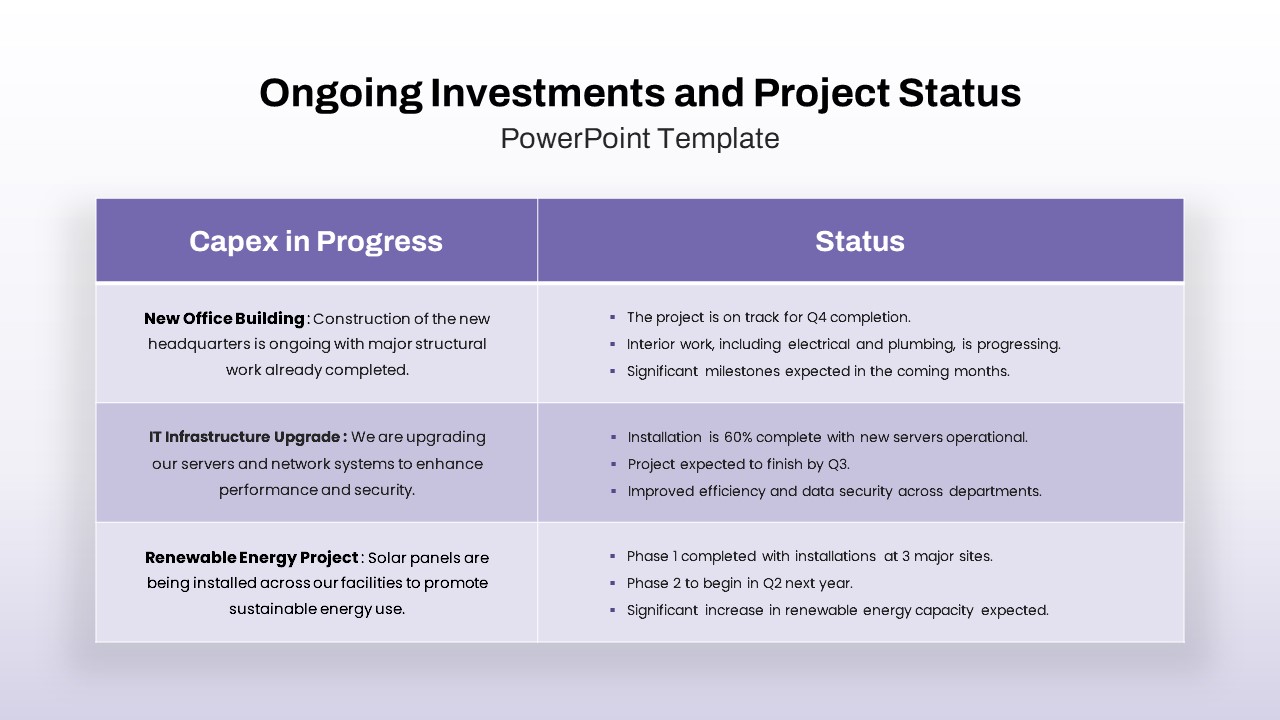
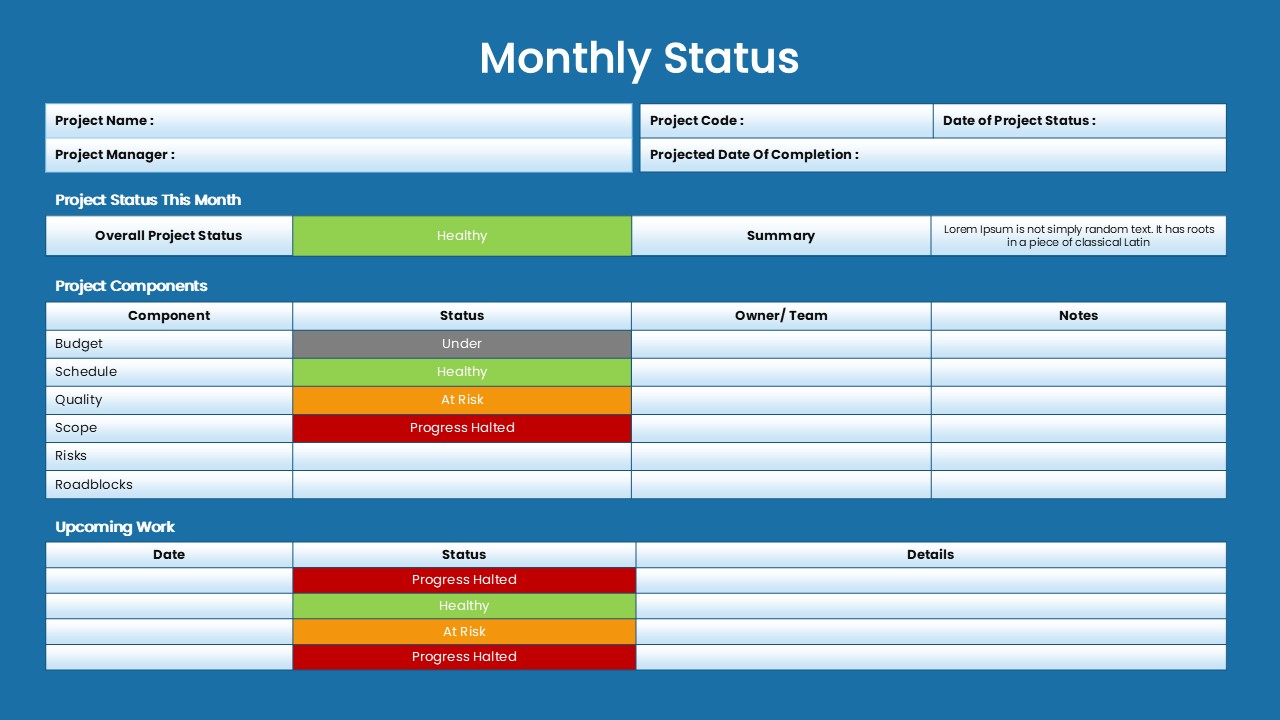
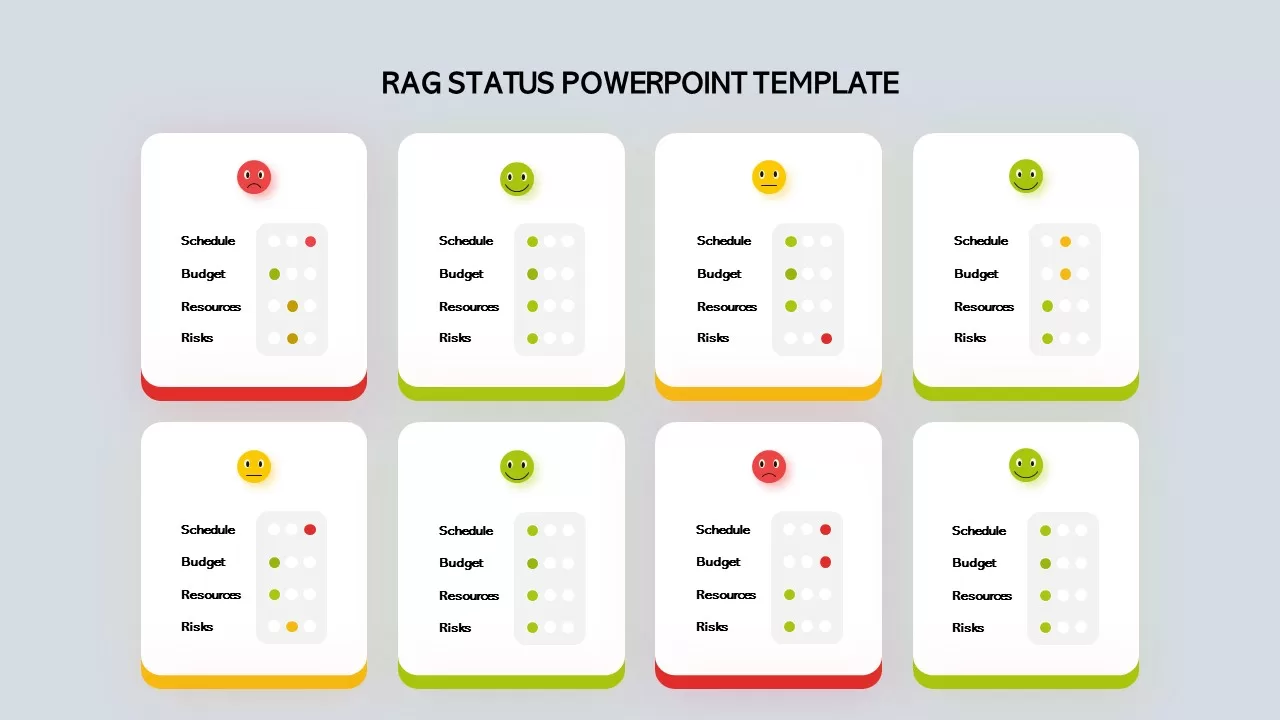
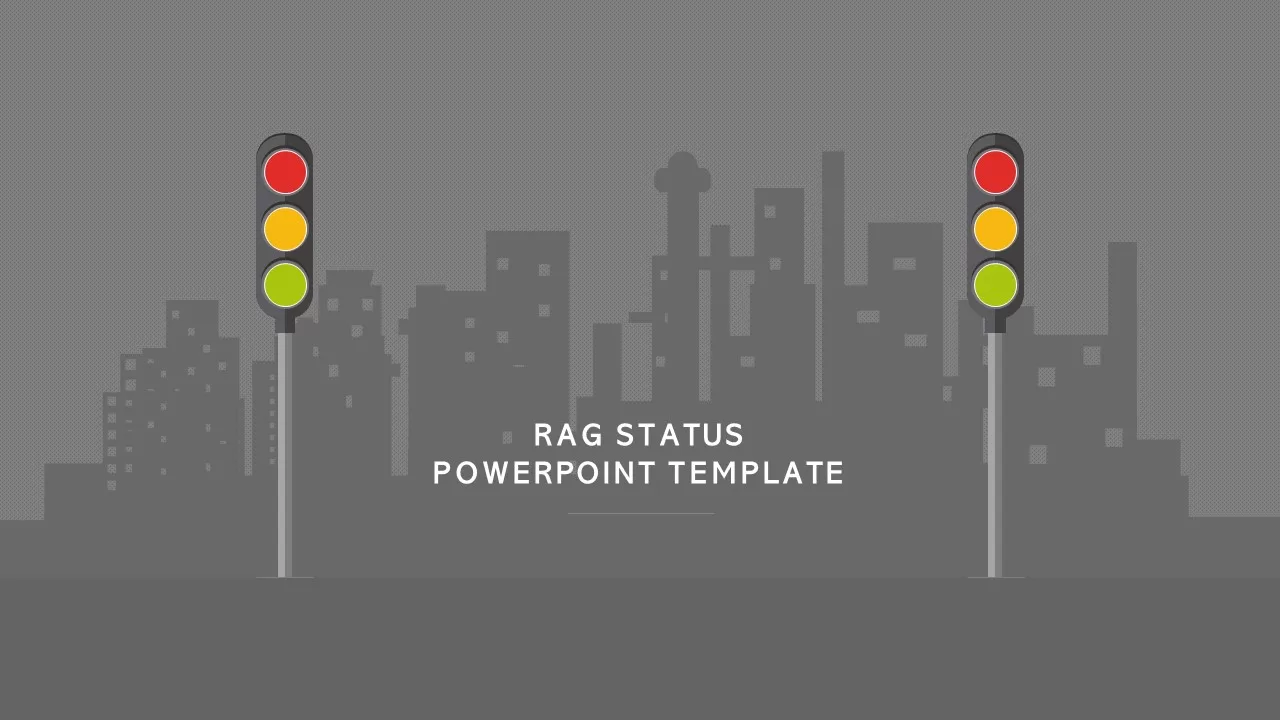
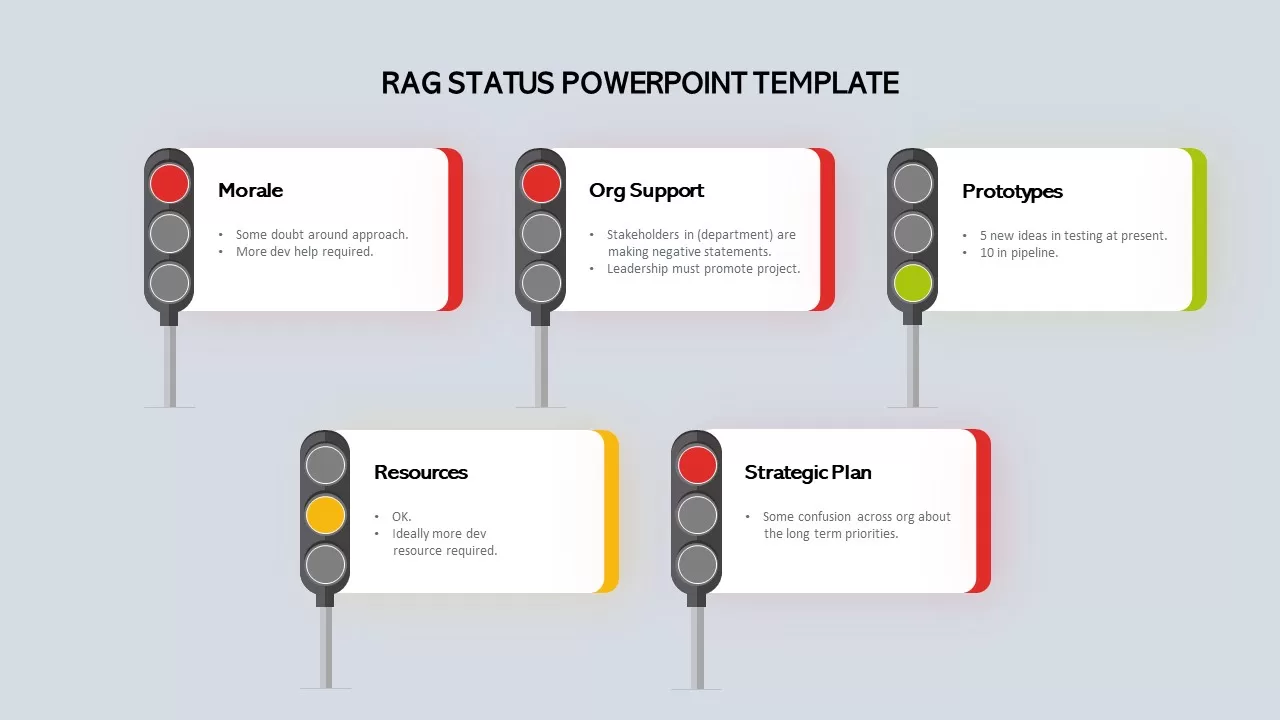
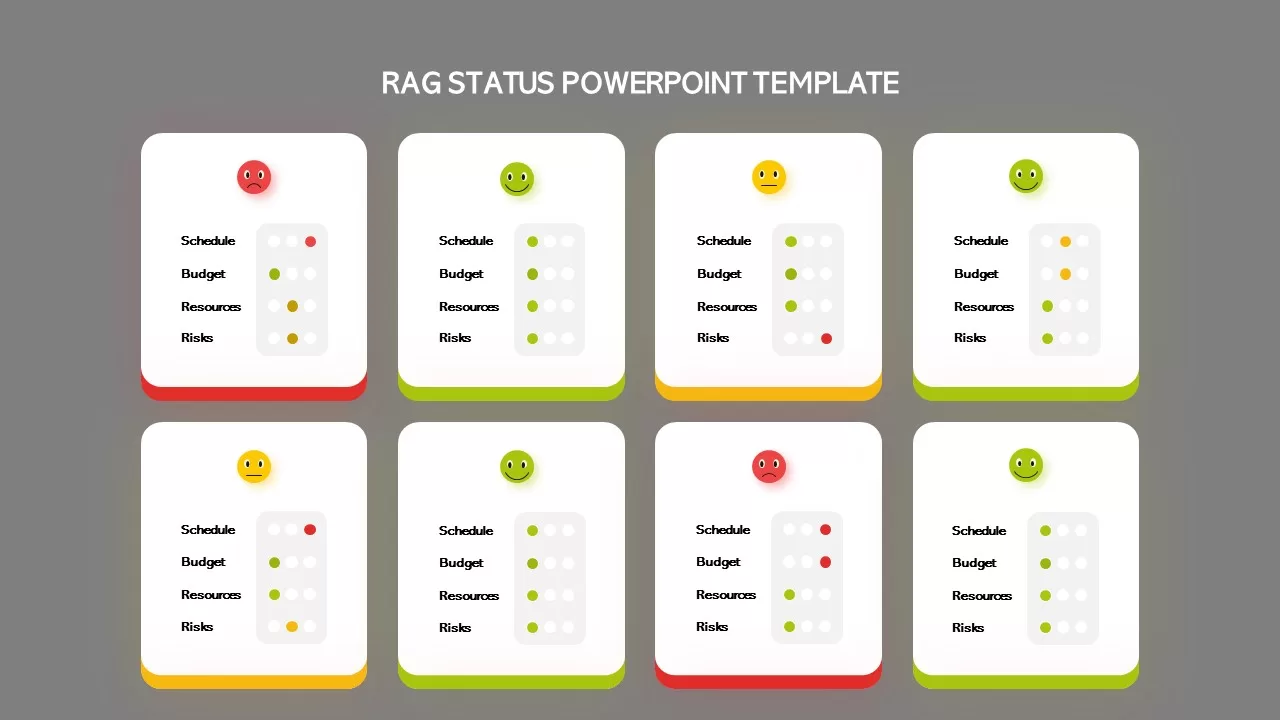
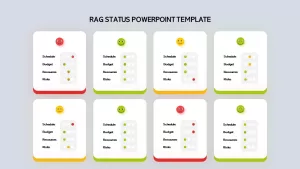
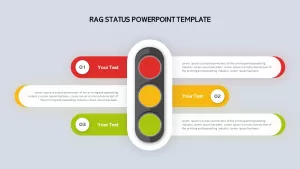
Choose from five versatile slide layouts: a striking cover slide with urban silhouettes and twin traffic signals; a series of five-step timeline templates using colored light icons; an emoji-driven status matrix for quick stakeholder updates; a clean table slide outlining RAG criteria and guidelines; and a grid of eight modular cards for multi-project dashboards.
Each element is fully editable—adjust colors, reposition icons, and swap text placeholders with ease. Subtle gradients, light shadows, and modern typography ensure your data remains the focal point while delivering a polished, professional aesthetic.
Optimized for both PowerPoint and Google Slides, these retina-ready slides support master layouts, drag-and-drop graphics, and consistent formatting across platforms. Whether you’re reporting to executives, aligning team members, or tracking program milestones, this template simplifies complex information into an instantly understandable visual narrative.
Who is it for
Project managers, PMO leads, business analysts, program directors, and team leaders will benefit from these RAG status slides when communicating progress, risks, and resource allocations.
Other Uses
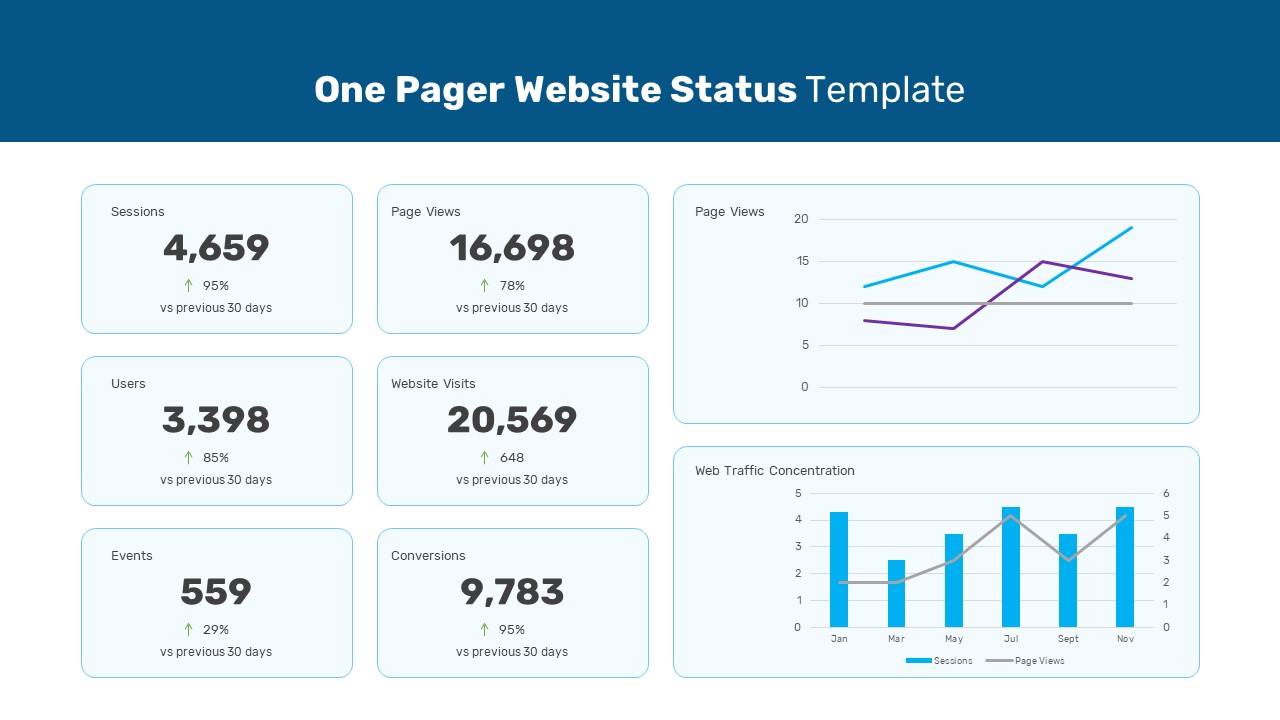
Beyond project reporting, repurpose these slides for performance dashboards, risk workshops, executive briefings, portfolio reviews, or KPI tracking across departments.
Login to download this file

Item ID
SB02143
Related Templates

Modern Project Status Report Dashboard Template for PowerPoint & Google Slides
Project Status
Premium
Clean Minimal Project Status Update Template for PowerPoint & Google Slides
Project
Premium
Project Status Dashboard Table Template for PowerPoint & Google Slides
Project Status
Premium
Project Status Dashboard with Metrics Template for PowerPoint & Google Slides
Project Status
Premium
Colorful Project Status Dashboard Template for PowerPoint & Google Slides
Project Status
Premium
Color-Coded Project Status Template for PowerPoint & Google Slides
Project Status
Premium
Color-Coded Project Status Slide Template for PowerPoint & Google Slides
Project Status
Premium
Project Status Table Template for PowerPoint & Google Slides
Project Status
Premium
Circular Project Status Template for PowerPoint & Google Slides
Project Status
Premium
Project Status Dashboard Template for PowerPoint & Google Slides
Project Status
Premium
Horizontal Timeline Project Status Template for PowerPoint & Google Slides
Project Status
Premium
Weekly Status Report Dashboard Template for PowerPoint & Google Slides
HR
Premium
Sprint Status Tracking Template for PowerPoint & Google Slides
Infographics
Premium
One Pager Website Status Template for PowerPoint & Google Slides
Digital Marketing
Premium
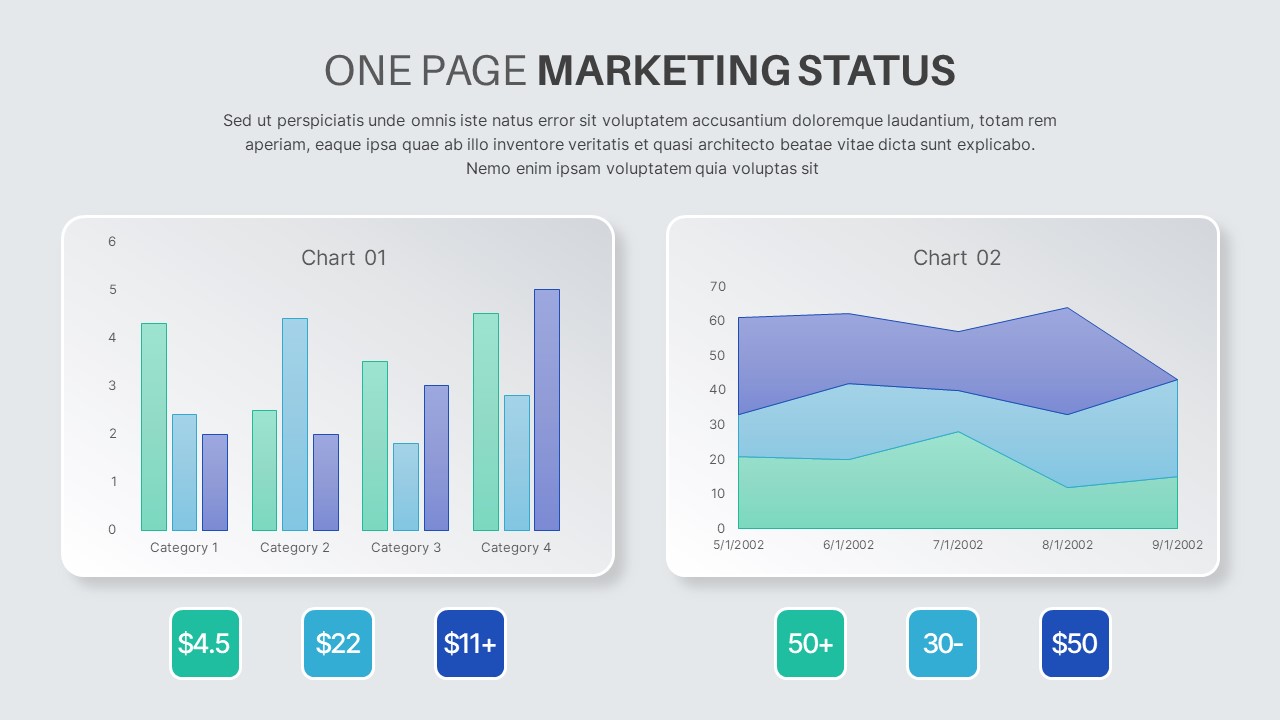
One Page Marketing Status Template for PowerPoint & Google Slides
Marketing
Premium
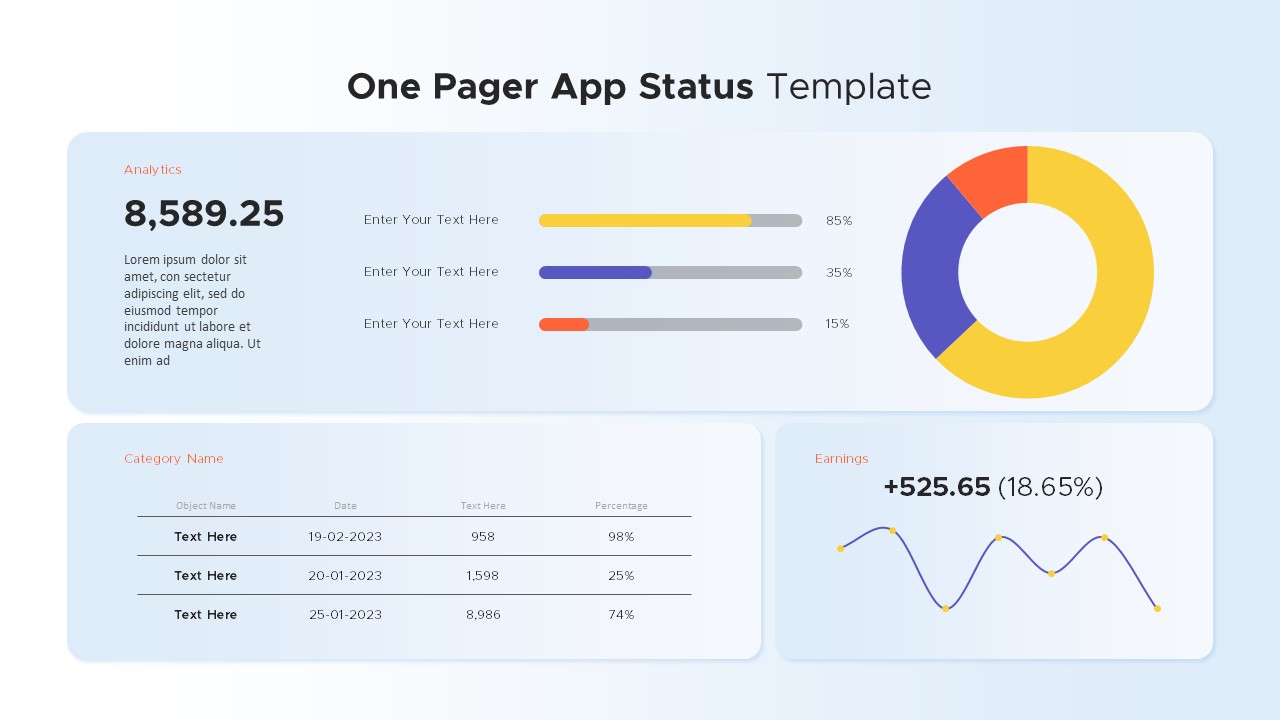
One Pager App Status template for PowerPoint & Google Slides
Business Report
Premium
One Pager Project Status Dashboard Template for PowerPoint & Google Slides
Project Status
Premium
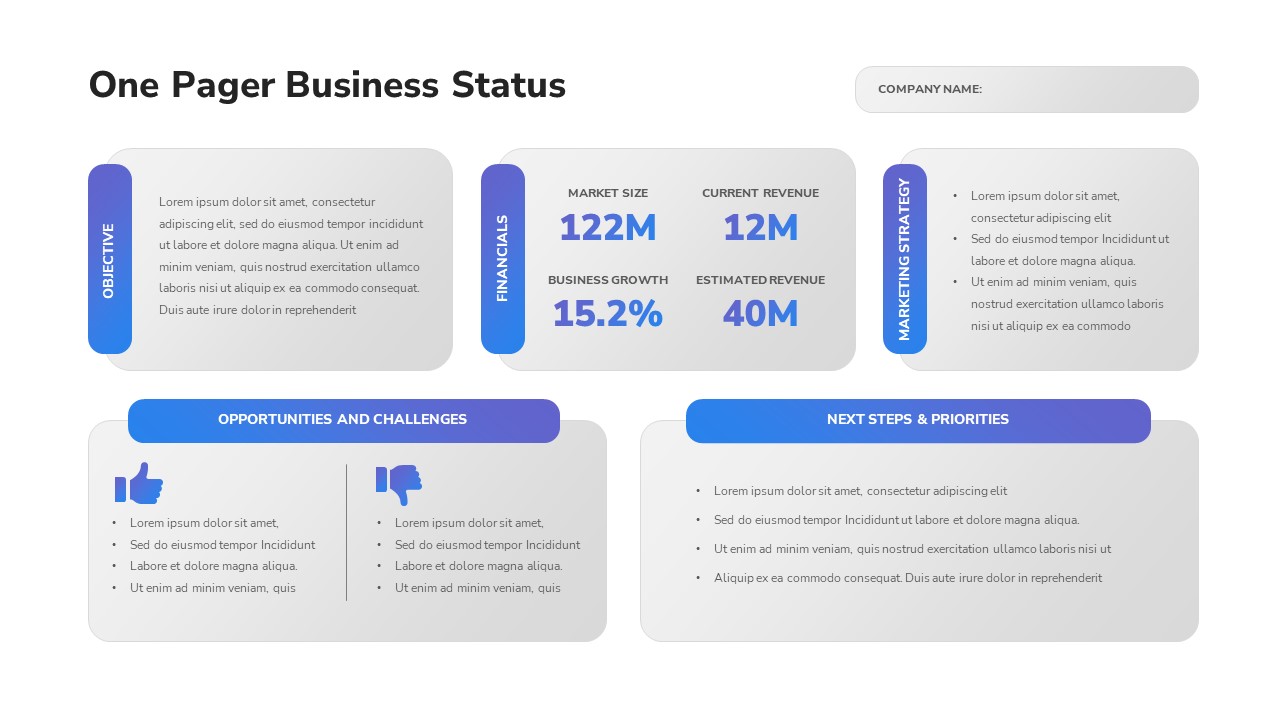
One-Pager Business Status Report Slide Template for PowerPoint & Google Slides
Business Report
Premium
Weekly Project Status Dashboard Template for PowerPoint & Google Slides
Project Status
Premium
Free Traffic Light Status Indicator Slide Template for PowerPoint & Google Slides
Project Status
Free
Free Simple Weekly Project Status Report Template for PowerPoint & Google Slides
Project Status
Free
Project Status Report Tracker Slide for PowerPoint & Google Slides
Project Status
Premium
Ongoing Investments and Project Status Template for PowerPoint & Google Slides
Project Status
Premium
Monthly Status Report Template for PowerPoint & Google Slides
Project Status
Premium
Speedometer Infographic Gauge Comparison Template for PowerPoint & Google Slides
Comparison
Premium

A/B Testing Comparison Infographic template for PowerPoint & Google Slides
Comparison
Premium
Gender Comparison People Infographic Template for PowerPoint & Google Slides
Comparison
Premium

Comparison Pricing Table Infographic Template for PowerPoint & Google Slides
Comparison Chart
Premium
Two-Column Comparison Infographic Slide Template for PowerPoint & Google Slides
Comparison
Premium
Seller Portals Comparison Infographic Template for PowerPoint & Google Slides
Process
Premium
Generations Comparison Infographic Template for PowerPoint & Google Slides
Timeline
Premium
Comparison Infographic Overview template for PowerPoint & Google Slides
Business
Premium
Before and After Comparison Infographic Template for PowerPoint & Google Slides
Comparison
Free
Free Global Warming Infographic Comparison Template for PowerPoint & Google Slides
Comparison Chart
Free
Types of AI Comparison Infographic Template for PowerPoint & Google Slides
AI
Premium
Hits & Misses Comparison Infographic Template for PowerPoint & Google Slides
Pitch Deck
Premium
Pricing Model Types Comparison Infographic Template for PowerPoint & Google Slides
Pitch Deck
Premium
VUCA vs BANI Comparison Infographic Template for PowerPoint & Google Slides
Comparison
Premium
Category Analysis Comparison Infographic Template for PowerPoint & Google Slides
Comparison
Premium
Service Zoom Feature Slides Comparison template for PowerPoint & Google Slides
Process
Premium
Gold Scales Balance Comparison Template for PowerPoint & Google Slides
Comparison
Premium
Four-Tier Pricing Comparison Table Template for PowerPoint & Google Slides
Comparison
Premium
Comparison Bar Chart template for PowerPoint & Google Slides
Comparison Chart
Premium
3-Column Comparison template for PowerPoint & Google Slides
Comparison
Premium
Four-Plan Pricing Table Comparison Template for PowerPoint & Google Slides
Comparison
Premium
Interactive Product Comparison Bar Chart Template for PowerPoint & Google Slides
Bar/Column
Premium
Interactive Pricing Plan Comparison Template for PowerPoint & Google Slides
Comparison
Premium
Tornado Chart Data Comparison Slide Template for PowerPoint & Google Slides
Bar/Column
Premium
Radar Chart Product Comparison Template for PowerPoint & Google Slides
Comparison Chart
Premium
Six-Metric Green Product Comparison Template for PowerPoint & Google Slides
Comparison
Premium
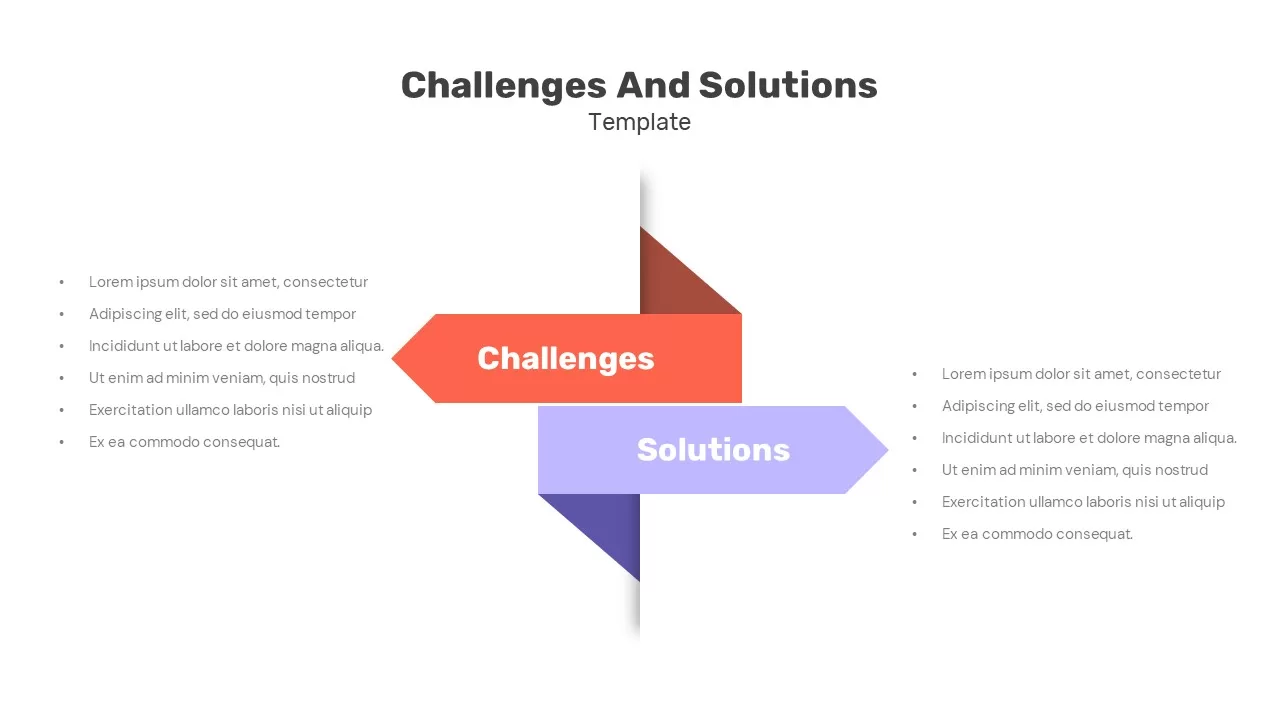
Challenges vs Solutions Comparison Template for PowerPoint & Google Slides
Comparison
Premium

Smart Work vs Hard Work Comparison for PowerPoint & Google Slides
Infographics
Premium
BMI Category Comparison Chart Template for PowerPoint & Google Slides
Comparison
Premium
Isometric 3D Block Comparison Diagram Template for PowerPoint & Google Slides
Comparison
Premium
Circular Product Comparison Chart Template for PowerPoint & Google Slides
Comparison Chart
Premium
Theory X and Theory Y Comparison Template for PowerPoint & Google Slides
Comparison
Premium
Competitive Landscape Comparison Template Pack for PowerPoint & Google Slides
Comparison
Premium
Before and After Comparison Infographics Template for PowerPoint & Google Slides
Comparison
Premium
Current vs Future State Comparison Slide Template for PowerPoint & Google Slides
Comparison Chart
Premium
Current vs Future State Comparison Template for PowerPoint & Google Slides
Comparison Chart
Premium
Dynamic Benchmarking Comparison Chart Template for PowerPoint & Google Slides
Comparison Chart
Premium
Challenges & Solutions Comparison Template for PowerPoint & Google Slides
Opportunities Challenges
Premium
Challenges and Opportunities Comparison Slide for PowerPoint & Google Slides
Opportunities Challenges
Premium
Challenges and Solutions Comparison Slide for PowerPoint & Google Slides
Opportunities Challenges
Premium
Adam’s Equity Theory Scale Comparison Template for PowerPoint & Google Slides
Comparison
Premium
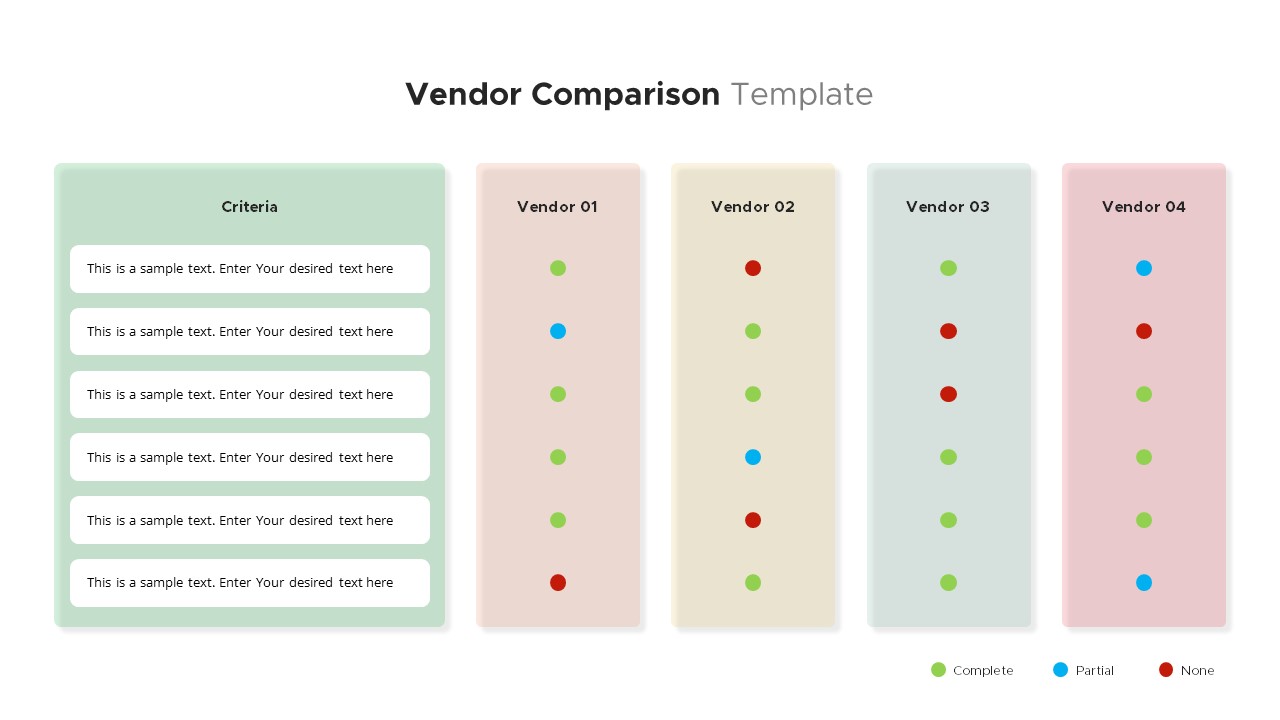
Vendor Comparison Slide for PowerPoint & Google Slides
Comparison
Premium
Vendor Comparison Slide for PowerPoint & Google Slides
Business Proposal
Premium
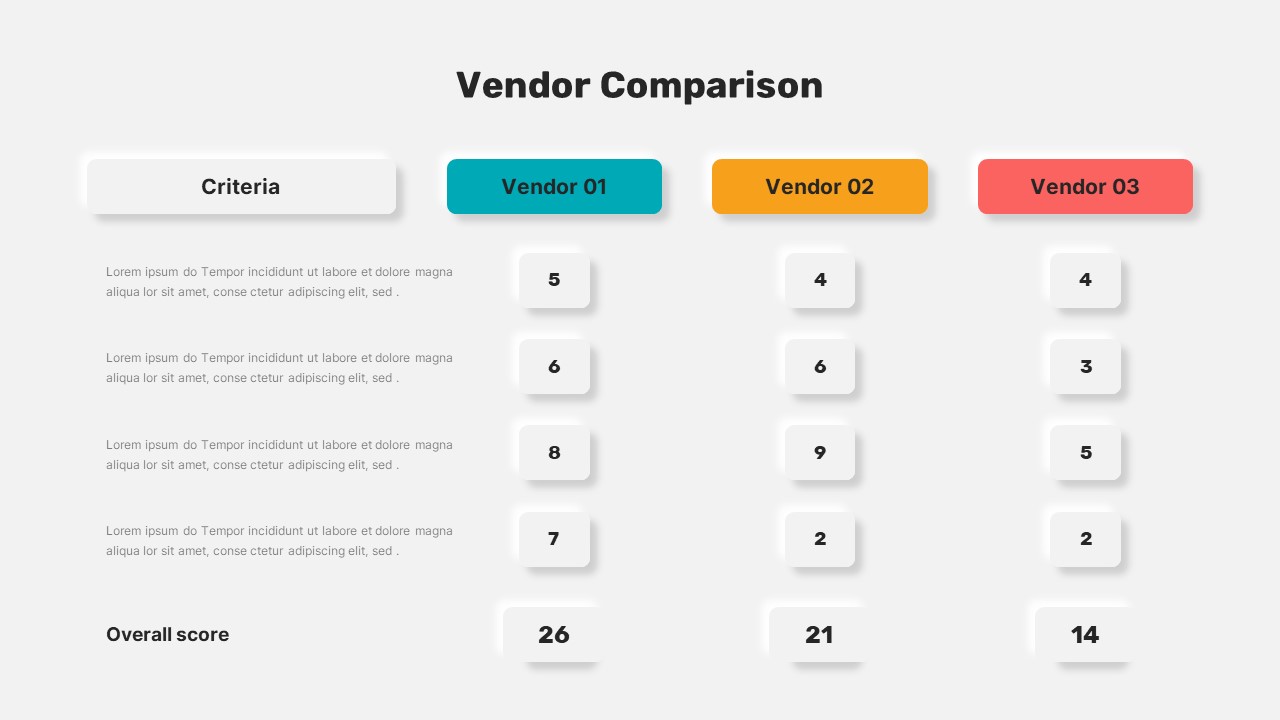
Vendor Comparison Analysis template for PowerPoint & Google Slides
Comparison Chart
Premium
Vendor Comparison Matrix with High-Level Requirements template for PowerPoint & Google Slides
Comparison Chart
Premium
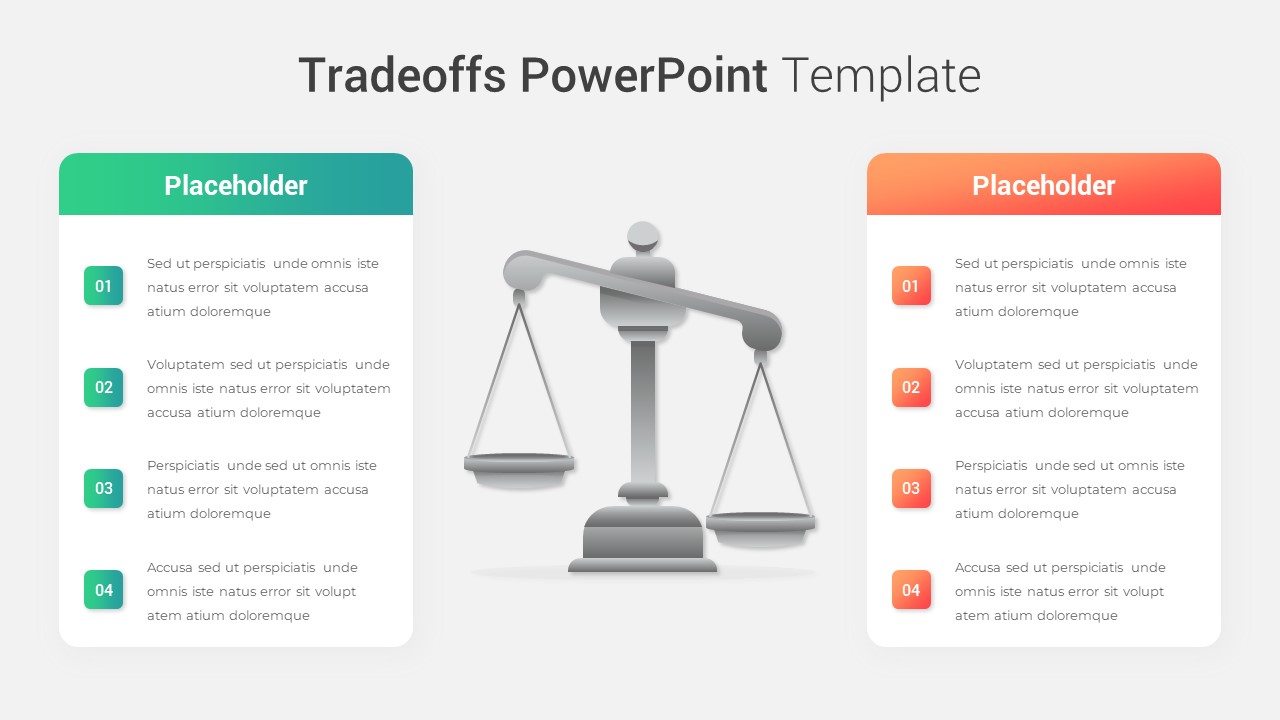
Modern Tradeoffs Comparison Slide Template for PowerPoint & Google Slides
Comparison
Premium
Popular Social Media Comparison Grid Template for PowerPoint & Google Slides
Digital Marketing
Premium
Hits and Misses Performance Comparison Template for PowerPoint & Google Slides
Comparison
Premium
Conflict Infographics Comparison Template for PowerPoint & Google Slides
Infographics
Premium
Clustered Bar Chart Comparison Template for PowerPoint & Google Slides
Bar/Column
Premium
Business Timeline Comparison Bar Chart Template for PowerPoint & Google Slides
Comparison Chart
Premium
Grouped Column Chart Comparison Template for PowerPoint & Google Slides
Bar/Column
Premium
Multiple Line Chart Comparison Template for PowerPoint & Google Slides
Comparison Chart
Premium
Interactive Multi-Use Cost Comparison Template for PowerPoint & Google Slides
Comparison
Premium
Free Pros and Cons Comparison Template for PowerPoint & Google Slides
Comparison
Free
Free Versatile Product Comparison Chart Template for PowerPoint & Google Slides
Comparison Chart
Free
Boss vs Leader Comparison Slide for PowerPoint & Google Slides
Leadership
Premium
Free Three-Option Comparison Slide for PowerPoint & Google Slides
Comparison
Free
Dynamic Bar-of-Pie Chart Comparison Template for PowerPoint & Google Slides
Pie/Donut
Premium
Regional Revenue Comparison Overview Template for PowerPoint & Google Slides
Comparison
Premium
Project Comparison Timeline Roadmap Template for PowerPoint & Google Slides
Comparison
Premium
Good vs Bad Comparison with Scale Template for PowerPoint & Google Slides
Comparison
Premium
Three-Category Comparison Template for PowerPoint & Google Slides
Comparison
Premium
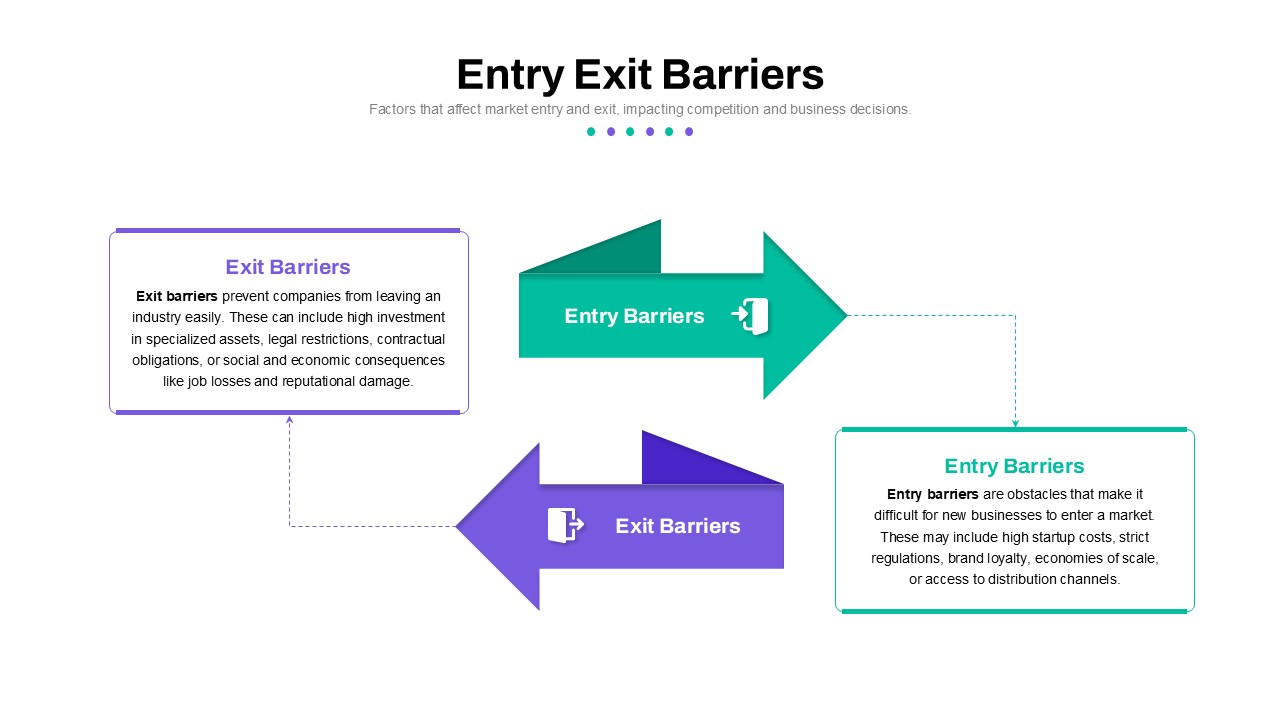
Entry and Exit Barriers Comparison Template for PowerPoint & Google Slides
Comparison
Premium
Profile Comparison Chart template for PowerPoint & Google Slides
Comparison Chart
Premium
Integrative Thinking Comparison Diagram Template for PowerPoint & Google Slides
Comparison
Premium
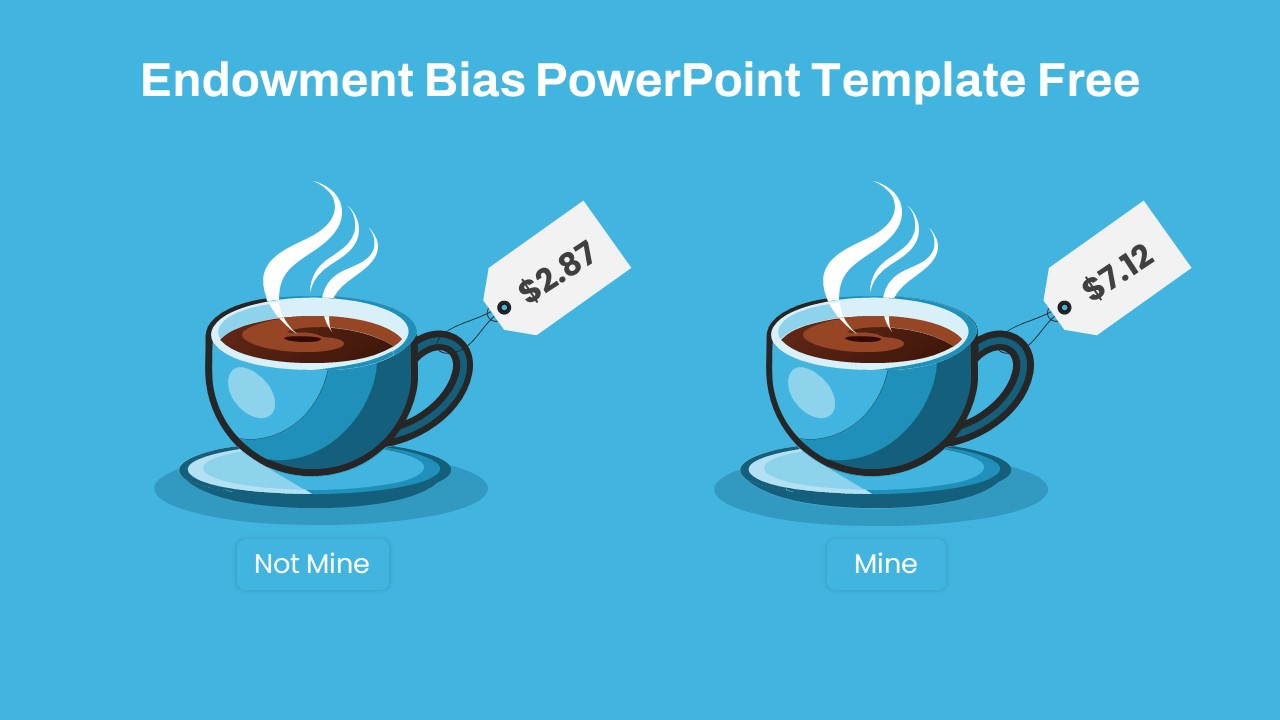
Endowment Bias Coffee Price Comparison Template for PowerPoint & Google Slides
Comparison
Free
Sales Growth Comparison Chart & Table Template for PowerPoint & Google Slides
Bar/Column
Premium
Two Section Comparison template for PowerPoint & Google Slides
Business Proposal
Premium
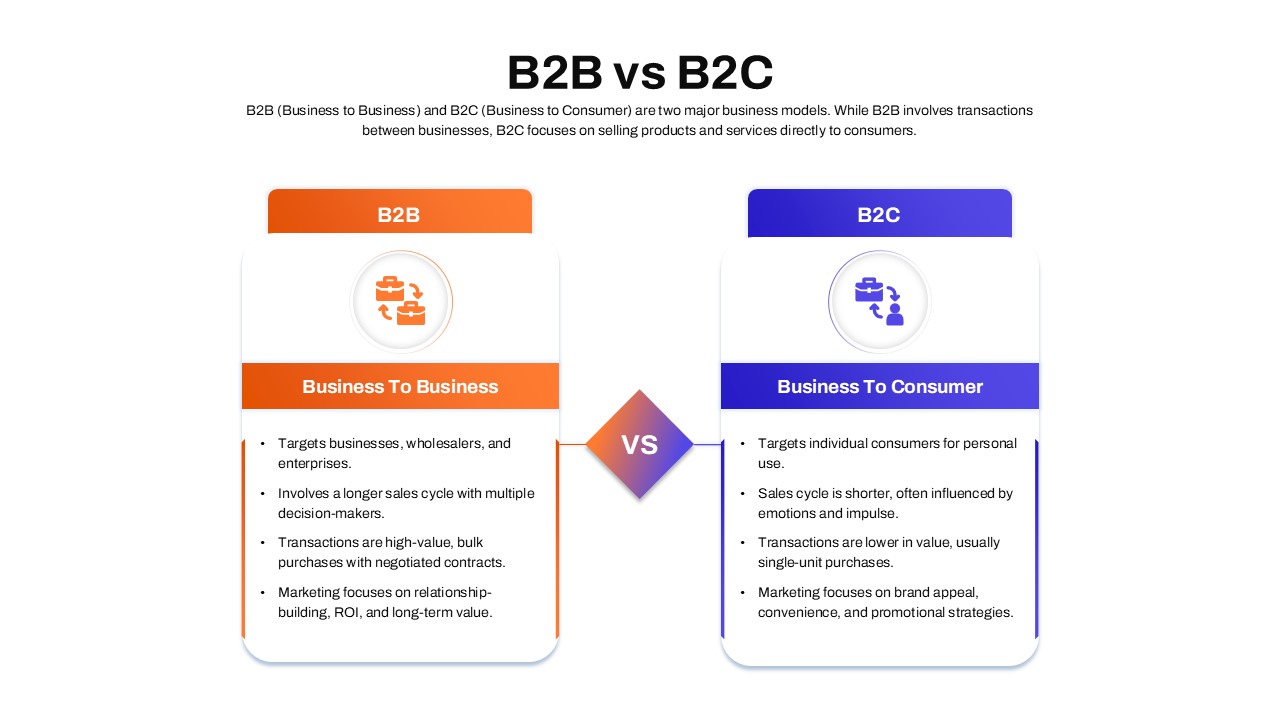
B2B vs B2C Comparison template for PowerPoint & Google Slides
Business Models
Premium
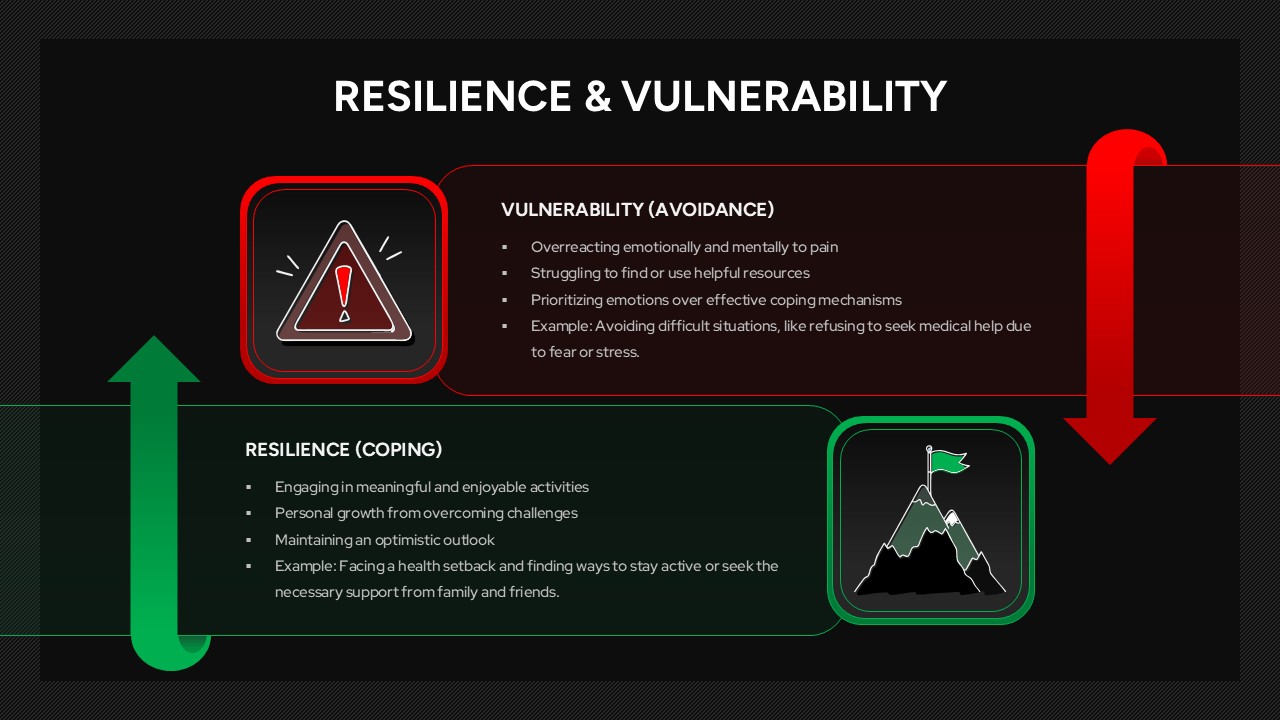
Resilience & Vulnerability Comparison Template for PowerPoint & Google Slides
Comparison
Premium
Skills Gap Analysis Comparison Chart Template for PowerPoint & Google Slides
Comparison
Premium
Attribution Models Comparison Diagram Template for PowerPoint & Google Slides
Comparison
Premium
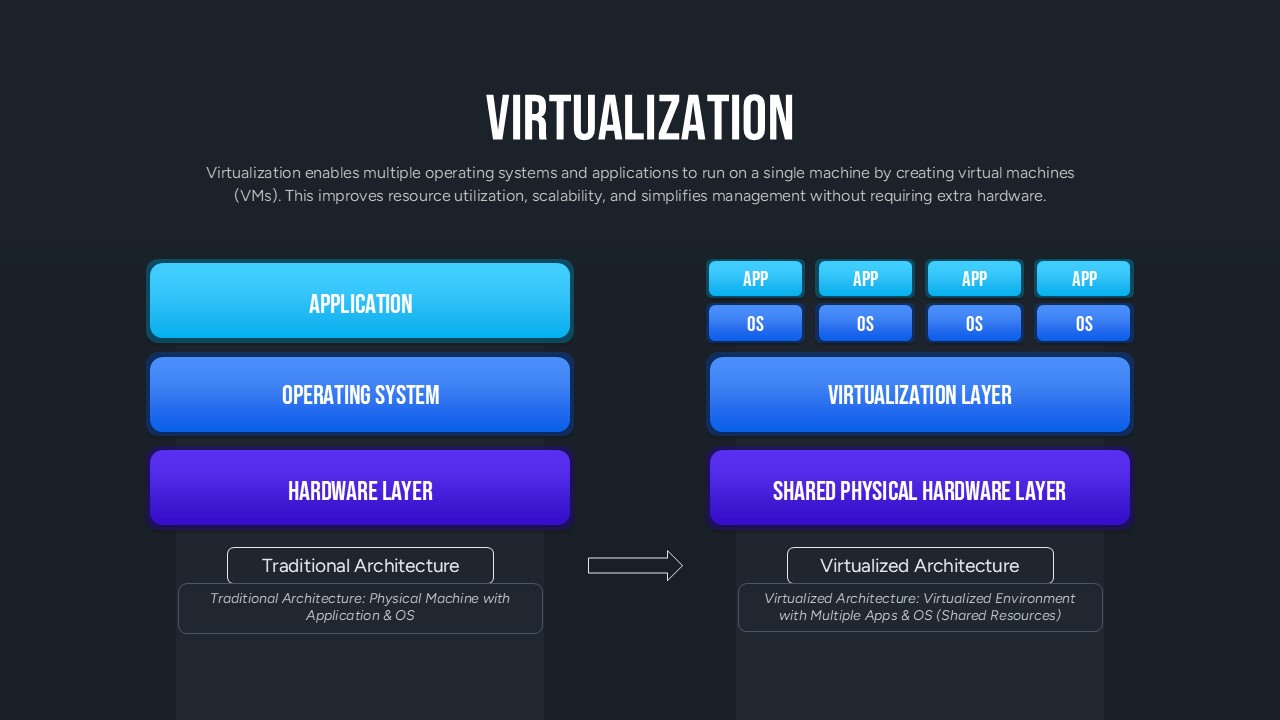
Virtualization Architecture Comparison Template for PowerPoint & Google Slides
Comparison Chart
Premium
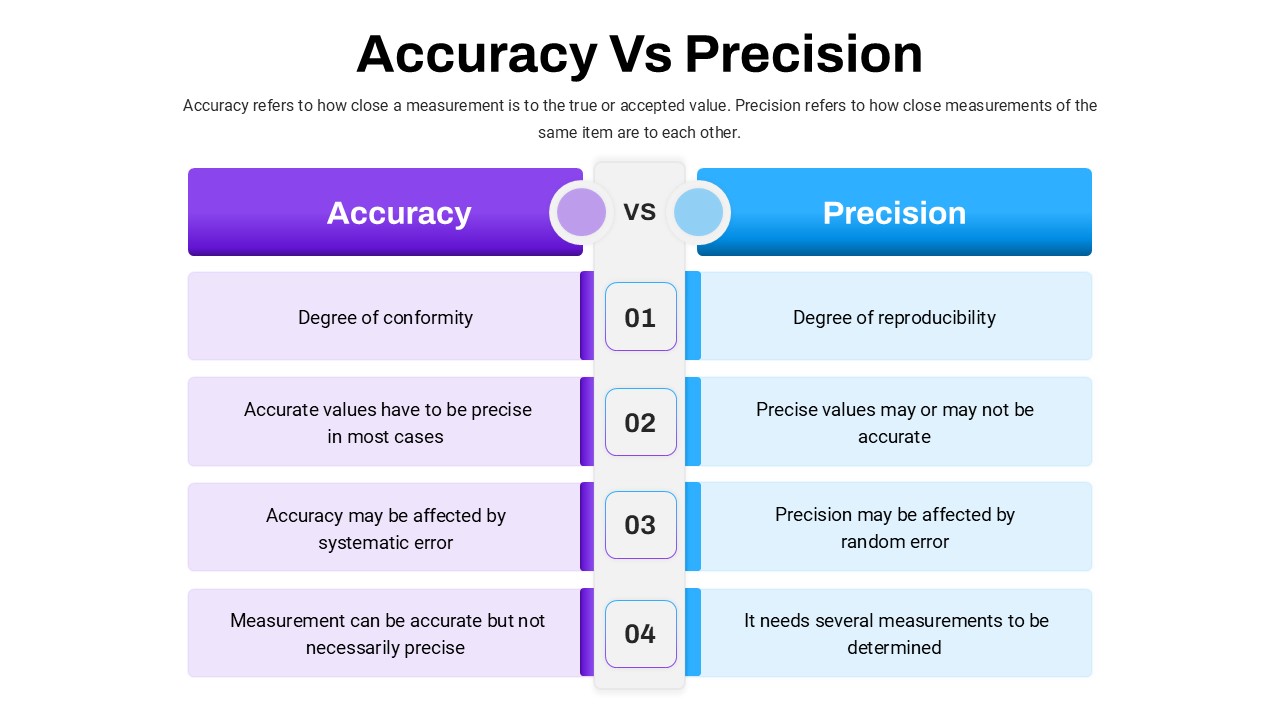
Accuracy Vs Precision Comparison Template for PowerPoint & Google Slides
Comparison Chart
Premium
Internal vs External Hiring Comparison Template for PowerPoint & Google Slides
Comparison
Premium