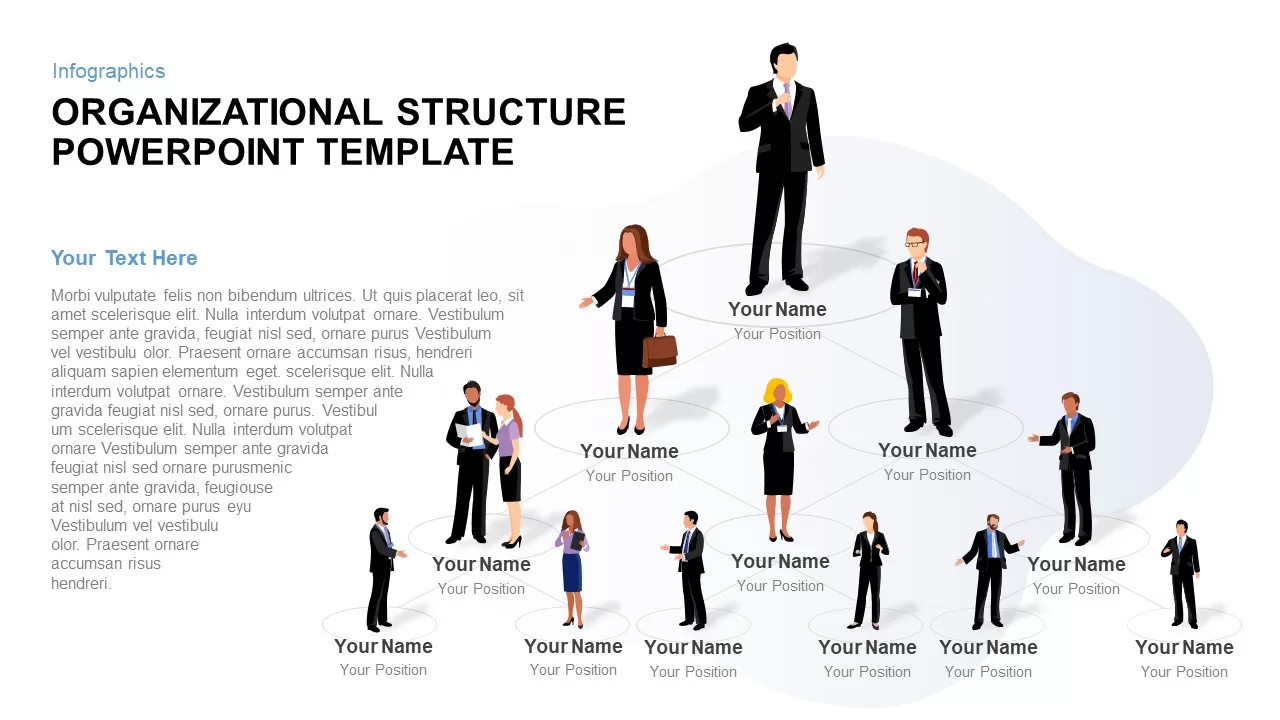
Organizational People Percentage Chart template for PowerPoint & Google Slides
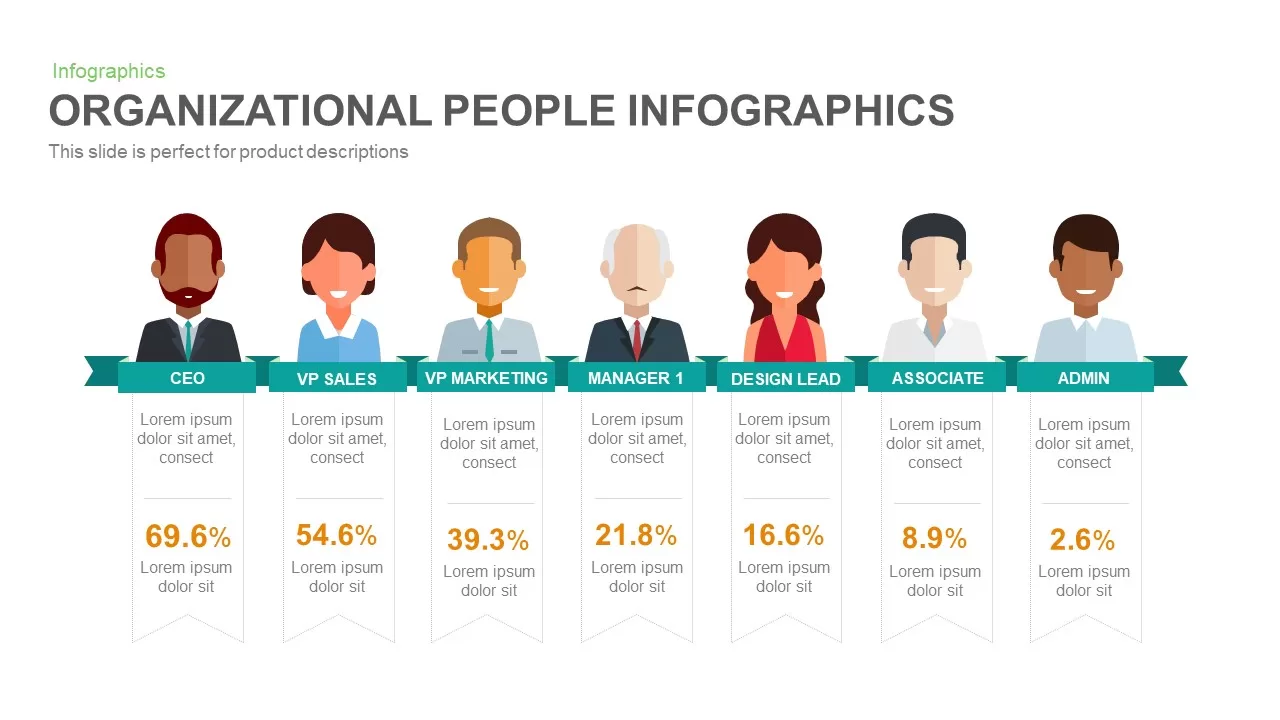
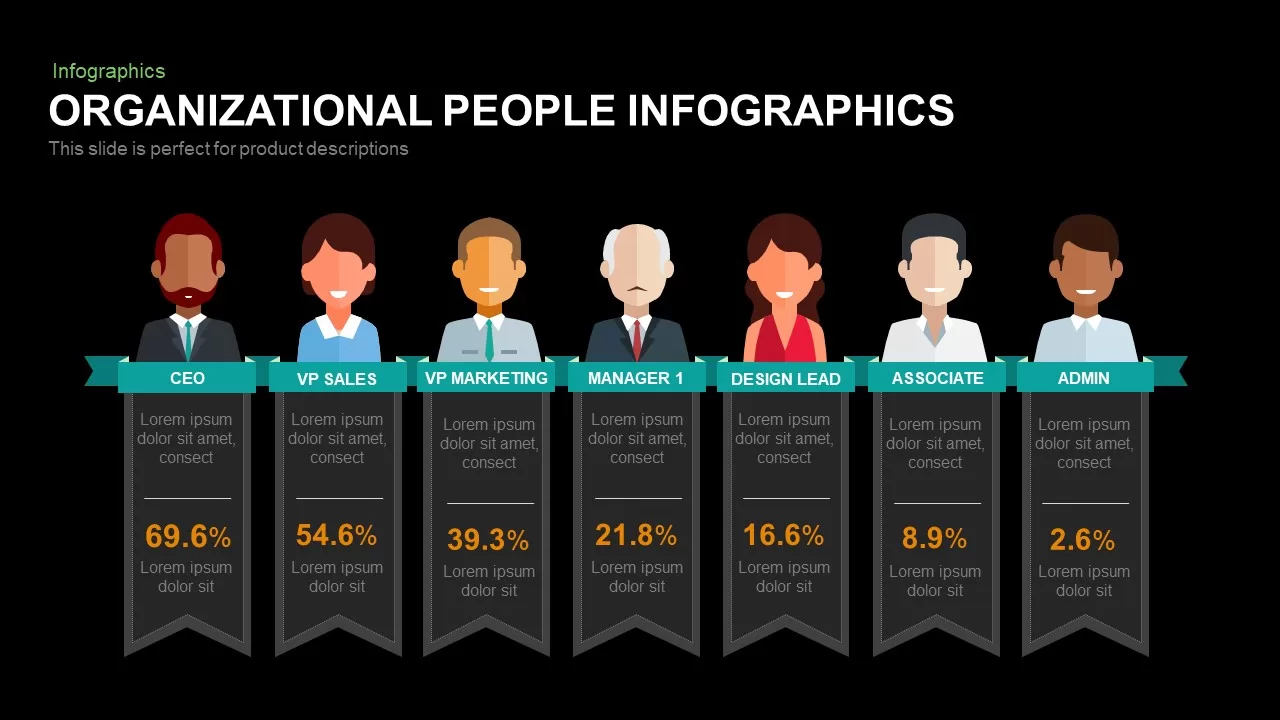
Leverage this organizational people infographic slide to present your team structure and distribution with clarity and impact. This fully editable layout features seven illustrated avatars listing roles from CEO through Admin, each accompanied by a bold banner and percentage metric. The avatars are set against subtle transparent silhouettes in the background, creating depth while keeping focus on the data. Under each avatar, space for a brief description and large numeric placeholder allow you to highlight key statistics such as headcount share, resource allocation, or performance metrics. The flat, vector-based design ensures crisp visuals at any size, with master slide integration enabling global edits to colors, fonts, and iconography. Simply swap avatars, adjust percentages, or replace banners to match your organizational context. The clean white canvas and consistent spacing maintain a professional aesthetic that aligns with corporate branding. Use this slide to compare team segments, illustrate leadership structures, or visualize talent distribution across departments. Clone and reorder columns to expand beyond seven roles if needed. Compatible with both PowerPoint and Google Slides, this infographic preserves layout integrity and high-resolution output across platforms, devices, and resolutions, reducing version control issues. Enhance viewer engagement by animating individual avatars or fading in percentages. Incorporate custom icons or color highlights to denote status levels or priority roles. Whether you’re preparing an executive briefing, HR report, or board presentation, this people infographic slide transforms raw organizational data into compelling visuals that foster alignment and drive action. Modify banner colors to align with department color codes or animate each column for dynamic storytelling. Leverage the built-in grouping hierarchy to lock structural elements while updating content swiftly during team meetings or virtual workshops.
Who is it for
HR managers, team leaders, and executives can leverage this infographic to communicate team composition, headcount distribution, and department breakdowns. Business consultants, talent acquisition specialists, and project managers will also find it valuable for illustrating resource allocation and organizational structure to stakeholders. Educators and trainers can use it to demonstrate role hierarchies in academic or workshop settings.
Other Uses
Repurpose this slide to display skill proficiency levels, employee satisfaction scores, or training completion rates by role. Adapt the format for showcasing customer personas, demographic segments, or survey findings by replacing avatars and updating percentage metrics. Use it to visualize budget allocation per department or highlight performance benchmarks across teams.
Login to download this file

Item ID
SB00365
Related Templates

Dual Percentage Comparison Metaphor Template for PowerPoint & Google Slides
Comparison
Premium

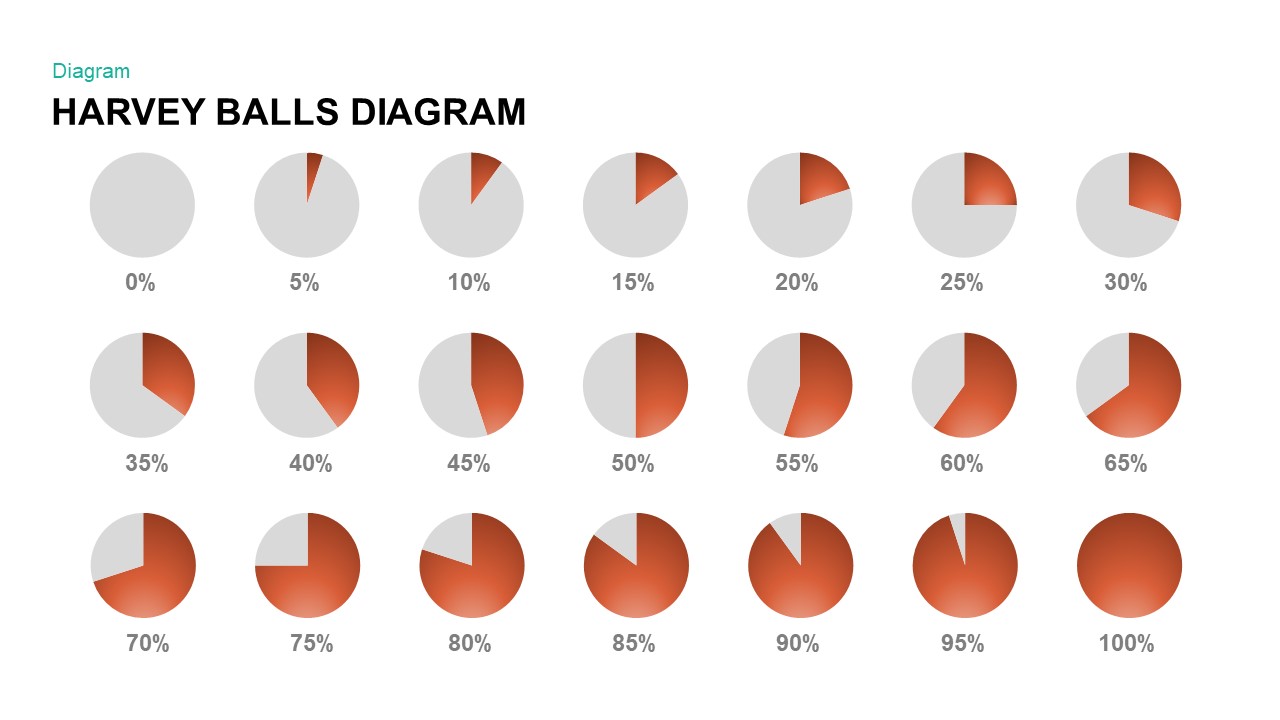
Harvey Balls Percentage Infographic Template for PowerPoint & Google Slides
Harvey Balls
Premium
Bottle Data Percentage Infographic Template for PowerPoint & Google Slides
Infographics
Premium
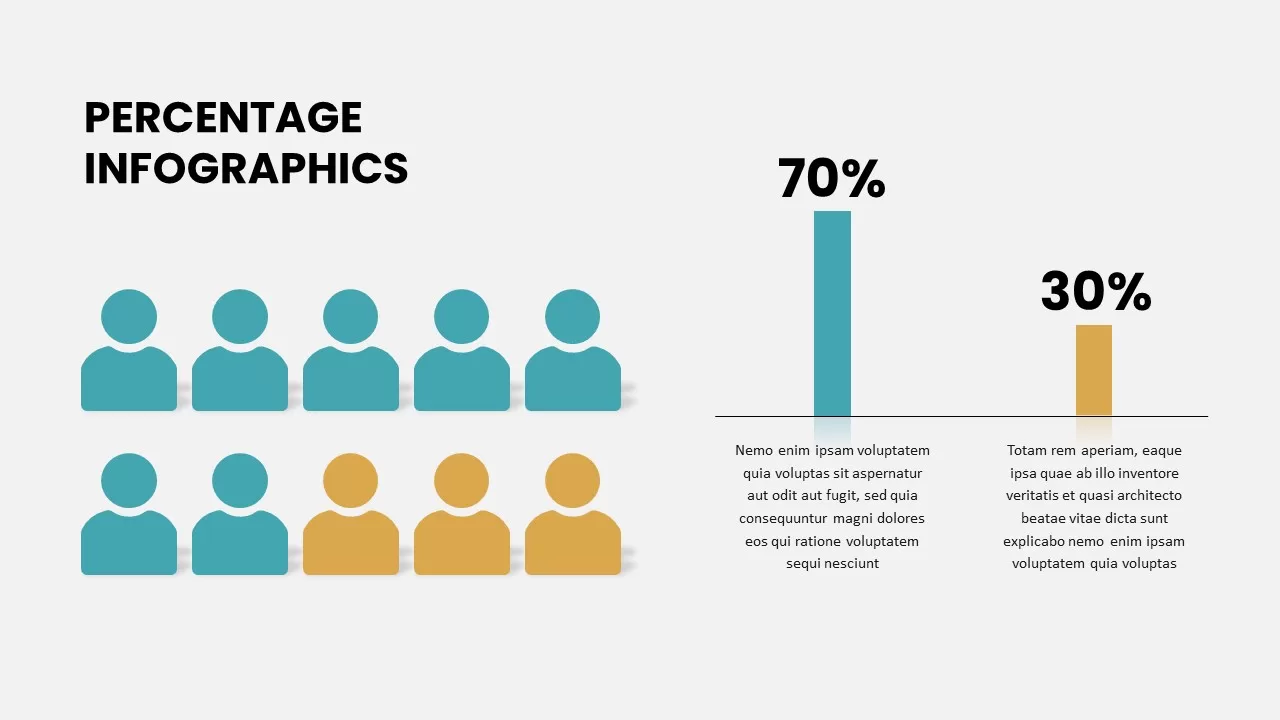
Free Percentage Infographics template for PowerPoint & Google Slides
Comparison
Free
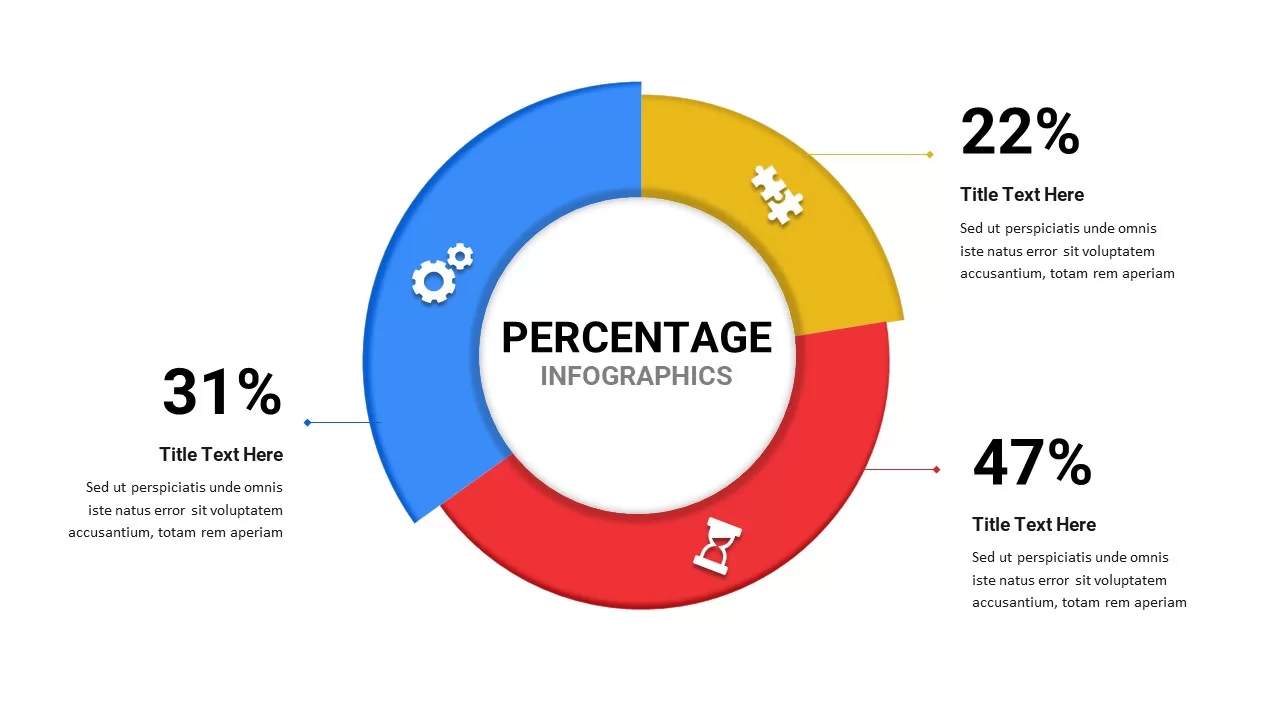
Percentage Infographics template for PowerPoint & Google Slides
Comparison
Premium
North America Percentage Map Infographic Template for PowerPoint & Google Slides
World Maps
Premium
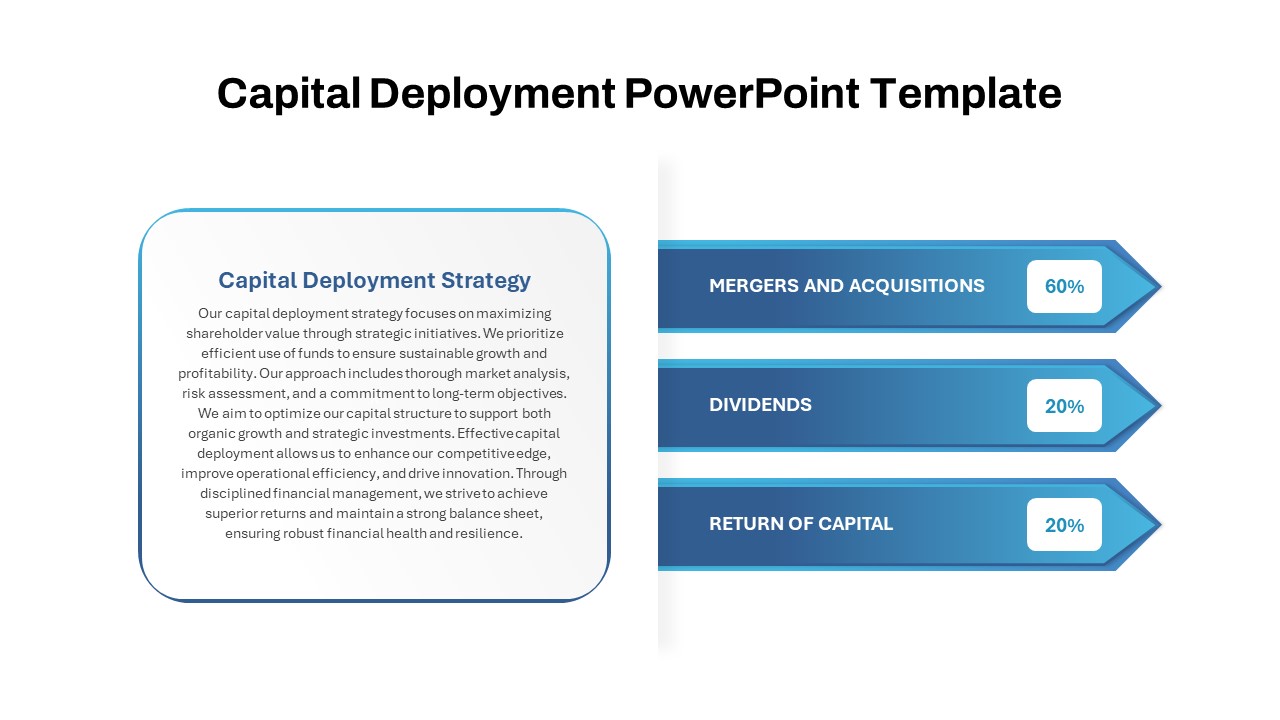
Capital Deployment Percentage Breakdown Template for PowerPoint & Google Slides
Pitch Deck
Premium
Five-Stage People Infographic Chart template for PowerPoint & Google Slides
Process
Premium
People Demographic Comparison Chart Template for PowerPoint & Google Slides
Comparison
Premium
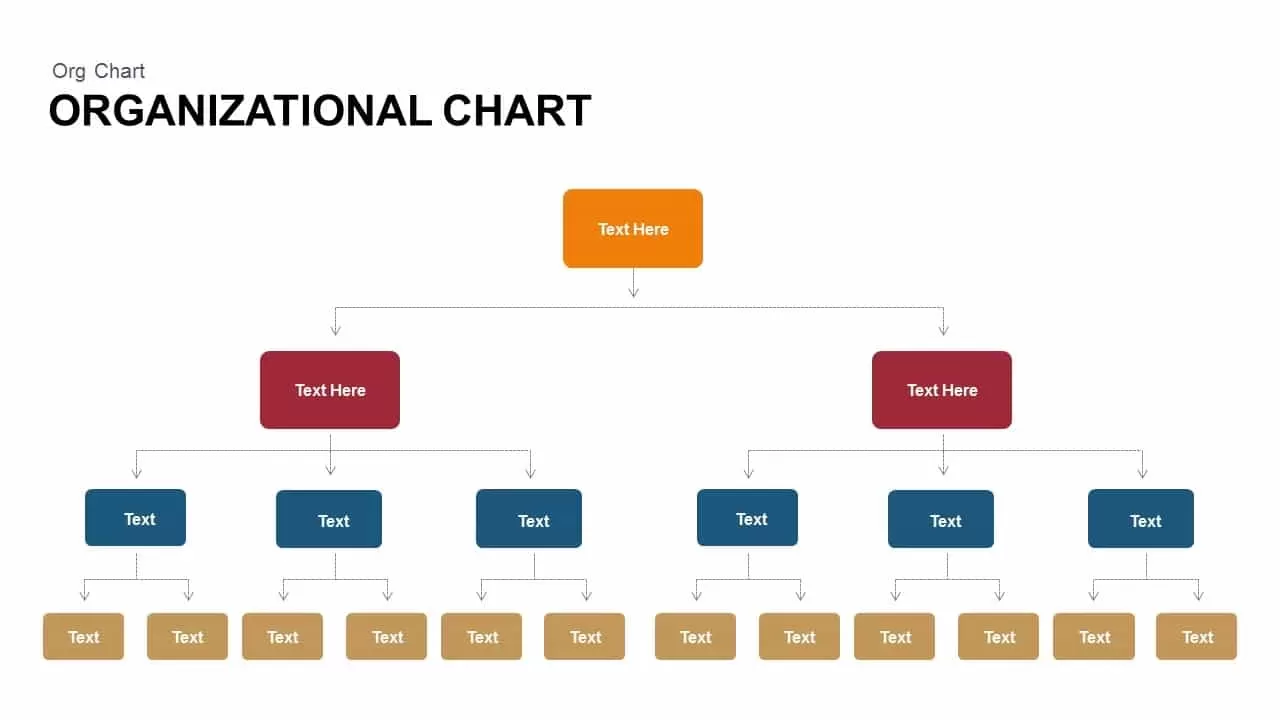
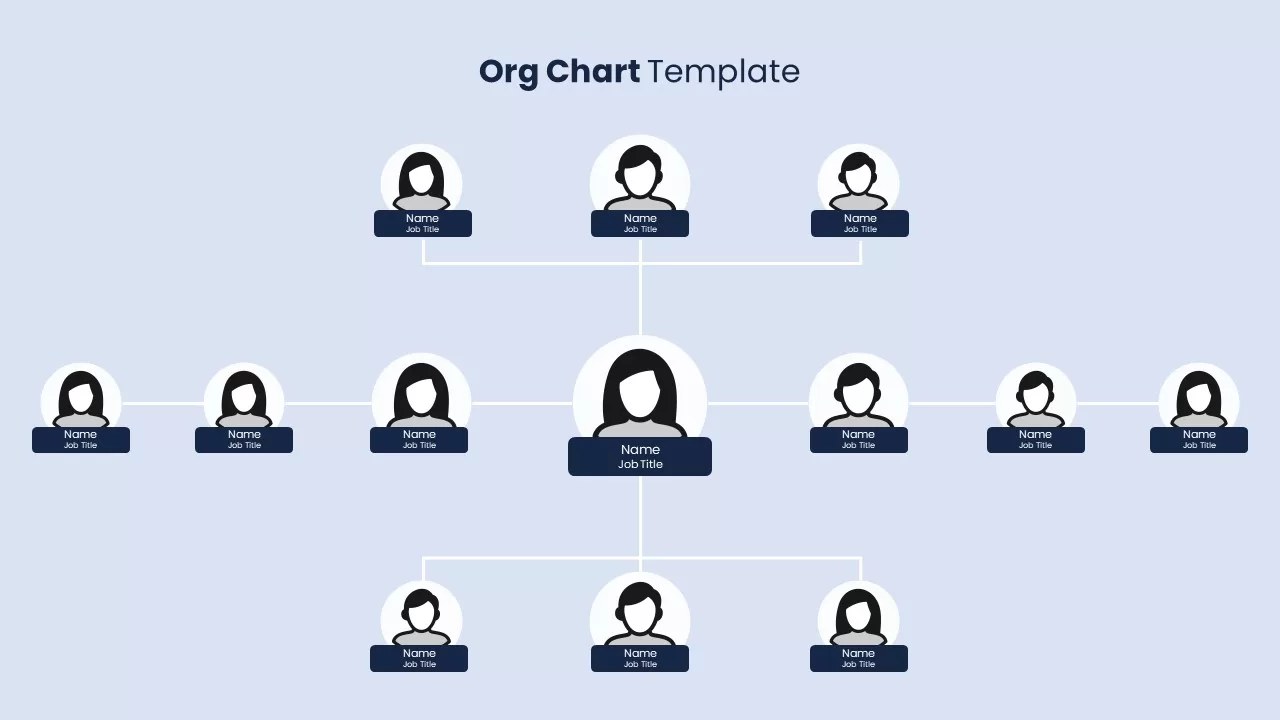
Simple Organizational Chart Infographic Template for PowerPoint & Google Slides
Org Chart
Premium
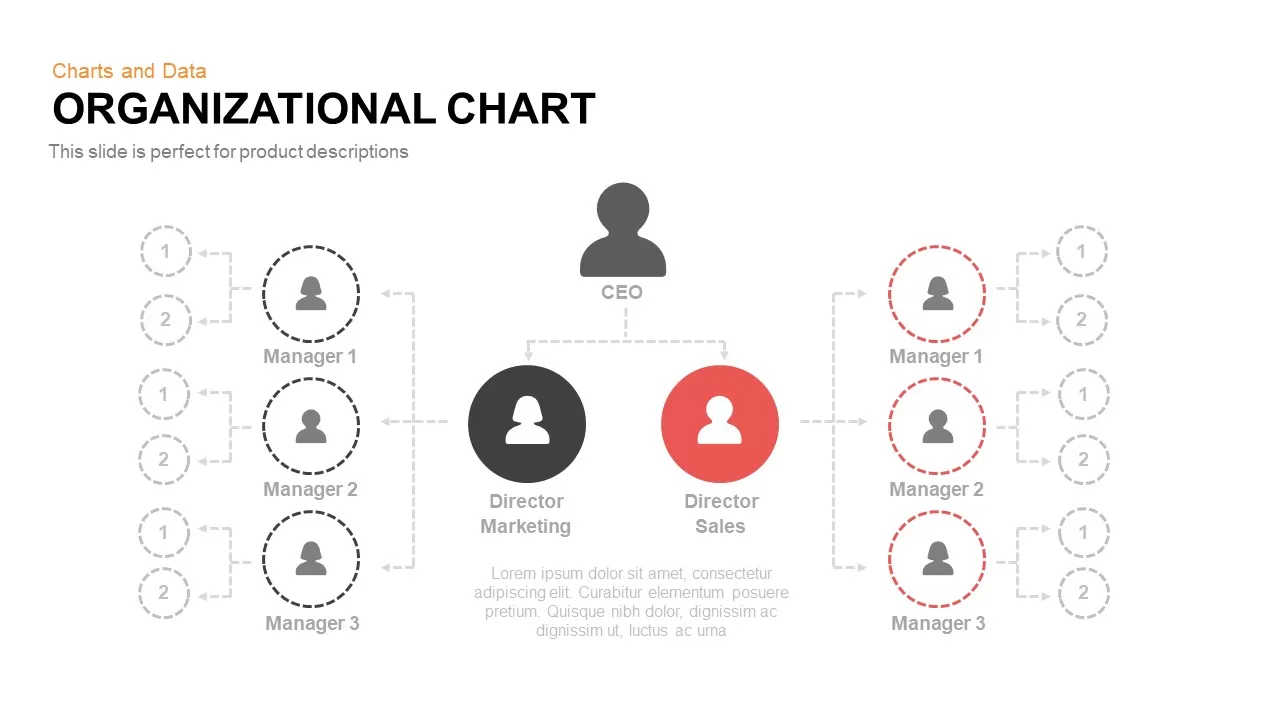
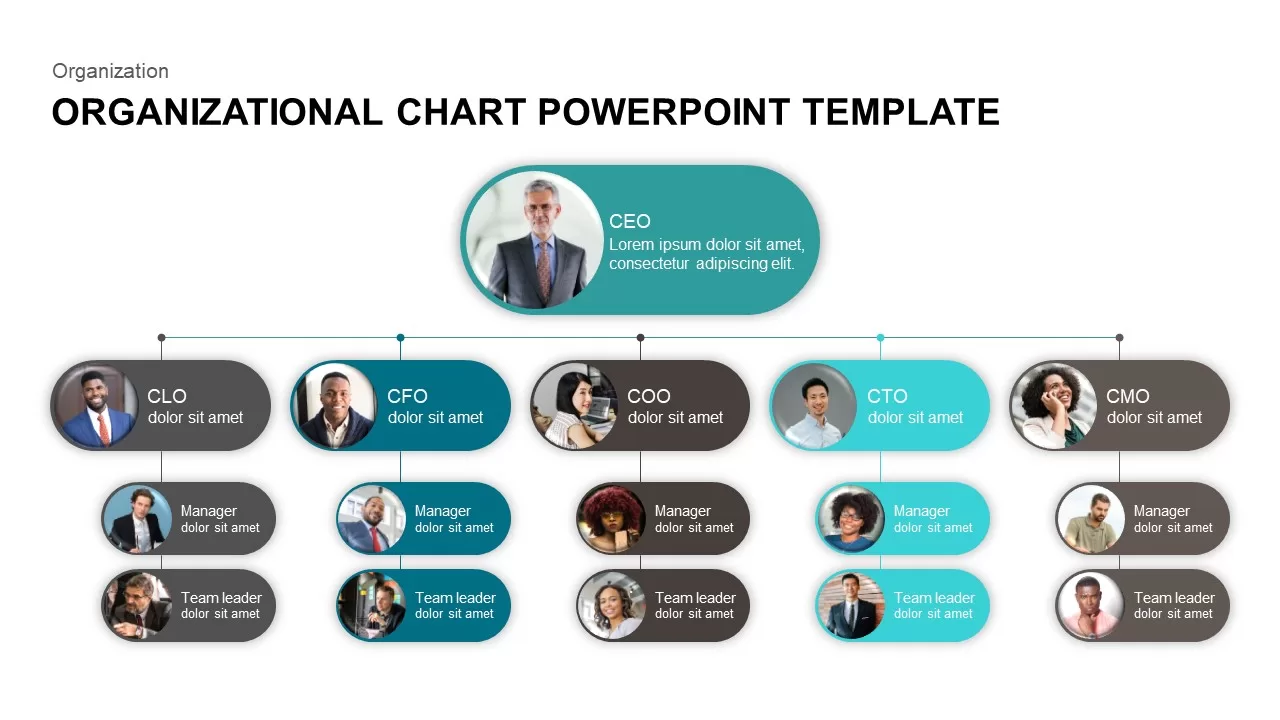
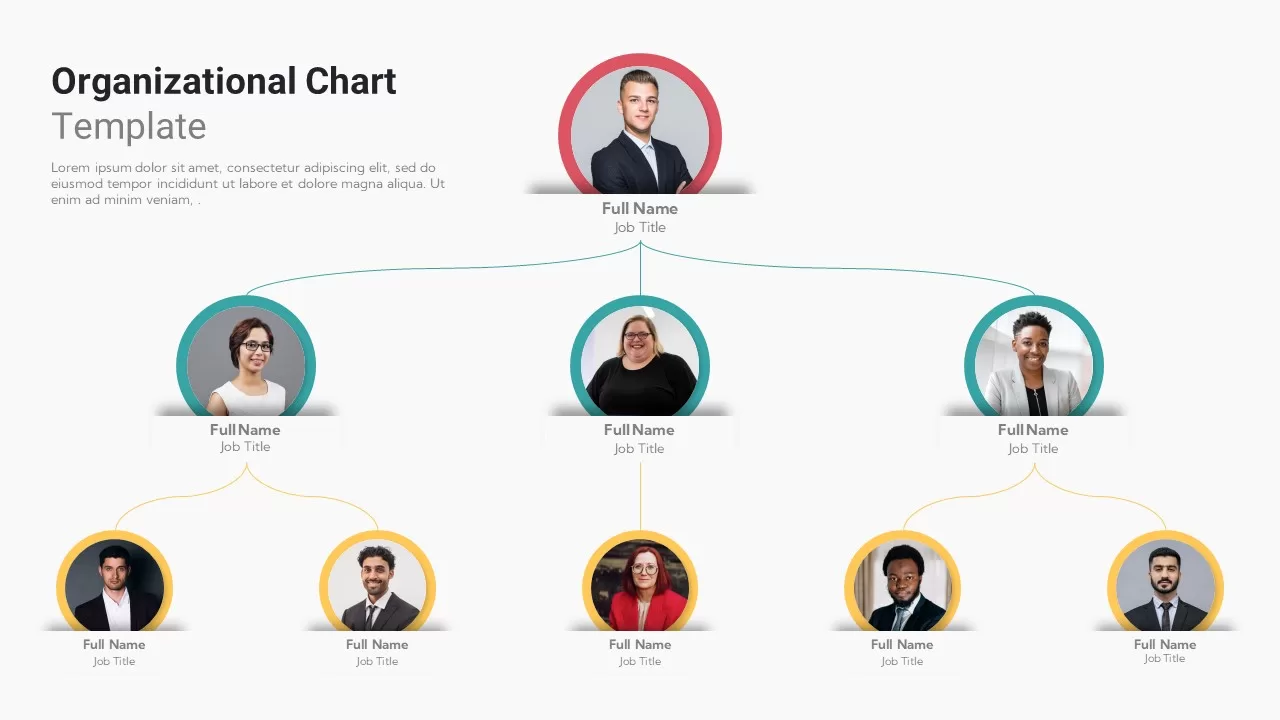
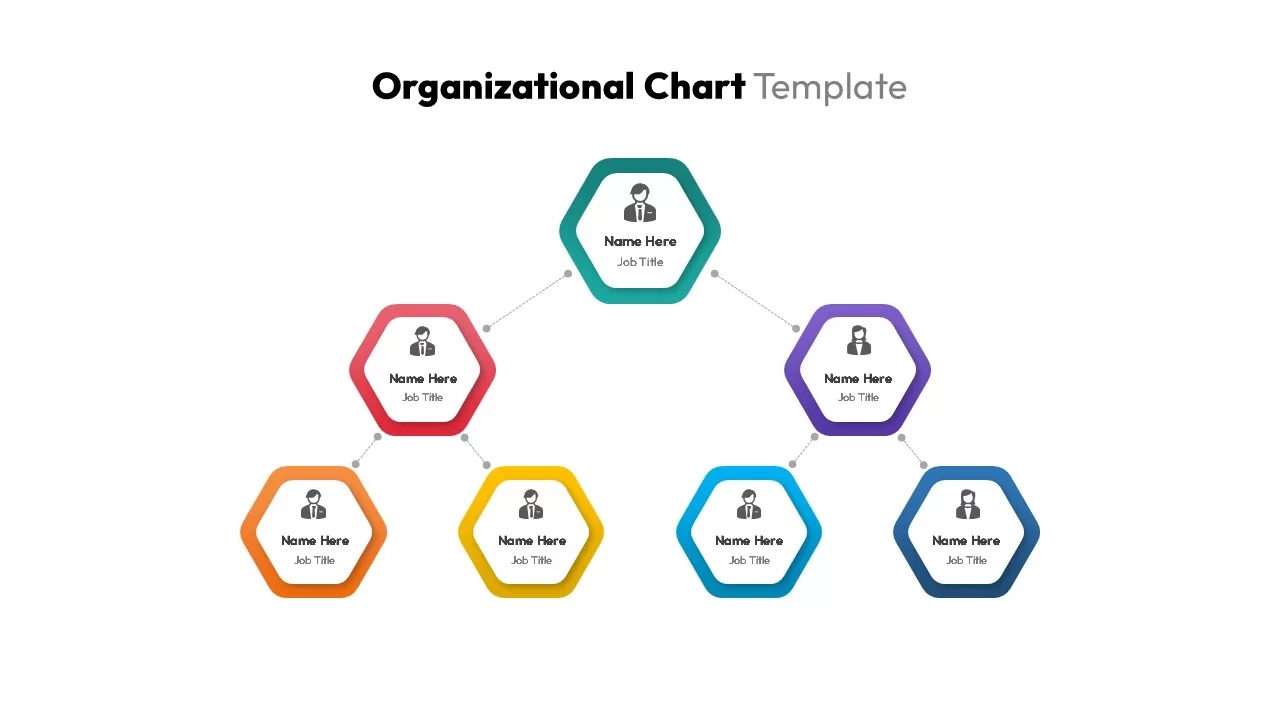
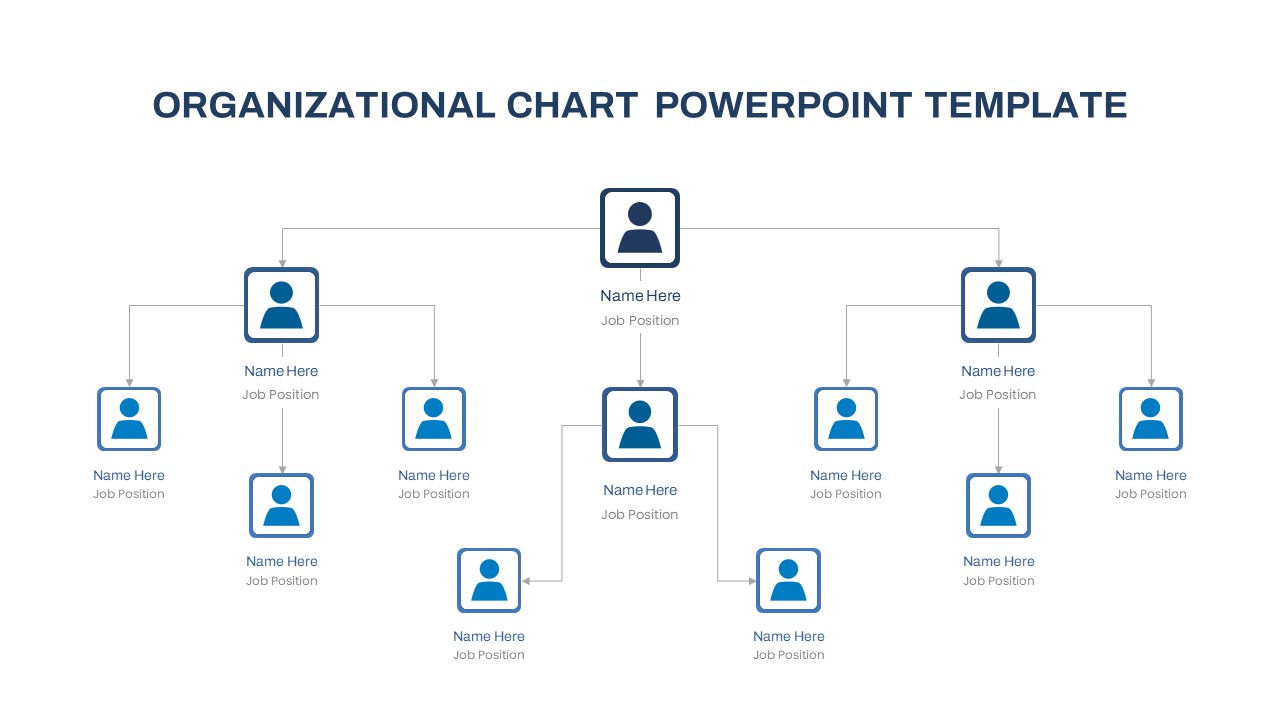
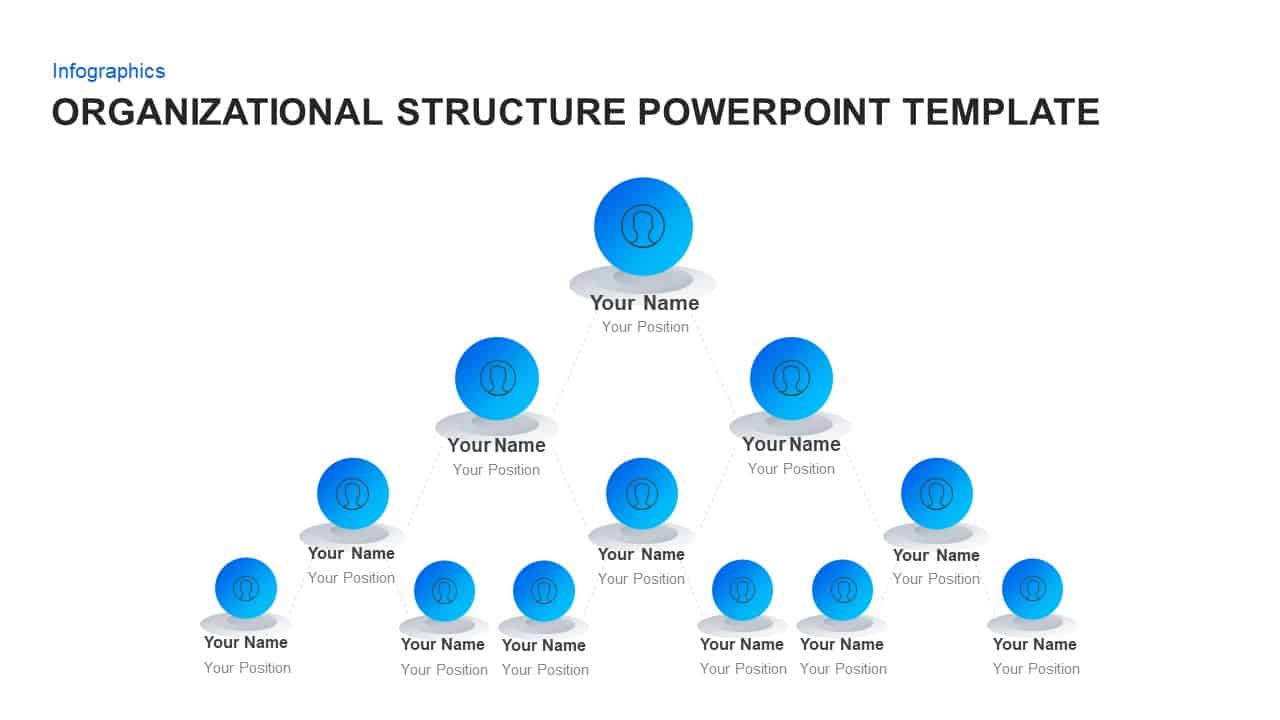
Organizational Chart Template for PowerPoint & Google Slides
Org Chart
Premium
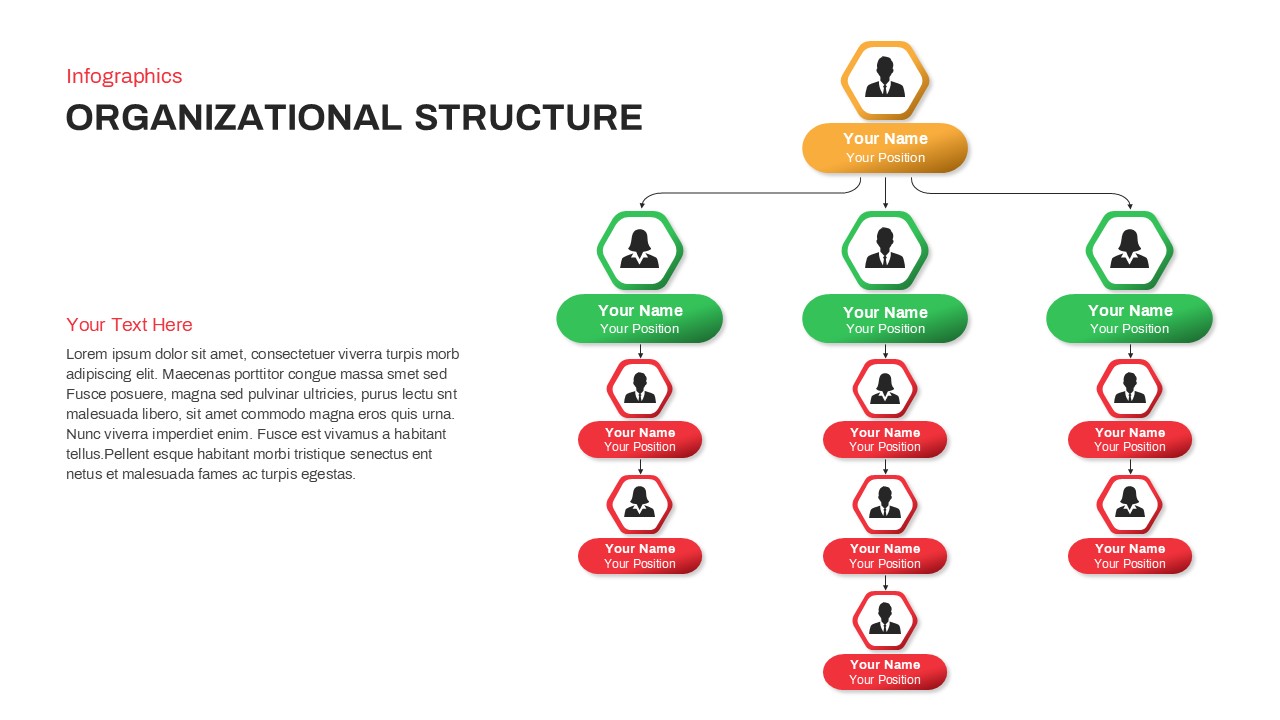
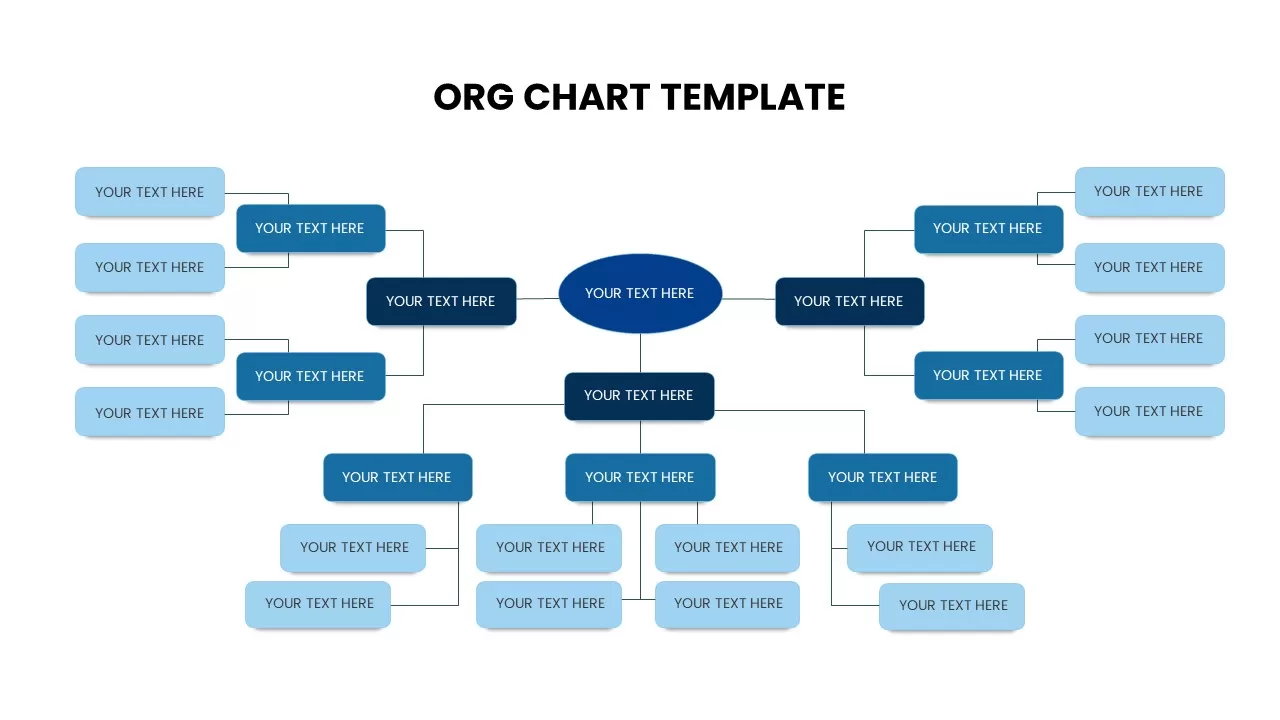
Organizational Structure Org Chart Template for PowerPoint & Google Slides
Org Chart
Premium

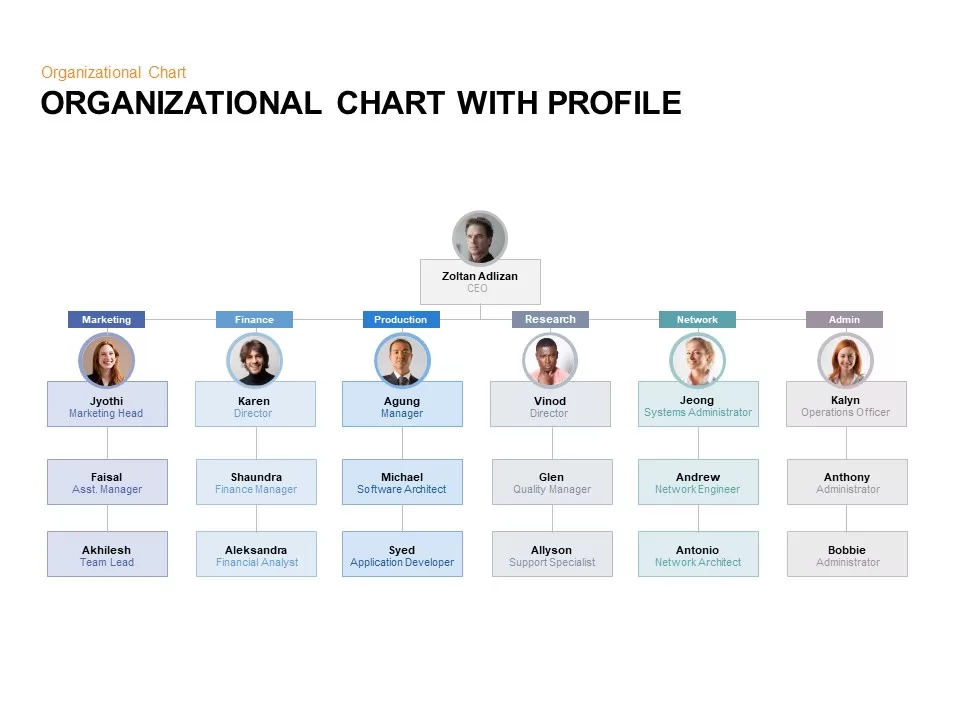
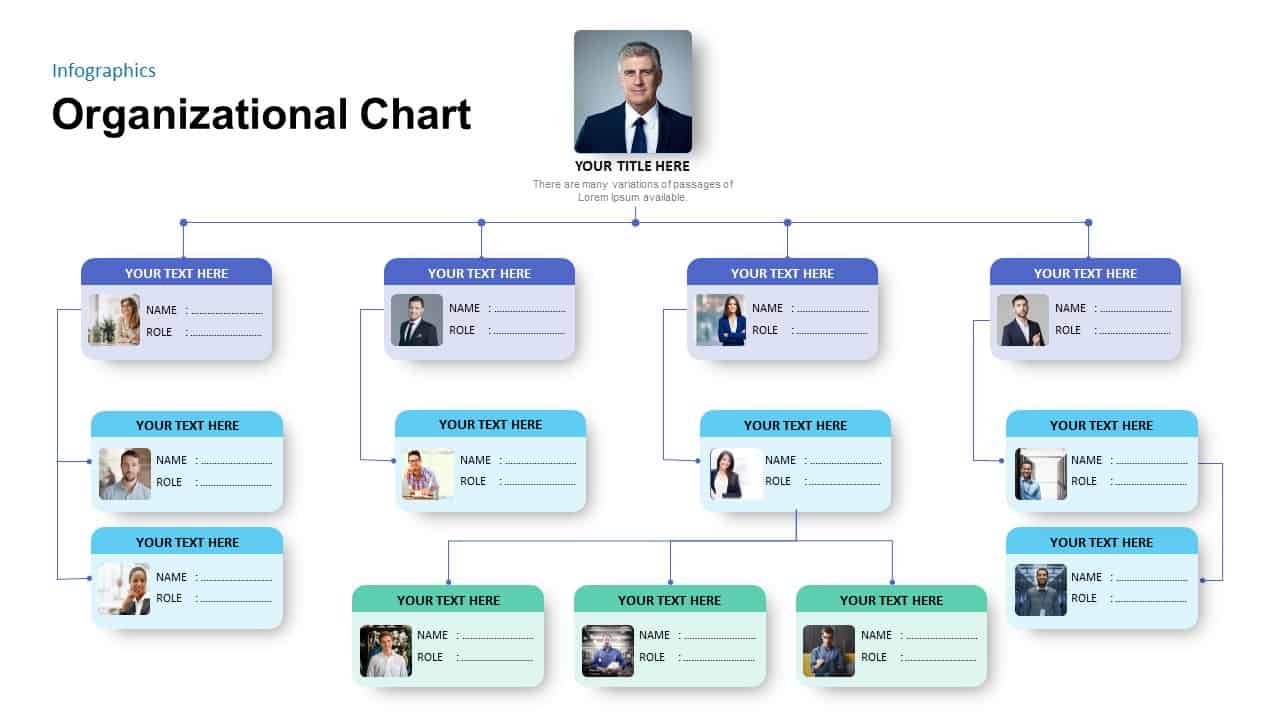
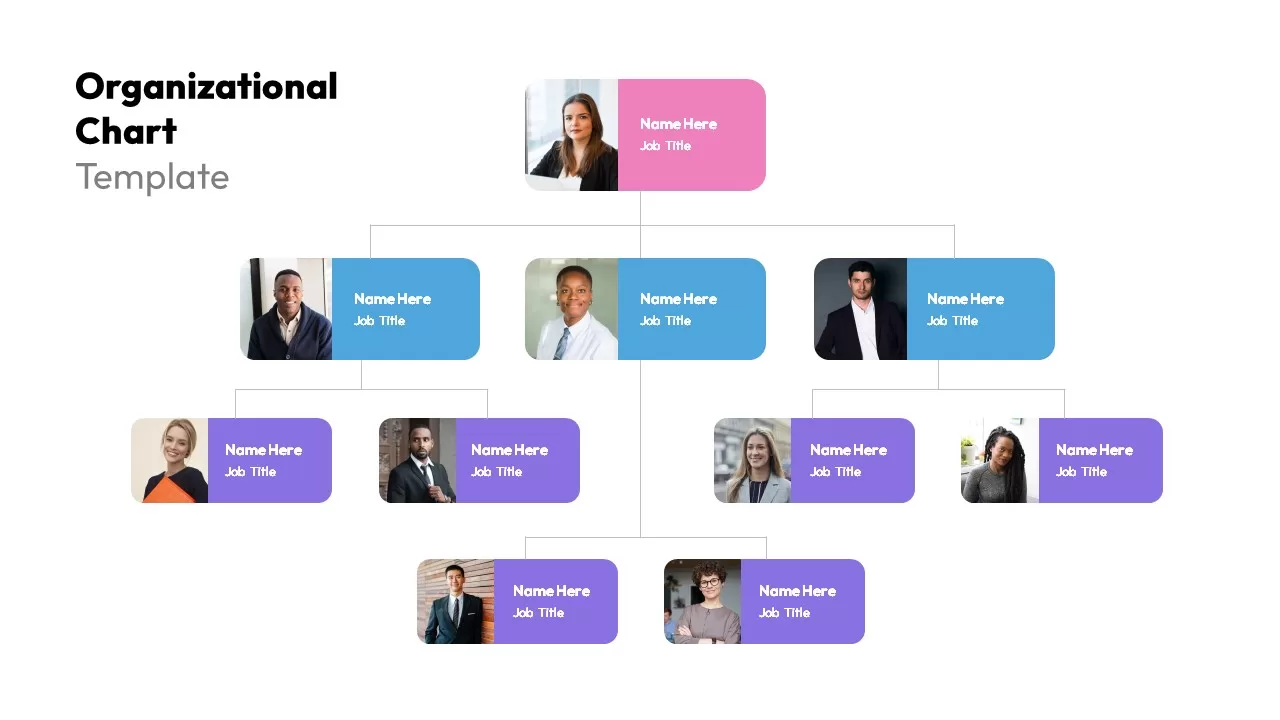
Organizational Chart with Profile for PowerPoint & Google Slides
Org Chart
Premium
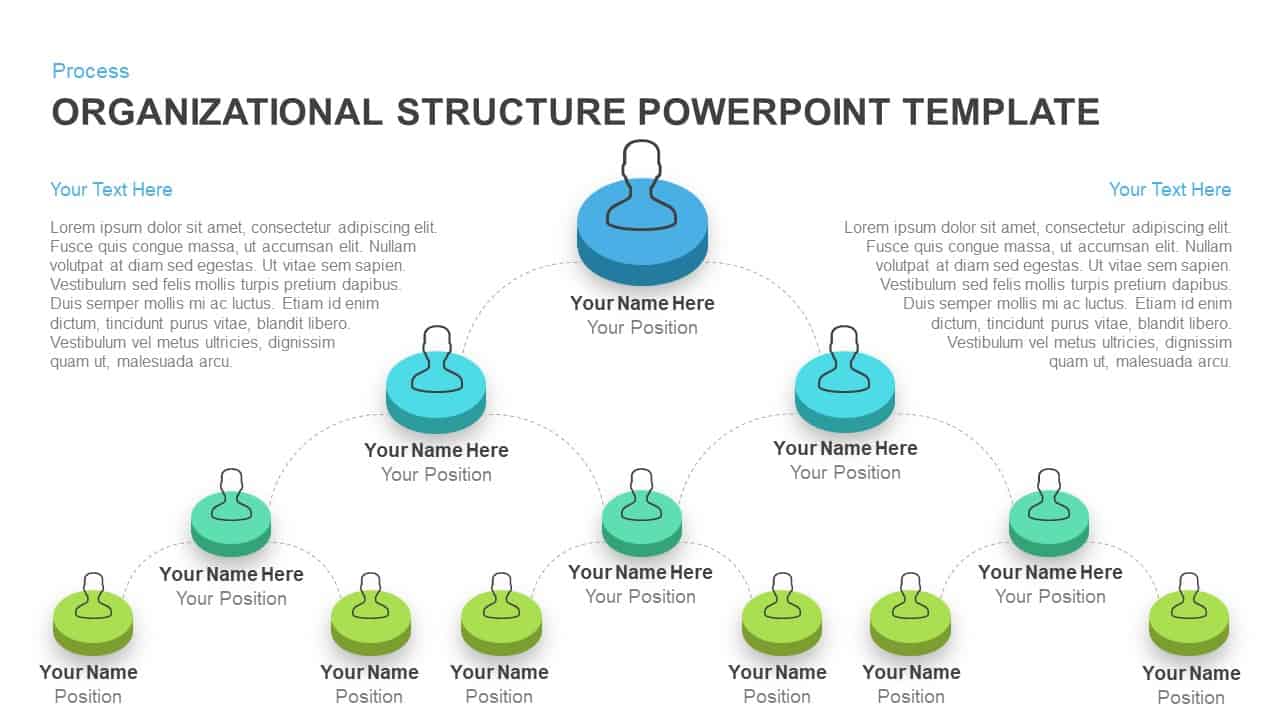
Organizational Chart Structure template for PowerPoint & Google Slides
Org Chart
Premium
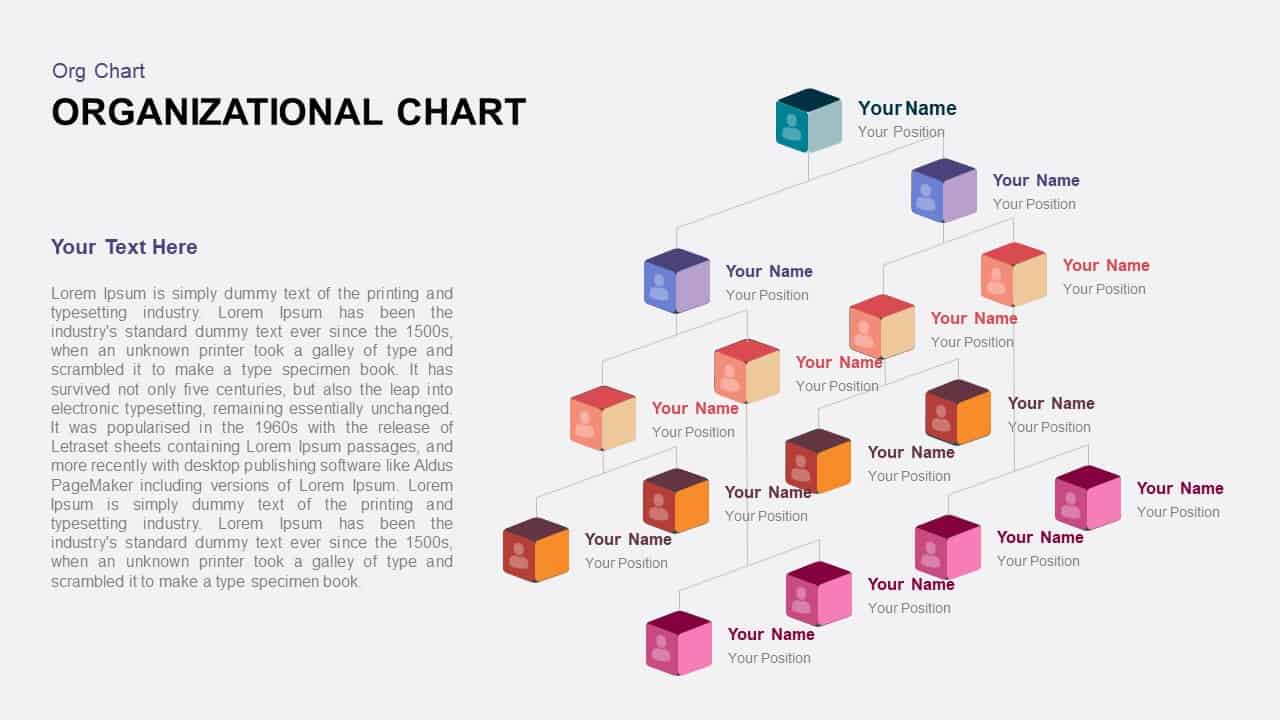
Isometric Organizational Structure Chart Template for PowerPoint & Google Slides
Org Chart
Premium
Corporate Organizational Chart Hierarchy Template for PowerPoint & Google Slides
Org Chart
Premium
Organizational Structure Hierarchy Chart Template for PowerPoint & Google Slides
Org Chart
Premium
Modern Organizational Chart Hierarchy Template for PowerPoint & Google Slides
Org Chart
Premium
3D Color Block Organizational Chart Slide for PowerPoint & Google Slides
Org Chart
Premium
Creative Organizational Chart Template for PowerPoint & Google Slides
Org Chart
Premium
Professional Organizational Chart Diagram Template for PowerPoint & Google Slides
Org Chart
Premium
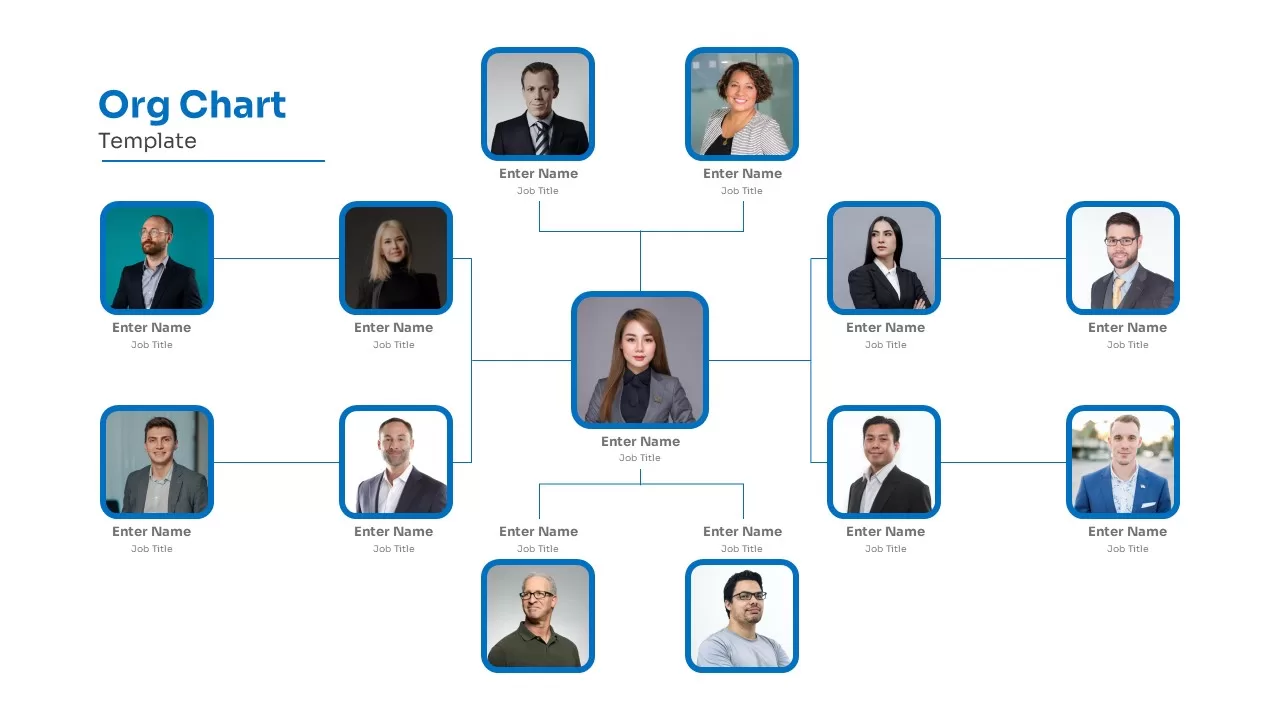
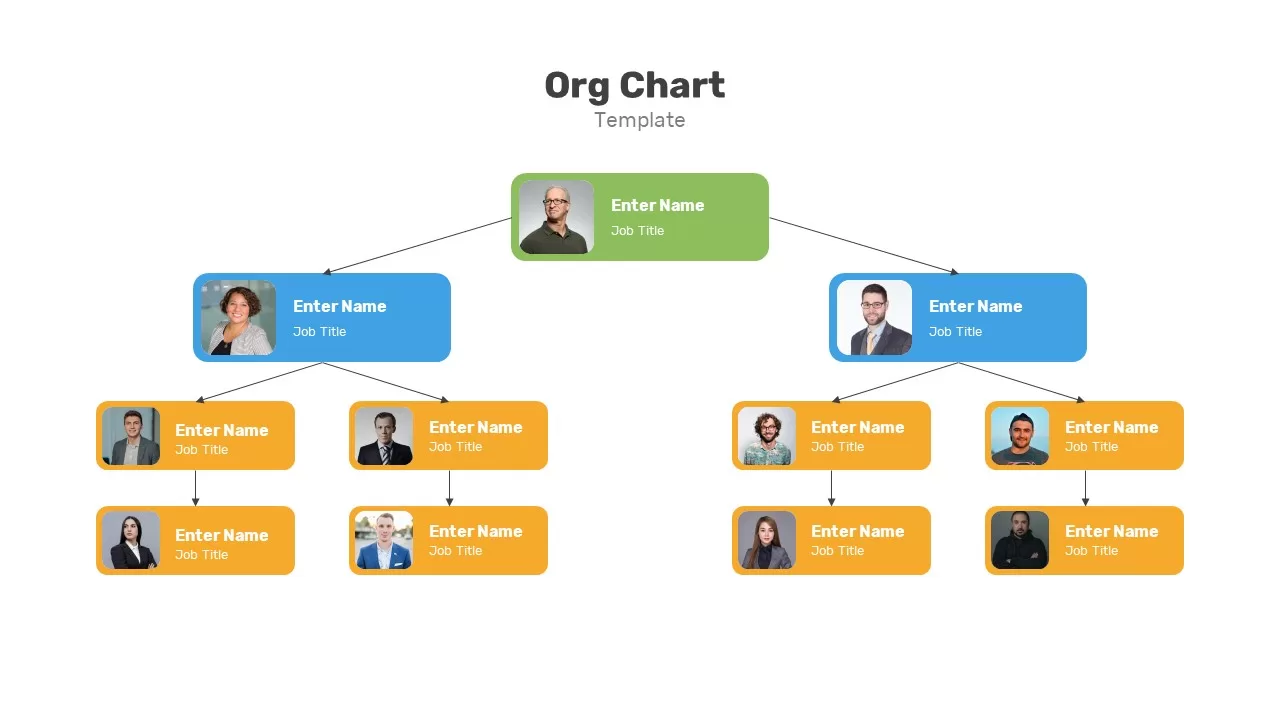
Modern Photo-Based Organizational Chart Template for PowerPoint & Google Slides
Org Chart
Premium
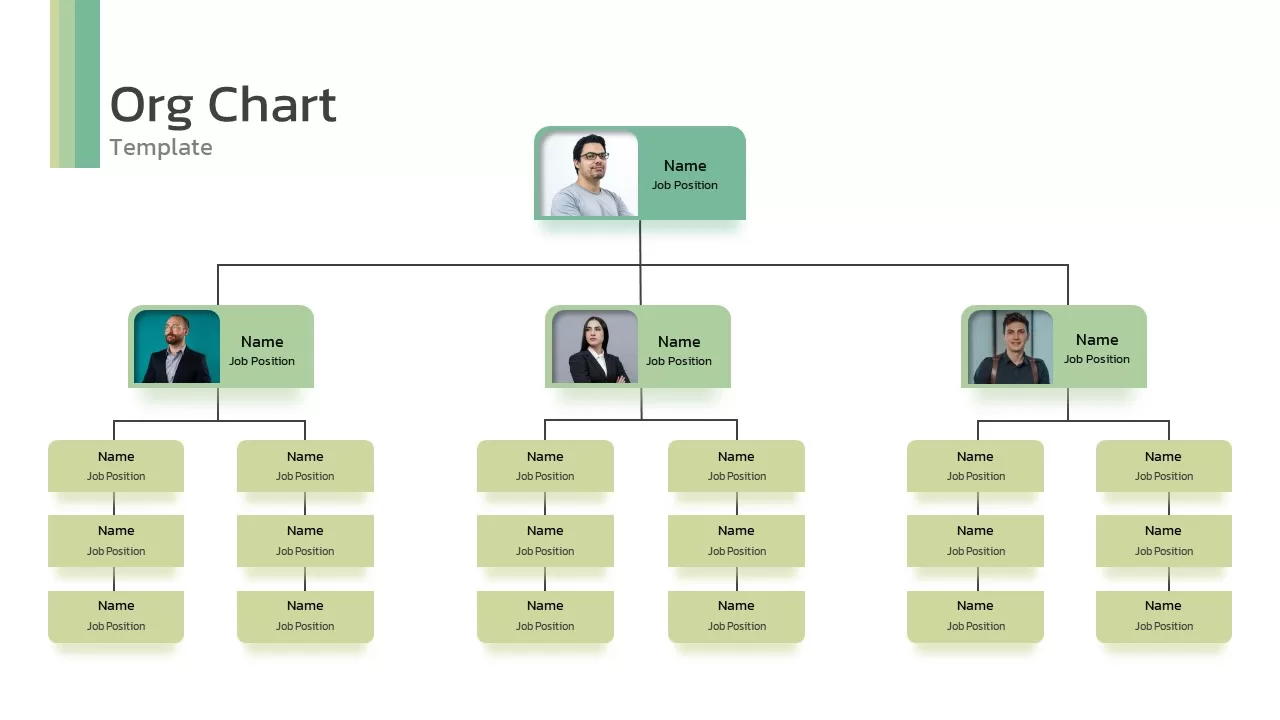
Modern Image-Based Organizational Chart Template for PowerPoint & Google Slides
Org Chart
Premium
Organizational Chart Overview template for PowerPoint & Google Slides
Org Chart
Premium
Organizational Chart Structure template for PowerPoint & Google Slides
Business Plan
Premium
Organizational Chart Template for PowerPoint & Google Slides
Our Team
Premium
Organizational Chart template for PowerPoint & Google Slides
Org Chart
Premium
Organizational Chart template for PowerPoint & Google Slides
Org Chart
Premium
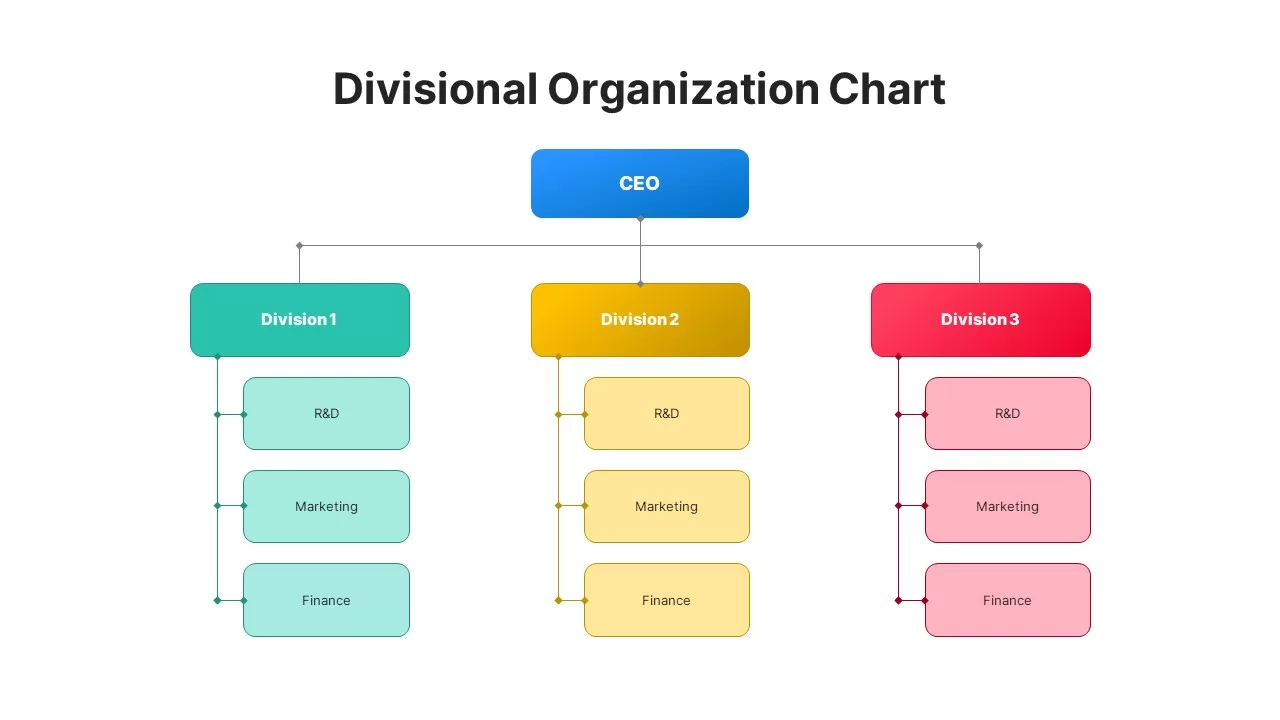
Divisional Organizational Chart Diagram Template for PowerPoint & Google Slides
Org Chart
Premium
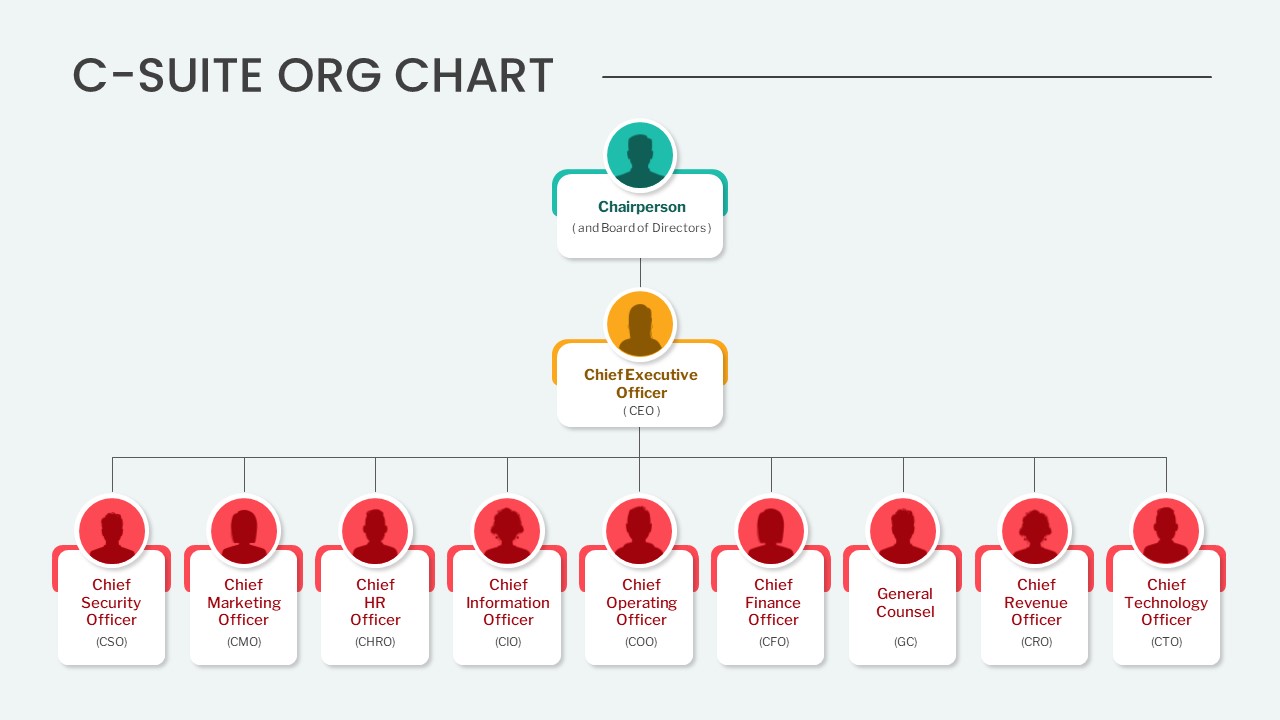
Editable C-Suite Organizational Chart Template for PowerPoint & Google Slides
Org Chart
Premium
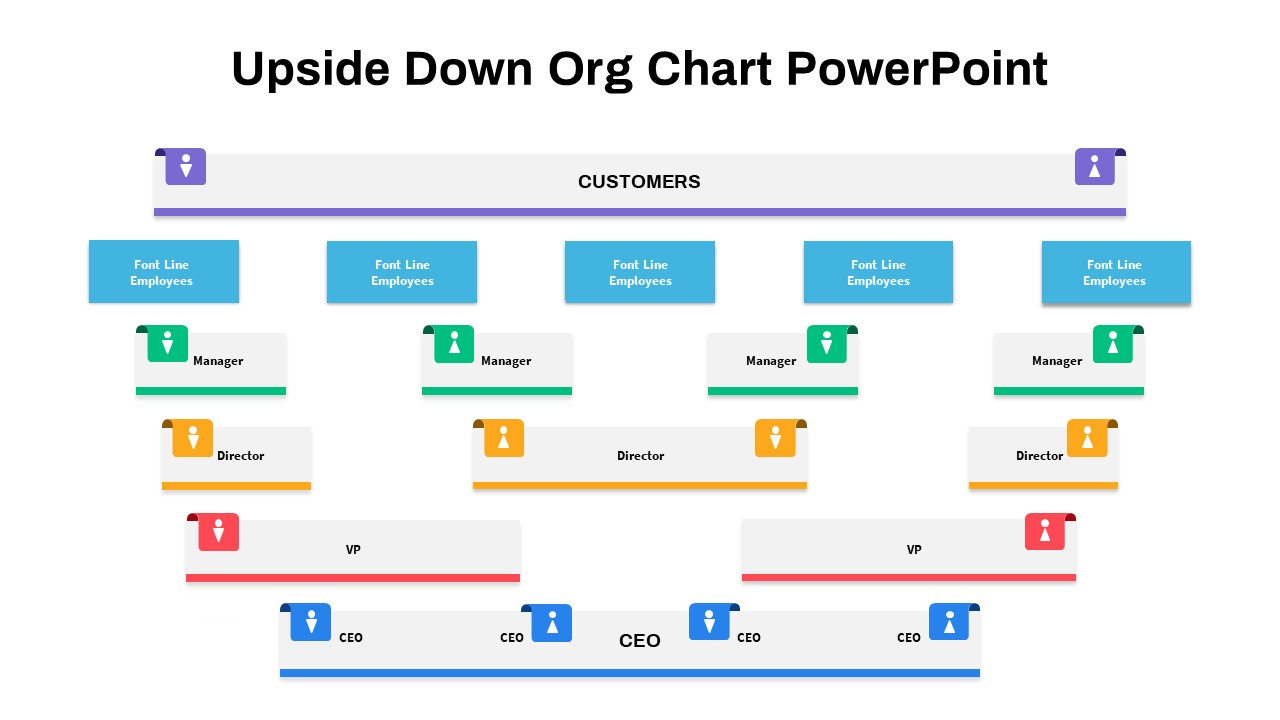
Upside-Down Organizational Chart Diagram Template for PowerPoint & Google Slides
Org Chart
Premium
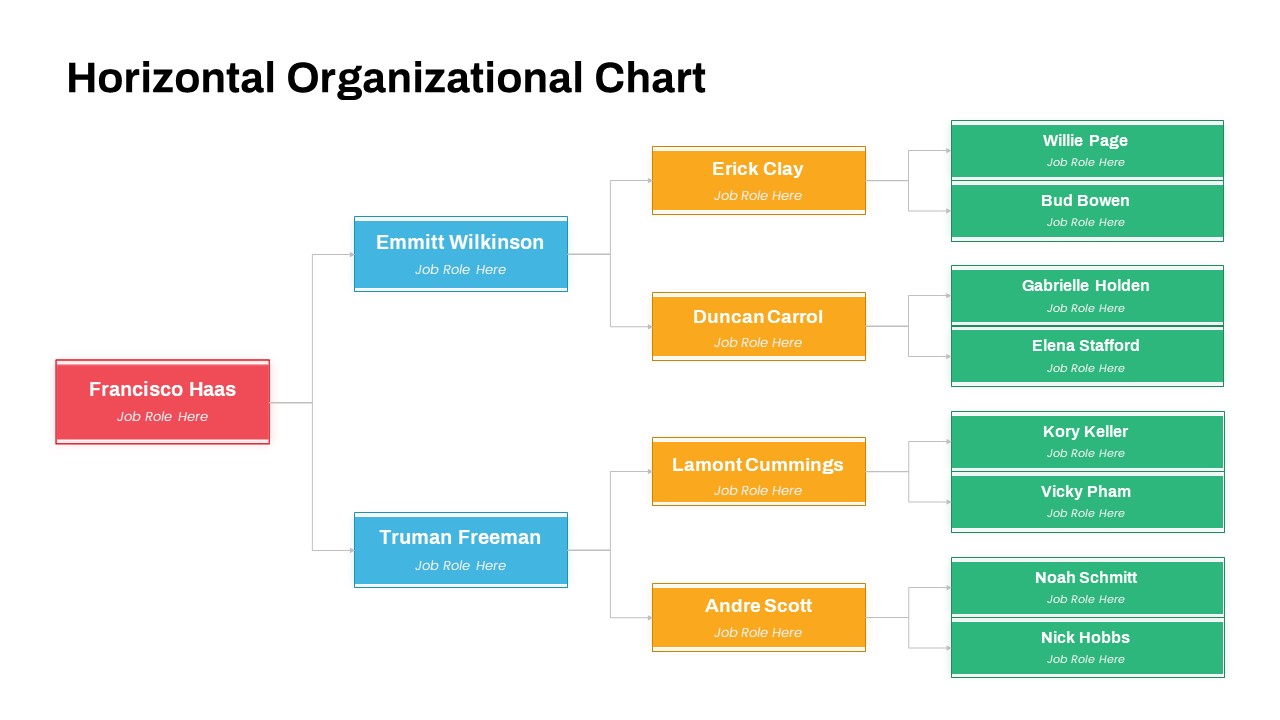
Horizontal Organizational Chart Template for PowerPoint & Google Slides
Org Chart
Premium
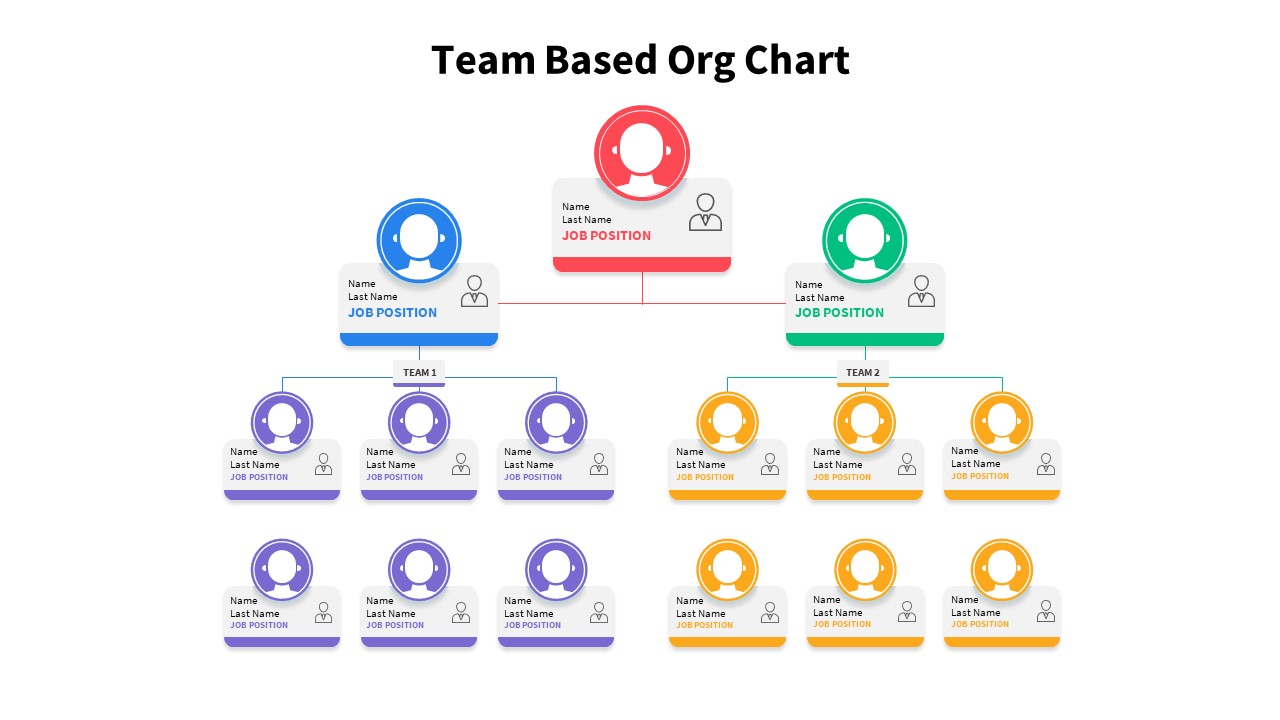
Team-Based Organizational Chart Template for PowerPoint & Google Slides
Org Chart
Premium
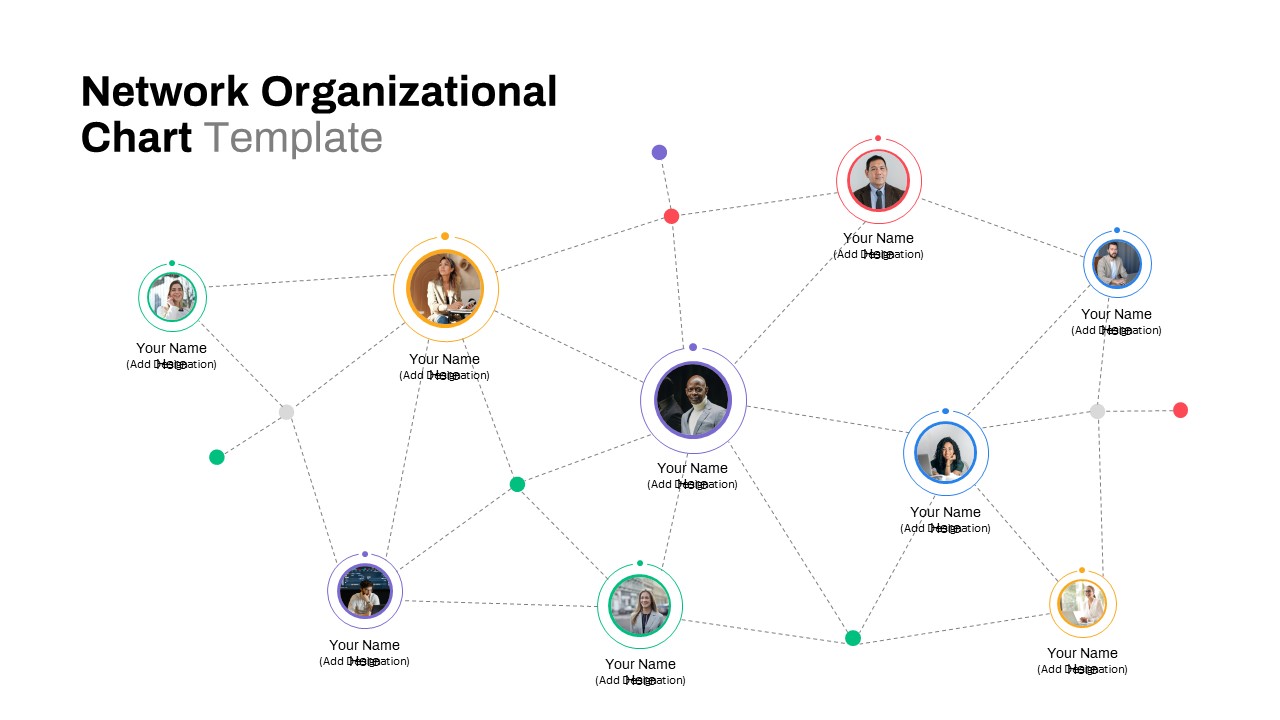
Network Organizational Chart for PowerPoint & Google Slides
Business
Premium
Free Organizational Chart for PowerPoint & Google Slides
Business
Free
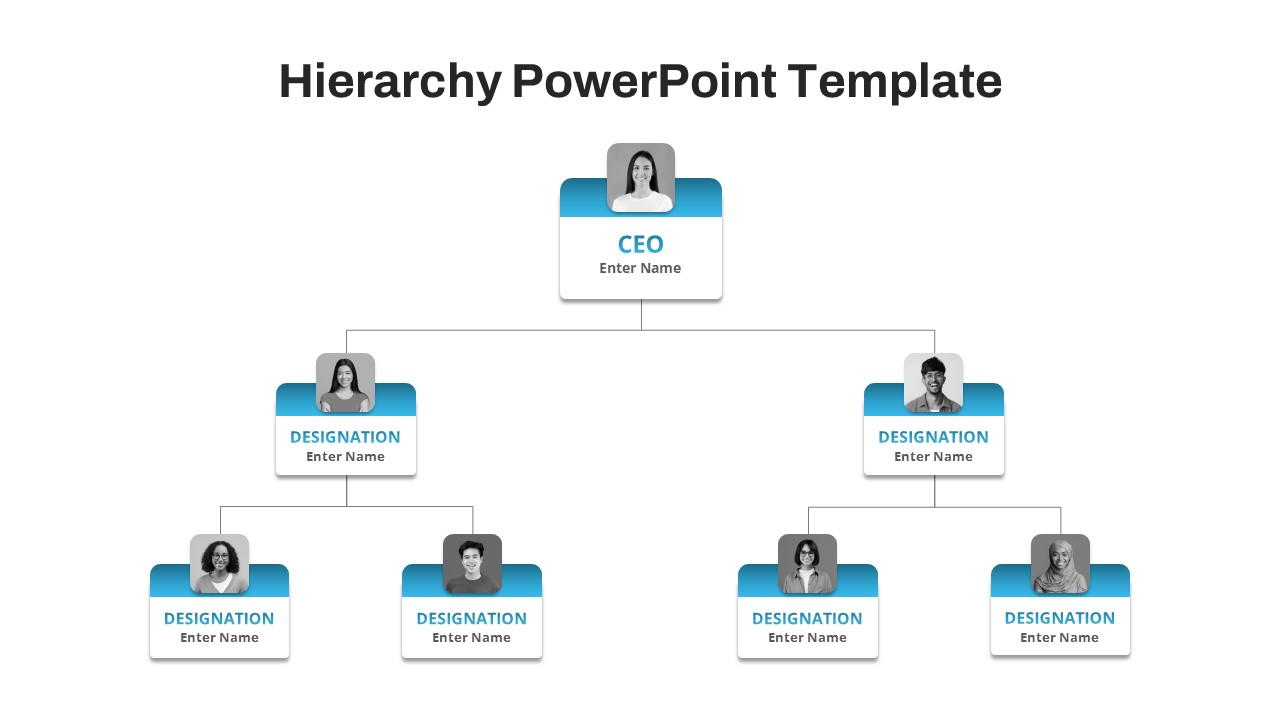
Free Corporate Hierarchy Organizational Chart Template for PowerPoint & Google Slides
Org Chart
Free
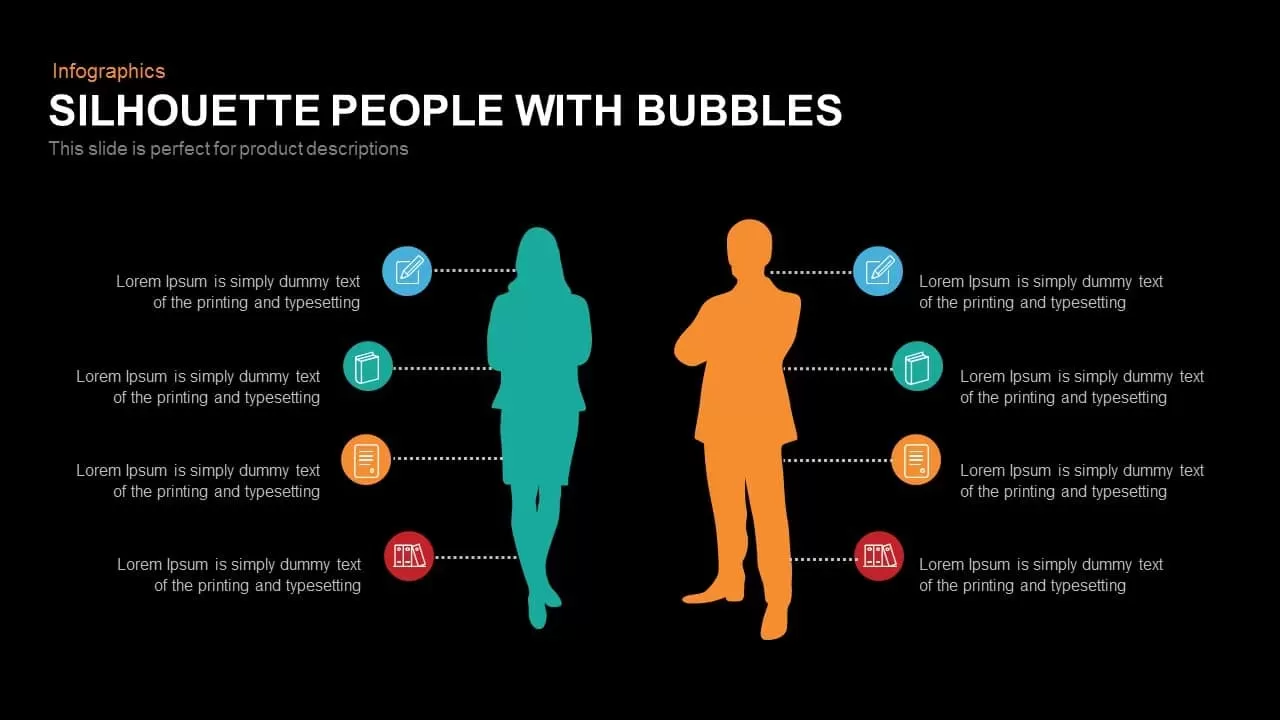
People with Bubbles template for PowerPoint & Google Slides
Comparison
Premium
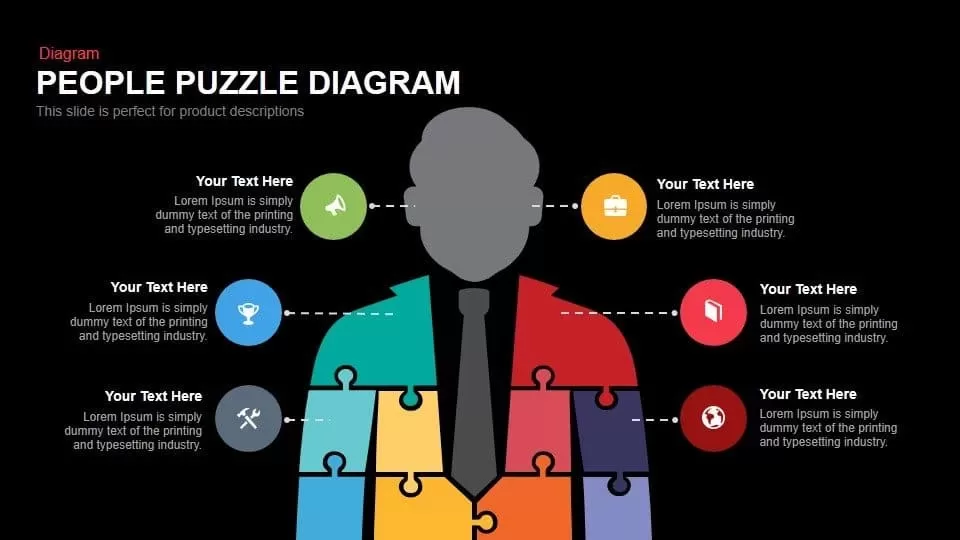
People Puzzle Diagram for Team Roles Template for PowerPoint & Google Slides
Org Chart
Premium
Gender Comparison People Infographic Template for PowerPoint & Google Slides
Comparison
Premium
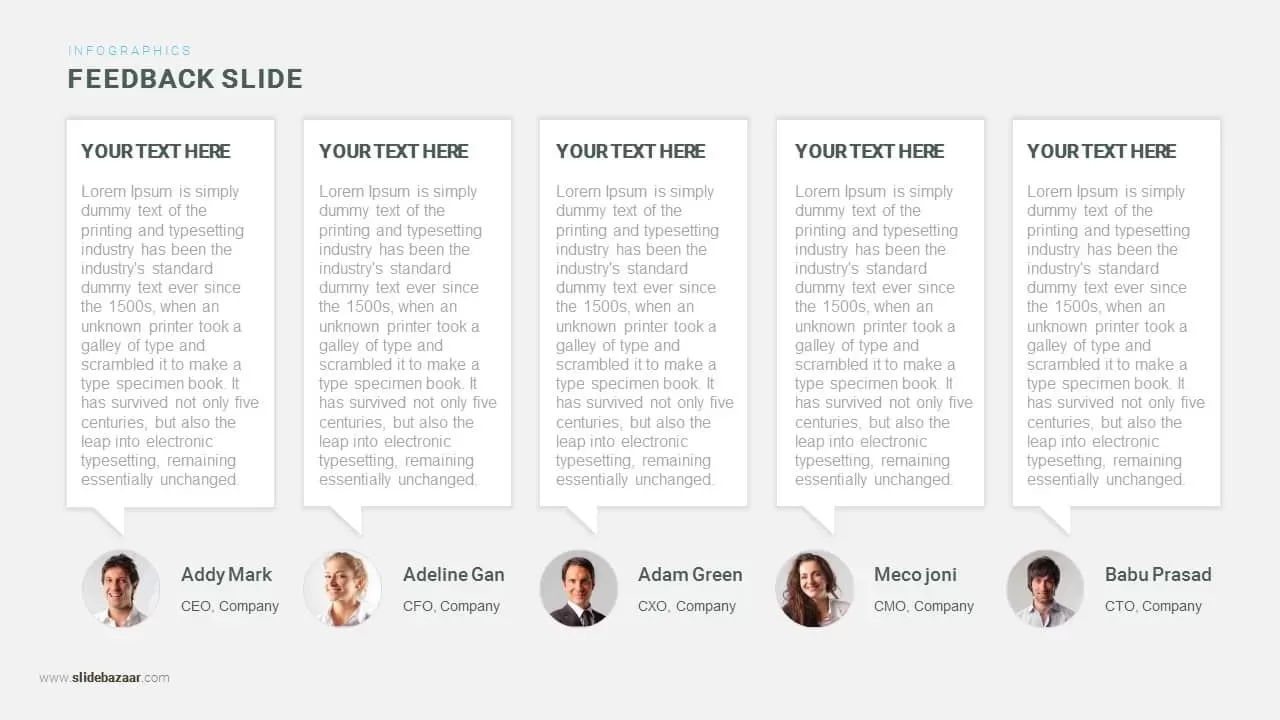
People Feedback and Testimonial Template for PowerPoint & Google Slides
Our Team
Premium
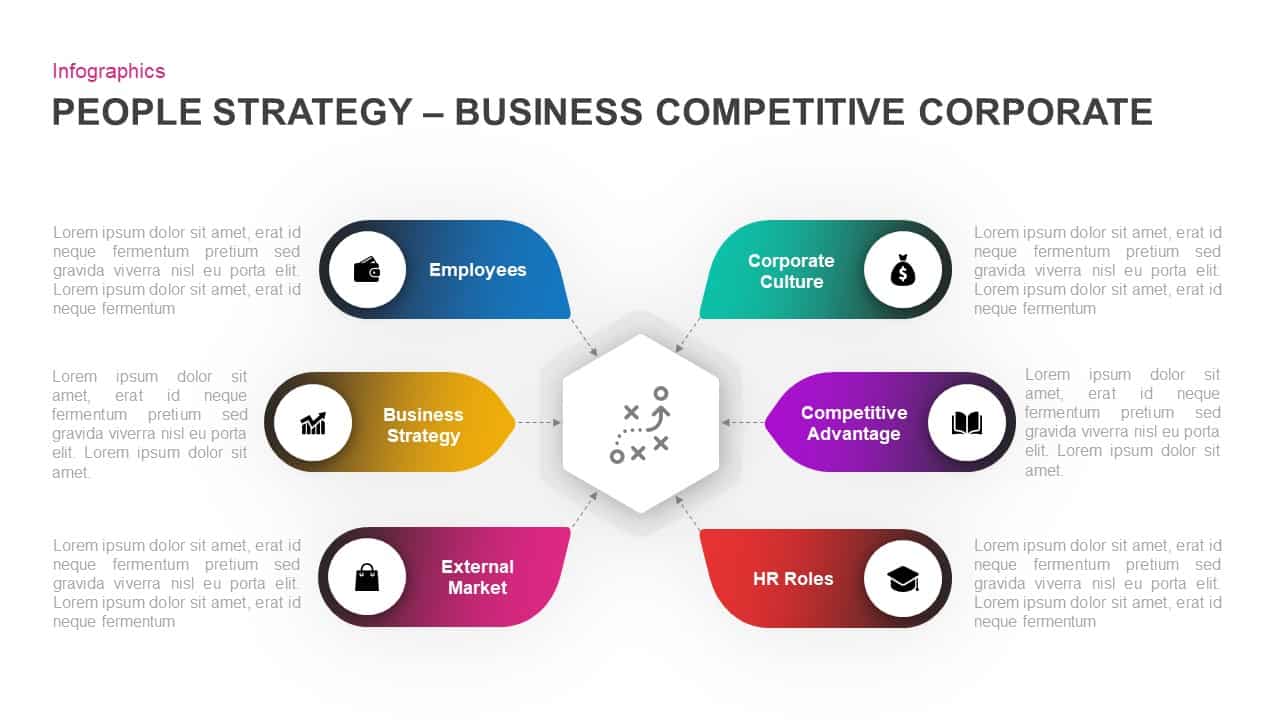
Corporate People Strategy Infographic Template for PowerPoint & Google Slides
Process
Premium
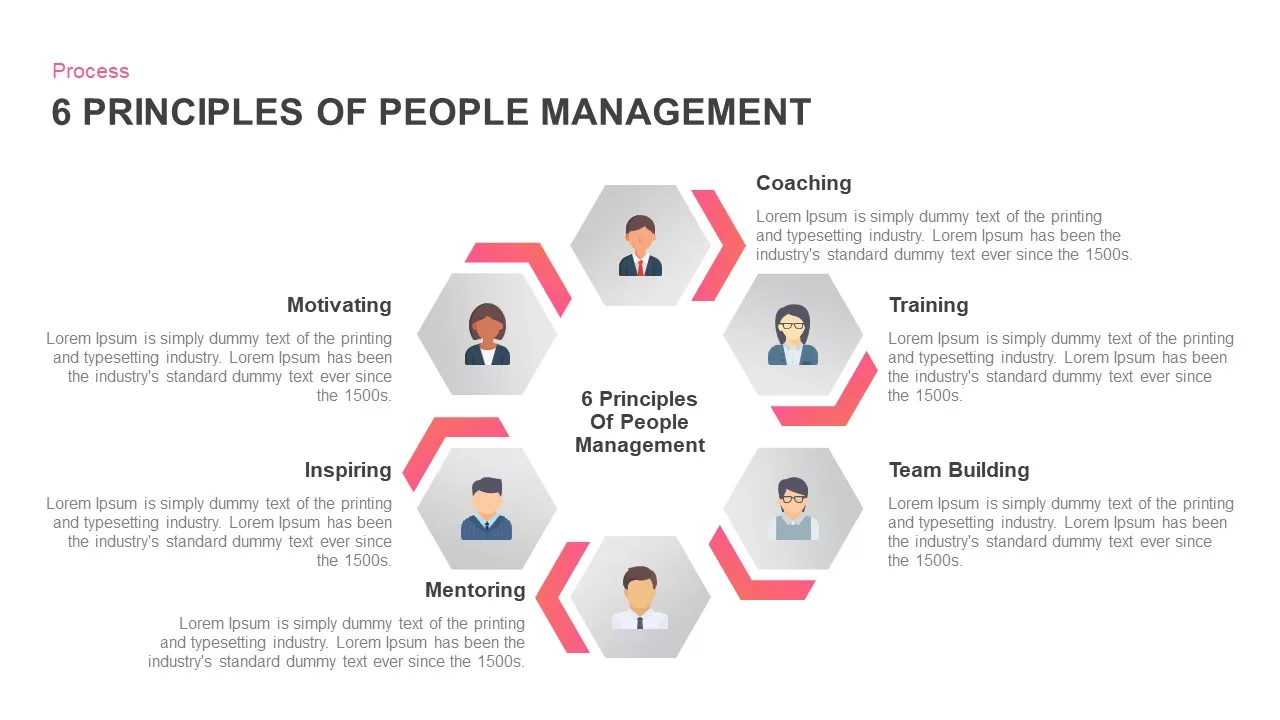
Six Principles of People Management Template for PowerPoint & Google Slides
HR
Premium
People-Centered Implementation Process Template for PowerPoint & Google Slides
Process
Premium
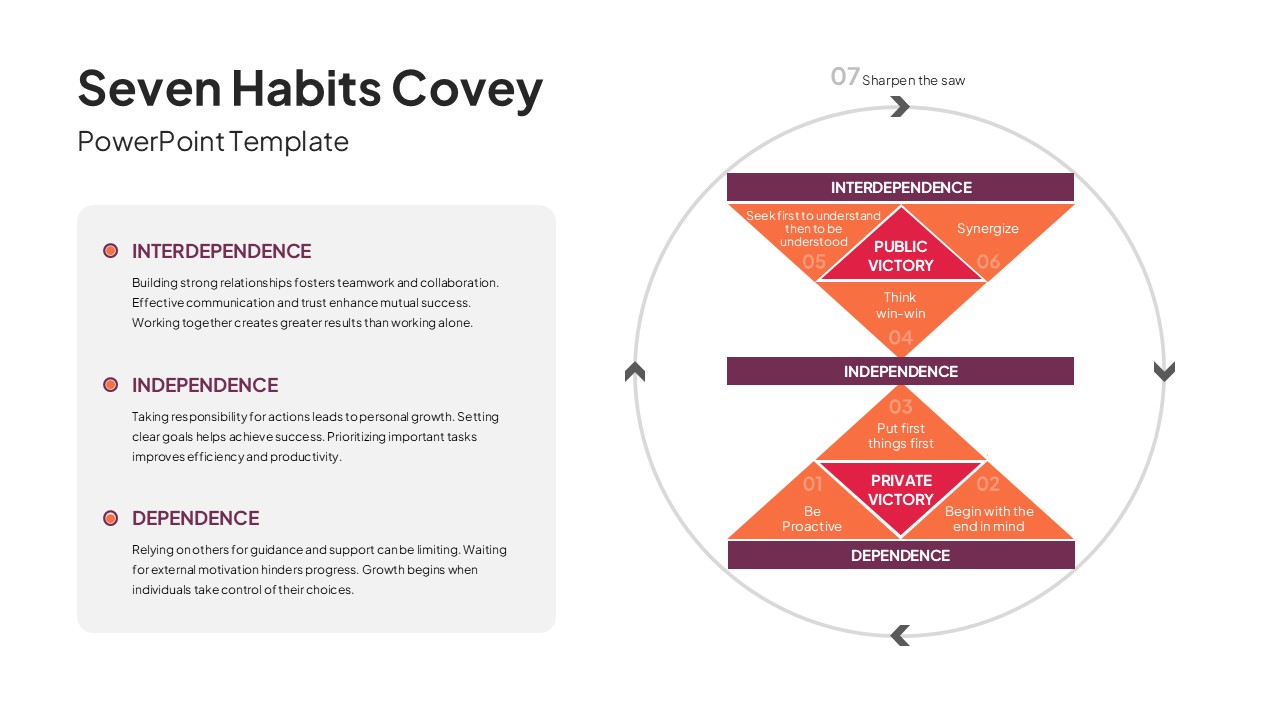
7 Habits of Highly Effective People Covey Model Template for PowerPoint & Google Slides
Leadership
Premium
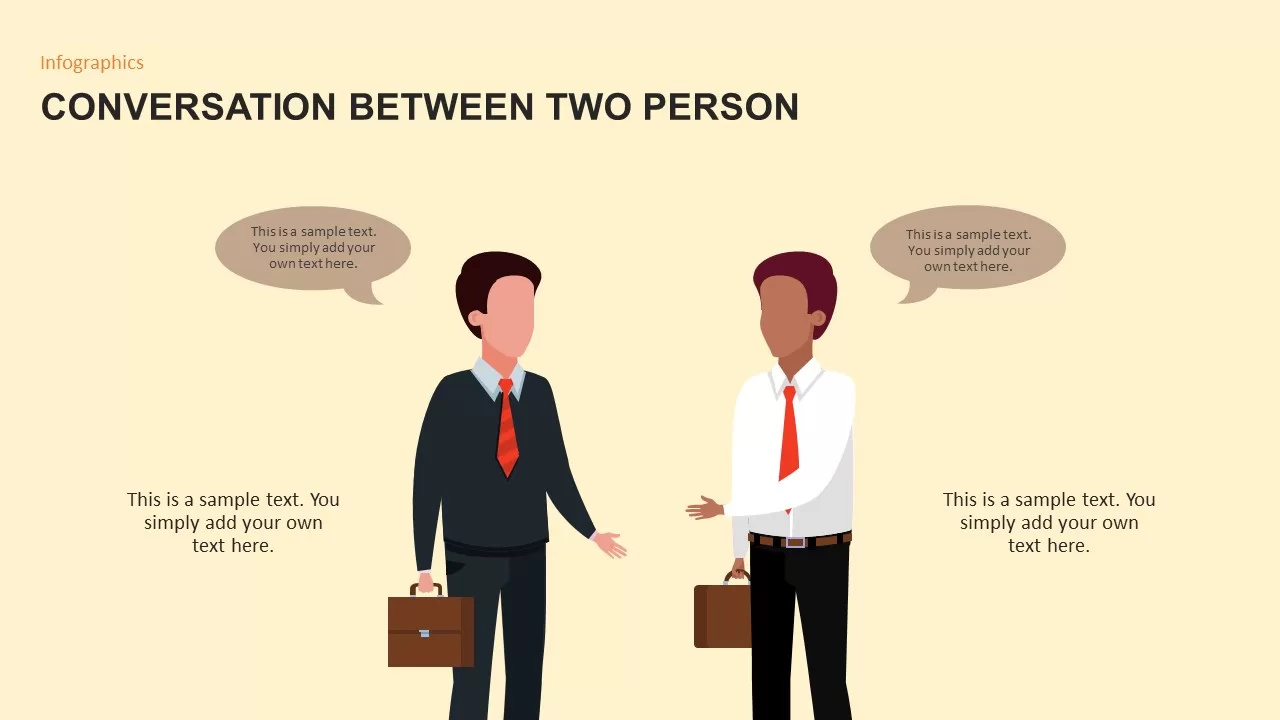
Conversation Between Two People template for PowerPoint & Google Slides
Graphics
Premium
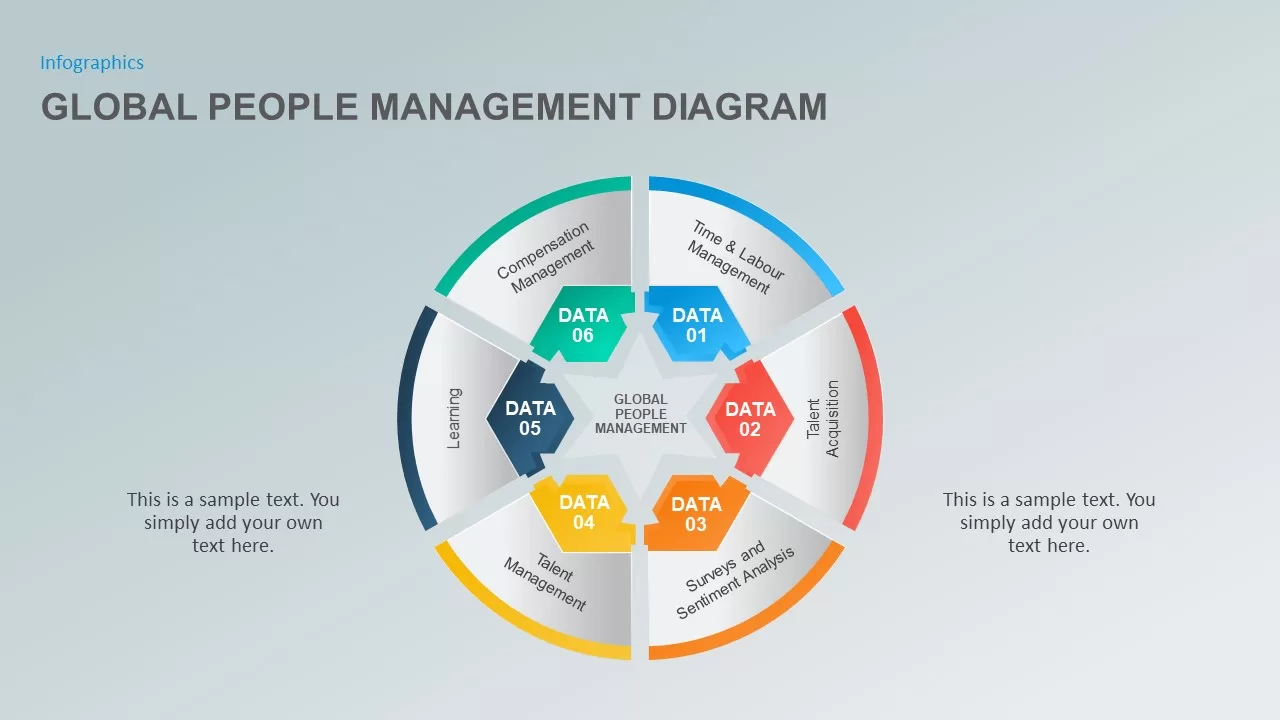
The Global People Management Diagram for PowerPoint & Google Slides
Business Models
Premium
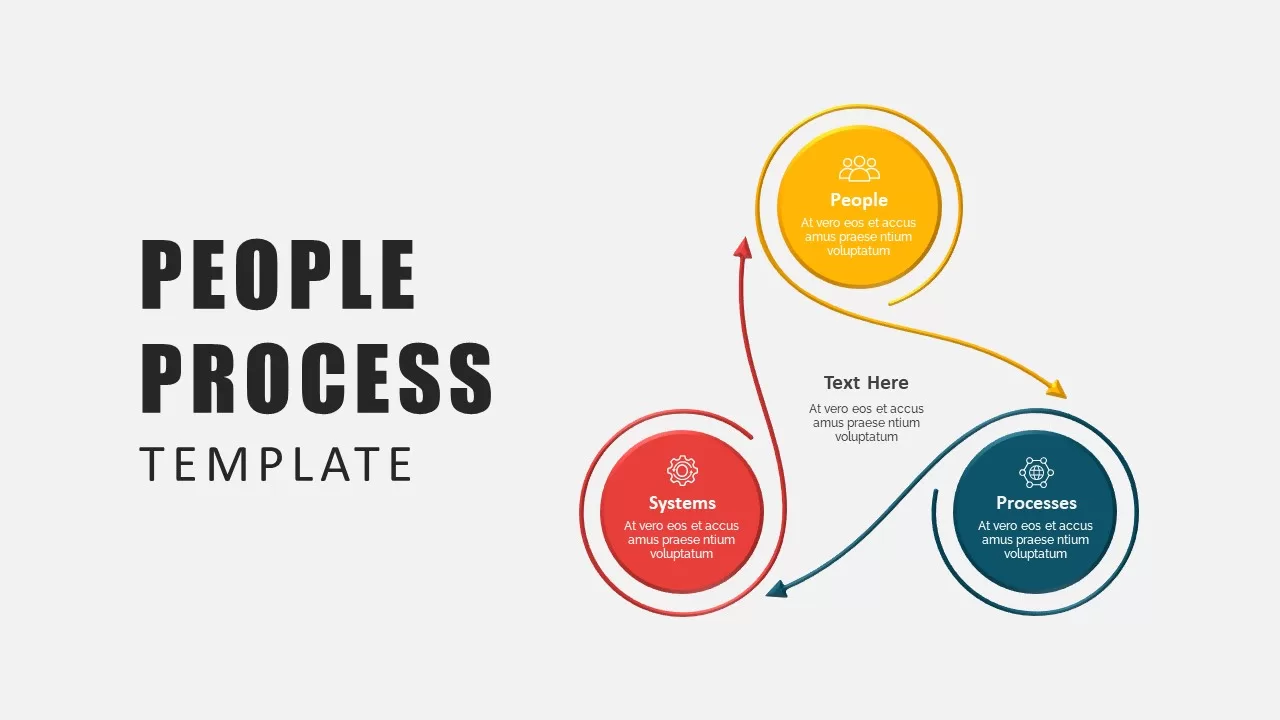
People-Process-Technology Infographic Template for PowerPoint & Google Slides
Process
Premium
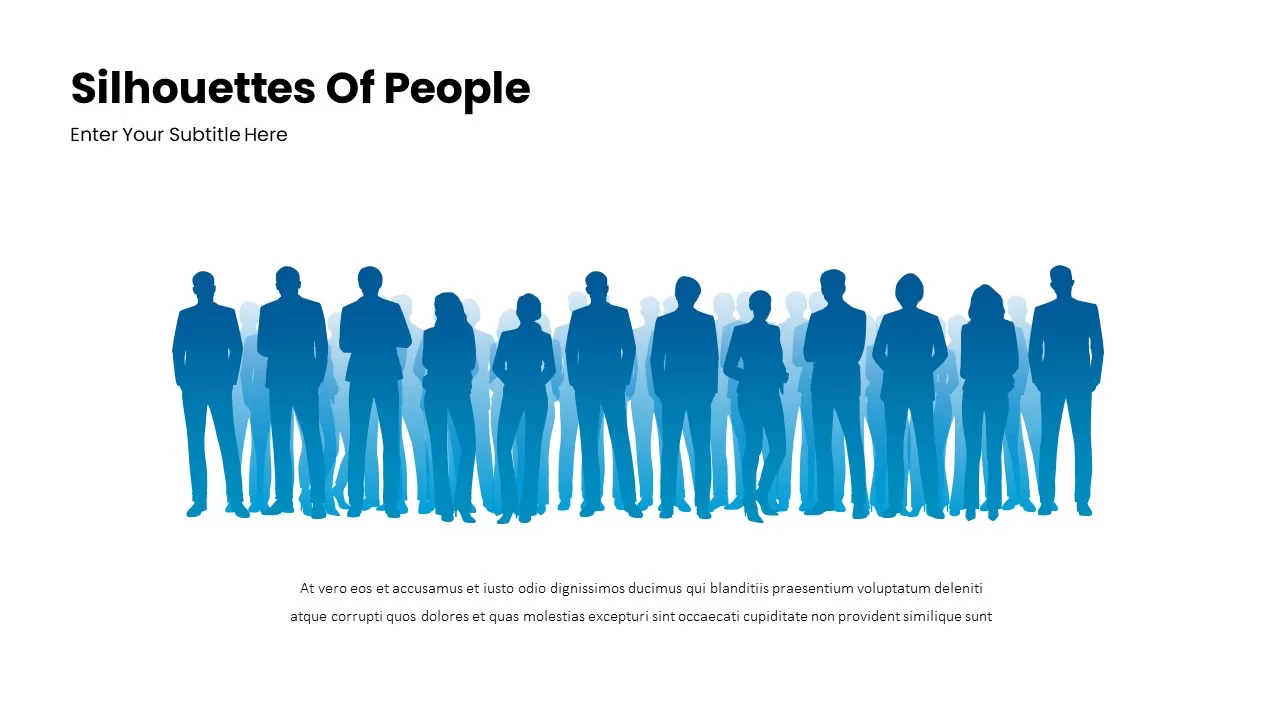
Blue Silhouettes of People Crowd Slide Template for PowerPoint & Google Slides
Our Team
Premium
Business People Characters Presentation Template for PowerPoint & Google Slides
Decks
Premium

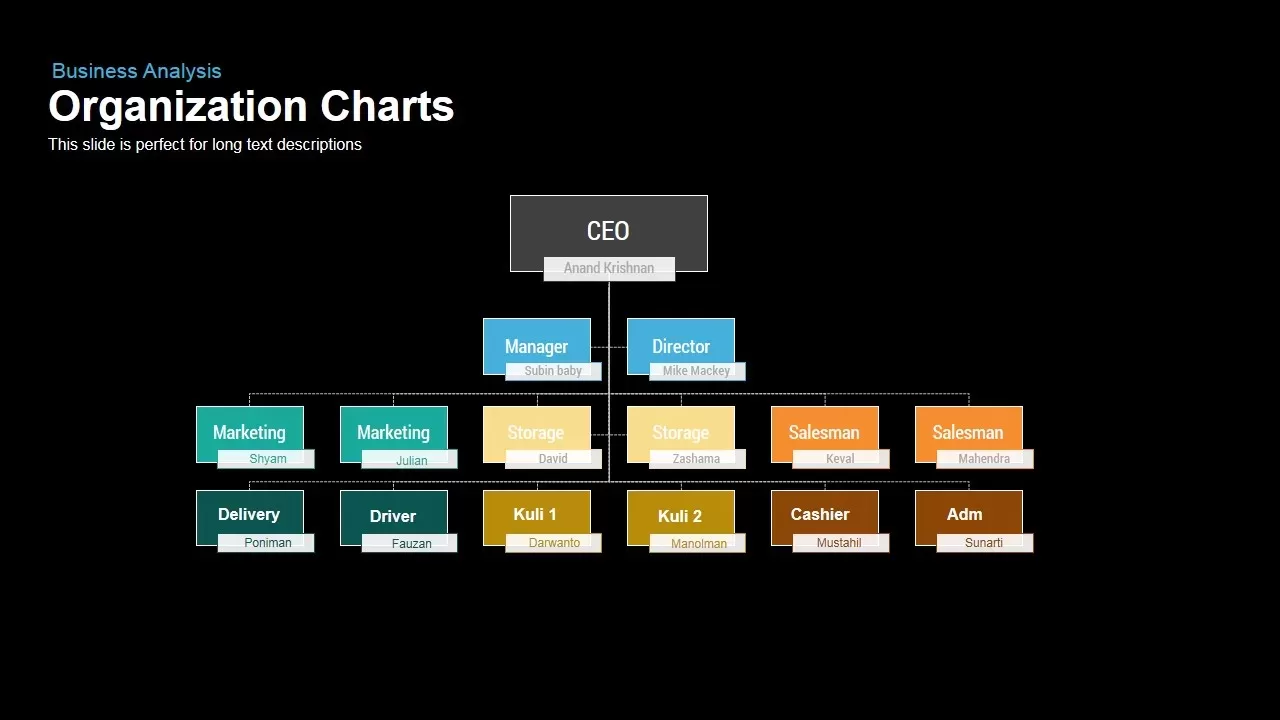
Organizational Chart Hierarchy Templates for PowerPoint and Keynote
Org Chart
Premium

Organizational Structure Diagram for PowerPoint & Google Slides
Org Chart
Premium
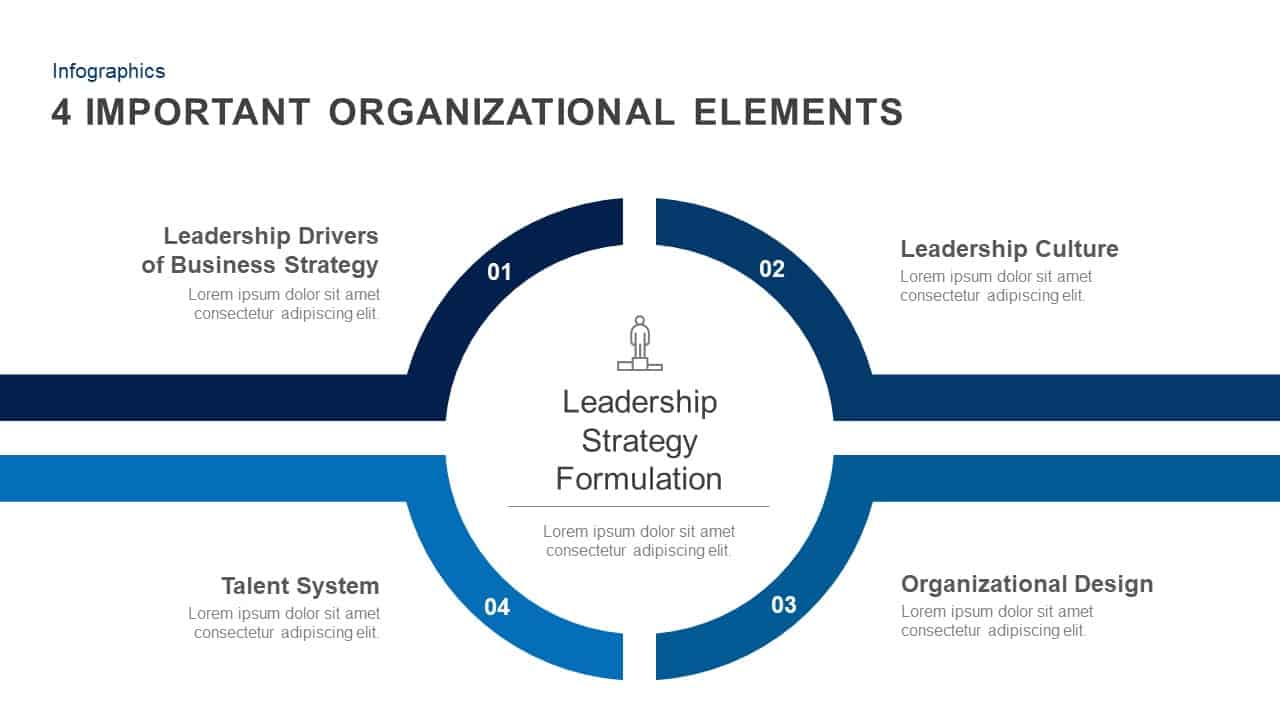
4 Important Organizational Elements template for PowerPoint & Google Slides
Infographics
Premium
Hierarchical Organizational Structure Template for PowerPoint & Google Slides
Org Chart
Premium
Organizational Structure Diagram Template for PowerPoint & Google Slides
Org Chart
Premium
Modern Organizational Hierarchy Diagram Template for PowerPoint & Google Slides
Org Chart
Premium
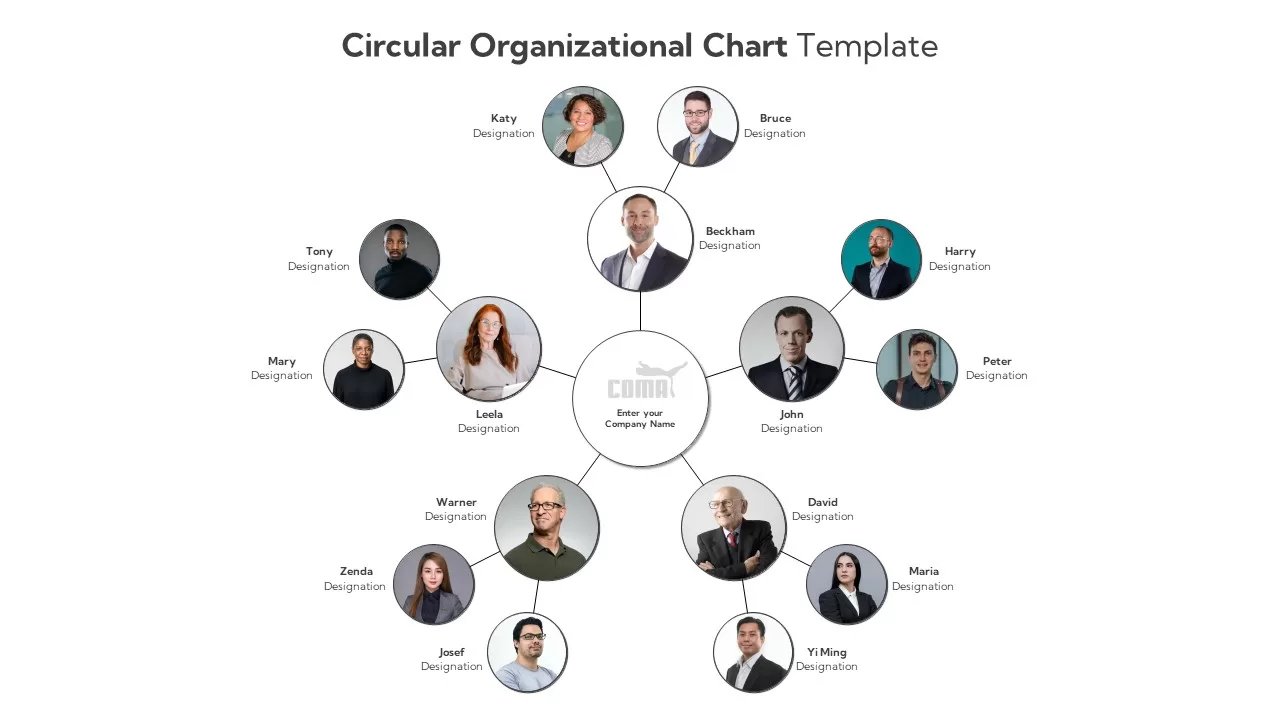
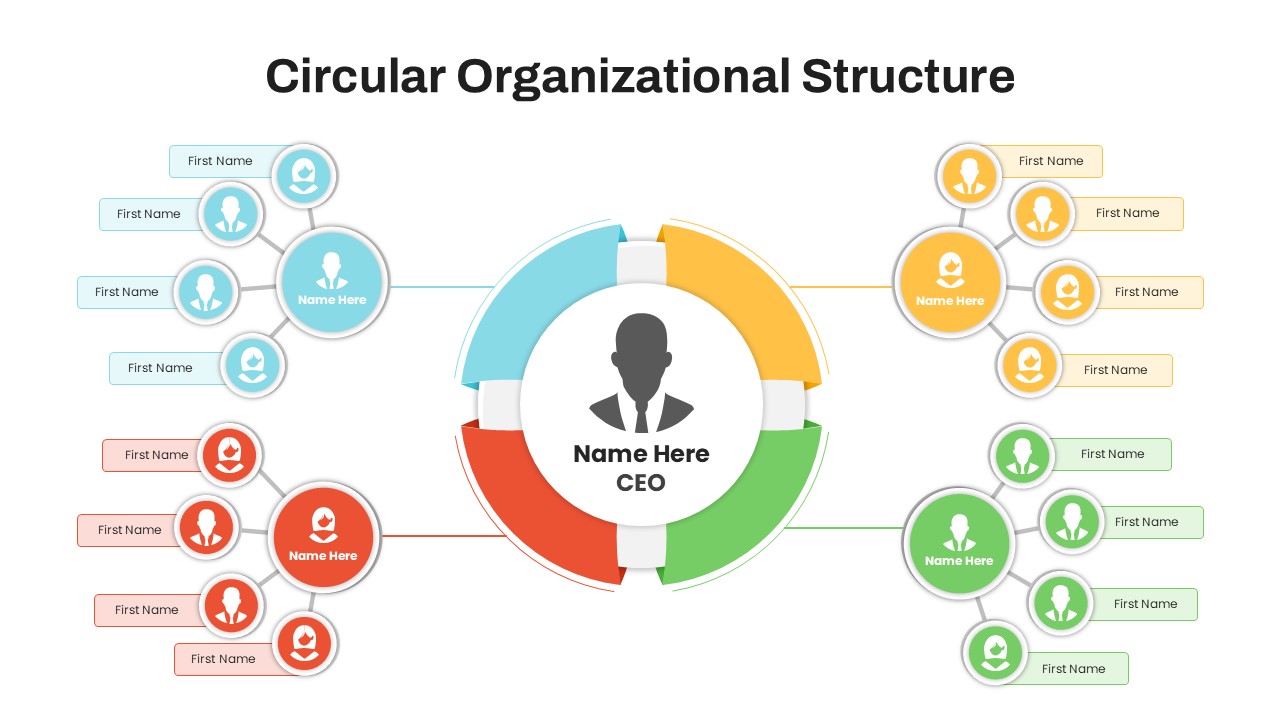
Circular Organizational Structure Layout Template for PowerPoint & Google Slides
Org Chart
Premium
Organizational Maturity Model Diagram Template for PowerPoint & Google Slides
Process
Premium
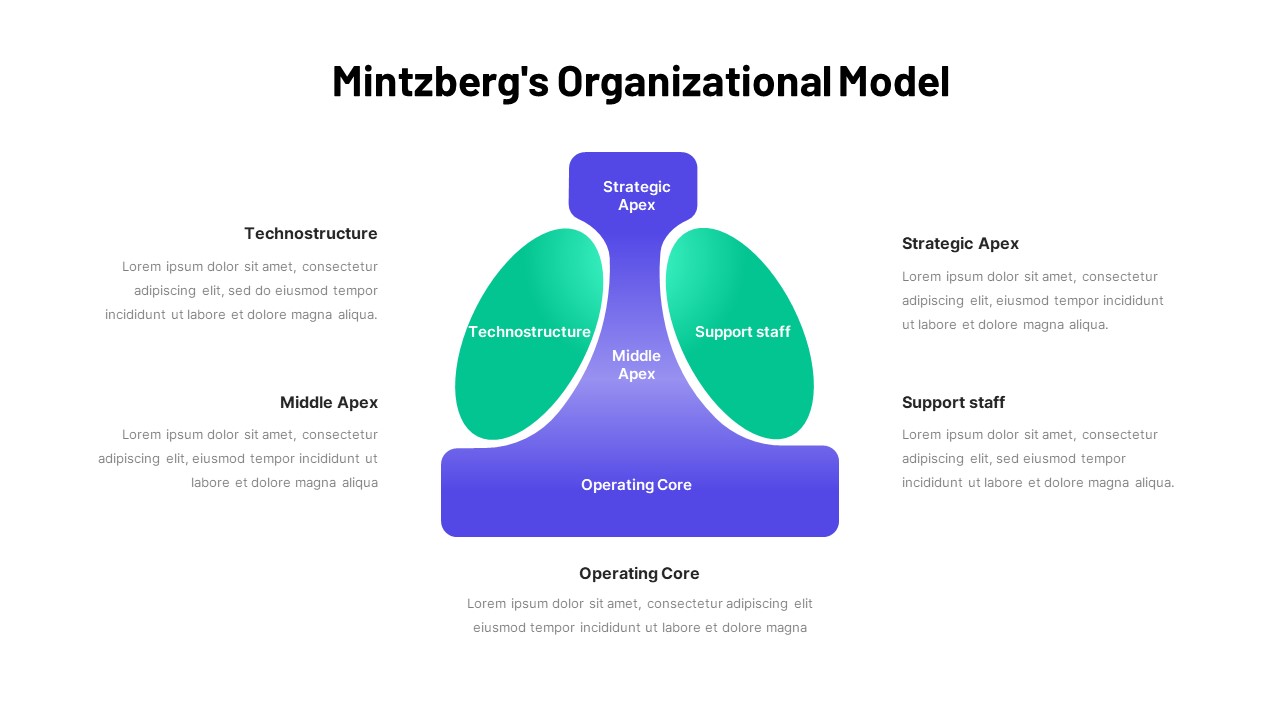
Mintzberg Organizational Model Gradient Template for PowerPoint & Google Slides
Business
Premium
Circular Organizational Structure Template for PowerPoint & Google Slides
Org Chart
Premium
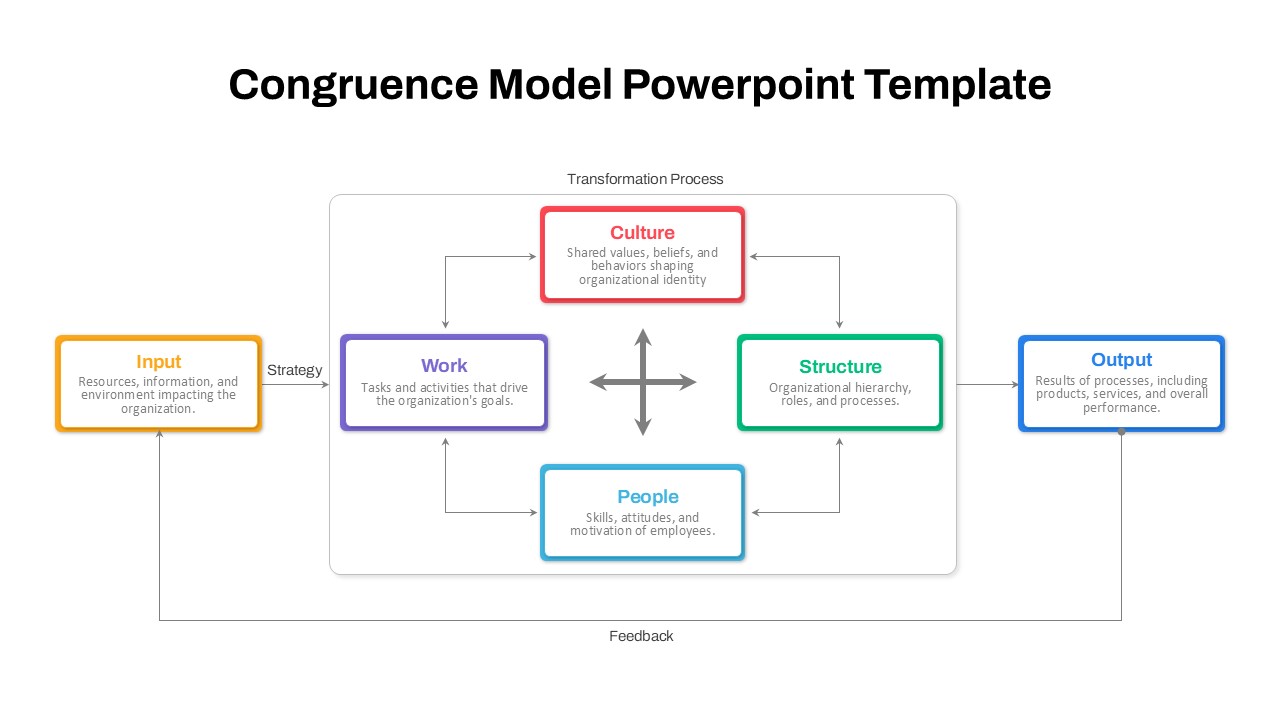
Organizational Congruence Model Diagram Template for PowerPoint & Google Slides
Process
Premium
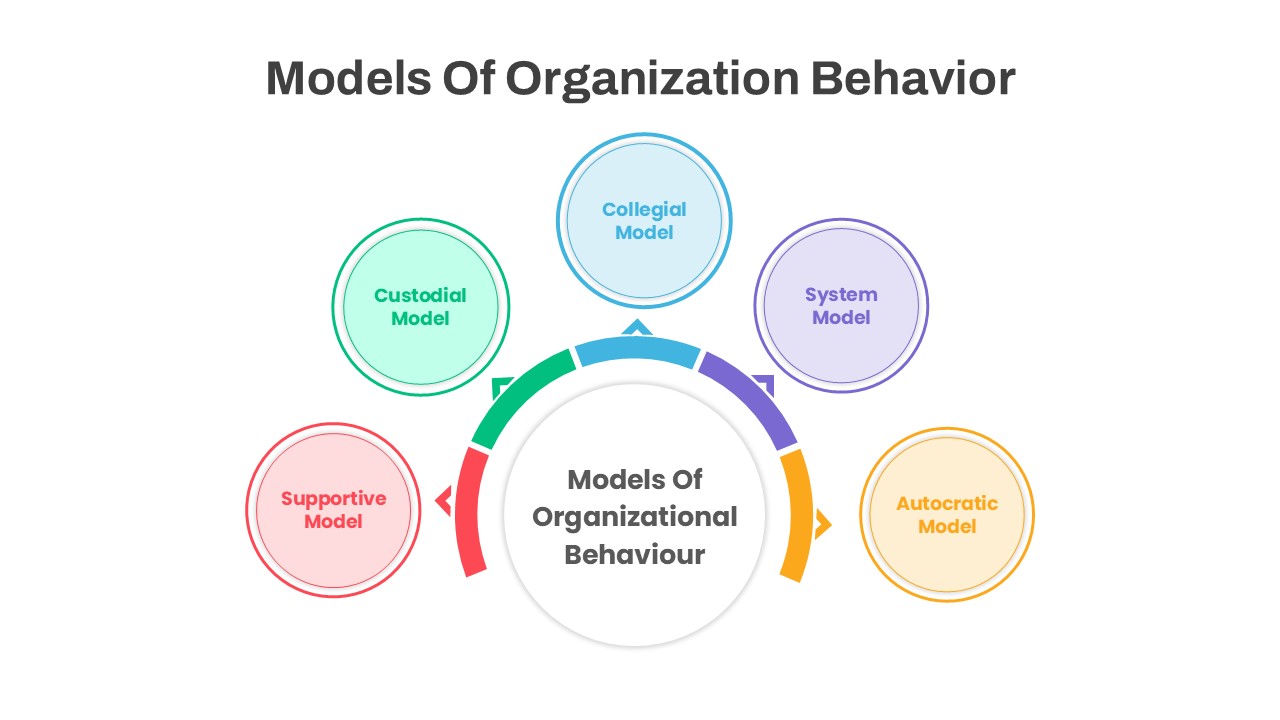
Organizational Behavior Hexagon Diagram Template for PowerPoint & Google Slides
Circle
Premium
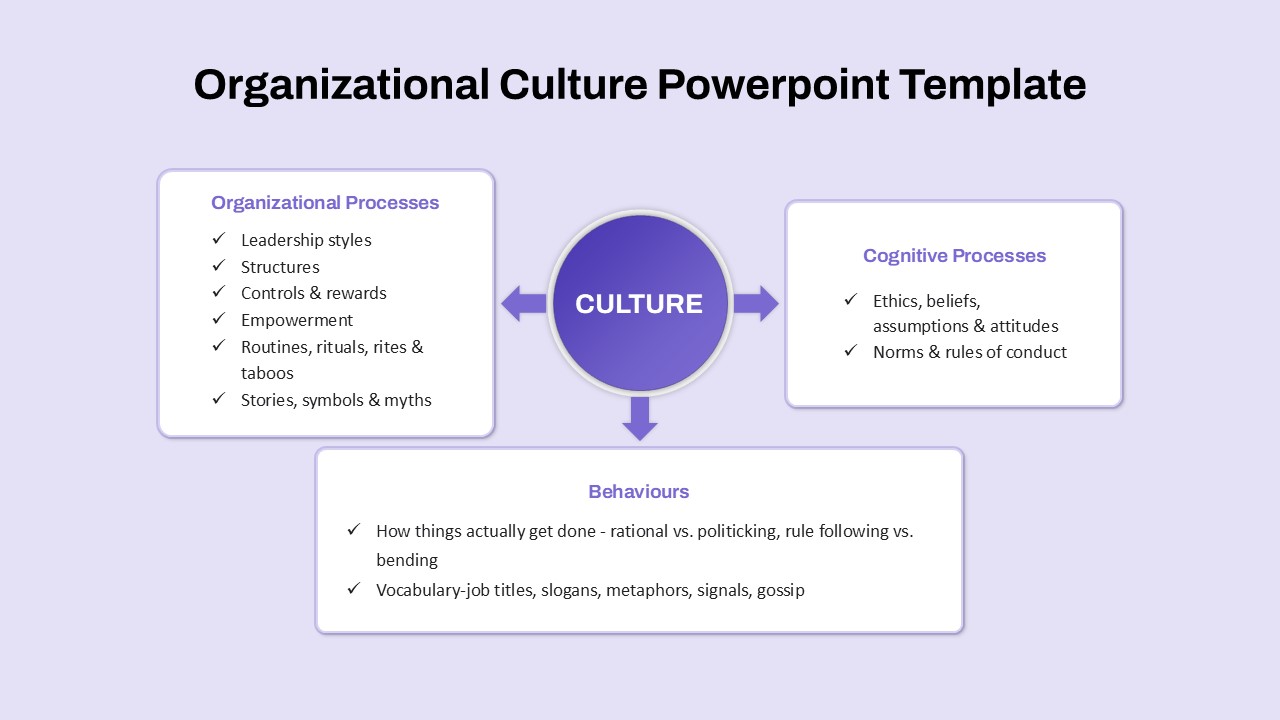
Organizational Culture Framework Diagram Template for PowerPoint & Google Slides
Arrow
Premium
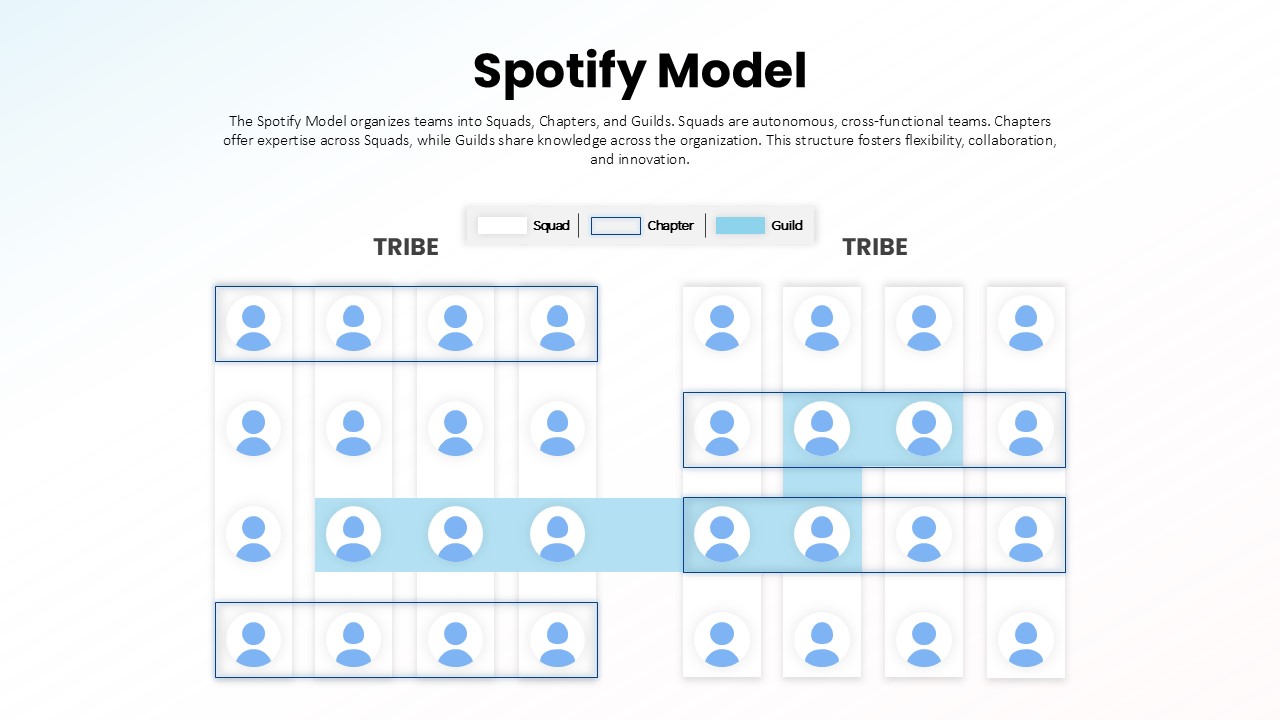
Spotify Model Organizational Structure template for PowerPoint & Google Slides
Business Strategy
Premium
Quad Chart Infographic Pack of 8 Slides Template for PowerPoint & Google Slides
Comparison Chart
Premium
Free Professional Gantt Chart Pack – 4 Slides Template for PowerPoint & Google Slides
Gantt Chart
Free
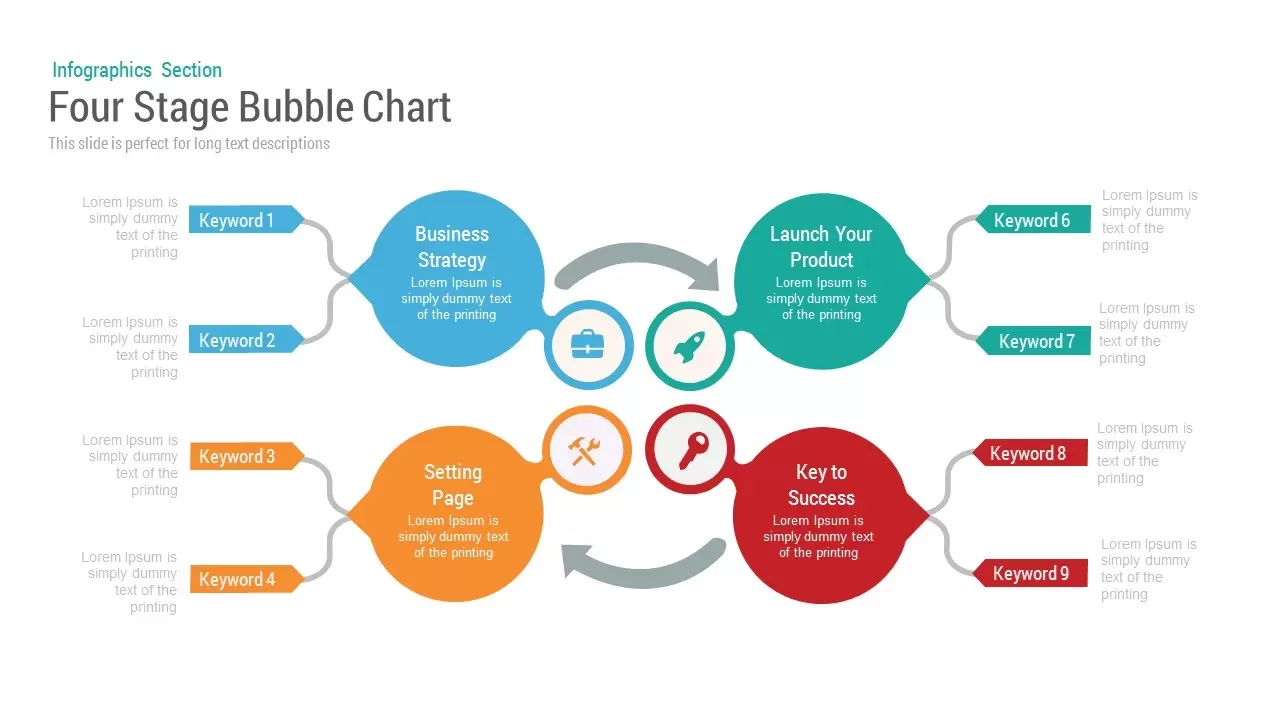
Bubble Chart template for PowerPoint & Google Slides
Charts
Premium

Corporate Organization Chart template for PowerPoint & Google Slides
Org Chart
Premium
Business Organization Chart Hierarchy Template for PowerPoint & Google Slides
Org Chart
Premium
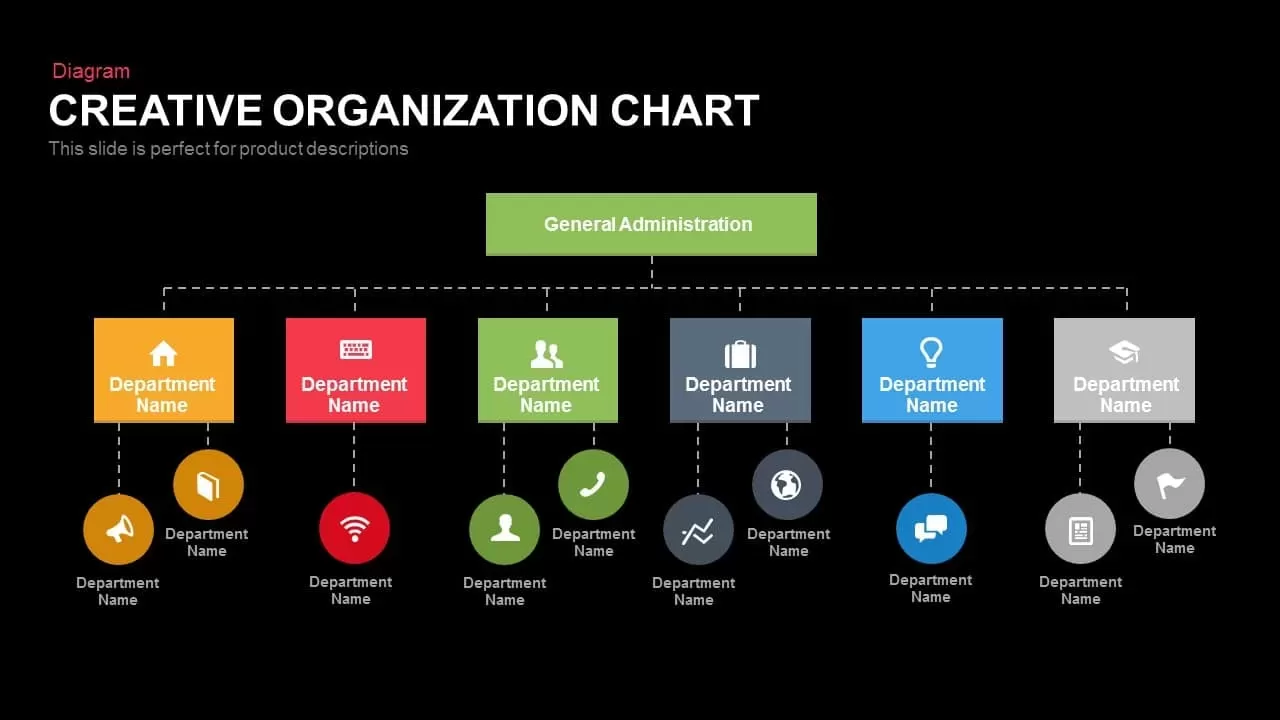
Creative Organization Chart Diagram Template for PowerPoint & Google Slides
Org Chart
Premium

Modern Ten-Block Section Title Chart template for PowerPoint & Google Slides
Comparison
Premium
Sales Bar Chart for PowerPoint & Google Slides
Bar/Column
Premium
Three-Stage Circular Options Chart Template for PowerPoint & Google Slides
Comparison
Premium
Line Chart Analysis template for PowerPoint & Google Slides
Charts
Premium

Radial Bar Chart Diagram for PowerPoint & Google Slides
Bar/Column
Premium
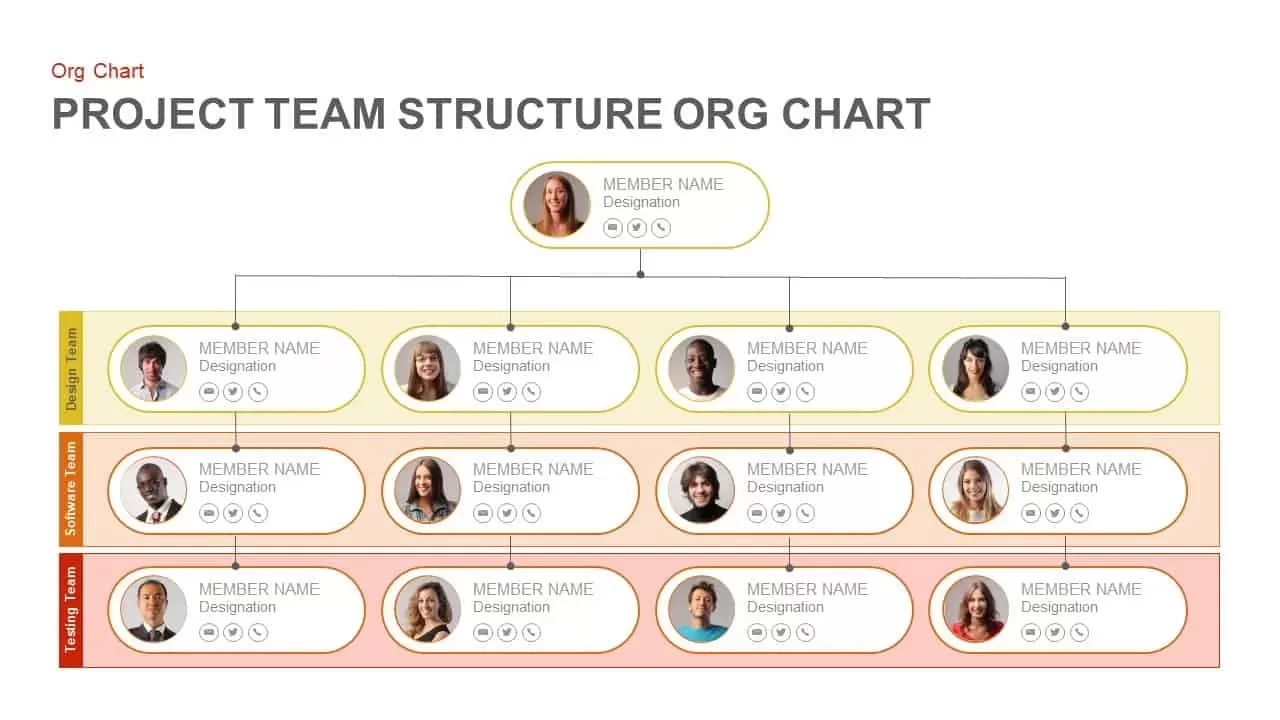
Project Team Structure Org Chart Template for PowerPoint & Google Slides
Org Chart
Premium
3D Organization Hierarchy Chart Template for PowerPoint & Google Slides
Org Chart
Premium
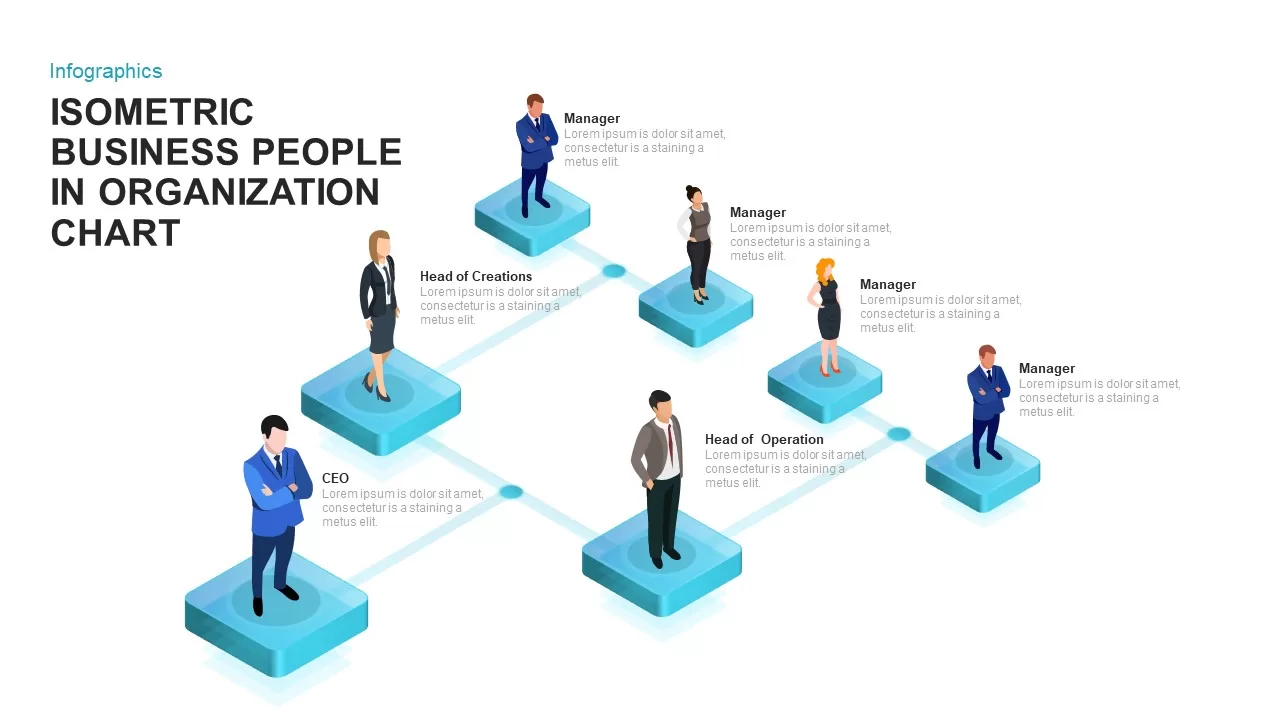
Isometric Business Organization Chart Template for PowerPoint & Google Slides
Org Chart
Premium
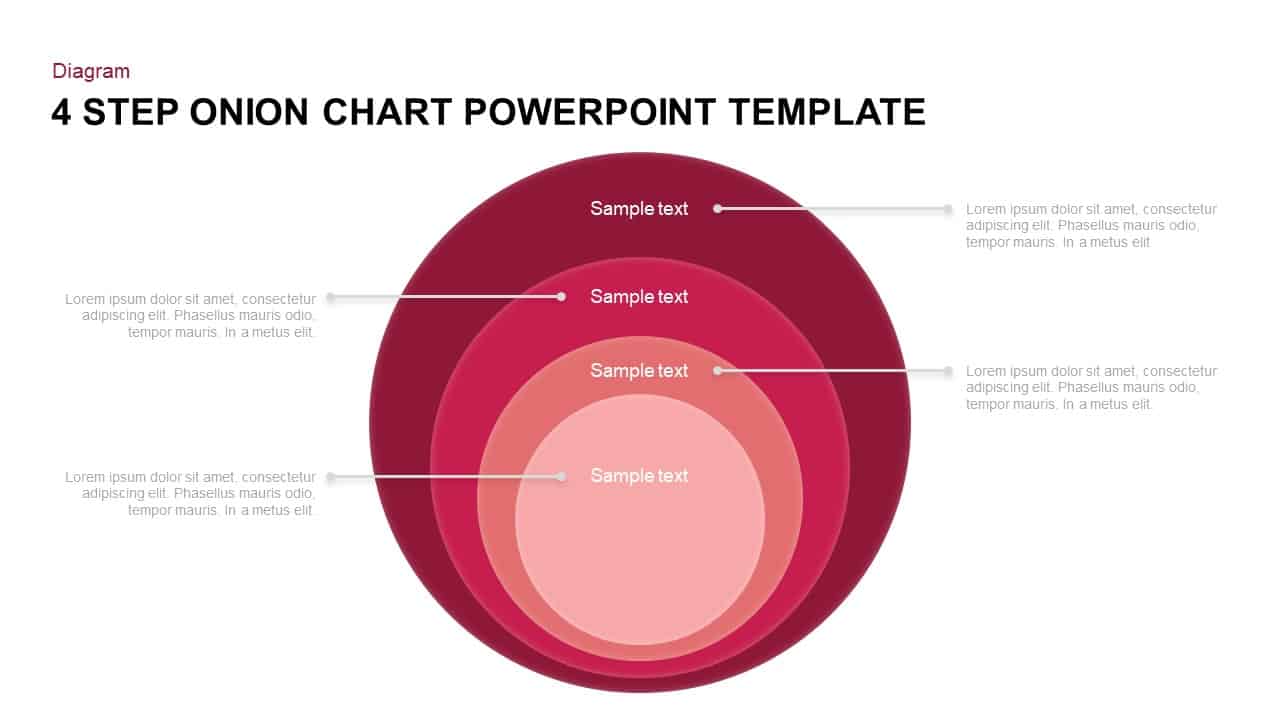
Four-Step Onion Chart Process Template for PowerPoint & Google Slides
Charts
Premium
Distracting Factors at Work Bar Chart Template for PowerPoint & Google Slides
Bar/Column
Premium
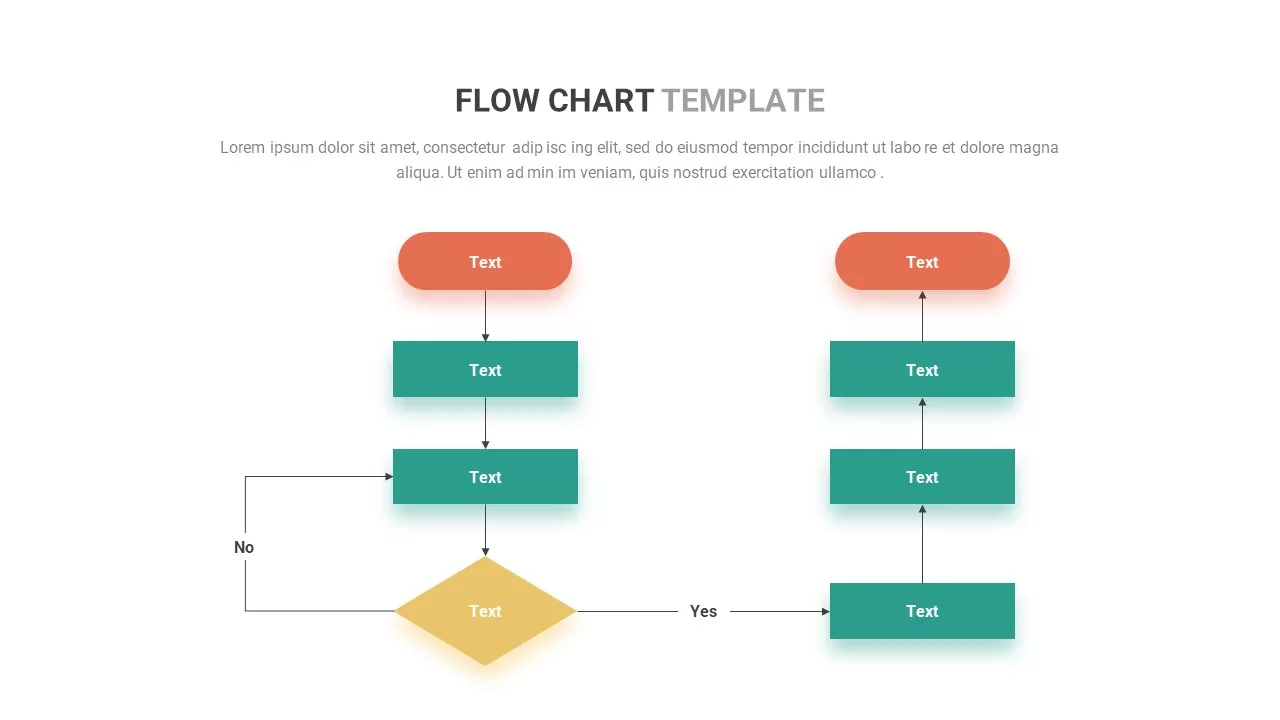
Flow Chart template for PowerPoint & Google Slides
Flow Charts
Premium
Cost Reduction Strategy Donut Chart Template for PowerPoint & Google Slides
Pie/Donut
Premium
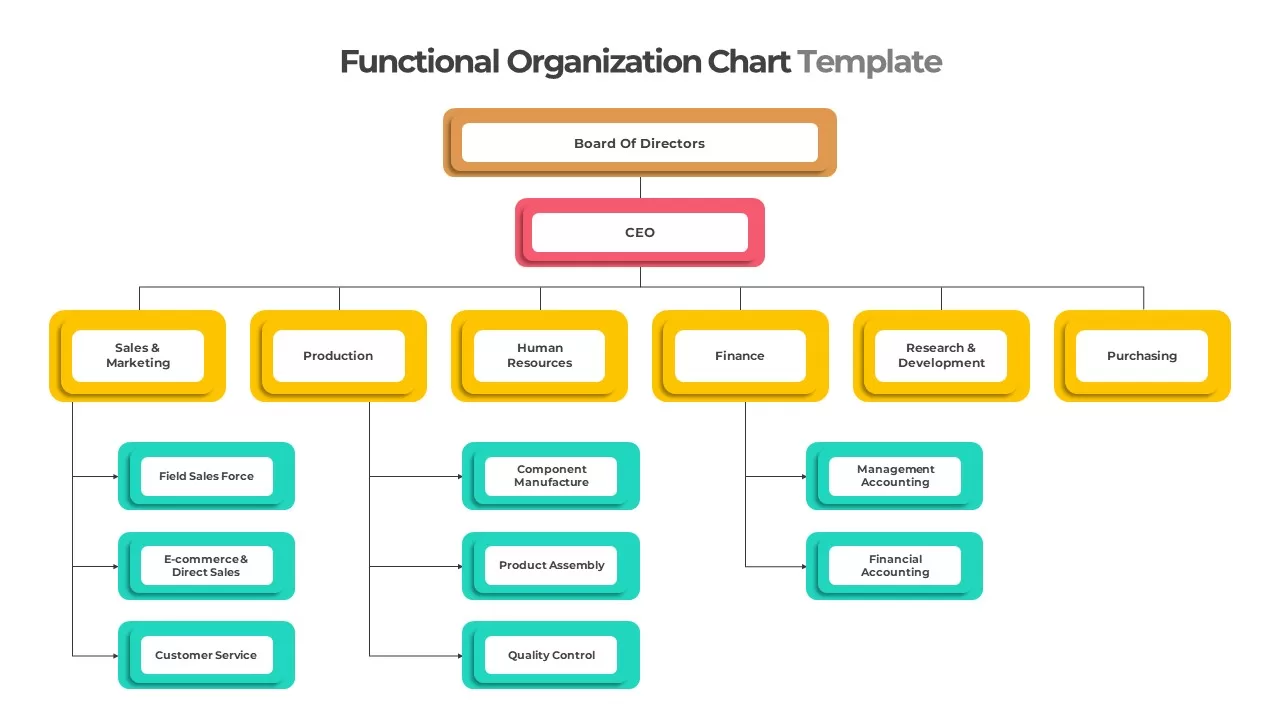
Colorful Functional Organization Chart Template for PowerPoint & Google Slides
Org Chart
Premium
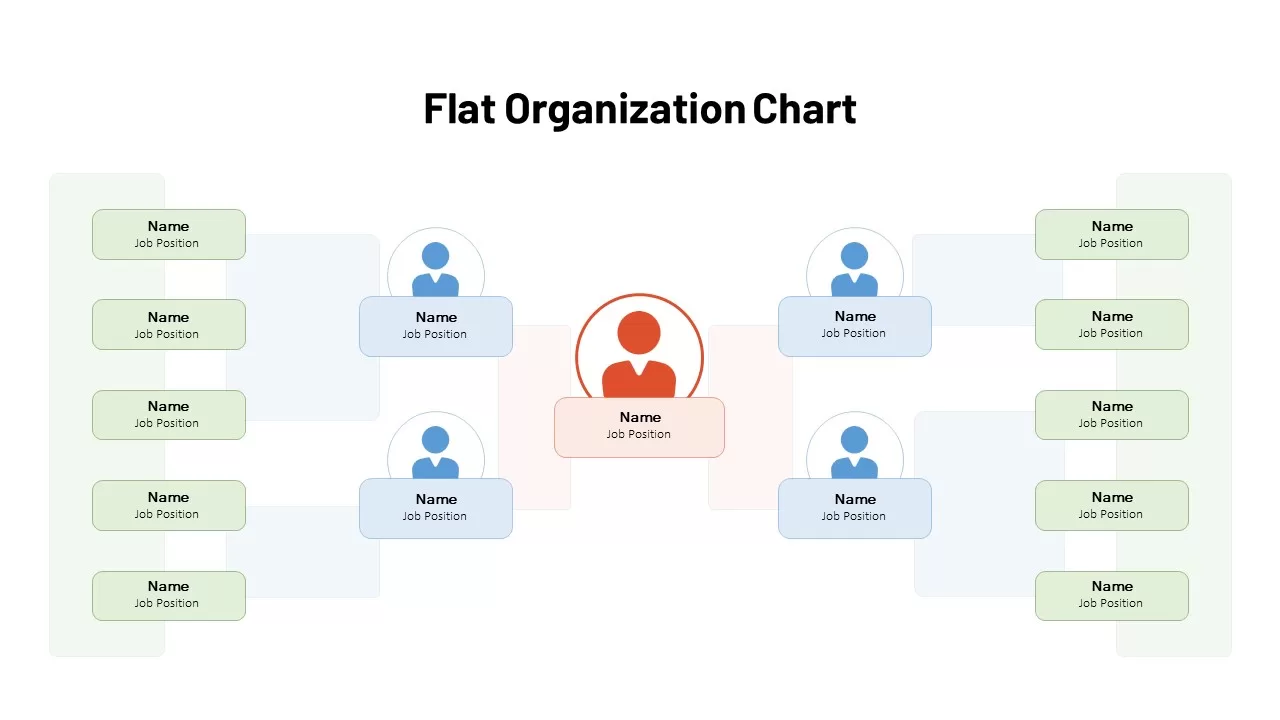
Flat Organization Chart Diagram Template for PowerPoint & Google Slides
Org Chart
Premium
Flat Organization Chart Diagram Template for PowerPoint & Google Slides
Org Chart
Premium
3D pie chart infographic template for PowerPoint & Google Slides
Pie/Donut
Premium
100% Stacked Bar Chart for PowerPoint & Google Slides
Bar/Column
Premium
Multi-Series Stacked Bar Chart Template for PowerPoint & Google Slides
Bar/Column
Premium
Professional Quad Chart Layout Template for PowerPoint & Google Slides
Pie/Donut
Premium
Multi-Series Vertical Dot Chart Template for PowerPoint & Google Slides
Comparison Chart
Premium
Multi-Style Clock Chart Diagram Template for PowerPoint & Google Slides
Circle
Premium
Free Versatile Product Comparison Chart Template for PowerPoint & Google Slides
Comparison Chart
Free
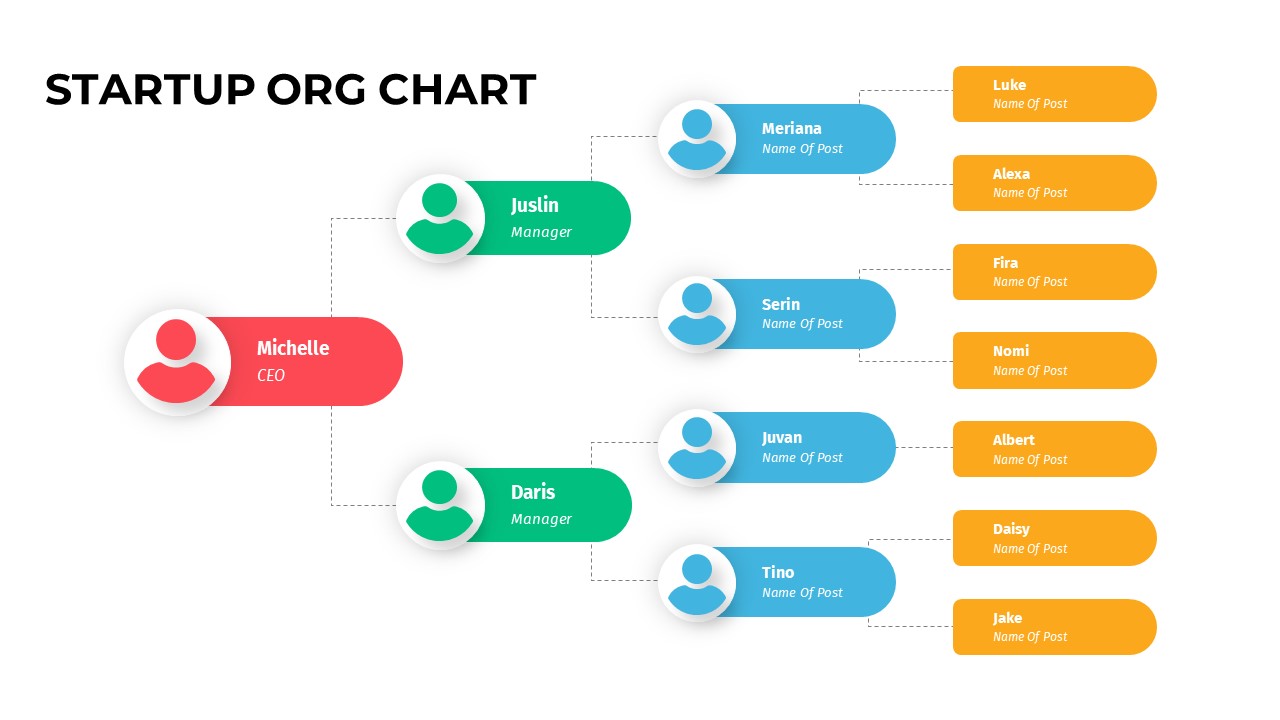
Color-Coded Startup Org Chart Slide for PowerPoint & Google Slides
Org Chart
Premium
Stacked Area Chart with Financial Highlights for PowerPoint & Google Slides
Finance
Premium
Bubble Chart Scatter, Diagram & Matrix Template for PowerPoint & Google Slides
Comparison Chart
Premium
Annual Growth Trend Analysis Chart template for PowerPoint & Google Slides
Business Report
Premium
Competitor Comparison Chart Design Template for PowerPoint & Google Slides
Comparison
Premium
Two-Option Bar Chart Comparison Table Template for PowerPoint & Google Slides
Comparison
Premium
Sales Growth Comparison Chart & Table Template for PowerPoint & Google Slides
Bar/Column
Premium
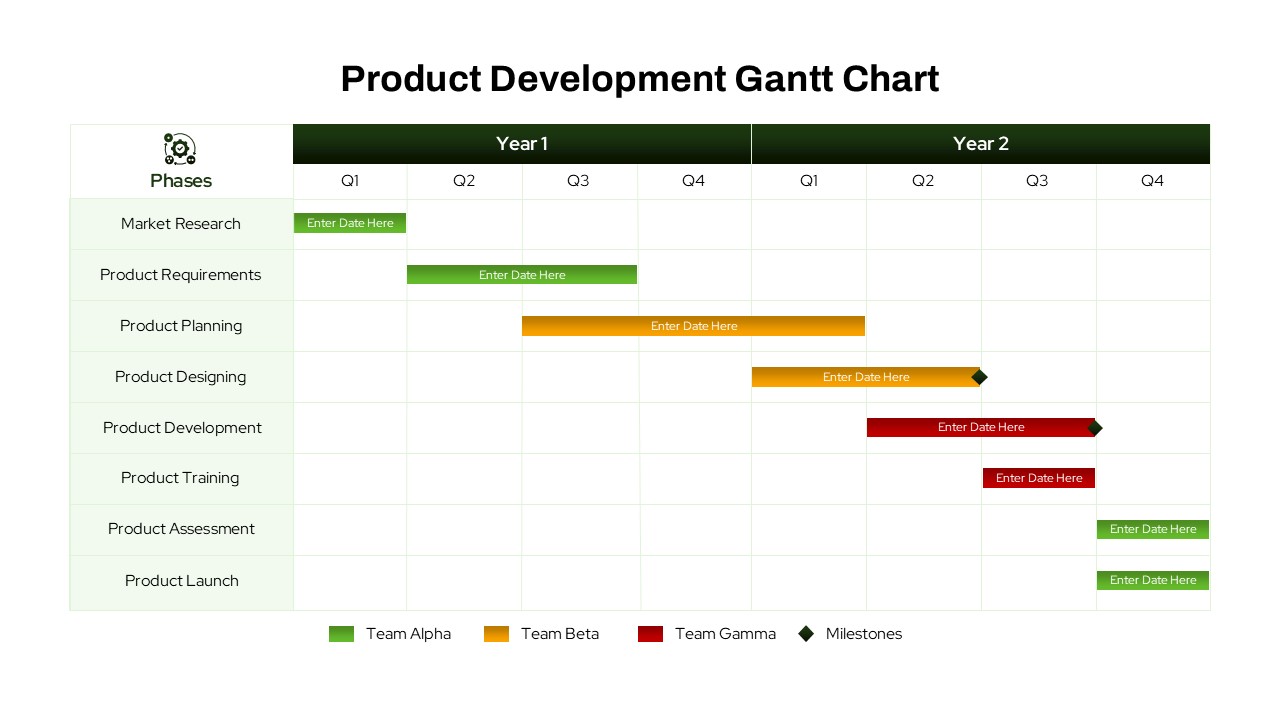
Product Development Gantt Chart template for PowerPoint & Google Slides
Gantt Chart
Premium
Bar Gantt Chart Template for PowerPoint & Google Slides
Gantt Chart
Premium