Corporate Synergy Venn Diagram PowerPoint Template

Transform Your Presentations with the Corporate Synergy Venn Diagram Template
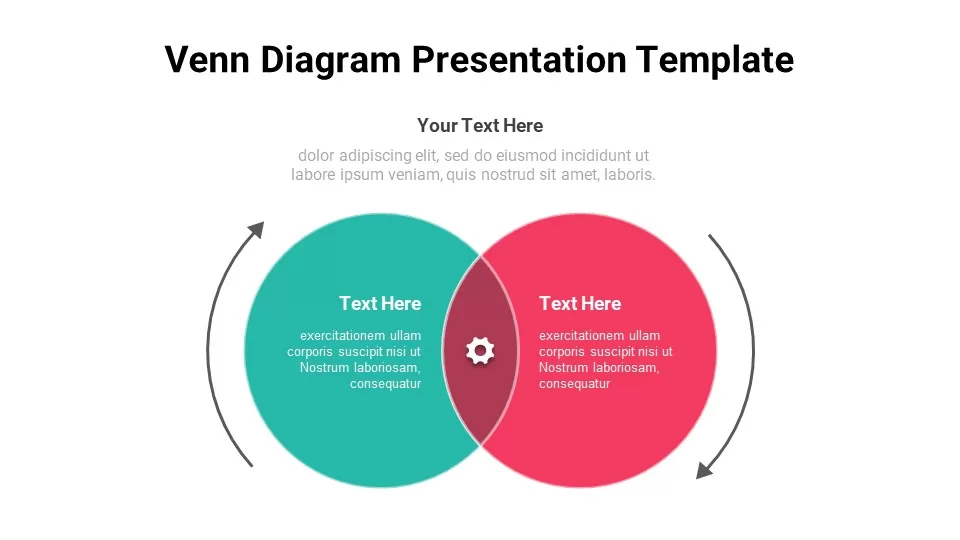
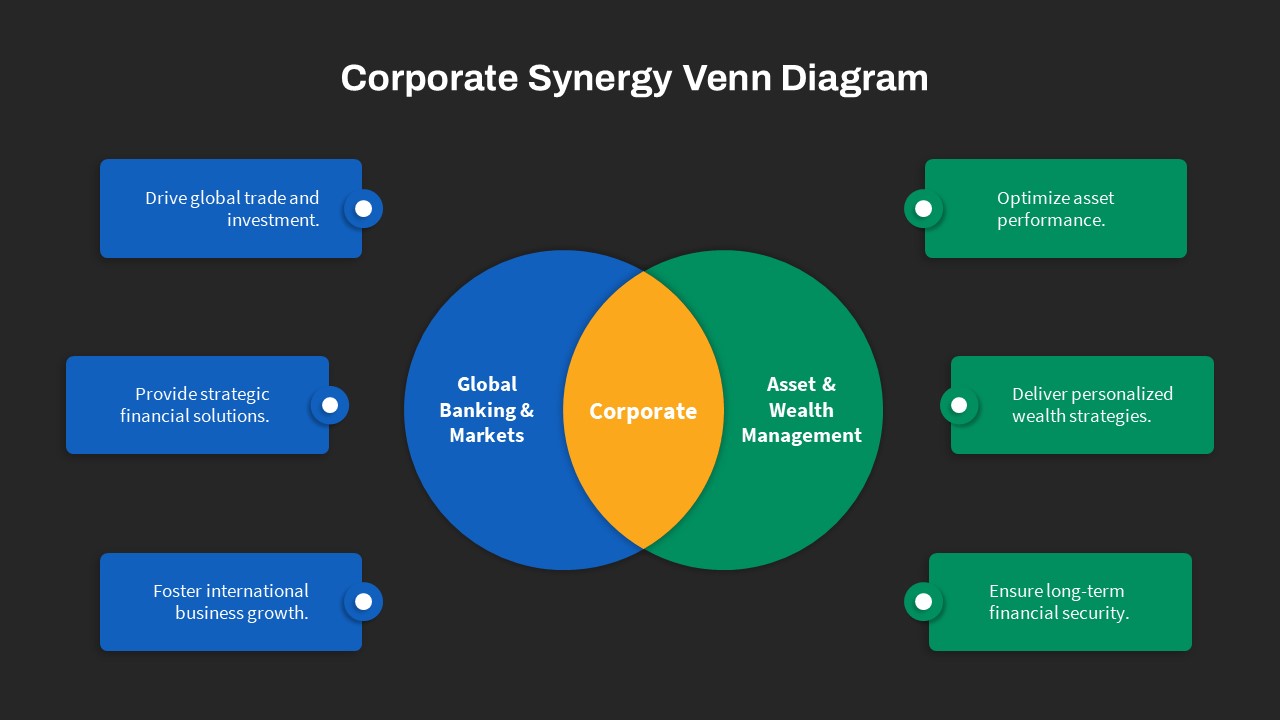
Choose a Venn diagram to present logical relationships and collaboration between elements. Our Corporate Synergy Venn Diagram Template is designed to illustrate the synergy between departments, highlighting both shared and distinct attributes. The intersecting circles represent relationships between sets and their commonalities. Corporations can use this template to emphasize collaborative efforts and shared goals between different departments or teams, making it an ideal tool for visualizing interdepartmental cooperation and synergy.
What is a Venn diagram example?
A Venn diagram is a graphical representation used to illustrate the relationships between different sets. It consists of overlapping circles, each representing a set. The areas where the circles overlap show the common elements shared by the sets, while the non-overlapping areas show elements unique to each set. For example, in a Venn diagram with two sets, A and B, the overlapping region represents elements that belong to both A and B. If A represents “students who play soccer” and B represents “students who play basketball,” the overlapping area would represent students who play both sports. This visual tool helps in understanding the logical relationships and intersections between different groups.
The Corporate Synergy Venn Diagram Template for PowerPoint presentation helps you to explain complex concepts and the importance of interdepartmental cooperation. Project management needs to showcase the interdependencies and collaboration between project teams. The users can demonstrate how various marketing strategies overlap and complement each other to achieve business objectives. Venn diagram provides a clear visual representation of corporate synergies to senior management and stakeholders. Project managers, business executives, consultants, sales and marketing teams, corporate trainers, and educators can download this Venn diagram ppt for different purposes.
The Venn diagram PowerPoint for corporate synergy presentation shows the relationship between asset & wealth management and global banking & markets. These are two set diagrams showing the commonality of intersecting circles. The blue, green, and yellow mix template is a six-step presentation where you can depict six elements of your topic. The rectangle-shaped text holders highlight your concepts with color patterns. Edit and incorporate your ideas and concepts with this Venn Diagram business presentation. Get it now!
Login to download this file

Item ID
SB04312
Related Templates

Venn Diagram Process PowerPoint Template and Keynote Slide
Diagrams
Premium

Creative Venn Diagram Template for PowerPoint & Keynote
Circular Diagrams
Premium
Venn Diagram infographic PowerPoint Template
Business Models
Premium
Gear Venn Diagram PowerPoint Template
Business Models
Premium
Free Simple Venn Diagram PowerPoint Template
Free PowerPoint Templates
Free
5 Circle Venn Diagram PowerPoint Template
Diagrams
Premium
8 Circle Venn Diagram PowerPoint Template
PowerPoint Templates
Premium
6 Circle Venn Diagram PowerPoint Template
PowerPoint Templates
Premium
Venn Diagram PPT Template and Keynote Slide
Diagrams
Premium
Free Venn Diagram Presentation Template
Infographic
Free
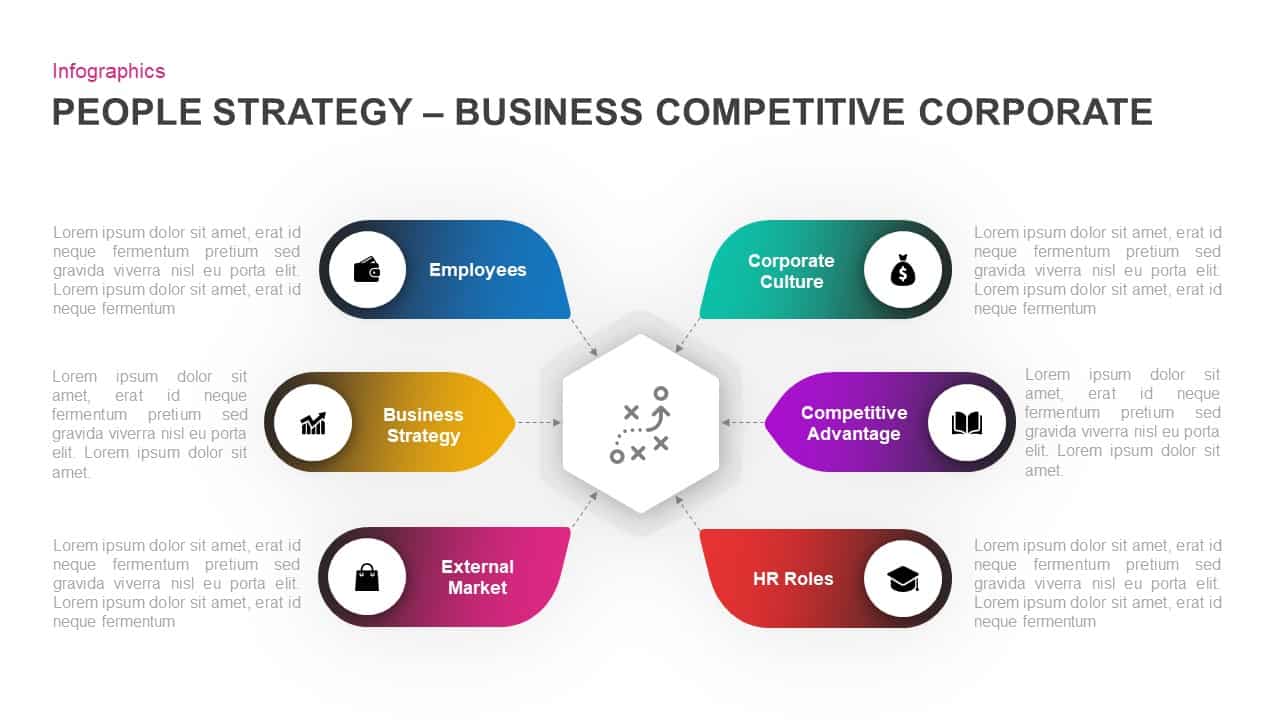
People Strategy Business Competitive Corporate Diagram
Business Models
Premium
Corporate PowerPoint Keynote Background Template
PowerPoint Background
Premium

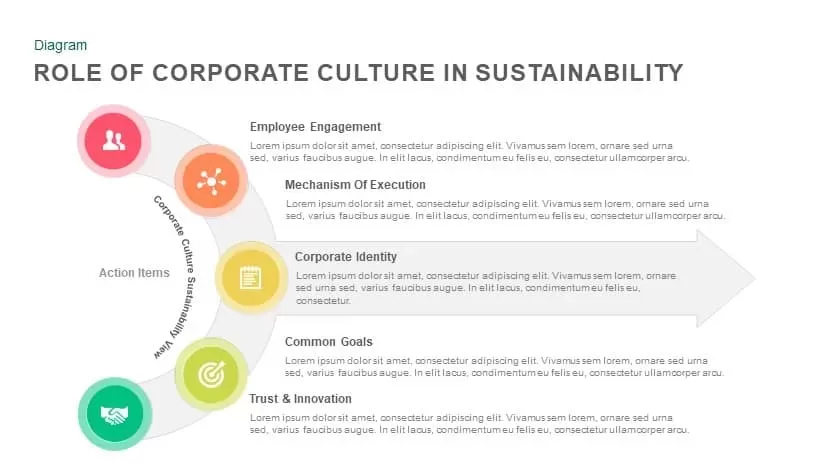
Role Of Corporate Culture in Sustainability Template for PowerPoint and Keynote
Diagrams
Premium
Free Corporate PowerPoint Template Design
Free PowerPoint Templates
Free

Corporate Consulting PowerPoint Template
PowerPoint Themes
Premium
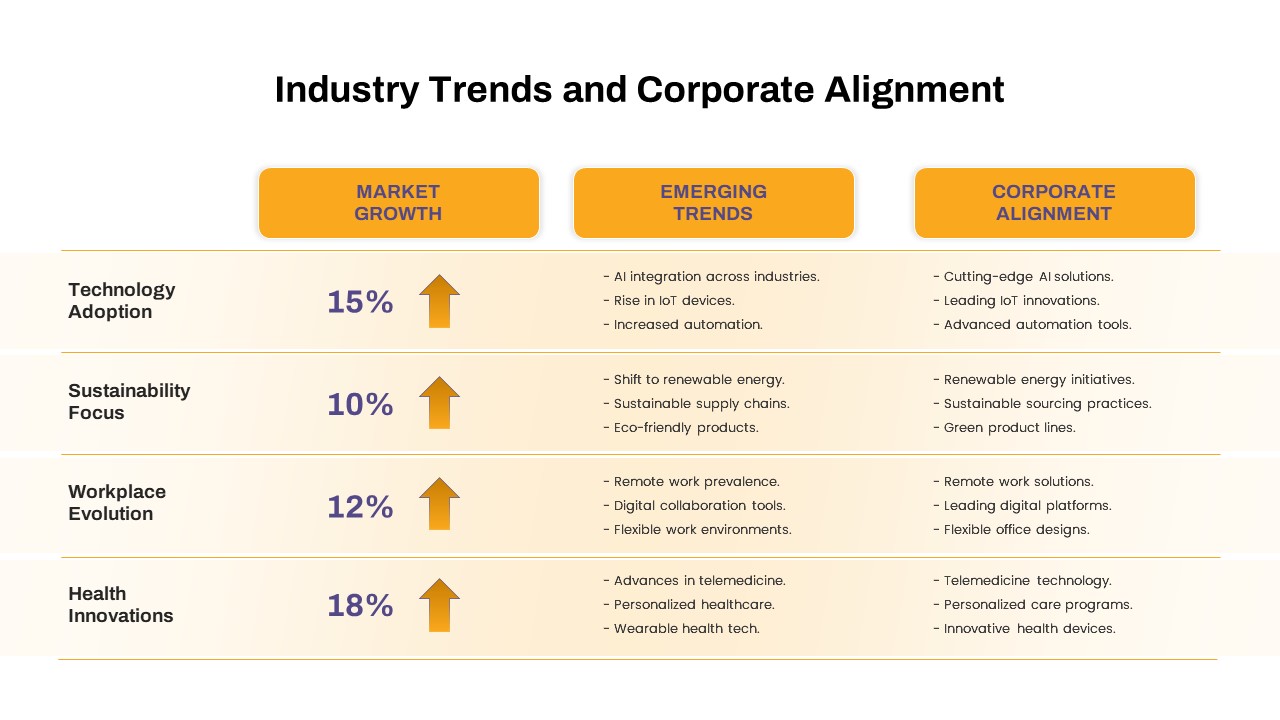
Industry Trends Corporate Alignment PowerPoint Template
Business PowerPoint Templates
Premium
Clean Corporate Deck PowerPoint Template
PowerPoint Templates
Premium
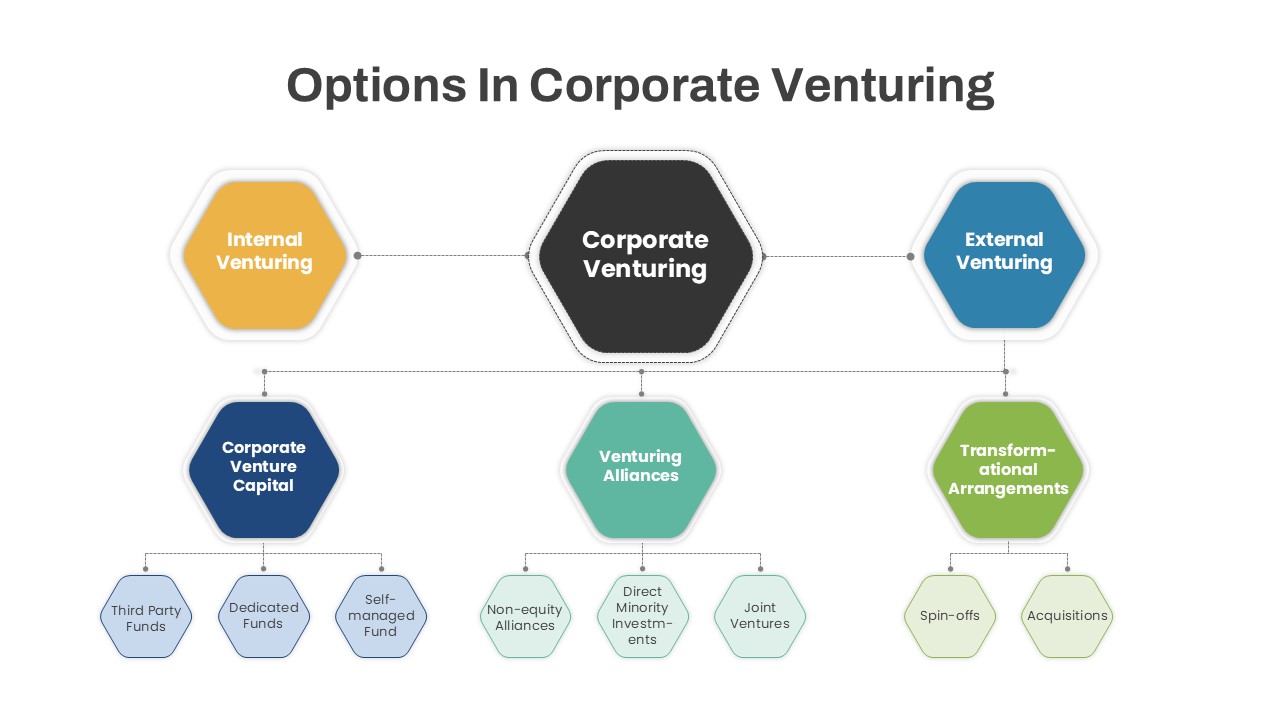
Options in Corporate Venturing PowerPoint Template
PowerPoint Templates
Premium
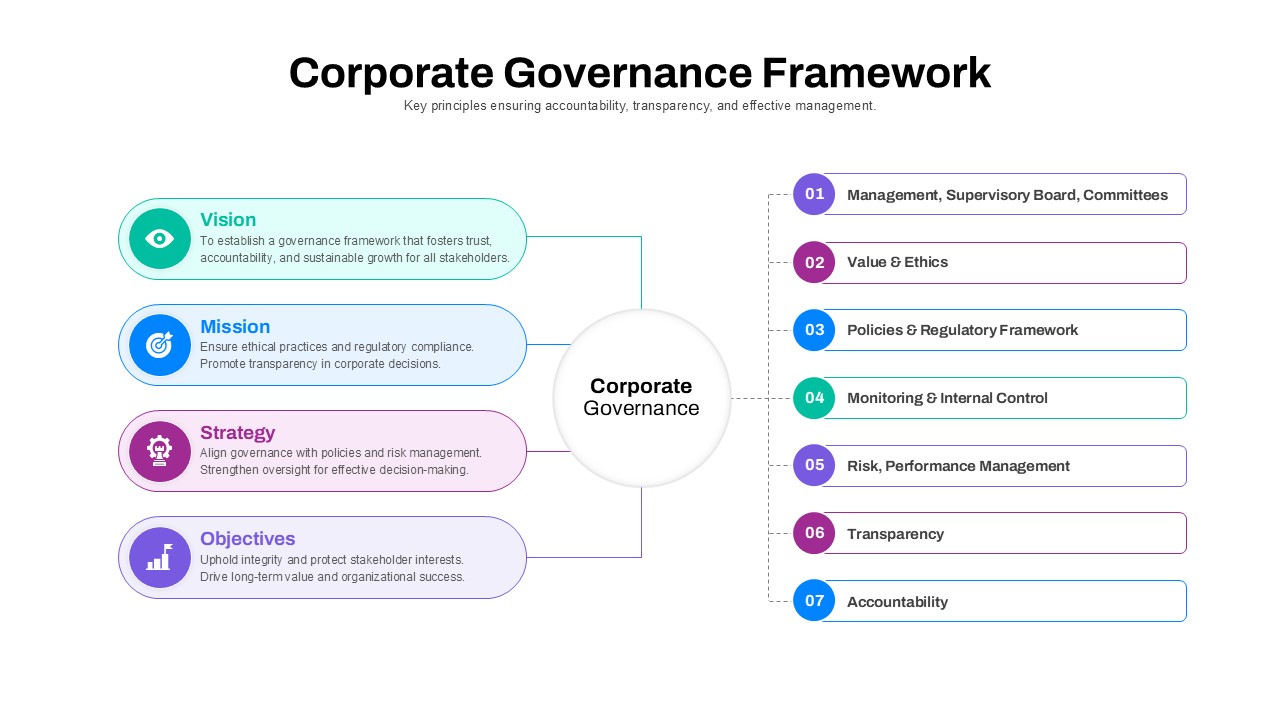
Corporate Governance Framework PowerPoint Template
PowerPoint Templates
Premium
Animated Corporate Company Profile PowerPoint Template
Company Profile Templates
Premium

Corporate PowerPoint Presentation Templates
PowerPoint Templates
Premium
Business Corporate Presentation Template
Business PowerPoint Templates
Premium
Free Corporate Presentation Template
PowerPoint Templates
Free
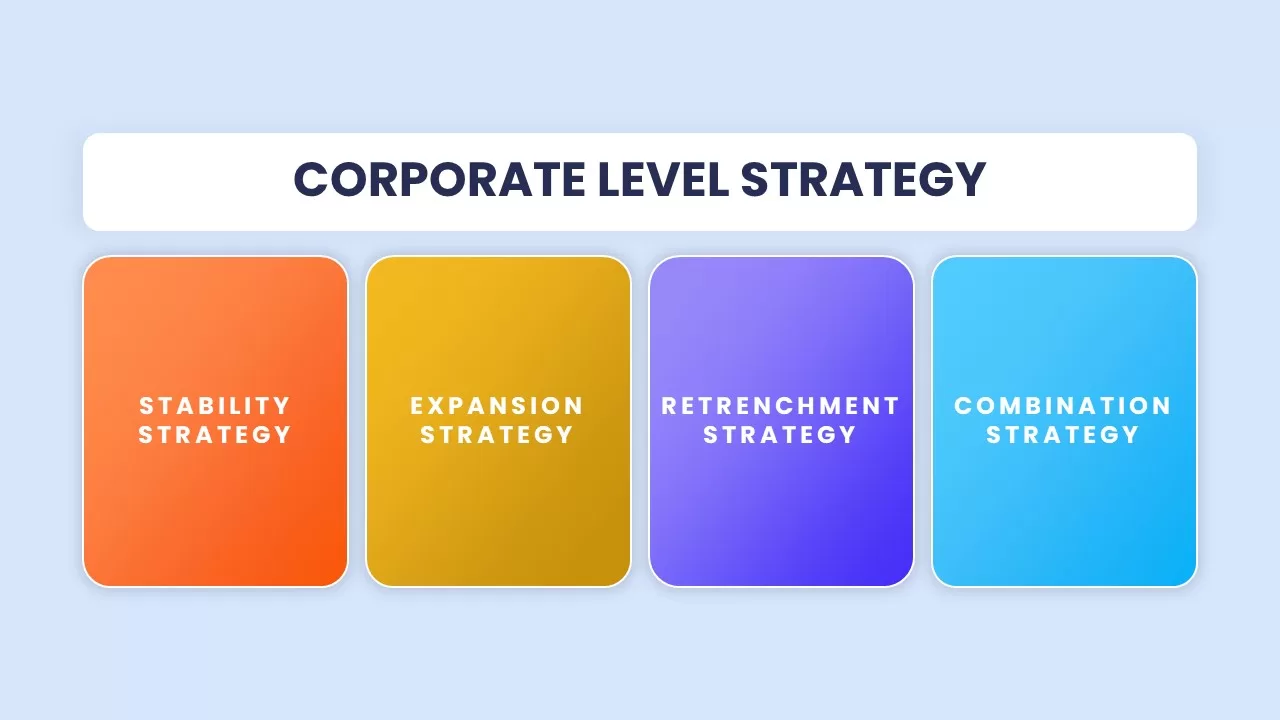
Corporate Level Strategy Template
Business PowerPoint Templates
Premium
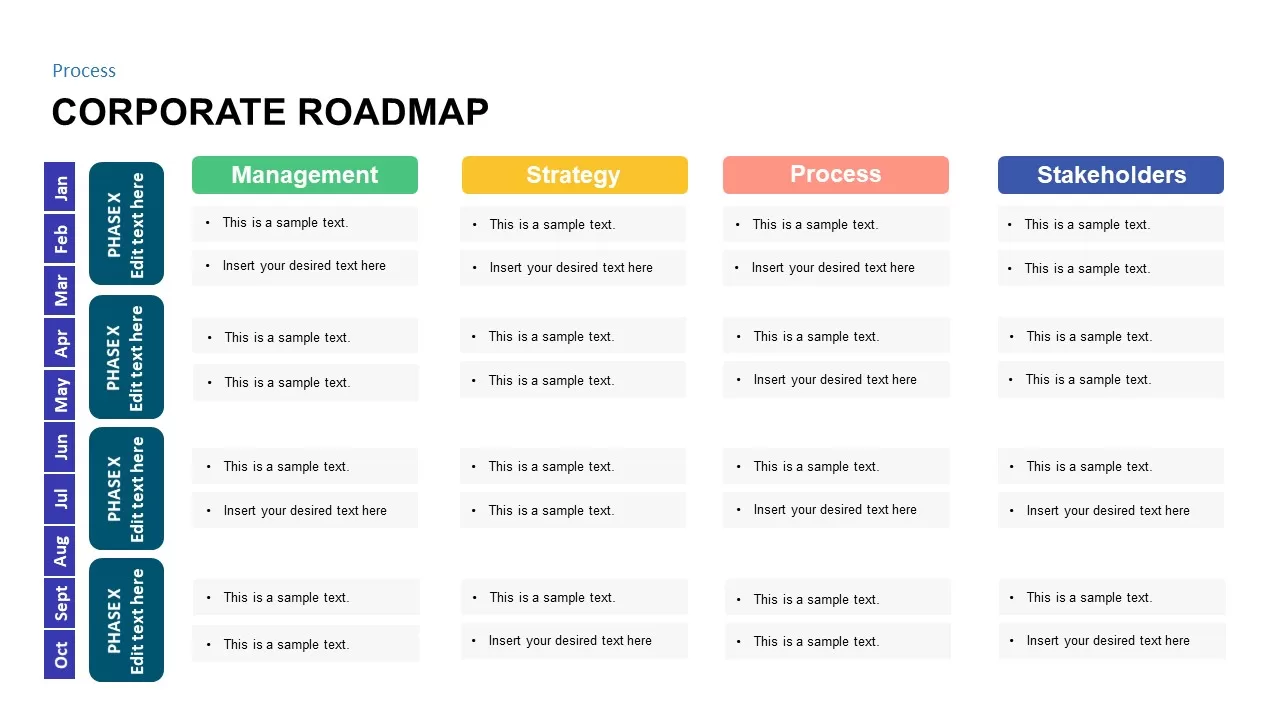
Corporate Roadmap Template
Business PowerPoint Templates
Premium
Corporate Deck PPT
Business PowerPoint Templates
Premium

Corporate Organization Chart PowerPoint Template
Org Charts
Premium
Corporate PowerPoint Presentation Template
Business PowerPoint Templates
Premium
Free Corporate Deck PowerPoint Template
PowerPoint Templates
Free

Corporate Social Responsibility Presentation Template
PowerPoint Templates
Premium
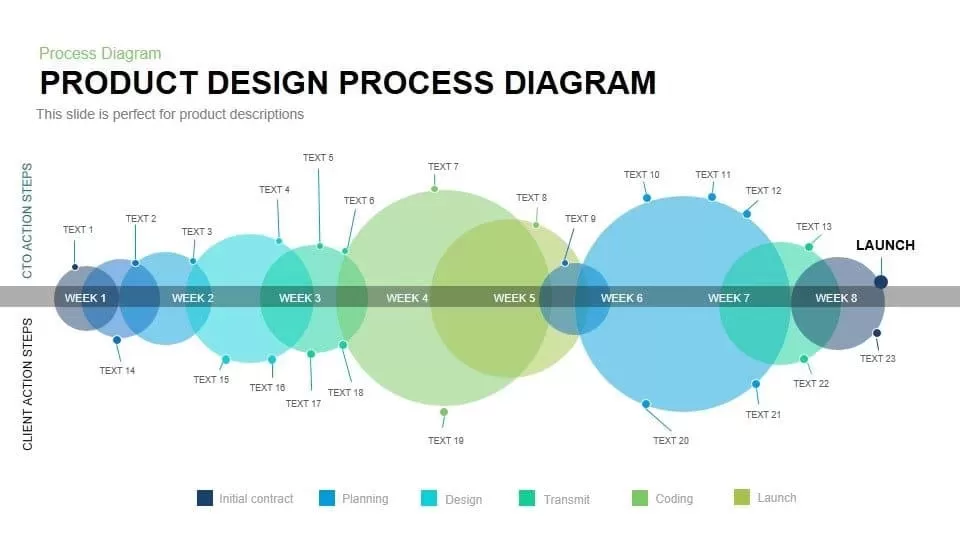
Product Design Process Diagram PowerPoint Template and Keynote
Business Models
Premium
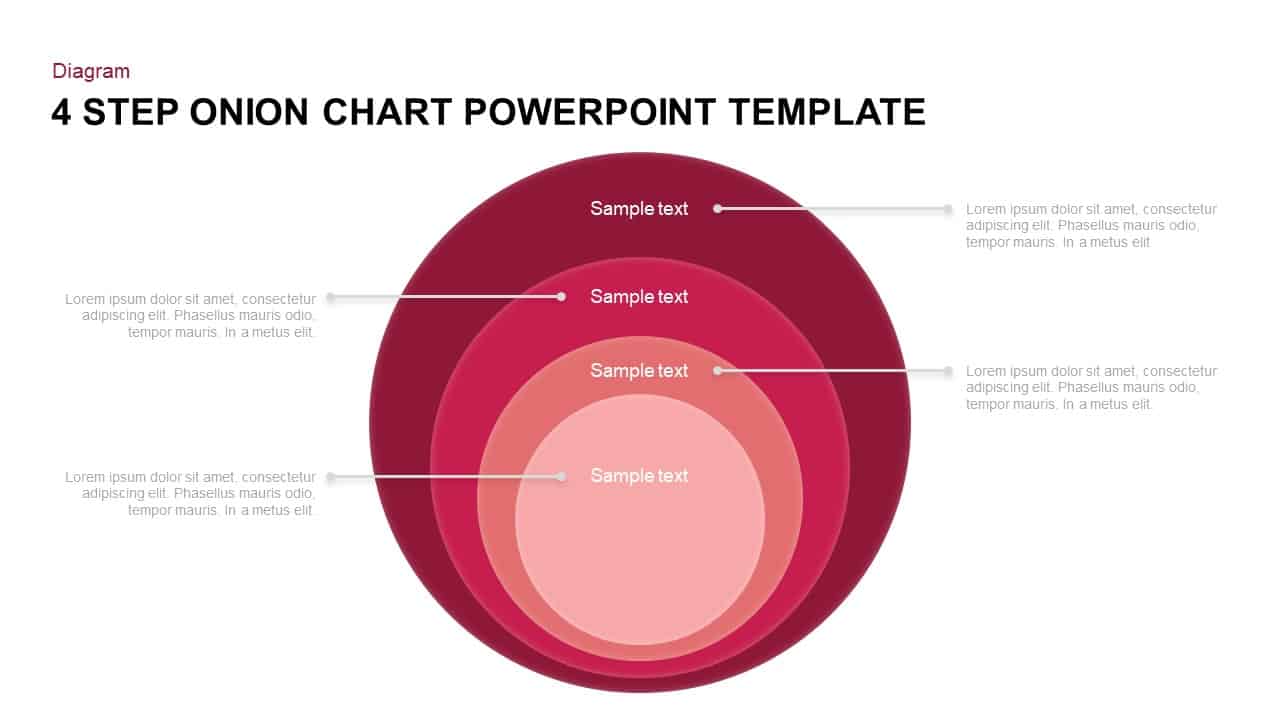
4 Steps Onion Diagram Template for PowerPoint and Keynote
Business Models
Premium
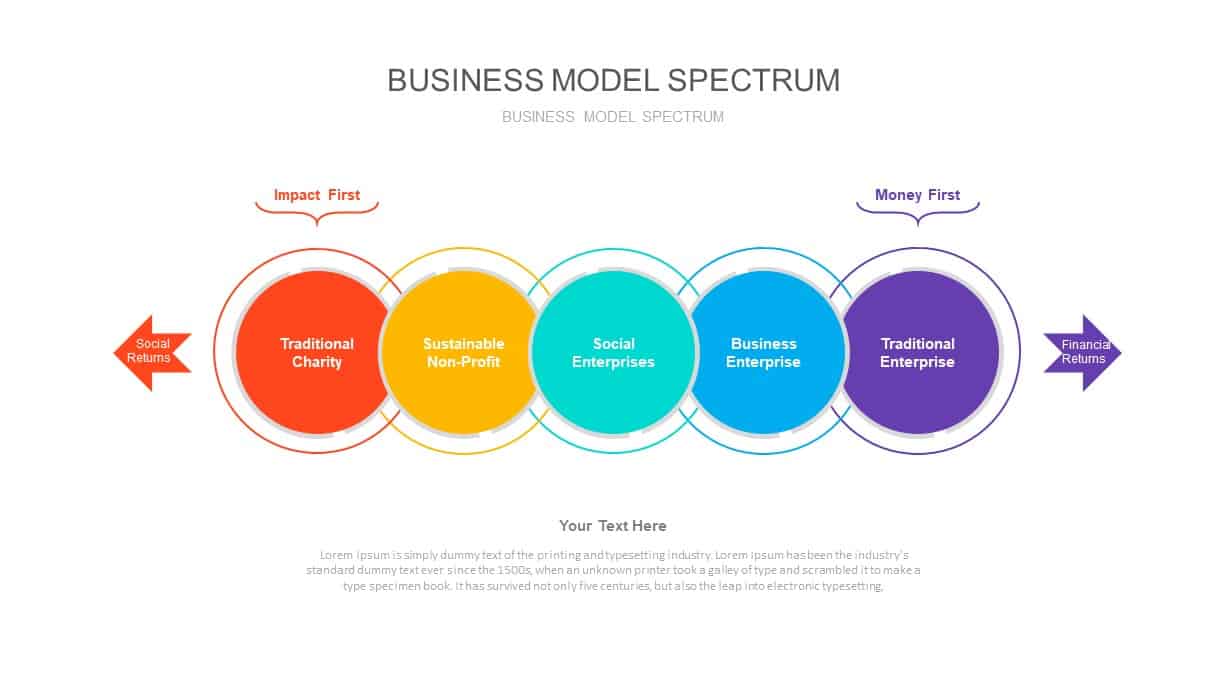
Business Model Spectrum PowerPoint Diagram
Business Models
Premium
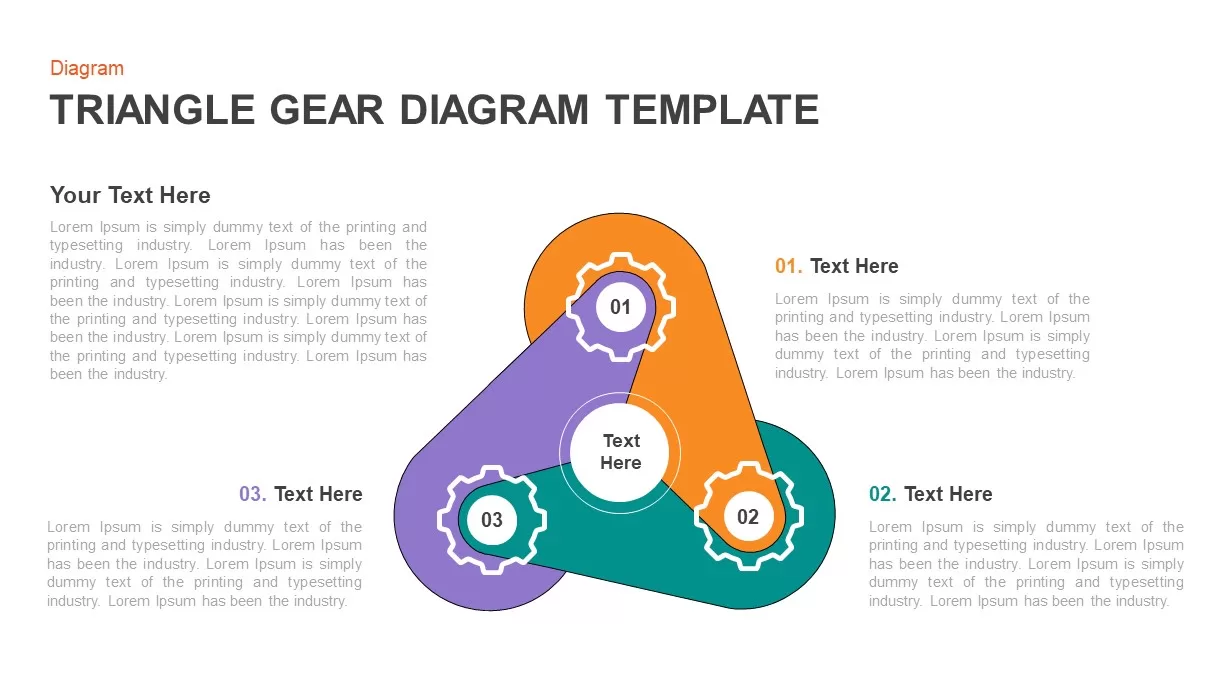
Triangle Gear Diagram Template
Gear
Premium