Year-over-Year Performance Comparison Template for PowerPoint & Google Slides


Description
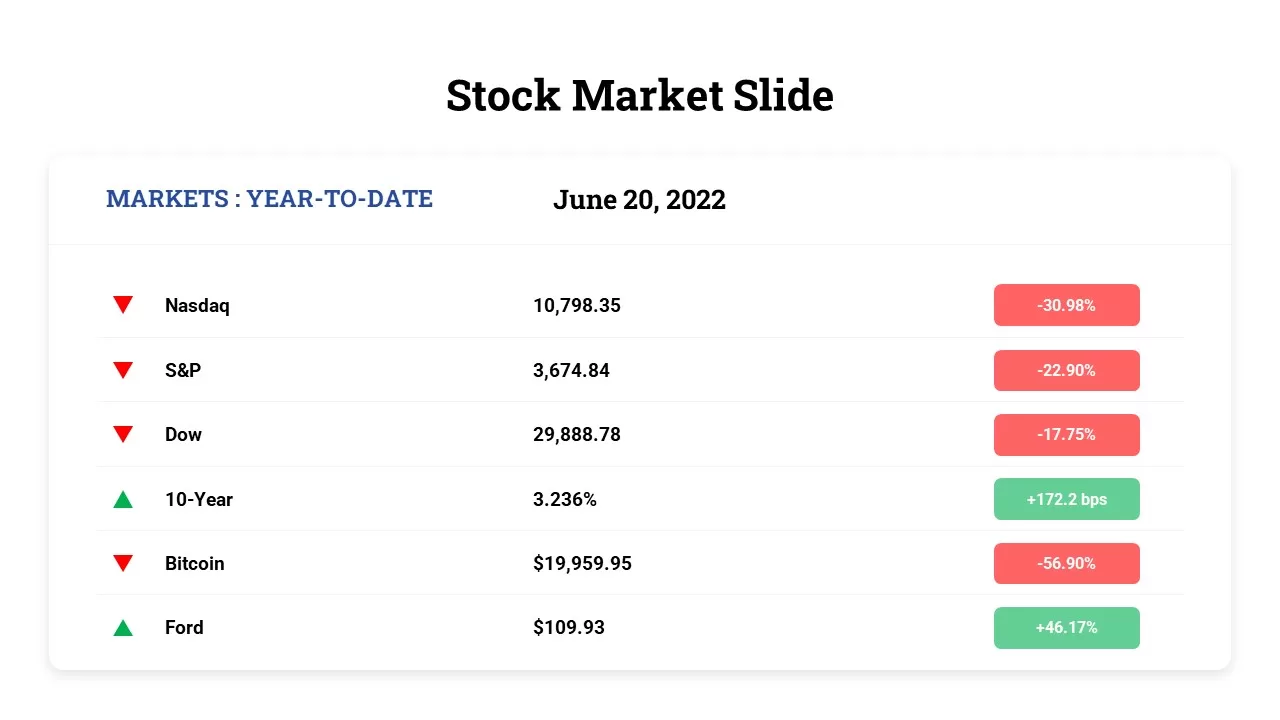
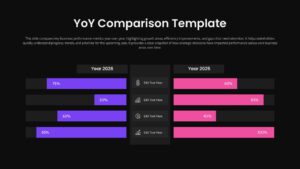
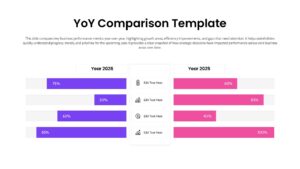
Present annual business performance with clarity using this Year-over-Year Performance Comparison Template for PowerPoint & Google Slides. Designed with a bold dark background and vibrant contrasting bars, this slide visually compares key metrics between two consecutive years in a clean side-by-side layout. Each horizontal bar highlights percentage values for Year 2026 and Year 2025, enabling stakeholders to quickly identify growth trends, declines, and performance gaps.
The structured format includes dedicated metric labels in the center column, paired with icon placeholders for added visual context. Gradient accent colors differentiate each year, ensuring instant visual separation while maintaining a cohesive, executive-ready aesthetic. The high-contrast typography and balanced spacing enhance readability, making complex data easier to interpret during strategic reviews.
Fully editable charts, text placeholders, and color schemes allow you to tailor the slide to revenue, sales growth, operational efficiency, customer acquisition, or KPI tracking metrics. Optimized for both PowerPoint and Google Slides, this template maintains formatting consistency and visual impact across devices and presentation settings.
Who is it for
Business leaders, finance managers, analysts, and consultants can use this slide to present annual reports, board updates, and strategic performance reviews. It is especially valuable for executive dashboards and stakeholder meetings.
Other Uses
Beyond year-over-year analysis, repurpose this layout for quarterly comparisons, departmental performance tracking, budget versus actual reporting, or campaign effectiveness reviews. The side-by-side bar format also supports competitor benchmarking and progress monitoring.
Login to download this file

Item ID
SB05801Designed By
Naseeba
Related Templates

Year-over-Year Stacked Gender Bar Chart Template for PowerPoint & Google Slides
Bar/Column
Hits and Misses Performance Comparison Template for PowerPoint & Google Slides
Comparison
Google Ads Optimization & Performance Infographic Template for PowerPoint & Google Slides
Digital Marketing
Profit Performance Trend Chart Template for PowerPoint & Google Slides
Finance
Sales vs Budget Performance Chart Template for PowerPoint & Google Slides
Bar/Column

Website Performance Dashboard template for PowerPoint & Google Slides
Charts
Sales Performance Dashboard template for PowerPoint & Google Slides
Business Report
Performance Review Process Management Cycle template for PowerPoint & Google Slides
Employee Performance
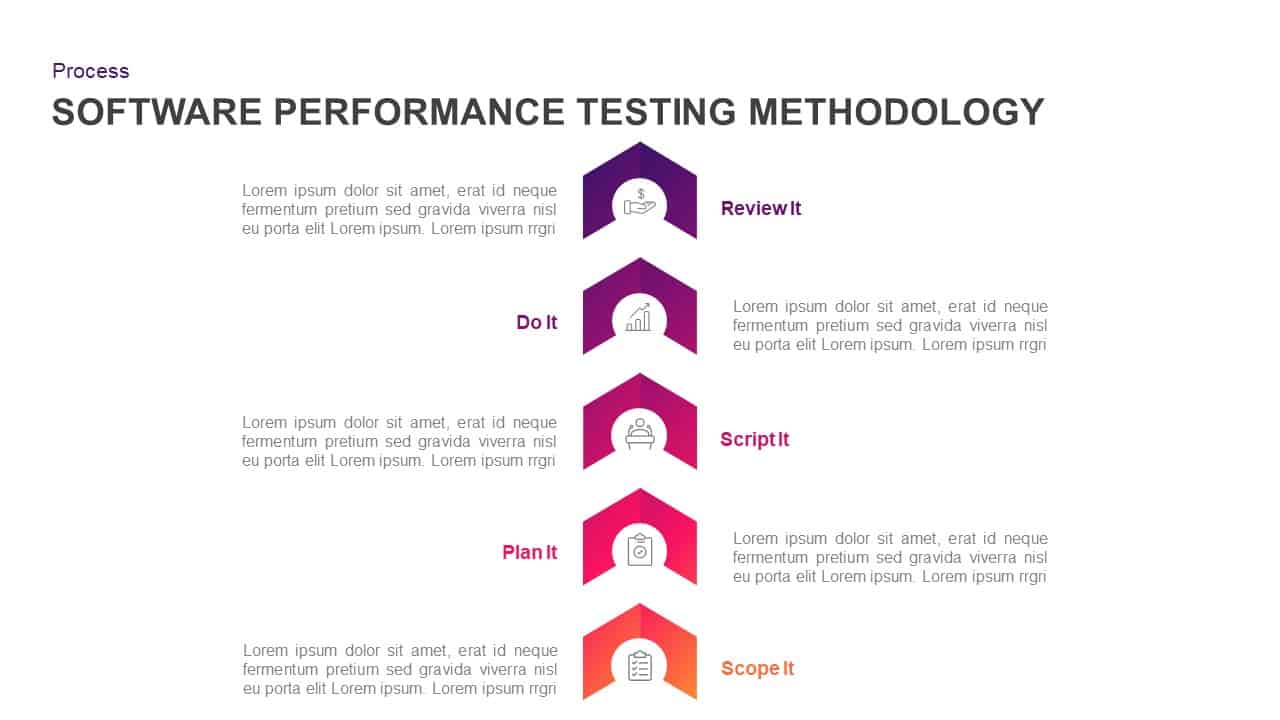
Software Performance Testing Methodology Template for PowerPoint & Google Slides
Process
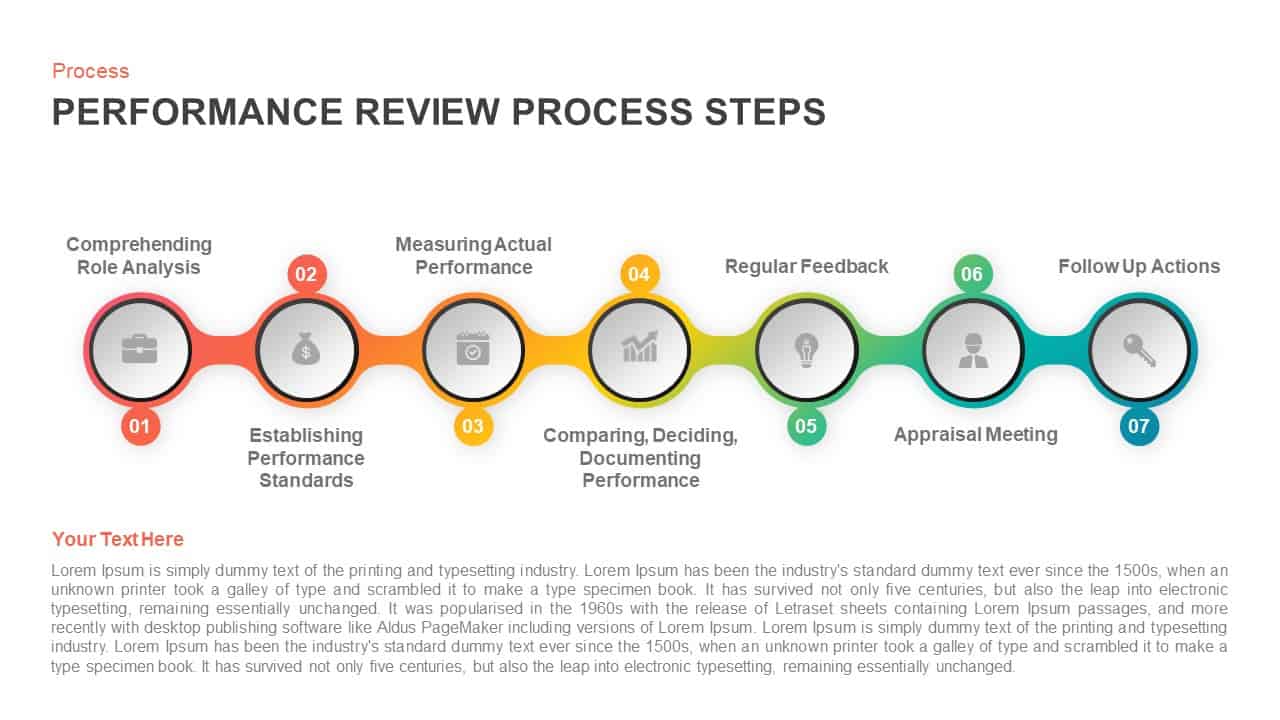
Performance Review Process Steps Template for PowerPoint & Google Slides
Employee Performance
Social Media Performance Dashboard Template for PowerPoint & Google Slides
Bar/Column
Professional Sales Performance Report Template for PowerPoint & Google Slides
Business Report
Performance Review Progress Management Template for PowerPoint & Google Slides
Process
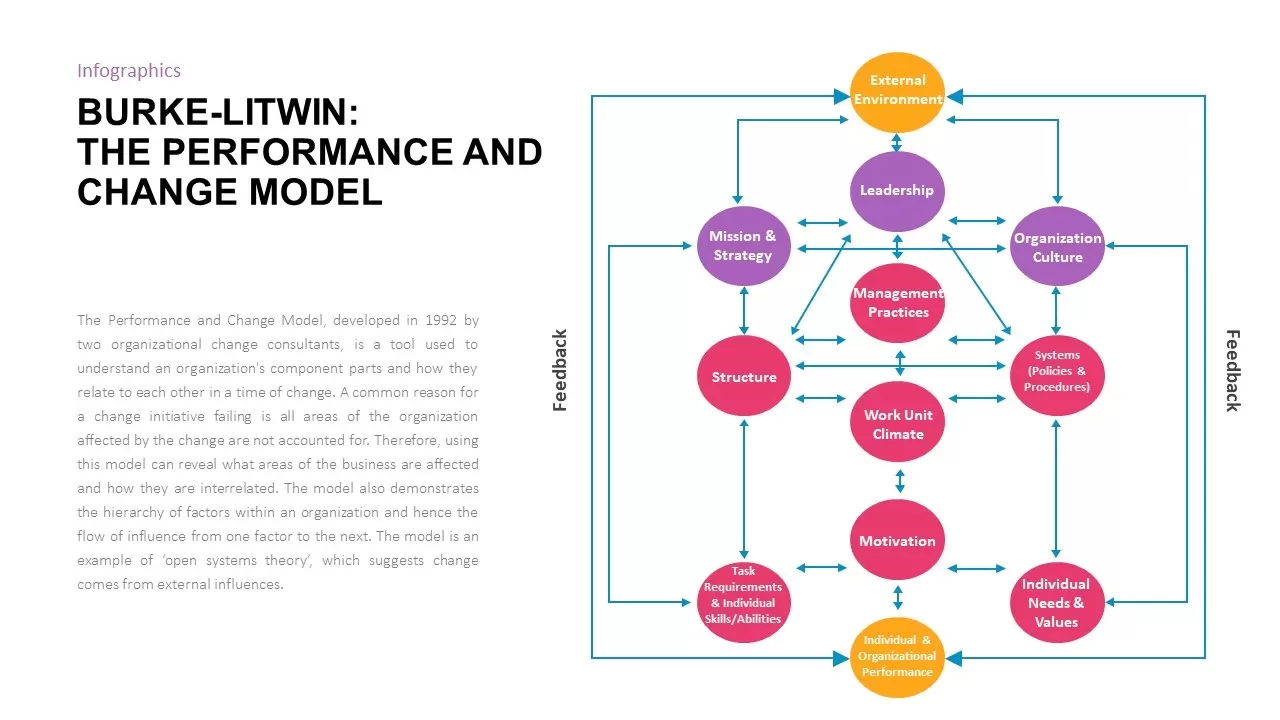
Burke-Litwin Performance and Change Model template for PowerPoint & Google Slides
Infographics
Corporate Performance Management Template for PowerPoint & Google Slides
Pitch Deck
Performance KPI Dashboard Slide Template for PowerPoint & Google Slides
Business Report
Free Stock Market Performance Overview template for PowerPoint & Google Slides
Finance
Free
9-Box Matrix for Performance & Potential Template for PowerPoint & Google Slides
Employee Performance
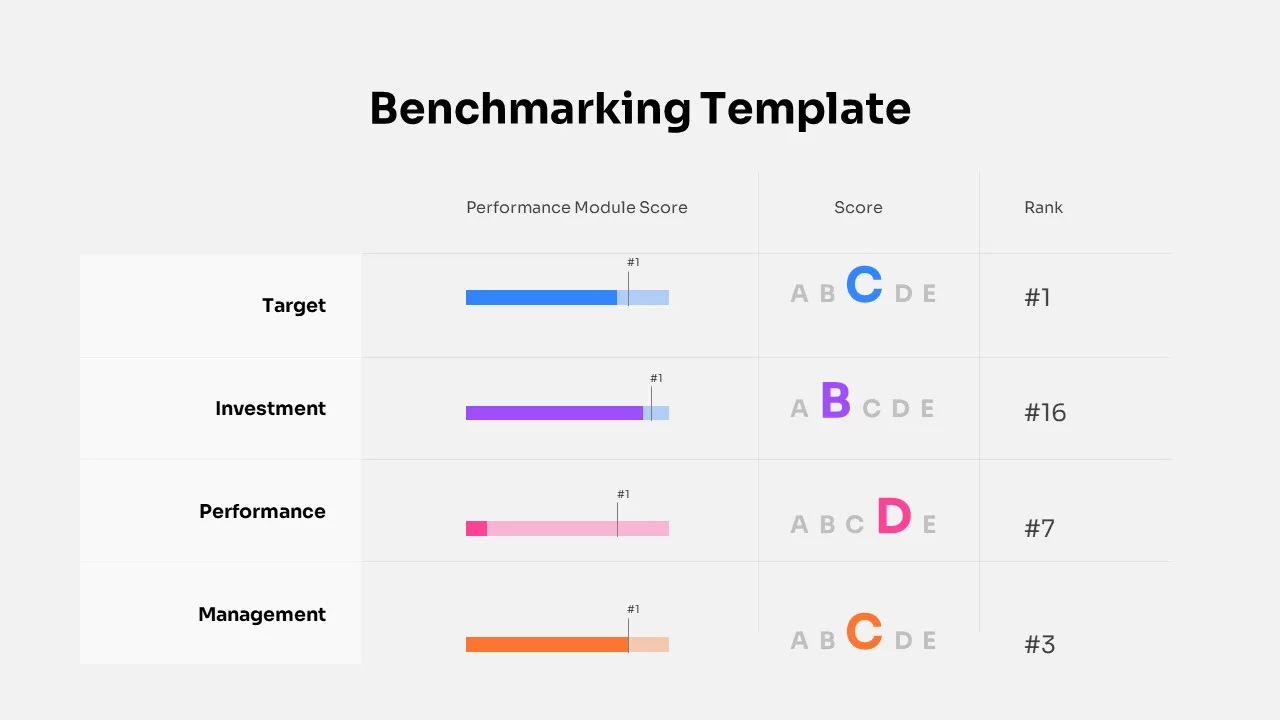
Benchmarking Performance Score Template for PowerPoint & Google Slides
Comparison Chart
Website Performance Monitoring Dashboard Template for PowerPoint & Google Slides
Business Report
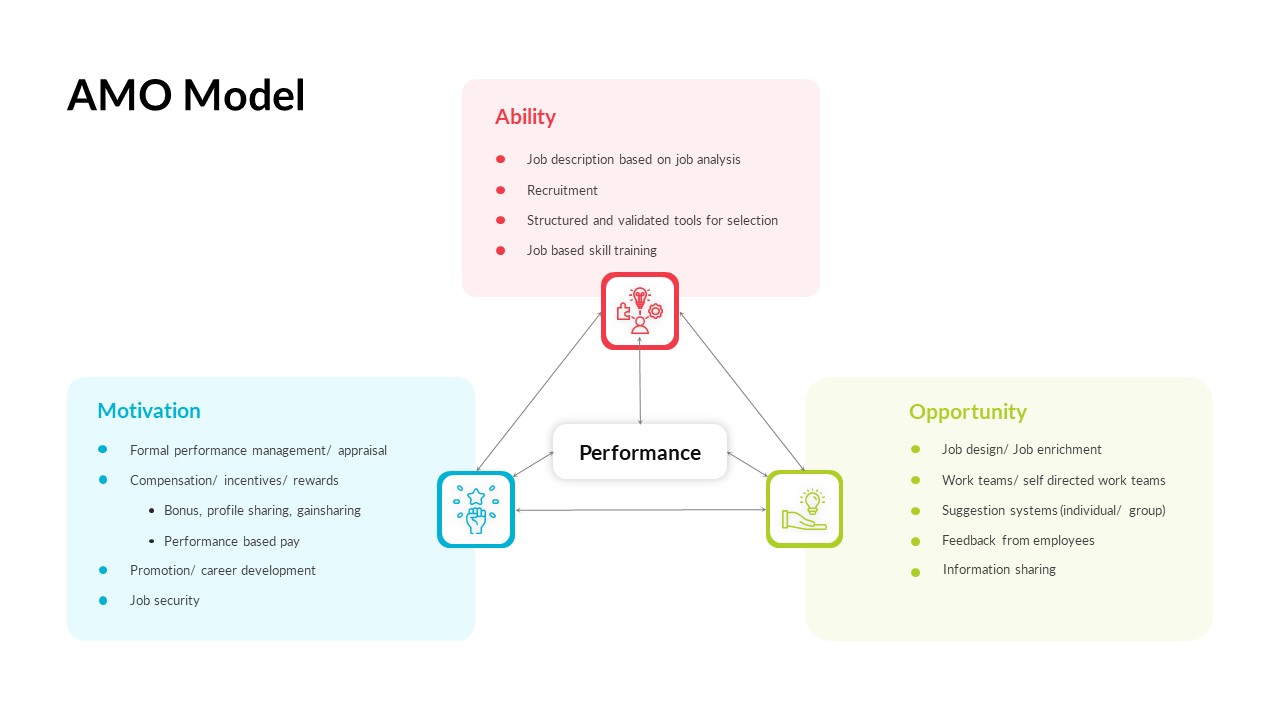
AMO Performance Model Feedback Diagram Template for PowerPoint & Google Slides
Employee Performance
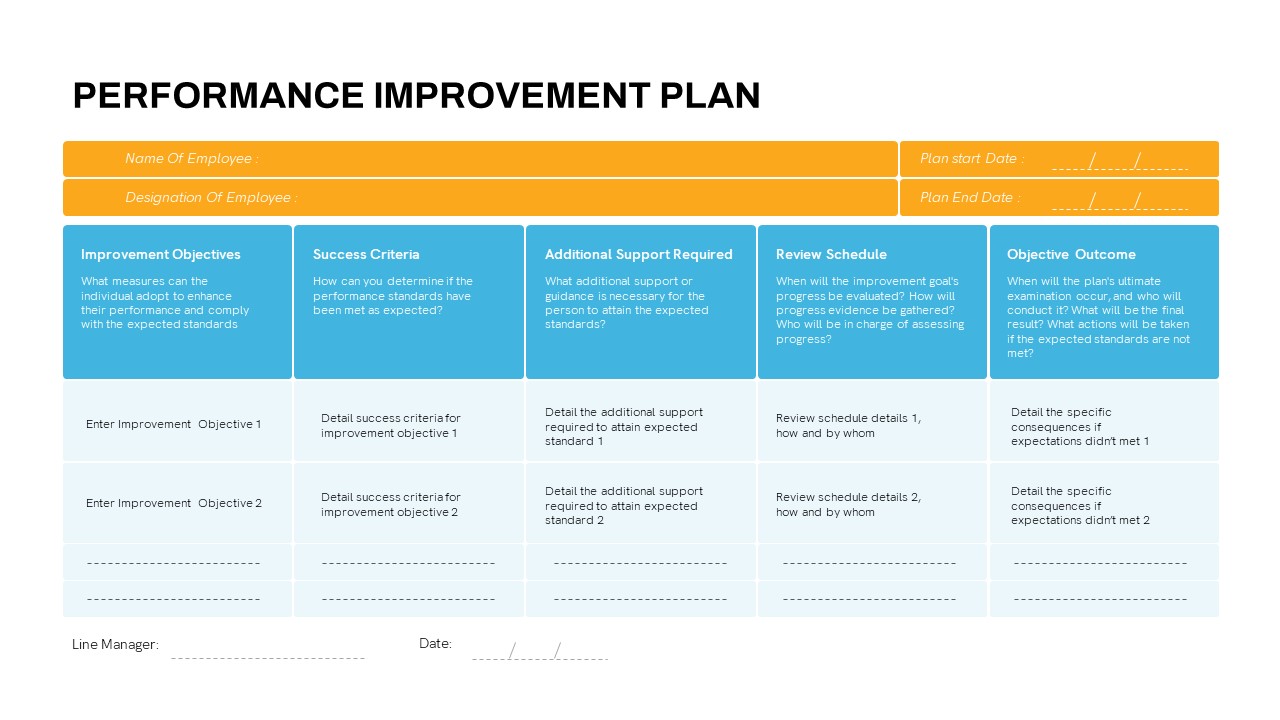
Detailed Performance Improvement Plan Template for PowerPoint & Google Slides
Employee Performance
Performance Appraisal Timeline Diagram Template for PowerPoint & Google Slides
Timeline
DevOps KPI Dashboard Performance Metrics Template for PowerPoint & Google Slides
Software Development
Monthly Sales Performance Dashboard Template for PowerPoint & Google Slides
Charts
Performance Review template for PowerPoint & Google Slides
Employee Performance
High Performance Pyramid Diagram Template for PowerPoint & Google Slides
Pyramid
Performance-driven Culture framework template for PowerPoint & Google Slides
Leadership
Employee Performance Metrics Dashboard Template for PowerPoint & Google Slides
Employee Performance
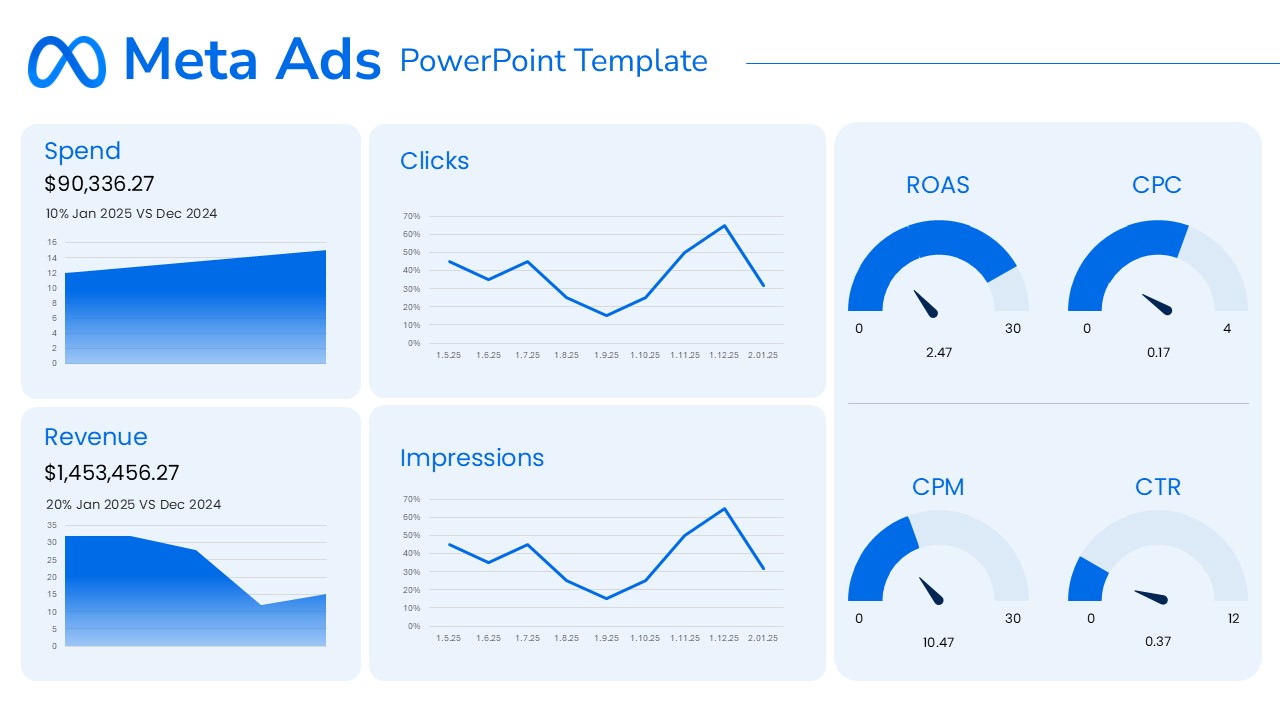
Meta Ads Performance Overview template for PowerPoint & Google Slides
Advertising
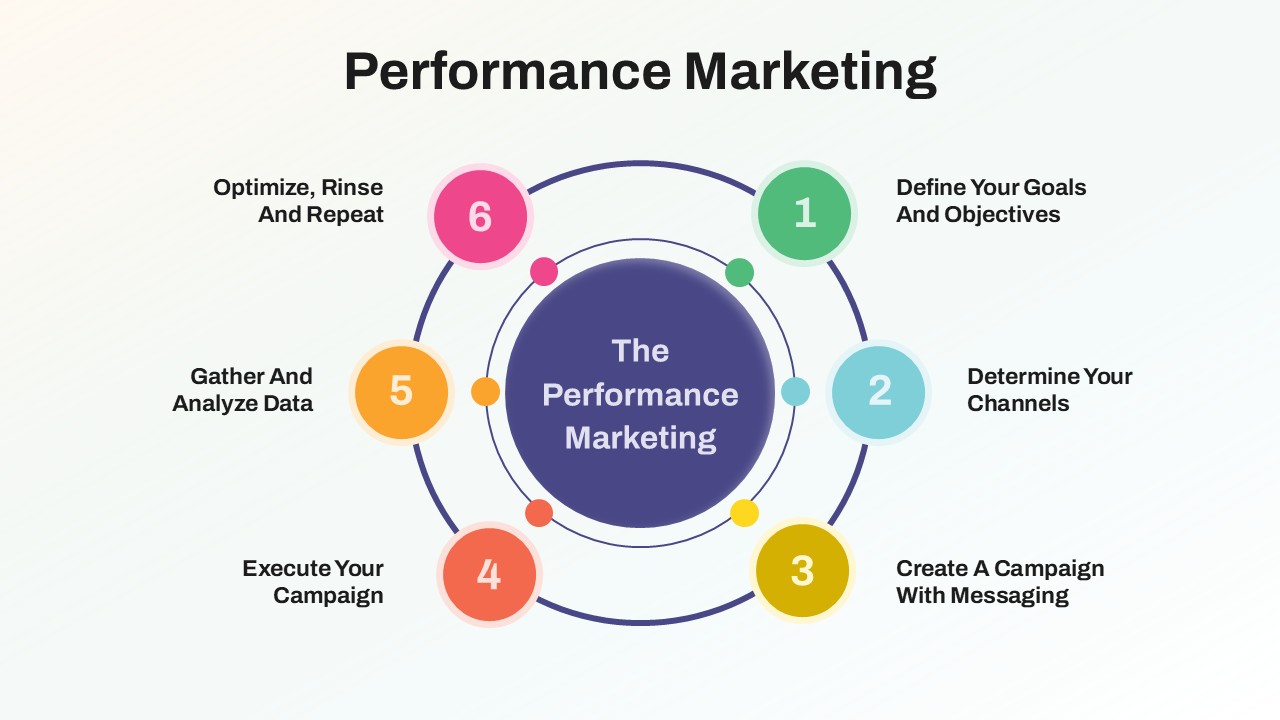
Performance Marketing Strategy template for PowerPoint & Google Slides
Digital Marketing
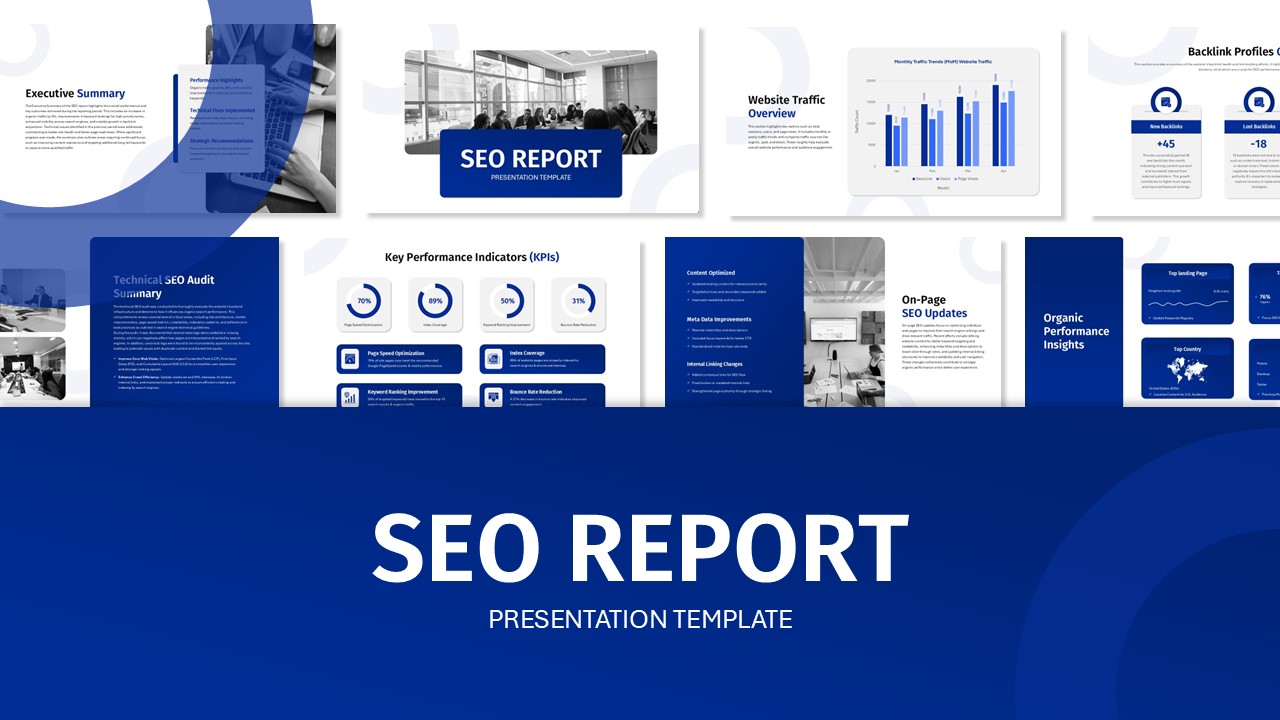
SEO Performance Report Overview template for PowerPoint & Google Slides
Digital Marketing
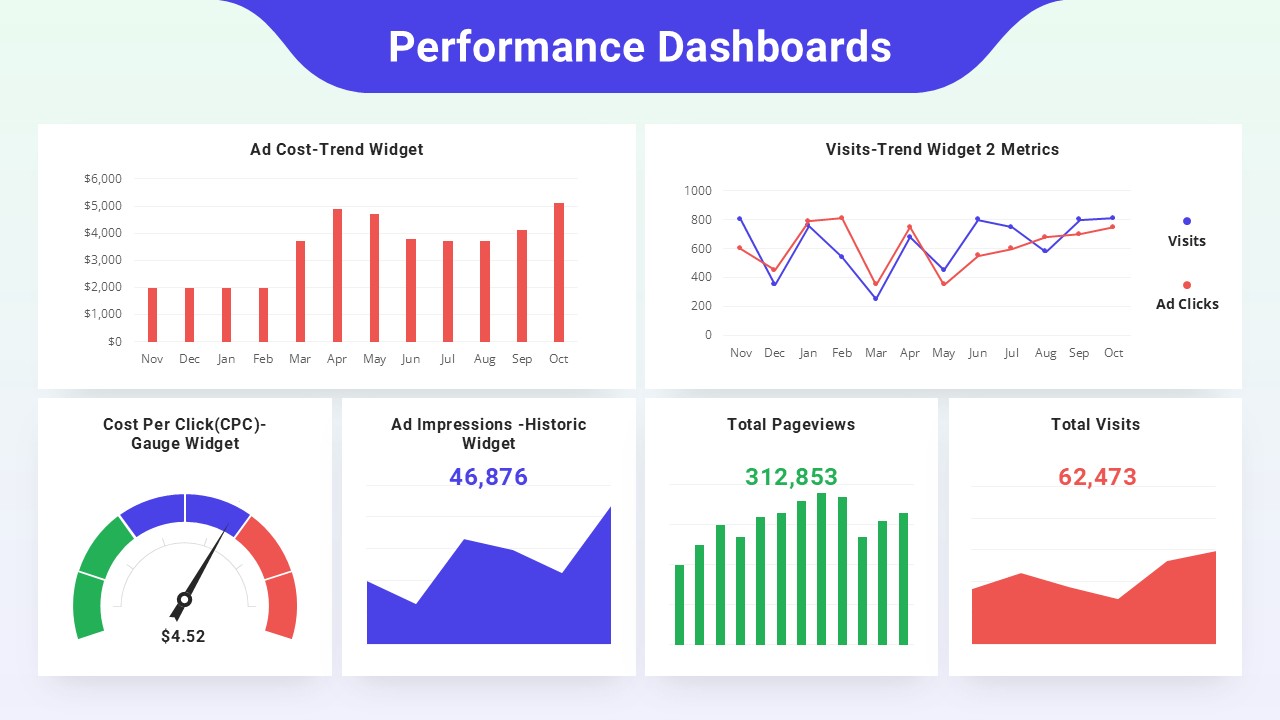
Performance Dashboards Overview Template for PowerPoint & Google Slides
Business Report
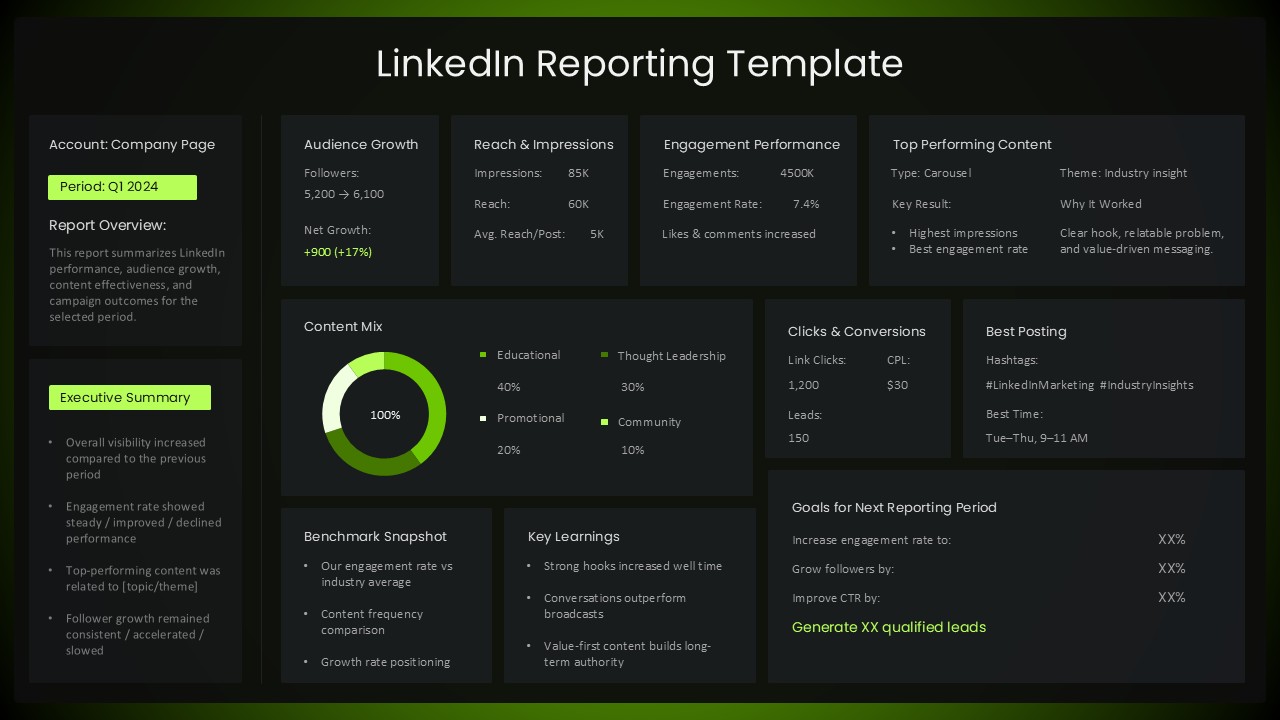
LinkedIn Performance Reporting Dashboard Template for PowerPoint & Google Slides
Digital Marketing
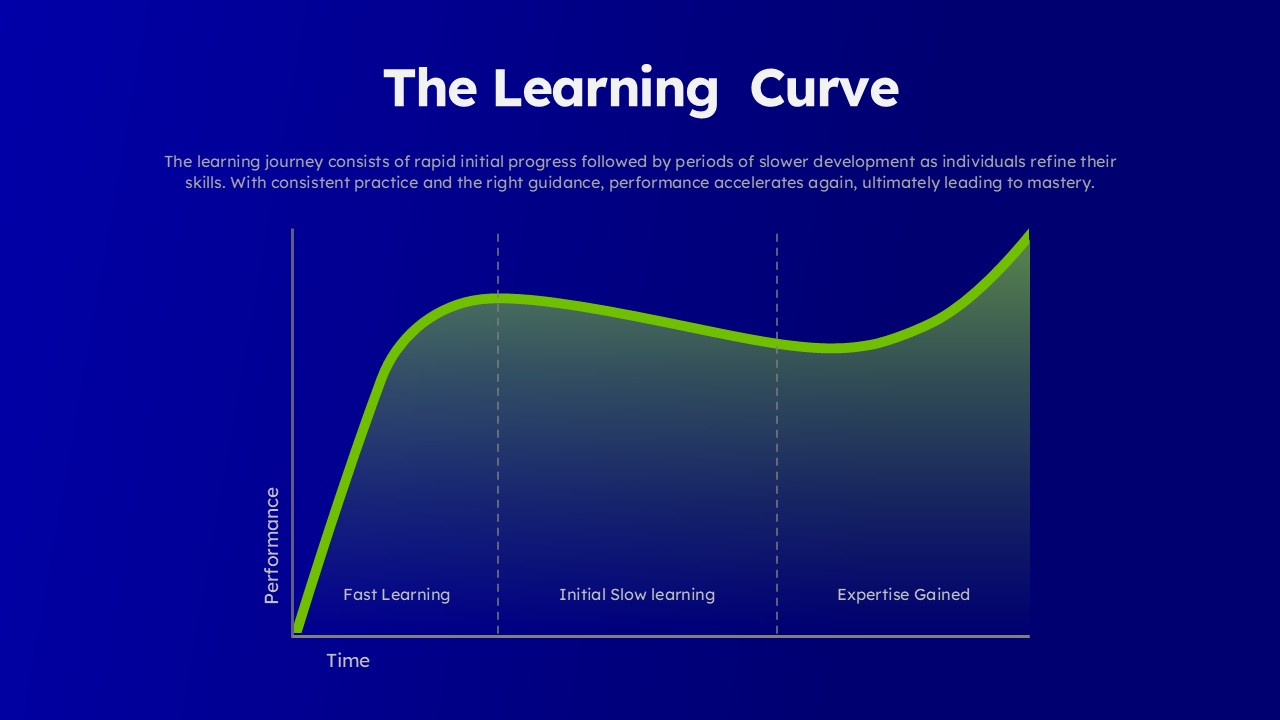
Learning Curve Performance Growth Chart Template for PowerPoint & Google Slides
Employee Performance
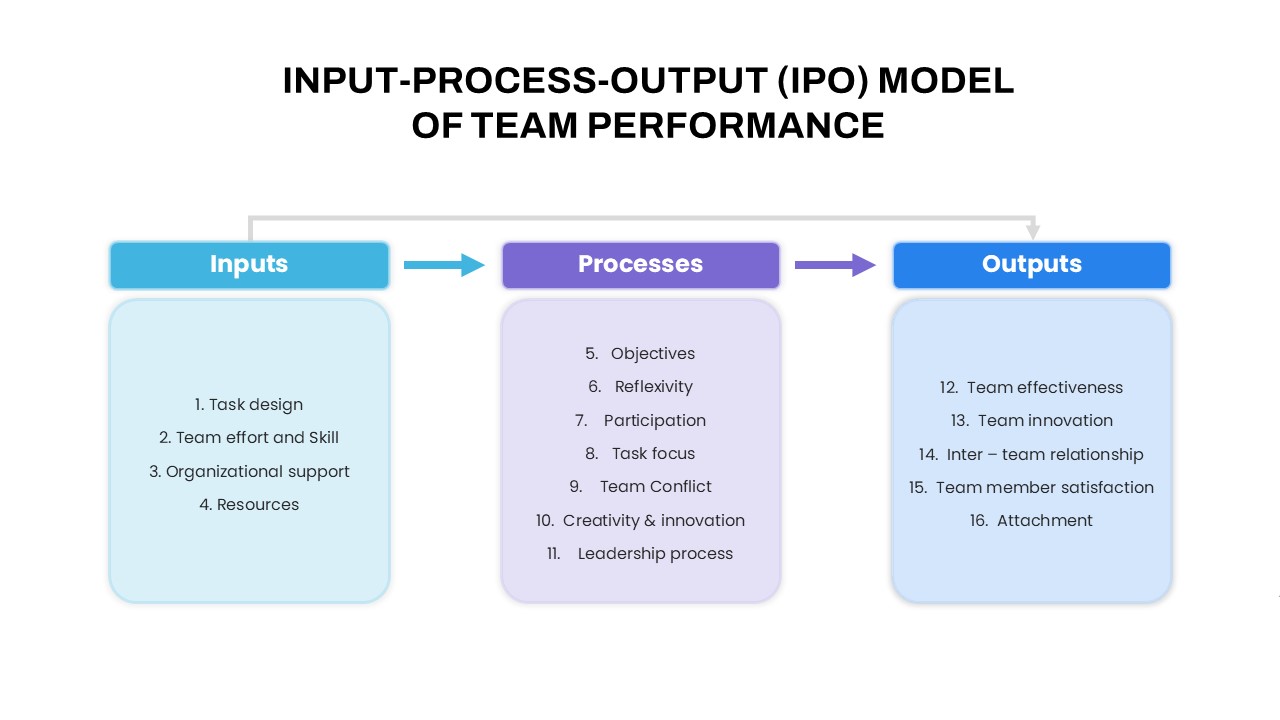
IPO Model of Team Performance for PowerPoint & Google Slides
Process
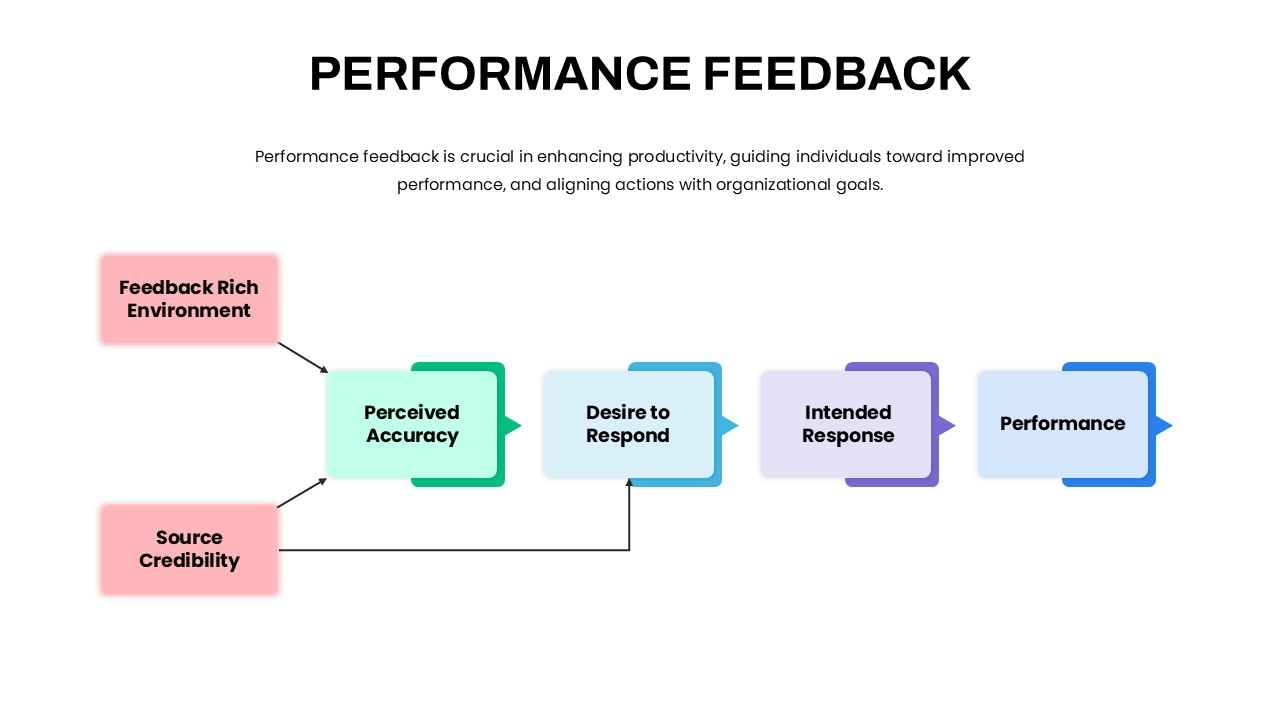
Performance Feedback Model for PowerPoint & Google Slides
Employee Performance
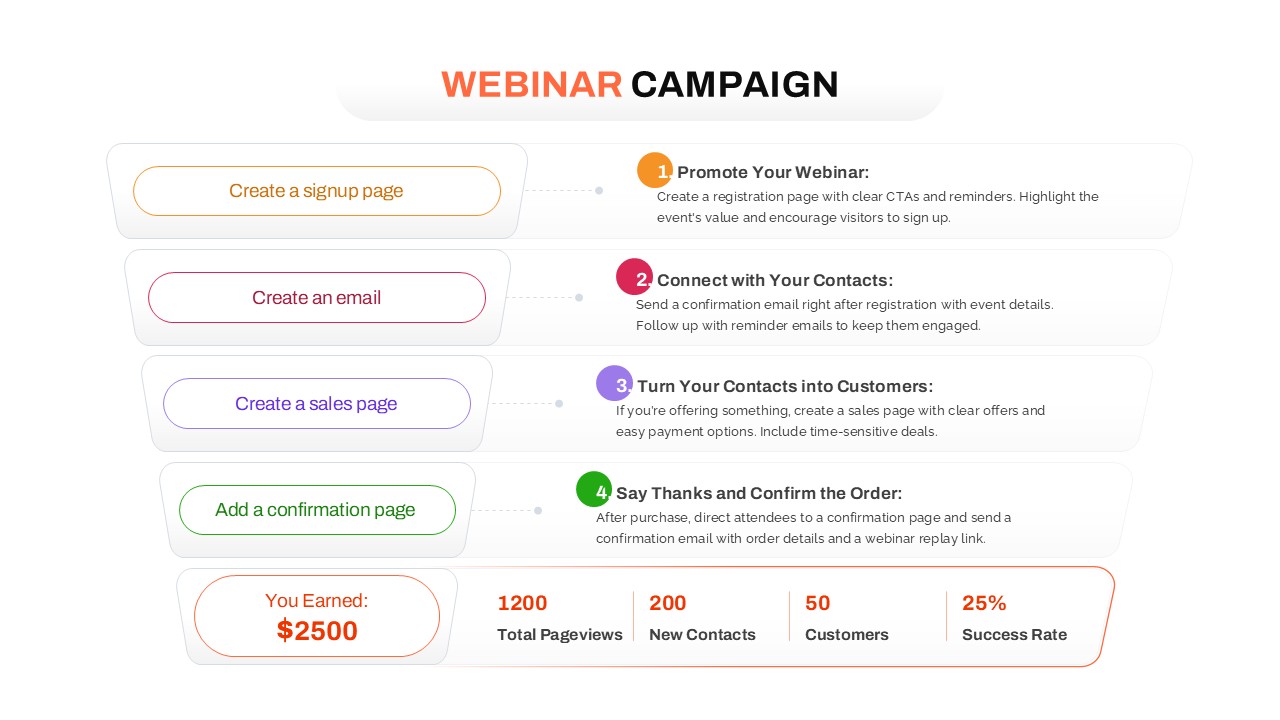
Webinar Campaign Steps and Performance for PowerPoint & Google Slides
Advertising
Free New Year’s Resolution Slides Pack for PowerPoint & Google Slides 2023
Graphics
Free
Three-Year Bar Chart template for PowerPoint & Google Slides
Charts
Multi-Year Timeline Infographic Template for PowerPoint & Google Slides
Timeline
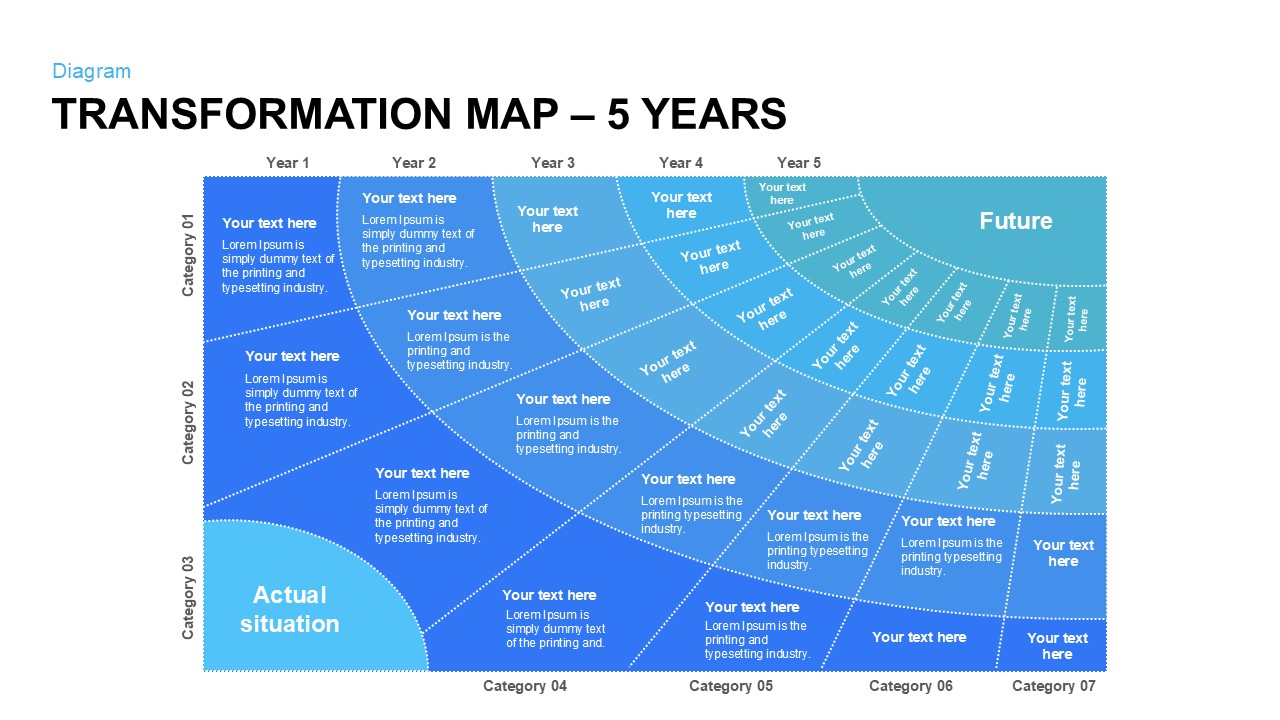
Five-Year Transformation Map Diagram Template for PowerPoint & Google Slides
Process
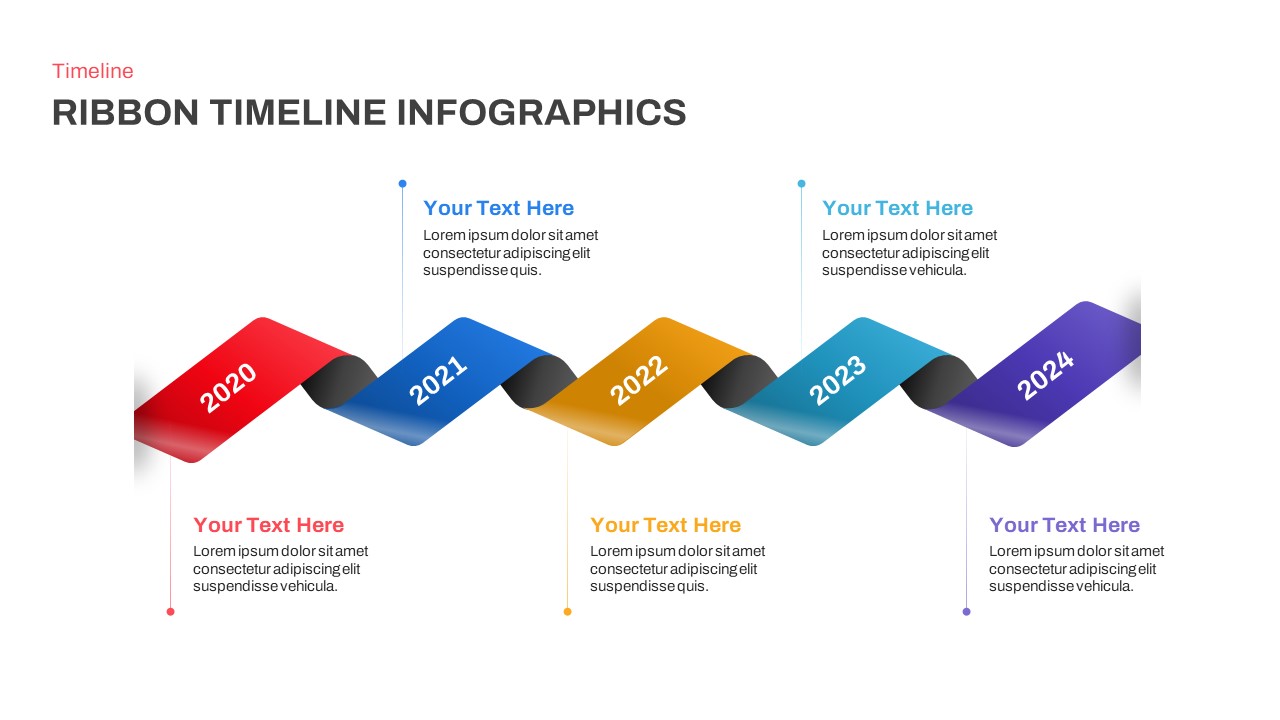
Five-Year Ribbon Timeline Diagram Template for PowerPoint & Google Slides
Timeline
Five-Year Gradient Timeline Infographic Template for PowerPoint & Google Slides
Timeline
Three-Year Strategic Plan Matrix Template for PowerPoint & Google Slides
Timeline
Year-Based Business Plan Zigzag Timeline Template for PowerPoint & Google Slides
Business Plan
Three-Year Plan Infographic Pack Template for PowerPoint & Google Slides
Timeline
Colorful Four-Year Timeline Layout Template for PowerPoint & Google Slides
Timeline
Colorful Five-Year Timeline Layout Template for PowerPoint & Google Slides
Timeline
Free Multi-Year Arrow Timeline Infographic Template for PowerPoint & Google Slides
Timeline
Free
Free Elegant Happy New Year Greeting Slide Template for PowerPoint & Google Slides
Graphics
Free
Minimal Multi-Year Column Chart Template for PowerPoint & Google Slides
Bar/Column
Milestone Timeline with Year Markers Template for PowerPoint & Google Slides
Timeline
Three-Year Vertical Milestone Timeline Template for PowerPoint & Google Slides
Timeline
Three-Year Project Roadmap Timeline Template for PowerPoint & Google Slides
Timeline
5 Year Timeline Template for PowerPoint & Google Slides
Timeline
Five-Year Plan Timeline Diagram Template for PowerPoint & Google Slides
Timeline
Multi-Year S-Shaped Roadmap Timeline Template for PowerPoint & Google Slides
Timeline
Three-Year Plan Timeline Diagram Template for PowerPoint & Google Slides
Timeline
1 Year Plan Overview template for PowerPoint & Google Slides
Business Plan
Personal 5-Year Roadmap Plan Example Template for PowerPoint & Google Slides
Timeline
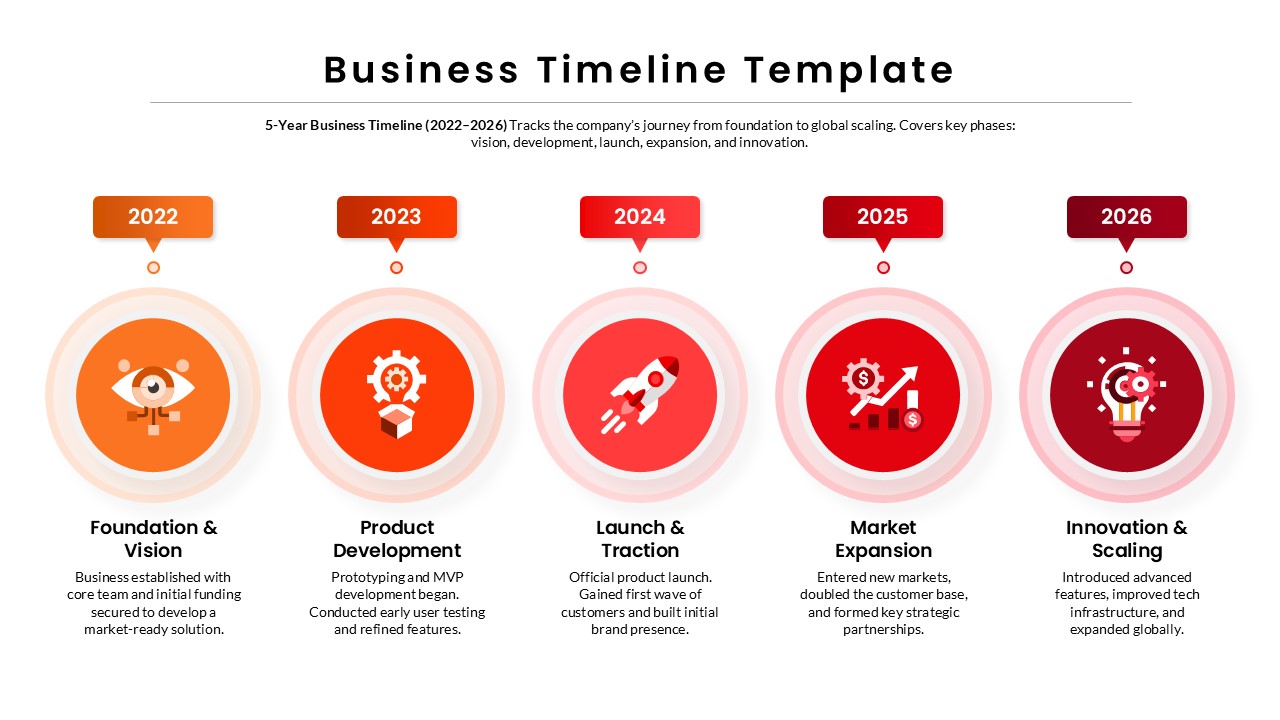
5-Year Business Timeline Template for PowerPoint & Google Slides
Timeline
End of Year Review Dashboard Template for PowerPoint & Google Slides
Business Report
Year in Review KPI Highlights Slide for PowerPoint & Google Slides
Business Report
Half Year Gantt Chart Templat for PowerPoint & Google Slides
Gantt Chart
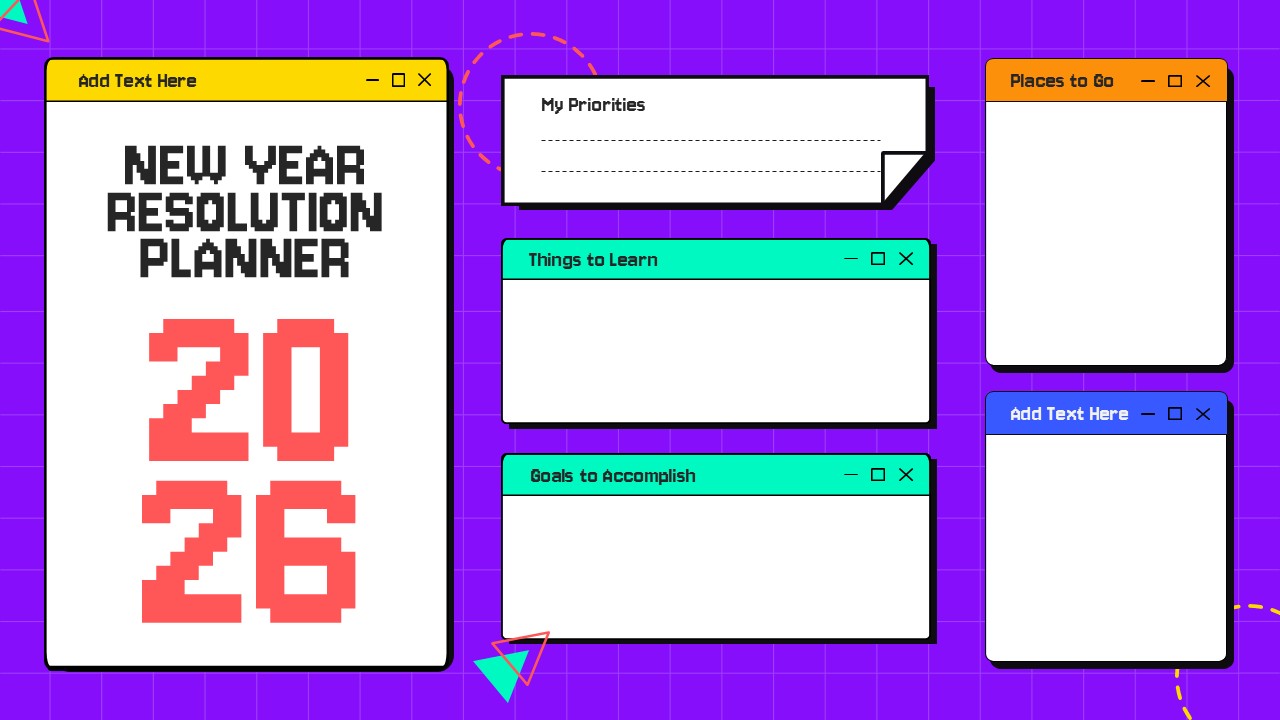
Creative New Year Resolution Planner for PowerPoint & Google Slides
Leadership
Free
Service Zoom Feature Slides Comparison template for PowerPoint & Google Slides
Process
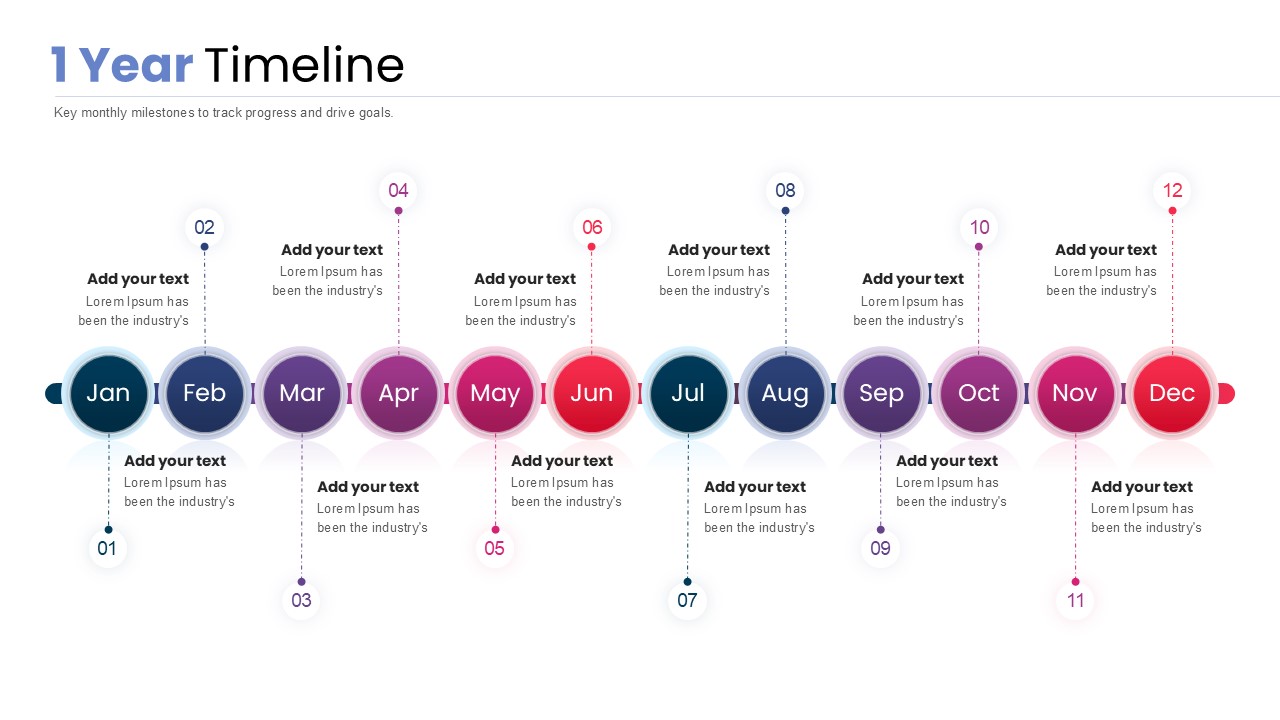
1 Year Timeline PowerPoint Template
Timeline
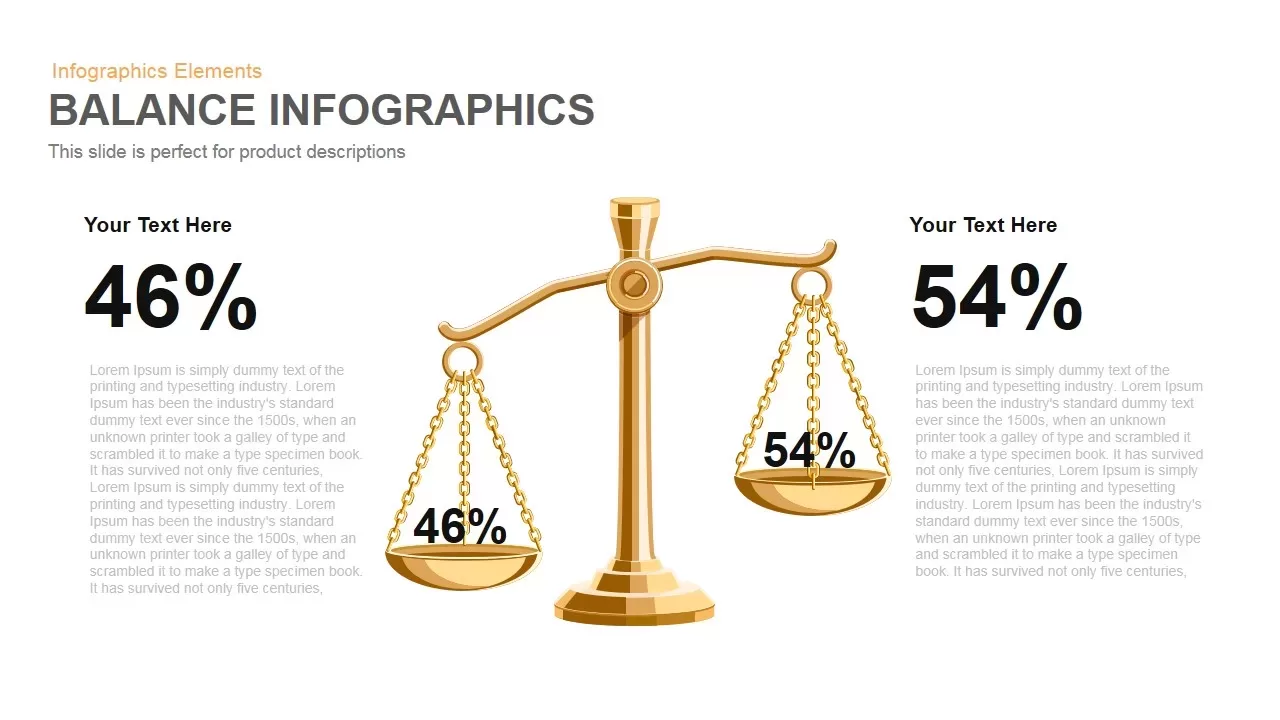
Gold Scales Balance Comparison Template for PowerPoint & Google Slides
Comparison
Four-Tier Pricing Comparison Table Template for PowerPoint & Google Slides
Comparison
Comparison Bar Chart template for PowerPoint & Google Slides
Comparison Chart

A/B Testing Comparison Infographic template for PowerPoint & Google Slides
Comparison
Four-Plan Pricing Table Comparison Template for PowerPoint & Google Slides
Comparison
Gender Comparison People Infographic Template for PowerPoint & Google Slides
Comparison
Interactive Pricing Plan Comparison Template for PowerPoint & Google Slides
Comparison
Six-Metric Green Product Comparison Template for PowerPoint & Google Slides
Comparison
Two-Column Comparison Infographic Slide Template for PowerPoint & Google Slides
Comparison

BMI Category Comparison Chart Template for PowerPoint & Google Slides
Comparison
Isometric 3D Block Comparison Diagram Template for PowerPoint & Google Slides
Comparison
Circular Product Comparison Chart Template for PowerPoint & Google Slides
Comparison Chart
Competitive Landscape Comparison Template Pack for PowerPoint & Google Slides
Comparison
Before and After Comparison Infographic Template for PowerPoint & Google Slides
Comparison
Free
Challenges and Solutions Comparison Template for PowerPoint & Google Slides
Opportunities Challenges
Cost Benefit Analysis Comparison Template for PowerPoint & Google Slides
Comparison
Risk Heatmap Comparison Template for PowerPoint & Google Slides
Maps
Heatmap Comparison Template for PowerPoint & Google Slides
Maps
Free Global Warming Infographic Comparison Template for PowerPoint & Google Slides
Comparison Chart
Free
Dynamic Bar-of-Pie Chart Comparison Template for PowerPoint & Google Slides
Pie/Donut
Types of AI Comparison Infographic Template for PowerPoint & Google Slides
AI
Three-Category Comparison Template for PowerPoint & Google Slides
Comparison
Profile Comparison Chart template for PowerPoint & Google Slides
Comparison Chart
Integrative Thinking Comparison Diagram Template for PowerPoint & Google Slides
Comparison
Market Share Comparison Diagram Template for PowerPoint & Google Slides
Comparison Chart
Sales Growth Comparison Chart & Table Template for PowerPoint & Google Slides
Bar/Column
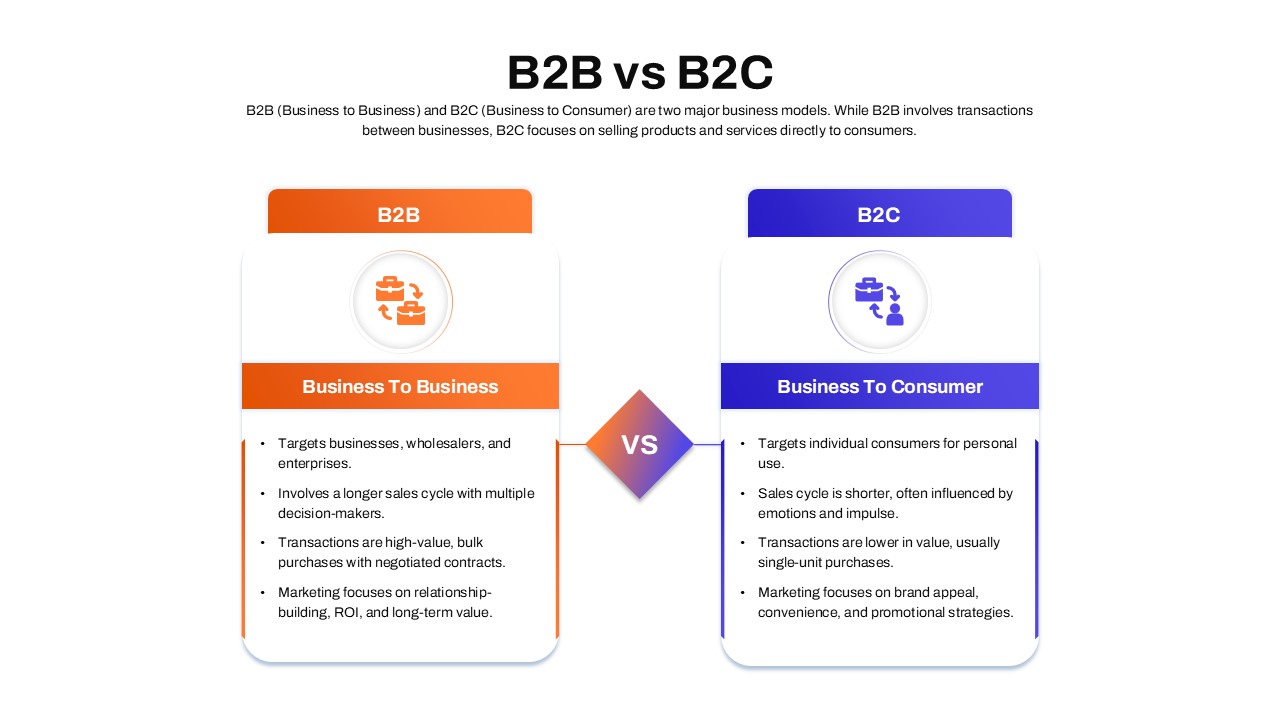
B2B vs B2C Comparison template for PowerPoint & Google Slides
Business Models
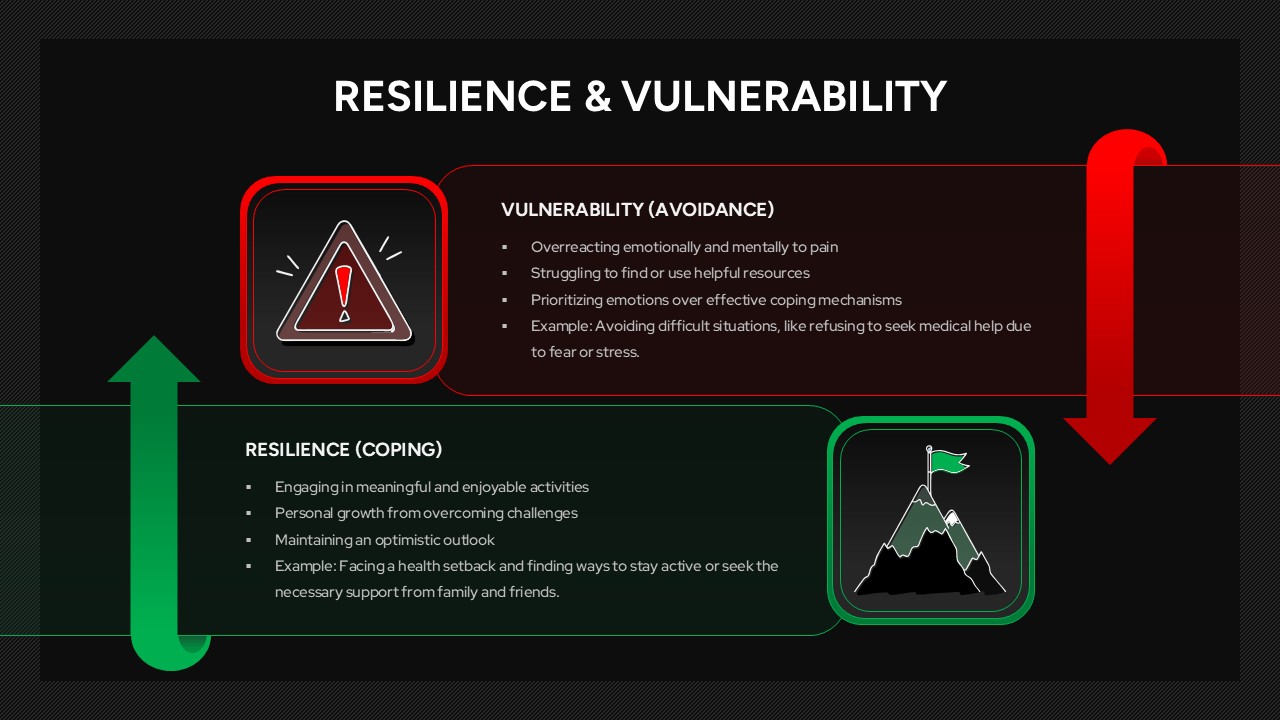
Resilience & Vulnerability Comparison Template for PowerPoint & Google Slides
Comparison
Skills Gap Analysis Comparison Chart Template for PowerPoint & Google Slides
Gap
Attribution Models Comparison Diagram Template for PowerPoint & Google Slides
Comparison
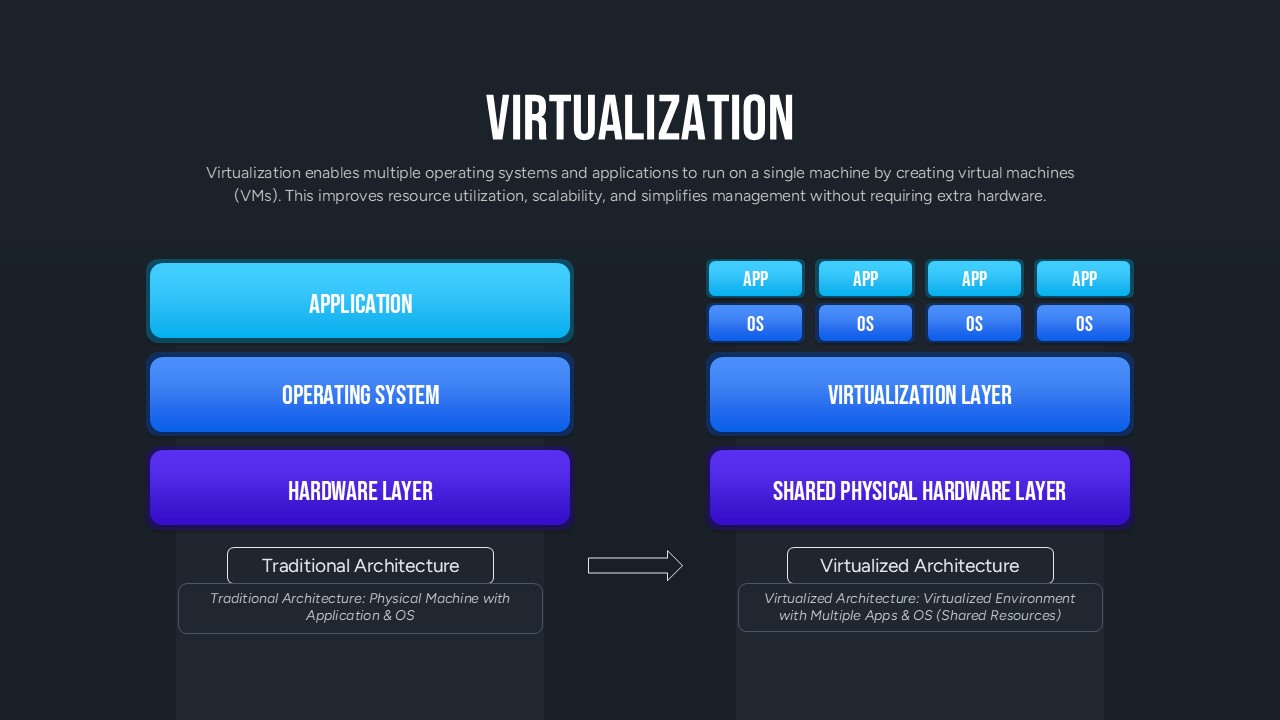
Virtualization Architecture Comparison Template for PowerPoint & Google Slides
Comparison Chart
Pros and Cons Comparison Table Template for PowerPoint & Google Slides
Comparison Chart