Modern World Map Callout Infographic Template for PowerPoint & Google Slides


Description
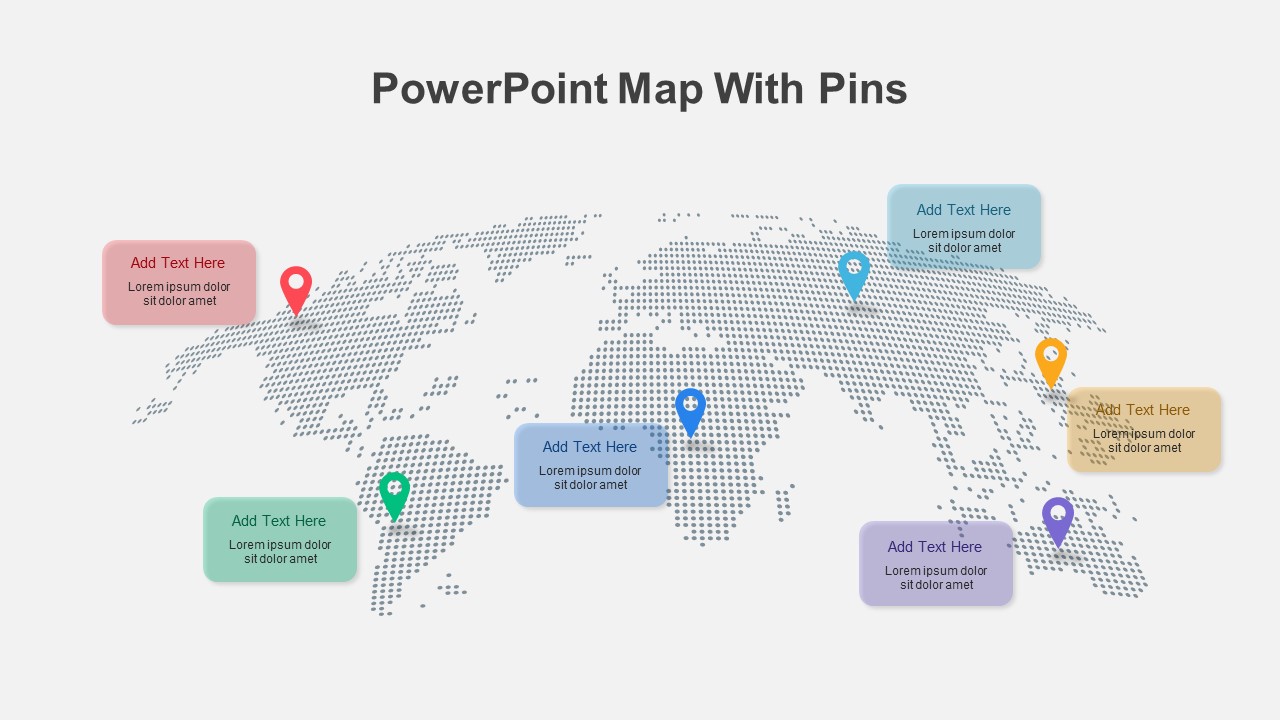
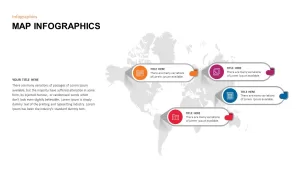
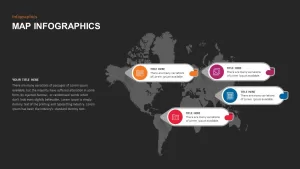
Leverage this modern map infographic slide to illustrate global data points, strategies, or regional highlights with clarity and visual impact. A subtle grayscale world map provides context for four distinct callout markers—each rendered as a sleek, rounded rectangle paired with a vibrant circular icon in orange, magenta, blue, or red. Each callout features a headline placeholder and supporting text, enabling precise annotation of geographic insights, milestones, or regional statistics. The clean typography, subtle drop shadows, and consistent iconography deliver a polished aesthetic that aligns with contemporary corporate or creative branding.
Designed for effortless customization, this template uses master slides and editable SVG icons so you can reposition markers, swap colors, or update text labels in seconds. Whether you’re showcasing market expansions, tracking supply chain nodes, or mapping customer segments, this fully scalable asset maintains clarity across devices and resolutions. Optimized for both PowerPoint and Google Slides, it eliminates formatting headaches and ensures seamless collaboration and version control.
Beyond regional mapping, this versatile slide adapts to competitor benchmark locations, project rollout timelines, or global customer journey maps. Replicate and reposition callouts to highlight up to four key data points, annotate supply chain stages, or illustrate assembly plant networks. The intuitive layout and color-coded icons enable quick scanning and audience engagement, making it ideal for executive briefings, board presentations, or cross-functional workshops.
Whether you’re presenting sales territories, highlighting expansion markets, or visualizing global supply chain distribution, this map callout infographic streamlines audience comprehension and supports data-driven storytelling. Easily modify the map region fidelity, switch to continent view, or adjust the color palette to match your brand guidelines.
Who is it for
Sales managers, marketing directors, supply chain analysts, consultants, and business strategists will benefit from this map callout infographic when presenting global data, location-based insights, or expansion plans. Project managers, data analysts, and academic researchers can also use it to illustrate geographic distributions and comparative metrics across regions.
Other Uses
Repurpose this slide for educational geography lessons, NGO impact reporting, travel itineraries, or interactive workshops. Use the callouts to display tourism hotspots, demographic statistics, risk assessment zones, or network nodes in IT infrastructure diagrams.
Login to download this file

Item ID
SB01713
Related Templates

Editable World Map Callout Infographic Template for PowerPoint & Google Slides
World Maps
Editable World Map Callout Infographic Template for PowerPoint & Google Slides
World Maps

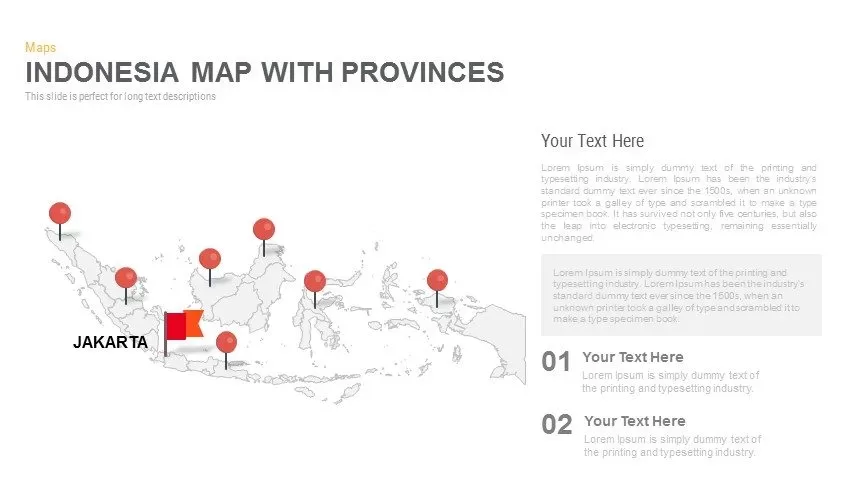
Indonesia Province Map Callout Slide Template for PowerPoint & Google Slides
Maps
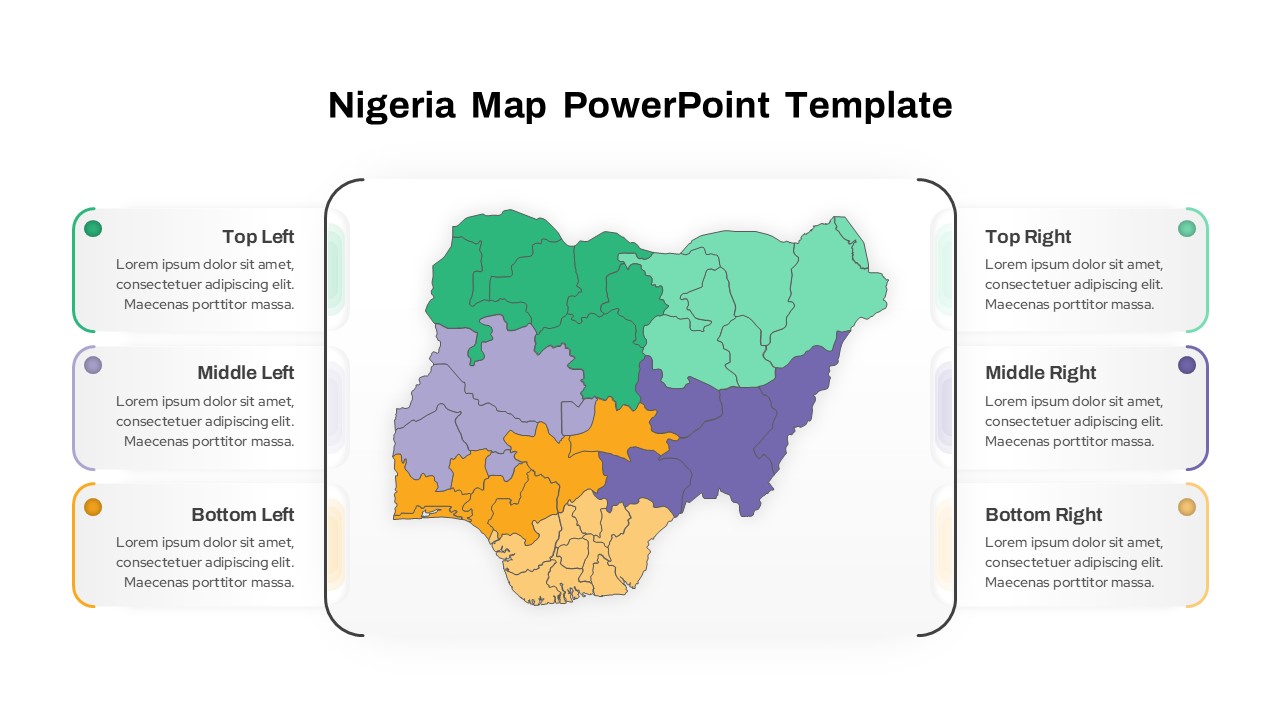
Nigeria Regional Callout Map Diagram Template for PowerPoint & Google Slides
Maps
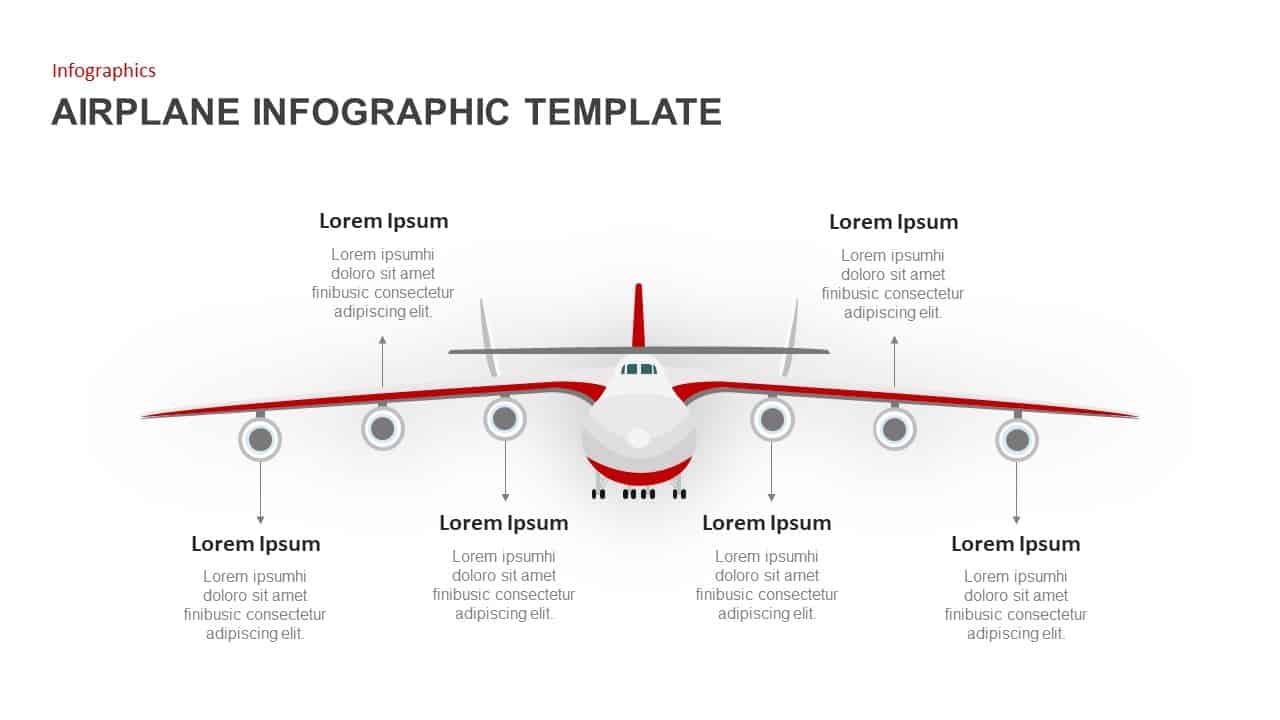
Airplane Front View Callout Infographic Template for PowerPoint & Google Slides
Comparison
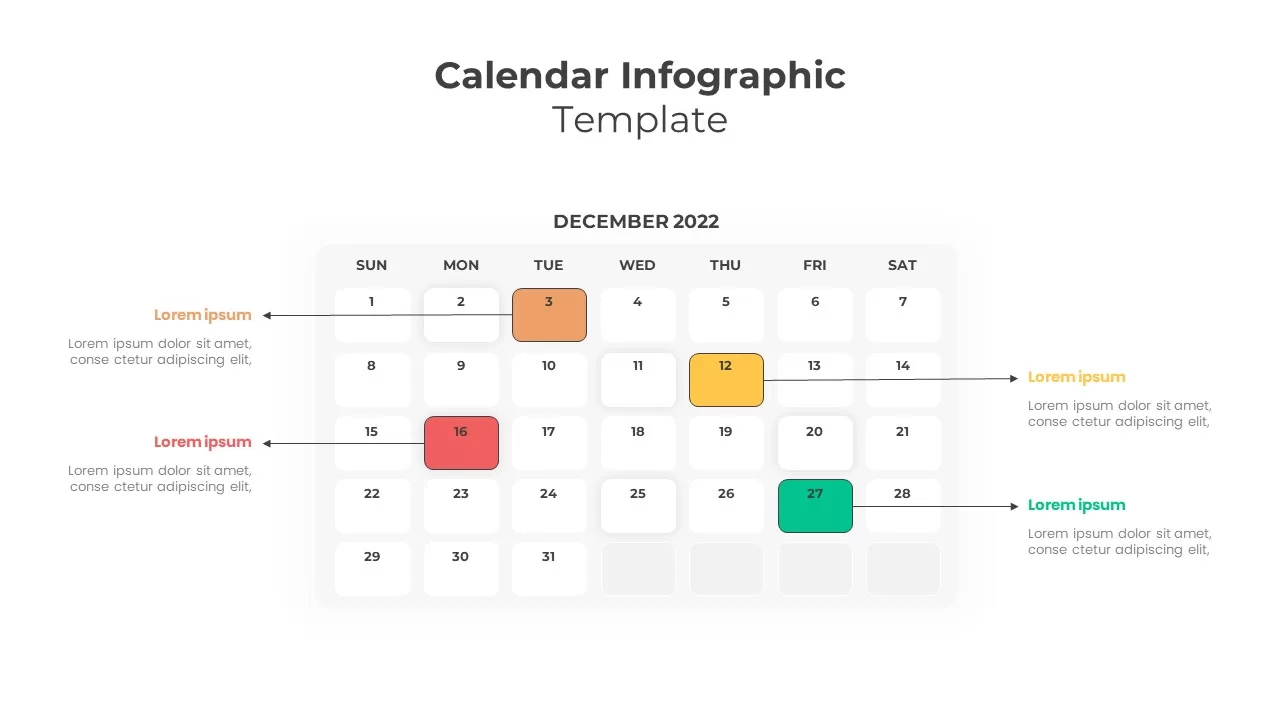
Colorful Callout Calendar Infographic Template for PowerPoint & Google Slides
Infographics
Free Callout Boxes PowerPoint Shapes for PowerPoint & Google Slides
Infographics
Free
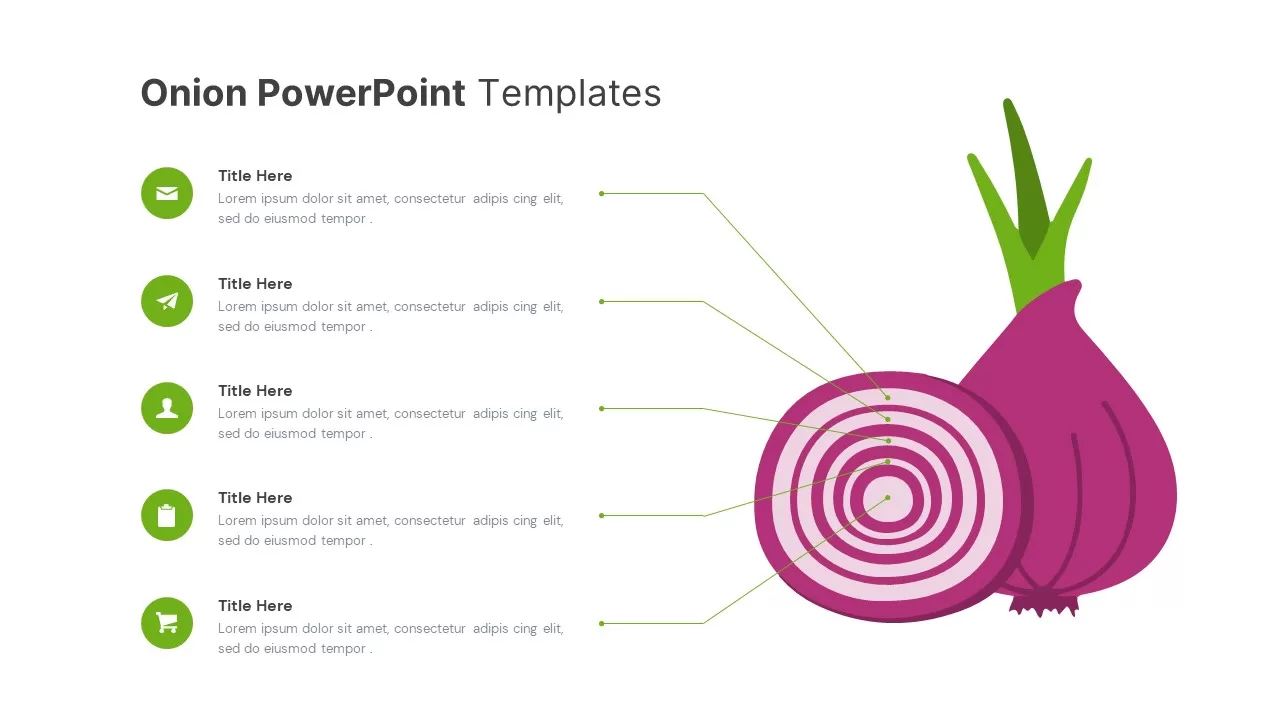
Onion Diagram Callout Template for PowerPoint & Google Slides
Process
Fully Editable World Map Infographic Template for PowerPoint & Google Slides
World Maps
World Map Data template for PowerPoint & Google Slides
World Maps
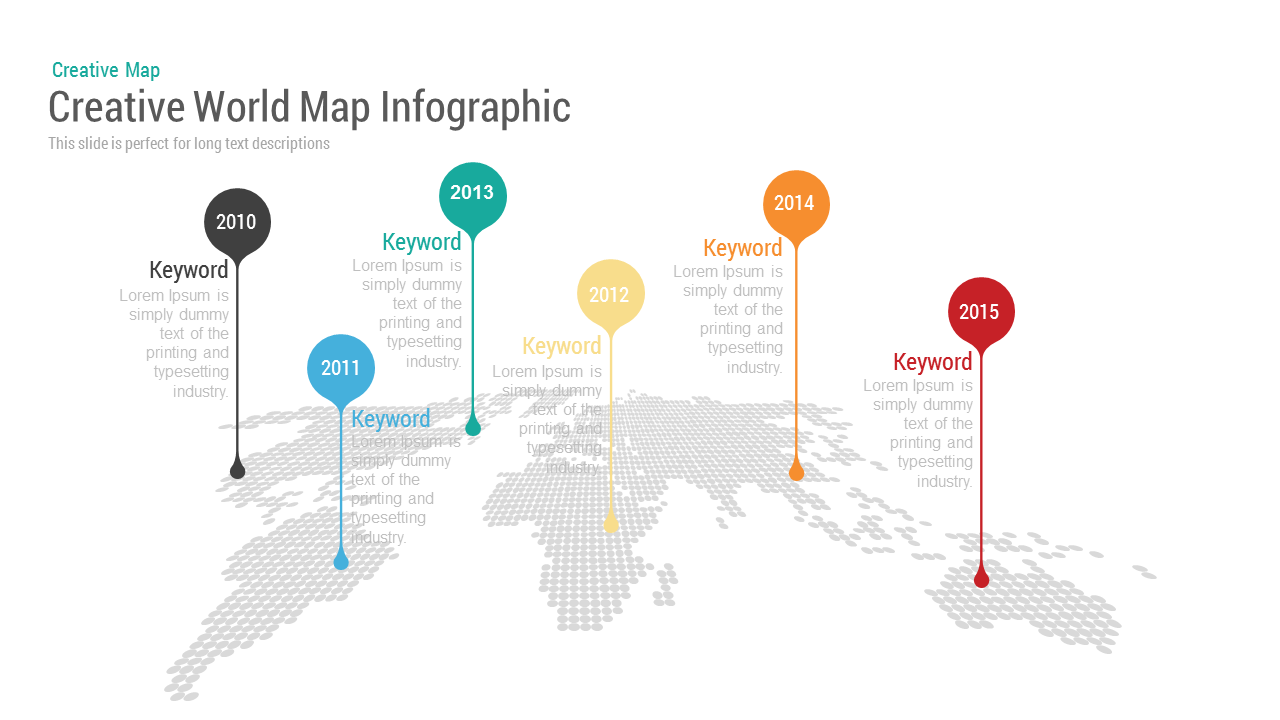
Creative World Map template for PowerPoint & Google Slides
World Maps
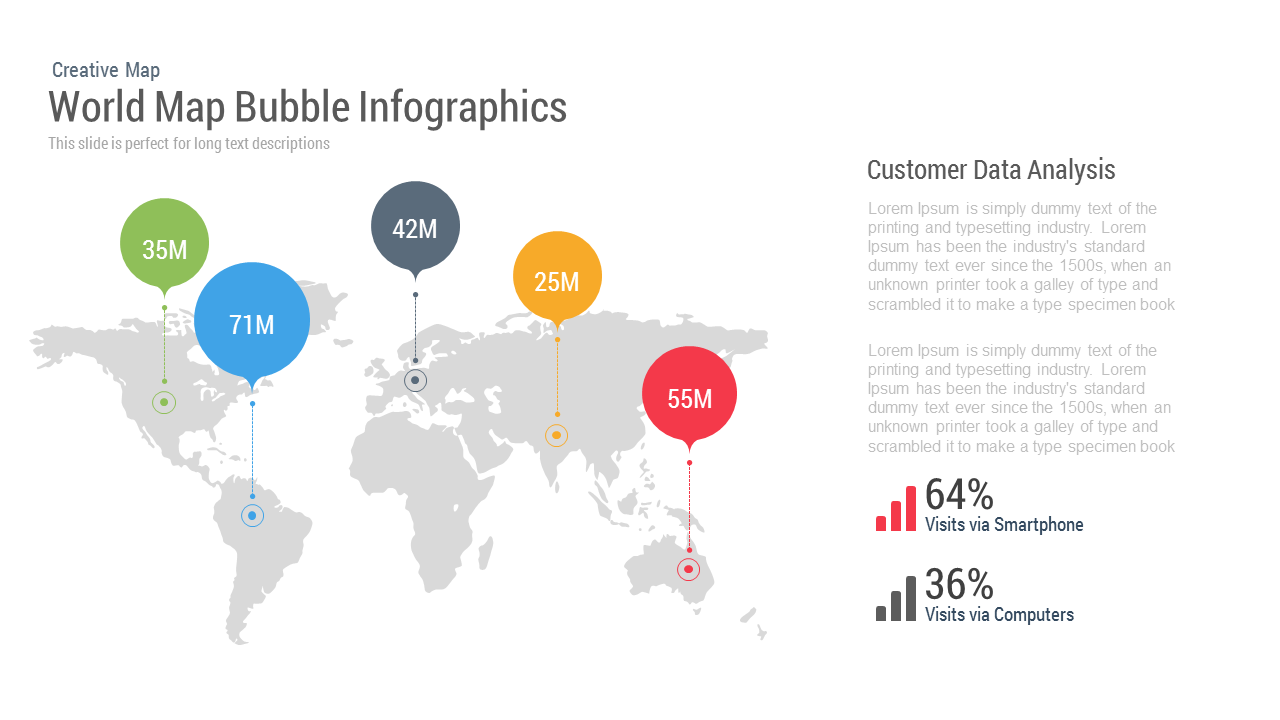
World Map Bubble template for PowerPoint & Google Slides
World Maps
World Map Without Names Template for PowerPoint & Google Slides
World Maps
Colorful World Map with Location Pins Template for PowerPoint & Google Slides
World Maps
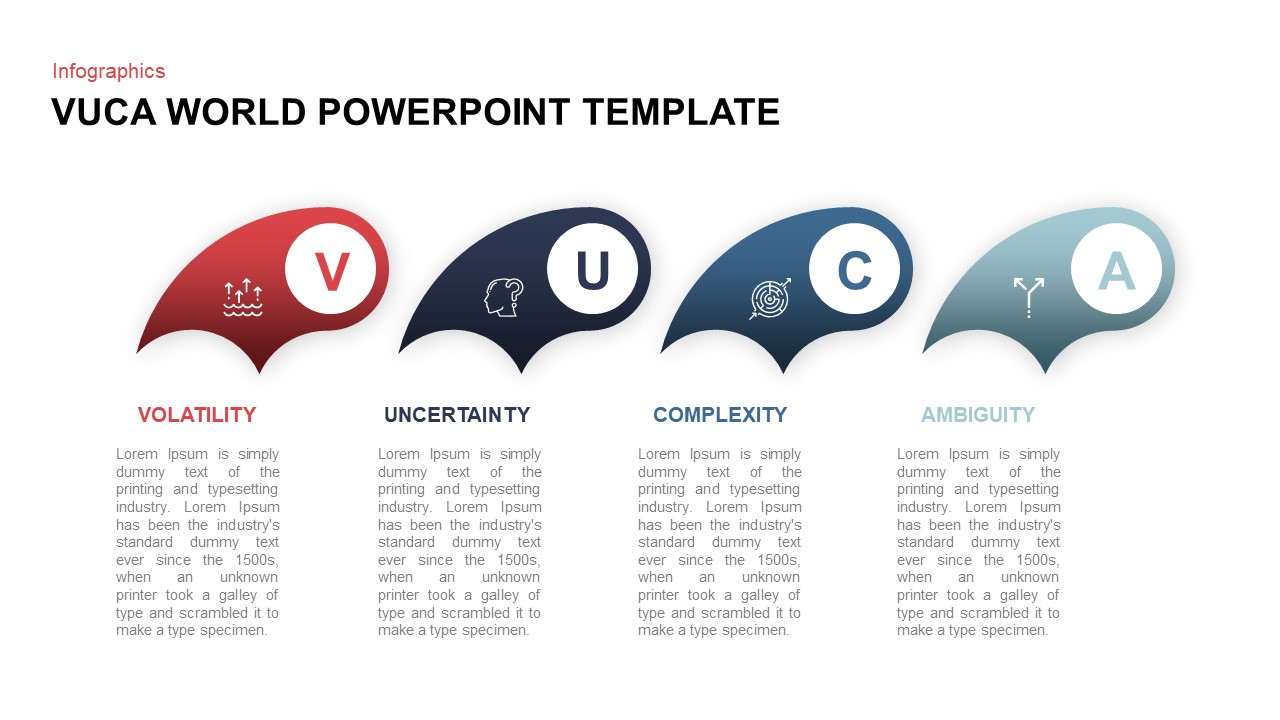
VUCA World Infographic Presentation Template for PowerPoint & Google Slides
Pitch Deck
Modern Custom Eight-Branch Mind Map Template for PowerPoint & Google Slides
Mind Maps
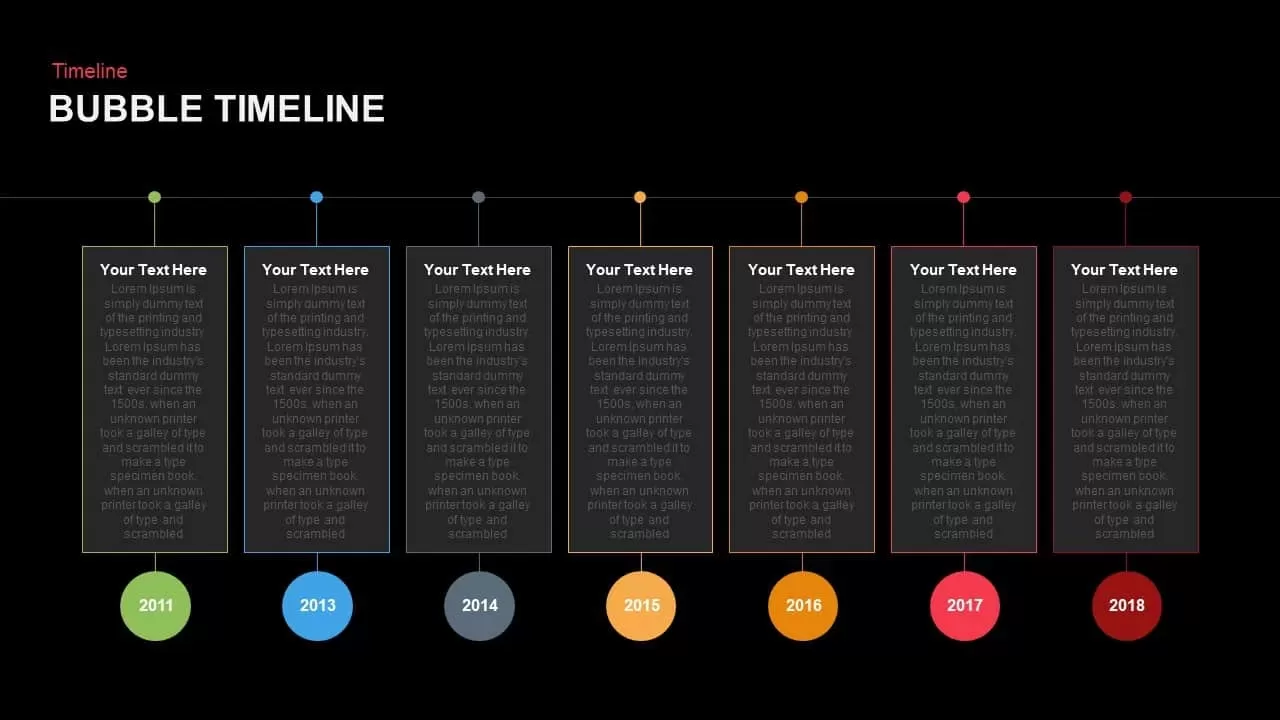
Modern Bubble Timeline Infographic Template for PowerPoint & Google Slides
Timeline
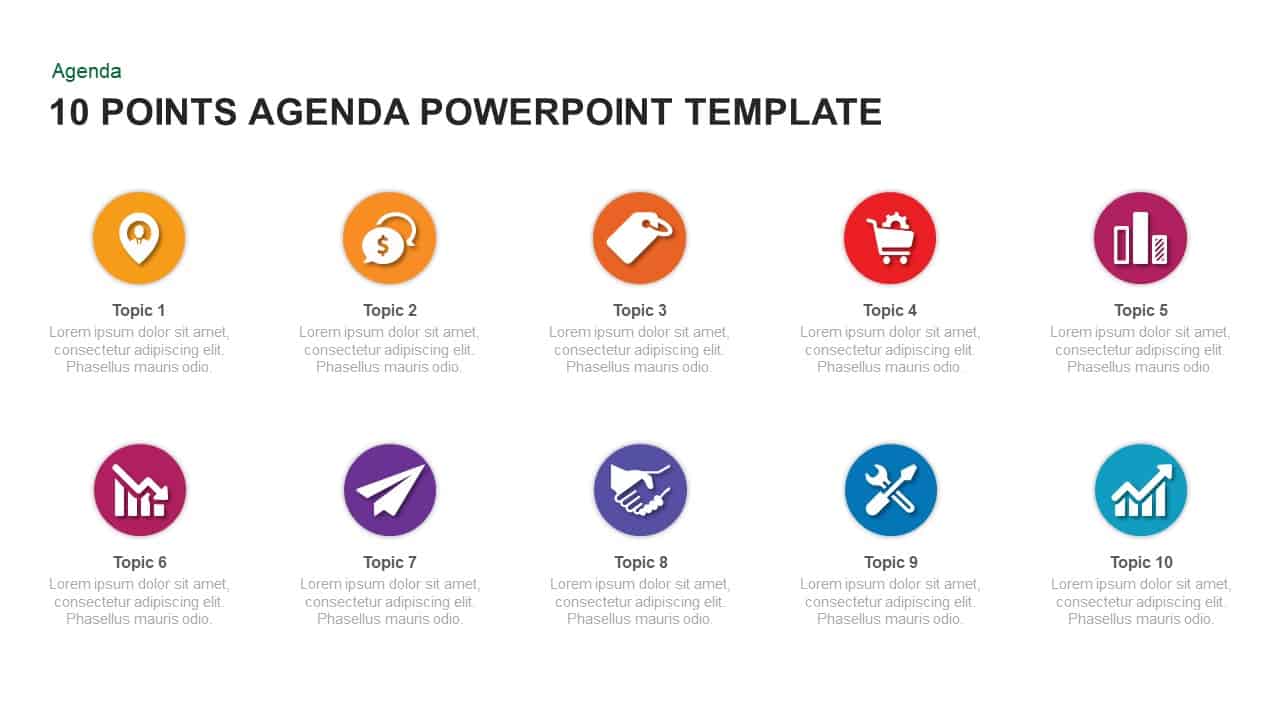
Modern 10-Point Agenda Infographic Template for PowerPoint & Google Slides
Agenda
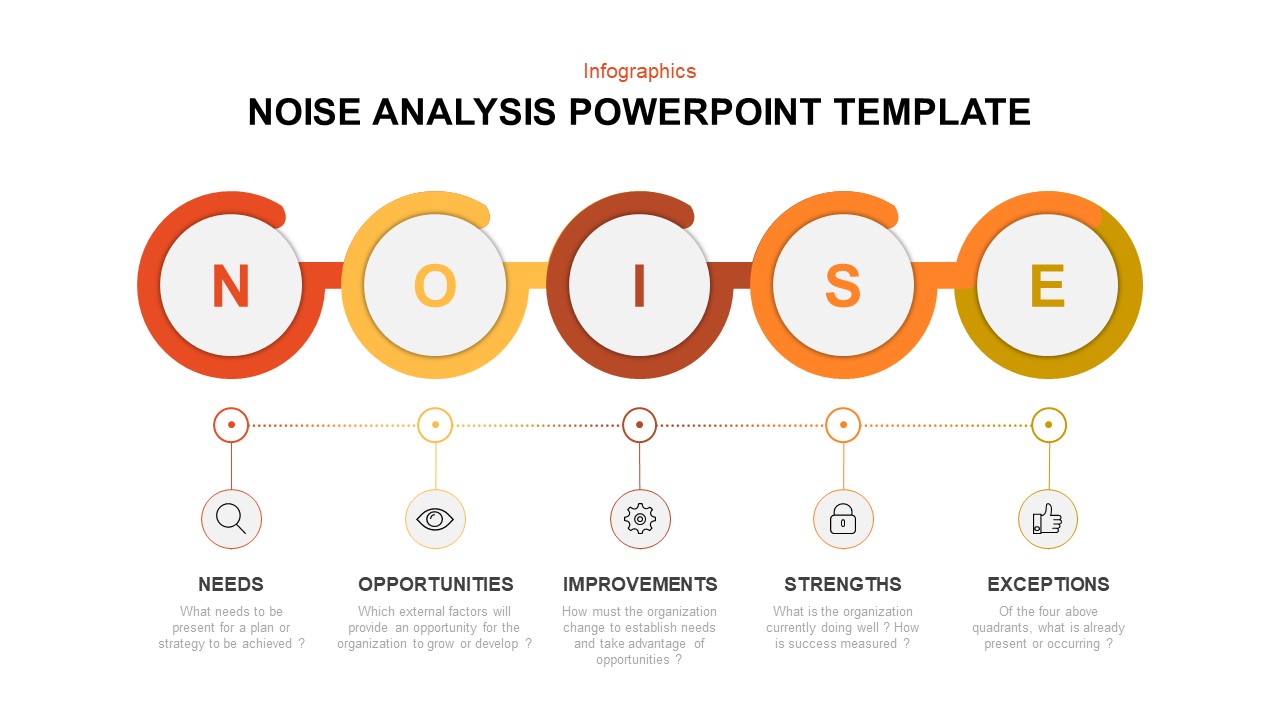
Modern Noise Analysis Infographic Template for PowerPoint & Google Slides
Process
Modern Gear Venn Diagram Infographic Template for PowerPoint & Google Slides
Comparison

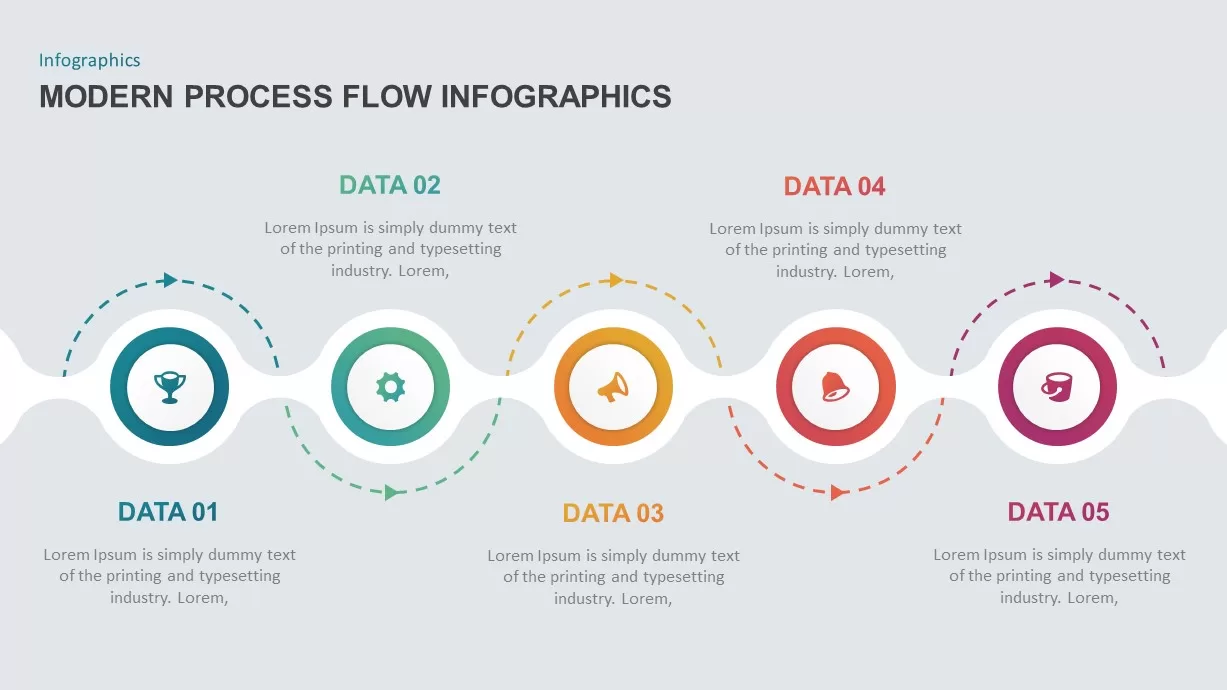
Modern 5-Step Process Flow Infographic Template for PowerPoint & Google Slides
Process
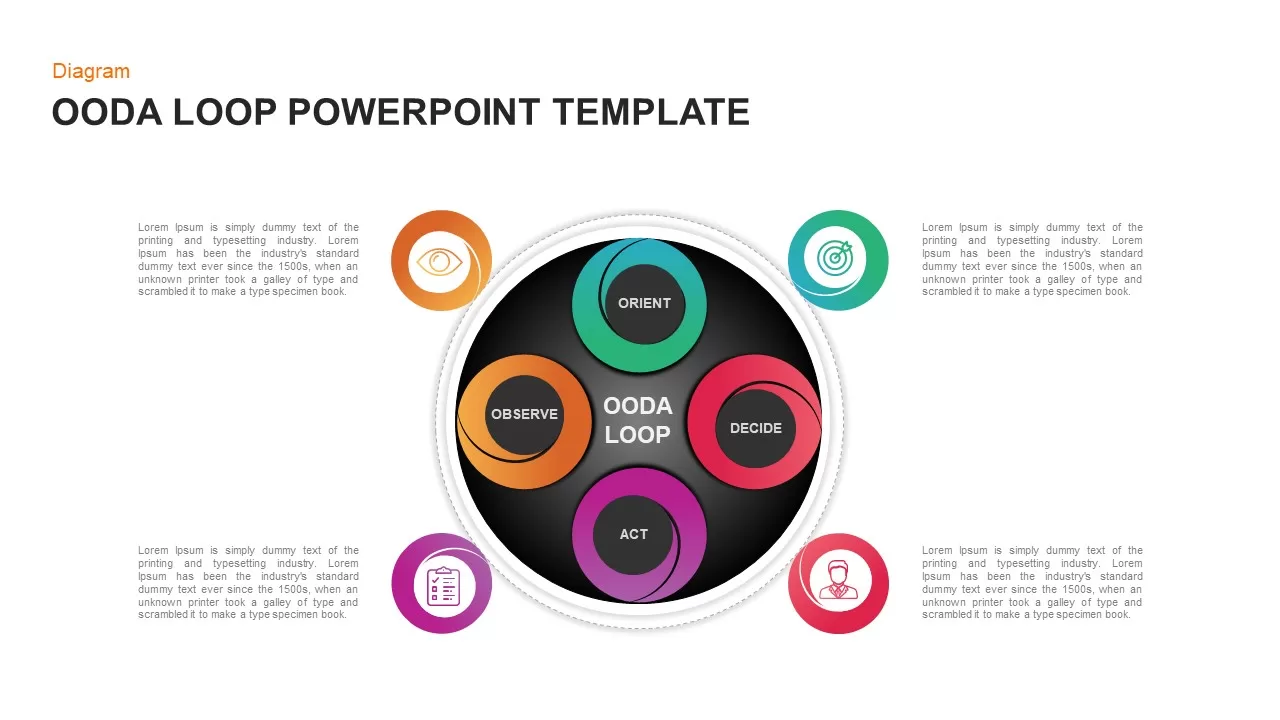
Modern Circular OODA Loop Infographic Template for PowerPoint & Google Slides
Circular
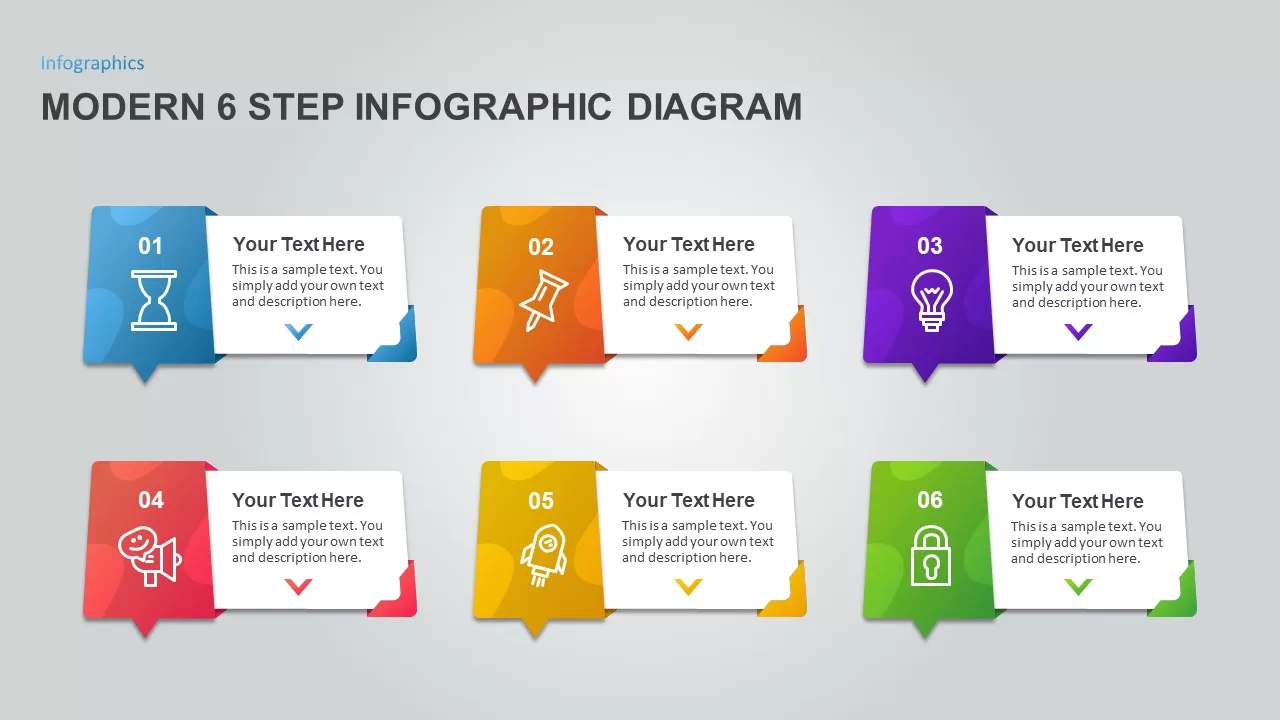
Modern 6 Step Infographic Diagram template for PowerPoint & Google Slides
Process
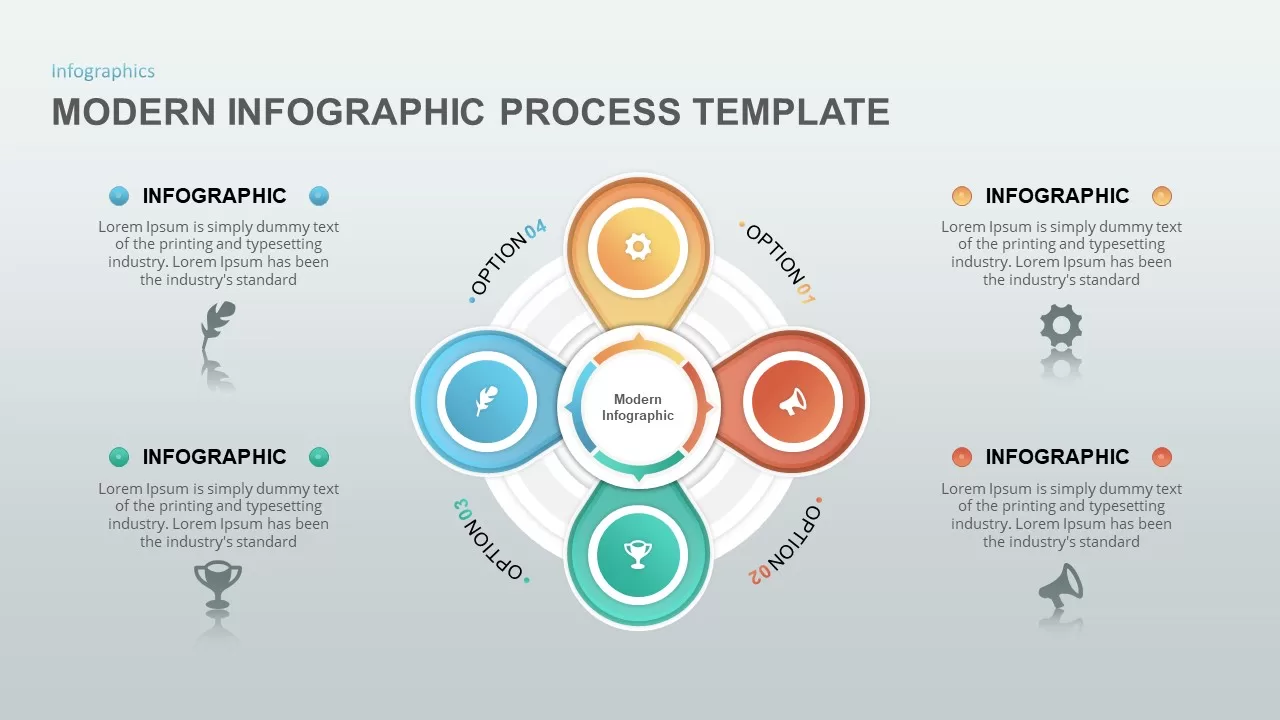
Modern Infographic Process template for PowerPoint & Google Slides
Infographics
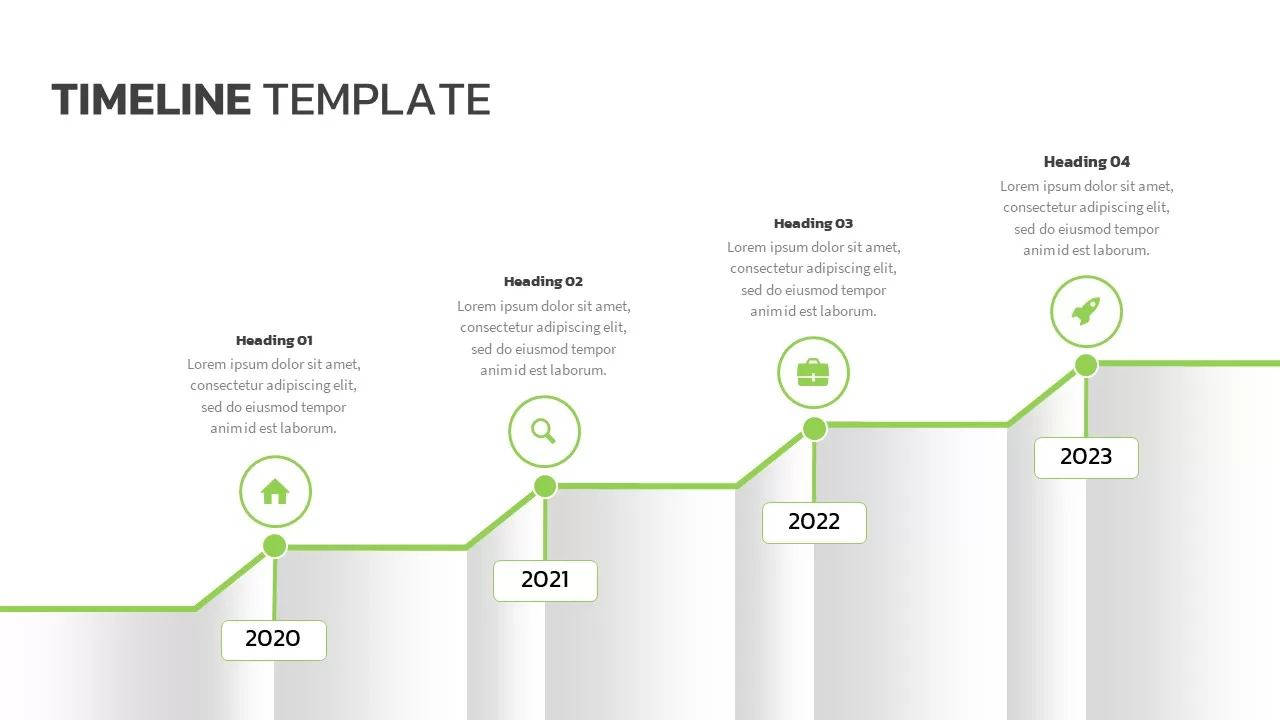
Modern Green Timeline Infographic Template for PowerPoint & Google Slides
Timeline
Free Modern Four-Step Agenda Infographic Template for PowerPoint & Google Slides
Agenda
Free
Modern Chess Infographic Diagram Template for PowerPoint & Google Slides
Comparison
Modern Shield Infographic Steps Template for PowerPoint & Google Slides
Process

Modern Big Data Infographic Deck Template for PowerPoint & Google Slides
Decks
Modern Six-Point Timeline Infographic Template for PowerPoint & Google Slides
Timeline
Modern Semi Circle Infographic Template for PowerPoint & Google Slides
Circular
Modern Wave Infographic Process for PowerPoint & Google Slides
Infographics
Travel Around World Template for PowerPoint & Google Slides
Infographics
World Environment Day Celebration Template for PowerPoint & Google Slides
Graphics
Free
Free World UFO Day Slide Template for PowerPoint & Google Slides
Business
Free
World Trade Organization Profile Template for PowerPoint & Google Slides
Business
World Hello Day Celebration Slide Template for PowerPoint & Google Slides
Graphics
Free World Health Organization Presentation Deck for PowerPoint & Google Slides
Decks
Free

Free Modern Gradient Wave Welcome Slides Template for PowerPoint & Google Slides
Free
Free

Modern Business Agency PowerPoint Template for PowerPoint & Google Slides
Company Profile
Modern Circle SWOT Analysis Diagram Template for PowerPoint & Google Slides
SWOT
Modern Business Speech Slide Design Template for PowerPoint & Google Slides
Business
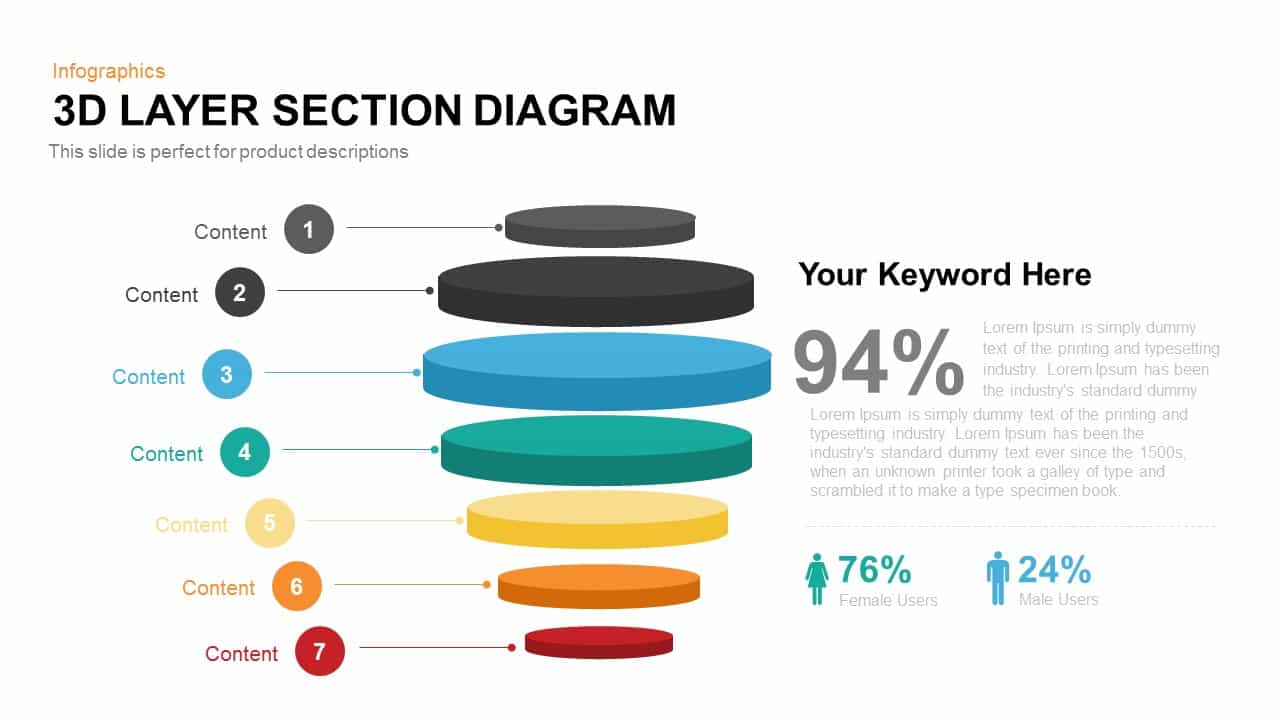
Modern 3D Layer Section Diagram Template for PowerPoint & Google Slides
Circular

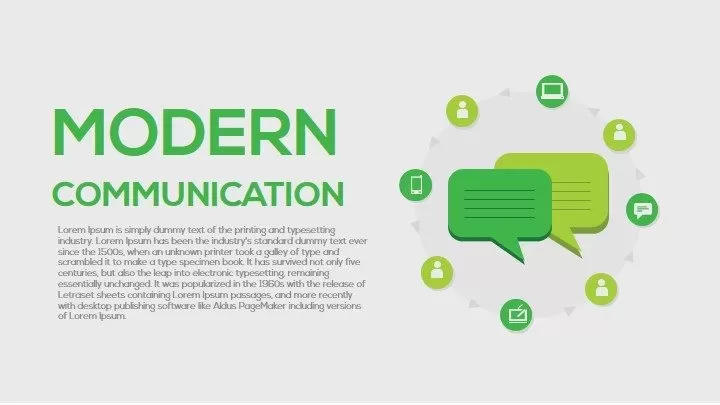
Modern Communication Process Diagram Template for PowerPoint & Google Slides
Process
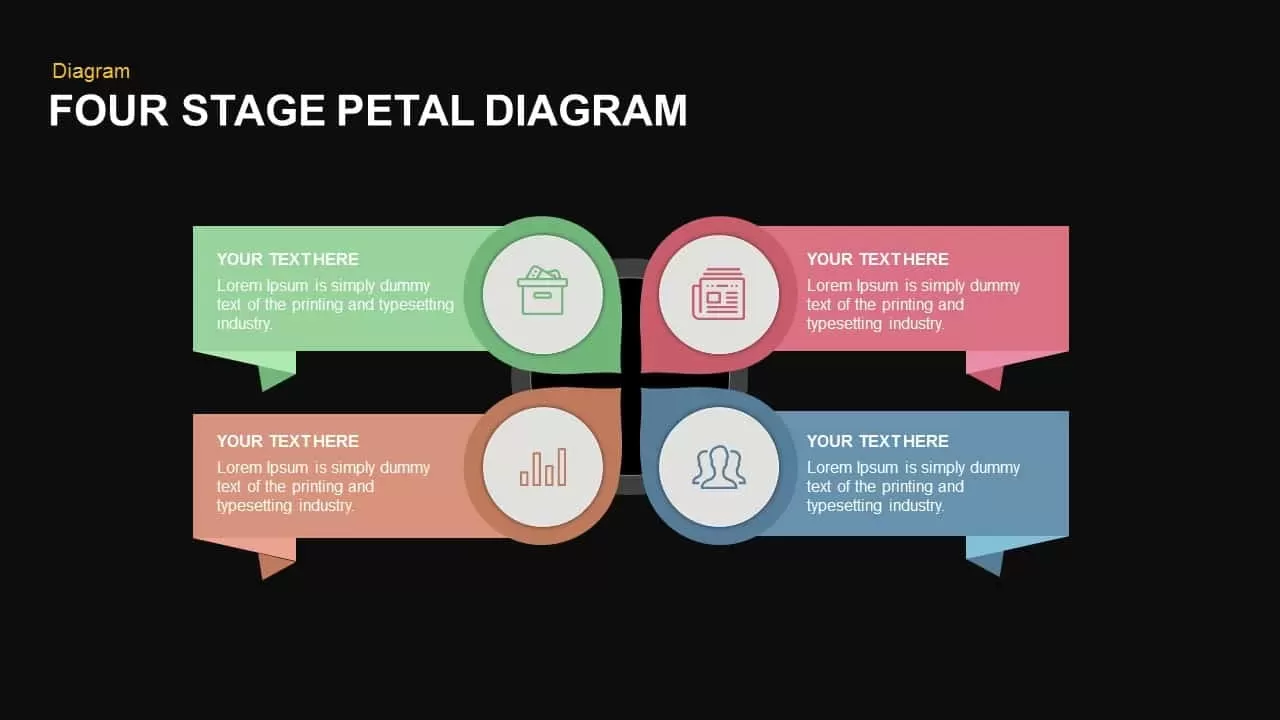
Modern Four-Stage Petal Diagram Template for PowerPoint & Google Slides
Circular
Modern Multi-Section Circle Diagram Template for PowerPoint & Google Slides
Circular

Modern Orange Business Plan Design Theme Template for PowerPoint & Google Slides
Company Profile

Modern Four Stage Gear Diagram Template for PowerPoint & Google Slides
Process
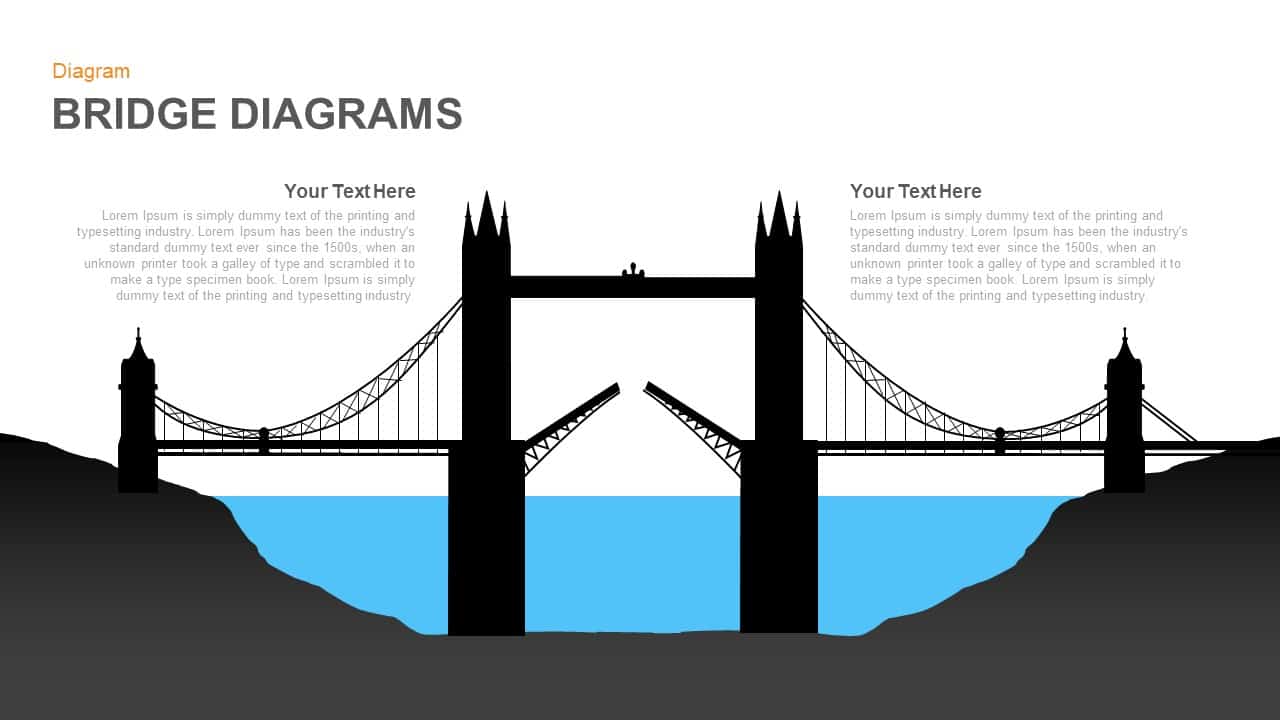
Modern Bridge Diagram Slide Design Template for PowerPoint & Google Slides
Process
Modern Customer Acquisition Strategy Template for PowerPoint & Google Slides
Customer Journey
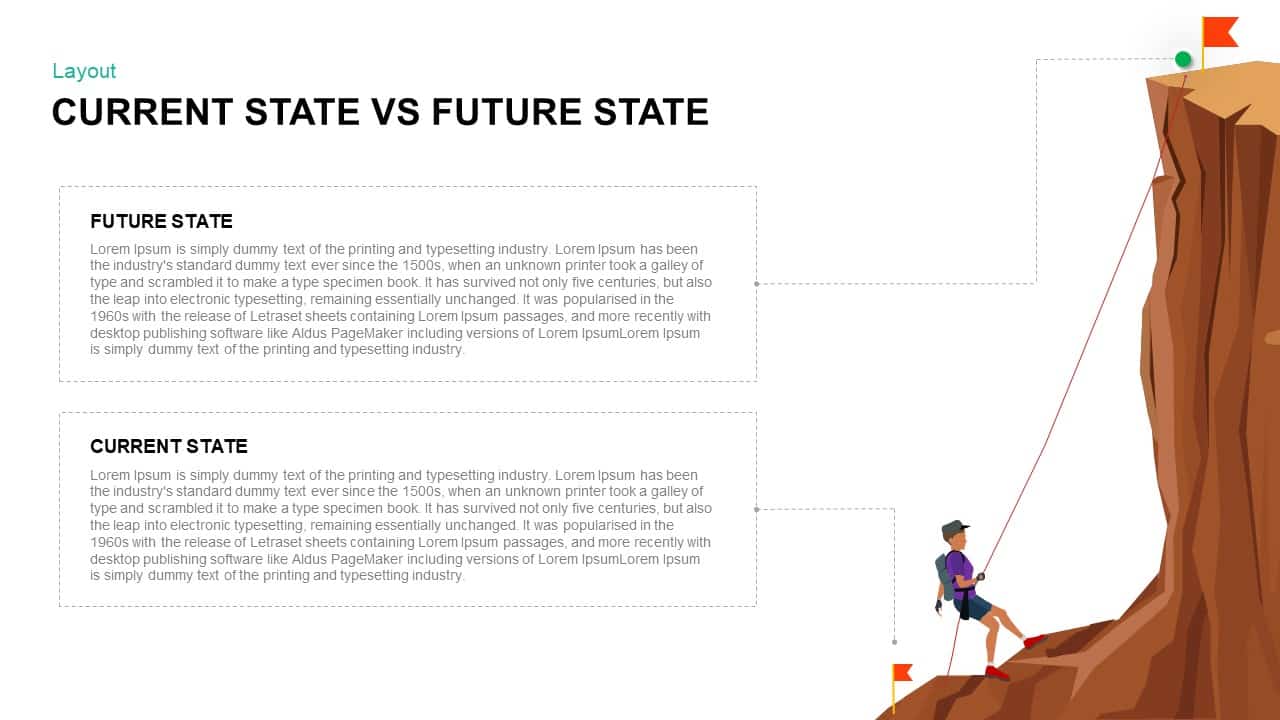
Modern Current vs Future State Template for PowerPoint & Google Slides
Comparison

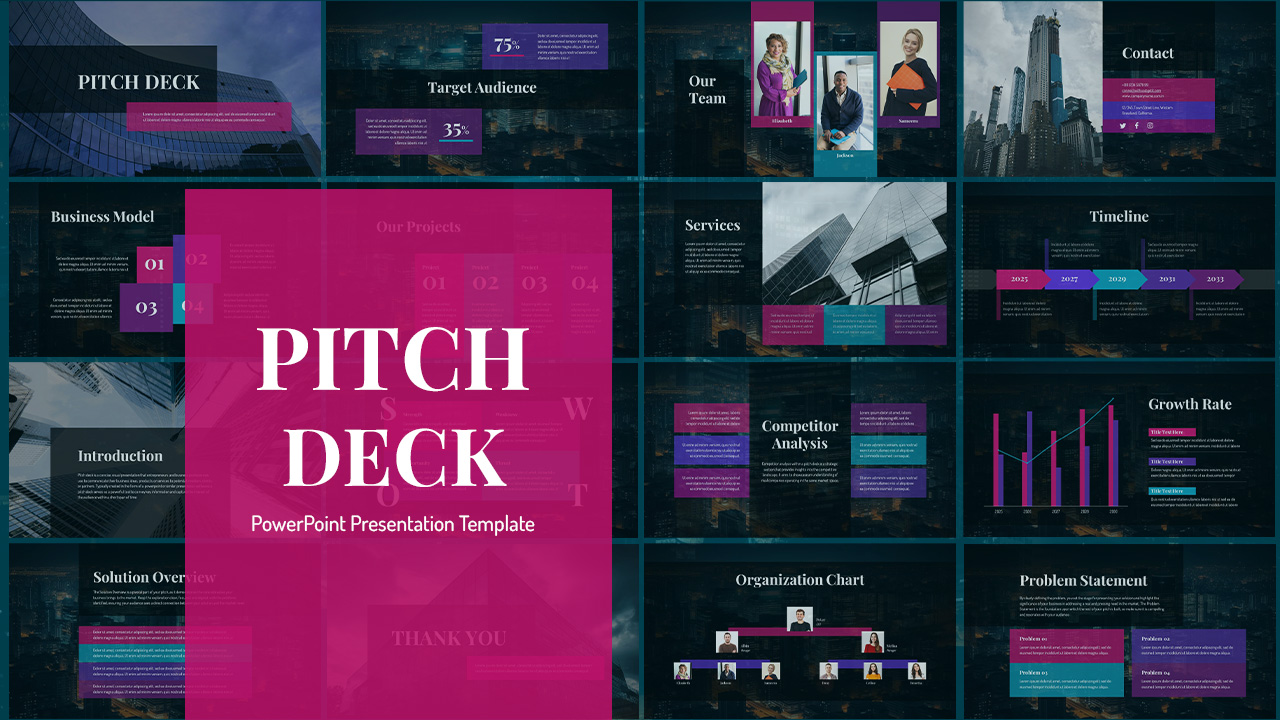
Free Modern Pitch Deck Presentation Template for PowerPoint & Google Slides
Pitch Deck
Free
Modern Recruiting Process Cover Slide Template for PowerPoint & Google Slides
Pitch Deck
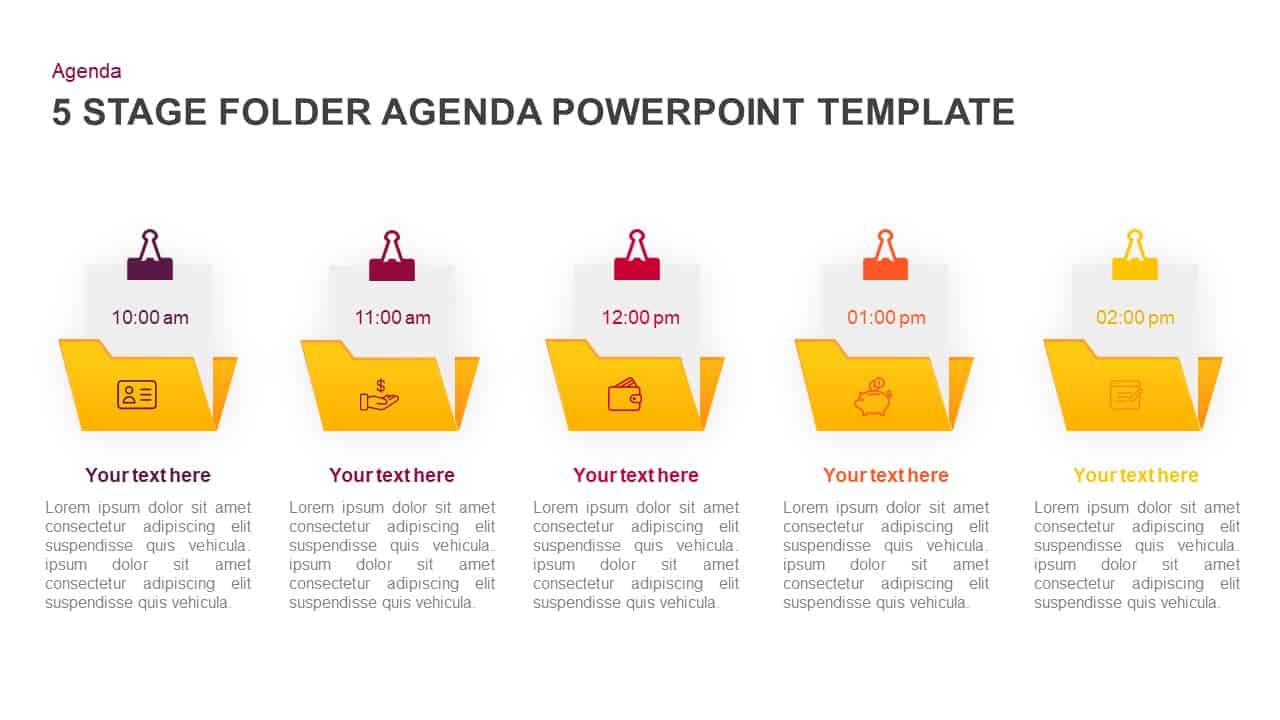
Modern 5-Stage Folder Agenda Layout Template for PowerPoint & Google Slides
Agenda
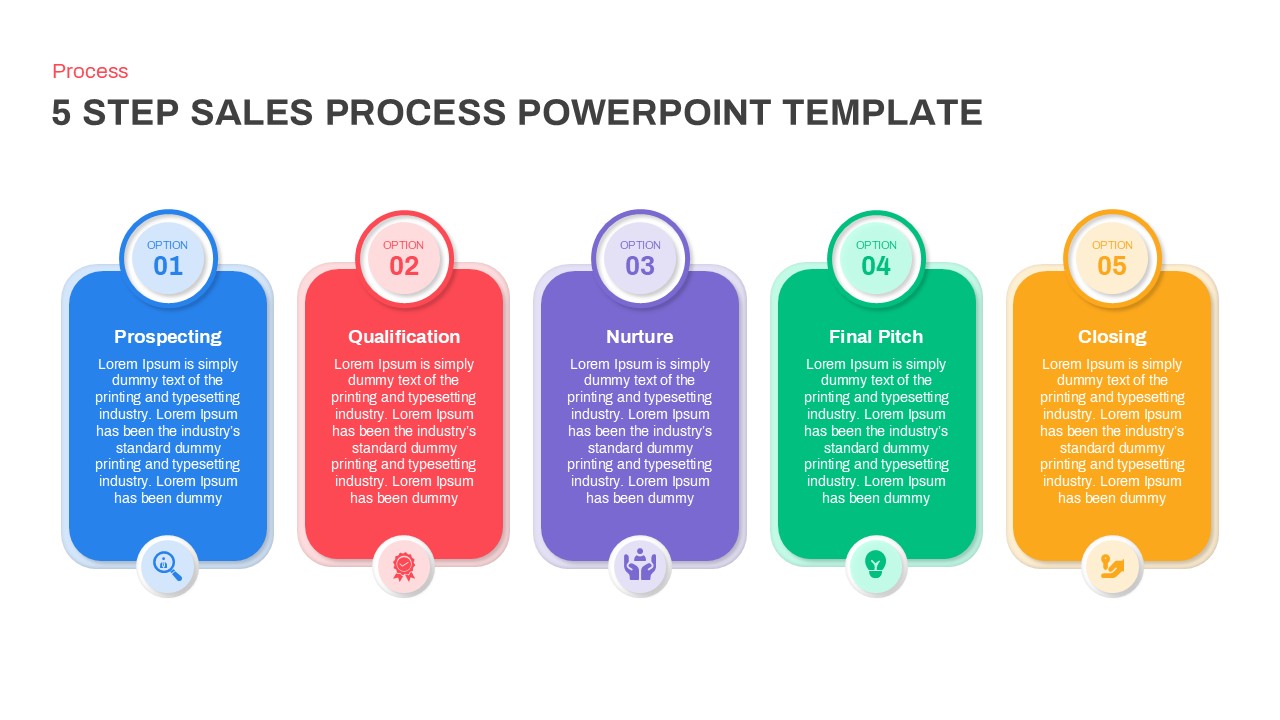
Modern 5-Step Sales Process Diagram Template for PowerPoint & Google Slides
Process
Modern Digital Marketing Strategy Template for PowerPoint & Google Slides
Pitch Deck
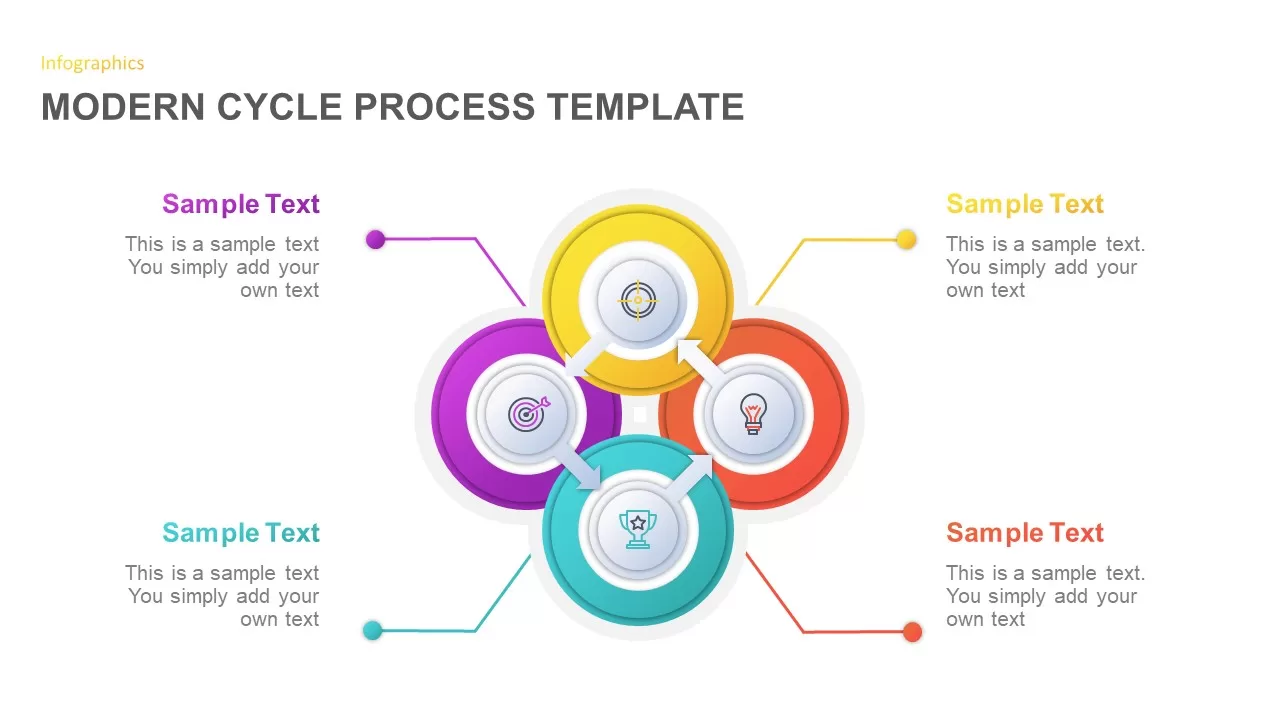
Modern Cycle Process Template for PowerPoint & Google Slides
Business Proposal
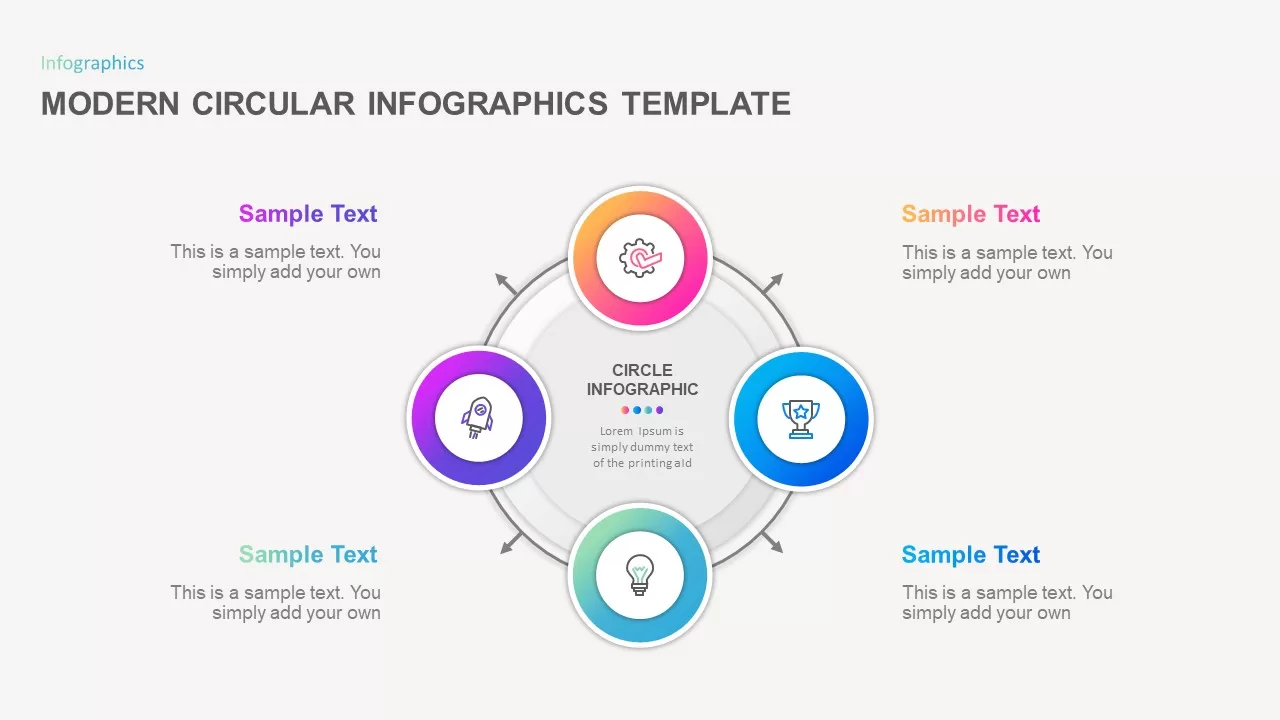
Modern Circular Infographics Template for PowerPoint & Google Slides
Circular
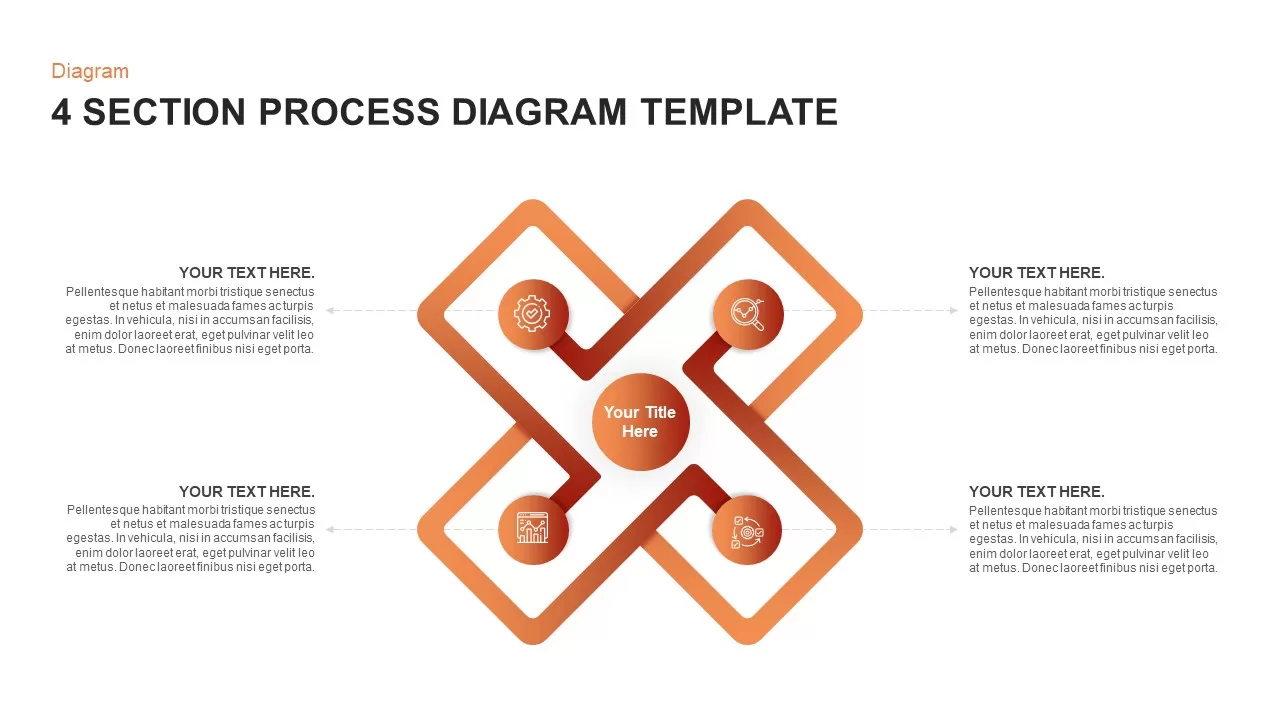
Modern 4 Section Process Diagram Template for PowerPoint & Google Slides
Process
Modern LIFO Template for PowerPoint & Google Slides
Accounting
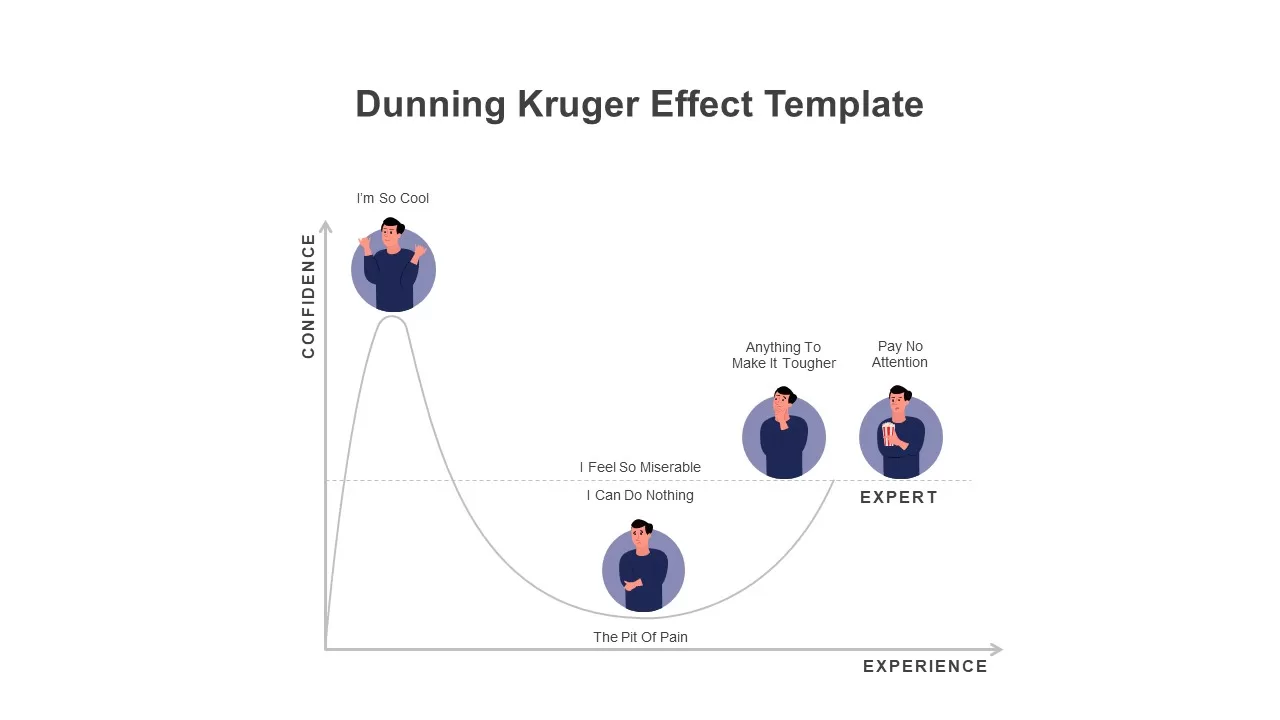
Modern Dunning Kruger Effect Diagram Template for PowerPoint & Google Slides
Business
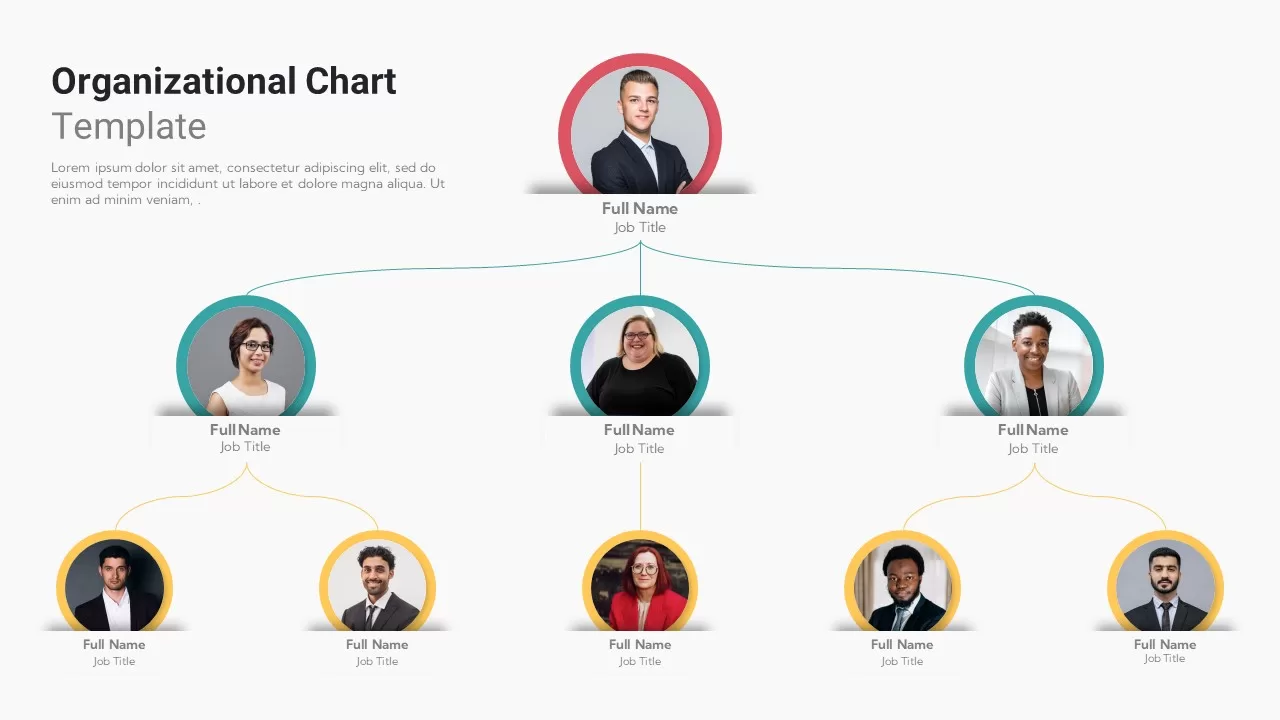
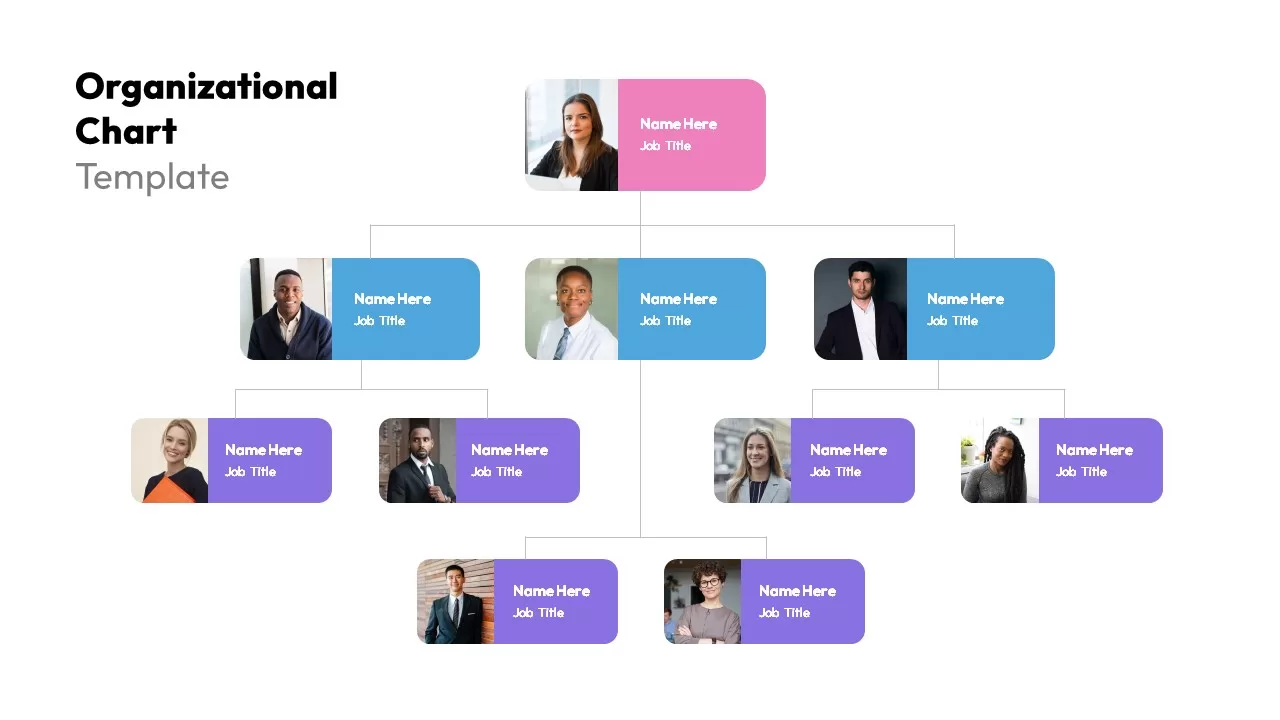
Modern Photo-Based Organizational Chart Template for PowerPoint & Google Slides
Org Chart
Modern Colorful SWOT Quadrant Analysis Template for PowerPoint & Google Slides
SWOT
Modern Project Status Report Dashboard Template for PowerPoint & Google Slides
Project Status
Modern Ribbon Six-Step Agenda Slide Template for PowerPoint & Google Slides
Agenda
Modern Image-Based Organizational Chart Template for PowerPoint & Google Slides
Infographics
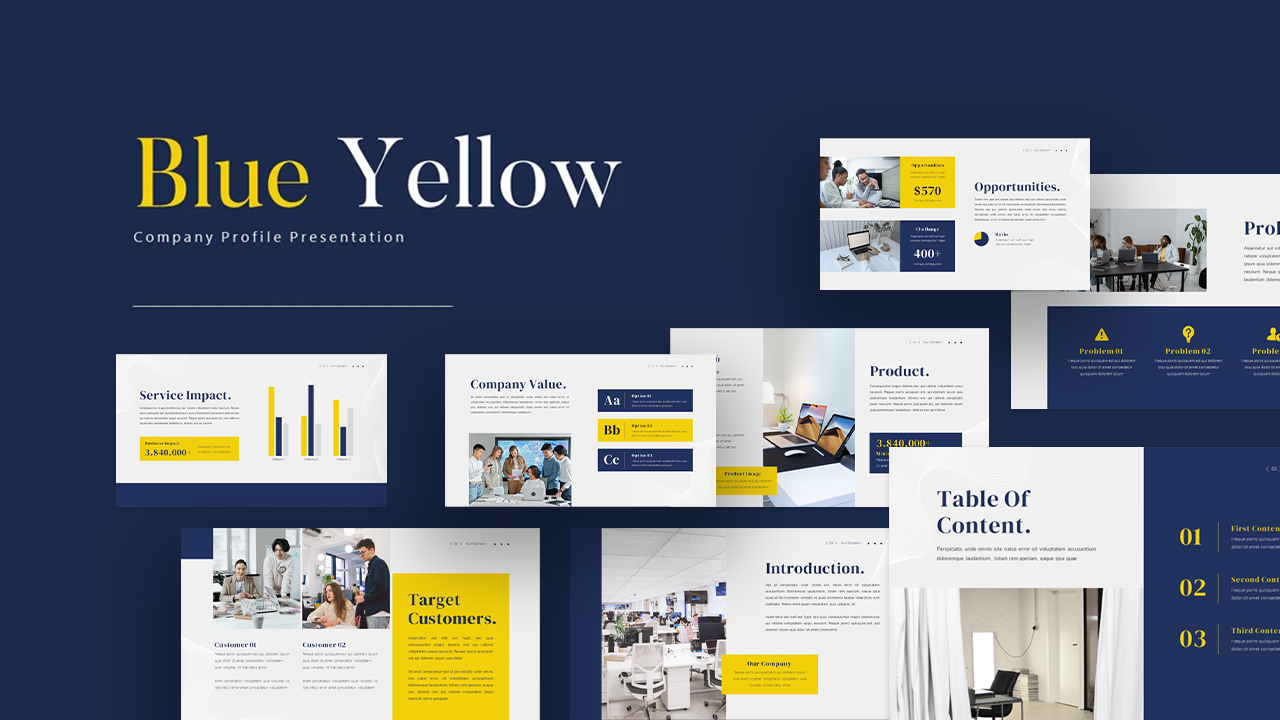
Modern Blue Yellow Company Profile Template for PowerPoint & Google Slides
Company Profile
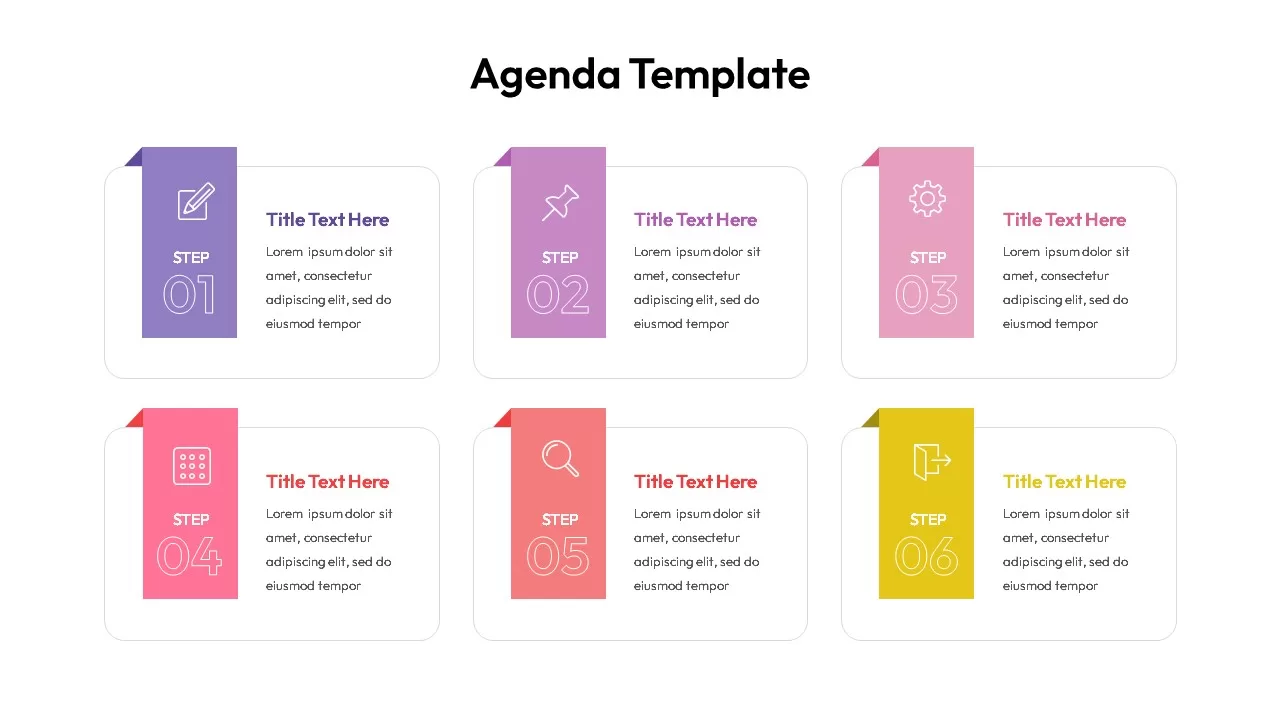
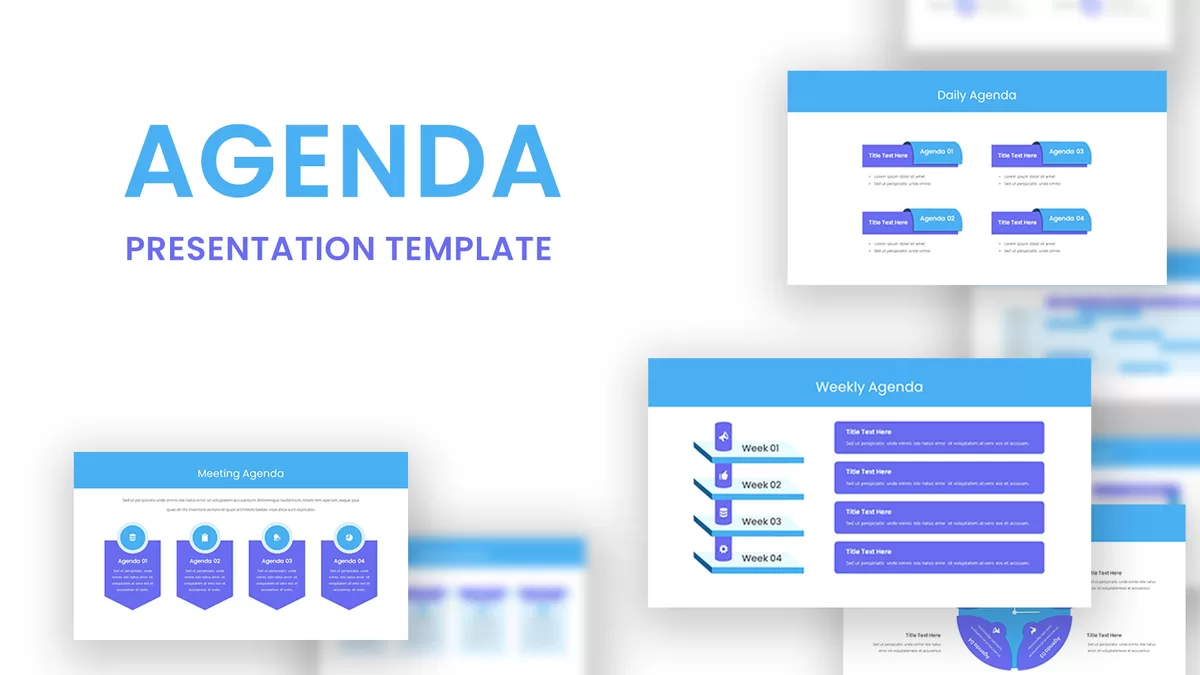
Modern Agenda Presentation Template for PowerPoint & Google Slides
Agenda
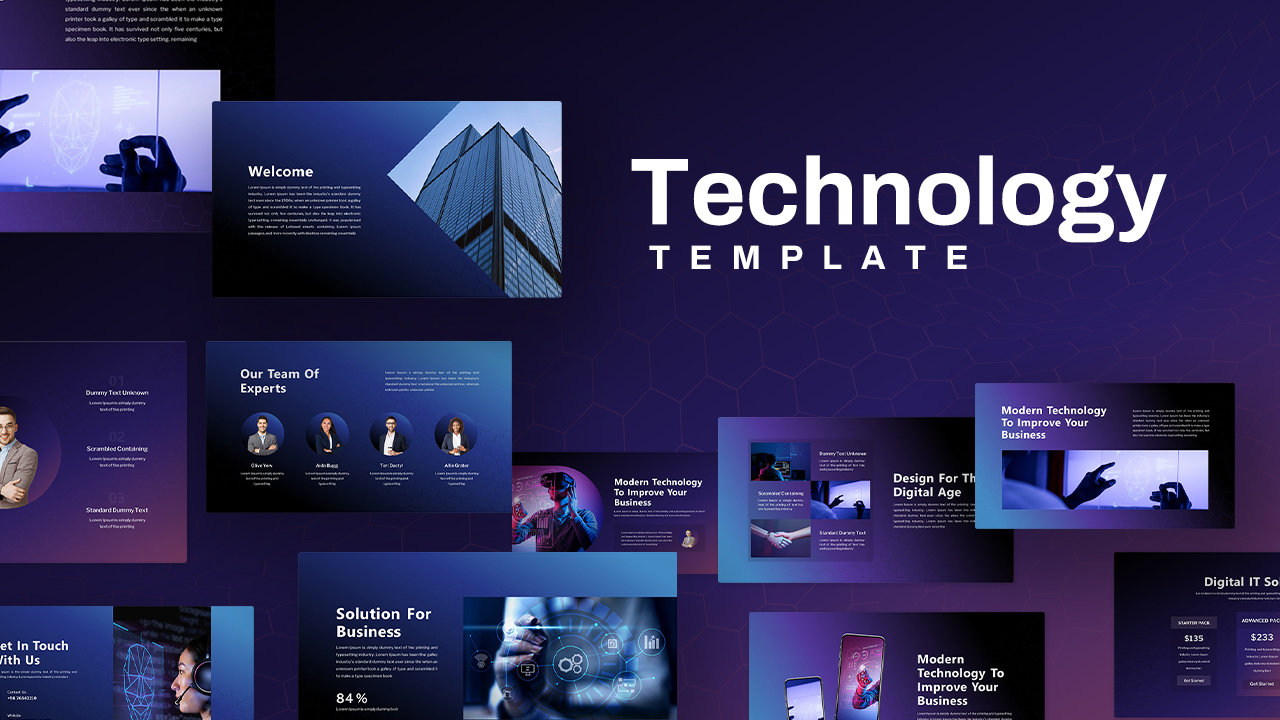
Modern Technology Solutions Overview template for PowerPoint & Google Slides
Information Technology
Modern Accomplishment Slide with Icons Template for PowerPoint & Google Slides
Business
Modern Yellow Business Proposal Deck Template for PowerPoint & Google Slides
Business Proposal
Modern Project Scope Template for PowerPoint & Google Slides
Project
Modern Company Profile About Us Slide Template for PowerPoint & Google Slides
Company Profile
Modern Mosaic Photo Grid Layout Template for PowerPoint & Google Slides
Graphics
Modern Cosmetics Photo Collage Layout Template for PowerPoint & Google Slides
Graphics
Modern Alphabet Letter Slide Deck Template for PowerPoint & Google Slides
Decks
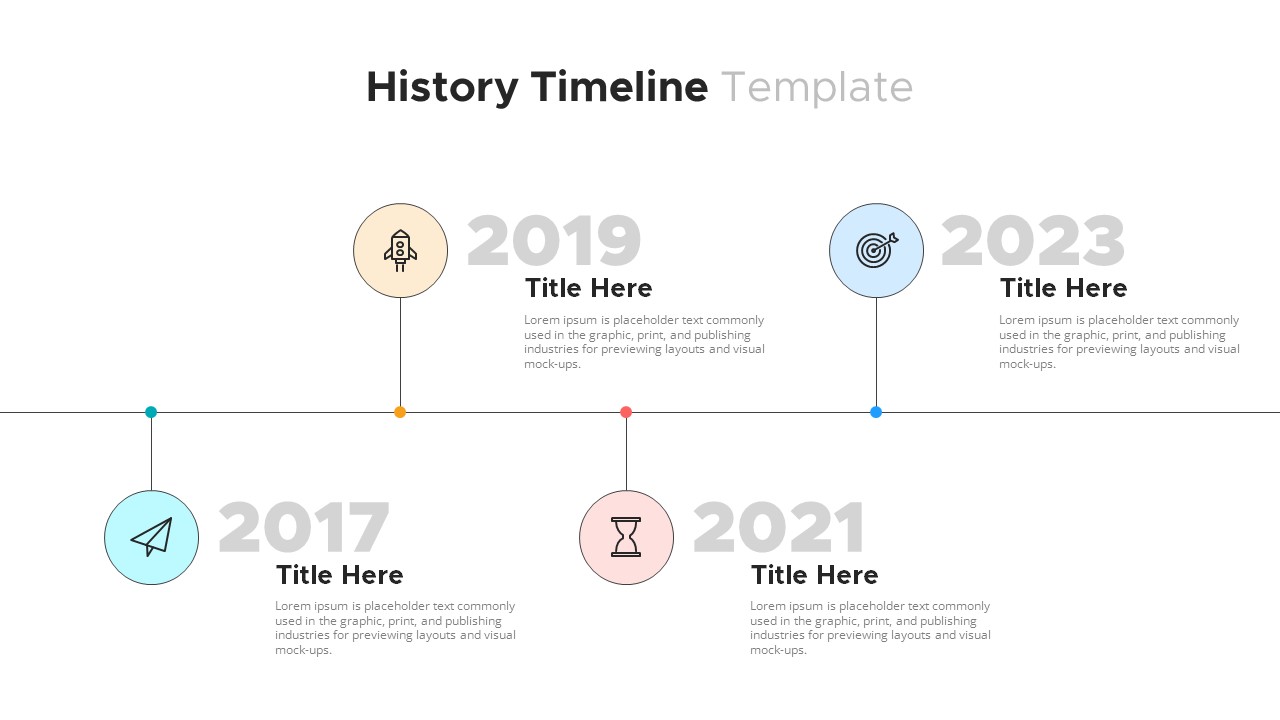
Modern Horizontal History Timeline Template for PowerPoint & Google Slides
Timeline
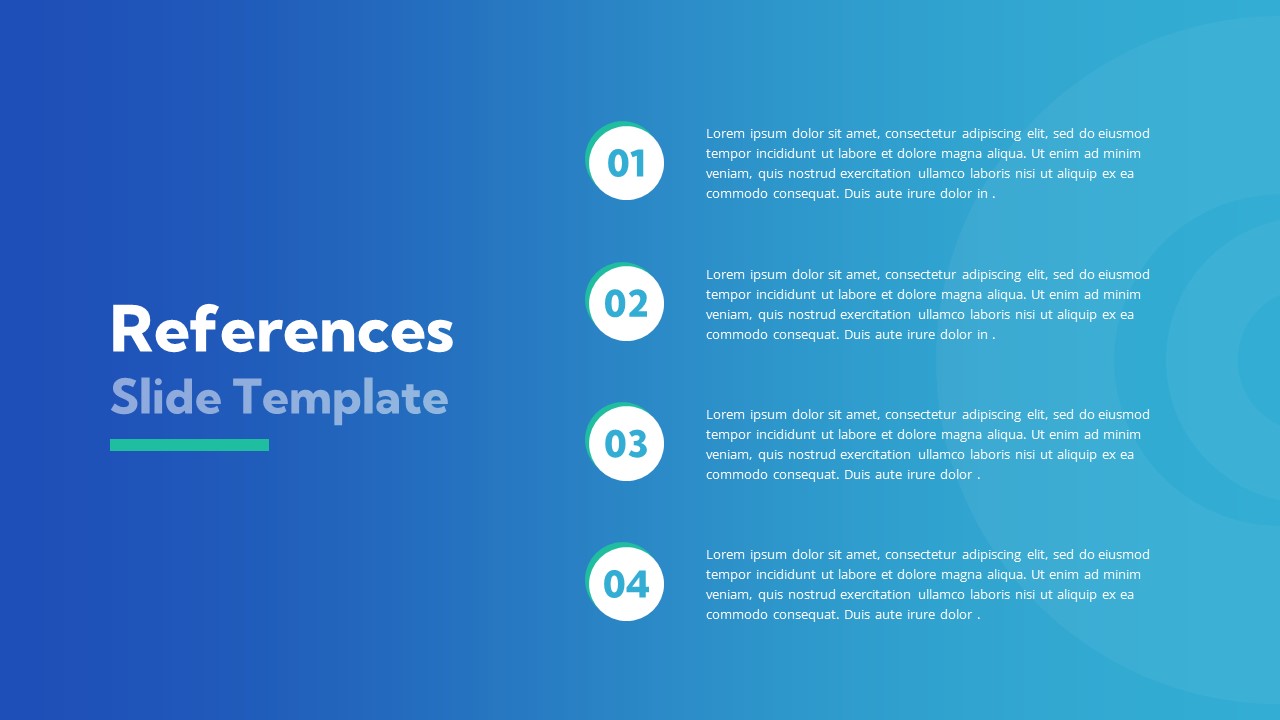
Modern Numbered References Slide Template for PowerPoint & Google Slides
Business Report
Modern Professional References Slide Template for PowerPoint & Google Slides
Business Report
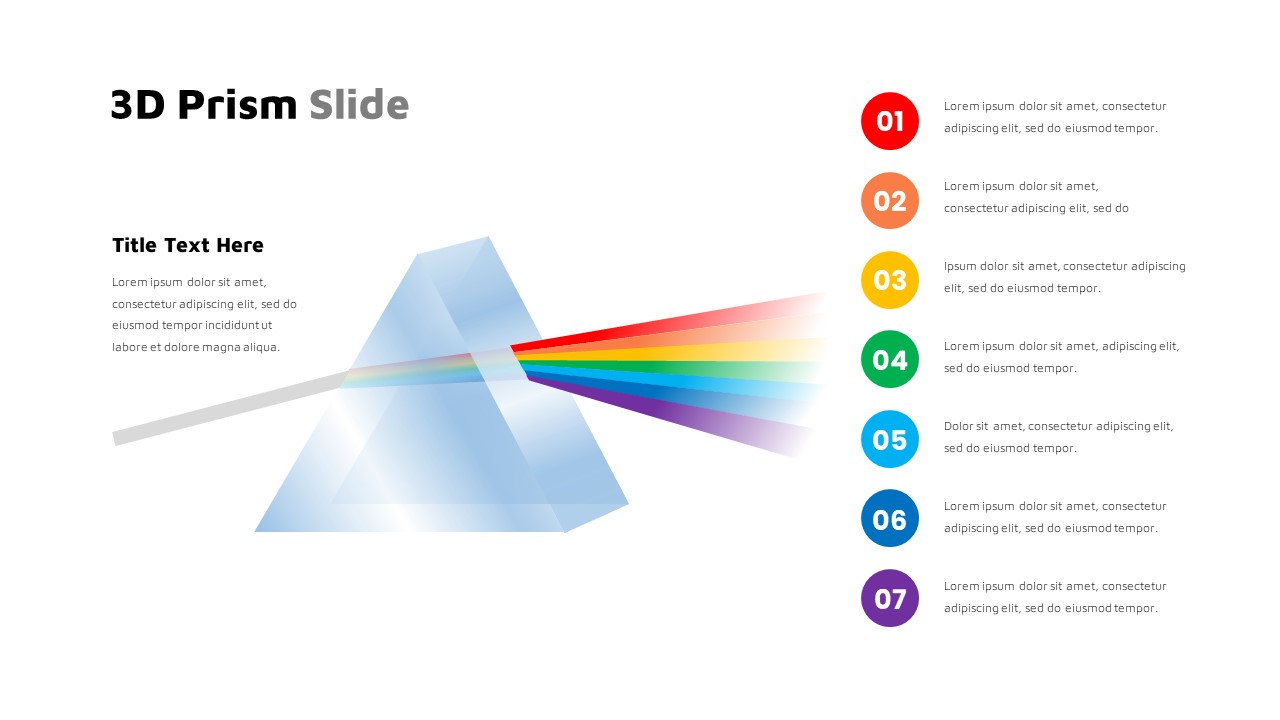
Modern Seven-Step 3D Prism Diagram Template for PowerPoint & Google Slides
Process
Modern Biotechnology Services & Research Template for PowerPoint & Google Slides
Health
Free Modern Dark Pitch Deck Presentation Template for PowerPoint & Google Slides
Pitch Deck
Free
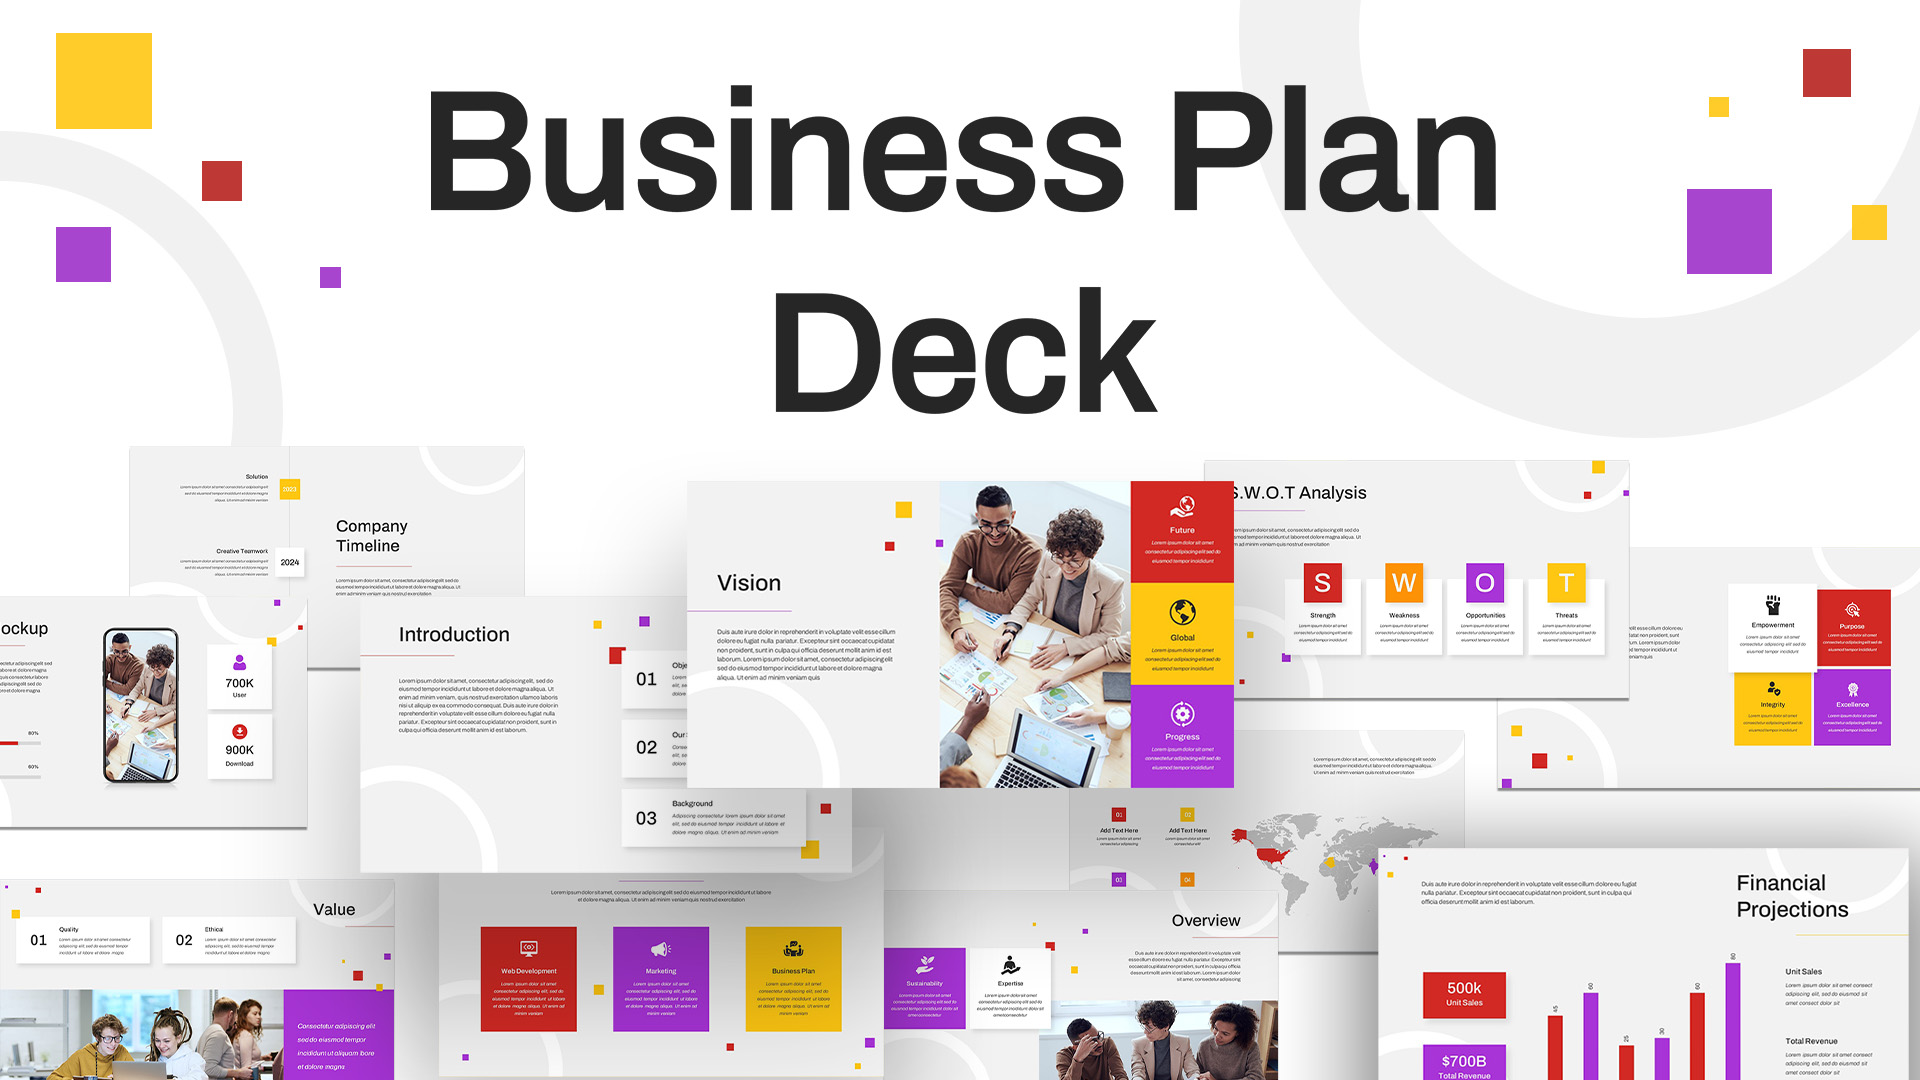
Free Modern Colorful Business Plan Deck Template for PowerPoint & Google Slides
Business Plan
Free
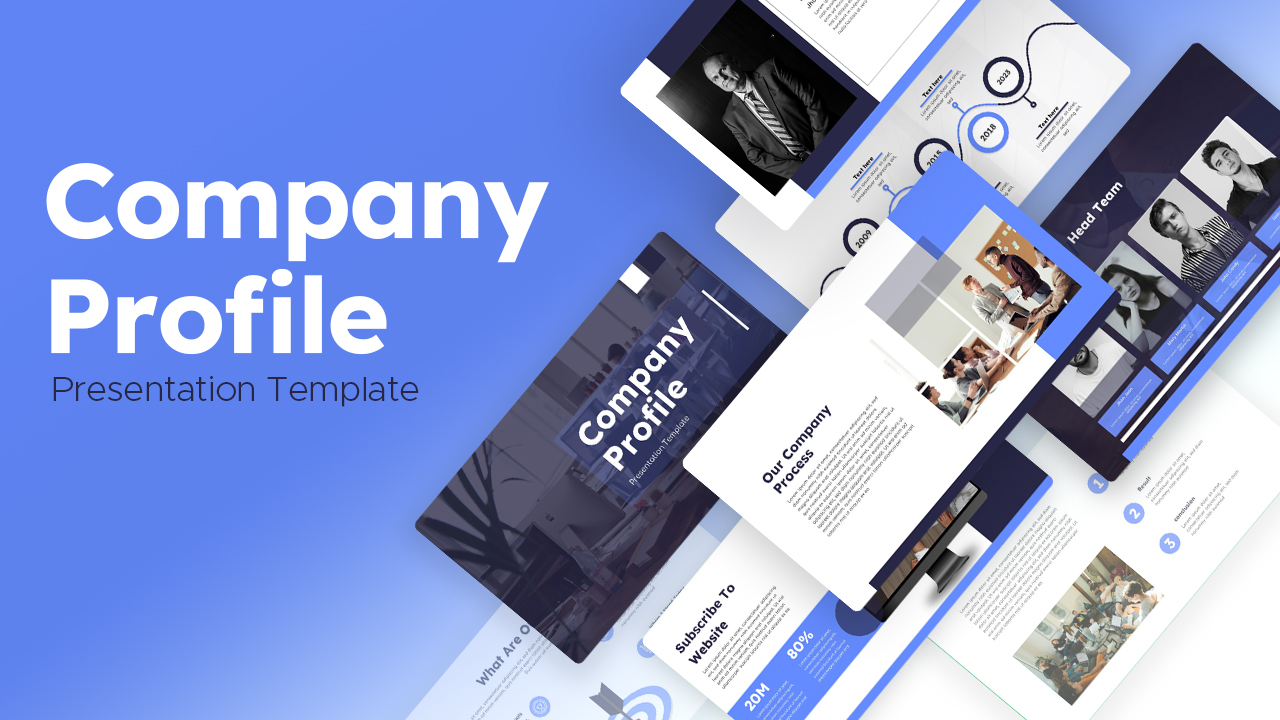
Free Modern Blue Company Profile Deck Template for PowerPoint & Google Slides
Company Profile
Free
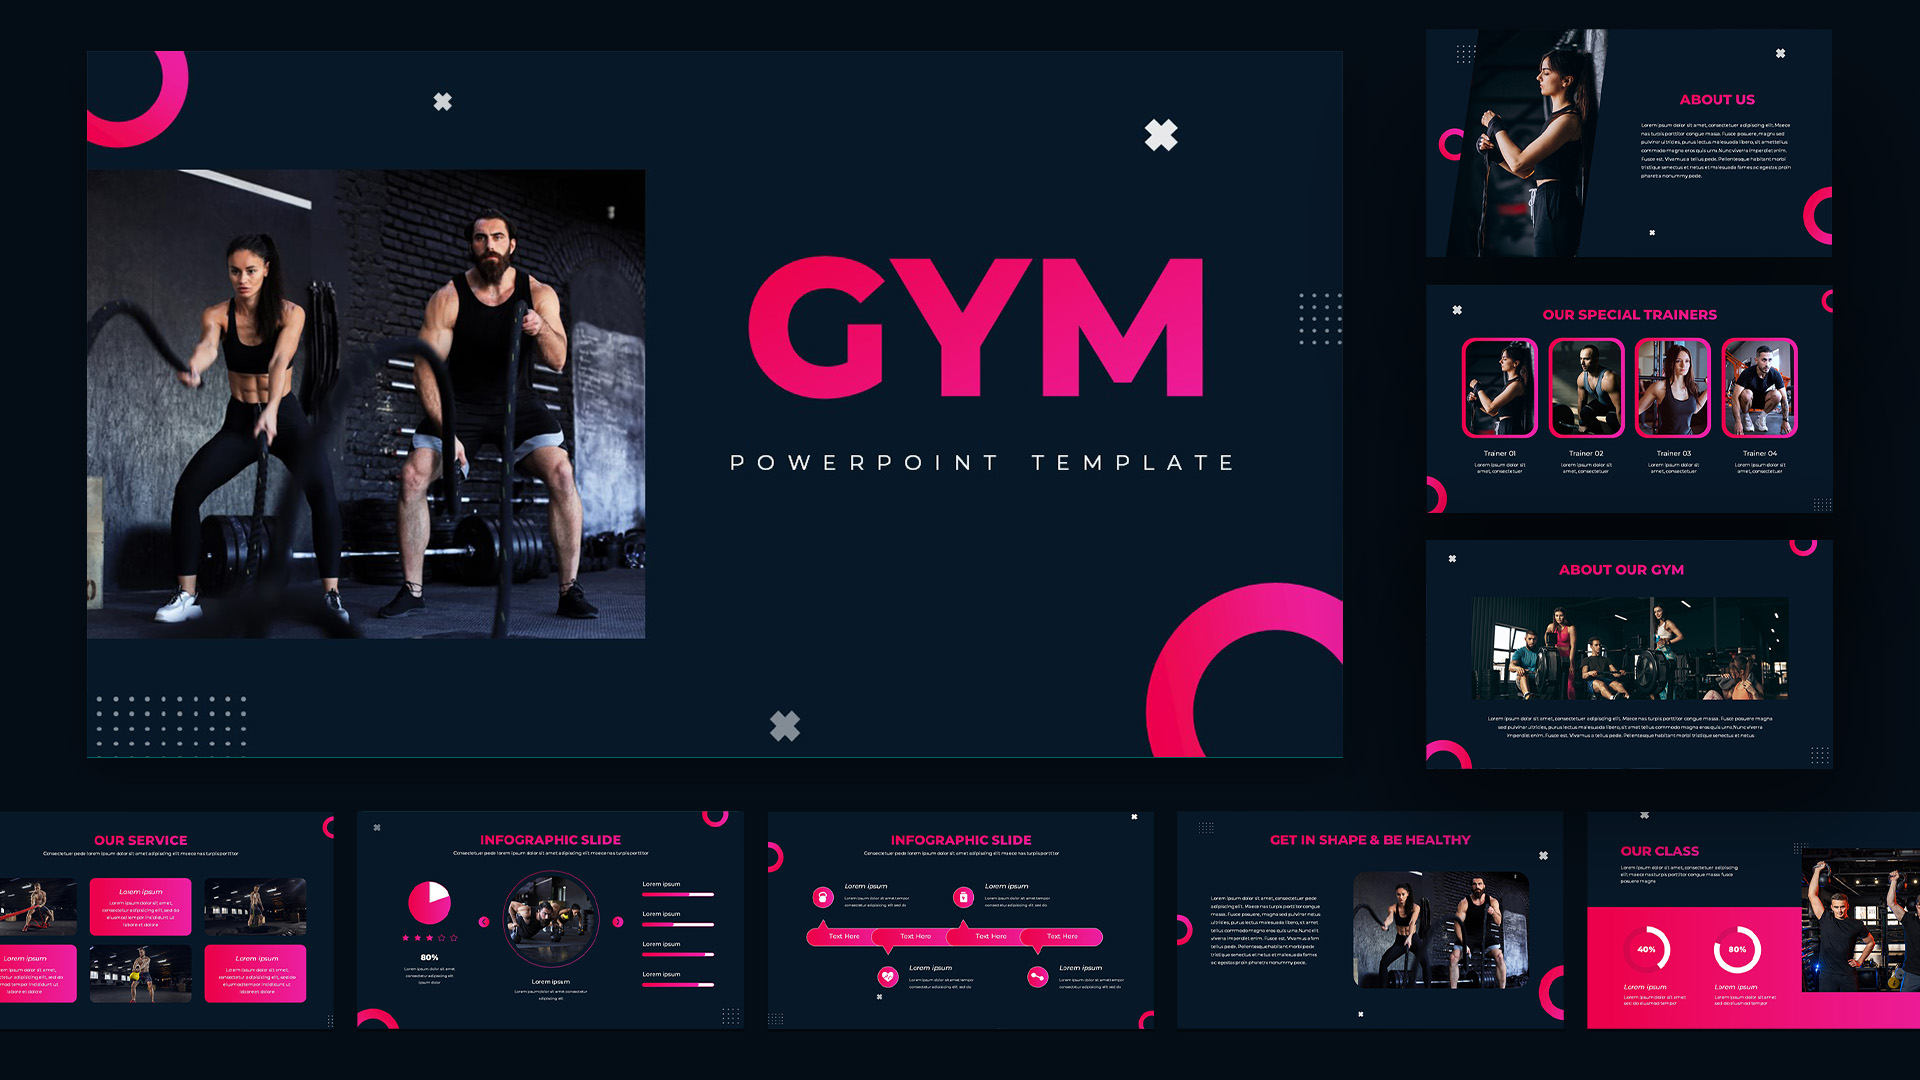
Modern Dark Gym & Fitness Presentation Template for PowerPoint & Google Slides
Pitch Deck
Modern Food Theme Presentation Template for PowerPoint & Google Slides
Pitch Deck
Free Modern Dunder Mifflin Pitch Deck Template for PowerPoint & Google Slides
Pitch Deck
Free
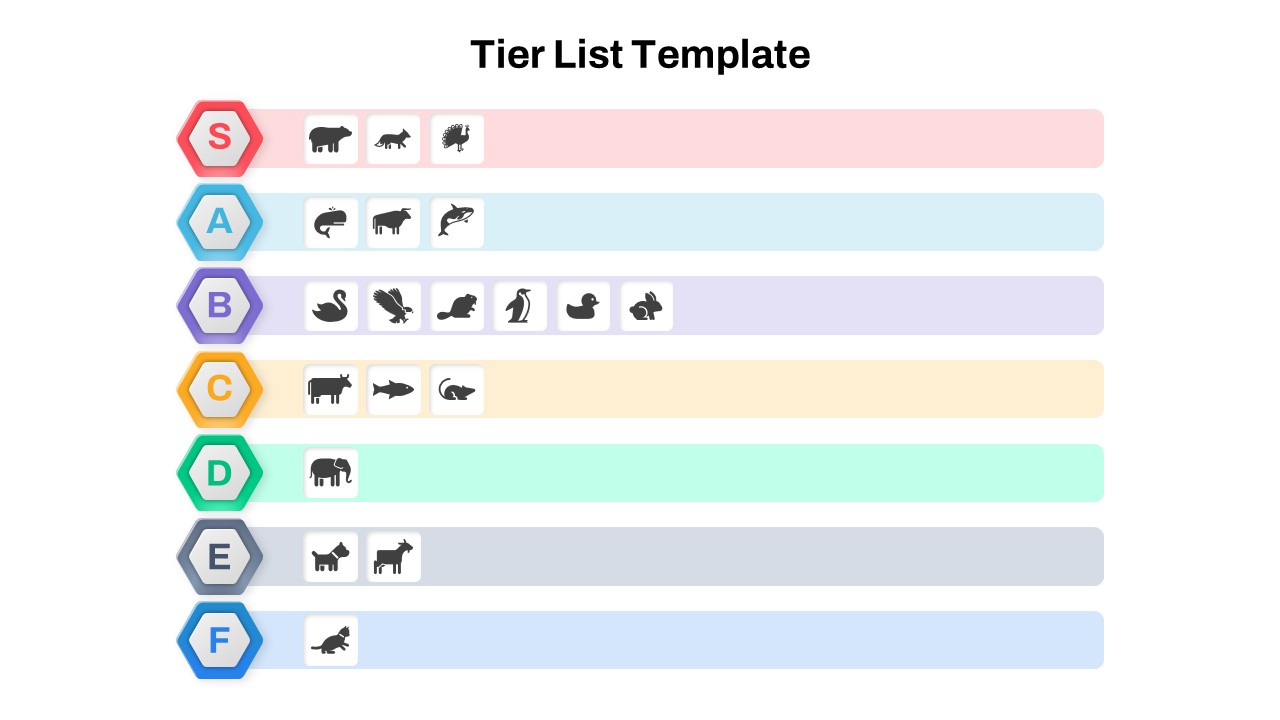
Modern Tier List Template for PowerPoint & Google Slides
Comparison
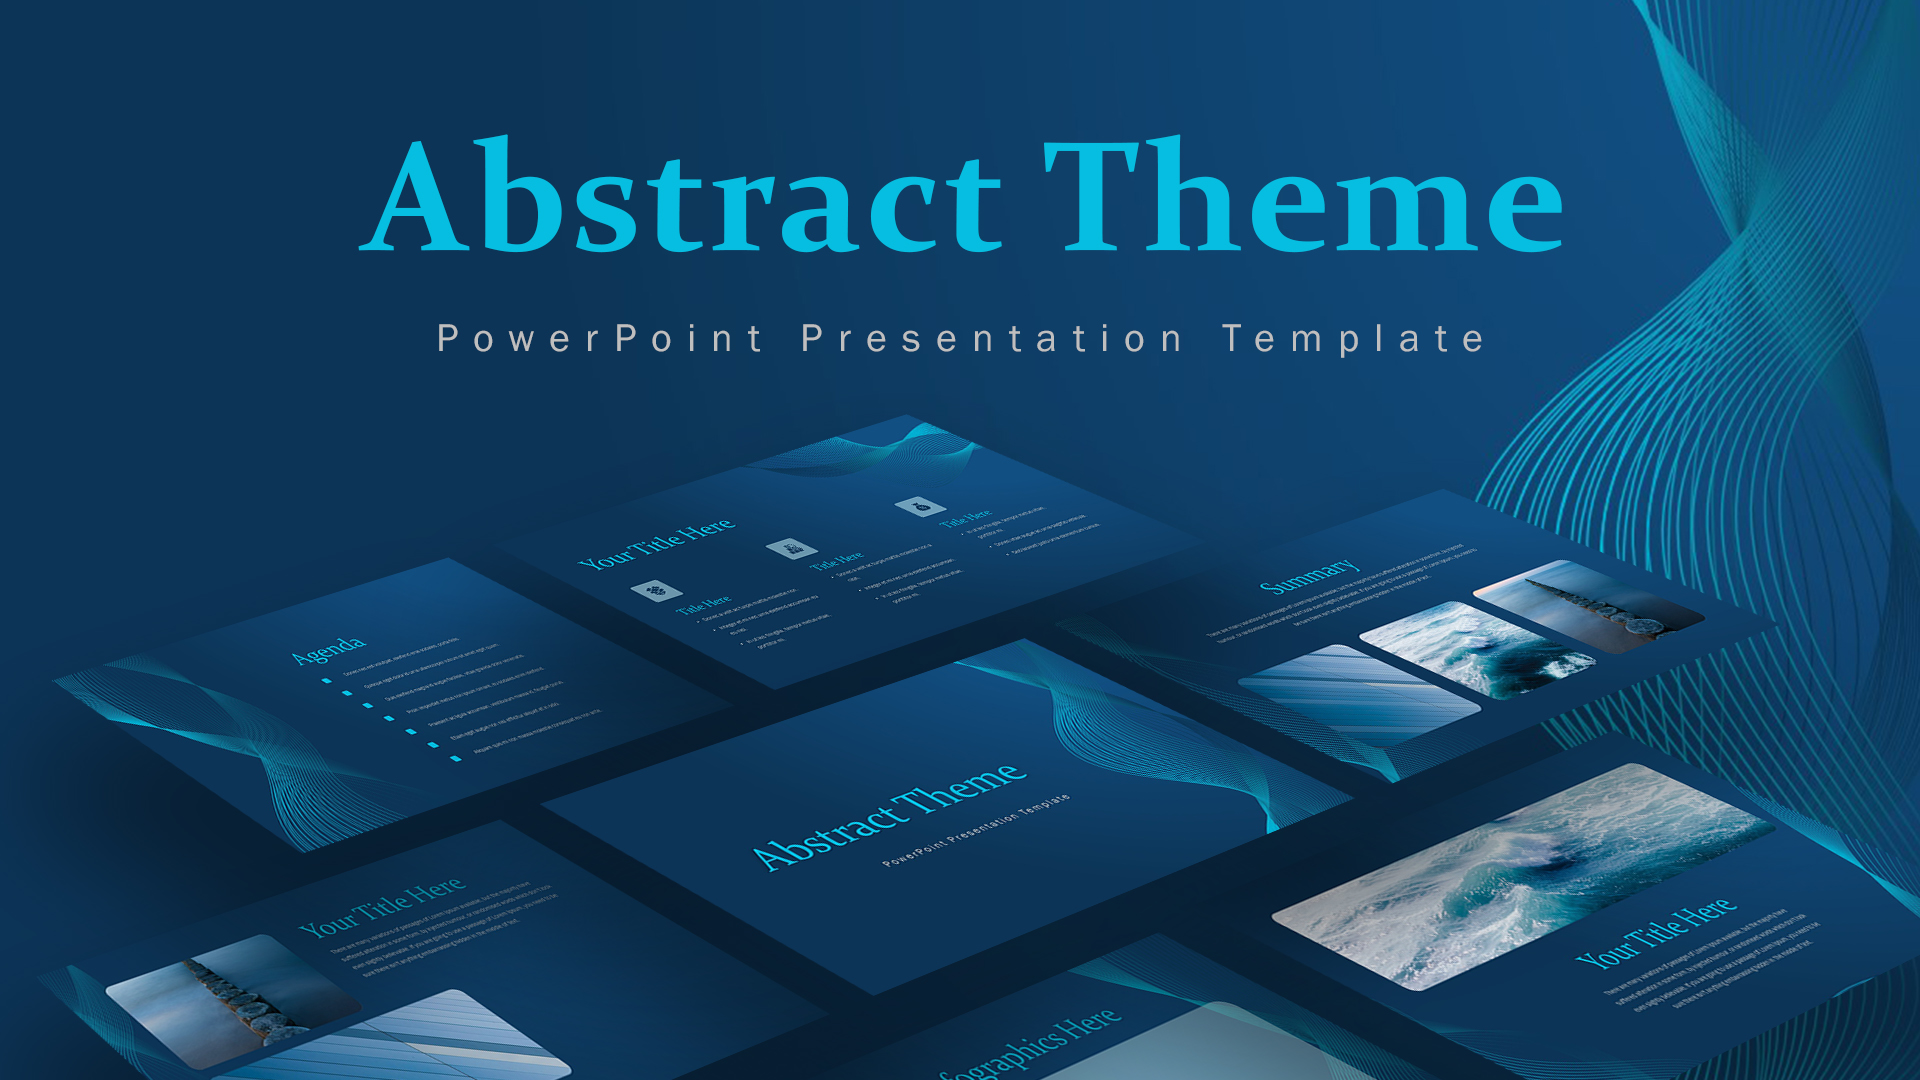
Modern Abstract Blue Wave Theme Template for PowerPoint & Google Slides
Decks
Modern Digital Agency Presentation Template for PowerPoint & Google Slides
Digital Marketing
Modern Marketing Presentation Template for PowerPoint & Google Slides
Pitch Deck
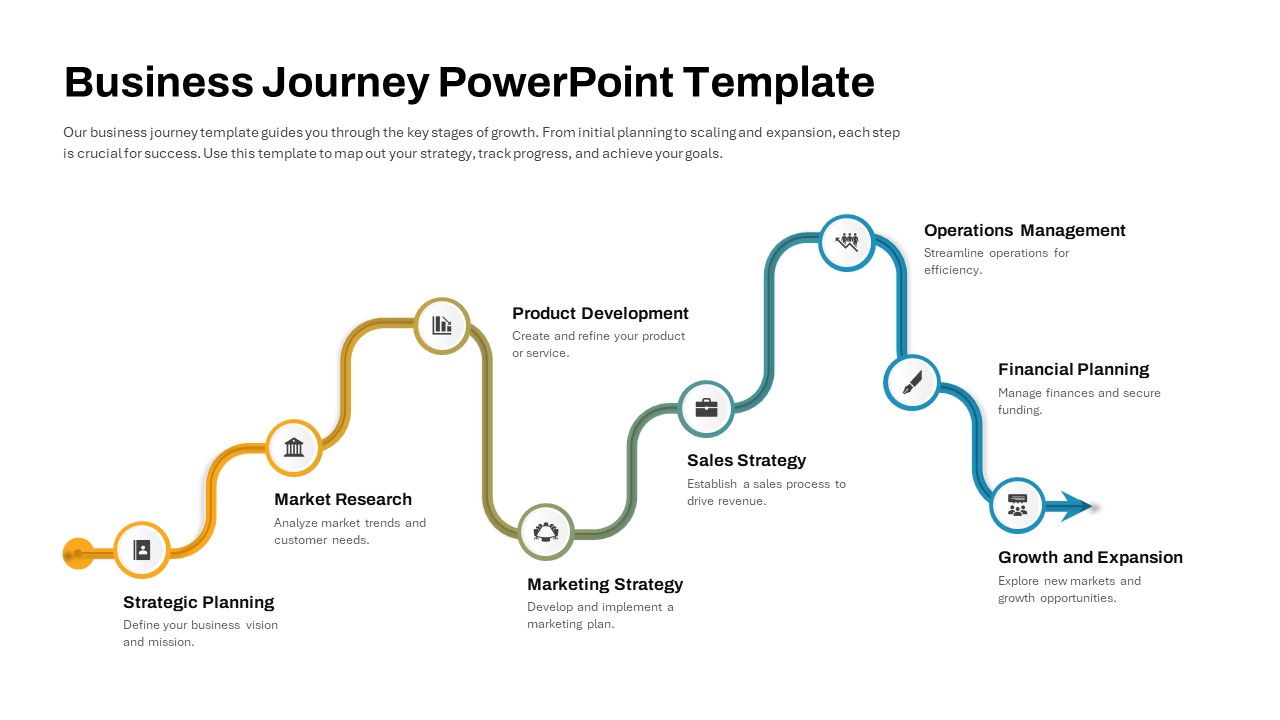
Modern Business Journey Roadmap Template for PowerPoint & Google Slides
Roadmap
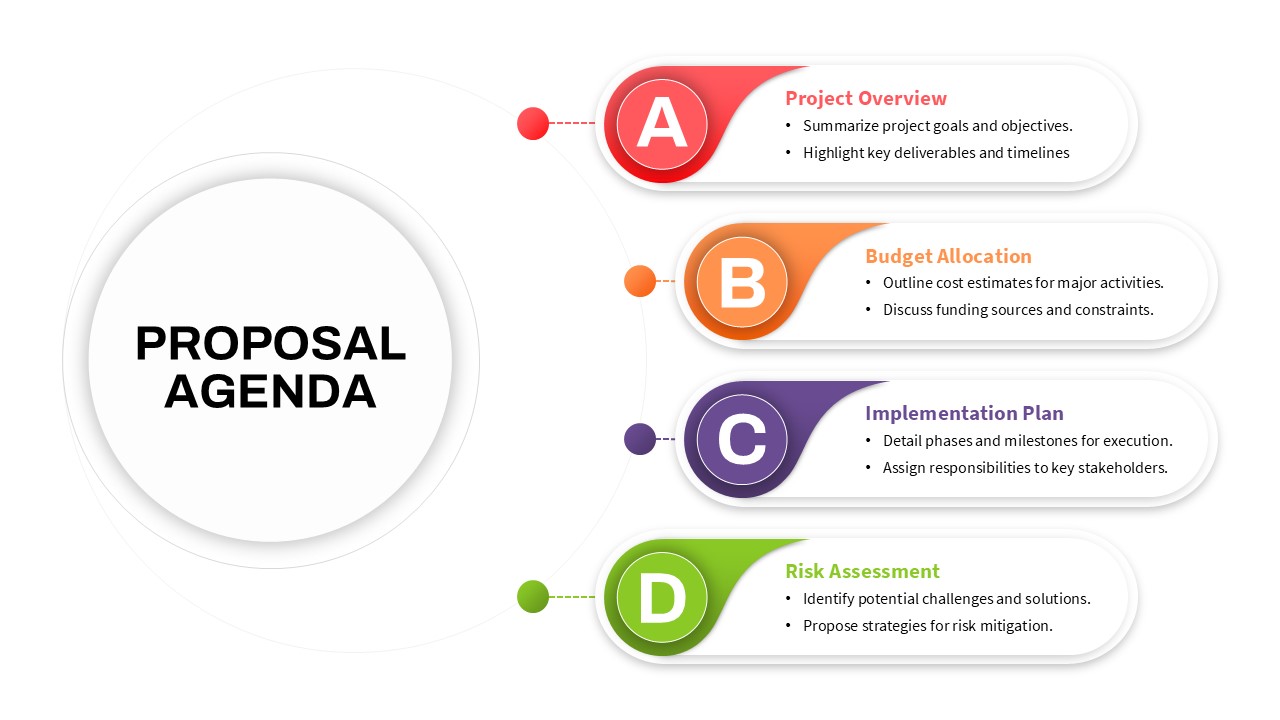
Modern Proposal Agenda Presentation Template for PowerPoint & Google Slides
Agenda
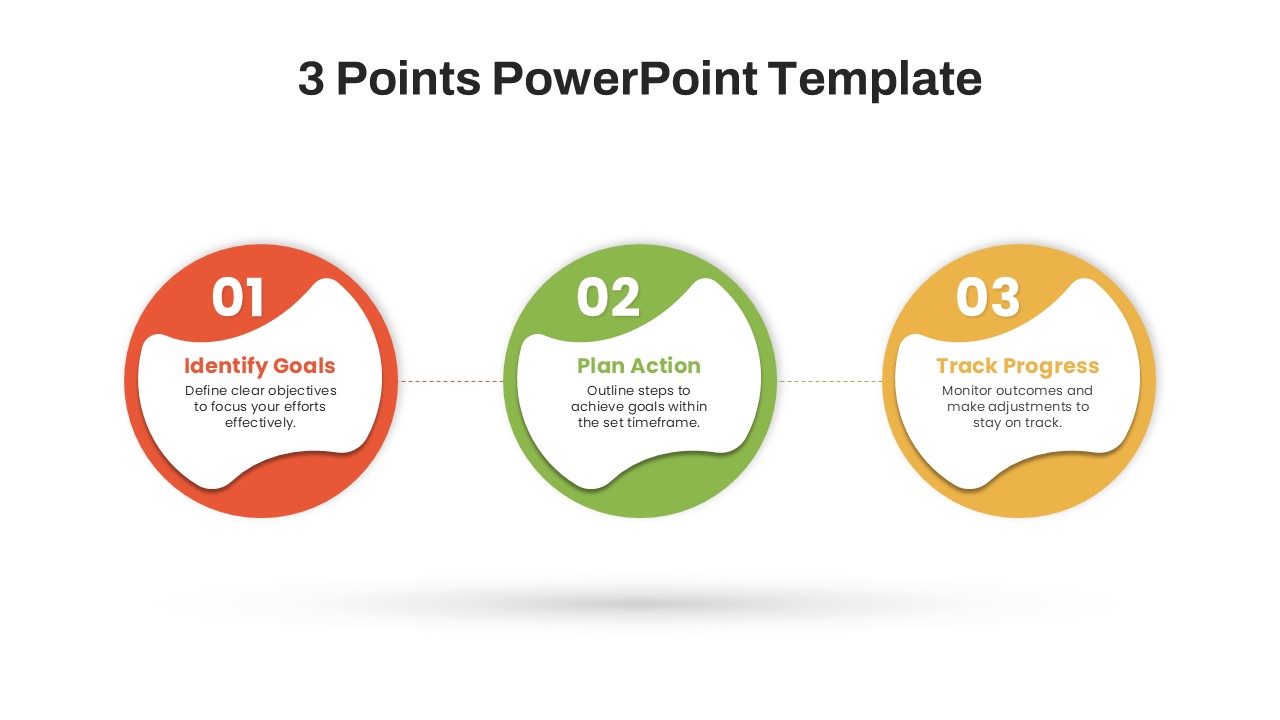
Modern Three-Point Process Diagram Template for PowerPoint & Google Slides
Process
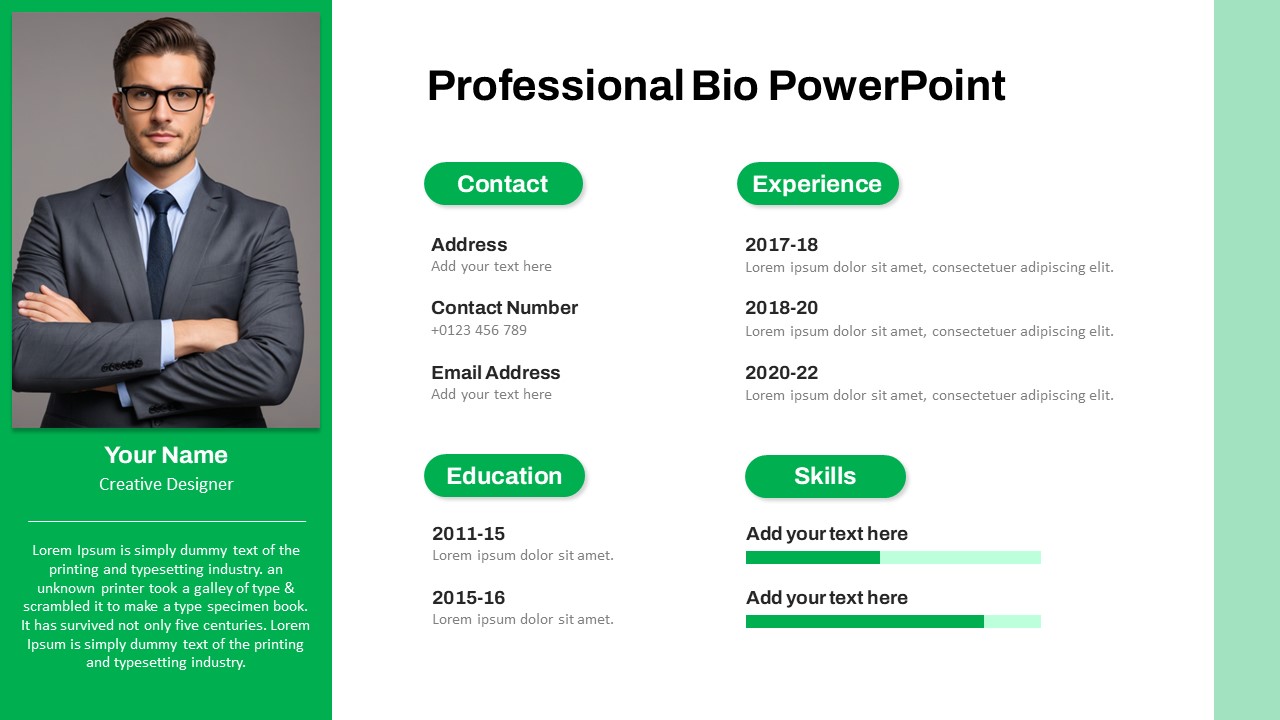
Modern Professional Bio Resume Slide Template for PowerPoint & Google Slides
Recruitment
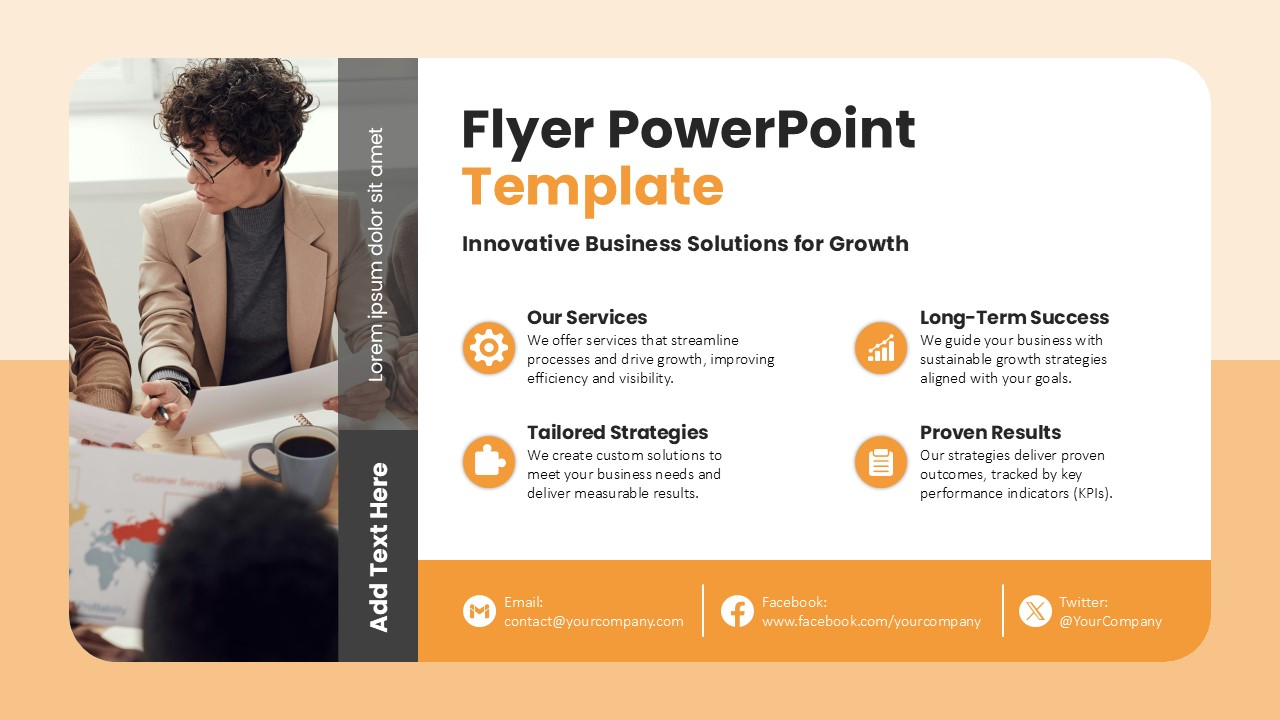
Modern Business Flyer Template for PowerPoint & Google Slides
Advertising
Modern Team Profile Template for PowerPoint & Google Slides
Our Team
Modern Blue Our Team Introduction Template for PowerPoint & Google Slides
Business
Modern Team Introduction Template for PowerPoint & Google Slides
Our Team
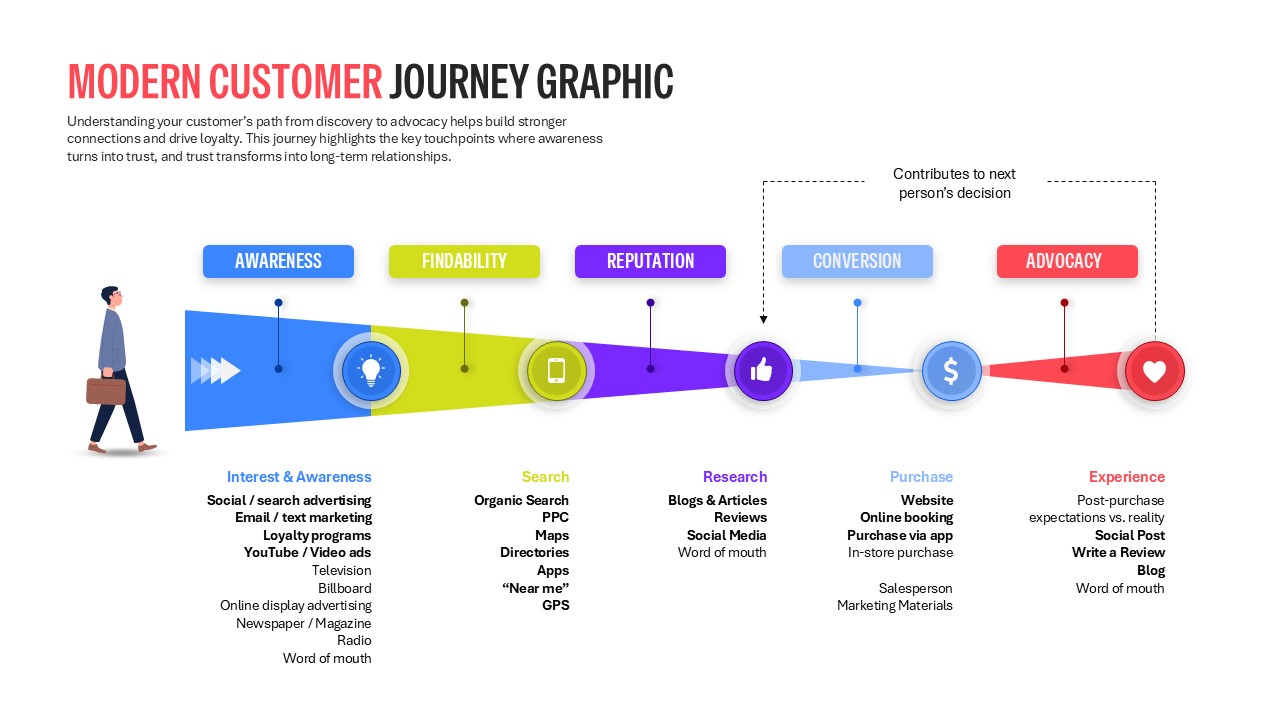
Modern Customer Journey Graphic Funnel Template for PowerPoint & Google Slides
Customer Journey