Twitter Social Media Infographic Template for PowerPoint & Google Slides
Description
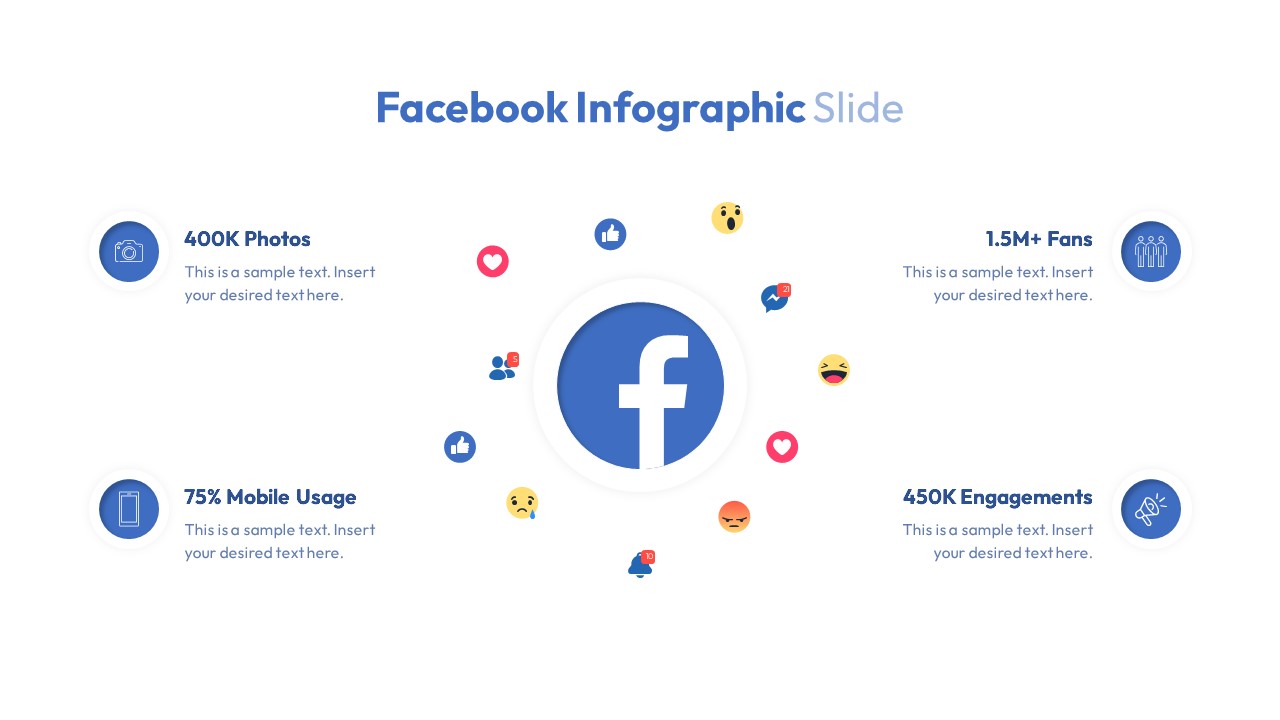
Leverage this Twitter infographic slide to visualize six critical social media metrics using a structured radial layout anchored by a smartphone illustration and a prominent Twitter icon. Six circular data points are evenly distributed around the icon—each highlighted by a glowing blue gradient ring and flat iconography representing user count, engagement, mobile usage, likes, video views, and connections. Crisp headings and placeholder text ensure clarity and maintain audience focus, while the neutral white background and subtle drop shadows enhance legibility and lend a polished, professional aesthetic.
This fully editable template in PowerPoint and Google Slides features organized layer structures, intuitive text and icon placeholders, and vector-based elements that maintain full resolution at any scale. Easily replace each flat icon with custom visuals, adjust the glowing ring color to match corporate branding, or modify slide layout to accommodate additional data points. Master slide integration ensures consistency across presentations and simplifies mass updates, enabling teams to collaborate remotely without compromising design integrity.
Ideal for social media analytics presentations, executive dashboards, and marketing performance reports, this infographic helps presenters communicate complex data in an engaging, easily digestible format. Use the radial arrangement to highlight metric relationships, illustrate growth trends, or compare audience segments. The balanced composition directs viewer attention sequentially, making it easy to walk stakeholders through each data point.
Beyond Twitter metrics, repurpose this graphic framework for any data-driven narrative: display customer satisfaction scores, project KPIs, sales performance benchmarks, or product feature adoptions. Simply update labels, icons, and data values to transform this slide into a versatile asset for boardroom briefings, client workshops, or team meetings. With full compatibility across devices, this slide ensures your insights look flawless in any collaborative environment.
Who is it for
Social media managers, digital marketers, and analytics teams will find this slide invaluable for presenting key Twitter metrics in stakeholder meetings, executive briefings, or performance reviews.
Other Uses
Adapt this radial layout to showcase customer satisfaction survey results, project KPIs, sales dashboards, or product adoption rates by updating the labels and icons.
Login to download this file


