Sustainability Goals and Targets Chart Template for PowerPoint & Google Slides
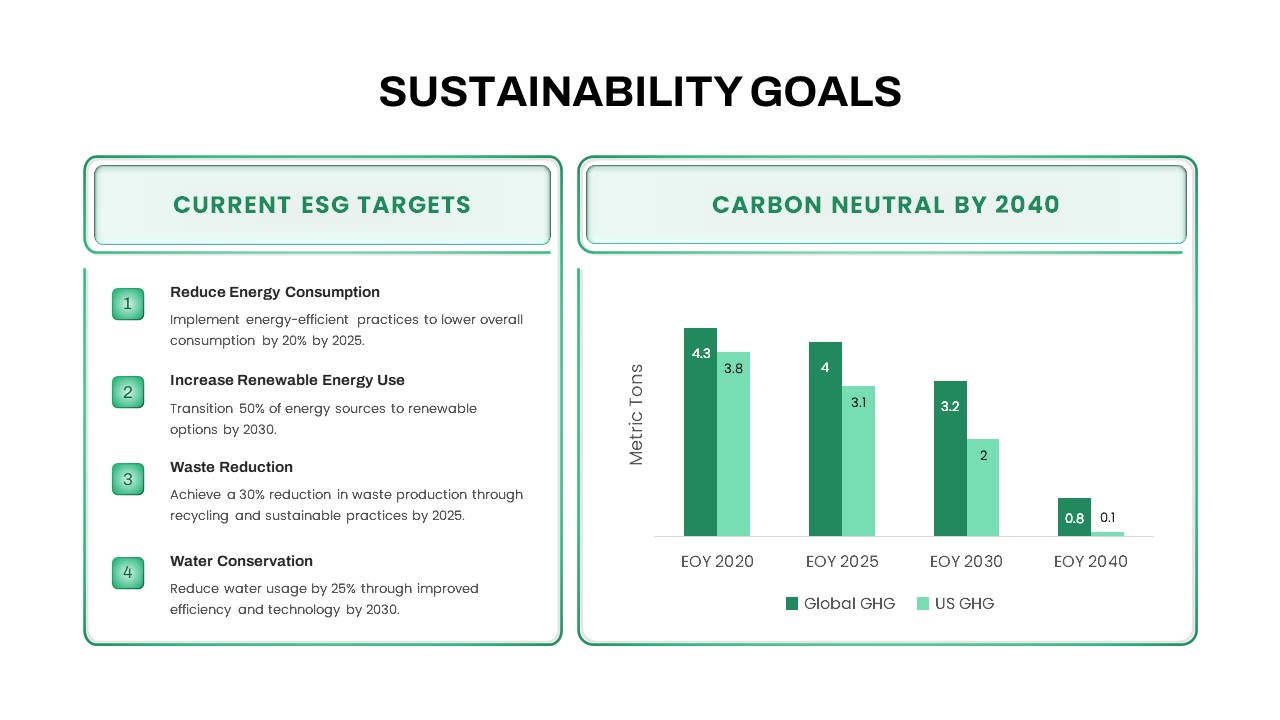
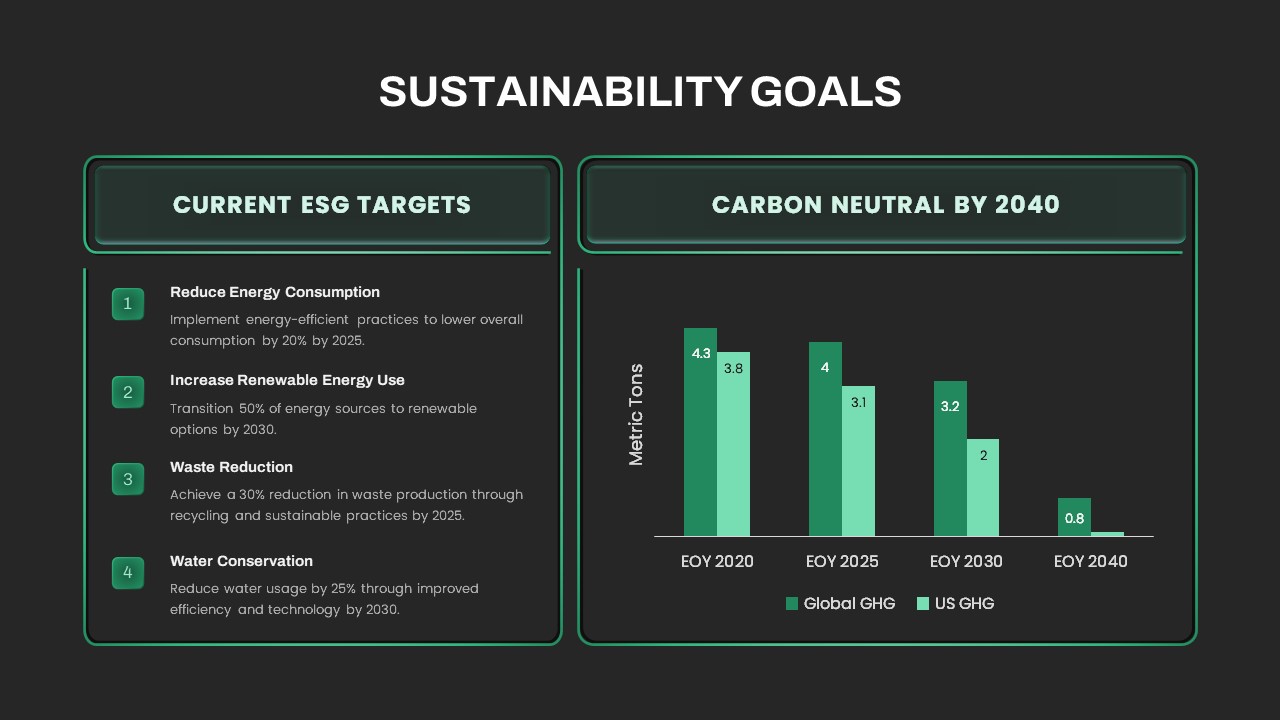
This Sustainability Goals and Targets slide template combines a dual-panel layout to effectively communicate current ESG objectives alongside long-term carbon neutrality projections. On the left, a concise list of four numbered targets—reducing energy consumption by 20% by 2025, increasing renewable energy use to 50% by 2030, achieving a 30% waste reduction by 2025, and improving water conservation by 25% by 2030—is displayed within a bordered container with a subtle green header and supporting body text. On the right, a mirrored panel highlights a bar chart tracking global and US greenhouse gas emissions from end-of-year 2020 through projected reductions by 2040. Dark green bars for global GHG and lighter green for US GHG ensure clear differentiation, with data labels over each segment and a metric tons axis for immediate readability.
Set against a clean white background, this template employs a consistent grid system, generous white space, and a bold sans-serif headline to guide viewer focus. Both panels feature rounded-corner containers, adjustable border radii, and drop shadows for depth. Master slides and grouped placeholder layers allow you to quickly swap in your actual metrics, modify color swatches, adjust chart scales, or translate header text with minimal clicks. The green accent theme can be customized through theme color controls, and all text blocks, shape outlines, and chart elements are fully editable in PowerPoint and Google Slides.
Additional design options include toggling axis gridlines, enabling entrance animations for sequential panel reveals, and resizing containers to accommodate extra targets or forecast points. Layer naming conventions and clearly labeled objects further streamline editing, so you can restore alignment guides or duplicate panels without breaking layout consistency. Whether presenting to executive boards, sustainability committees, or investor audiences, this slide ensures your ESG strategy and carbon neutrality roadmap are communicated with clarity, professionalism, and visual impact.
Who is it for
Sustainability officers, ESG consultants, corporate strategy teams, and investor relations managers who need to present clear ESG targets and carbon neutrality plans to executives and stakeholders.
Other Uses
Repurpose this slide for environmental audit summaries, CSR workshop overviews, stakeholder update meetings, and year-end sustainability performance reviews.
Login to download this file

Item ID
SB04270
Related Templates

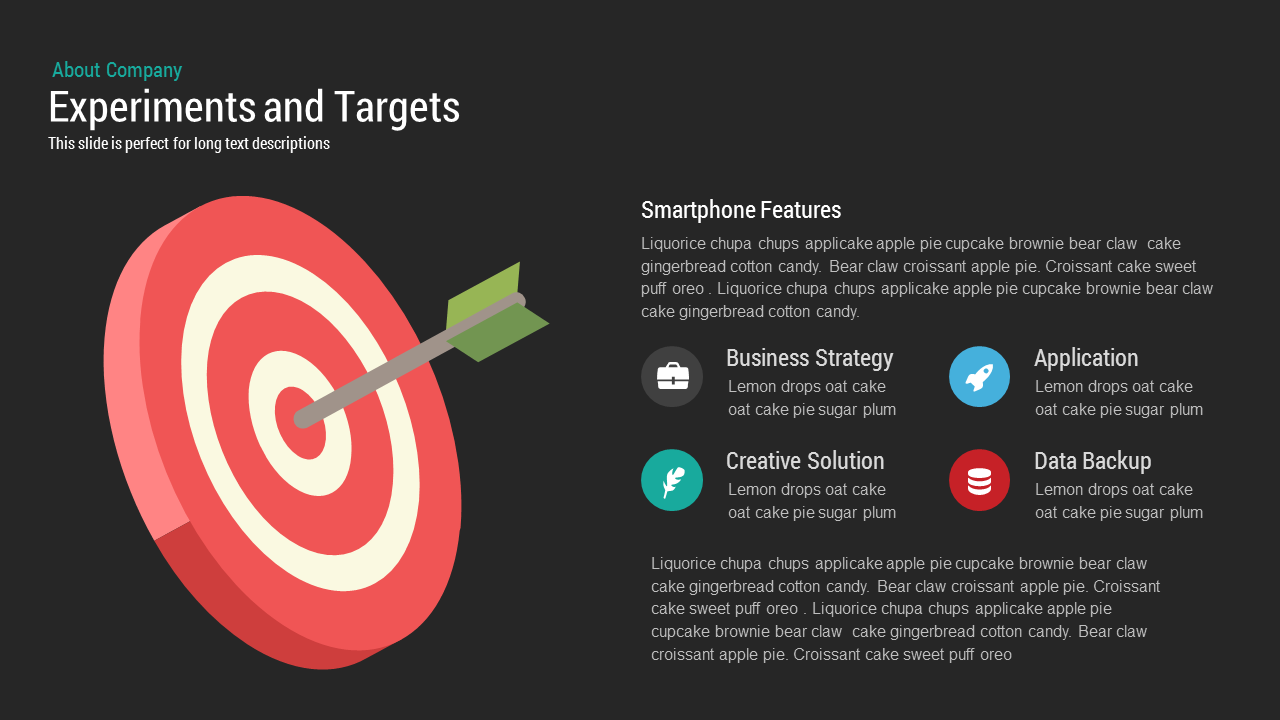
Experiments & Targets template for PowerPoint & Google Slides
Business

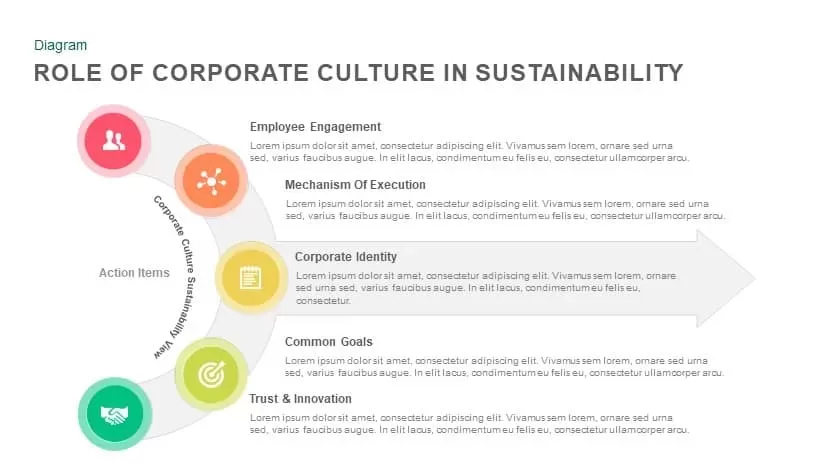
Corporate Culture in Sustainability Template for PowerPoint & Google Slides
Process
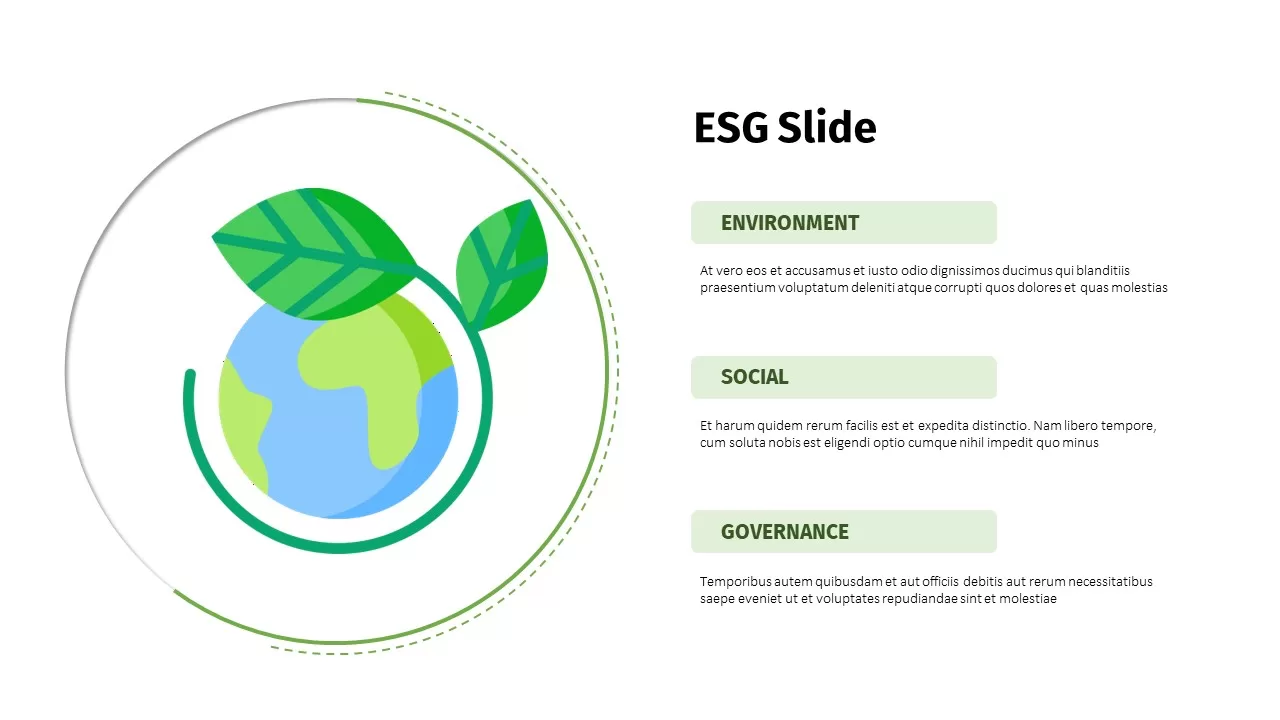
ESG Sustainability Overview Slide Template for PowerPoint & Google Slides
Risk Management
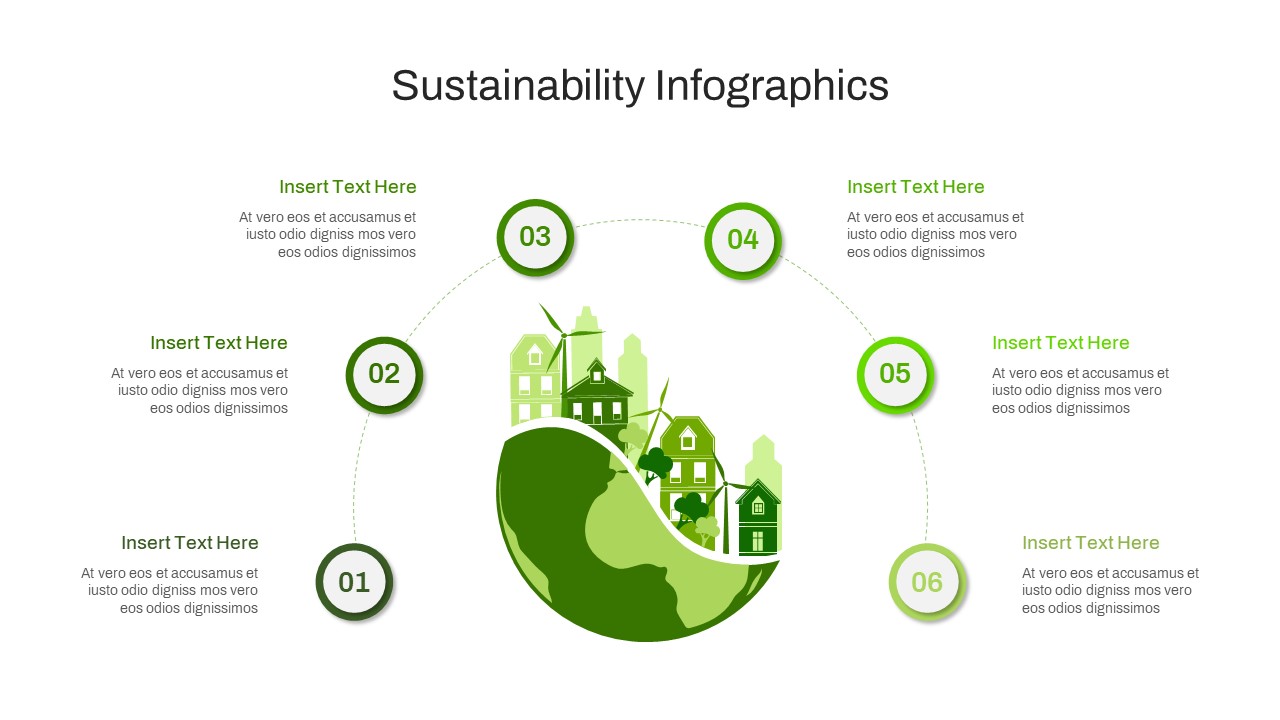
Circular Sustainability Infographic Template for PowerPoint & Google Slides
Process
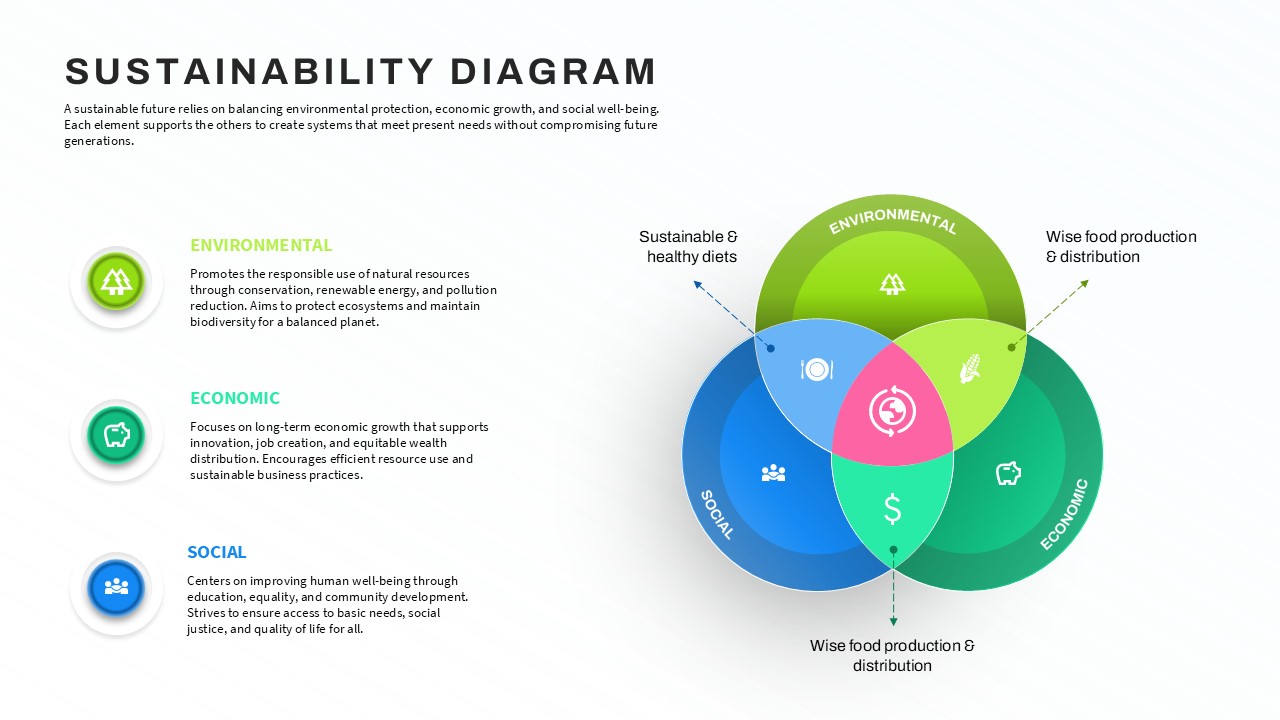
Sustainability Diagram Slide Template for PowerPoint & Google Slides
Business Strategy
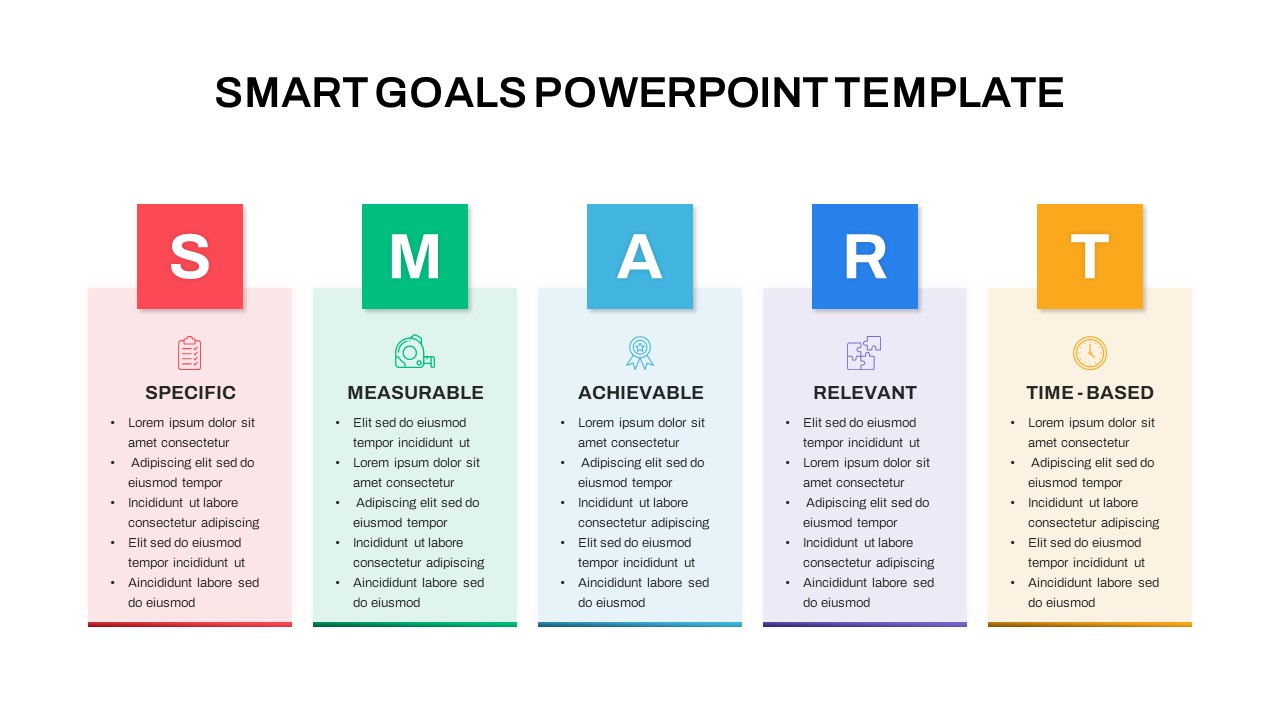
SMART Goals PowerPoint template for PowerPoint & Google Slides
Goals

Reach On Top Mountain Goals Slide Template for PowerPoint & Google Slides
Goals
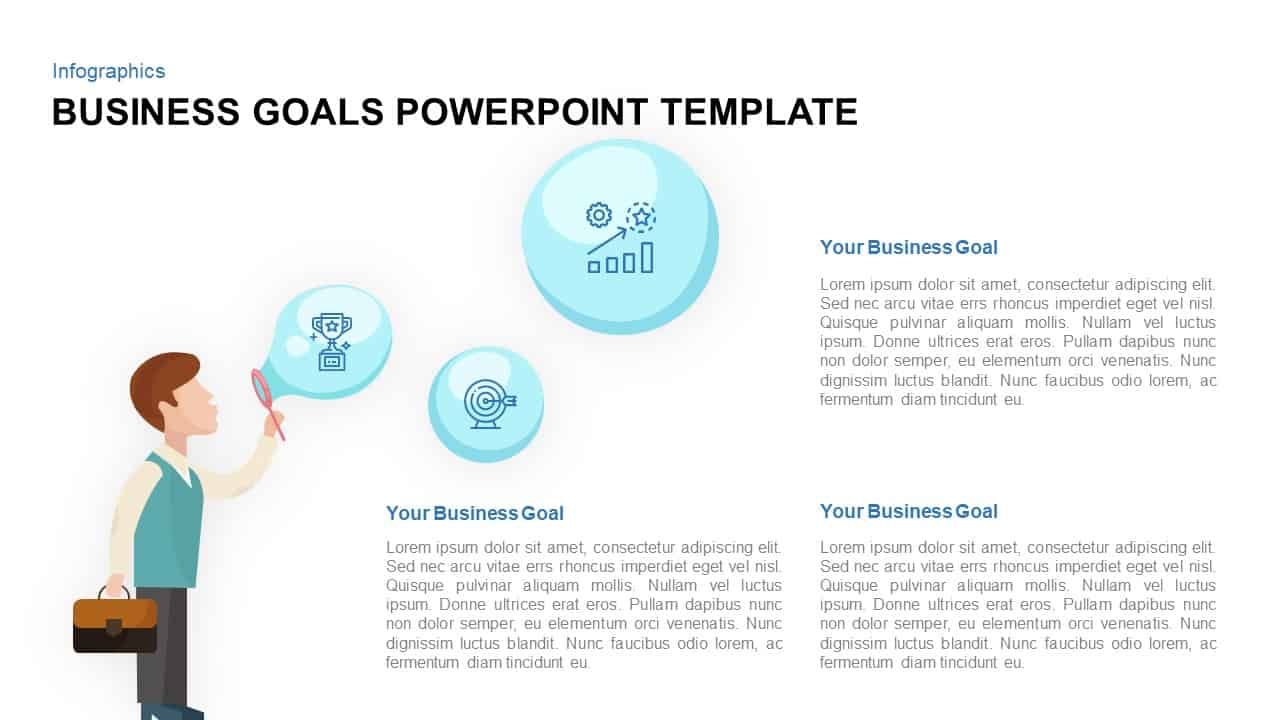
Business Goals Bubble Infographic Template for PowerPoint & Google Slides
Infographics
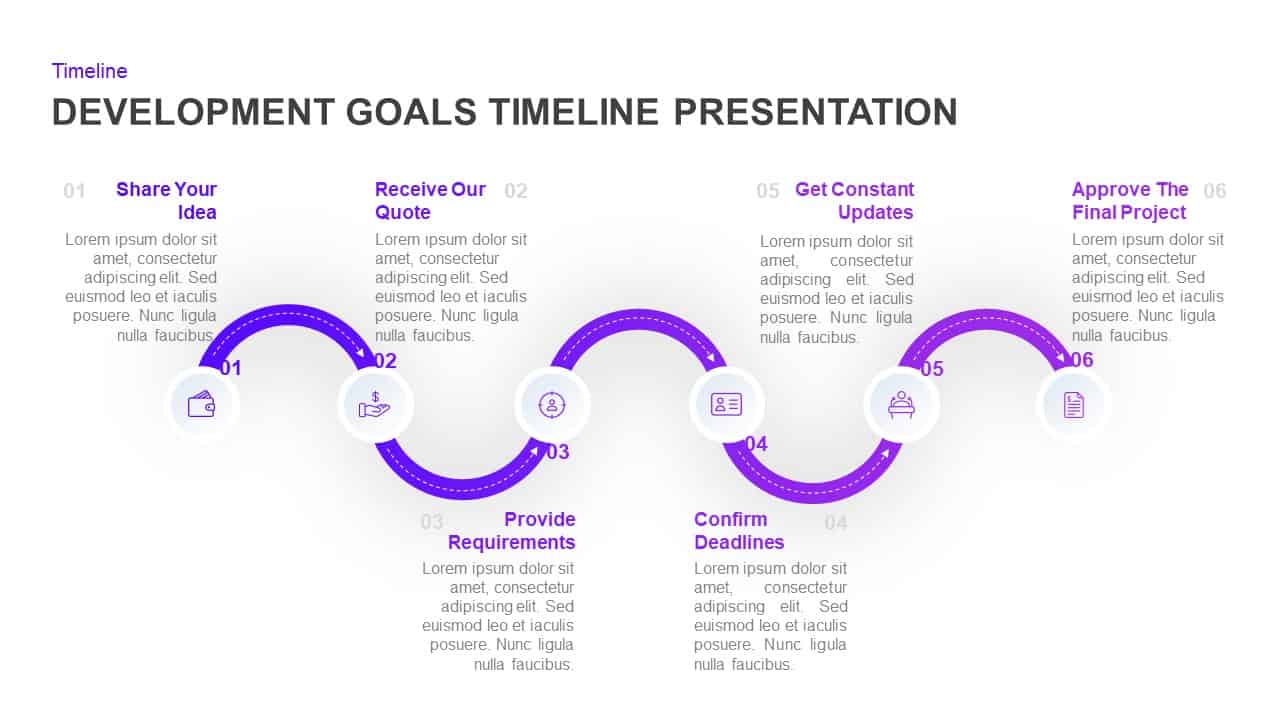
Development Goals Timeline Process Template for PowerPoint & Google Slides
Goals
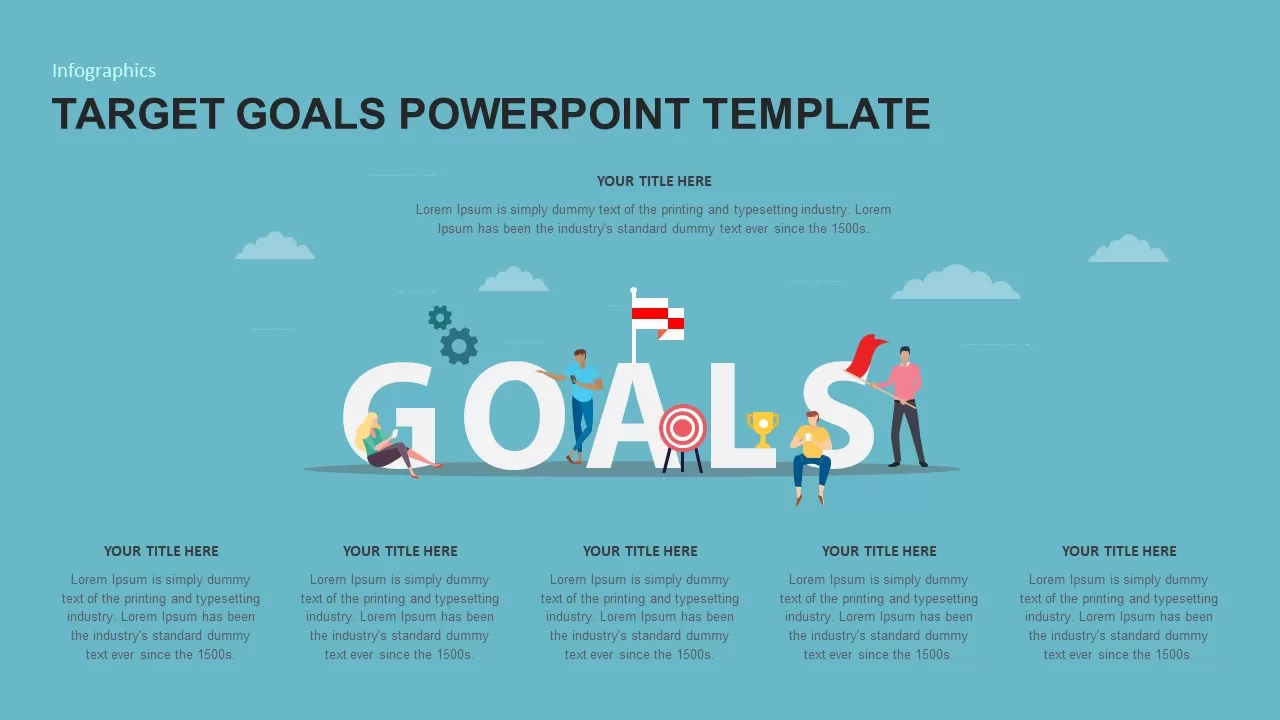
Target Goals Infographic Slide Template for PowerPoint & Google Slides
Goals
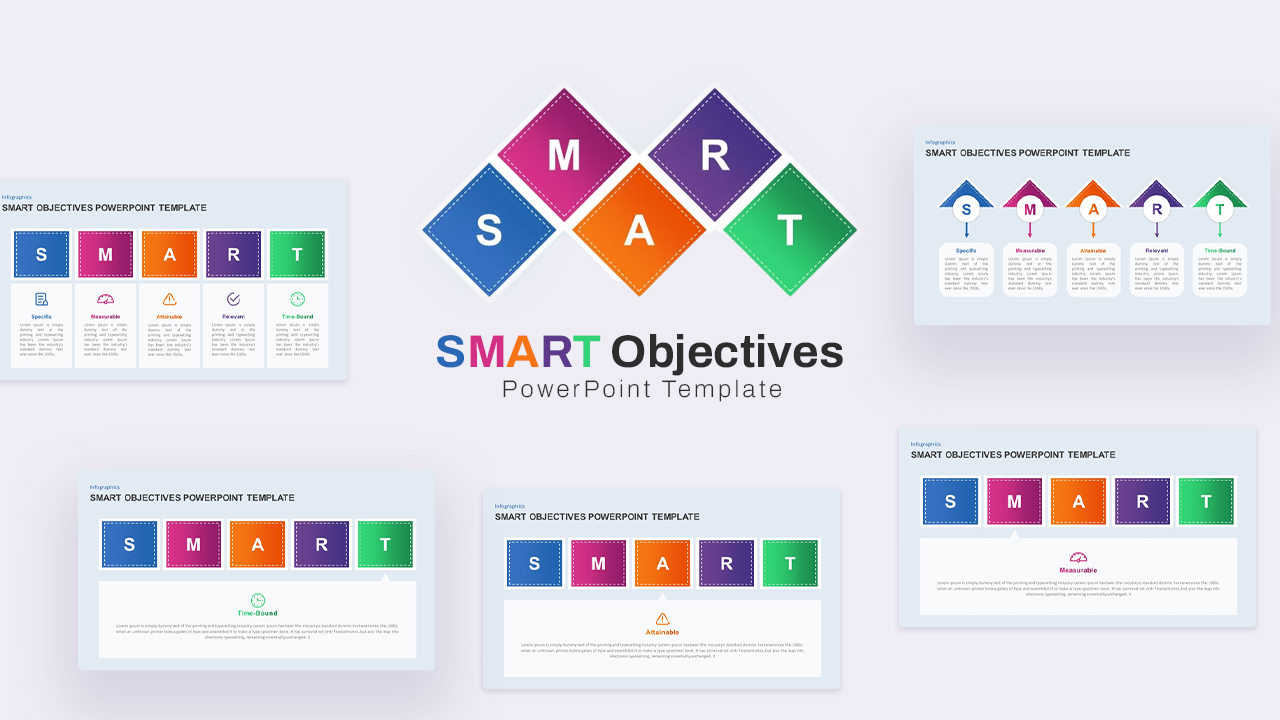
SMART Objectives – 5 Goals Framework Template for PowerPoint & Google Slides
Goals
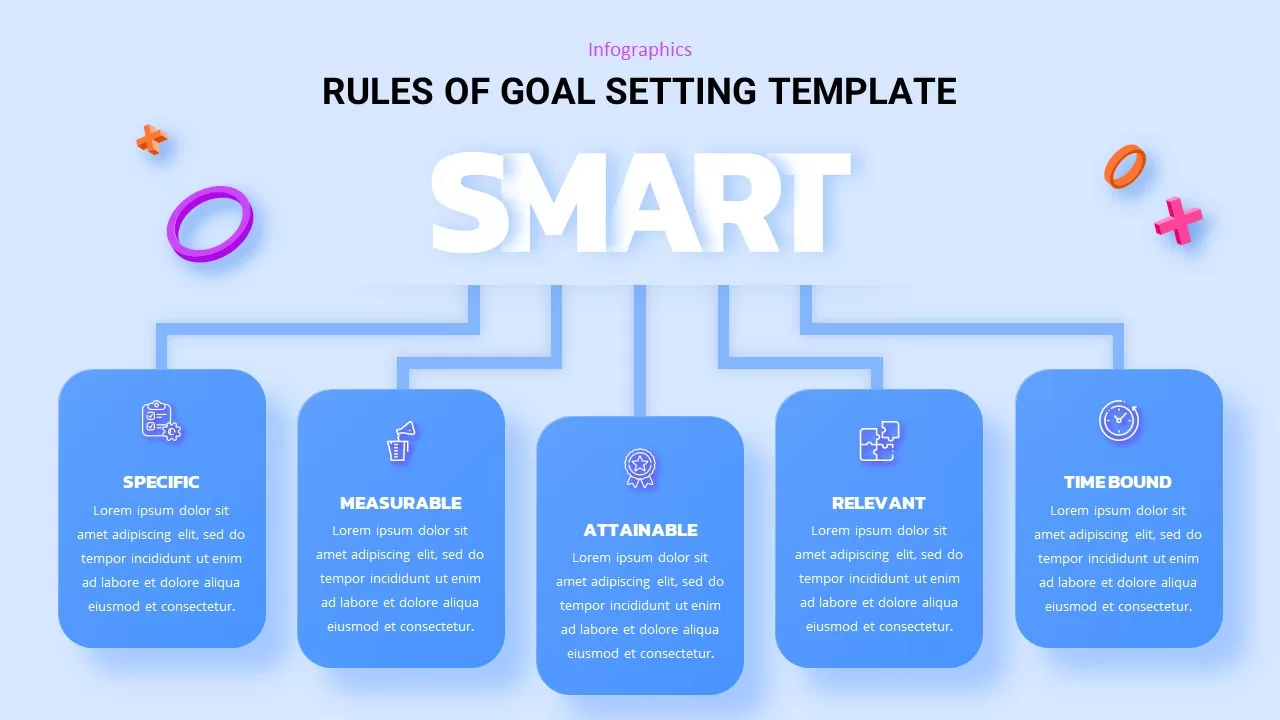
SMART Goals Framework Rules Template for PowerPoint & Google Slides
Business
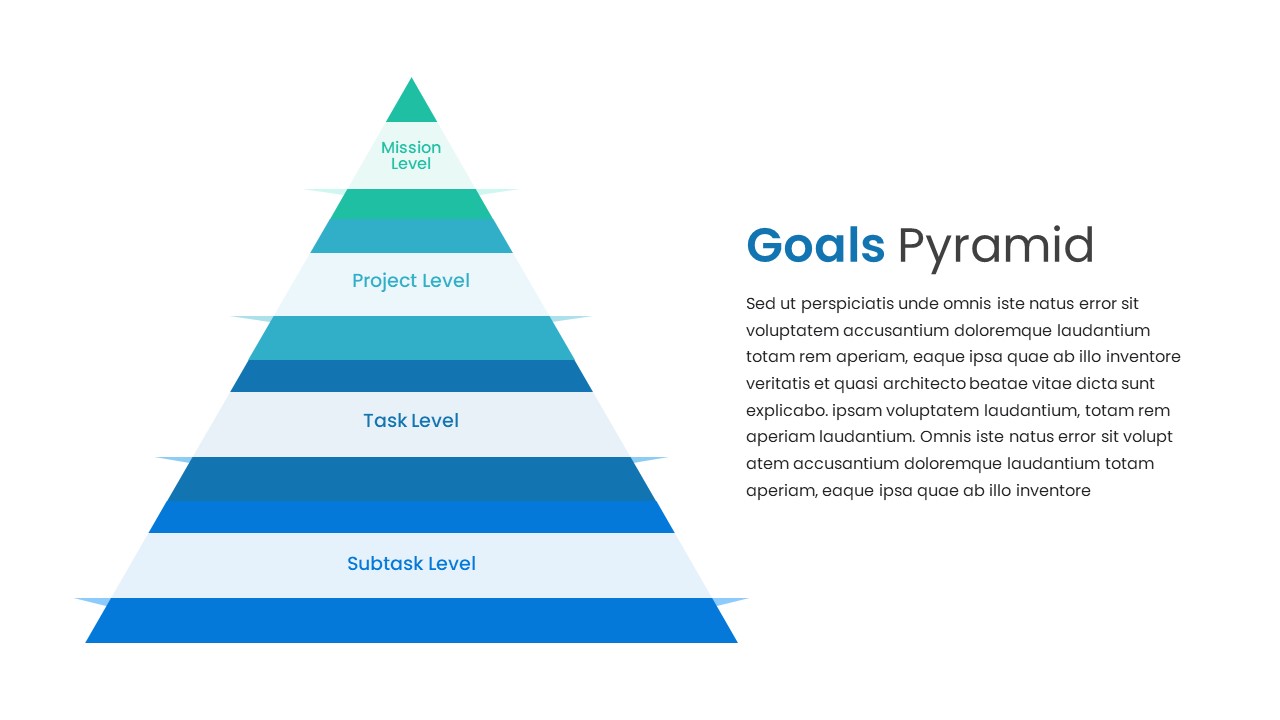
Goals Pyramid Hierarchy Slide Design Template for PowerPoint & Google Slides
Pyramid
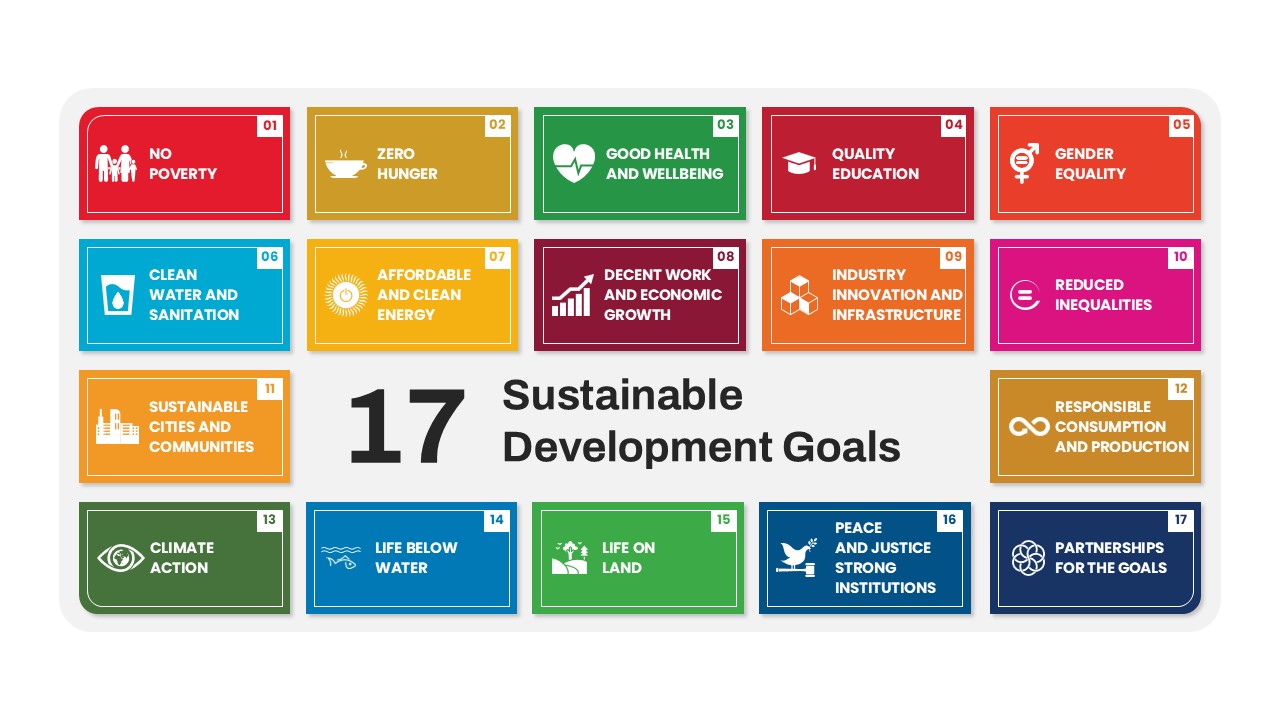
17 Sustainable Development Goals List Template for PowerPoint & Google Slides
Goals
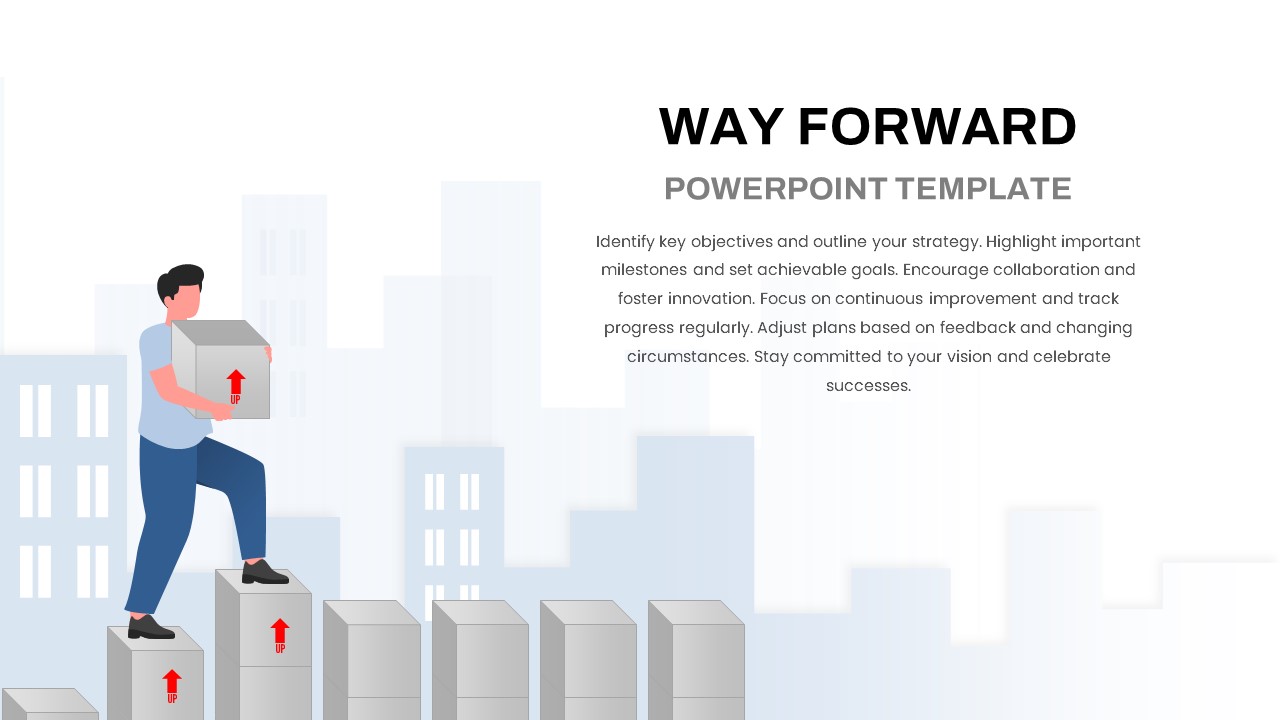
Way Forward Strategic Roadmap & Goals Template for PowerPoint & Google Slides
Goals
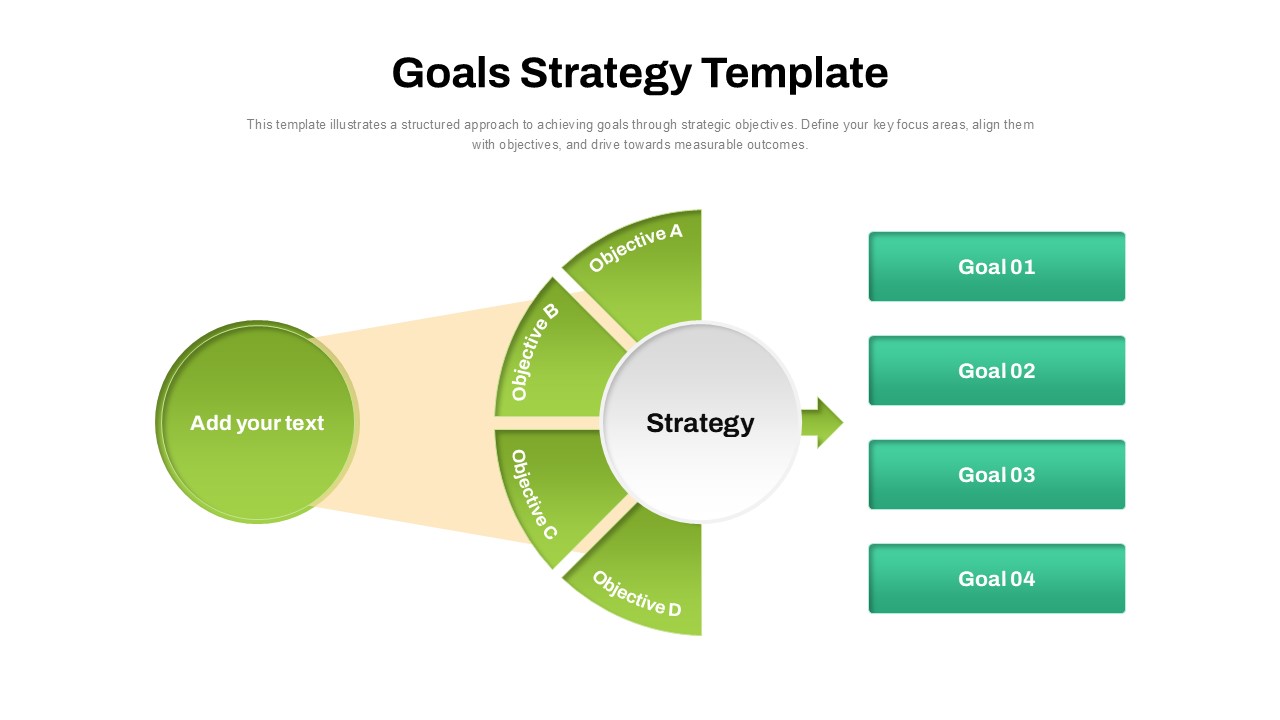
Goals Strategy Semicircle Diagram Template for PowerPoint & Google Slides
Process
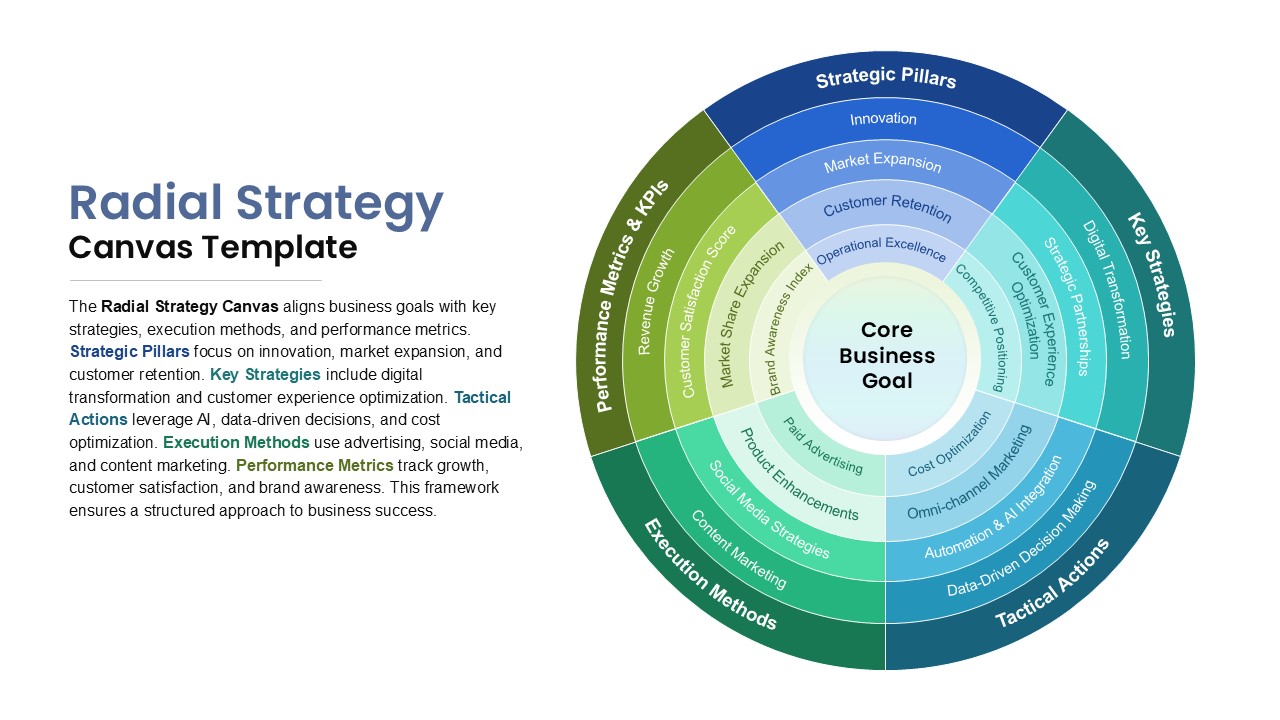
Radial Strategy Canvas for Goals Template for PowerPoint & Google Slides
Circular
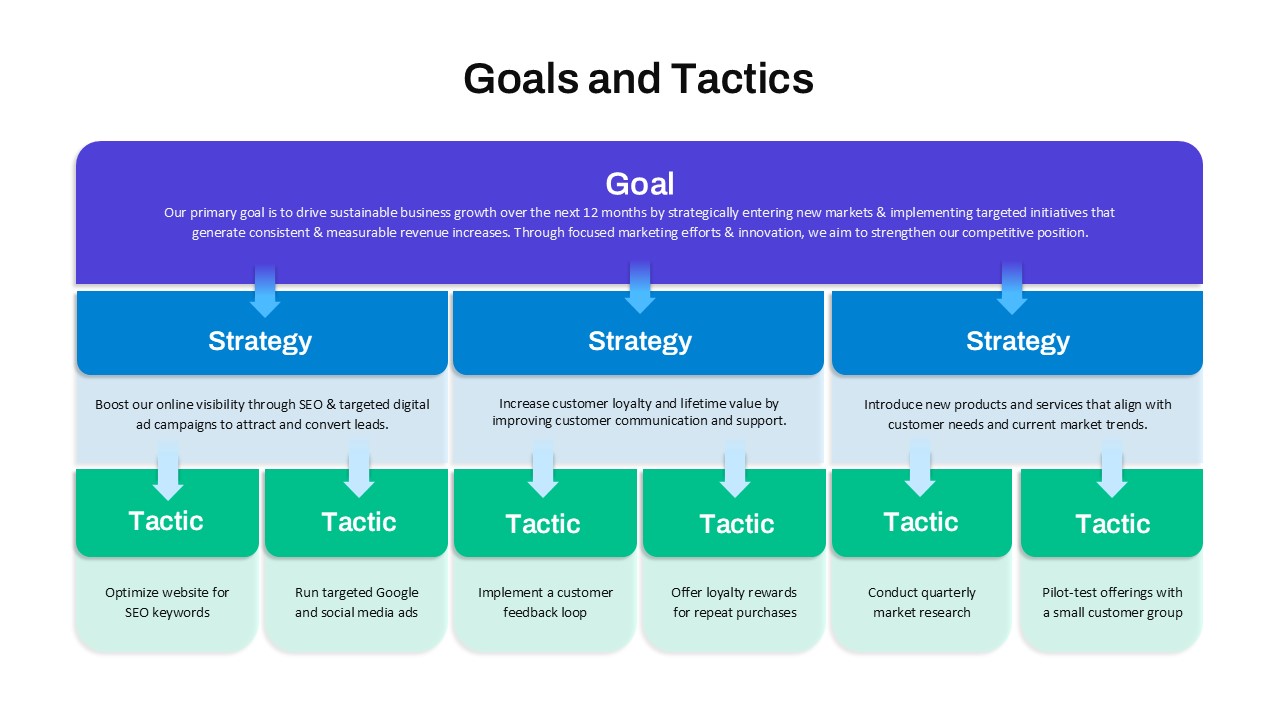
Goals & Tactics Alignment Template for PowerPoint & Google Slides
Business Plan
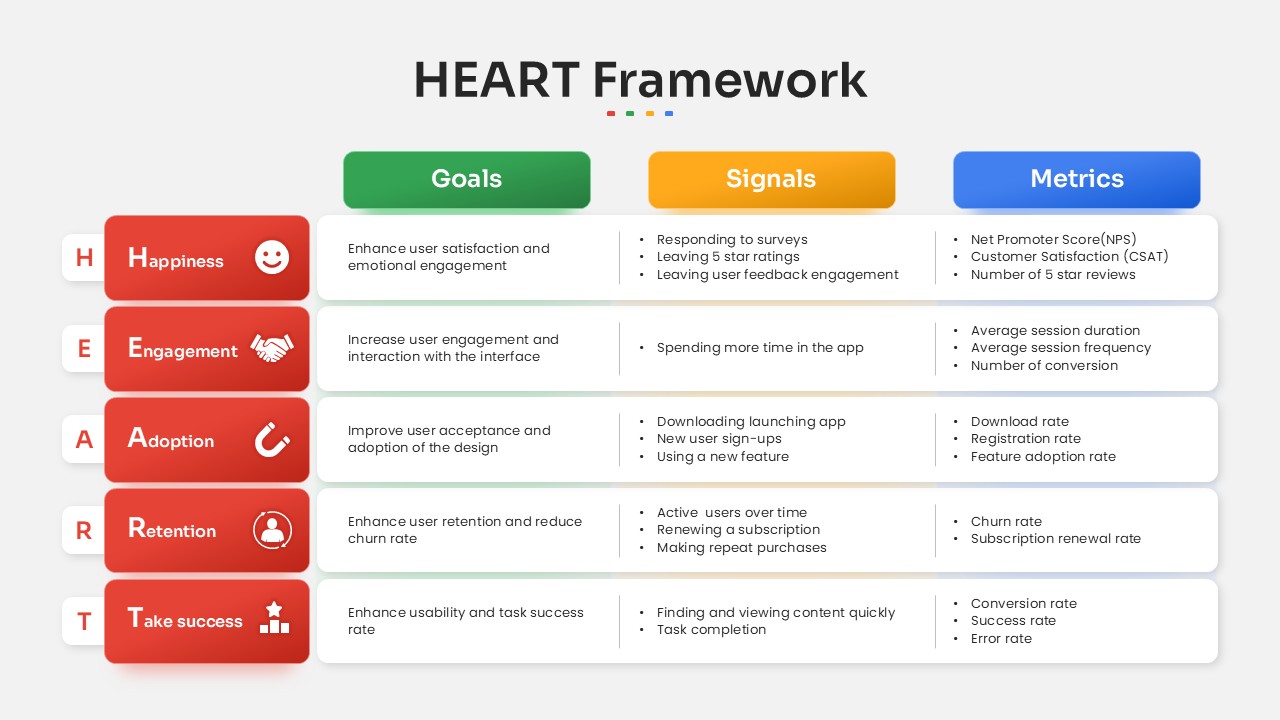
HEART Framework Goals, Signals & Metrics Template for PowerPoint & Google Slides
Process
Team Goals Tracker Template for PowerPoint & Google Slides
Employee Performance
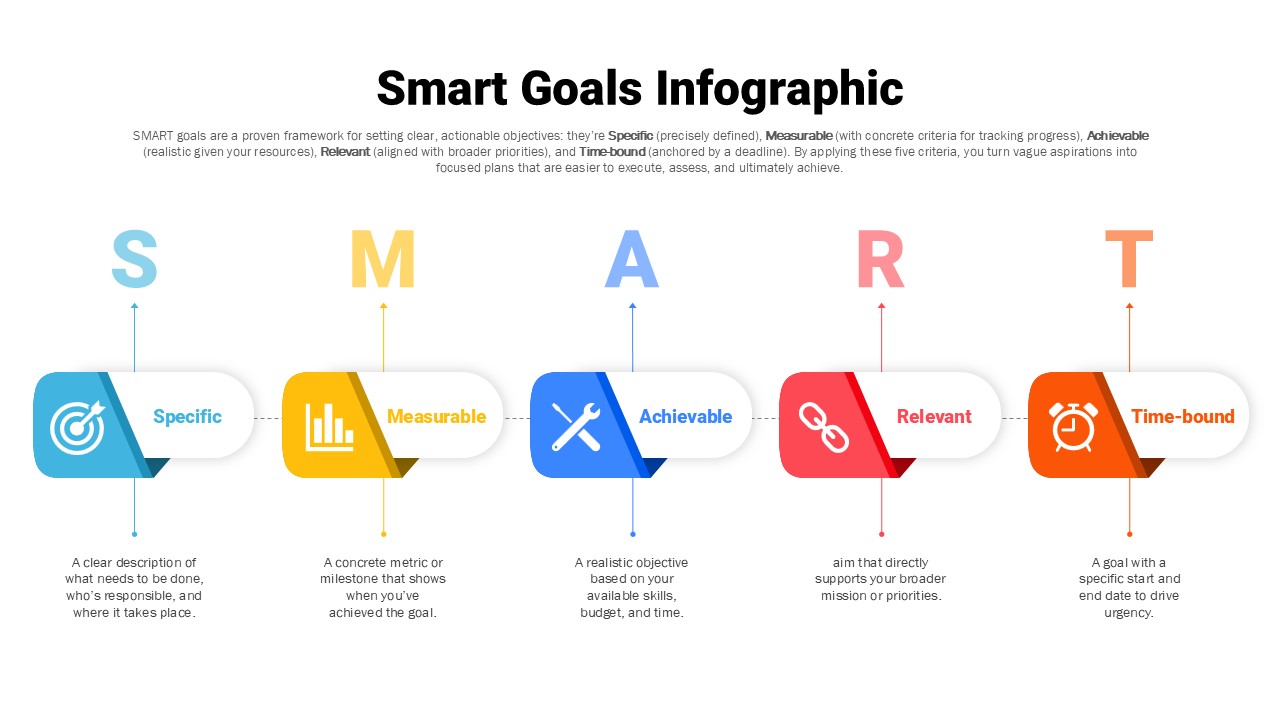
SMART Goals Infographic Template for PowerPoint & Google Slides
Goals
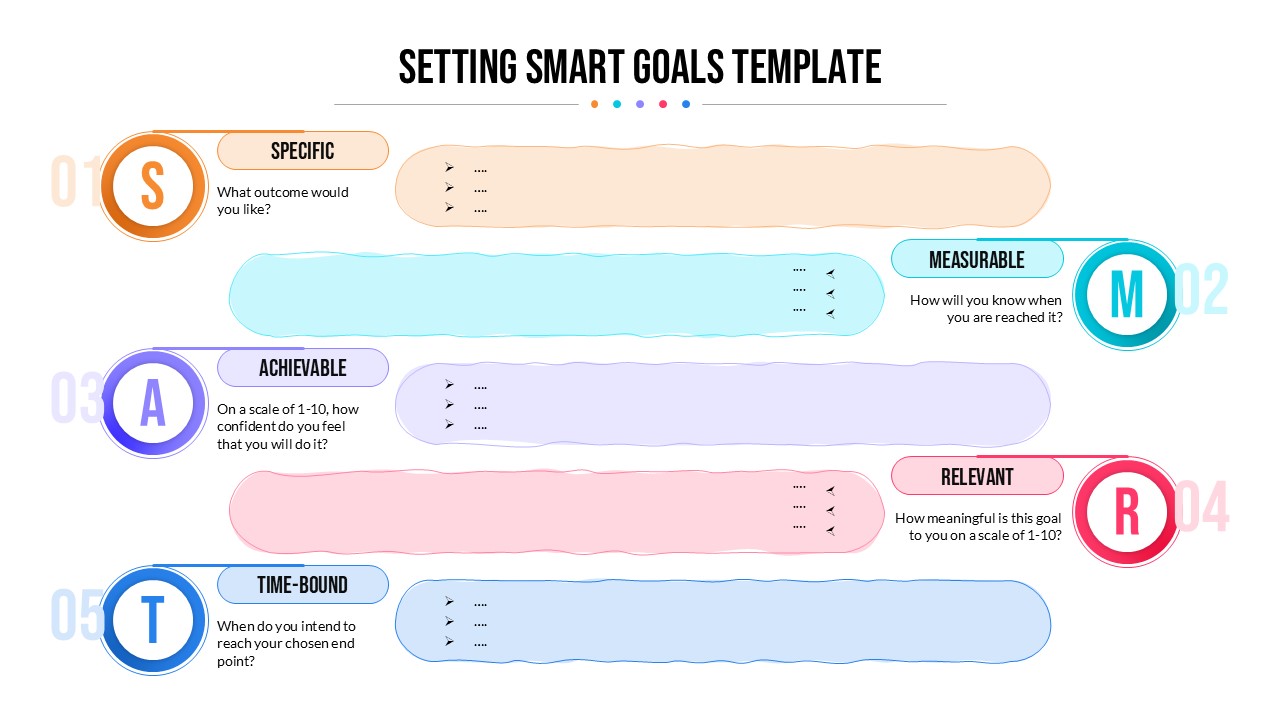
SMART Goals Setting Template for PowerPoint & Google Slides
Goals
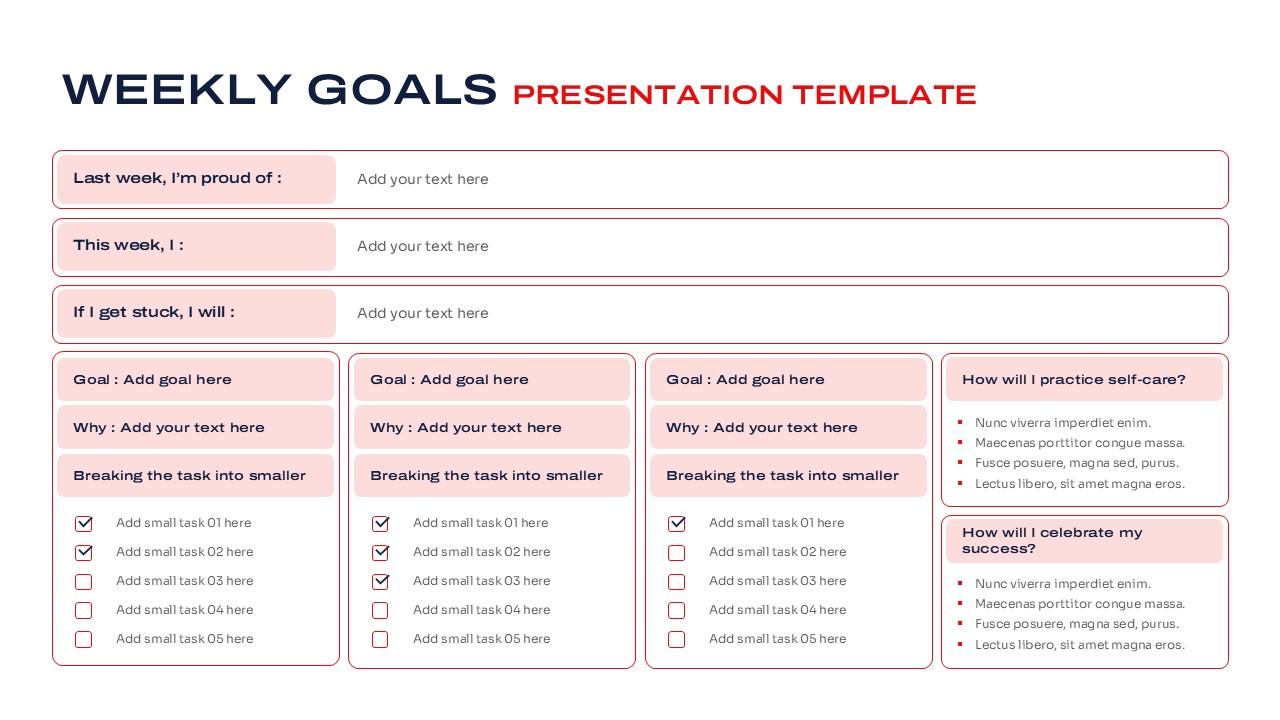
Weekly Goals Planning and Productivity Overview Template for PowerPoint & Google Slides
Goals
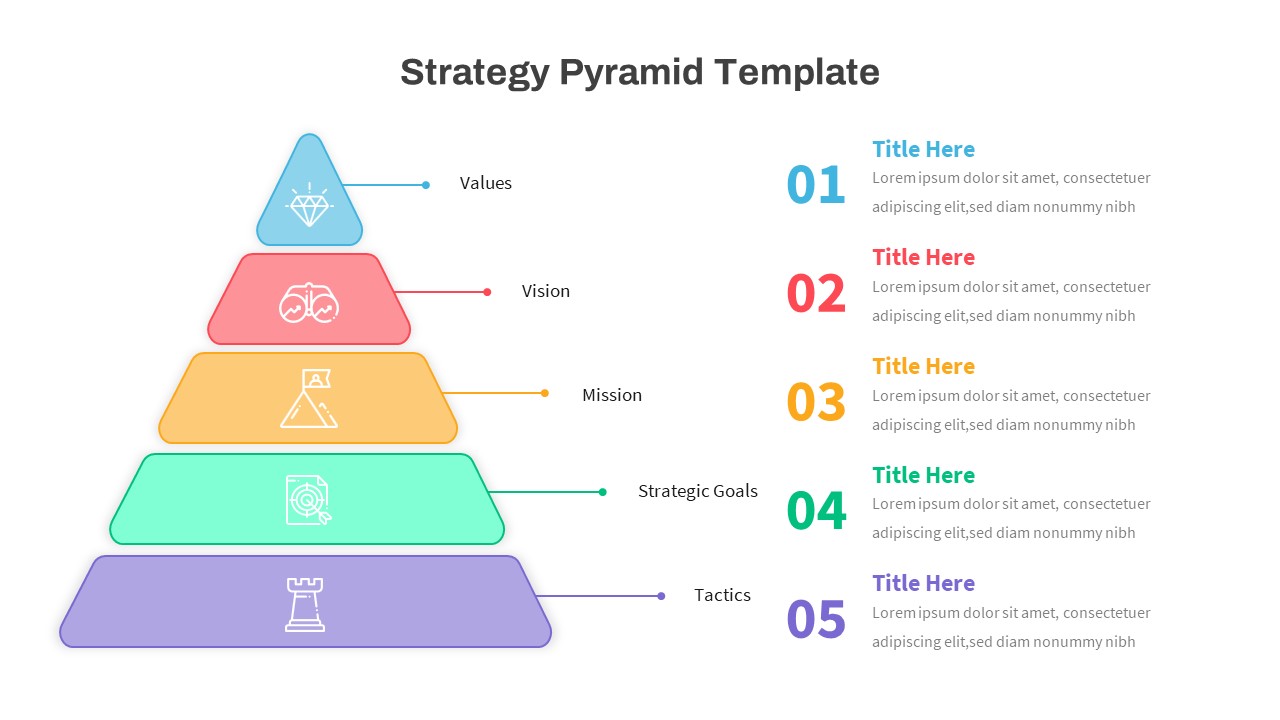
Business Strategy Pyramid with Goals and Tactics for PowerPoint & Google Slides
Pyramid
Quad Chart Infographic Pack of 8 Slides Template for PowerPoint & Google Slides
Comparison Chart
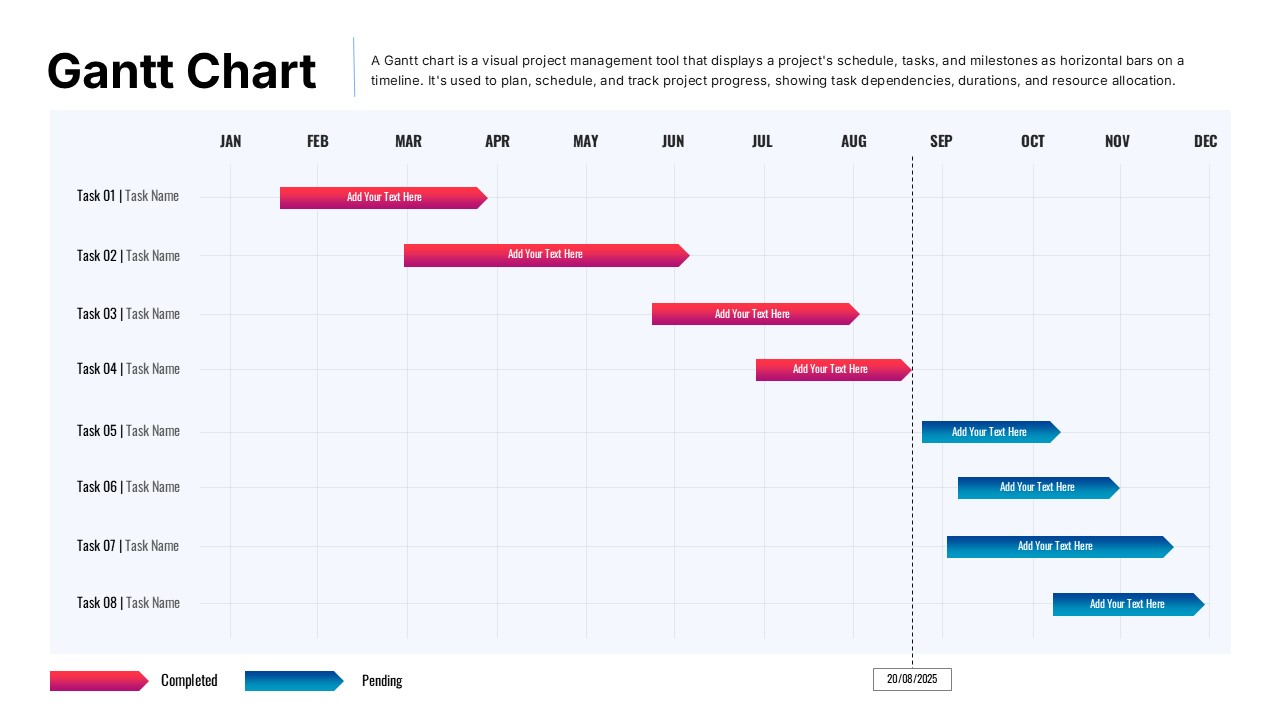
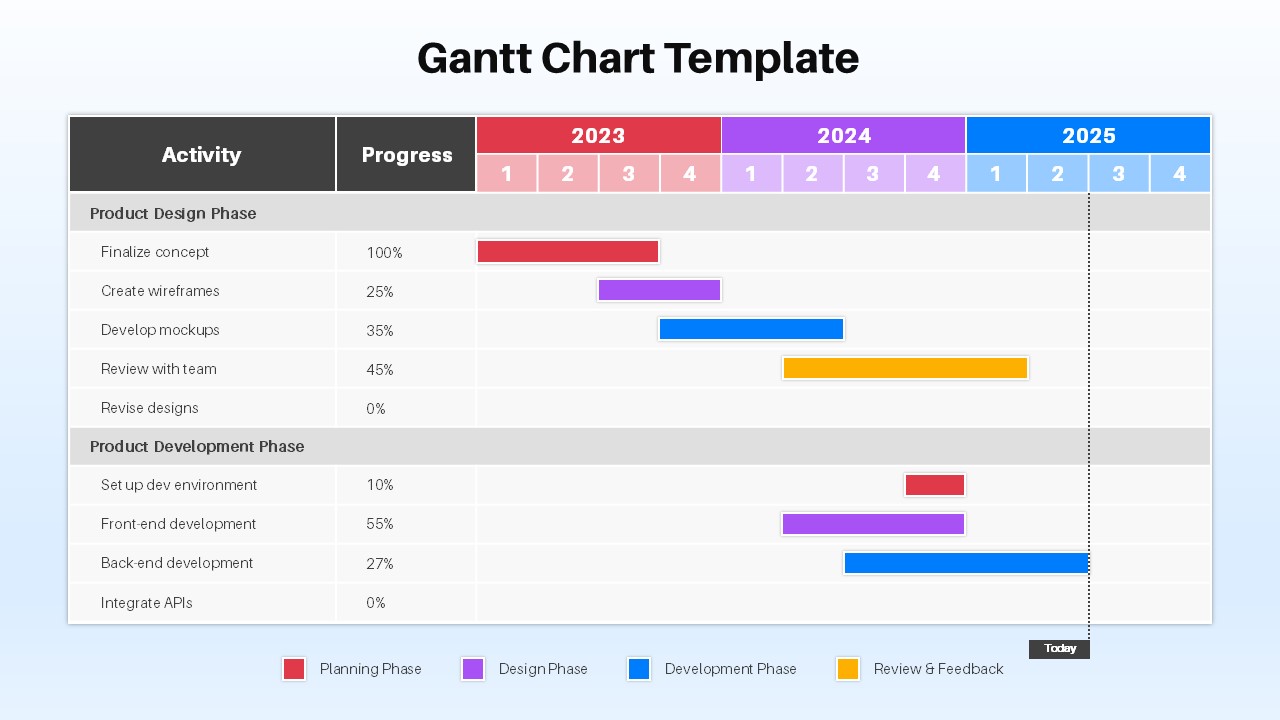
Free Professional Gantt Chart Pack – 4 Slides Template for PowerPoint & Google Slides
Gantt Chart
Free
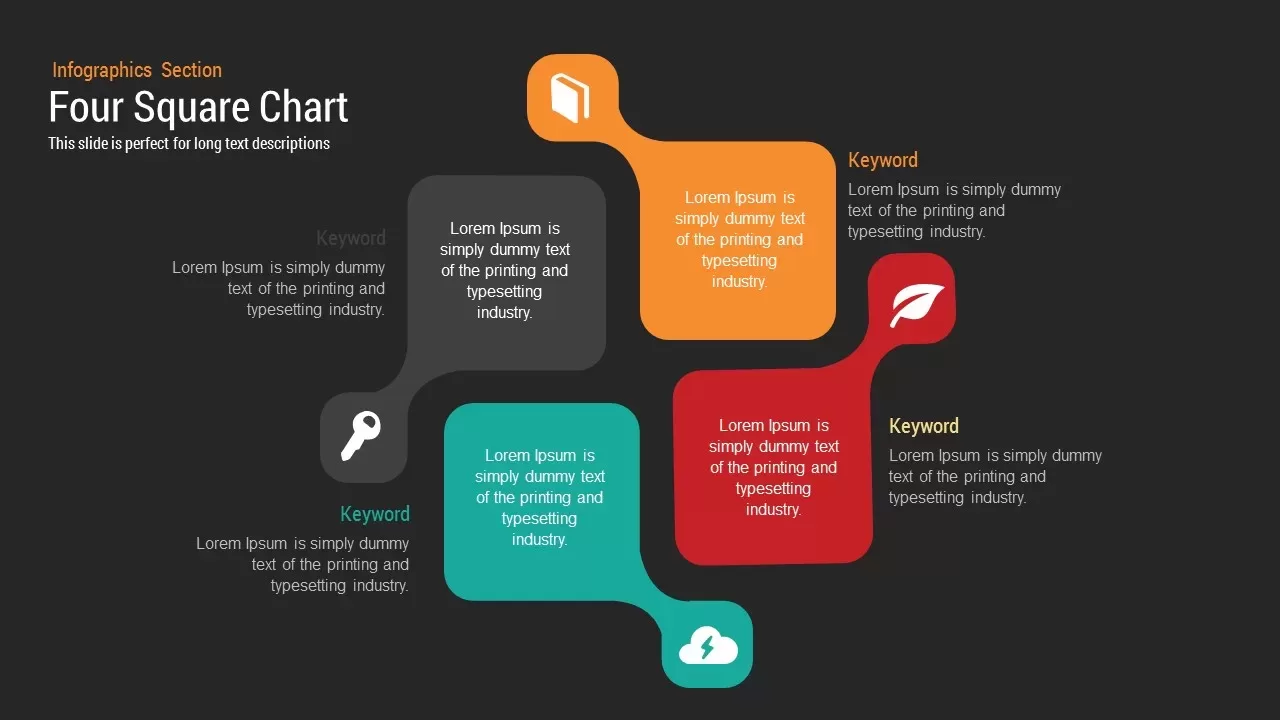
Four Square Chart template for PowerPoint & Google Slides
Charts
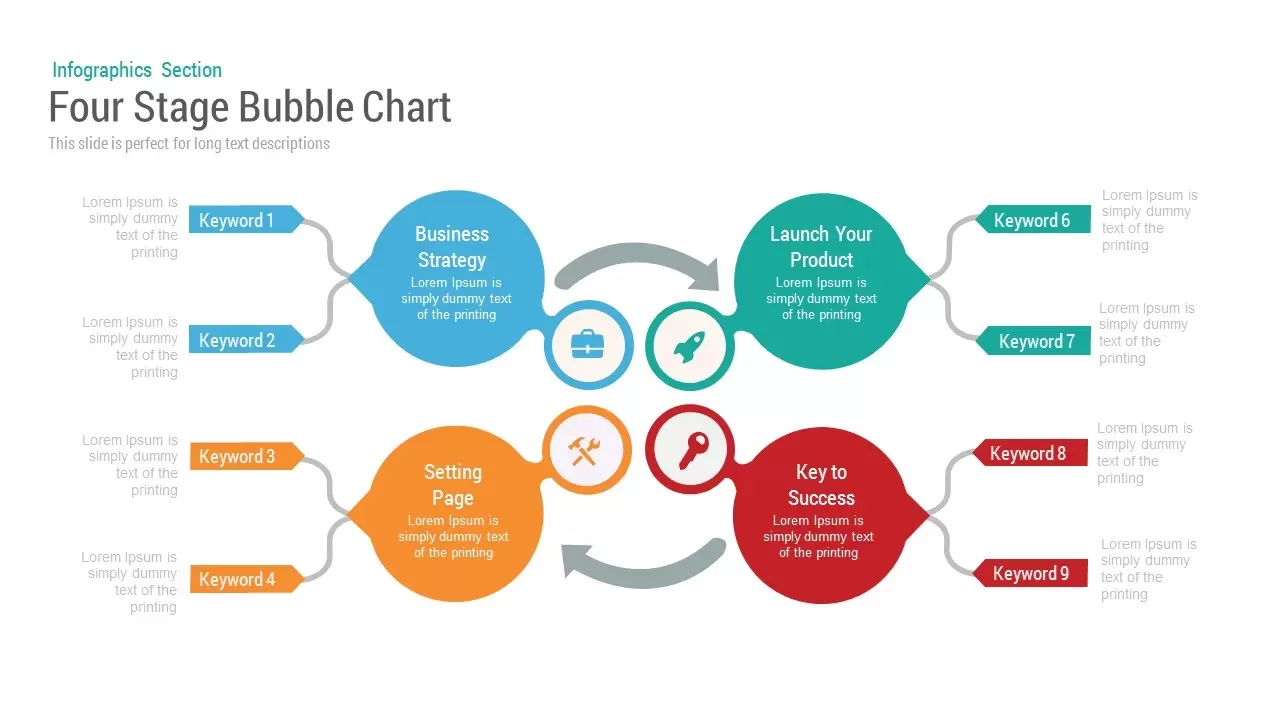
Bubble Chart template for PowerPoint & Google Slides
Charts
Circle Chart Data template for PowerPoint & Google Slides
Pie/Donut

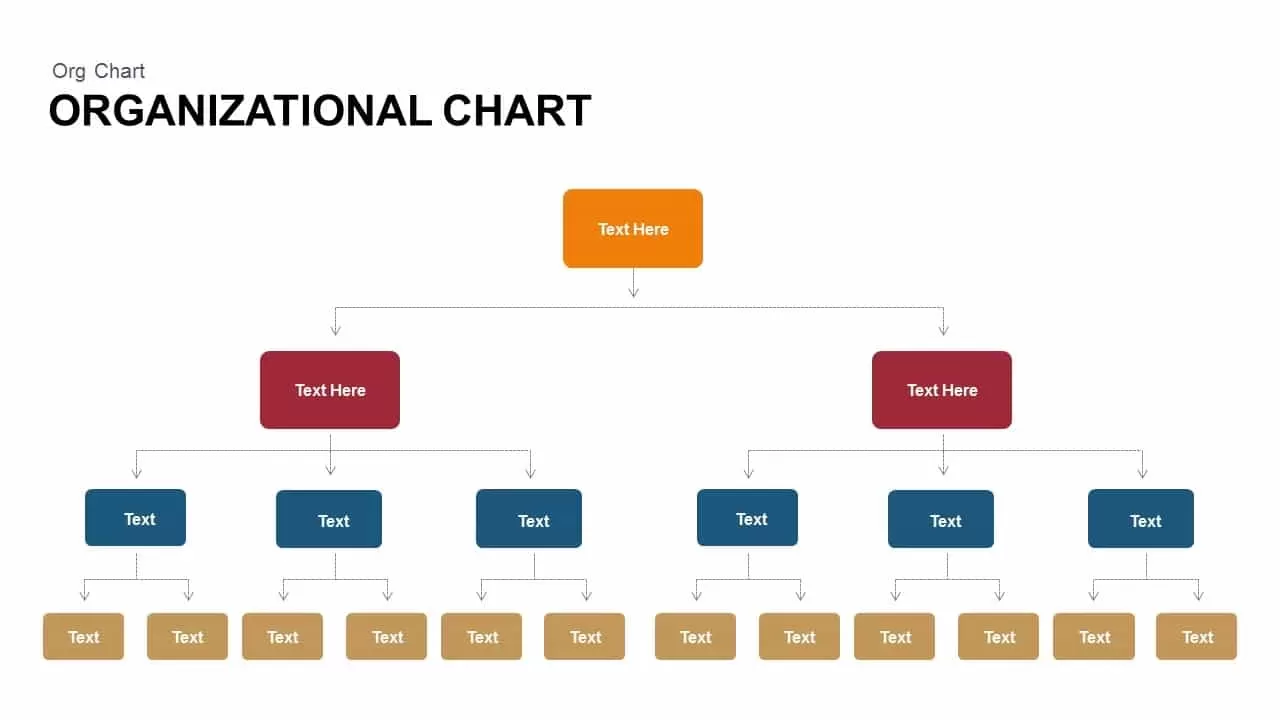
Corporate Organization Chart template for PowerPoint & Google Slides
Org Chart
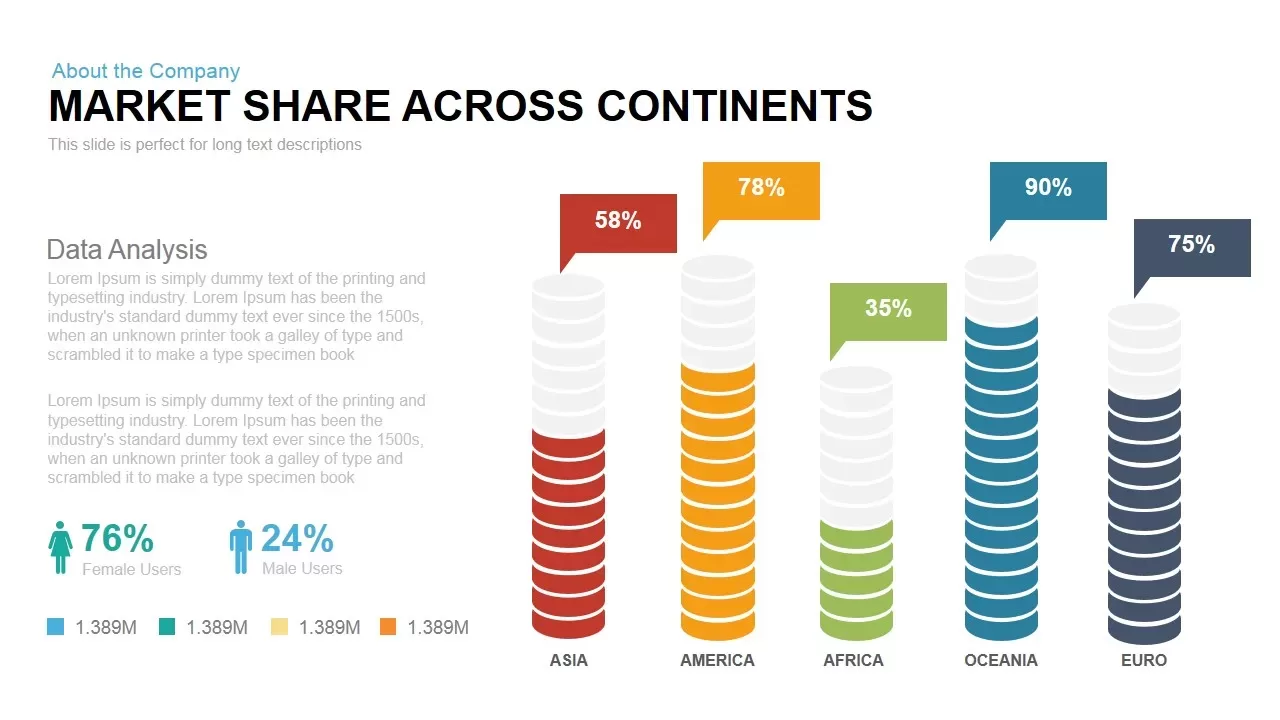
Global Market Share Cylinder Chart Template for PowerPoint & Google Slides
Bar/Column
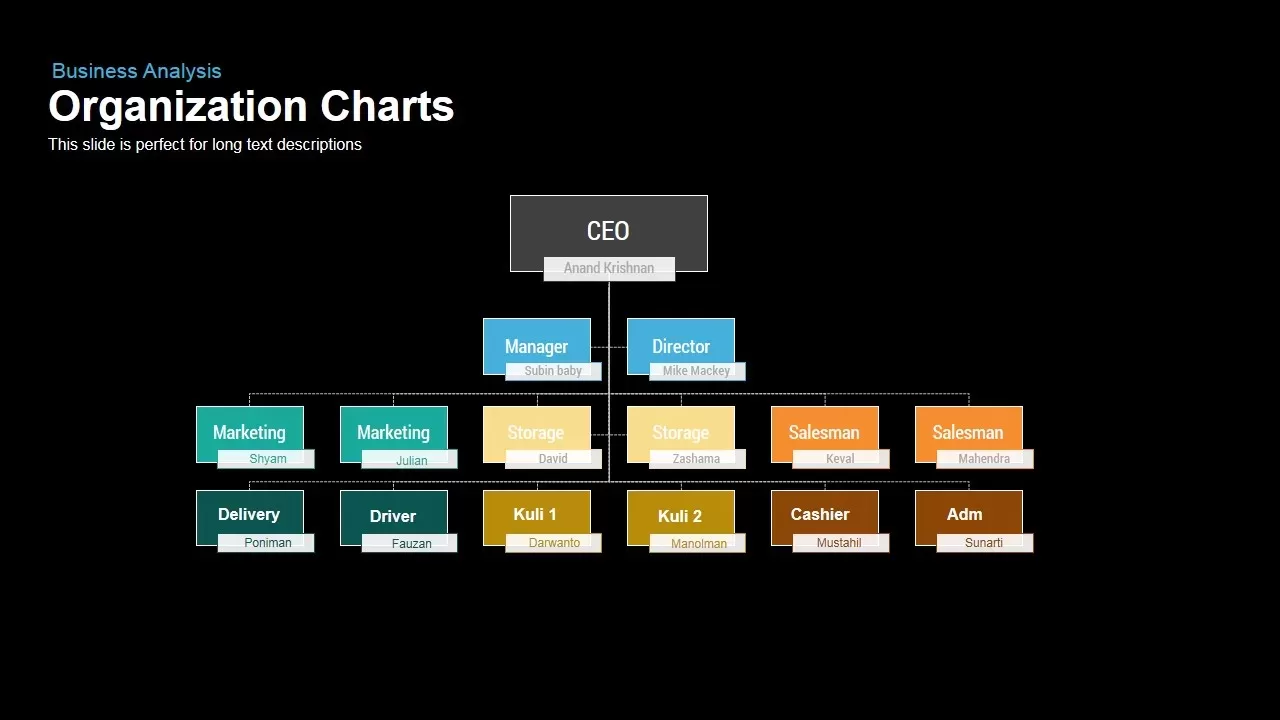
Business Organization Chart Hierarchy Template for PowerPoint & Google Slides
Org Chart
3D Bar Chart Data Infographics Template for PowerPoint & Google Slides
Bar/Column
Creative Dynamic Gantt Chart Timeline Template for PowerPoint & Google Slides
Timeline
Creative Bar Chart template for PowerPoint & Google Slides
Charts
Simple Organizational Chart Infographic Template for PowerPoint & Google Slides
Org Chart
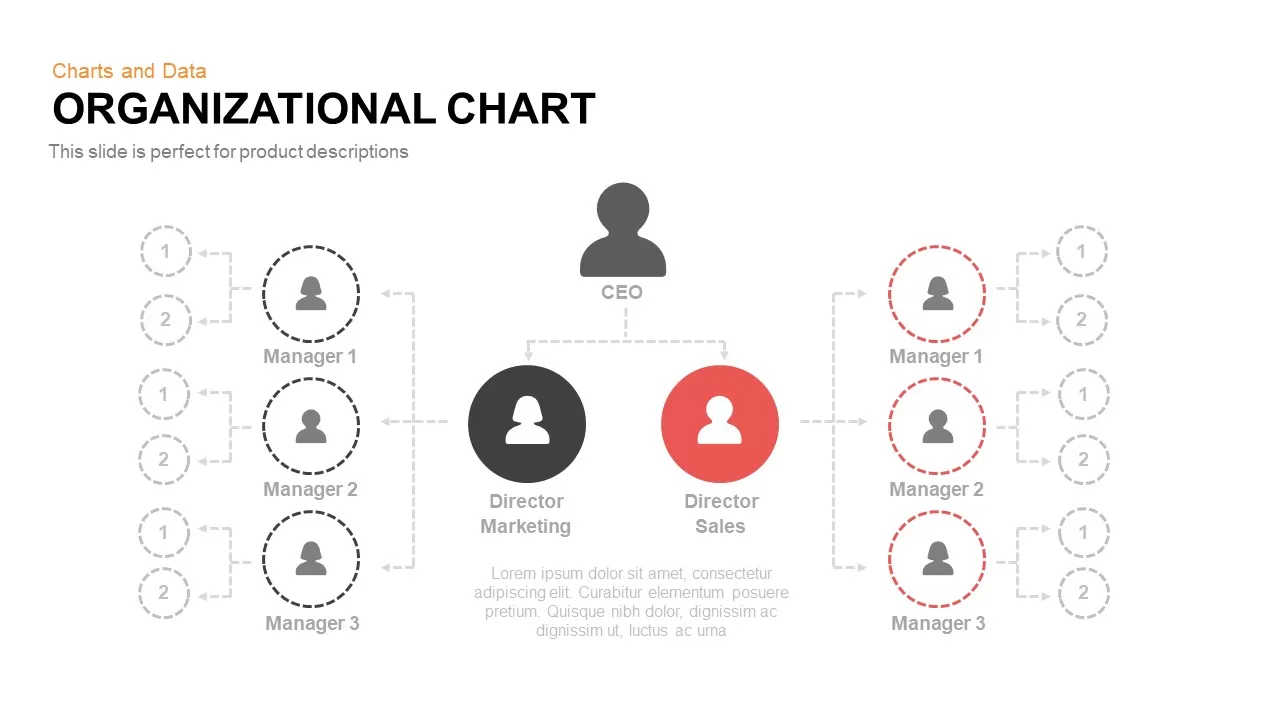
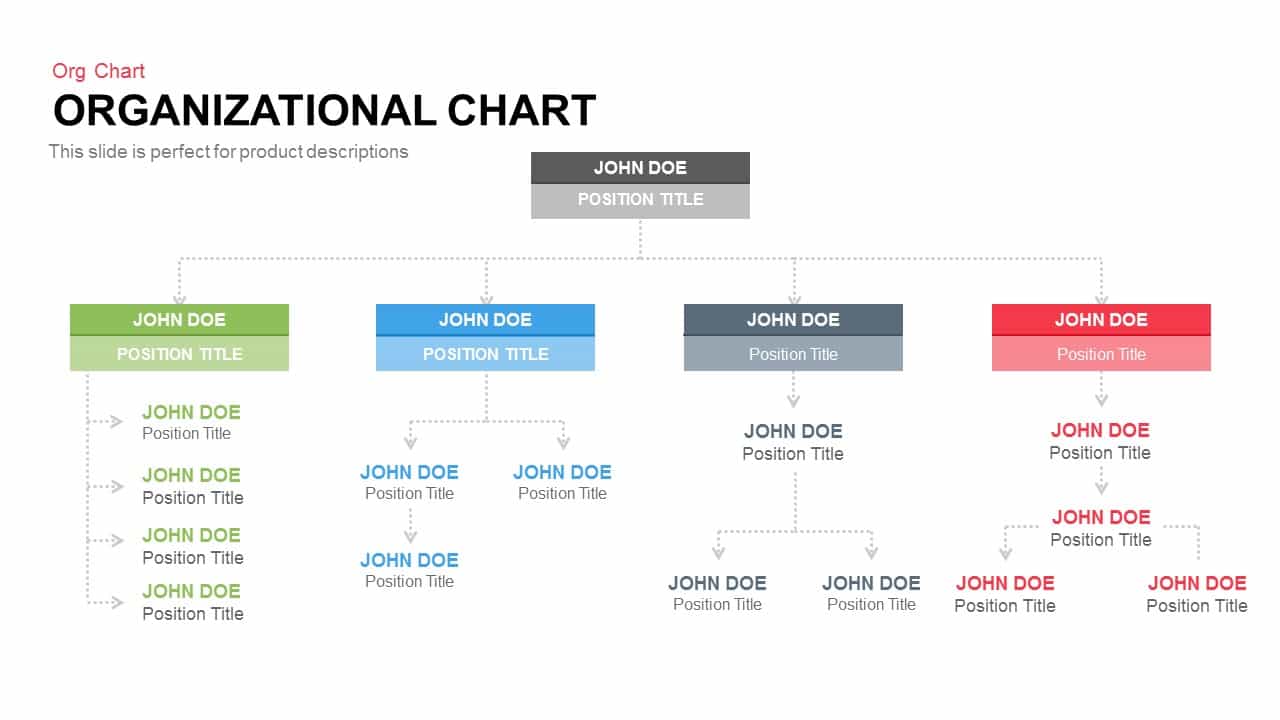
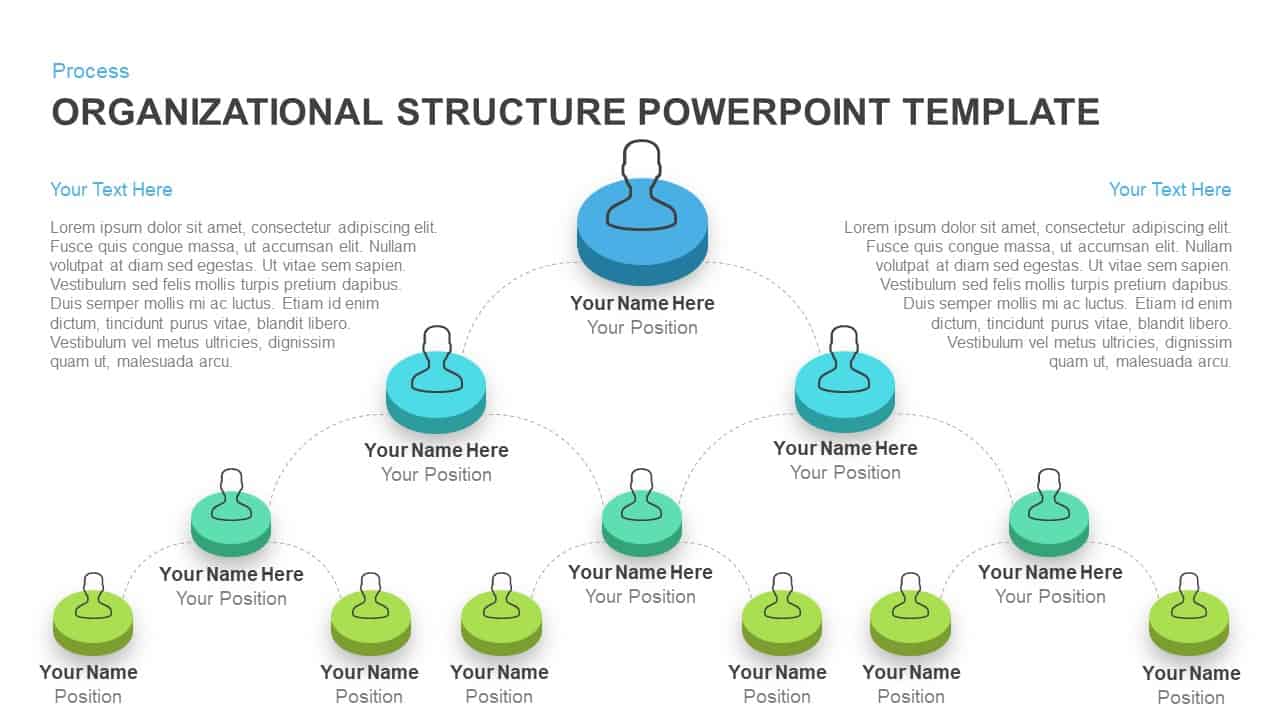
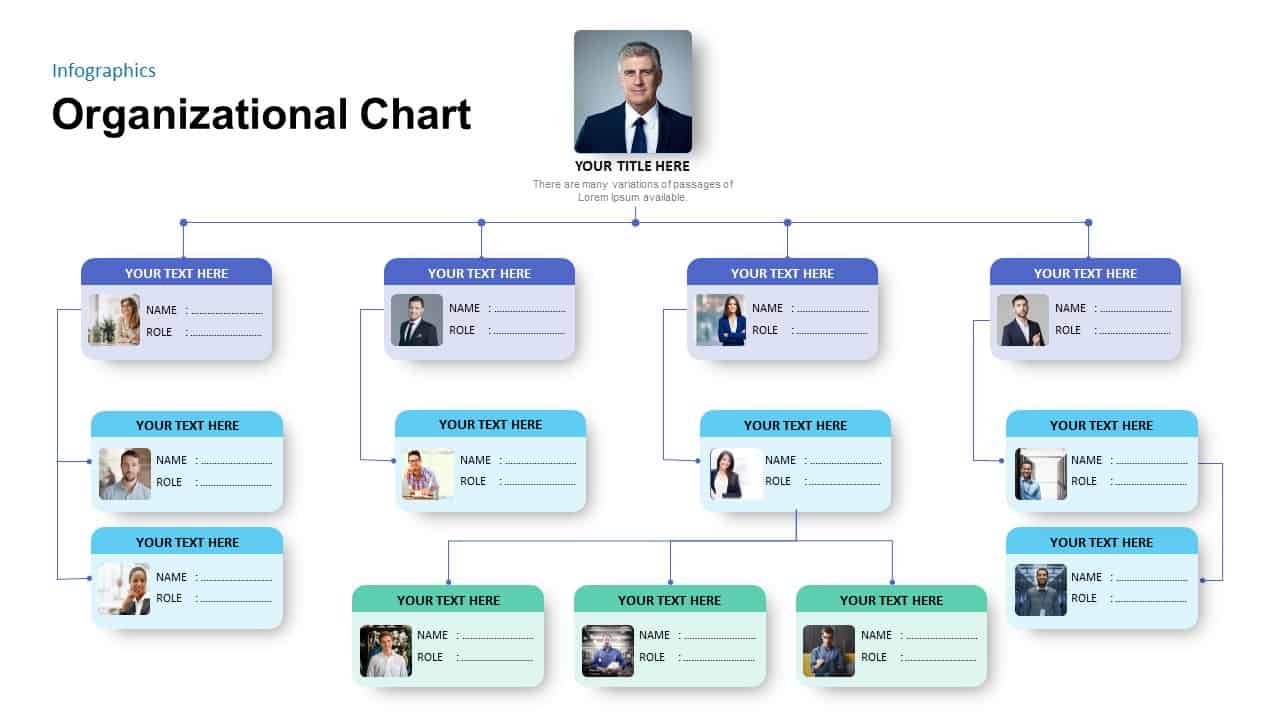
Organizational Chart Template for PowerPoint & Google Slides
Org Chart
Pencil Bar Chart Data Analysis Template for PowerPoint & Google Slides
Bar/Column
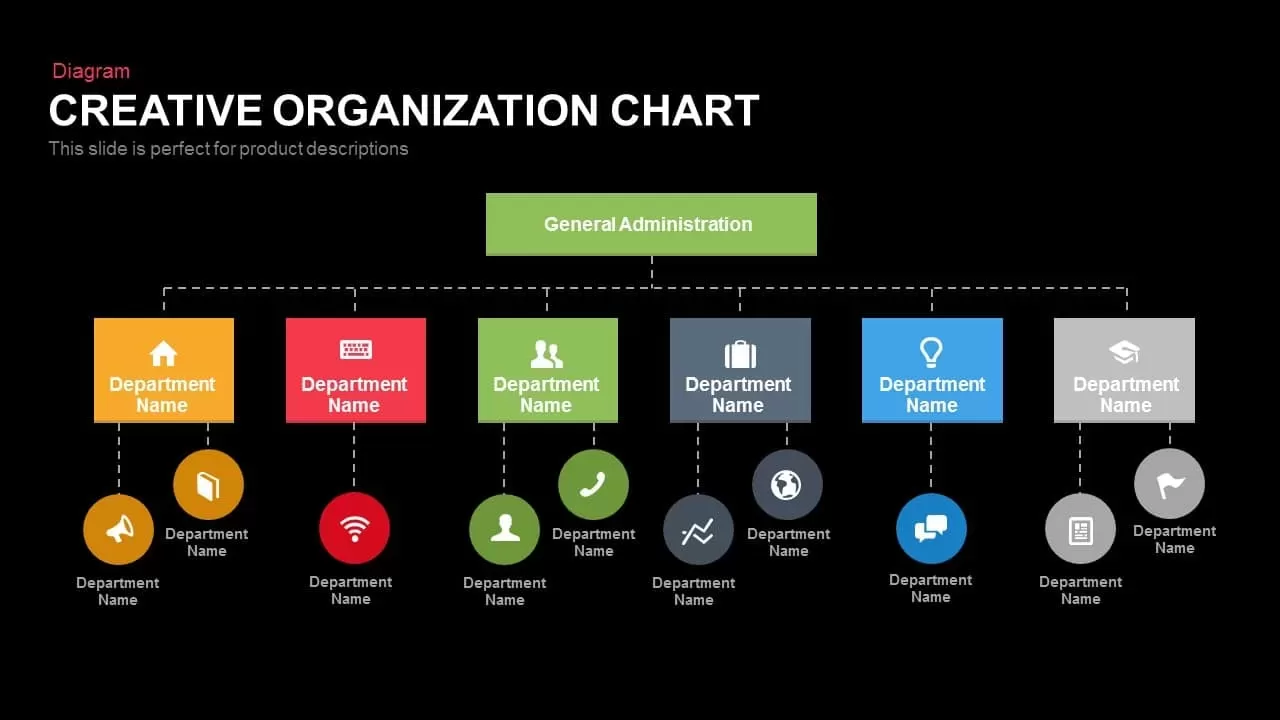
Creative Organization Chart Diagram Template for PowerPoint & Google Slides
Org Chart
Corporate Org Chart template for PowerPoint & Google Slides
Org Chart

Fully Editable Gantt Chart Timeline template for PowerPoint & Google Slides
Gantt Chart
Modern Ten-Block Section Title Chart template for PowerPoint & Google Slides
Comparison

Colorful Radial Bar Chart Template for PowerPoint & Google Slides
Bar/Column
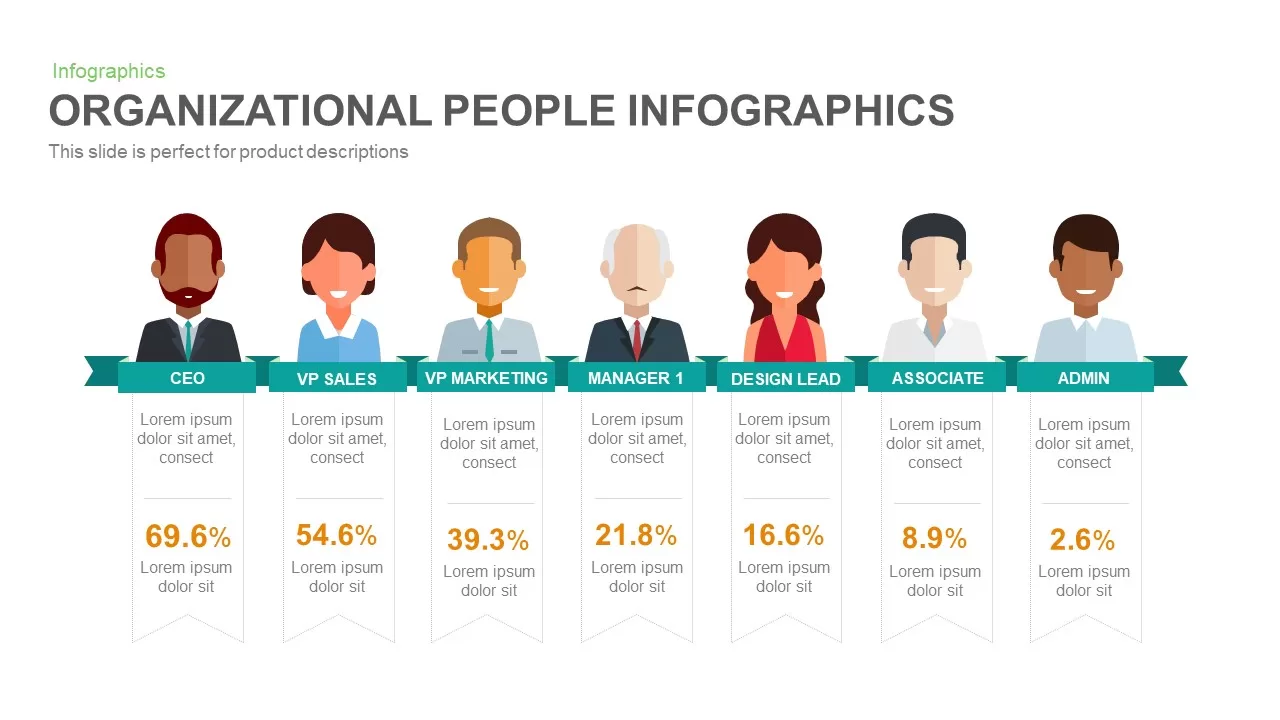
Organizational People Percentage Chart template for PowerPoint & Google Slides
Org Chart
Five-Stage People Infographic Chart template for PowerPoint & Google Slides
Process
Three-Stage Circular Options Chart Template for PowerPoint & Google Slides
Comparison
Organizational Chart Structure template for PowerPoint & Google Slides
Org Chart

Application Revenue Line Chart KPI Template for PowerPoint & Google Slides
Revenue
Tornado Chart Data Comparison Slide Template for PowerPoint & Google Slides
Bar/Column
Modern Colorful Circular Org Chart Template for PowerPoint & Google Slides
Org Chart
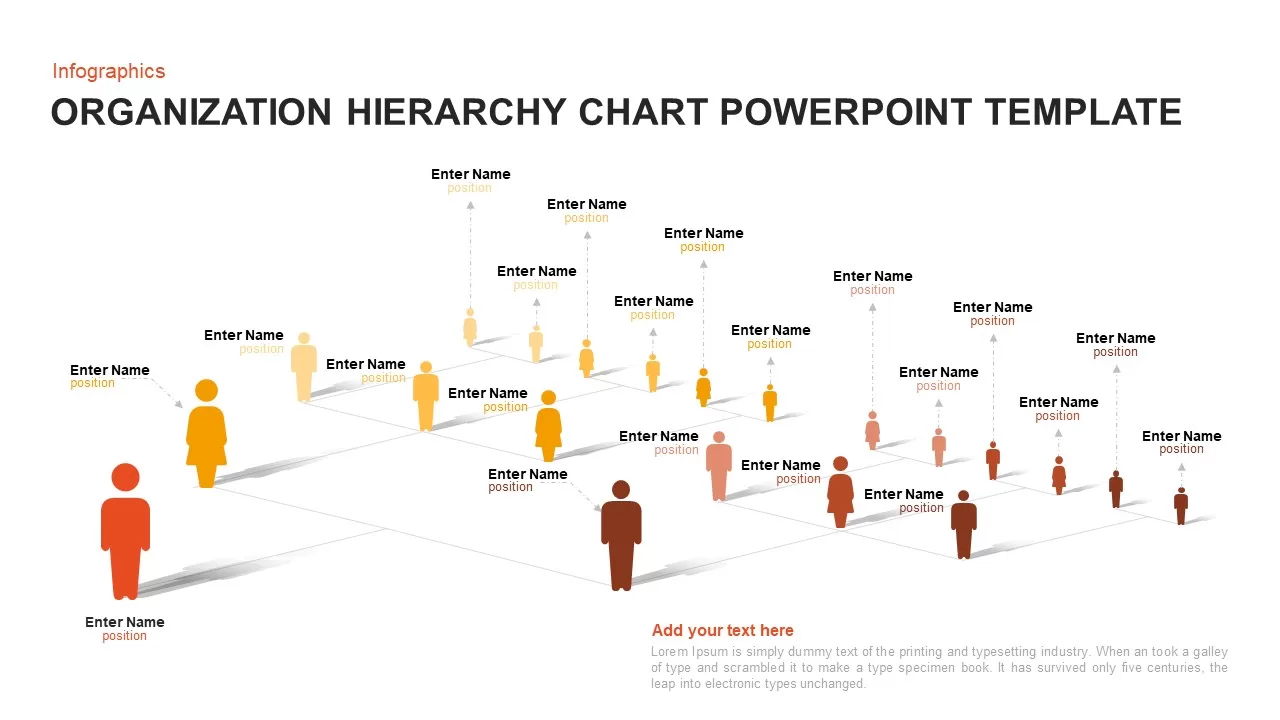
3D Organization Hierarchy Chart Template for PowerPoint & Google Slides
Org Chart
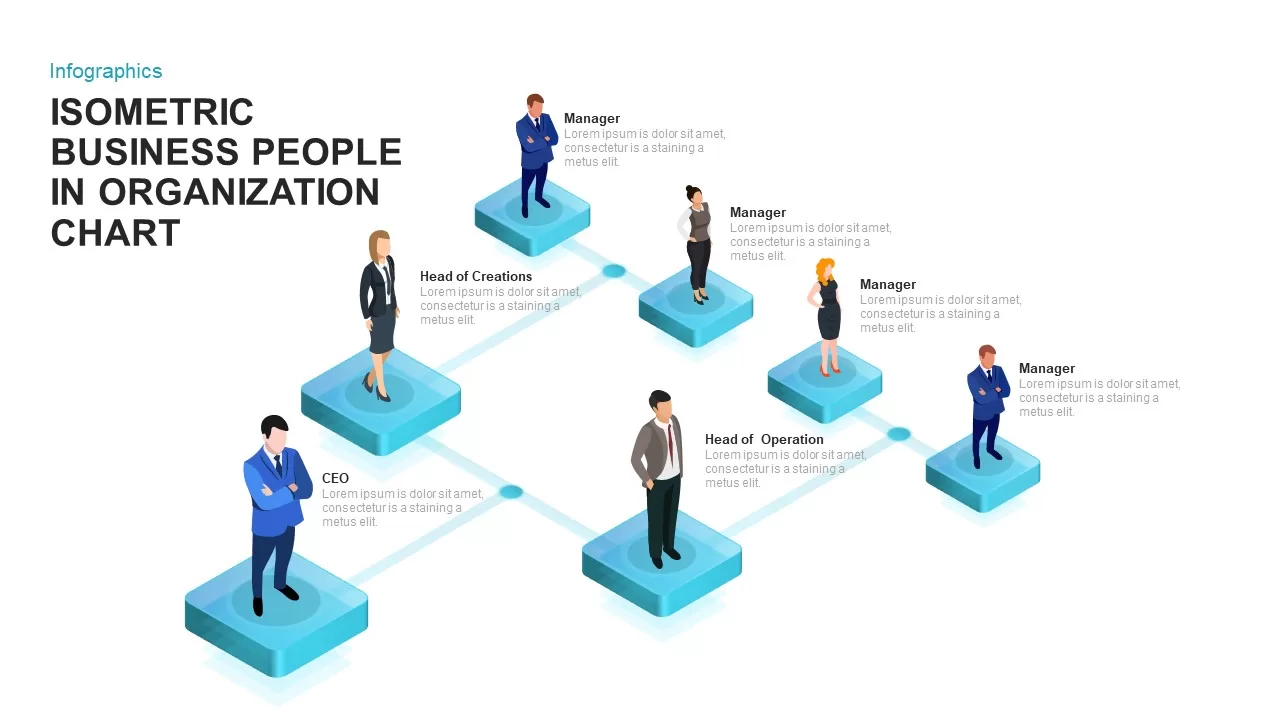
Isometric Business Organization Chart Template for PowerPoint & Google Slides
Org Chart
Isometric Organizational Structure Chart Template for PowerPoint & Google Slides
Org Chart
Radar Chart Product Comparison Template for PowerPoint & Google Slides
Comparison Chart
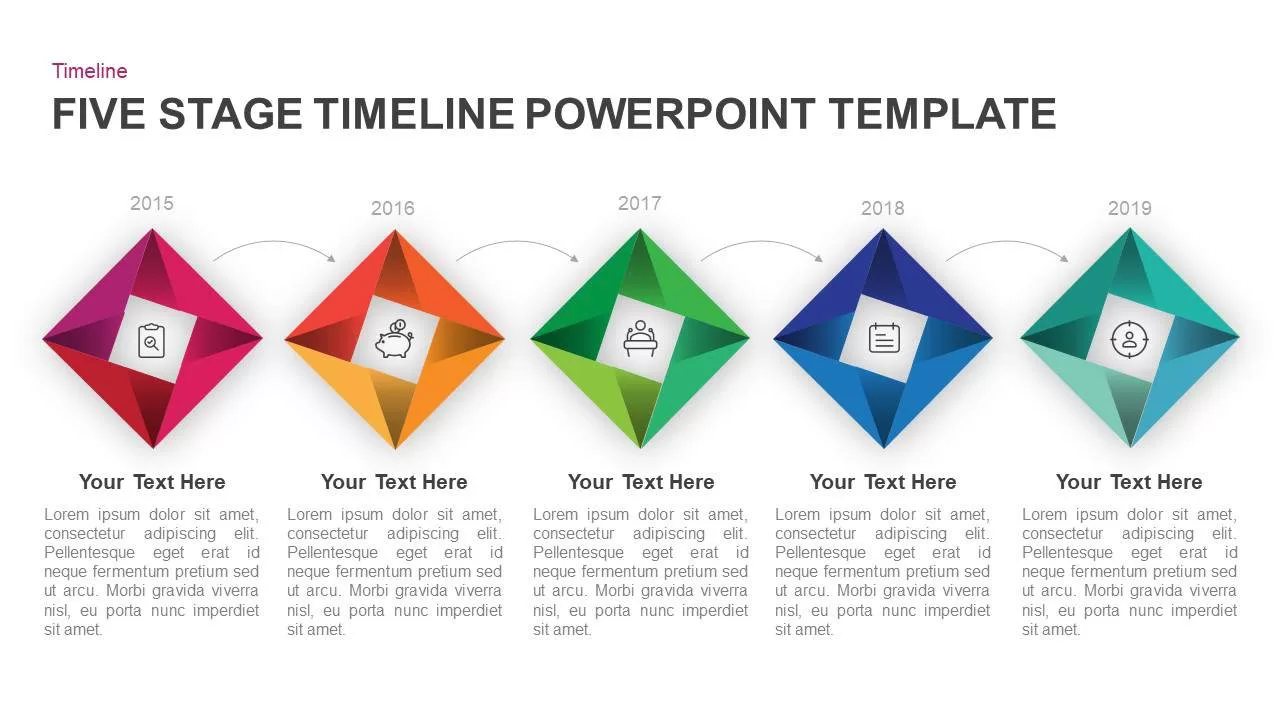
Five-Stage Diamond Timeline Chart Template for PowerPoint & Google Slides
Timeline
Distracting Factors at Work Bar Chart Template for PowerPoint & Google Slides
Bar/Column
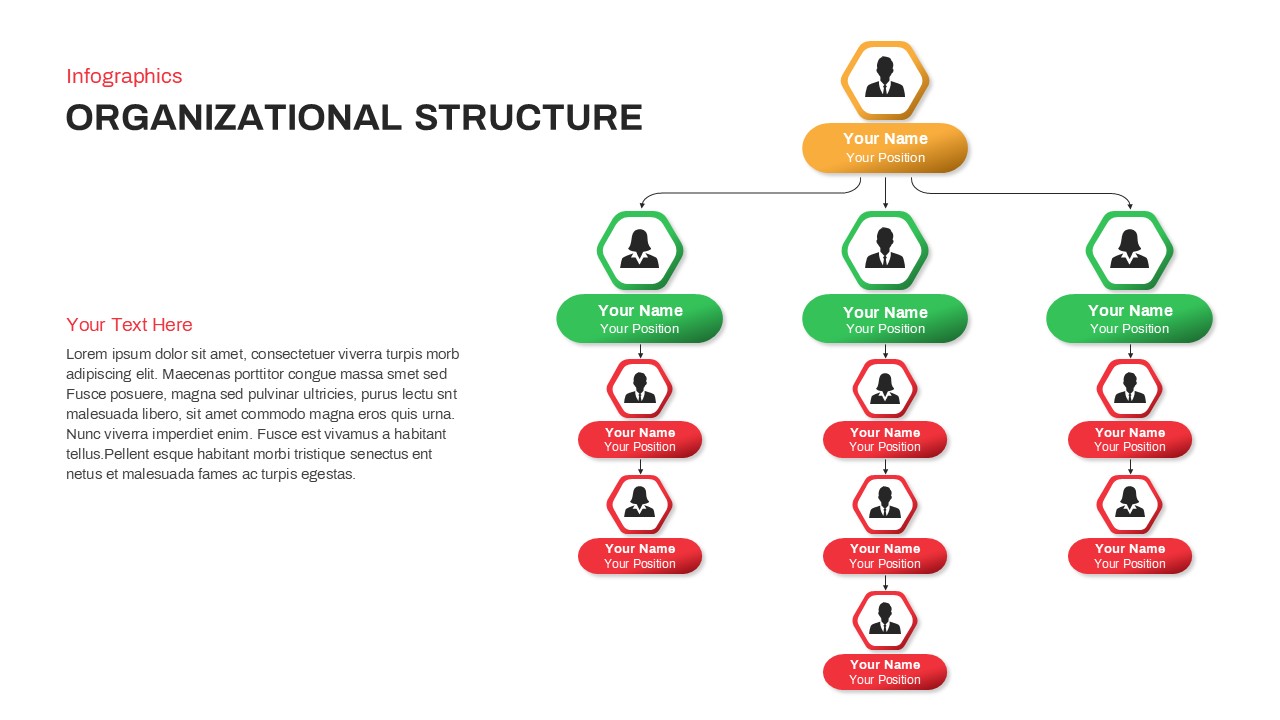
Organizational Structure Hierarchy Chart Template for PowerPoint & Google Slides
Org Chart
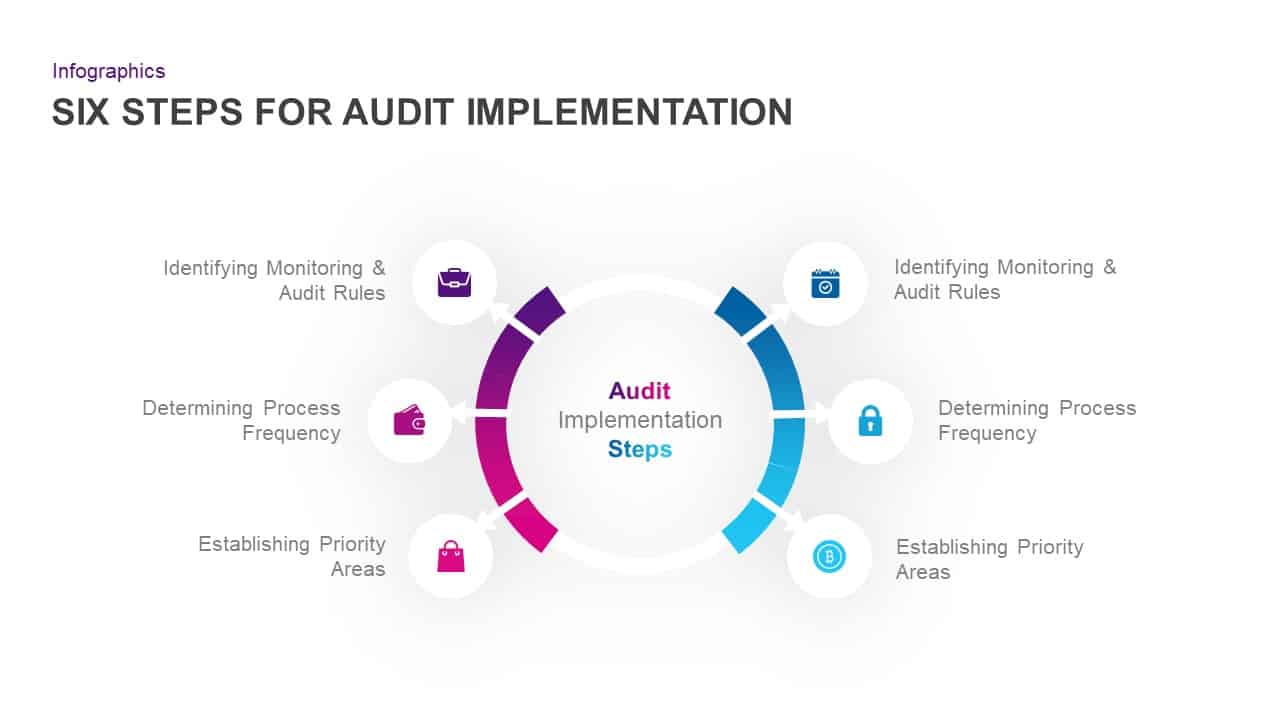
Six-Step Audit Implementation Chart Template for PowerPoint & Google Slides
Circular
Modern Organizational Chart Hierarchy Template for PowerPoint & Google Slides
Org Chart

Dynamic Marketing Radar Chart Analytics Template for PowerPoint & Google Slides
Comparison
Business Growth Metaphor Chart Template for PowerPoint & Google Slides
Business
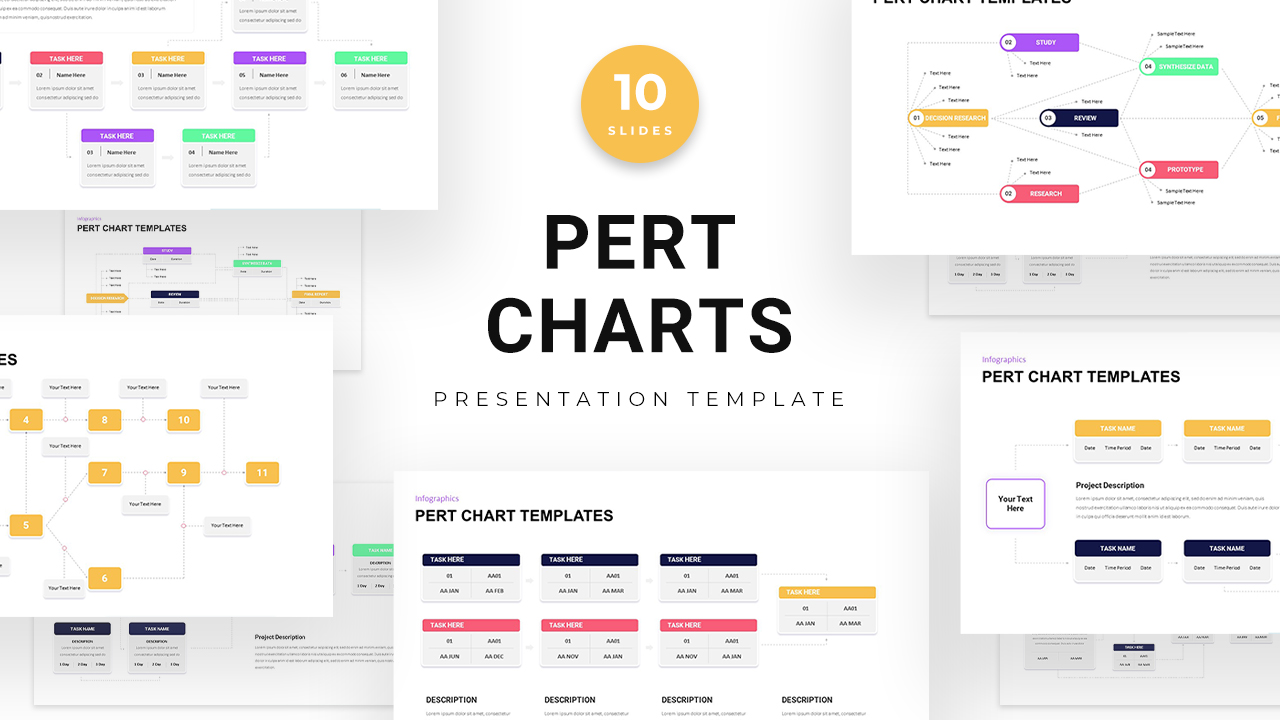
PERT Chart Project Management template for PowerPoint & Google Slides
Project Status
Professional Organizational Chart Diagram Template for PowerPoint & Google Slides
Org Chart
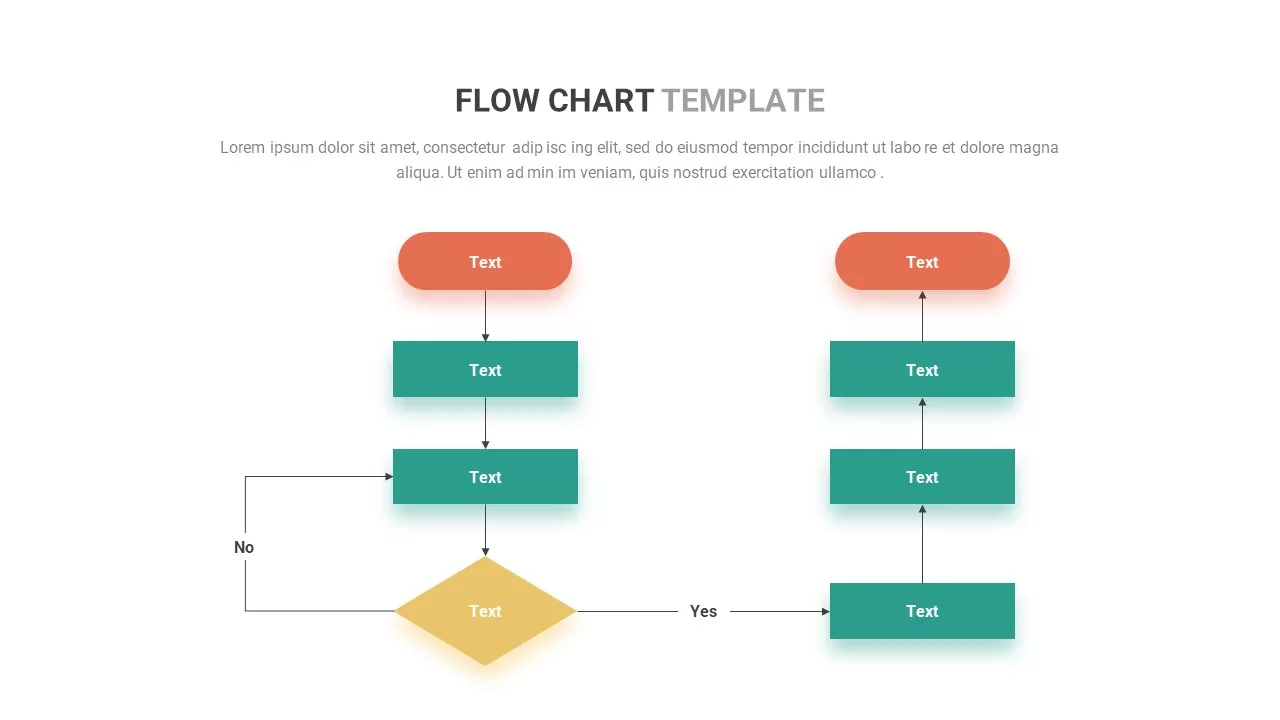
Flow Chart Template for PowerPoint & Google Slides
Flow Charts
Flow Chart template for PowerPoint & Google Slides
Flow Charts
Cost Reduction Strategy Donut Chart Template for PowerPoint & Google Slides
Pie/Donut
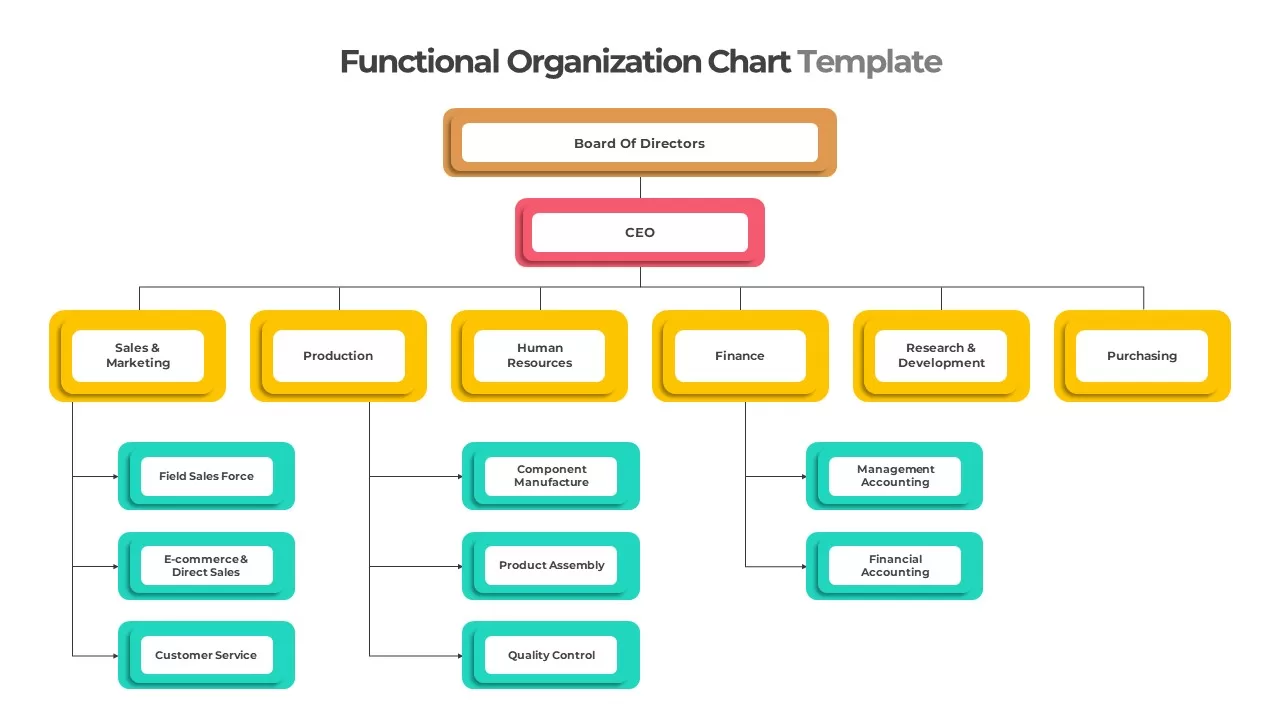
Colorful Functional Organization Chart Template for PowerPoint & Google Slides
Org Chart
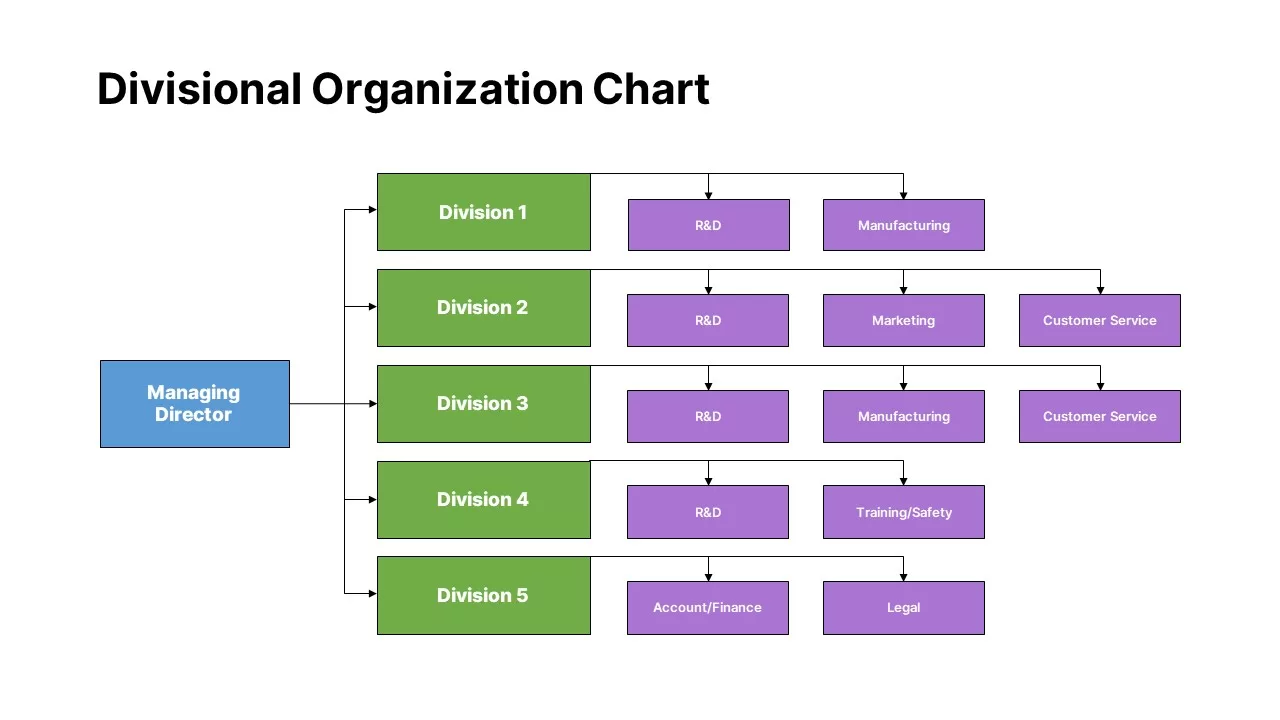
Divisional Organization Chart Template for PowerPoint & Google Slides
Org Chart
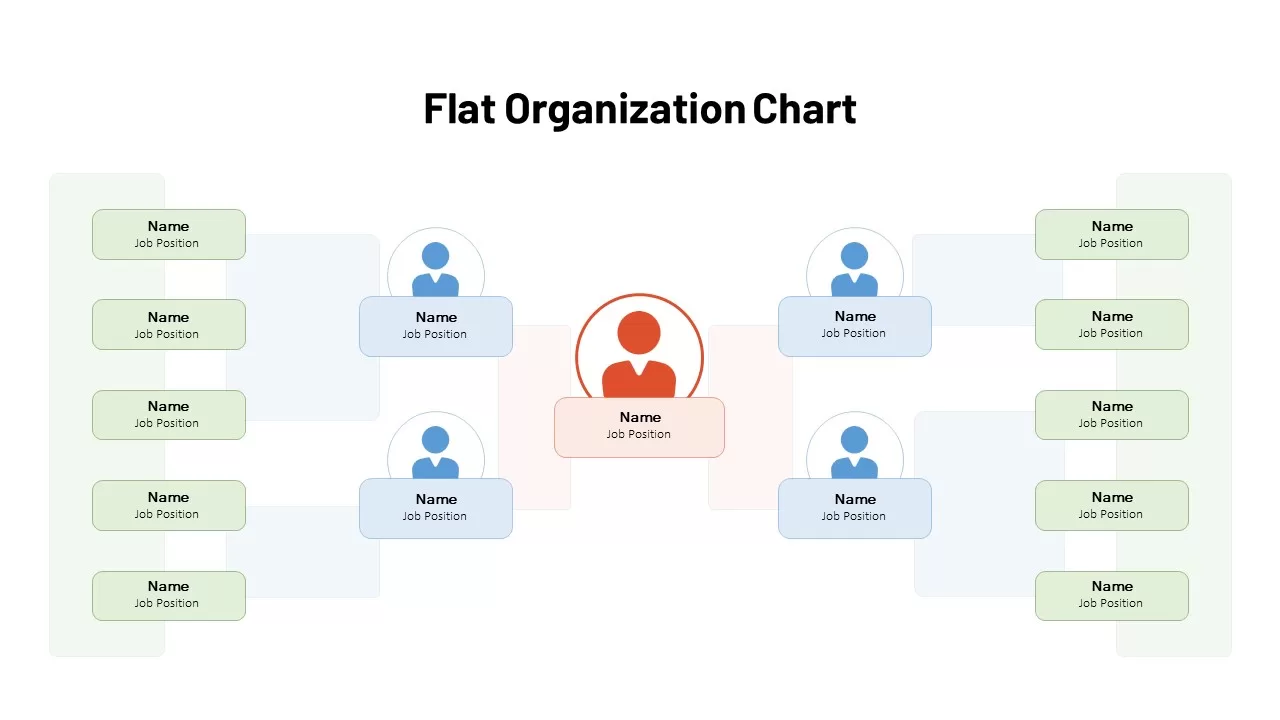
Flat Organization Chart Diagram Template for PowerPoint & Google Slides
Org Chart
Flat Organization Chart Diagram Template for PowerPoint & Google Slides
Org Chart
Multi-Series Stacked Bar Chart Template for PowerPoint & Google Slides
Bar/Column
Editable Multi-Series Peak Line Chart Template for PowerPoint & Google Slides
Comparison Chart
Professional 100% Stacked Column Chart Template for PowerPoint & Google Slides
Bar/Column
Professional Quad Chart Layout Template for PowerPoint & Google Slides
Pie/Donut
Grouped Column Chart Comparison Template for PowerPoint & Google Slides
Bar/Column
Five-Phase and Three-Phase Phases Chart Template for PowerPoint & Google Slides
Charts
Excel-Driven Gradient Timeline Chart Template for PowerPoint & Google Slides
Multi-Series Vertical Dot Chart Template for PowerPoint & Google Slides
Comparison Chart
Multi-Style Clock Chart Diagram Template for PowerPoint & Google Slides
Circular
Multipurpose Spline Chart Data Trend Template for PowerPoint & Google Slides
Bar/Column
Multi-Variation Circular Chart Diagram Template for PowerPoint & Google Slides
Circular
Professional HR Organization Chart Template for PowerPoint & Google Slides
Org Chart
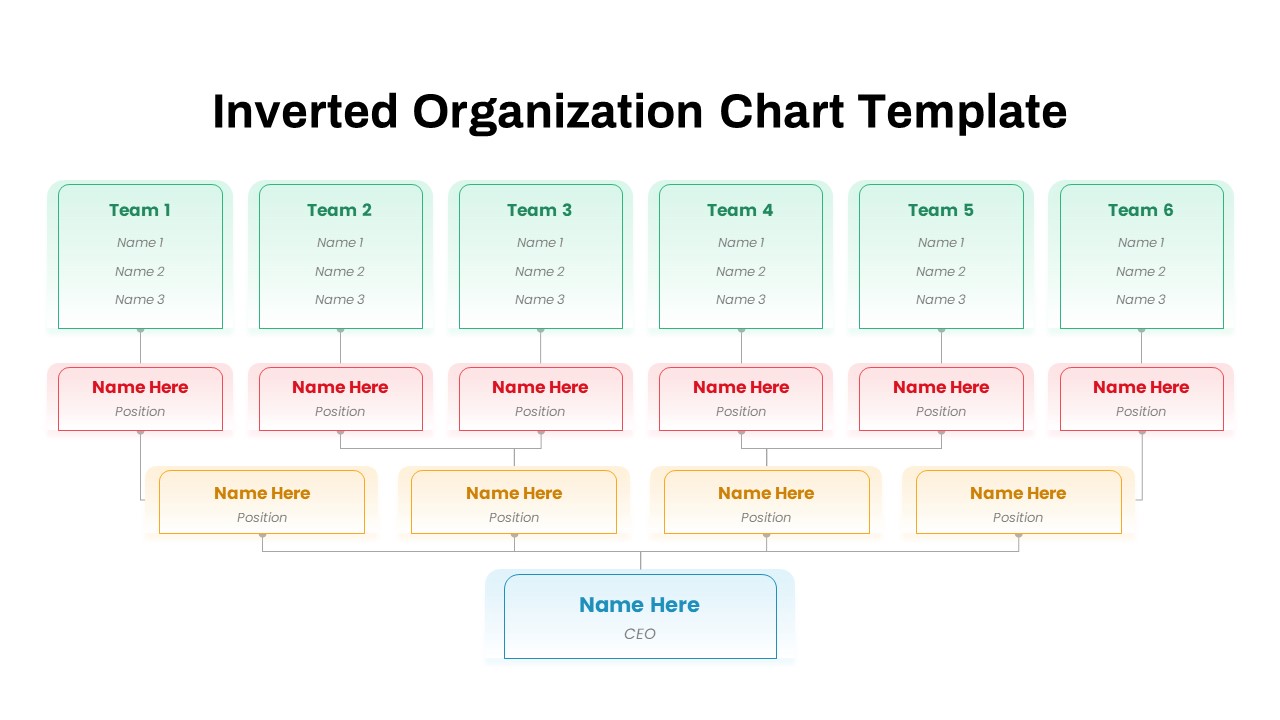
Inverted Organization Chart Diagram Template for PowerPoint & Google Slides
Org Chart
Multi-Level Colorful Pyramid Chart Template for PowerPoint & Google Slides
Pyramid
Free Versatile Product Comparison Chart Template for PowerPoint & Google Slides
Charts
Free
Bubble Chart Scatter, Diagram & Matrix Template for PowerPoint & Google Slides
Comparison Chart
Quarterly Gross Profit Rate Chart Template for PowerPoint & Google Slides
Revenue
Quarterly Revenue Comparison Bar Chart Template for PowerPoint & Google Slides
Bar/Column
Data Analysis Bar Chart with Insights Template for PowerPoint & Google Slides
Bar/Column
Free
Horizontal Bar Chart Slide with Icons Template for PowerPoint & Google Slides
Bar/Column
Project Tracker Timeline Gantt Chart Template for PowerPoint & Google Slides
Project Status
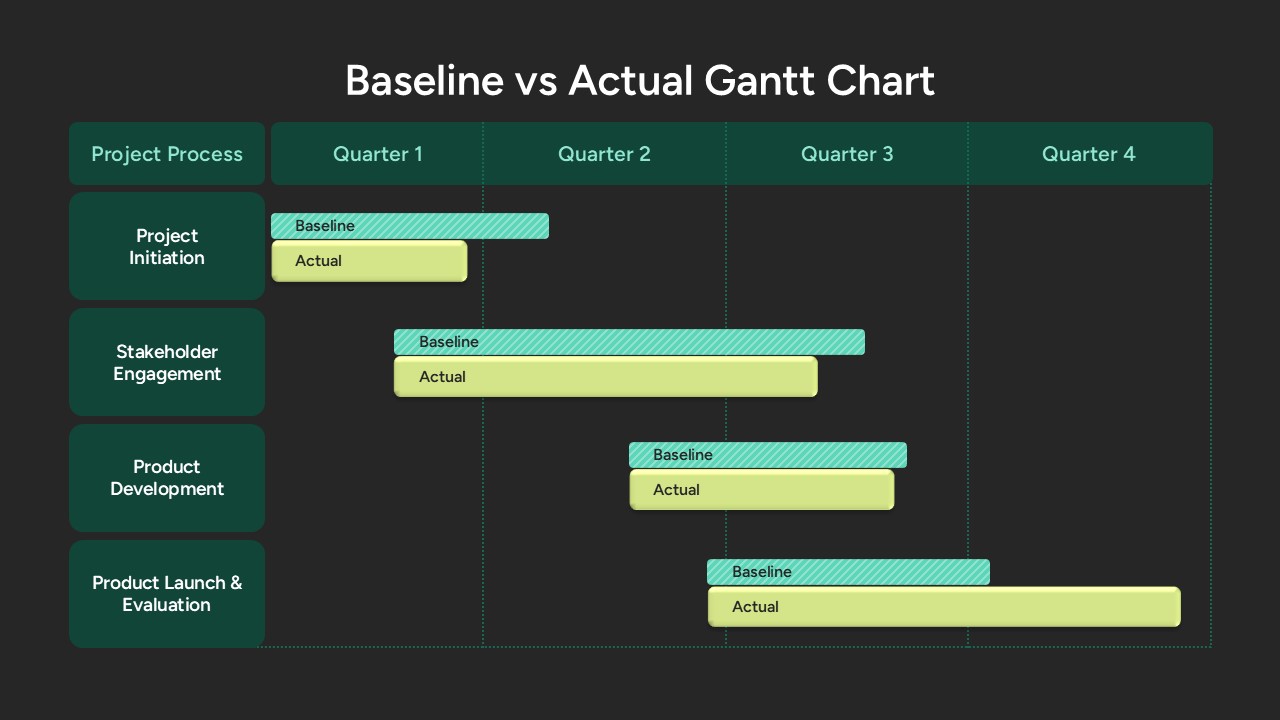
Baseline vs Actual Gantt Chart Template for PowerPoint & Google Slides
Gantt Chart
Weekly Gantt Chart Project Timeline Template for PowerPoint & Google Slides
Gantt Chart
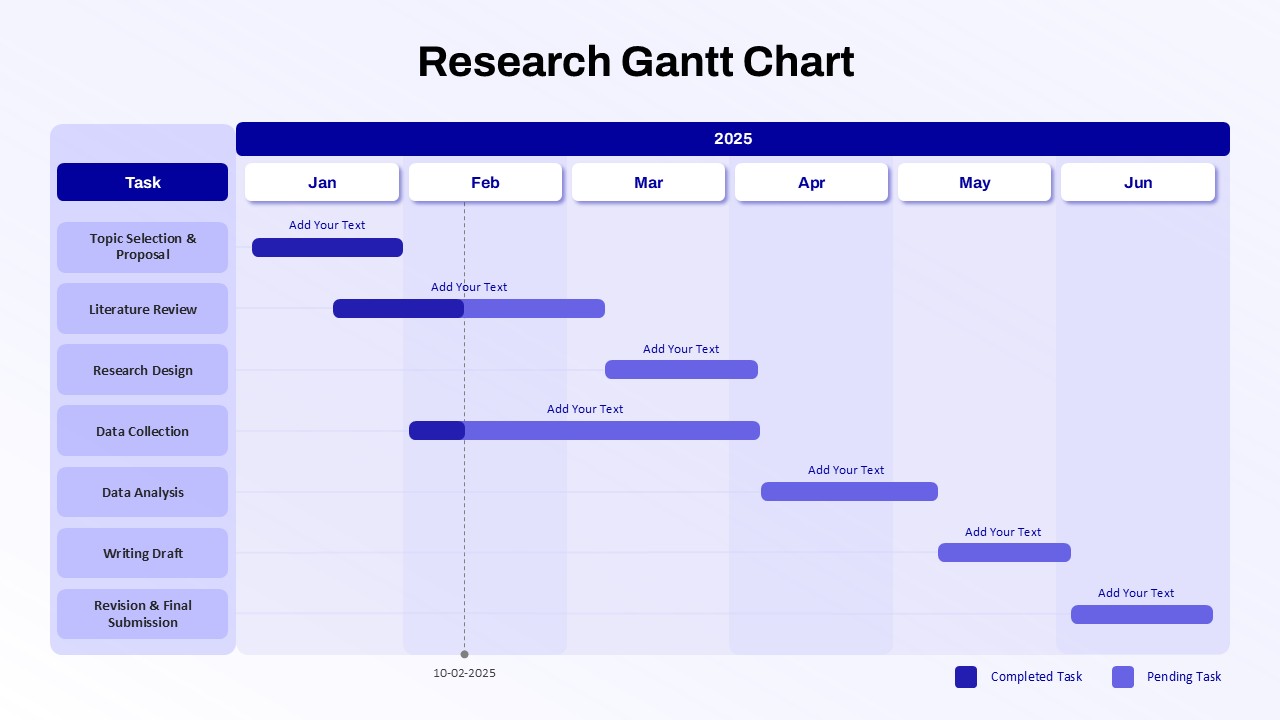
Research Gantt Chart template for PowerPoint & Google Slides
Project
Project Gantt Chart Template for PowerPoint & Google Slides
Gantt Chart
Circular Sample Org Chart Template for PowerPoint & Google Slides
Org Chart
Project Timeline Gantt Chart Template for PowerPoint & Google Slides
Gantt Chart
Horizontal Organizational Chart Template for PowerPoint & Google Slides
Org Chart
Colorful Annual Gantt Chart Timeline Template for PowerPoint & Google Slides
Gantt Chart
Corporate Hierarchy Org Chart Template for PowerPoint & Google Slides
Org Chart