Supply and Demand Creation Cycle Diagram Template for PowerPoint & Google Slides
Description
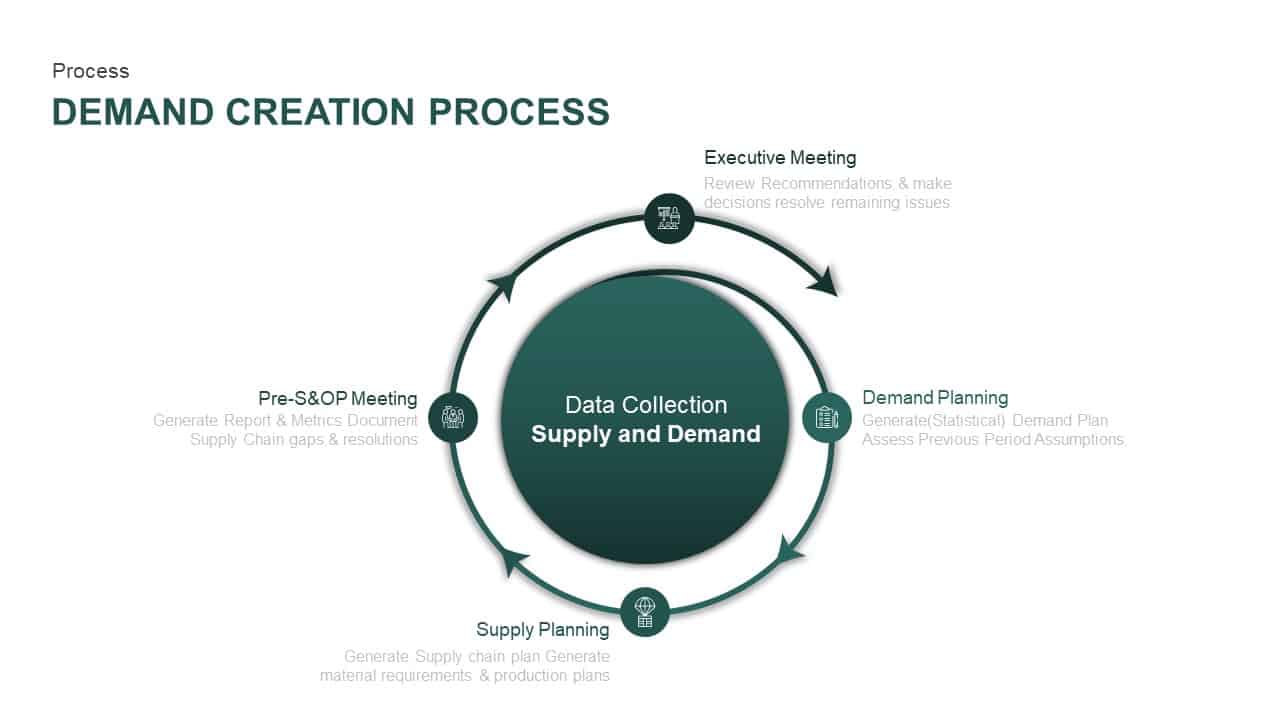
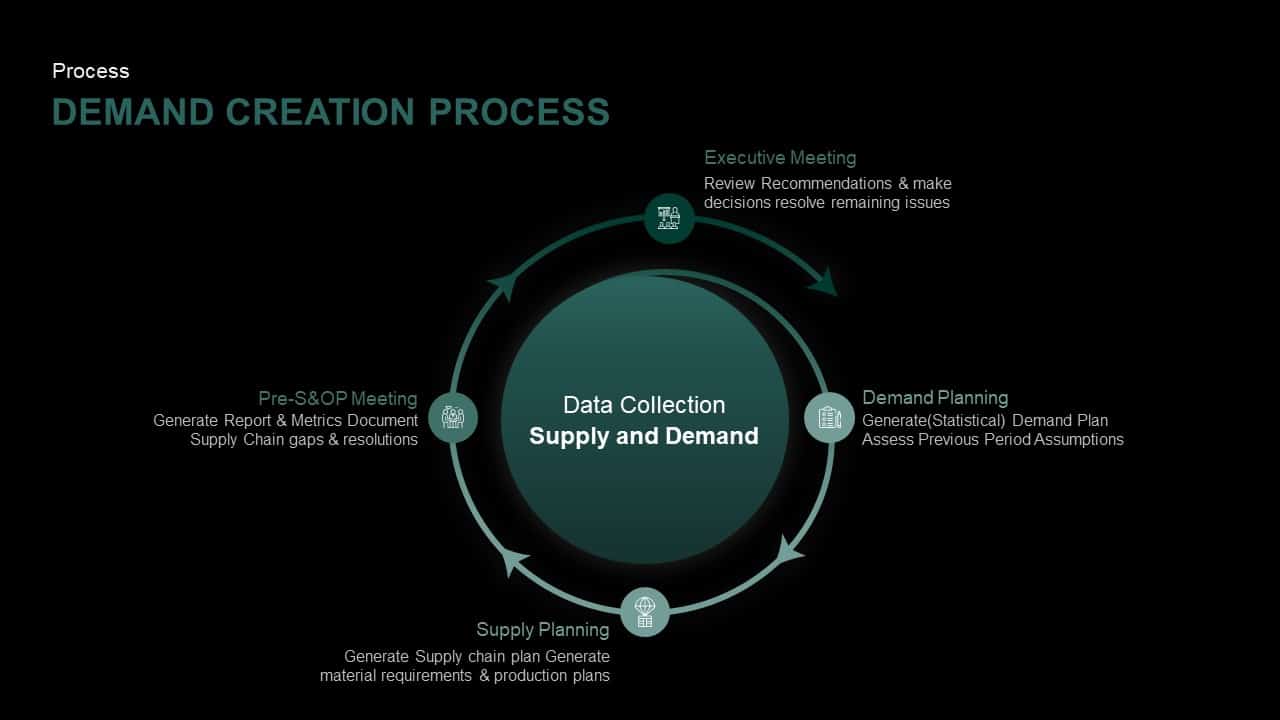
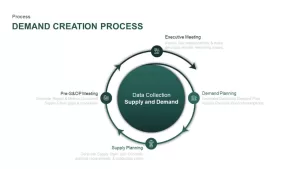
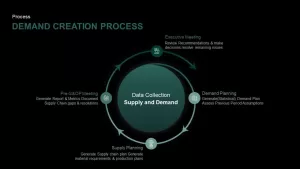
Use this fully editable supply and demand creation cycle diagram to map the end-to-end demand-creation process—from demand planning through supply planning, Pre-S&OP meetings, and executive reviews—in one cohesive infographic. The slide features a central “Data Collection: Supply and Demand” hub surrounded by a seamless circular flow of four gradient-green arrows. Each arrow is anchored by an icon placeholder and linked to concise callouts that describe each stage: Demand Planning, Supply Planning, Pre-S&OP Meeting, and Executive Meeting. Built with vector shapes and master layouts in both PowerPoint and Google Slides, you can swap icons, adjust gradients, edit labels, or reposition elements in seconds without misalignment. Preconfigured entrance animations guide audiences through each phase step-by-step, reinforcing narrative flow and engagement. Cross-platform compatibility ensures consistent formatting across devices and eliminates version-control headaches, enabling frictionless team collaboration and seamless remote presentations.
Who is it for
Supply chain managers, operations leaders, and demand-planning analysts will benefit from this slide when presenting S&OP workflows, forecasting processes, or cross-functional alignment workshops. Consultants and executive teams can leverage the clear cycle visualization to drive data-driven decisions and highlight process interdependencies.
Other Uses
Beyond S&OP frameworks, repurpose this infographic for project lifecycle overviews, marketing-operations alignment, continuous improvement cycles, or performance-review processes. The modular design supports swapping stages, adding icons, or extending the cycle to fit any four-step workflow or review cadence.
Login to download this file

Item ID
SB01553
Related Templates

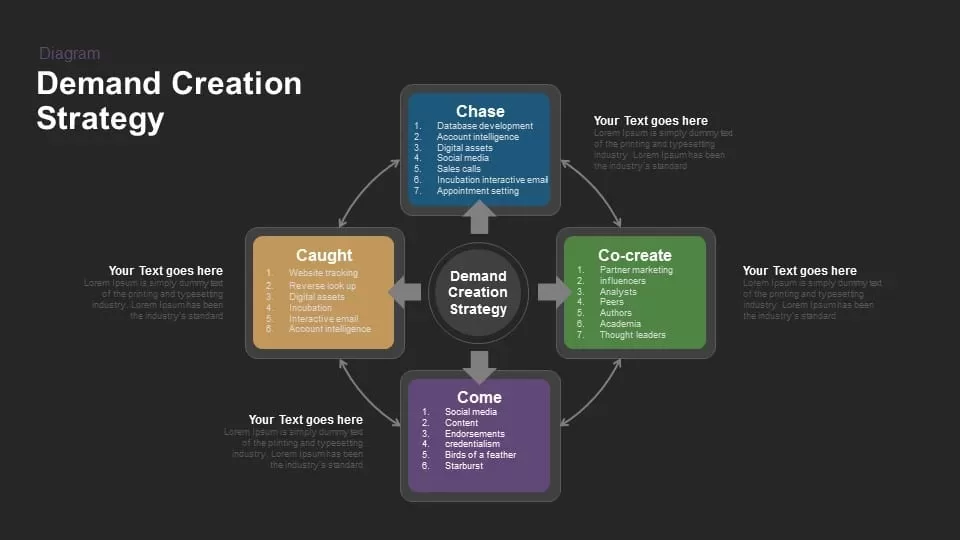
Demand Creation Strategy Diagram for PowerPoint & Google Slides
Business Strategy

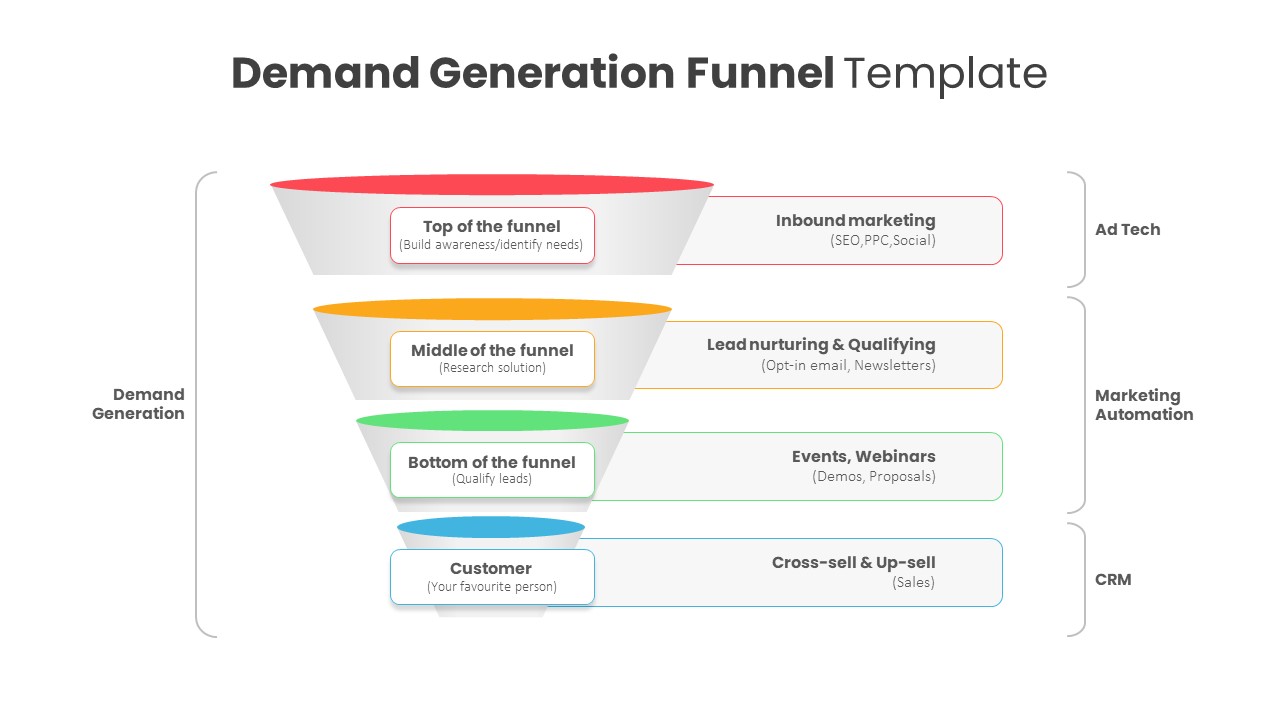
Demand Generation Funnel Diagram Template for PowerPoint & Google Slides
Funnel
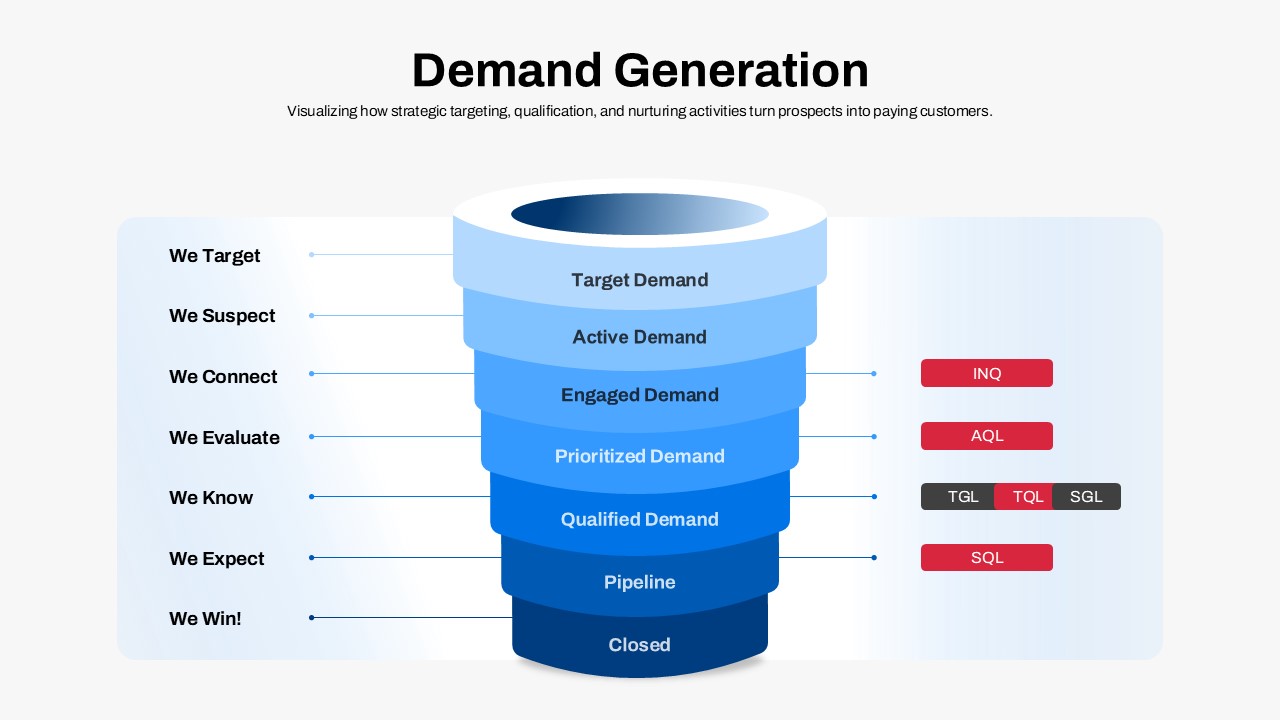
Demand Generation Funnel Process Diagram Template for PowerPoint & Google Slides
Funnel
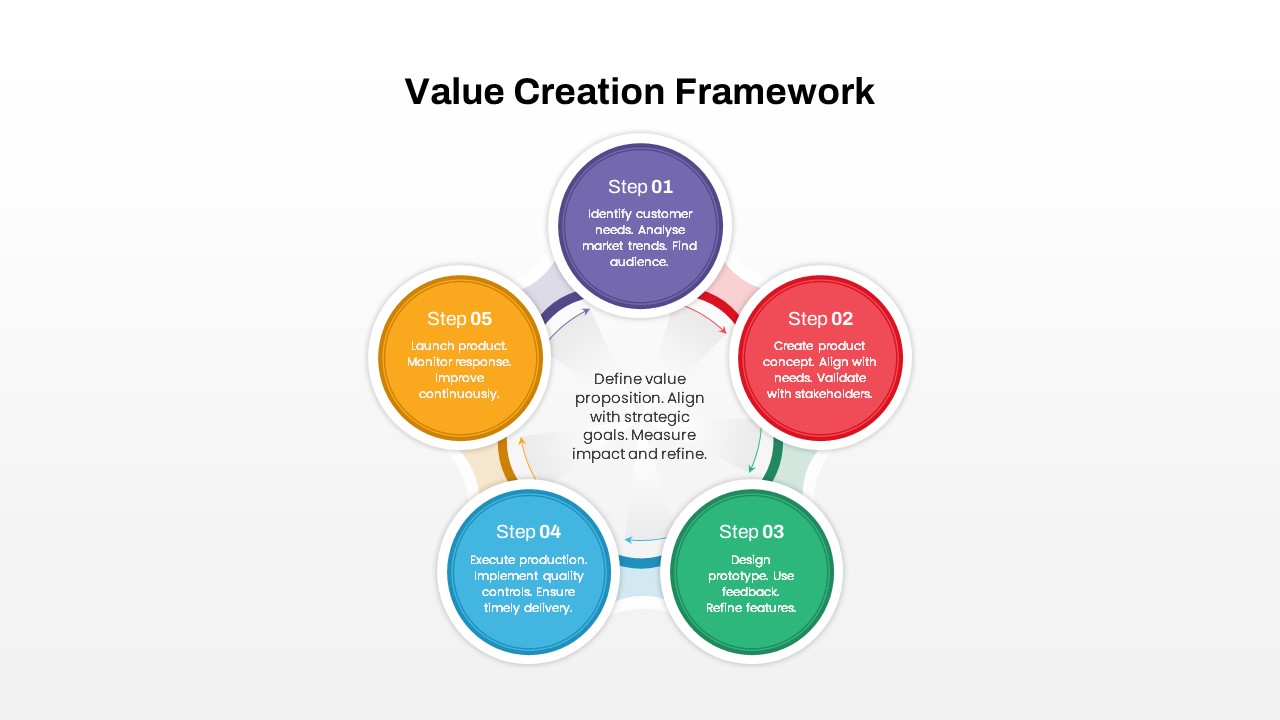
Value Creation Framework Process Diagram Template for PowerPoint & Google Slides
Business Plan
Category Creation Triangle Diagram Template for PowerPoint & Google Slides
Business Strategy
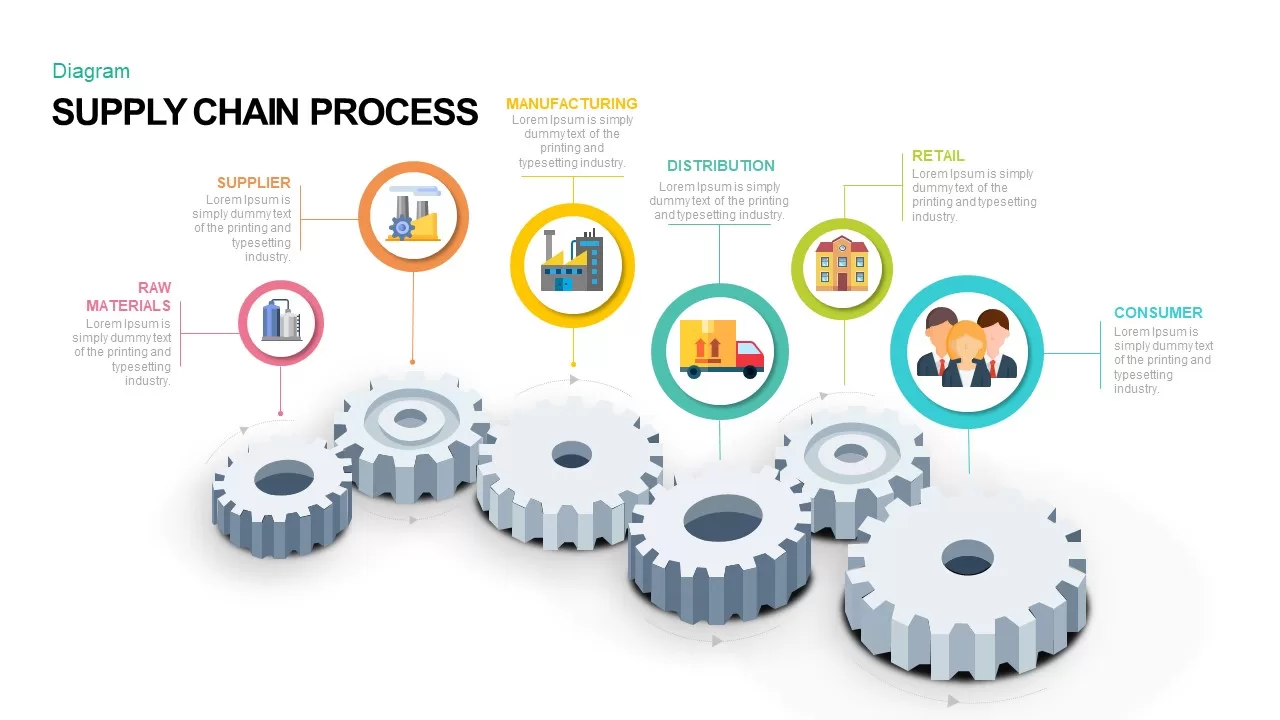
Supply Chain Process Gear Diagram Template for PowerPoint & Google Slides
Process
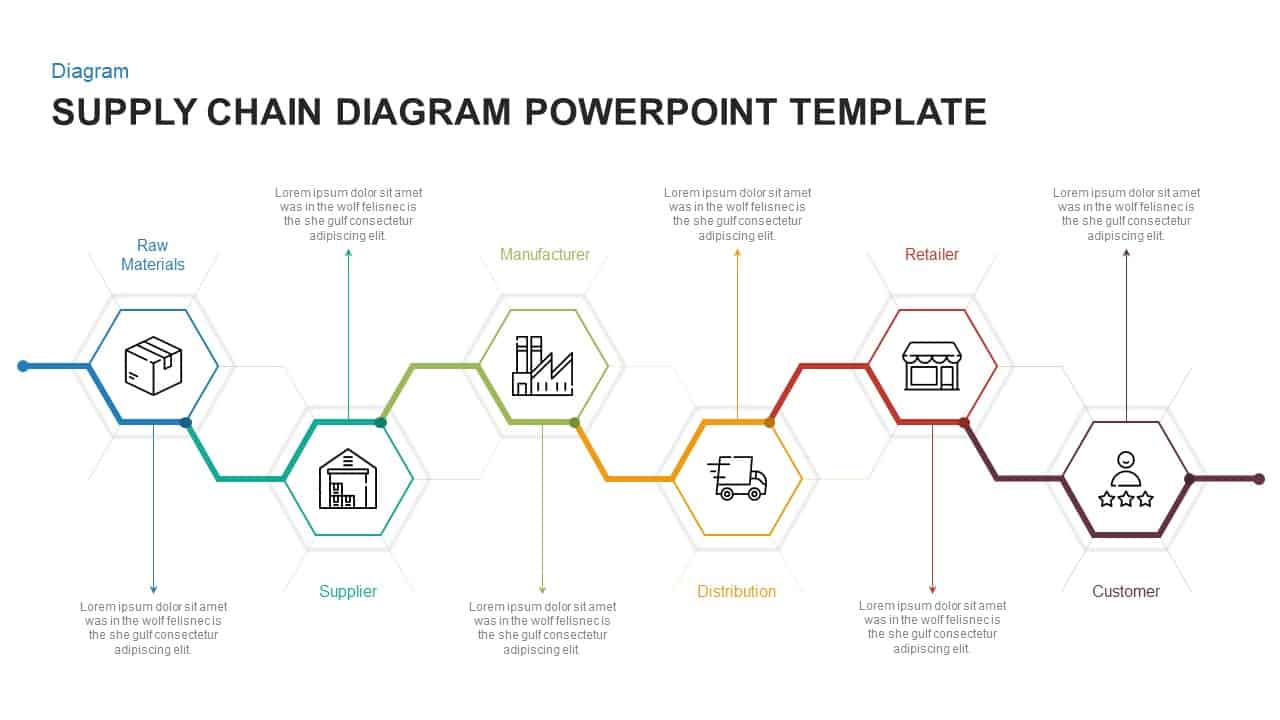
Hexagonal Supply Chain Diagram Template for PowerPoint & Google Slides
Process
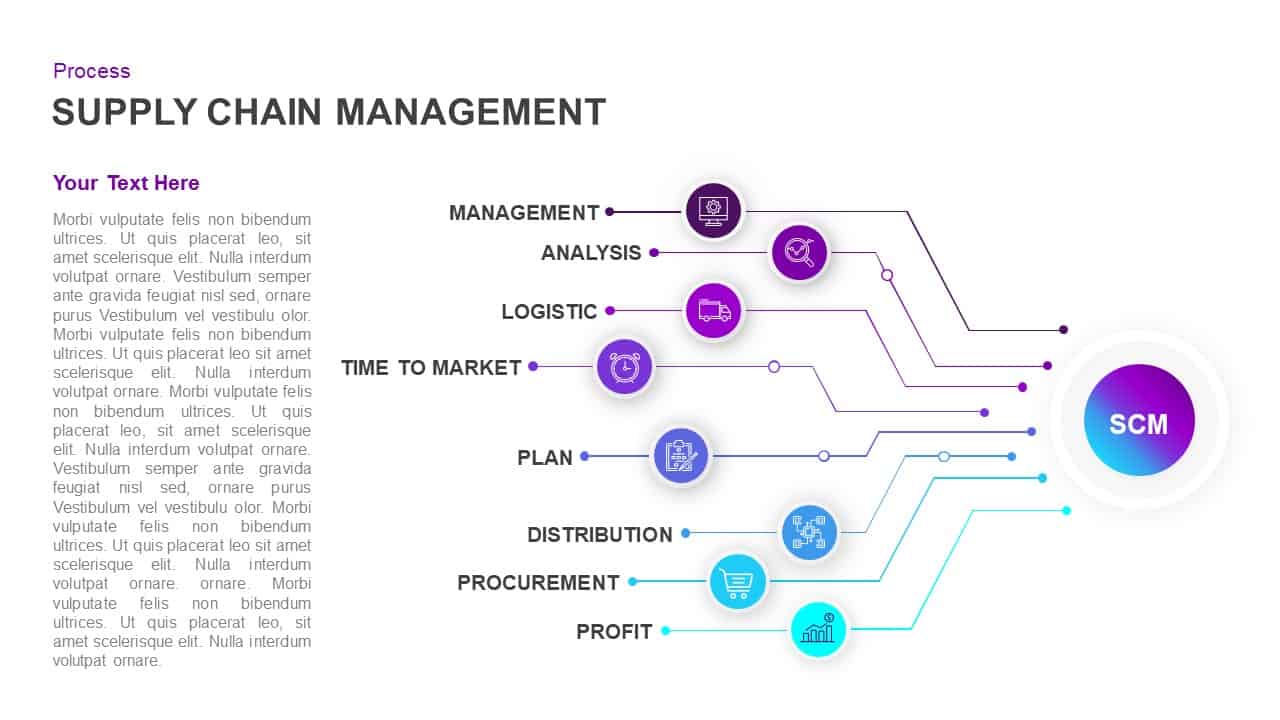
Supply Chain Management Process Diagram Template for PowerPoint & Google Slides
Process
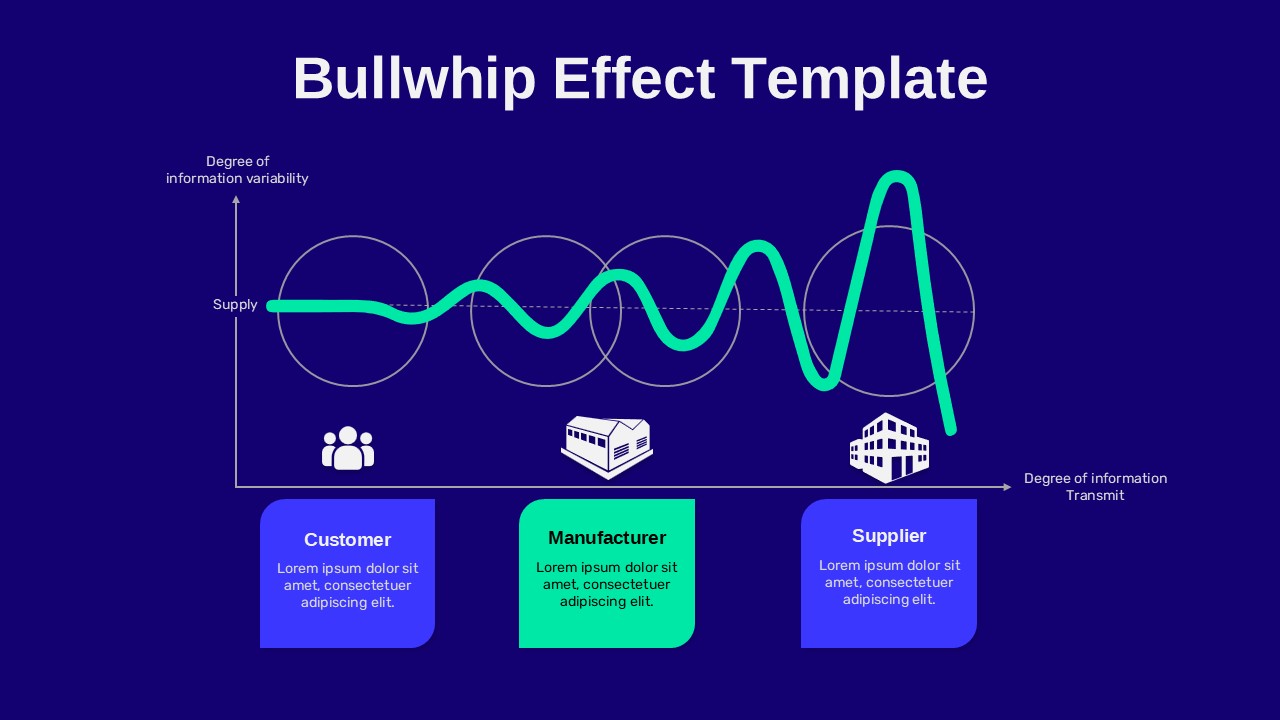
Bullwhip Effect Supply Chain Variability Diagram Template for PowerPoint & Google Slides
Business Models

Demand Generation and Lead Nurturing Process Template for PowerPoint & Google Slides
Process
Demand Generation Process Template for PowerPoint & Google Slides
Customer Journey
Demand Generation Process Overview Template for PowerPoint & Google Slides
Marketing
Sustainable Value Creation Framework Template for PowerPoint & Google Slides
Process
Business Model & Value Creation Template for PowerPoint & Google Slides
Process
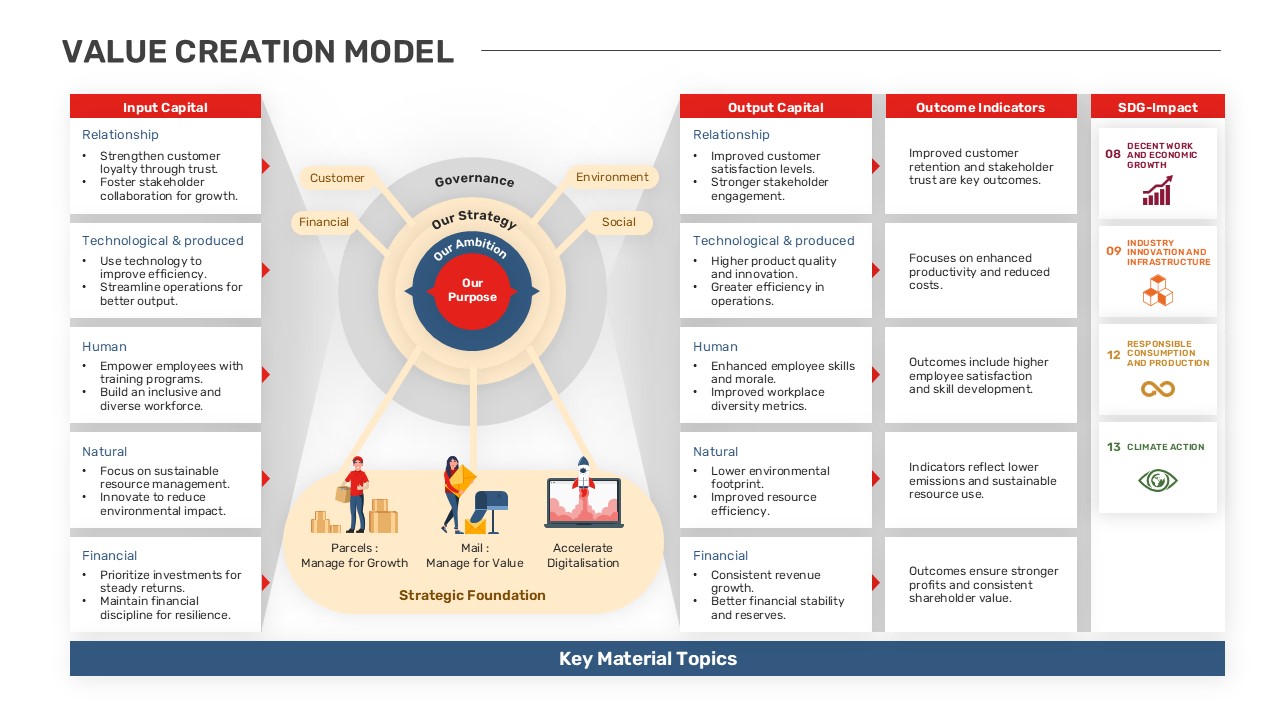
Comprehensive Value Creation Model Template for PowerPoint & Google Slides
Business Models
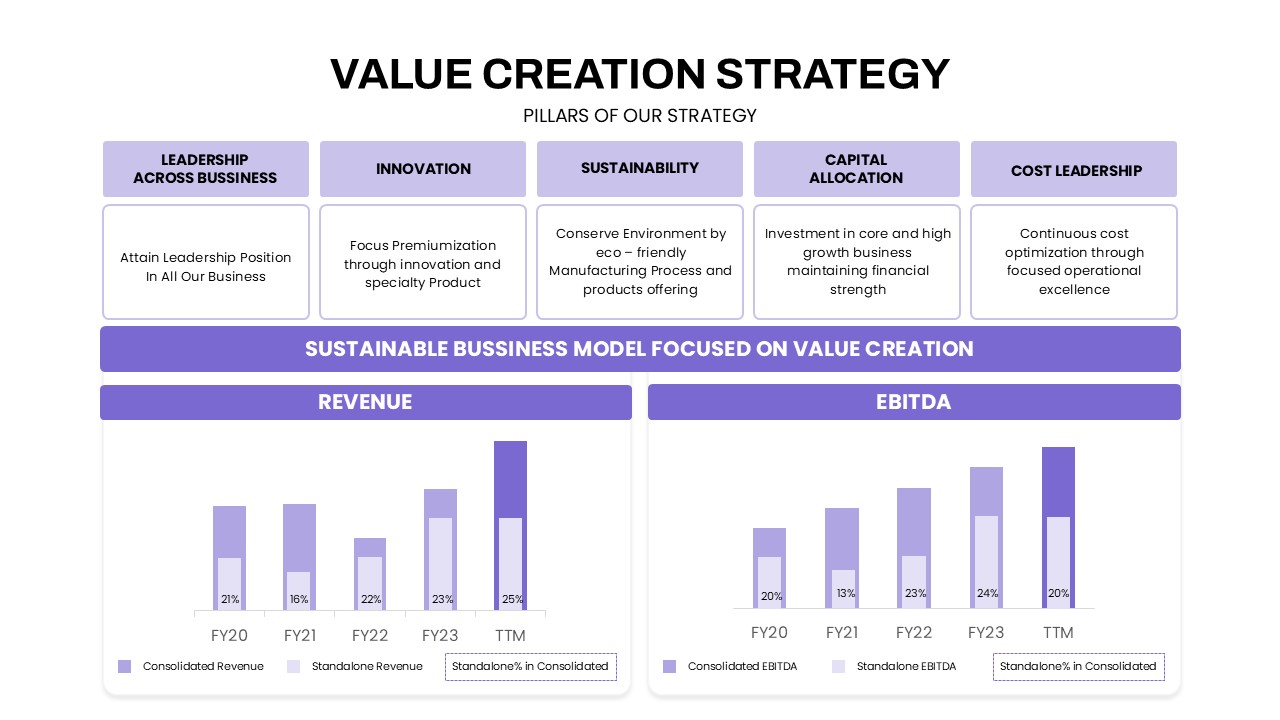
Value Creation Strategy Template for PowerPoint & Google Slides
Business Strategy
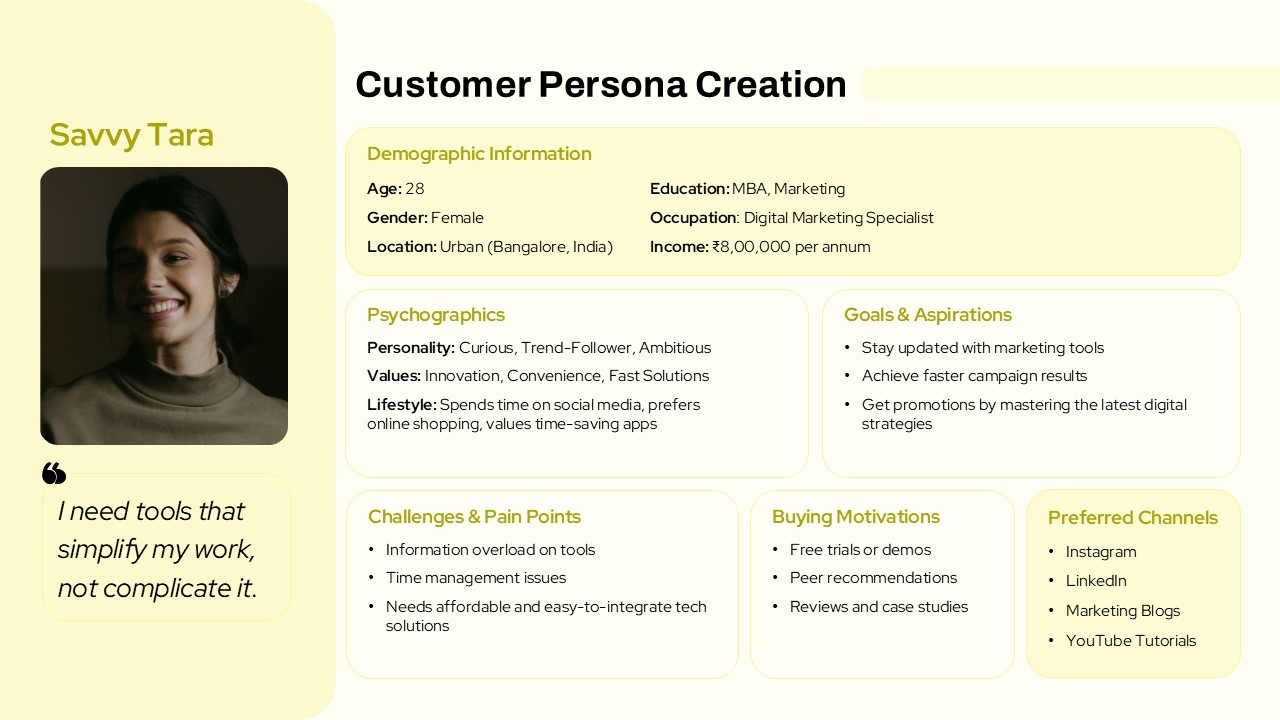
Customer Persona Creation template for PowerPoint & Google Slides
Marketing
Logistics and Supply Chain Management Template for PowerPoint & Google Slides
Process
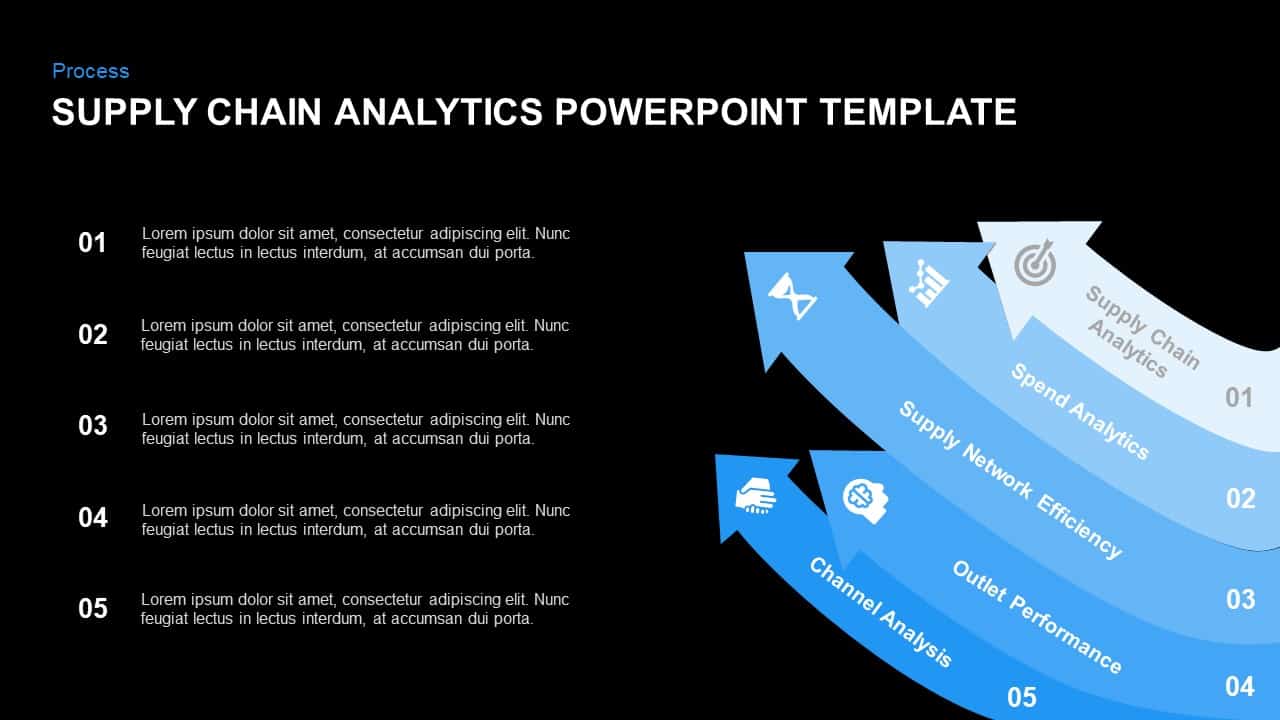
Supply Chain Analytics Process Template for PowerPoint & Google Slides
Process
Supply Chain Management Logistics Cover Template for PowerPoint & Google Slides
Pitch Deck
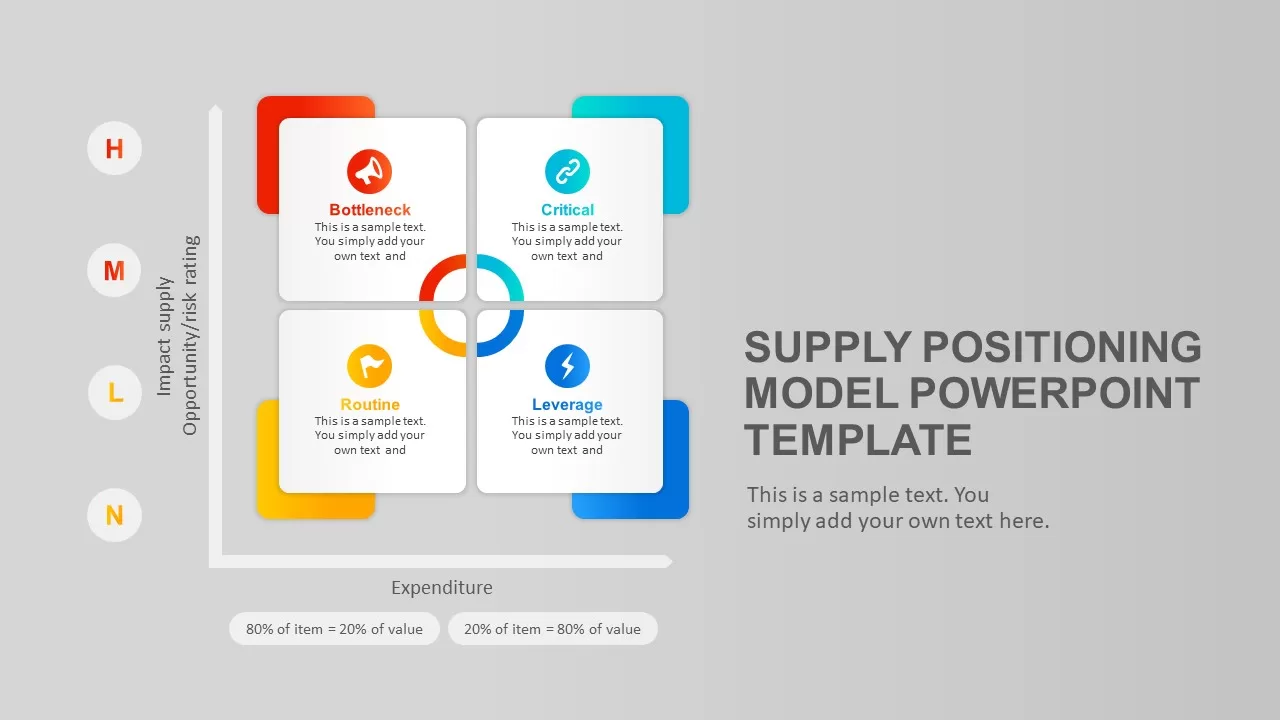
Supply Positioning Model Matrix Template for PowerPoint & Google Slides
Comparison Chart
Supply Positioning Model Template for PowerPoint & Google Slides
Business Models
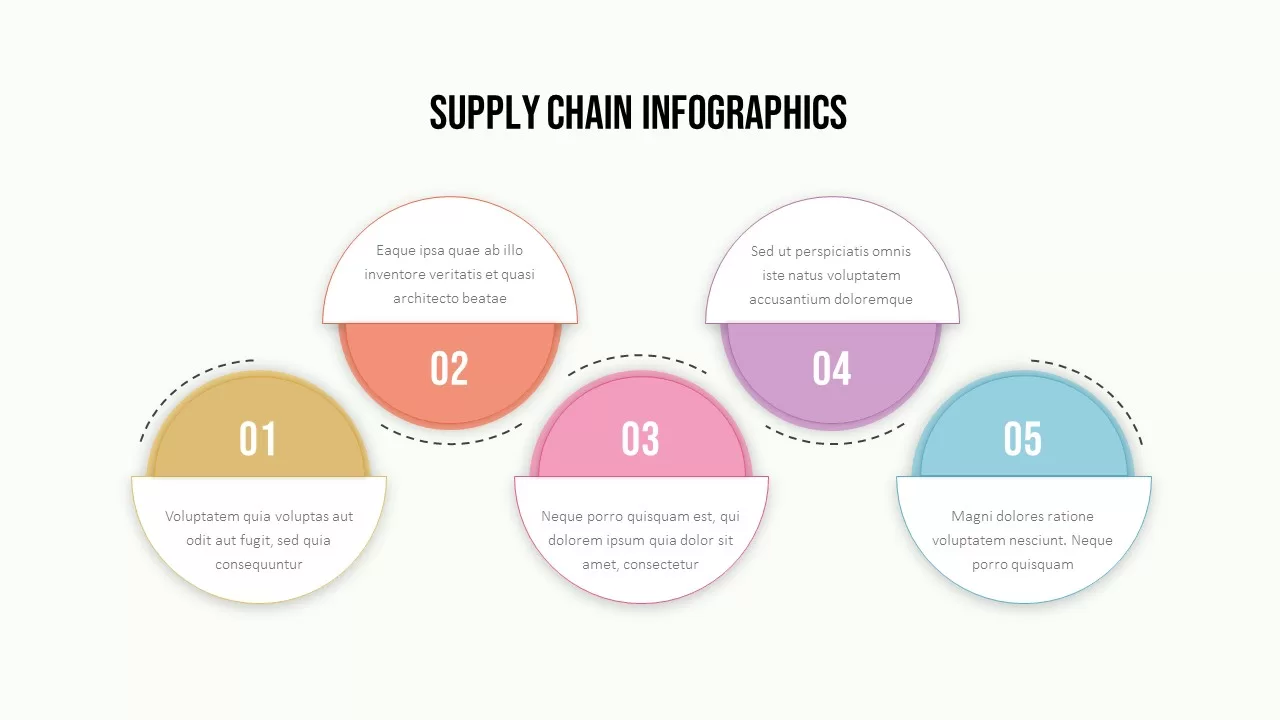
Supply Chain Circular Process Infographics Template for PowerPoint & Google Slides
Business Strategy
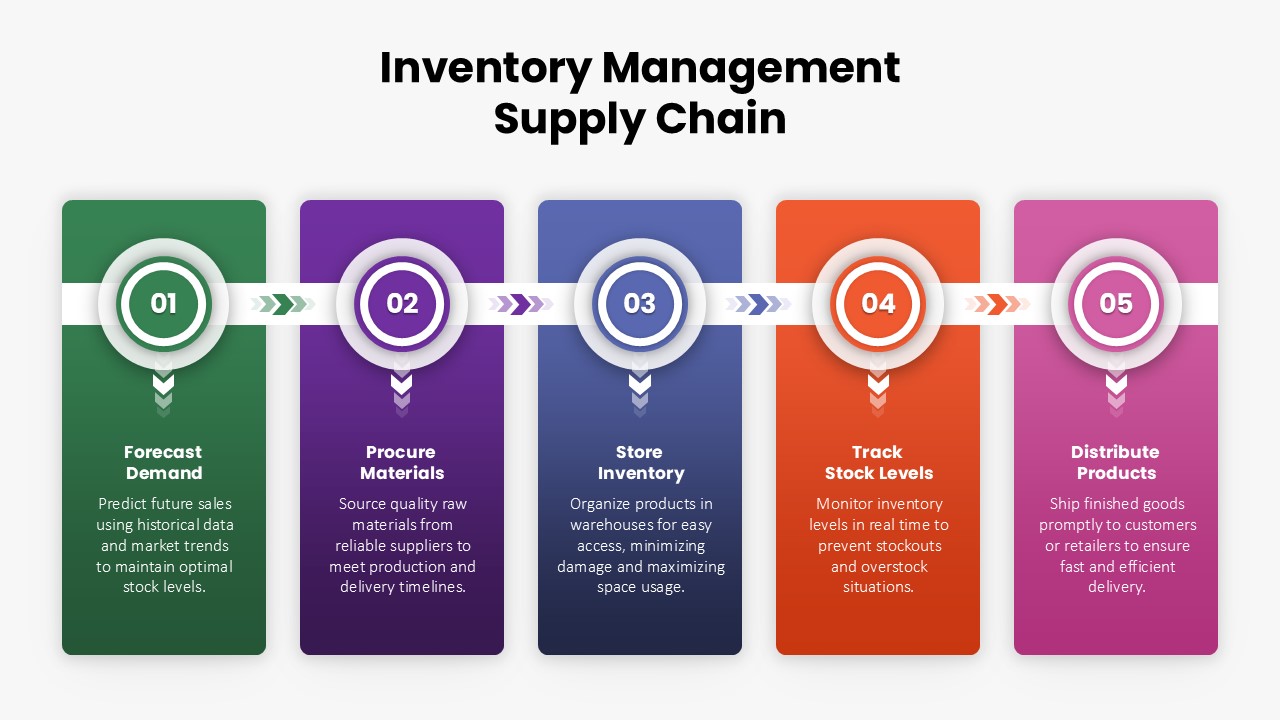
Inventory Management Supply Chain Template for PowerPoint & Google Slides
Process
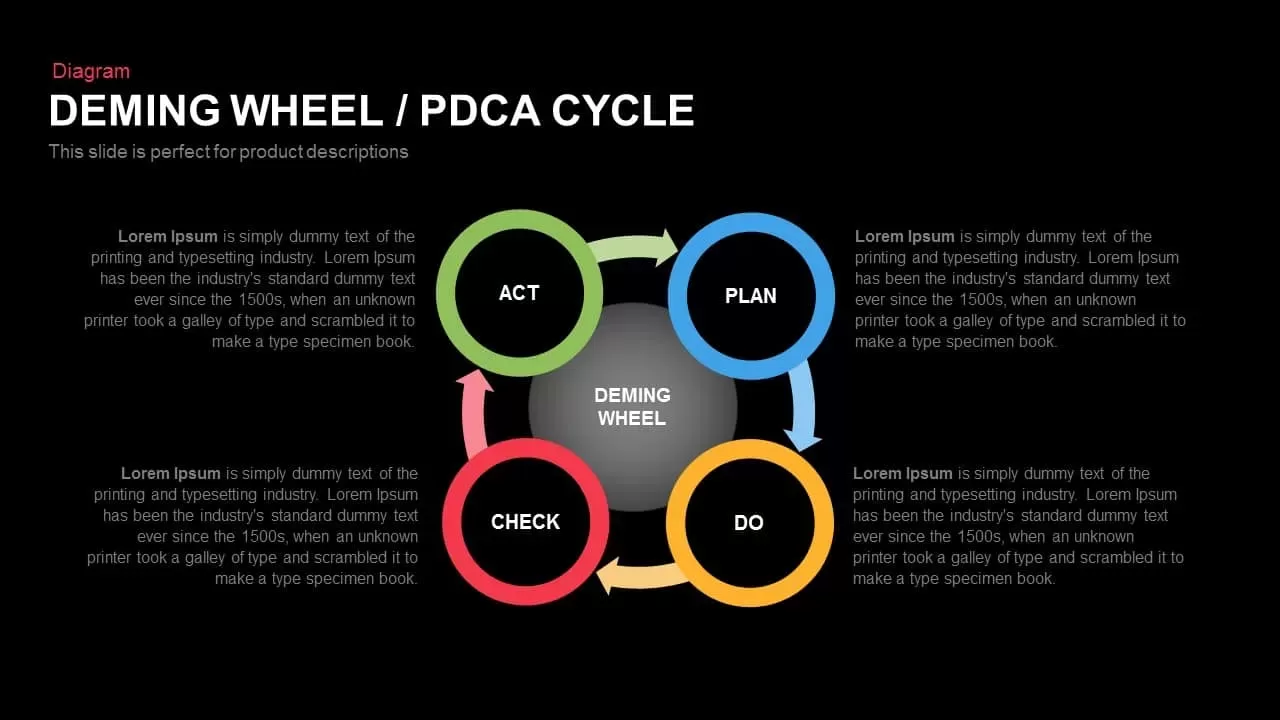
Deming Wheel PDCA Cycle Diagram Template for PowerPoint & Google Slides
Business Plan
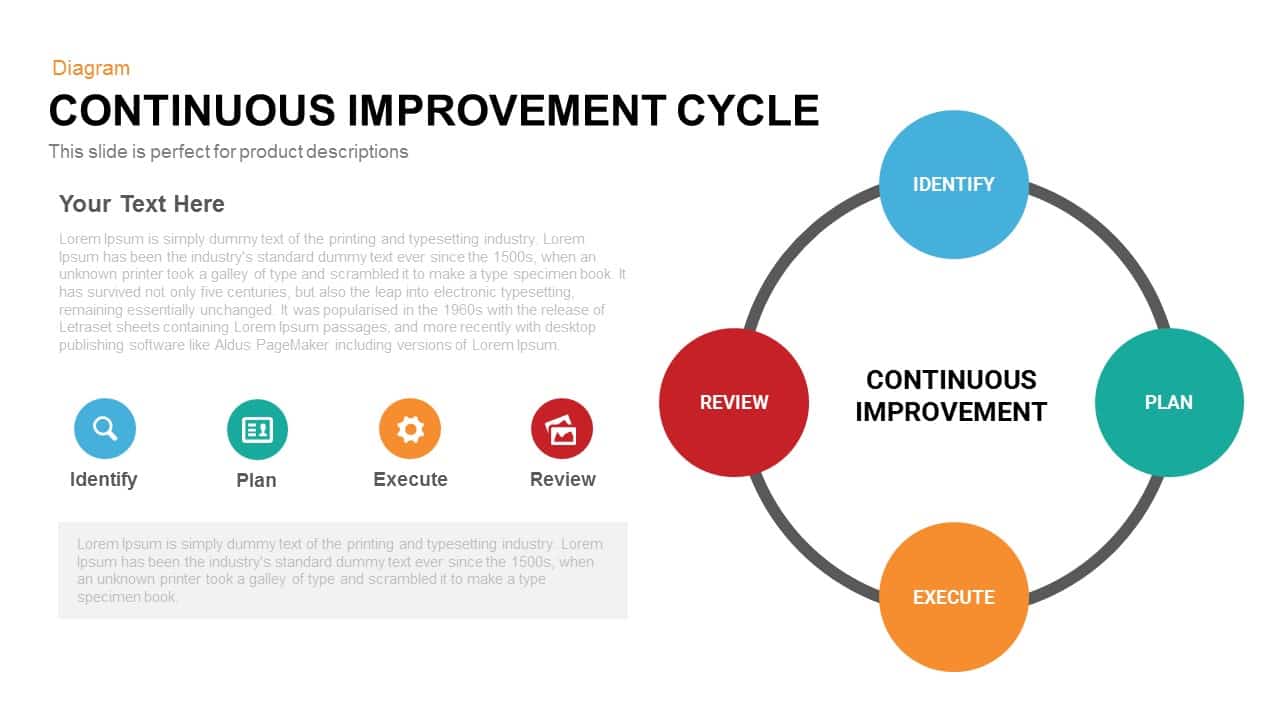
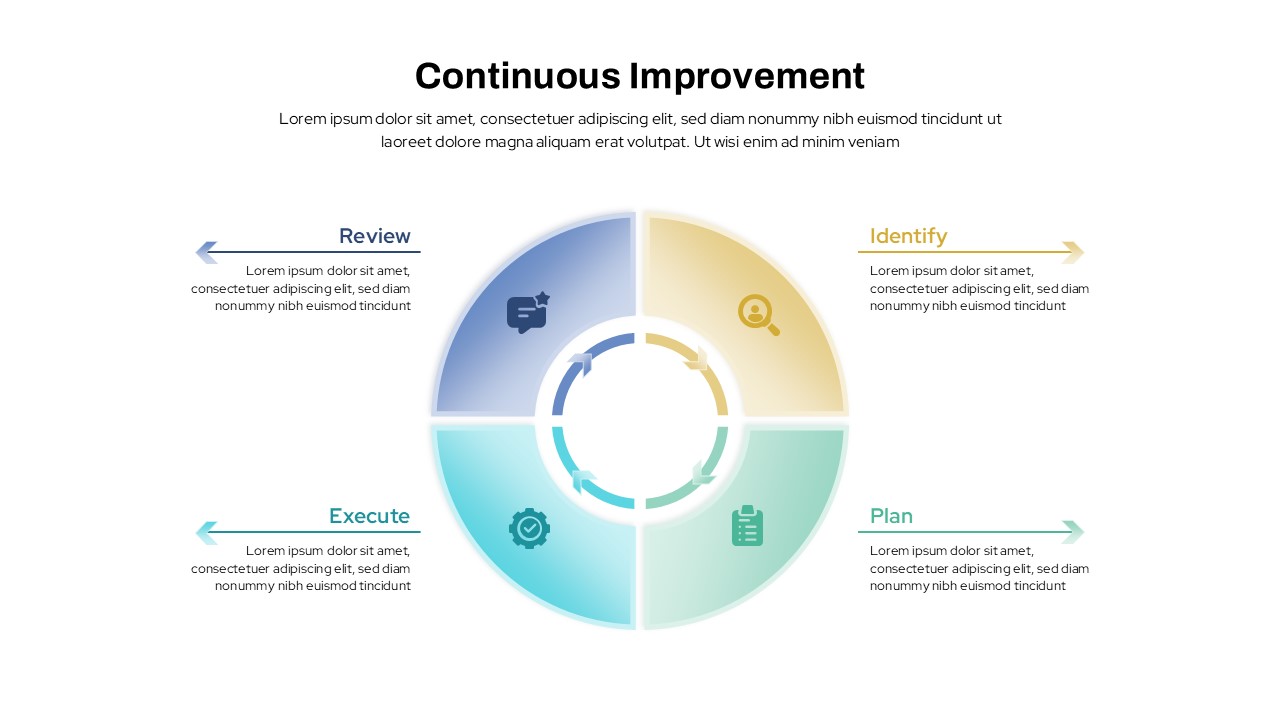
Continuous Improvement Cycle Diagram Template for PowerPoint & Google Slides
Circular
Modern Five-Stage Cycle Process Diagram Template for PowerPoint & Google Slides
Process
Six-Stage Circular Cycle Diagram Template for PowerPoint & Google Slides
Process
Four-Point Arrow Cycle Diagram Template for PowerPoint & Google Slides
Arrow

Data-Driven Marketing Cycle Diagram Template for PowerPoint & Google Slides
Customer Journey
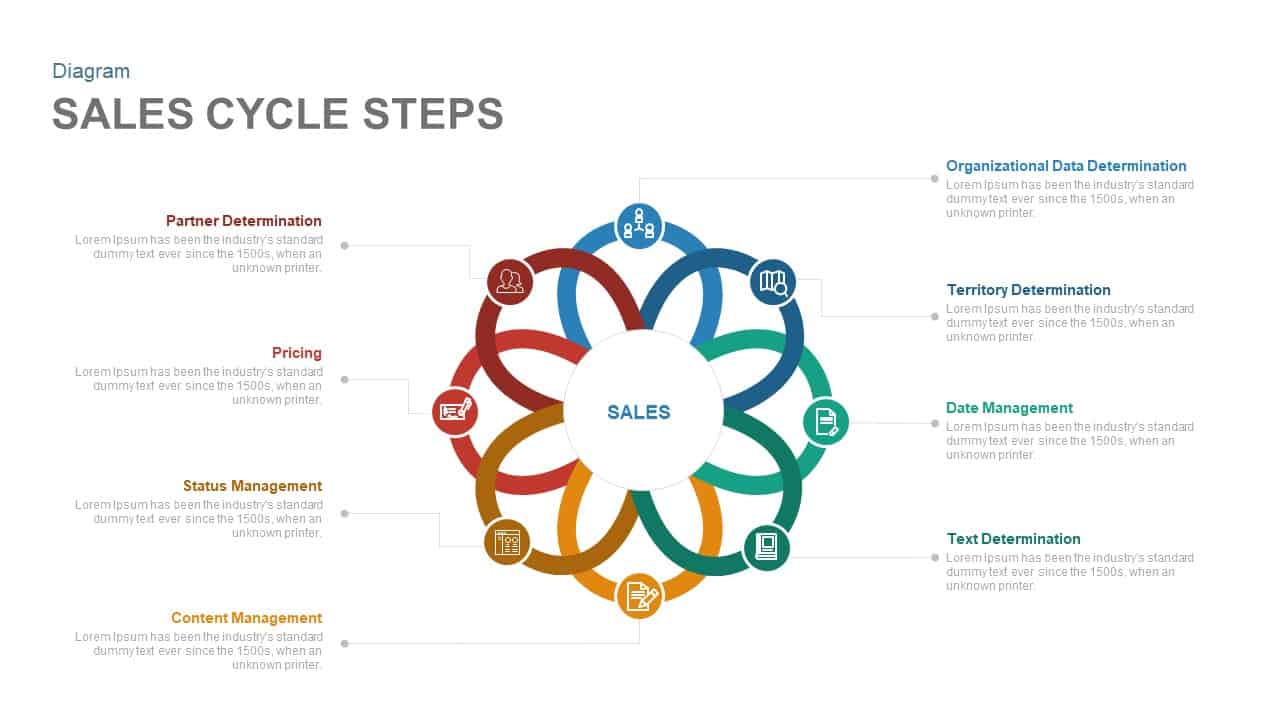
Eight-Step Sales Cycle Diagram Template for PowerPoint & Google Slides
Process
Software Development Life Cycle Diagram Template for PowerPoint & Google Slides
Circular
3, 4 & 5 Circular Stages Cycle Diagram Deck Template for PowerPoint & Google Slides
Circular
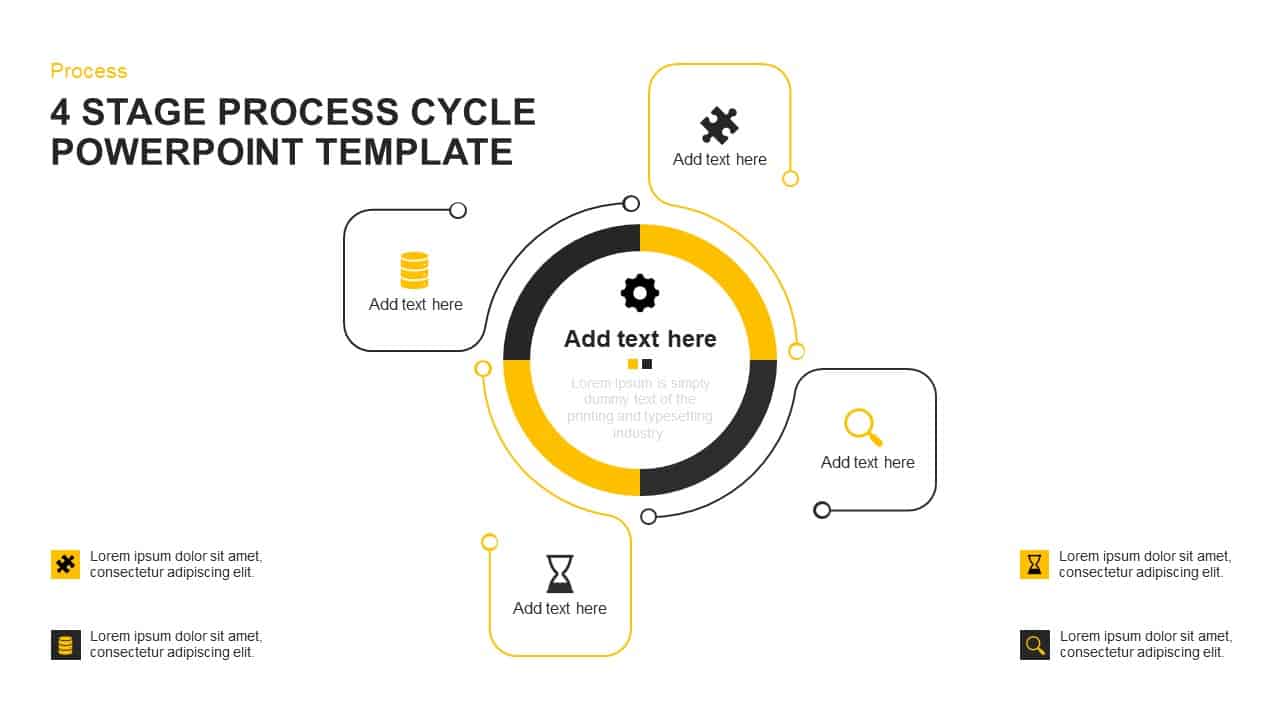
Four-Stage Cycle Process Diagram Template for PowerPoint & Google Slides
Process
Data Migration Life Cycle Curved Diagram Template for PowerPoint & Google Slides
Process
8-Step Circular Accounting Cycle Diagram Template for PowerPoint & Google Slides
Accounting
Multi-Style Project Life Cycle Diagram Template for PowerPoint & Google Slides
Process
Modern 6-Step Cycle Diagram Slide Deck Template for PowerPoint & Google Slides
Process
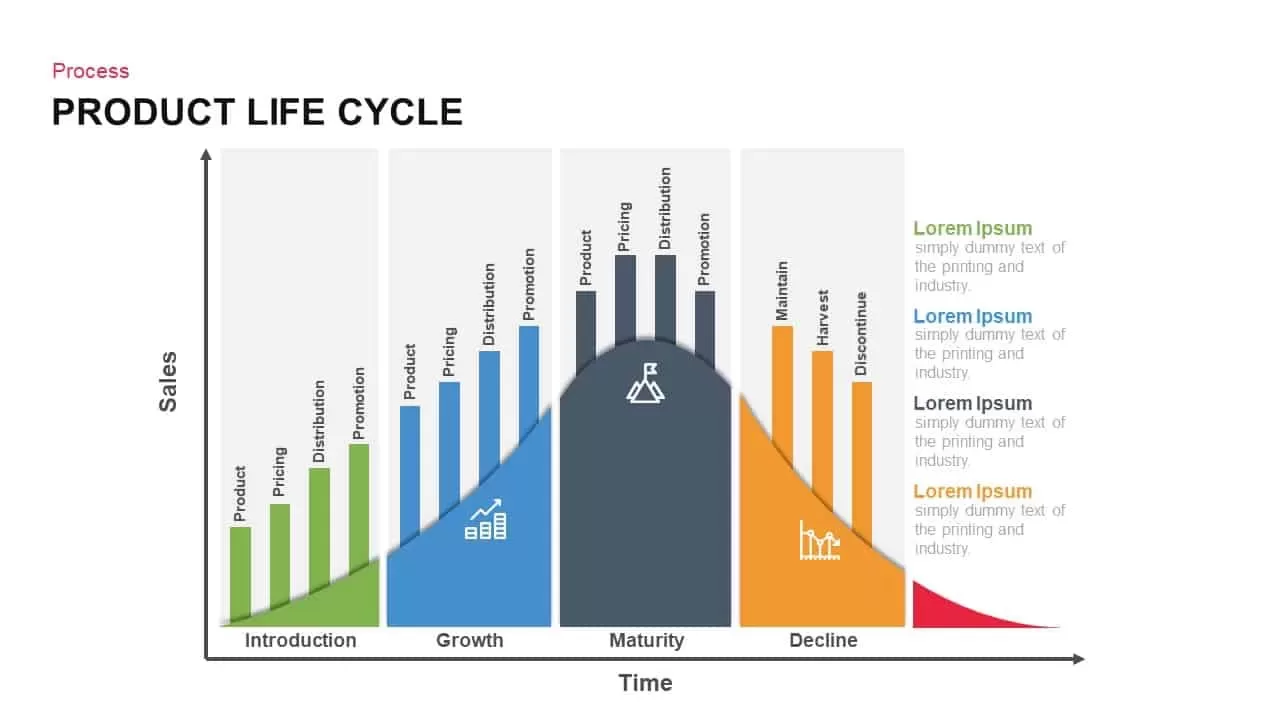
Corporate Product Life Cycle Diagram Template for PowerPoint & Google Slides
Process
Enterprise Risk Management Cycle Diagram Template for PowerPoint & Google Slides
Process
4MAT Learning Cycle Circular Diagram Template for PowerPoint & Google Slides
Circular
4-Step Circular PDCA Cycle Diagram Template for PowerPoint & Google Slides
Process
Continuous Improvement Cycle Diagram Template for PowerPoint & Google Slides
Process
7-Step Virtuous Economy Cycle Diagram Template for PowerPoint & Google Slides
Process
Communication Cycle Process Diagram template for PowerPoint & Google Slides
Business
Concentric Circular Arrow Cycle Diagram Template for PowerPoint & Google Slides
Process
3R Waste Management Cycle Diagram Template for PowerPoint & Google Slides
Circular
Release Management Cycle Circular Diagram Template for PowerPoint & Google Slides
Software Development
Business Process Analysis Cycle Diagram Template for PowerPoint & Google Slides
Business Strategy
Free Time Management Clock Cycle Diagram Template for PowerPoint & Google Slides
Process
Free
Three-Phase Triangle Cycle Diagram Template for PowerPoint & Google Slides
Infographics
Working Capital Cycle Diagram Template for PowerPoint & Google Slides
Circular
Gartner Hype Cycle Adoption Curve Diagram Template for PowerPoint & Google Slides
Infographics
Colorful Startup Financing Cycle Diagram Template for PowerPoint & Google Slides
Finance
ML Development Life Cycle Diagram Template for PowerPoint & Google Slides
Machine Learning
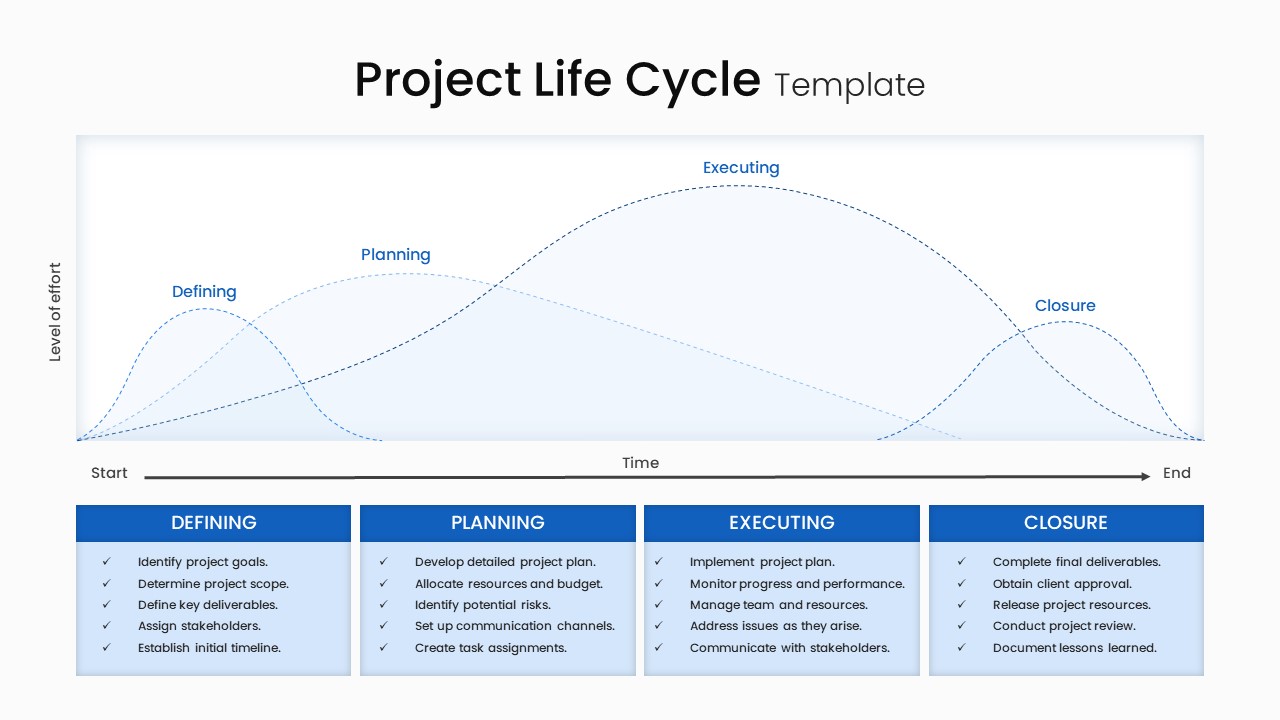
Project Life Cycle Workflow Diagram Template for PowerPoint & Google Slides
Process
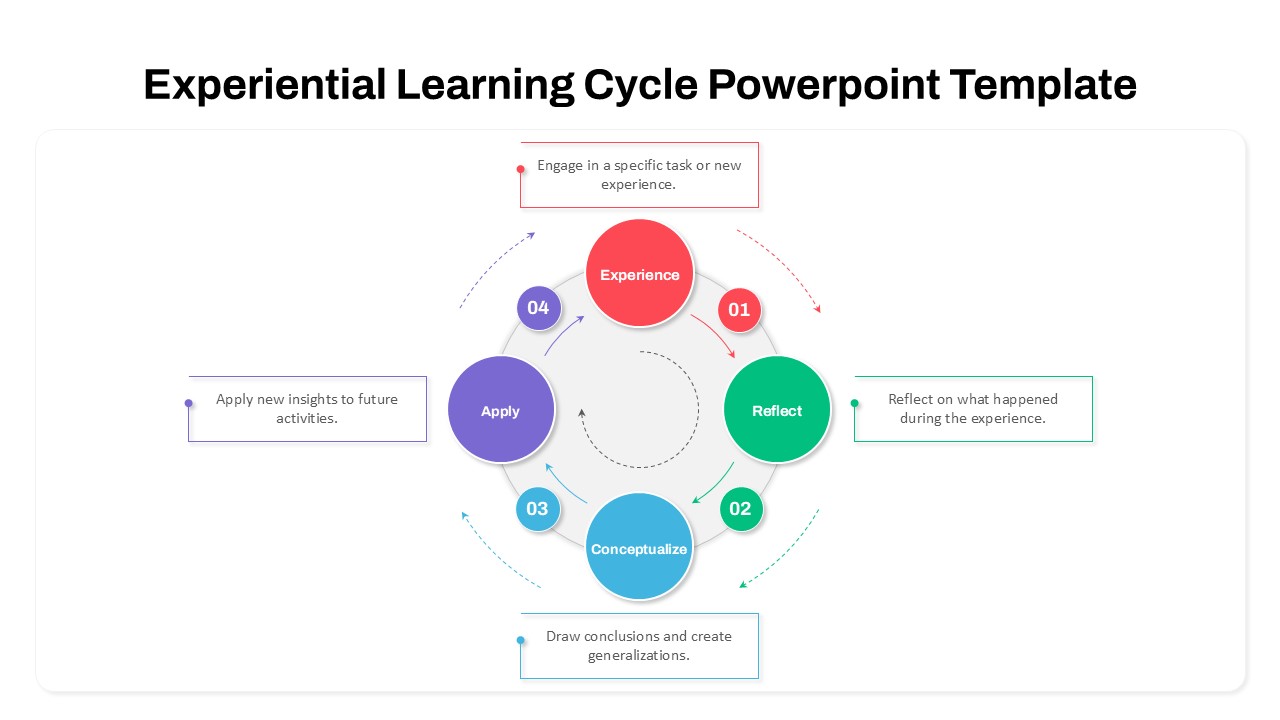
Experiential Learning Cycle Diagram Template for PowerPoint & Google Slides
Circular
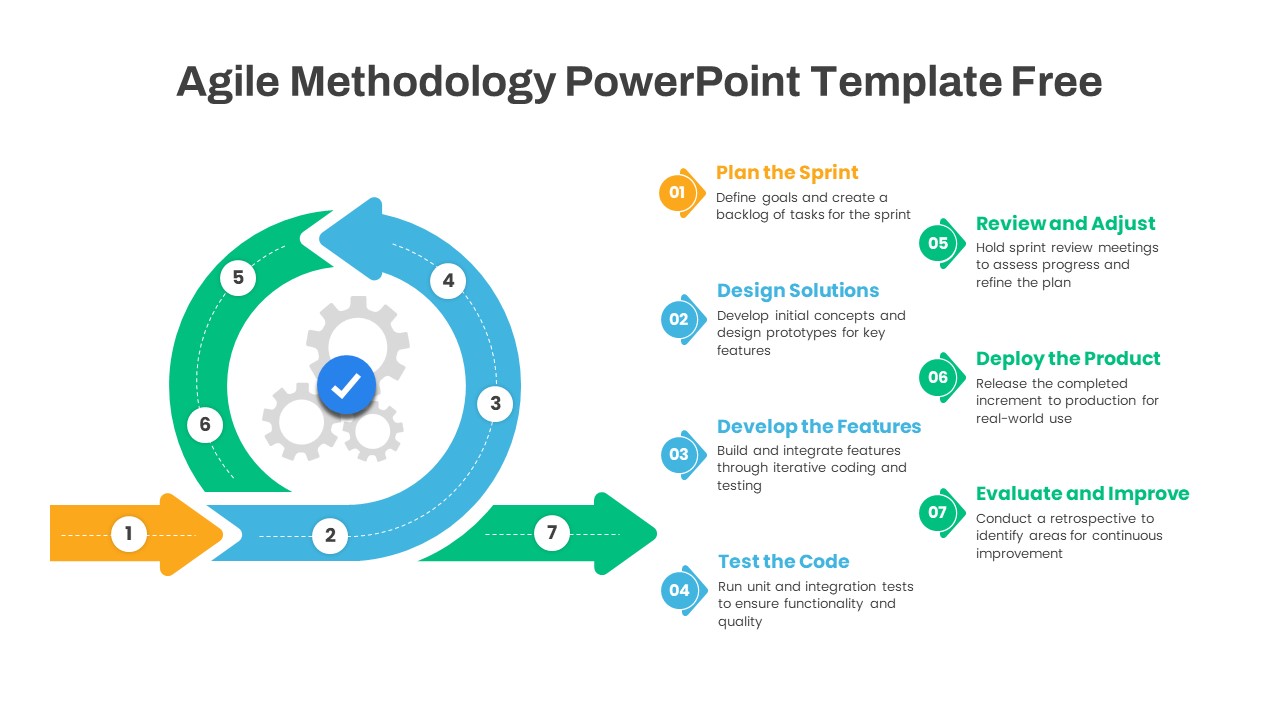
Agile Methodology Cycle Diagram Template for PowerPoint & Google Slides
Project
Free
Change Management Process Cycle Diagram Template for PowerPoint & Google Slides
Process
Flywheel Growth Cycle Diagram Template for PowerPoint & Google Slides
Circular
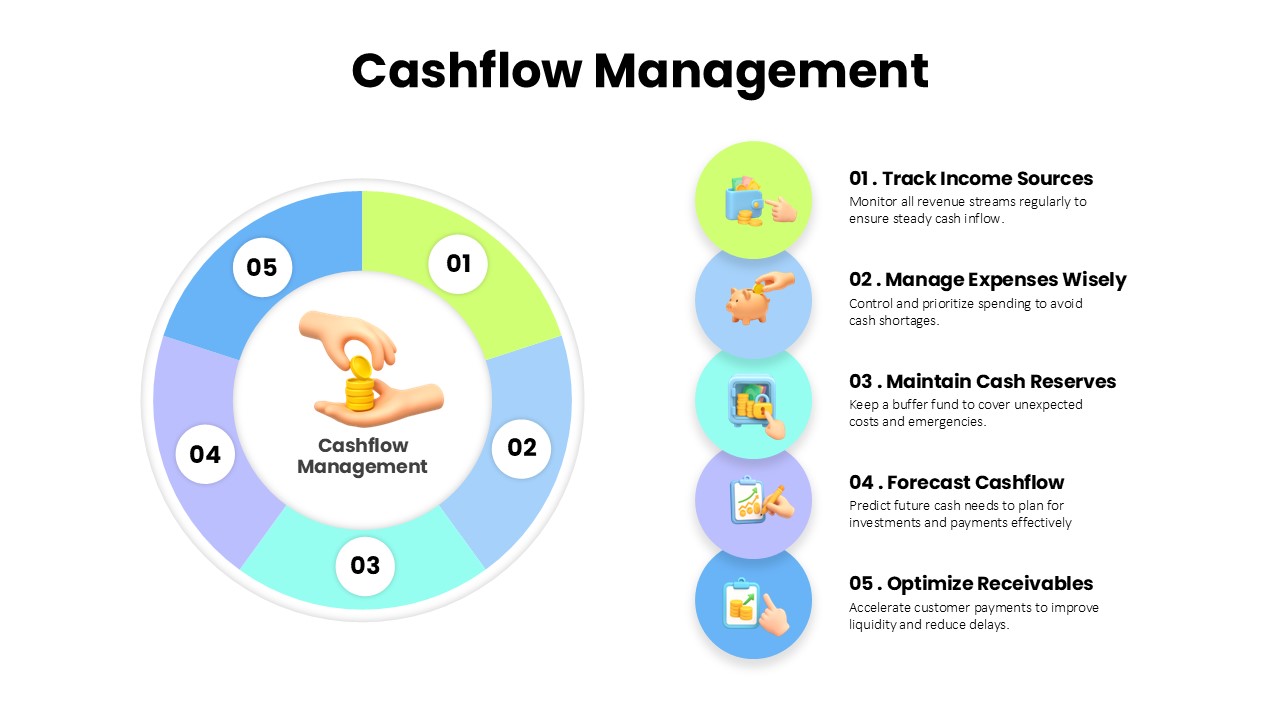
Cashflow Management Cycle Diagram Template for PowerPoint & Google Slides
Finance
Continuous Improvement Cycle Diagram Template for PowerPoint & Google Slides
Process
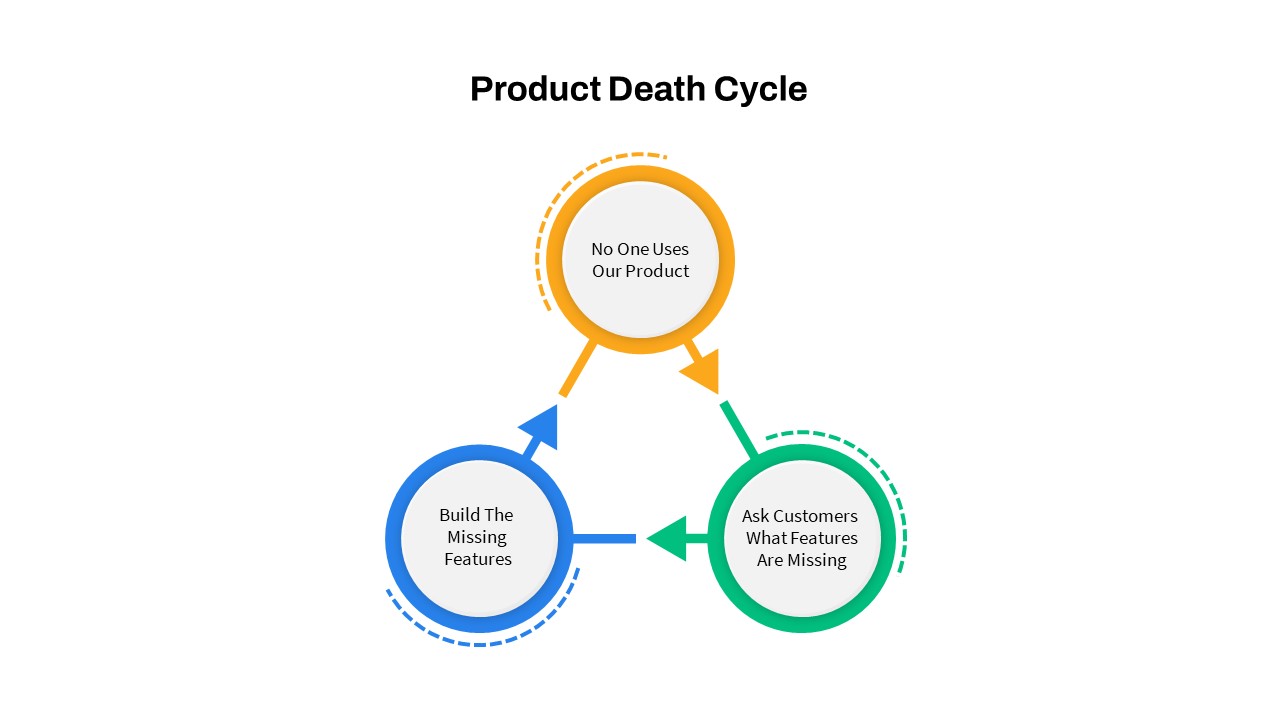
Product Death Cycle Diagram Slide for PowerPoint & Google Slides
Circular
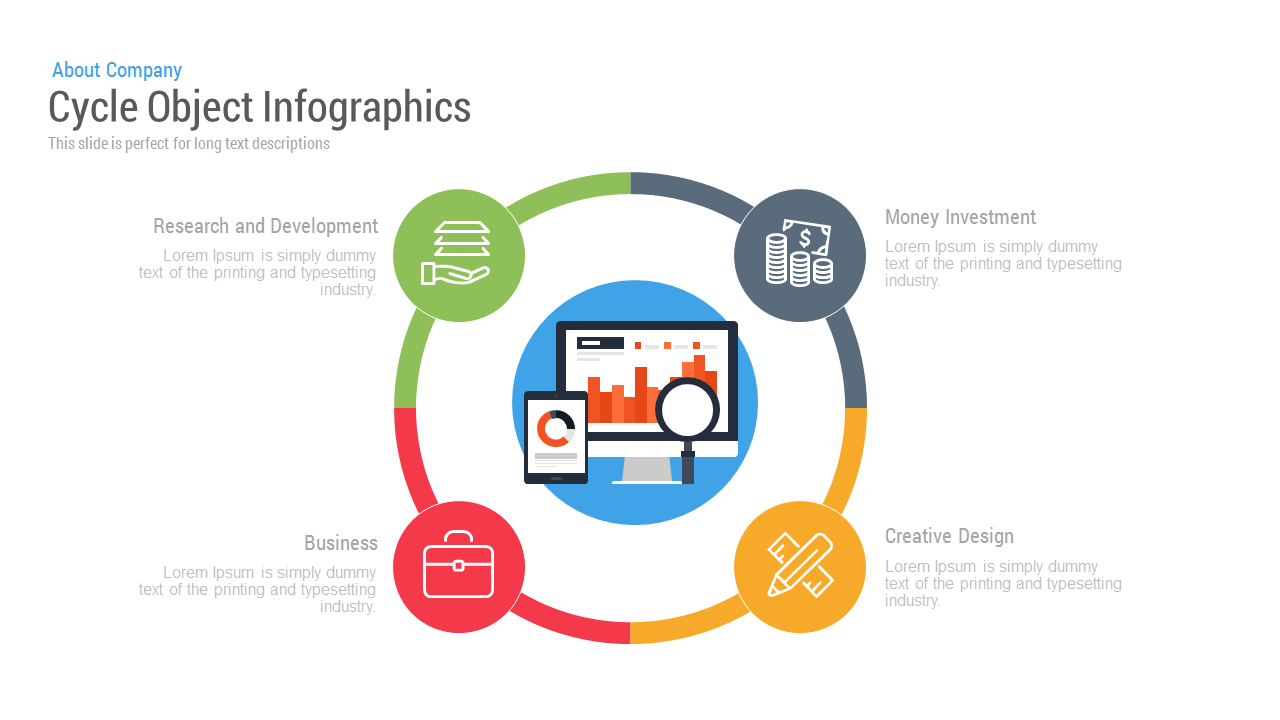
Free Cycle Object Infographics template for PowerPoint & Google Slides
Process
Free
Performance Review Process Management Cycle template for PowerPoint & Google Slides
Employee Performance
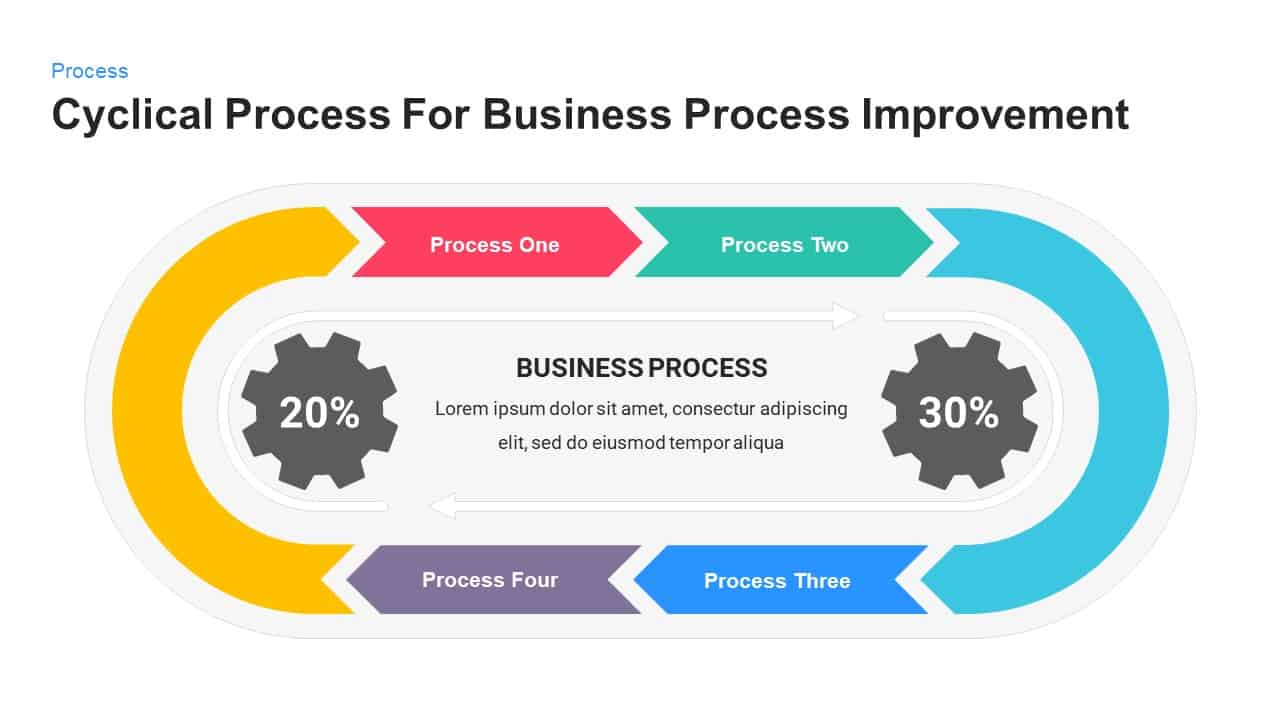
Business Process Improvement Cycle Template for PowerPoint & Google Slides
Process
Product Life Cycle Infographics template for PowerPoint & Google Slides
Business
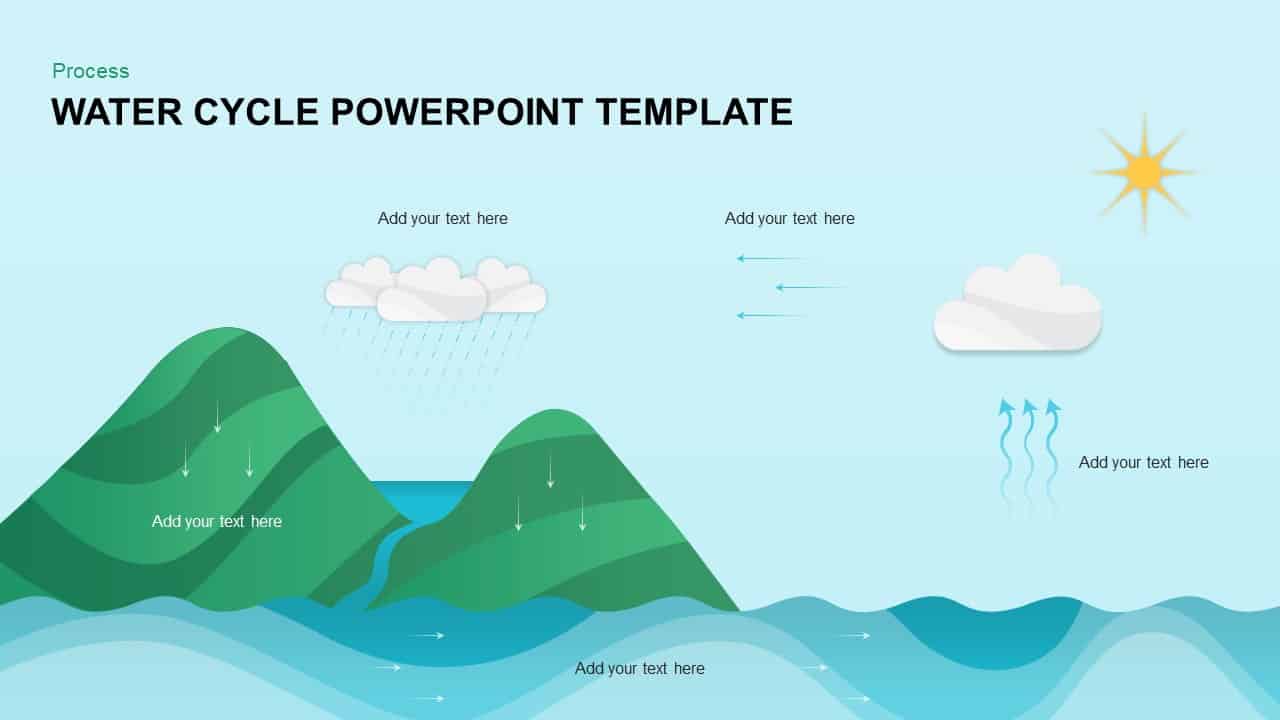
Water Cycle Process Infographic Template for PowerPoint & Google Slides
Process
Four-Stage Process Cycle Variations Pack Template for PowerPoint & Google Slides
Process
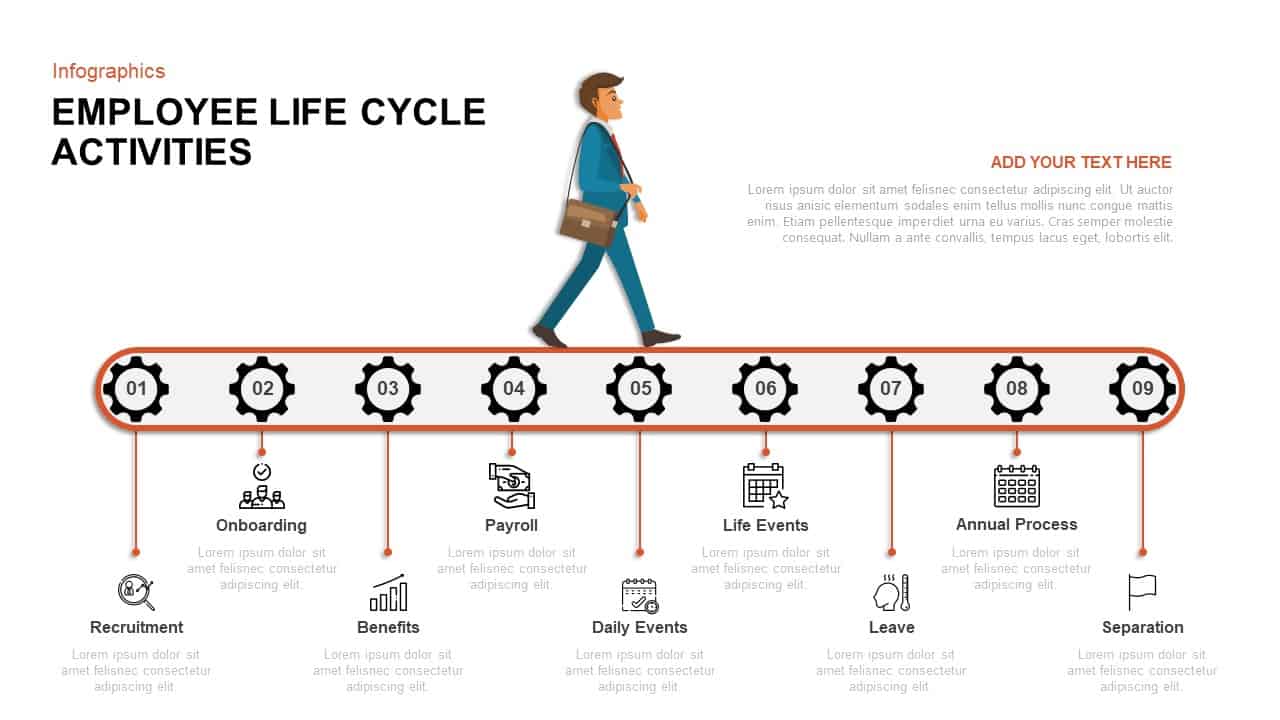
Employee Life Cycle Activities Template for PowerPoint & Google Slides
Timeline
Employee Life Cycle Activities Process Template for PowerPoint & Google Slides
Employee Performance
Business Process Improvement Cycle Template for PowerPoint & Google Slides
Circular
Strategic ADL Matrix by Industry Life Cycle & Position Template for PowerPoint & Google Slides
Business Strategy
Creative Cycle Process Infographics Template for PowerPoint & Google Slides
Process
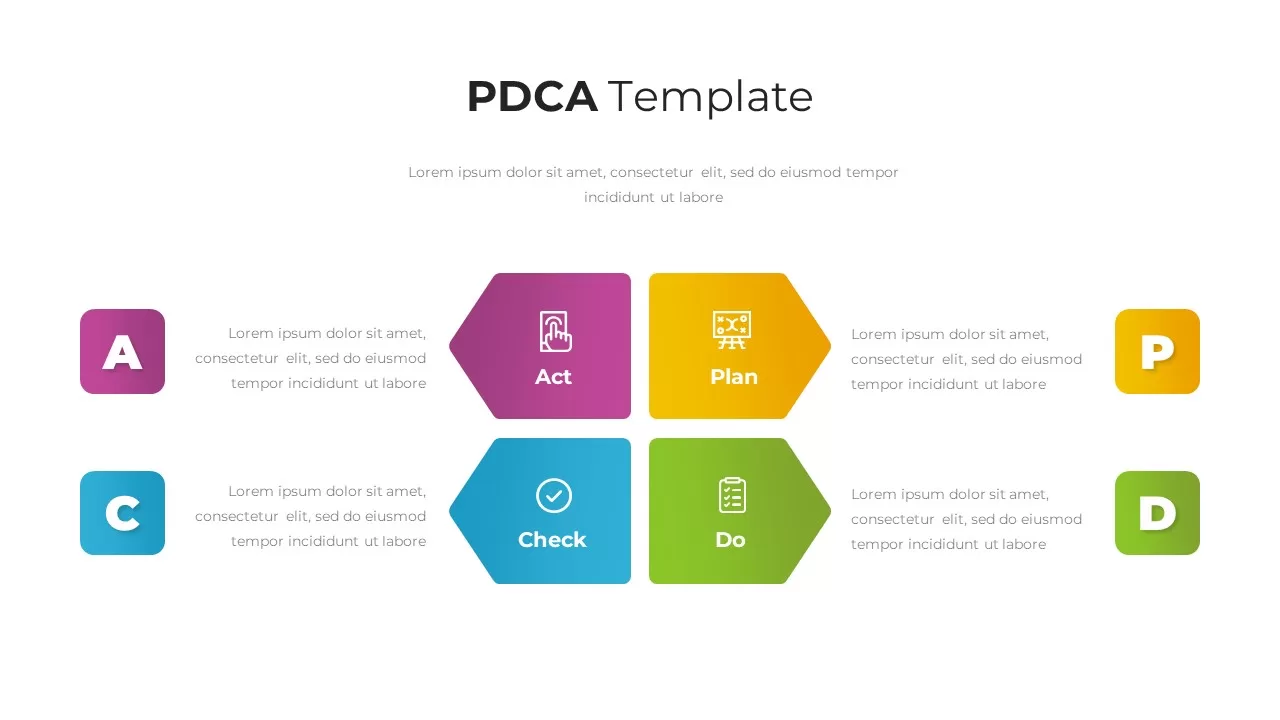
Plan Do Check Act PDCA Cycle Infographic Template for PowerPoint & Google Slides
Process
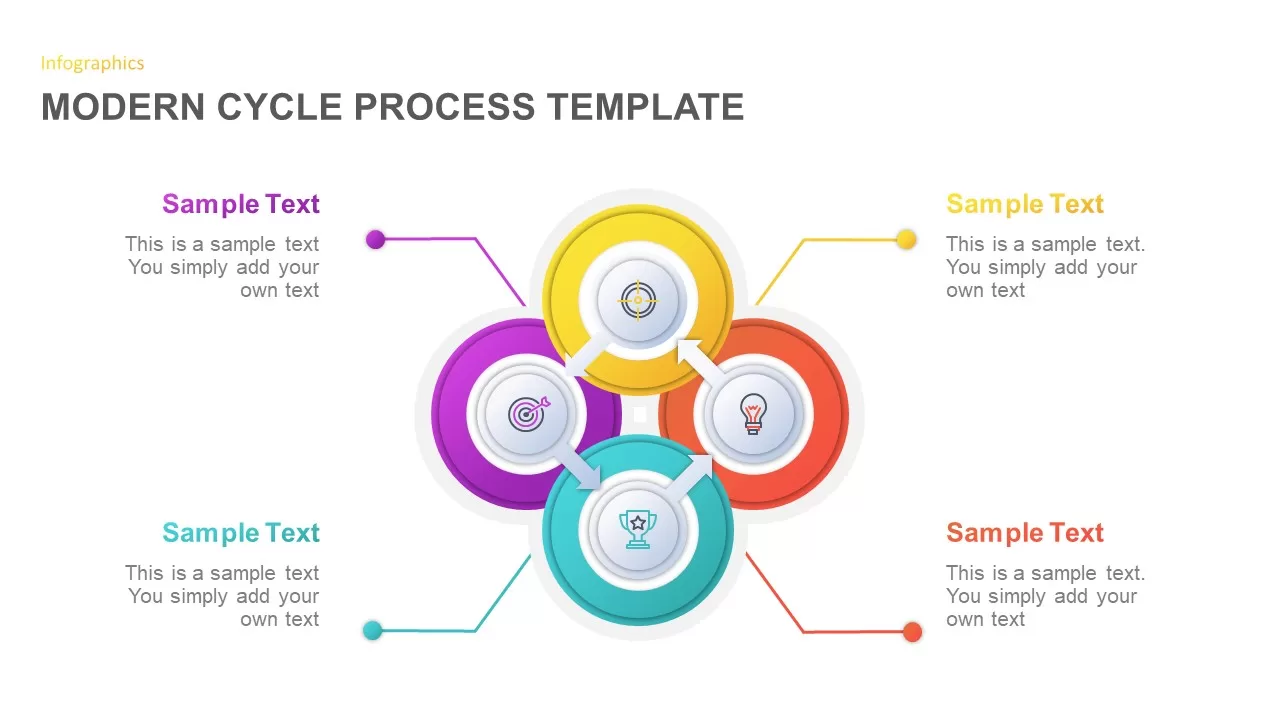
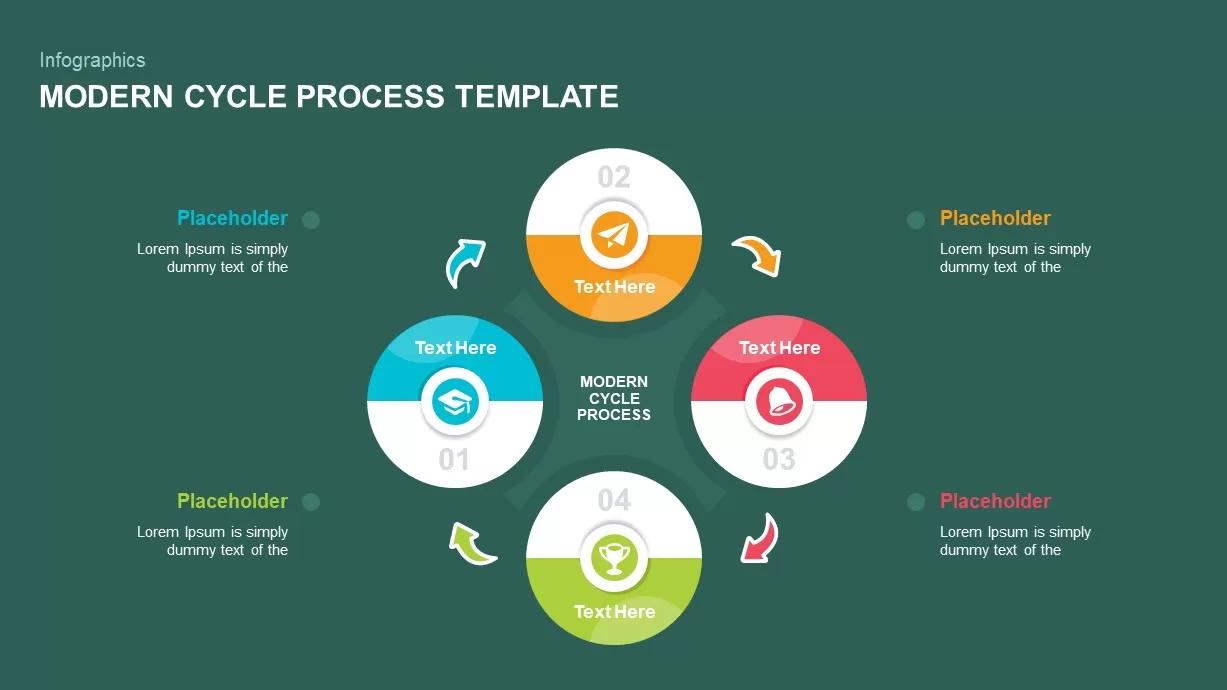
Modern Cycle Process Template for PowerPoint & Google Slides
Business Proposal
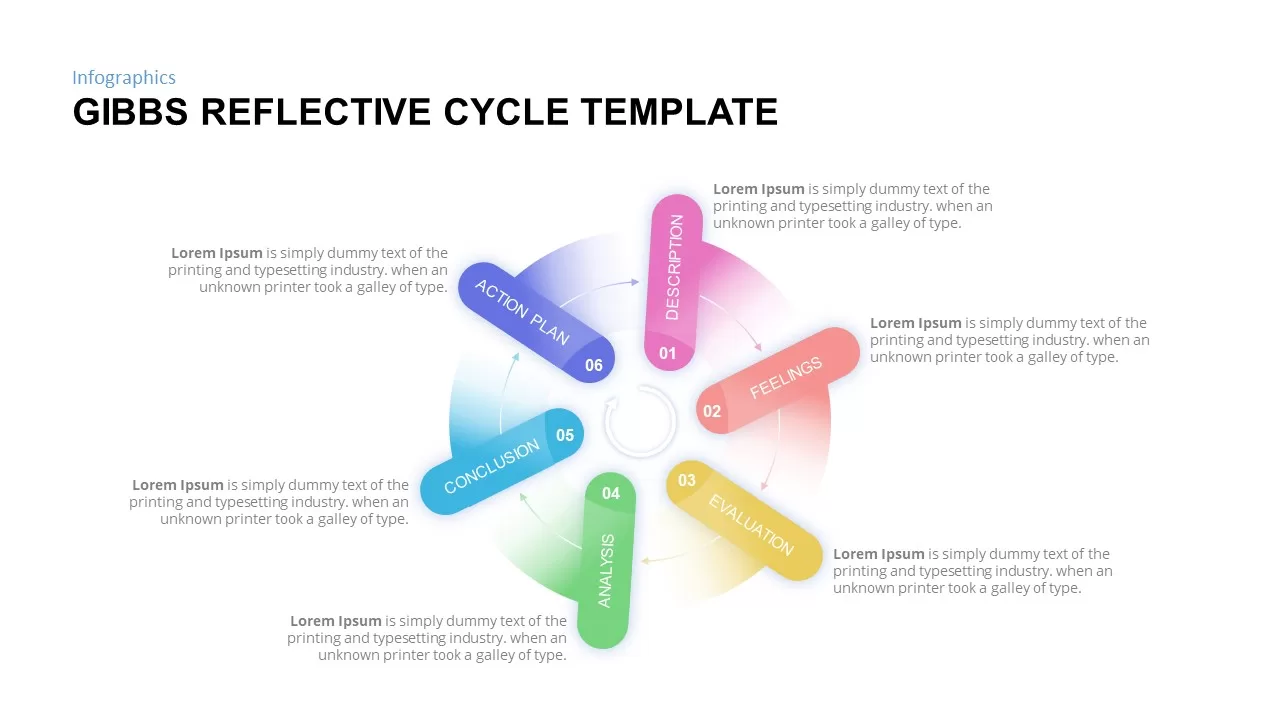
Gibbs Reflective Cycle Overview Template for PowerPoint & Google Slides
Process
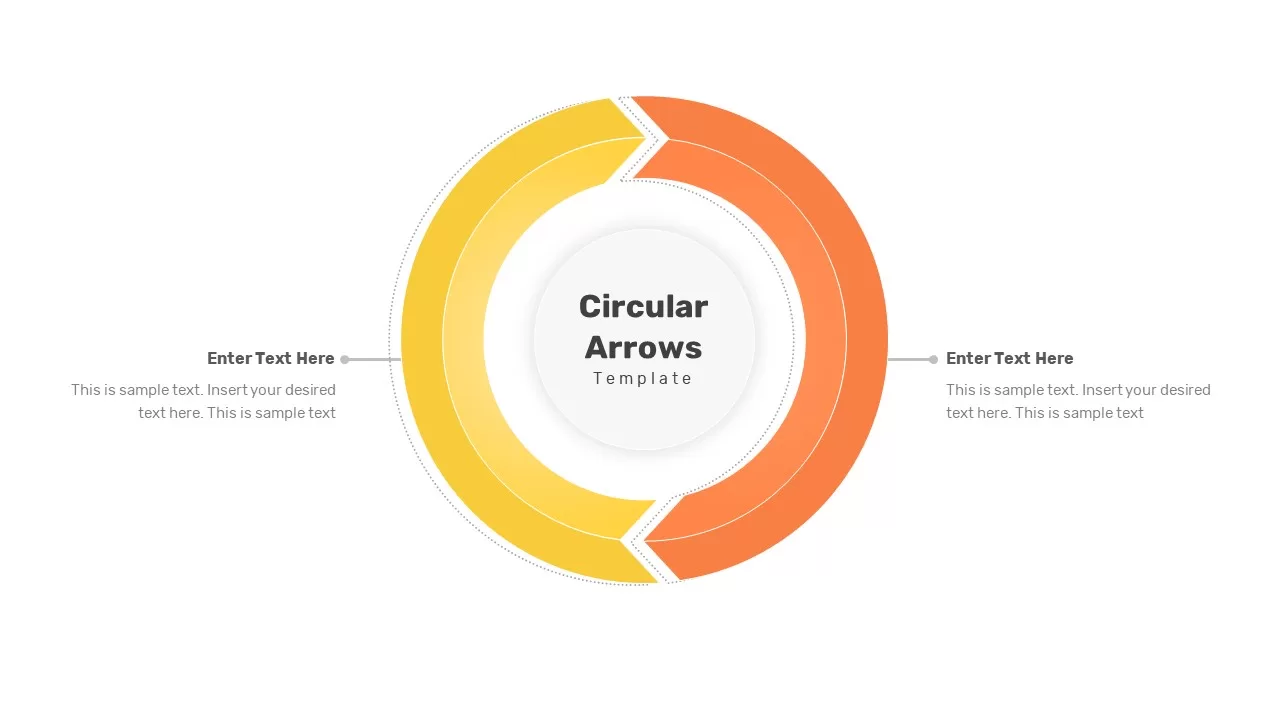
Dual-Stage Circular Arrow Cycle Template for PowerPoint & Google Slides
Process
Three-Segment Circular Arrow Cycle Template for PowerPoint & Google Slides
Circular
Four-Segment Circular Arrow Cycle Template for PowerPoint & Google Slides
Circular
Six-Segment Circular Arrow Cycle Template for PowerPoint & Google Slides
Circular
PDCA Cycle Infographic with Four Stages Template for PowerPoint & Google Slides
Process
PDCA Plan Do Check Act Cycle Infographic Template for PowerPoint & Google Slides
Process
PDCA Four-Stage Cycle Infographic Template for PowerPoint & Google Slides
Process
Robotics Process Cycle Infographic Template for PowerPoint & Google Slides
Process
Design Thinking Process Cycle Slide Template for PowerPoint & Google Slides
Process
Hexagonal Design Thinking Cycle Template for PowerPoint & Google Slides
Process
Business Process Reengineering Cycle Template for PowerPoint & Google Slides
Circular
Strategic Dialogue Model Cycle Template for PowerPoint & Google Slides
Circular
3R Waste Management Cycle Overview template for PowerPoint & Google Slides
Process
Iterative Strategic Planning Cycle Template for PowerPoint & Google Slides
Business Strategy
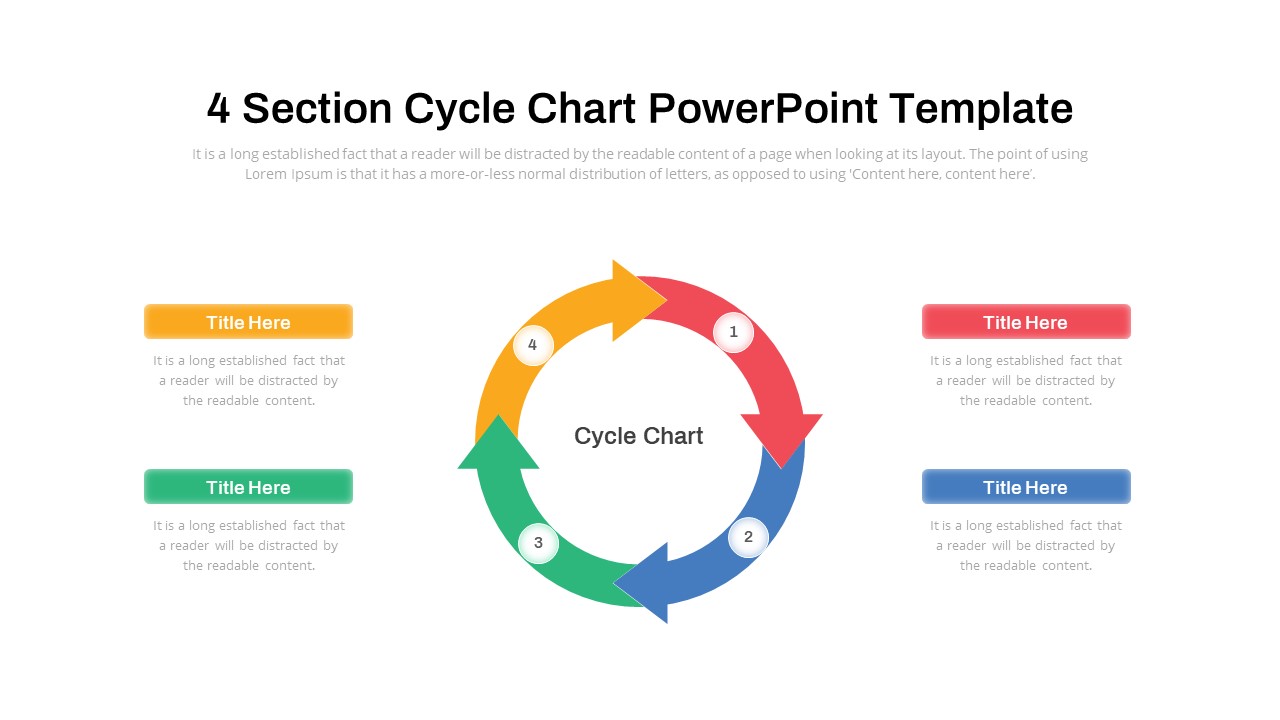
Cycle Chart Template for PowerPoint & Google Slides
Circular
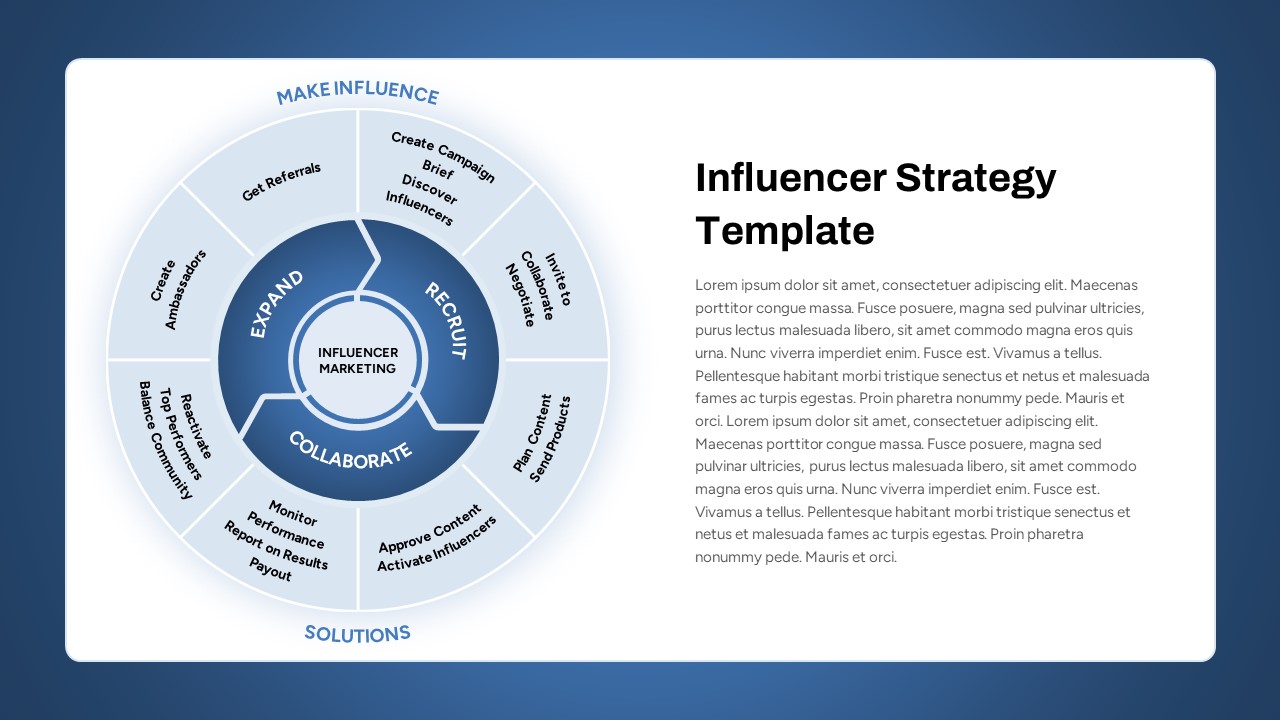
Influencer Marketing Cycle Strategy Template for PowerPoint & Google Slides
Circular
Seeds Growth Cycle Business Model Template for PowerPoint & Google Slides
Process
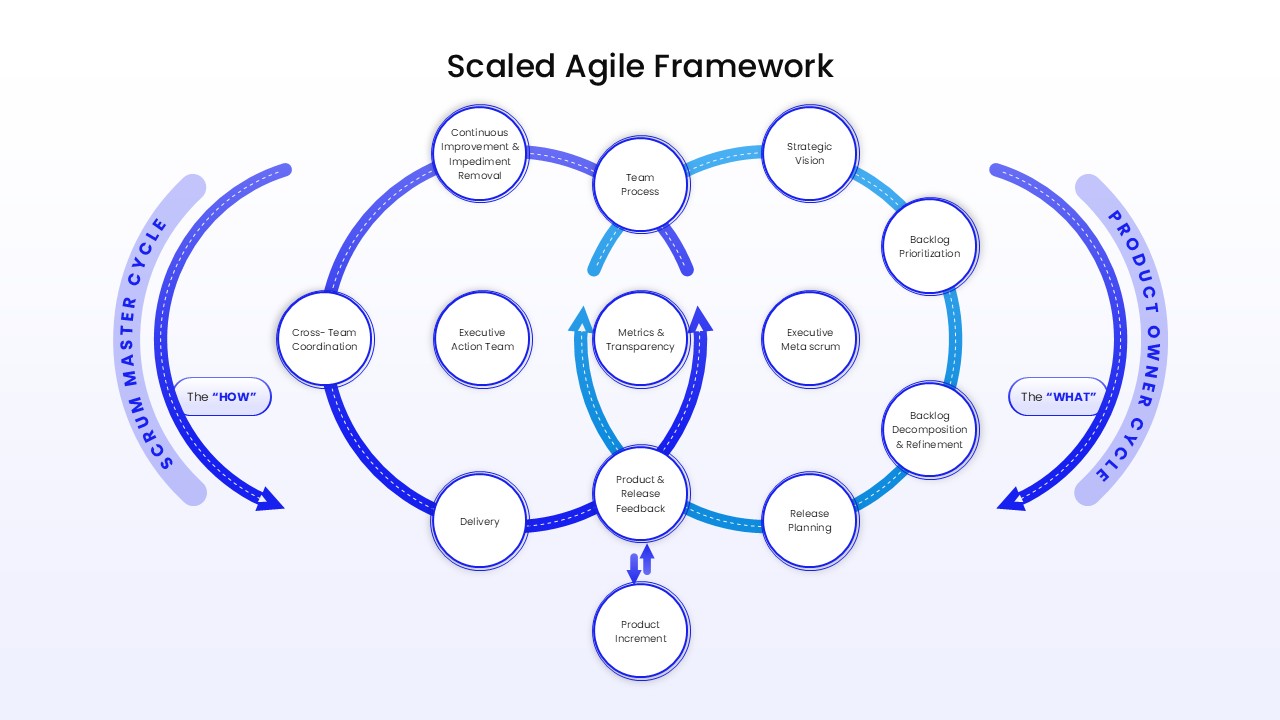
Two-Cycle Scaled Agile Framework Template for PowerPoint & Google Slides
Scrum
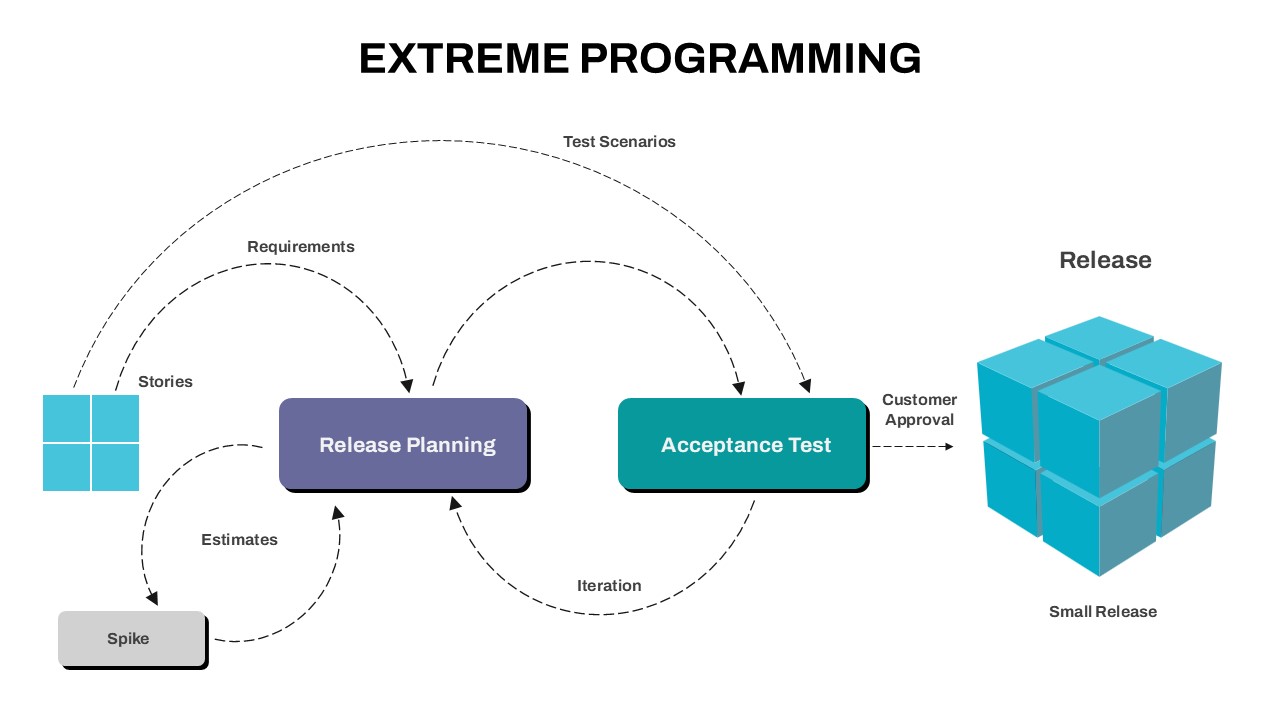
Extreme Programming Process Cycle Template for PowerPoint & Google Slides
Software Development
Modern Cycle Process for PowerPoint & Google Slides
Infographics
Snake Diagram Pack of 8 Slides template for PowerPoint & Google Slides
Process
Puzzle Diagram PowerPoint Template for PowerPoint & Google Slides
Process
Transportation Logistics PowerPoint Diagram template for PowerPoint & Google Slides
Process