Supply Chain Analytics Process Template for PowerPoint & Google Slides
Description
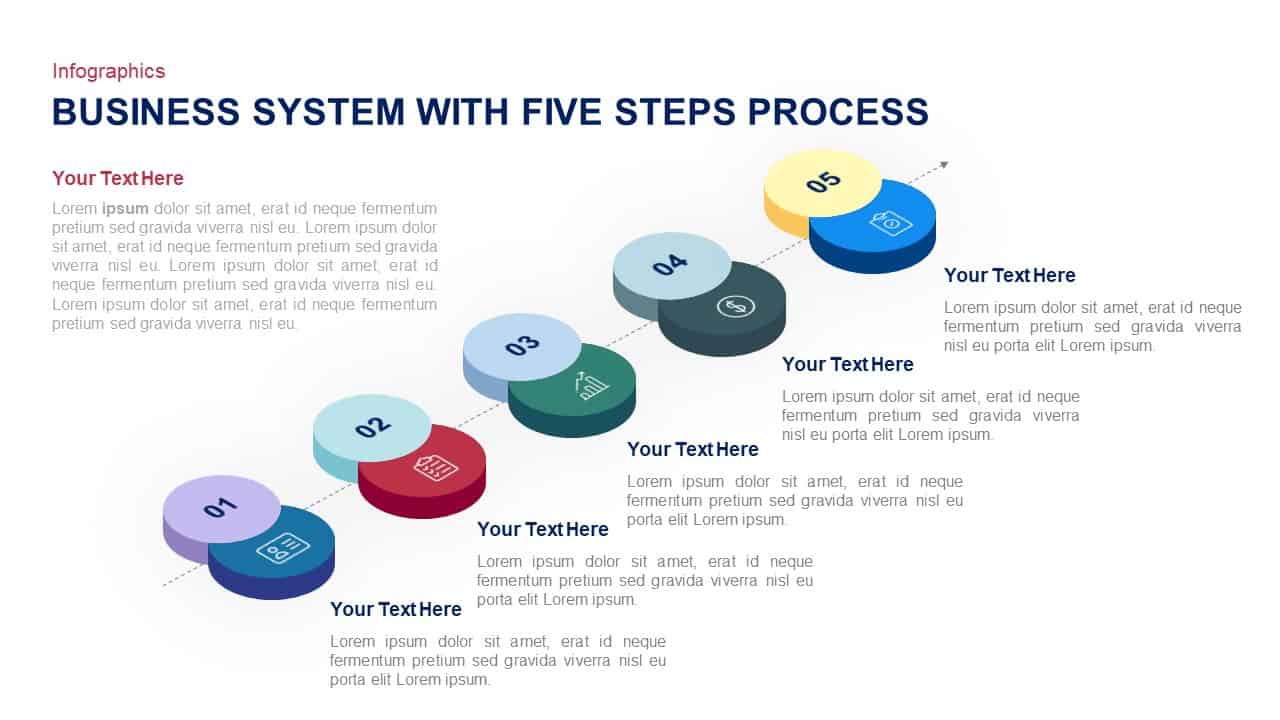
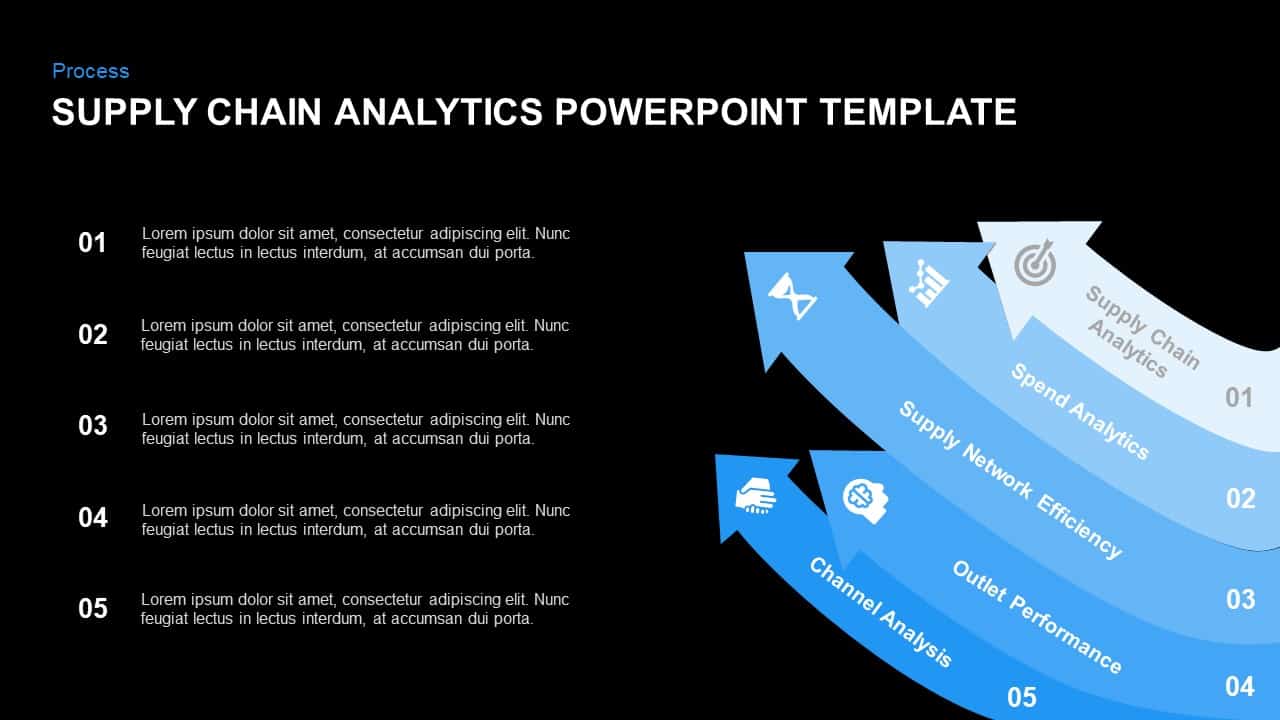
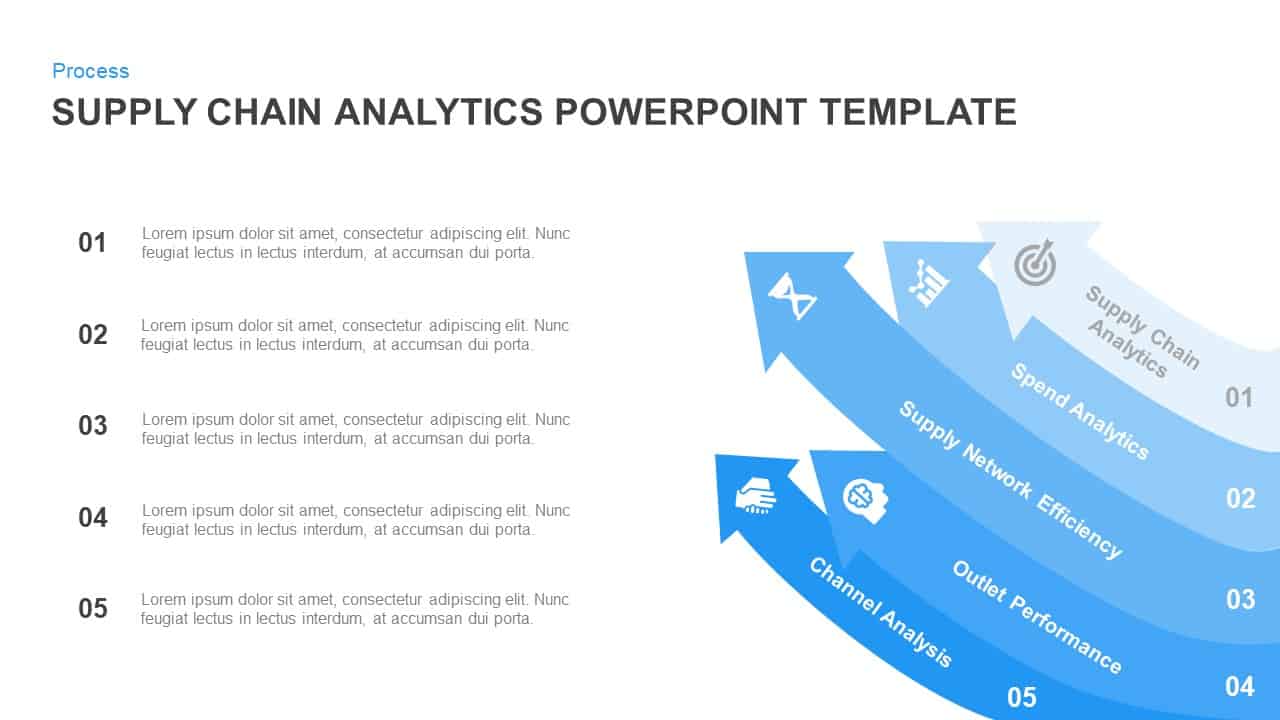
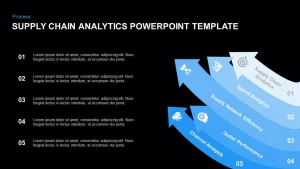
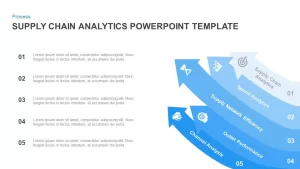
Optimize your supply chain presentations with this five-stage analytics process slide. A series of curved gradient arrows—ranging from light cyan to deep blue—flow upward, each labeled and iconified to represent Supply Chain Analytics, Spend Analytics, Supply Network Efficiency, Outlet Performance, and Channel Analysis. The staggered layering emphasizes the sequential nature of your analysis steps, while the bold arrowheads guide viewers through the journey. On the left, matching numbered text placeholders let you add detailed descriptions for each stage, ensuring clarity and depth. Fully editable master shapes, icons, and color stops allow you to rebrand effortlessly, adjust labels, or swap out metrics in seconds. The clean white background and crisp typography deliver maximum readability, whether you’re projecting in a boardroom or sharing via video conference. Use this slide to drive stakeholder alignment on where to focus optimization efforts, showcase metric improvements, and illustrate the iterative cycle of data-driven decision-making.
Who is it for
Supply chain analysts, operations managers, procurement leads, and business intelligence teams will leverage this slide to present end-to-end performance insights, benchmark spend categories, and map efficiency gains to decision-makers.
Other Uses
Repurpose this five-arrow layout for financial forecasting, marketing funnel reviews, customer journey stages, risk assessment frameworks, or product lifecycle mapping by simply relabeling arrows and updating icons.
Login to download this file

Item ID
SB01081
Related Templates

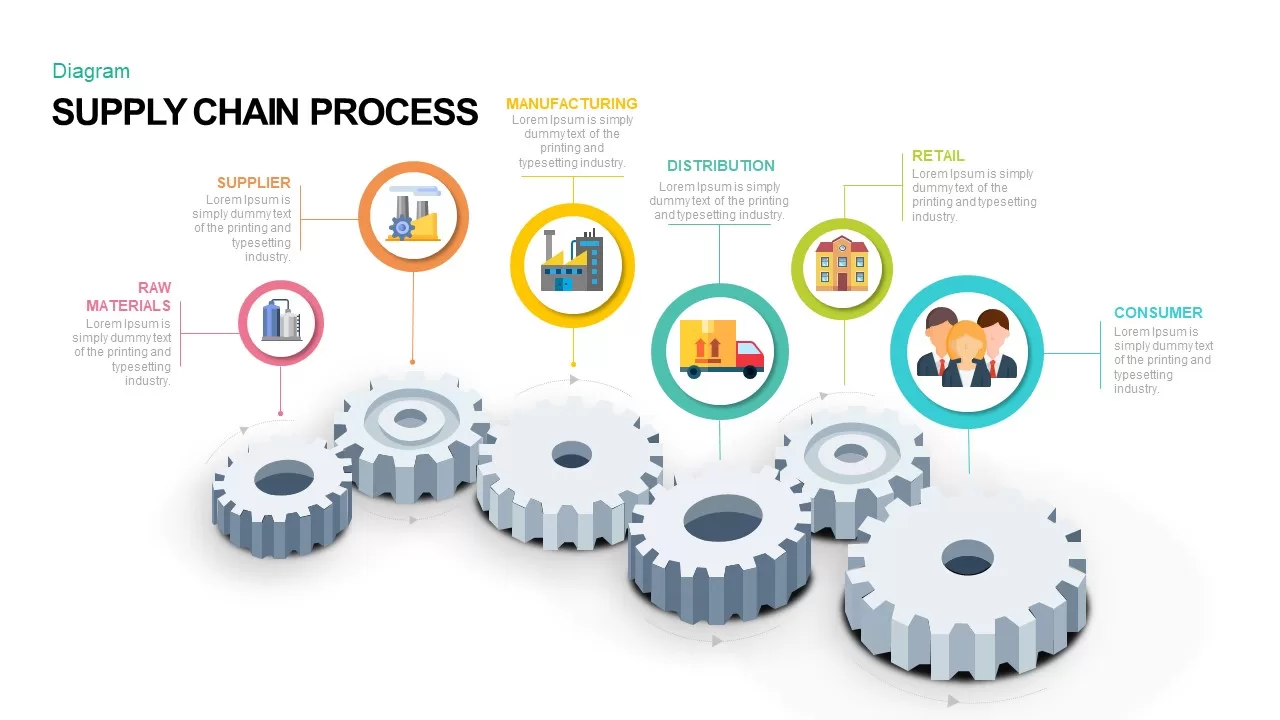
Supply Chain Process Gear Diagram Template for PowerPoint & Google Slides
Process
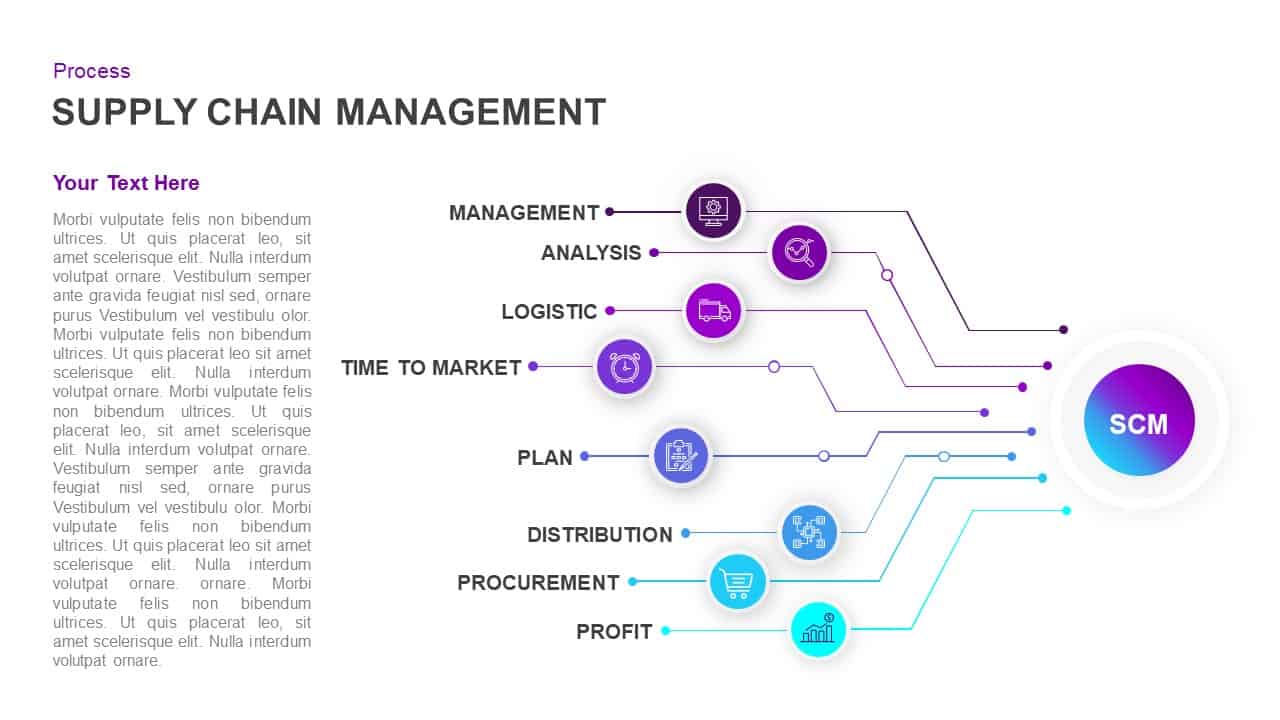
Supply Chain Management Process Diagram Template for PowerPoint & Google Slides
Process
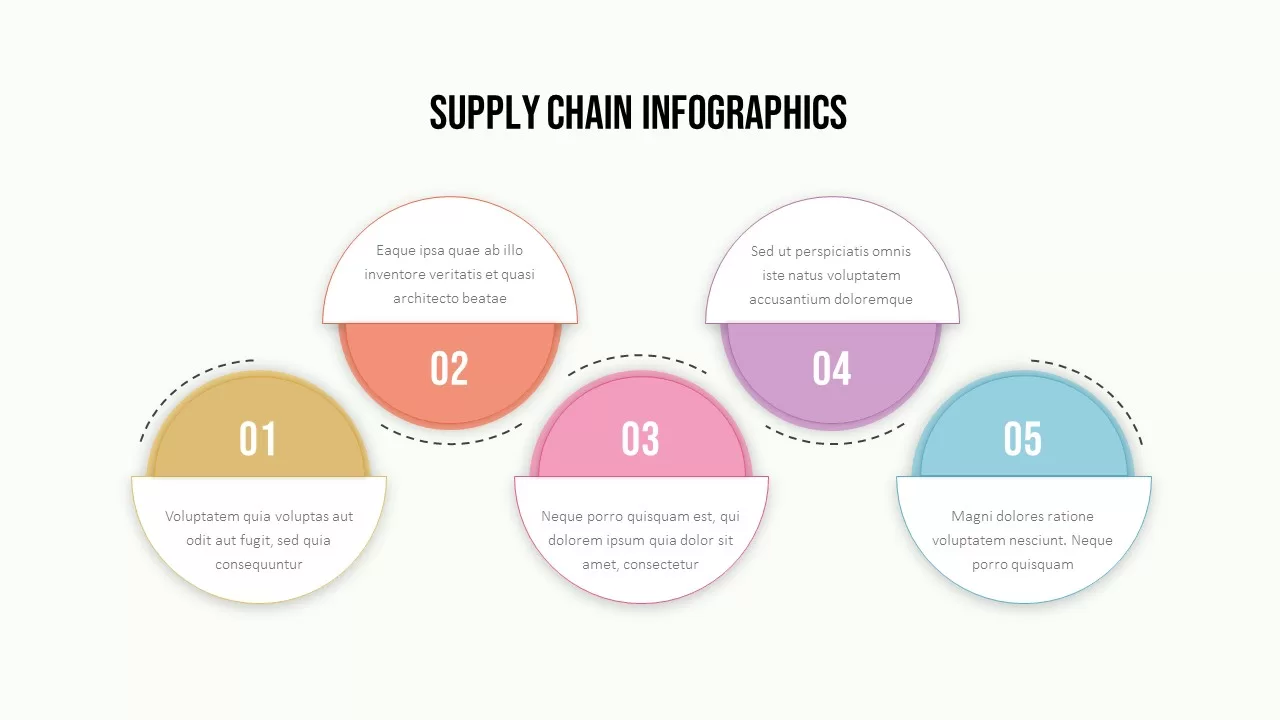
Supply Chain Circular Process Infographics Template for PowerPoint & Google Slides
Business Strategy
Logistics and Supply Chain Management Template for PowerPoint & Google Slides
Process
Supply Chain Management Logistics Cover Template for PowerPoint & Google Slides
Pitch Deck
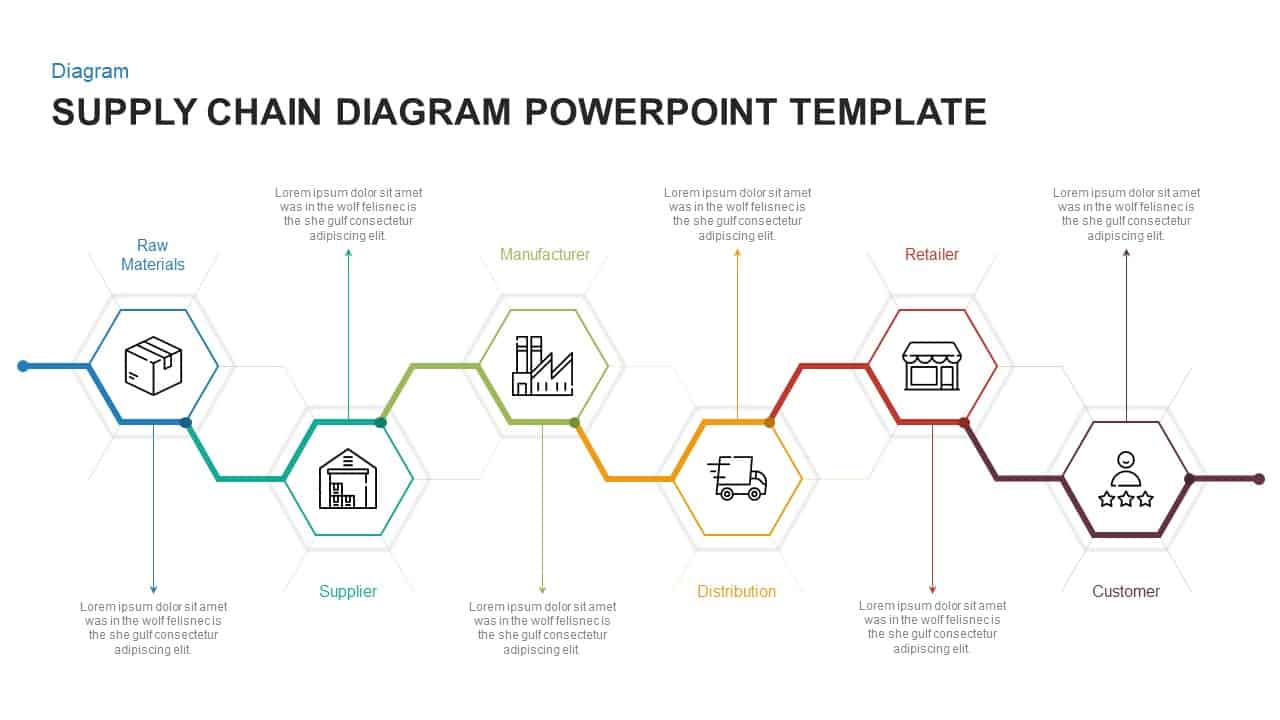
Hexagonal Supply Chain Diagram Template for PowerPoint & Google Slides
Process
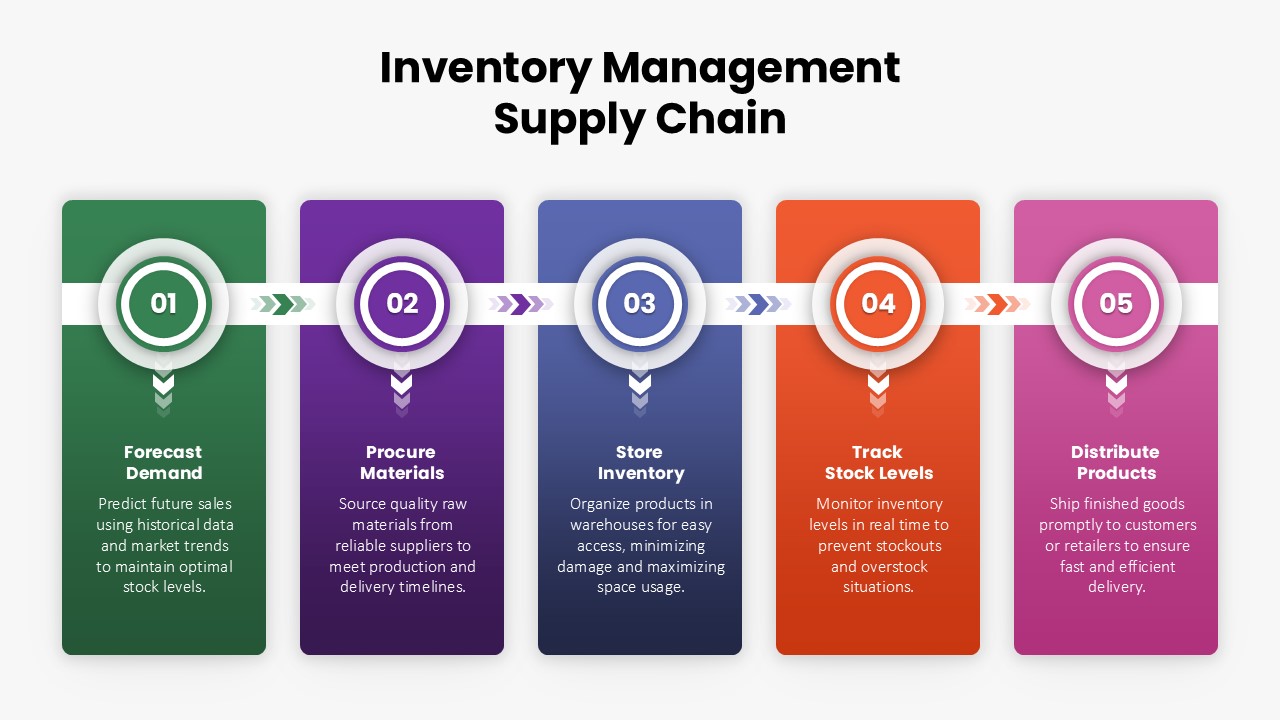
Inventory Management Supply Chain Template for PowerPoint & Google Slides
Process
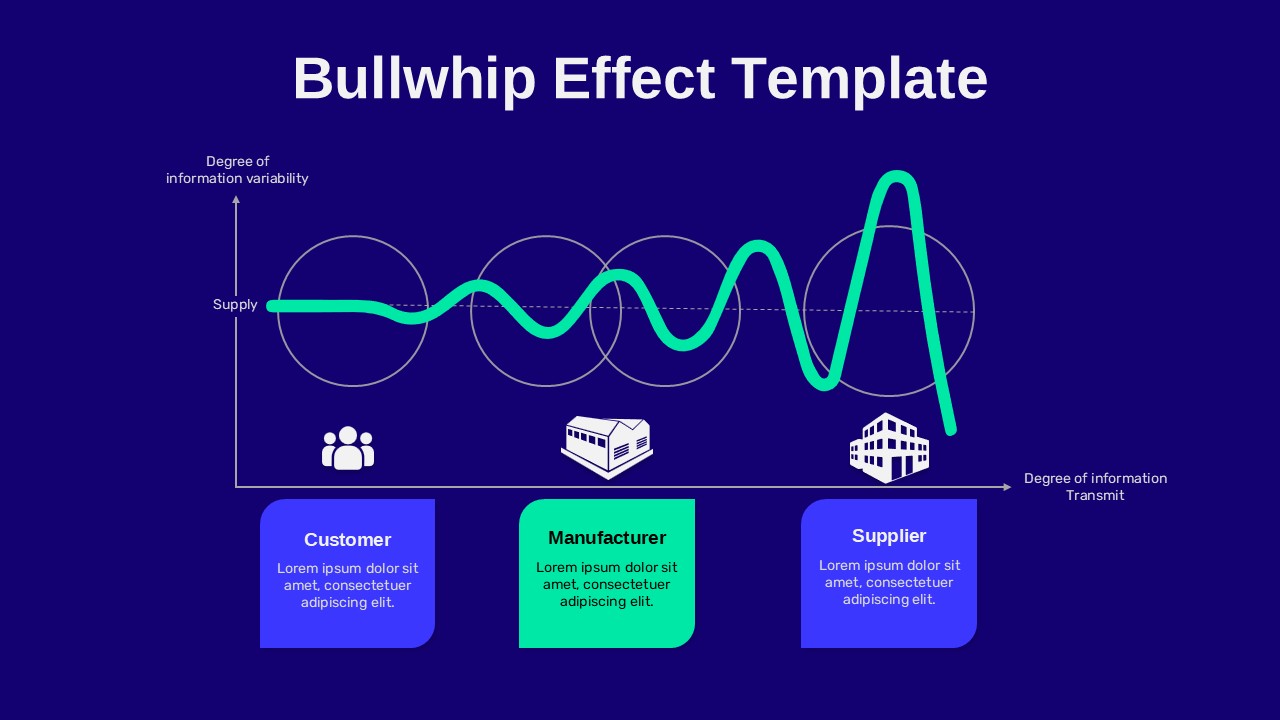
Bullwhip Effect Supply Chain Variability Diagram Template for PowerPoint & Google Slides
Business Models

Creative data chart analytics template for PowerPoint & Google Slides
Charts
Multi-Series Curved Line Graph Analytics Template for PowerPoint & Google Slides
Comparison Chart
E-commerce Analytics Dashboard Template for PowerPoint & Google Slides
Bar/Column

Product Usage Analytics Dashboard Chart Template for PowerPoint & Google Slides
Bar/Column
Data Analytics Dashboard Design template for PowerPoint & Google Slides
Bar/Column
Business Dashboard Analytics & KPIs Template for PowerPoint & Google Slides
Bar/Column
Data Management and Analytics Diagram Template for PowerPoint & Google Slides
Circular

Dynamic Marketing Radar Chart Analytics Template for PowerPoint & Google Slides
Comparison
Digital Marketing Analytics Presentation Template for PowerPoint & Google Slides
Digital Marketing
Social Media Analytics Dashboard Template for PowerPoint & Google Slides
Digital Marketing
Free TikTok Marketing Analytics Overview Template for PowerPoint & Google Slides
Company Profile
Free
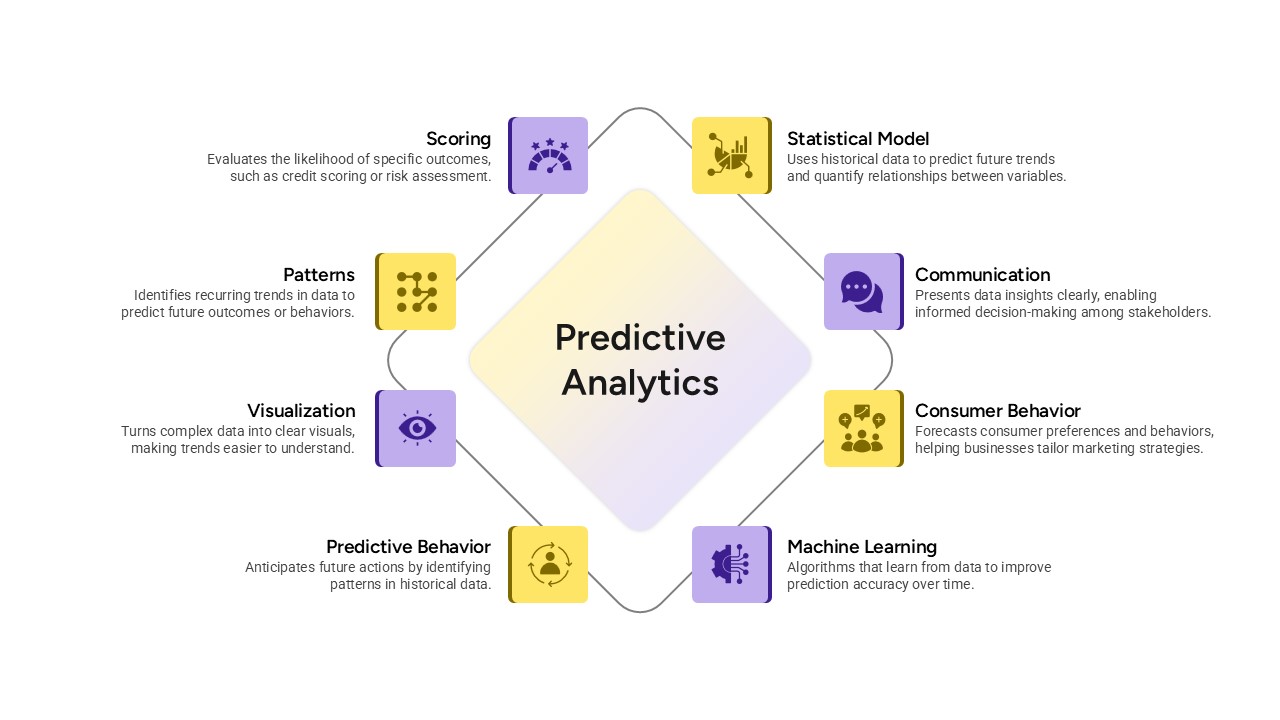
Predictive Analytics Diagram Template for PowerPoint & Google Slides
Process
Free Facebook Page Analytics Slide for PowerPoint & Google Slides
Customer Experience
Free
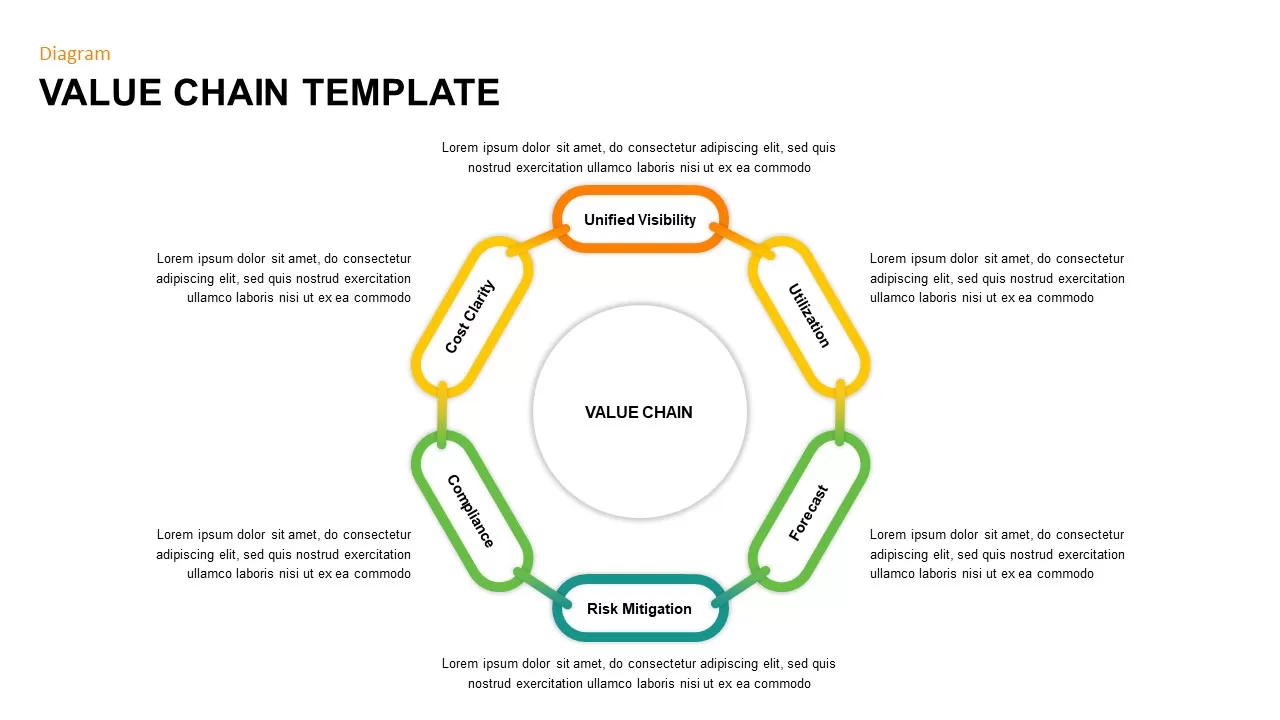
Value Chain Circular Process Diagram Template for PowerPoint & Google Slides
Business Models
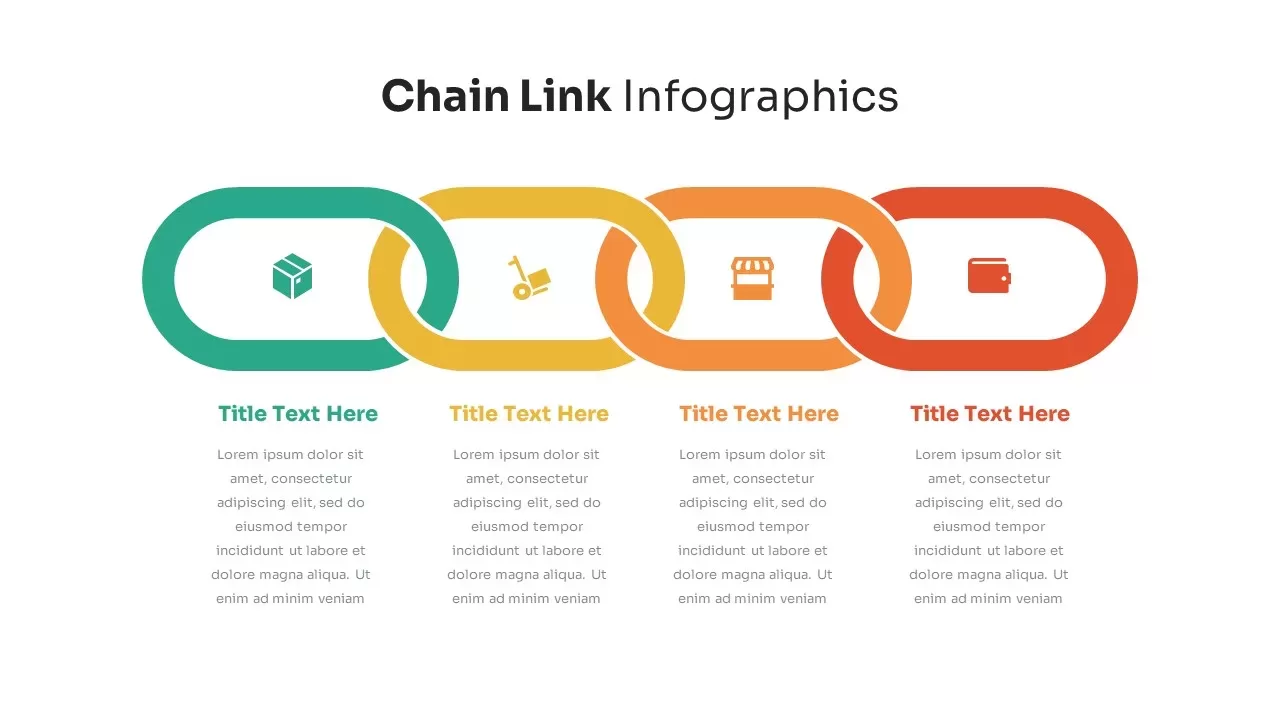
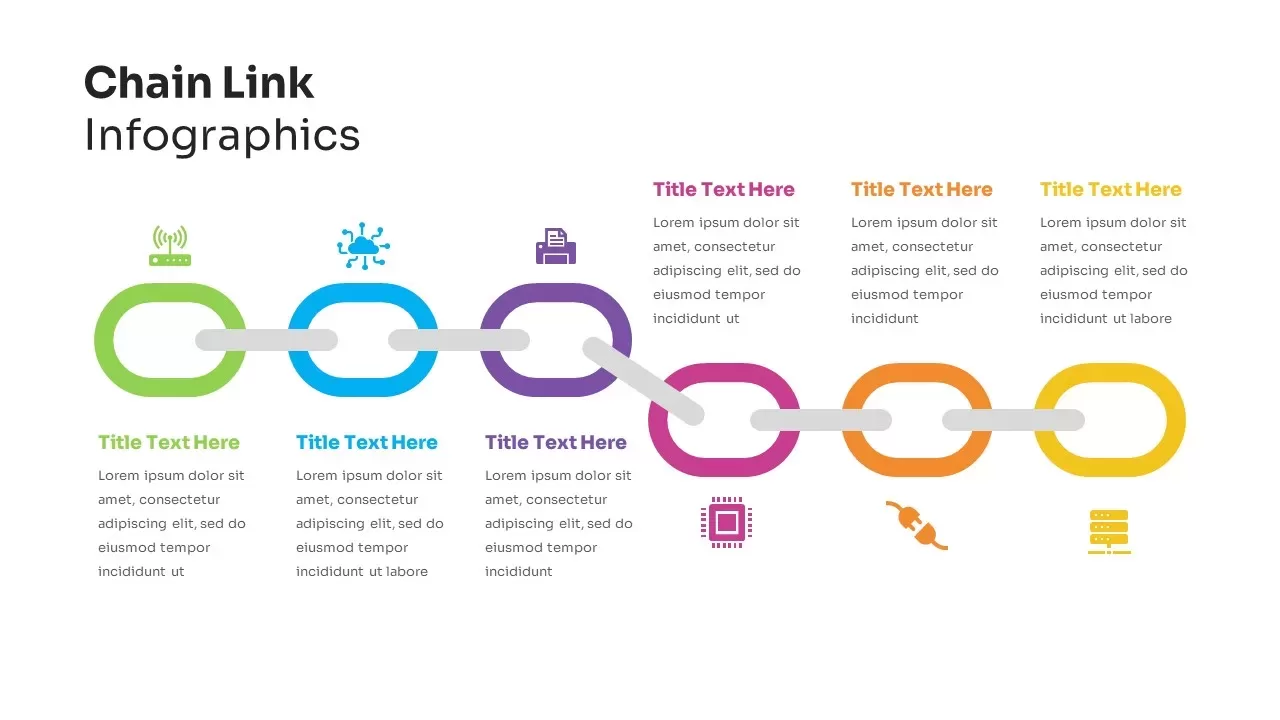
Chain Link Process Infographic Diagram Template for PowerPoint & Google Slides
Process
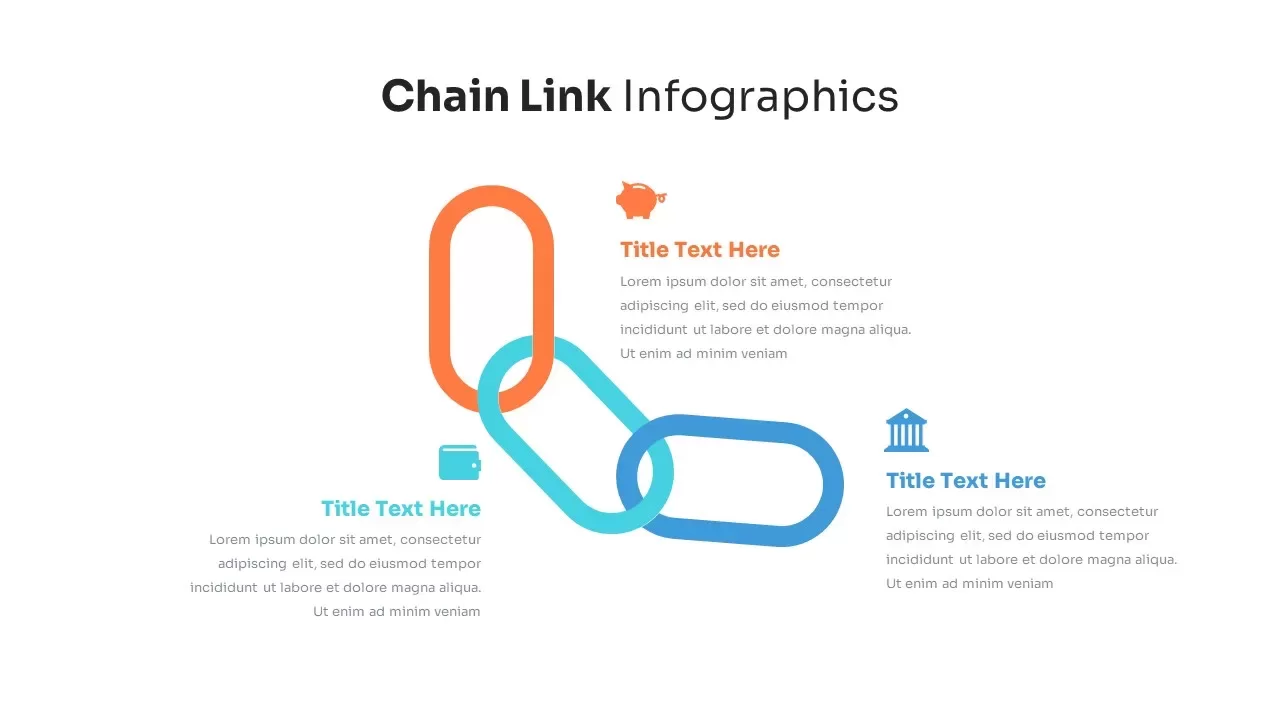
Chain Link Process Infographic Diagram Template for PowerPoint & Google Slides
Process
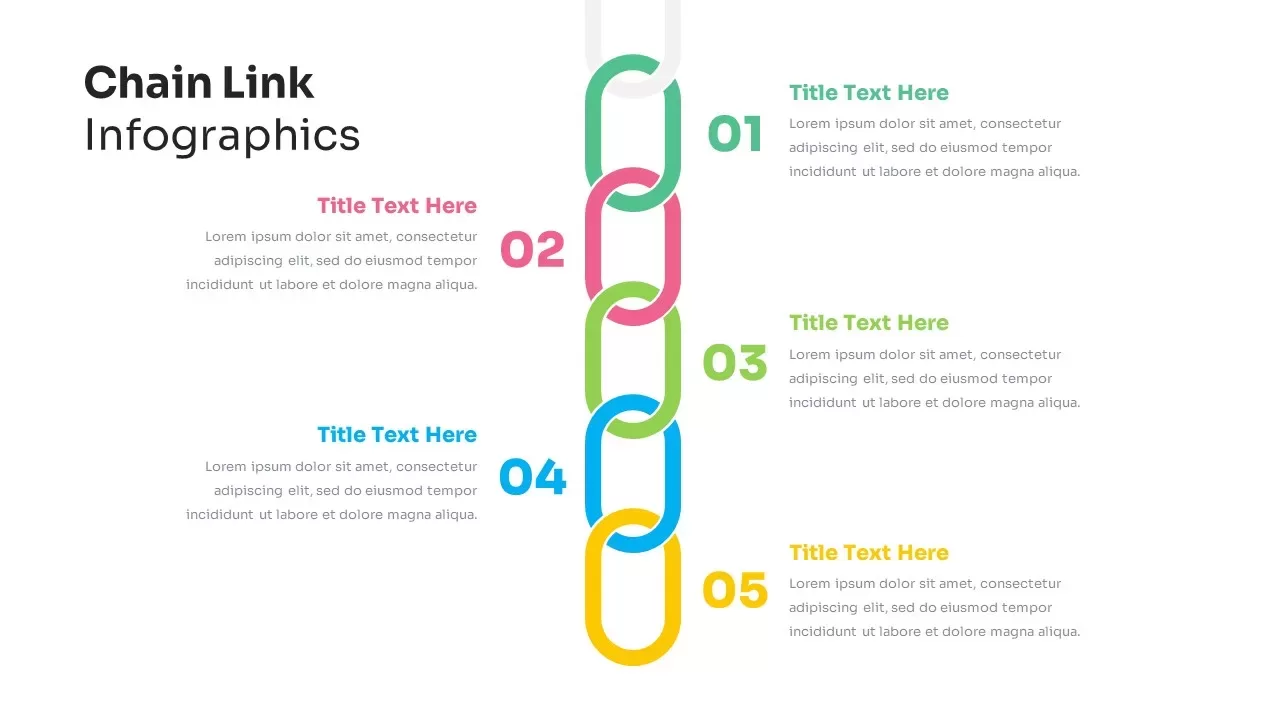
Chain Link Process Infographic Diagram Template for PowerPoint & Google Slides
Process
Five-Step Chain Link Process Infographic Template for PowerPoint & Google Slides
Process
Six-Step Chain Link Technology Process Template for PowerPoint & Google Slides
Process
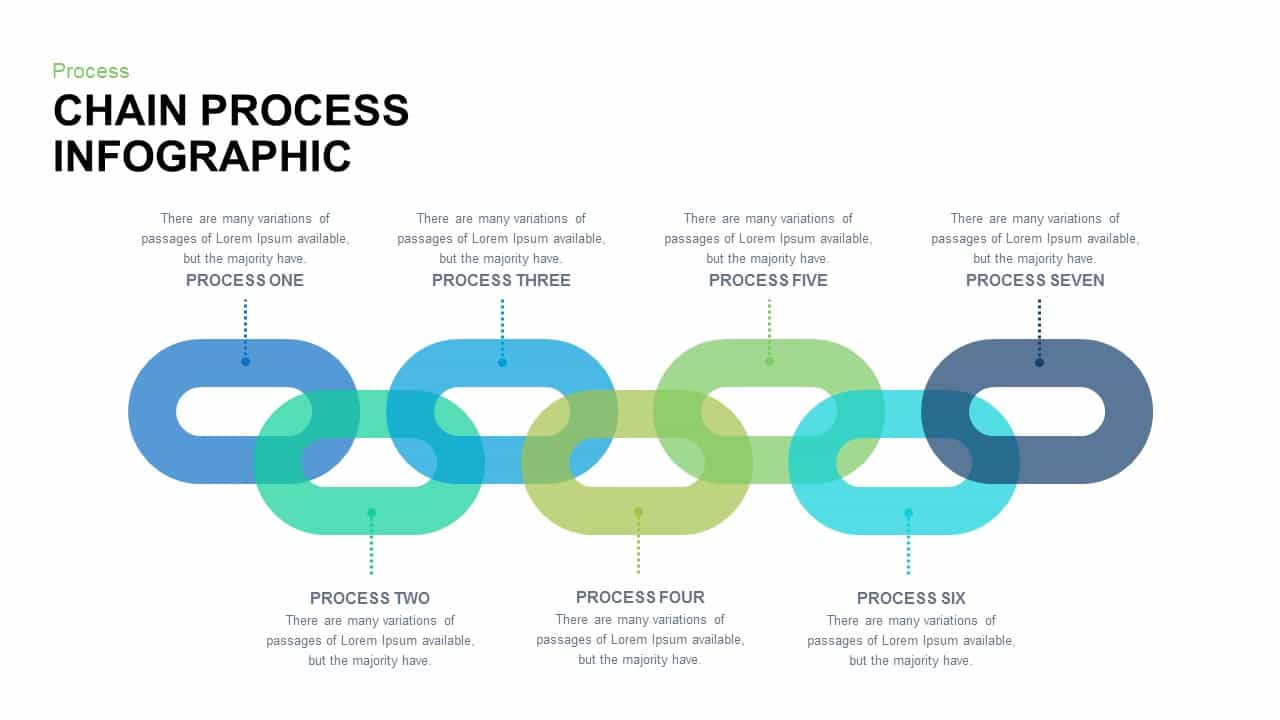
Chain Process Infographic for PowerPoint & Google Slides
Process
Free Data Analytics Dashboard Template for PowerPoint
Charts
Free
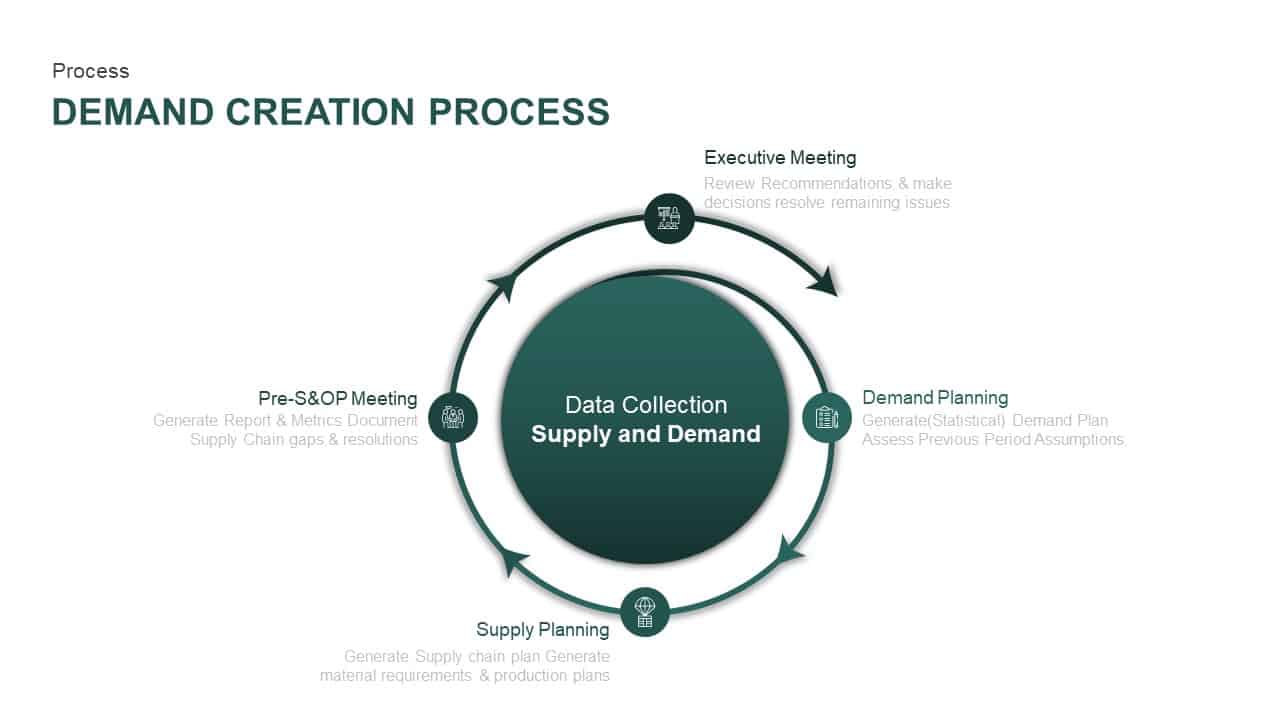
Supply and Demand Creation Cycle Diagram Template for PowerPoint & Google Slides
Process
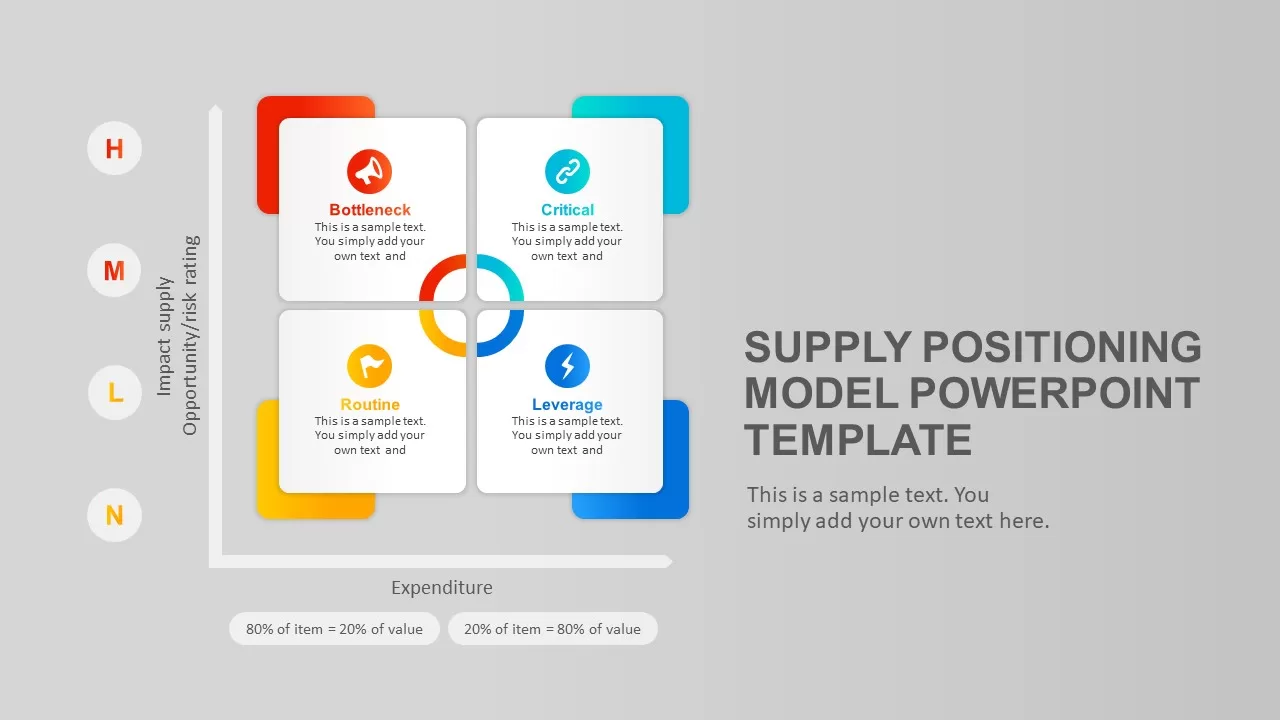
Supply Positioning Model Matrix Template for PowerPoint & Google Slides
Comparison Chart
Supply Positioning Model Template for PowerPoint & Google Slides
Business Models
Chain Timeline template for PowerPoint & Google Slides
Timeline
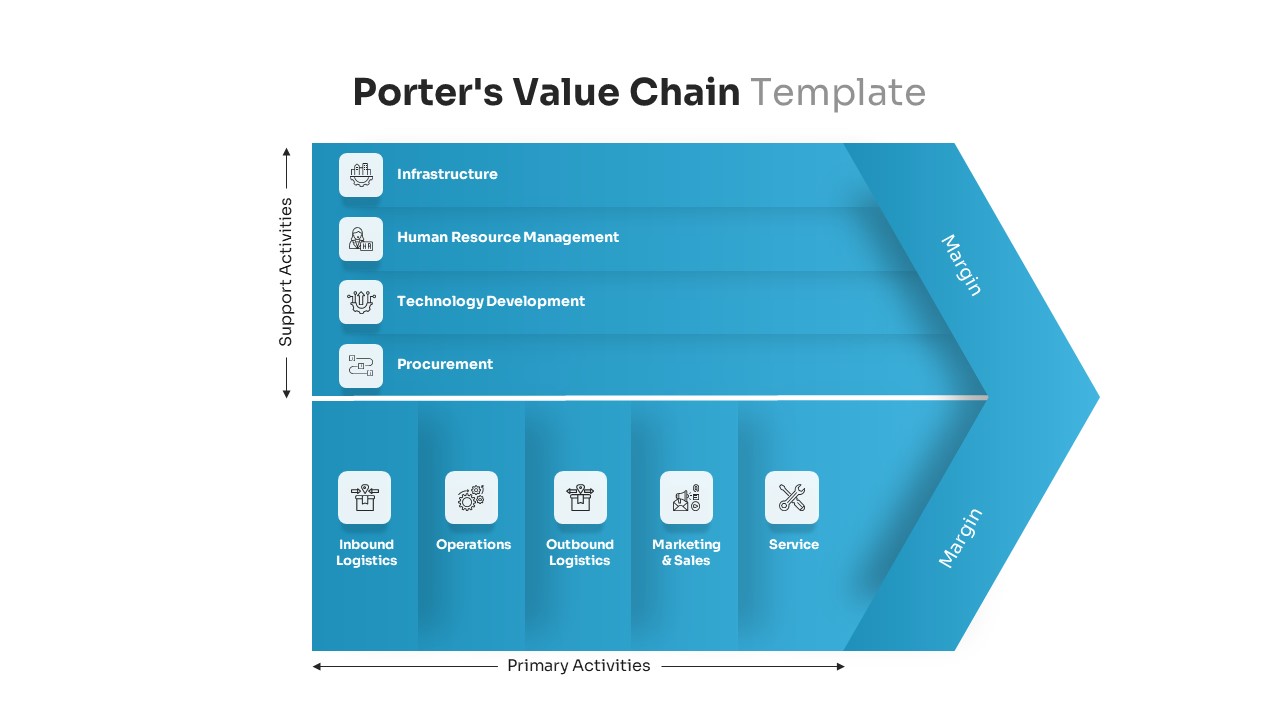
Porter’s Value Chain Analysis Diagram Template for PowerPoint & Google Slides
Business Strategy
Linear Chain Link Infographics Template for PowerPoint & Google Slides
Process
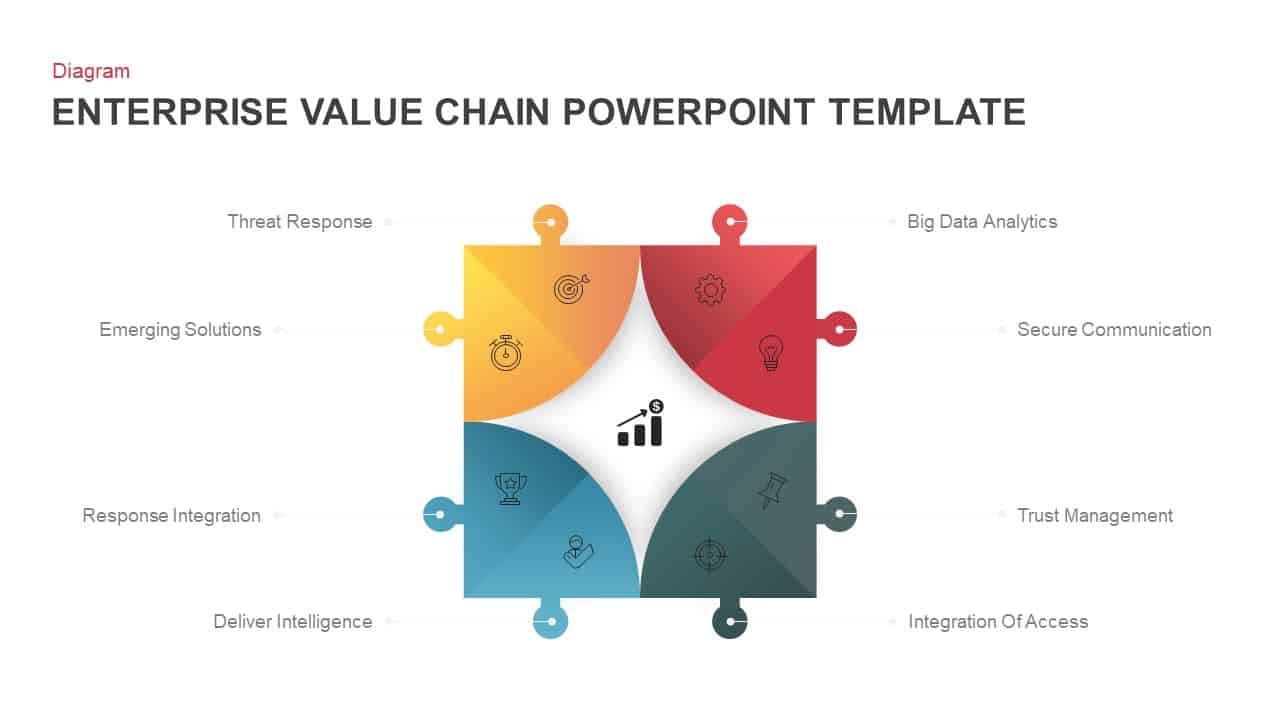
Enterprise Value Chain Puzzle Diagram Template for PowerPoint & Google Slides
Business Models
Value Chain Diagram template for PowerPoint & Google Slides
Business Strategy
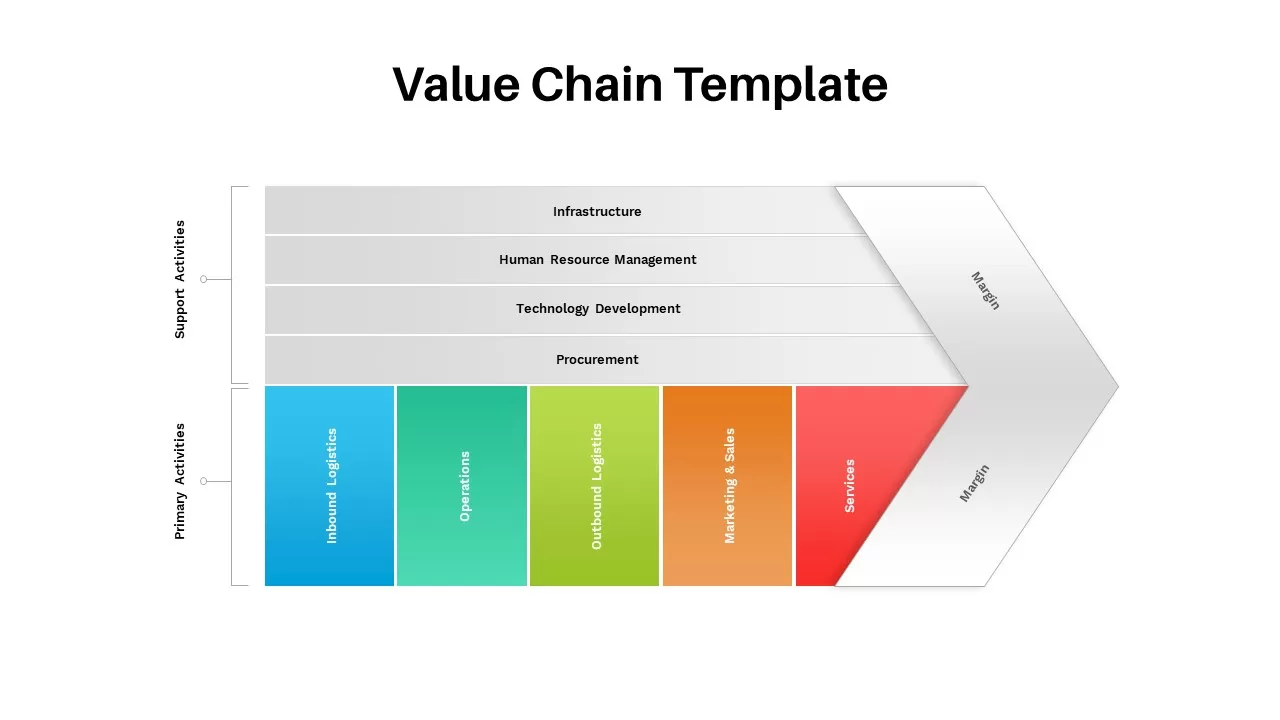
Value Chain Template for PowerPoint & Google Slides
Business Strategy
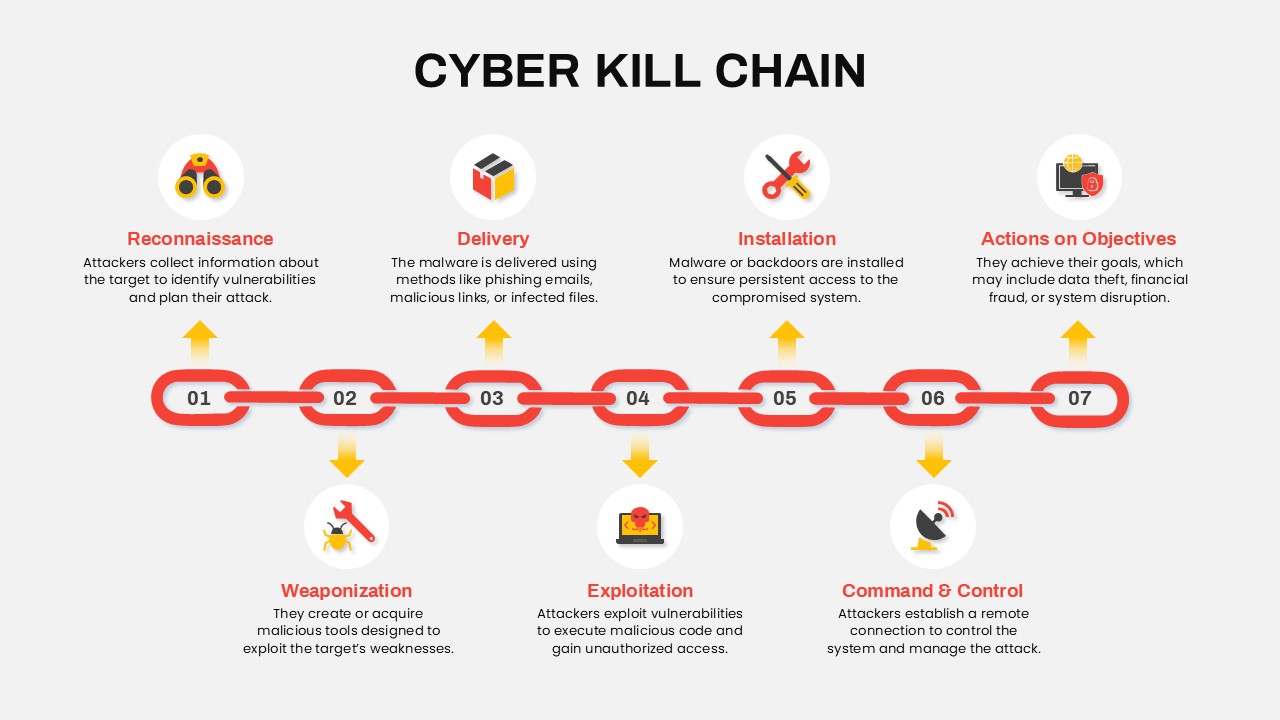
Cyber Kill Chain Template for PowerPoint & Google Slides
Information Technology
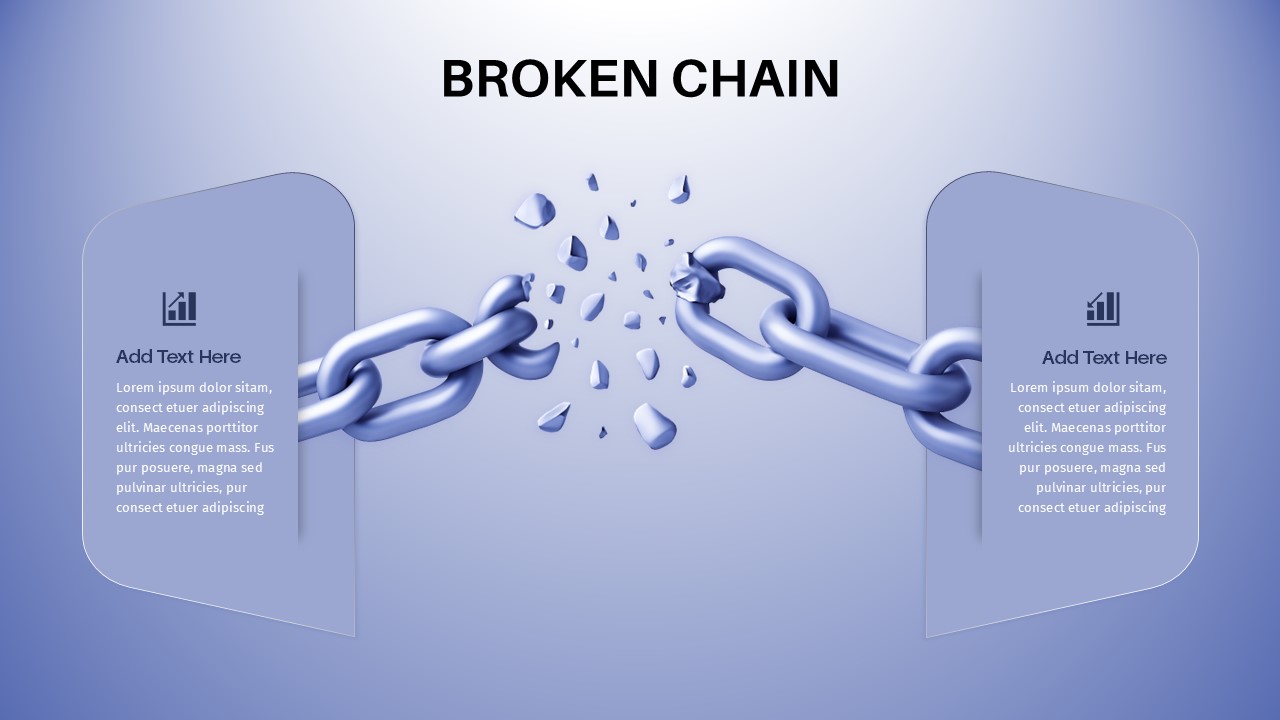
Broken Chain Concept template for PowerPoint & Google Slides
Business
4 Step Process PowerPoint & Google Slides Template for PowerPoint & Google Slides
Process

Sales Process Infographic Slides Pack Template for PowerPoint & Google Slides
Process
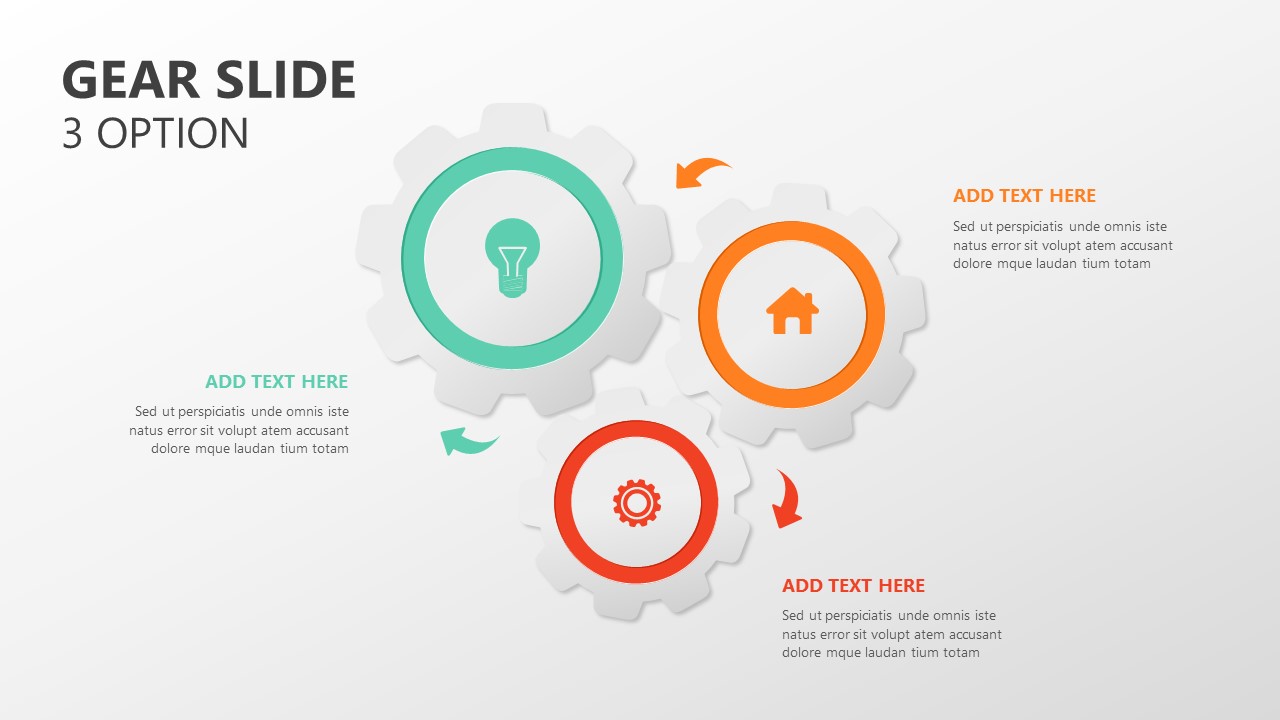
Gear Process Diagram PowerPoint Template for PowerPoint & Google Slides
Process
Sales Process Workflow Funnel Diagram PowerPoint Template for PowerPoint & Google Slides
Funnel
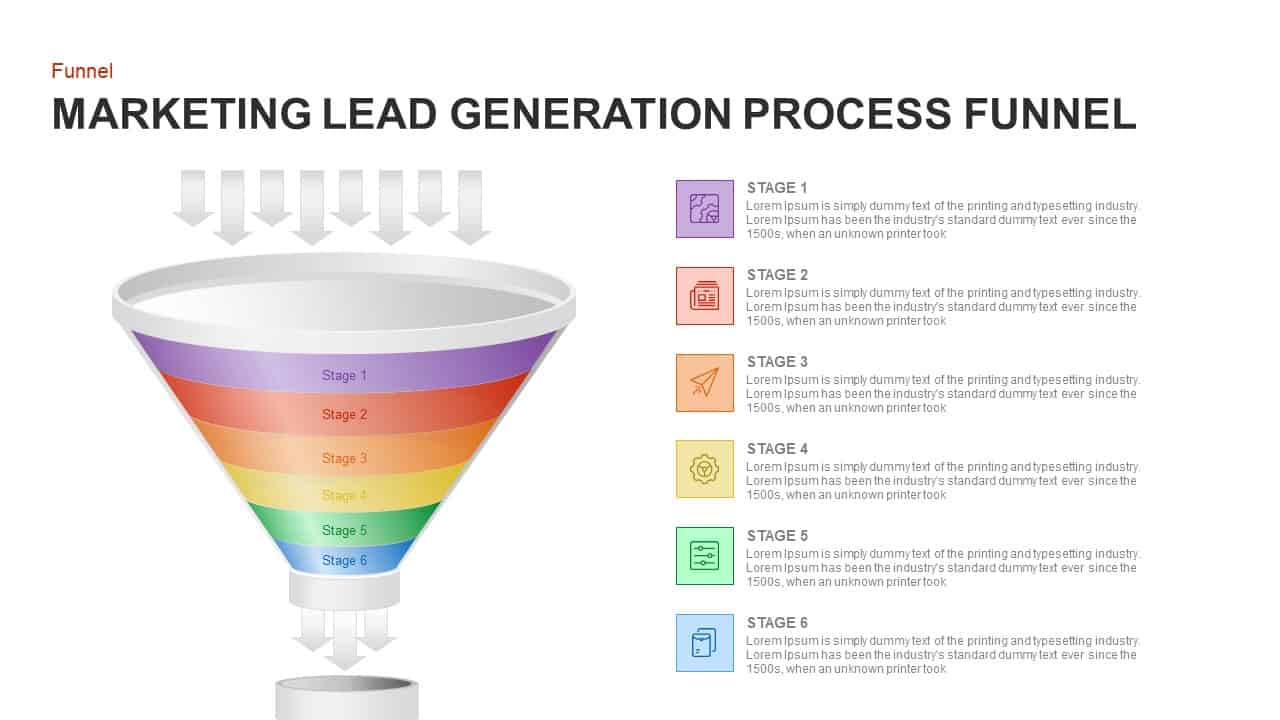
Marketing Lead Generation Process Funnel PowerPoint Template for PowerPoint & Google Slides
Funnel
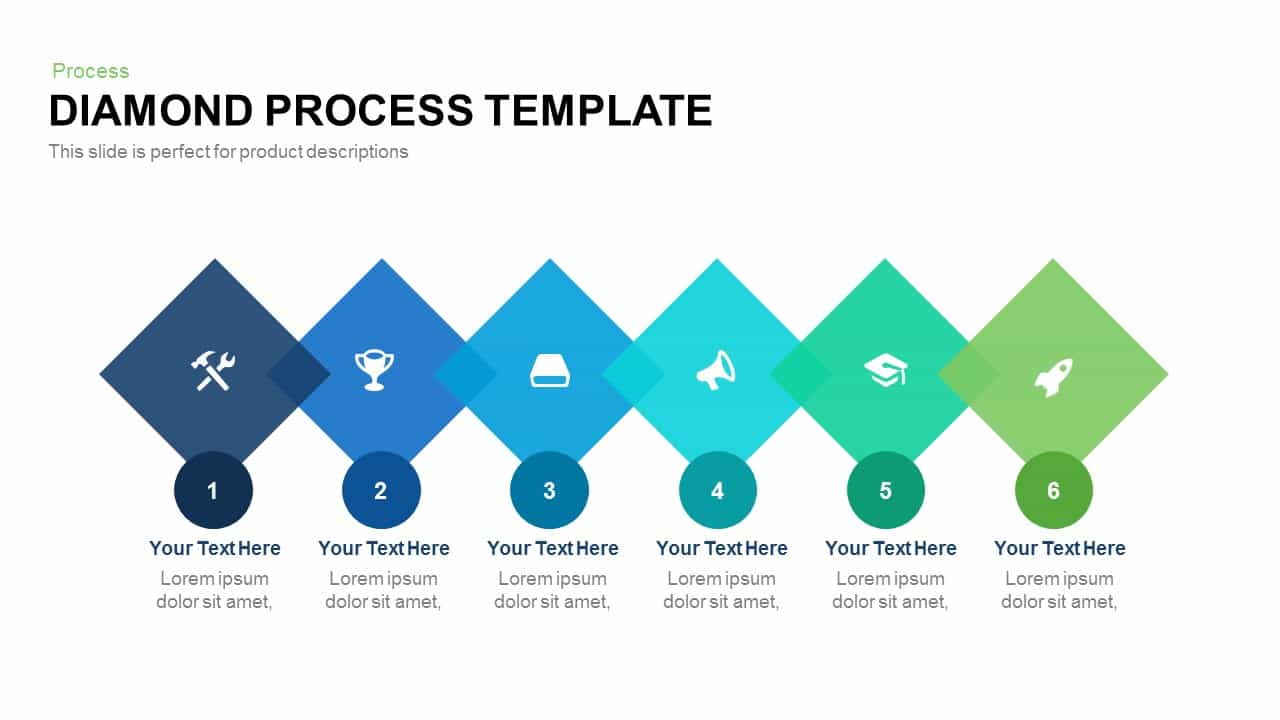
Diamond Process Template template for PowerPoint & Google Slides
Process
Workflow PowerPoint Process infographic for PowerPoint & Google Slides
Process
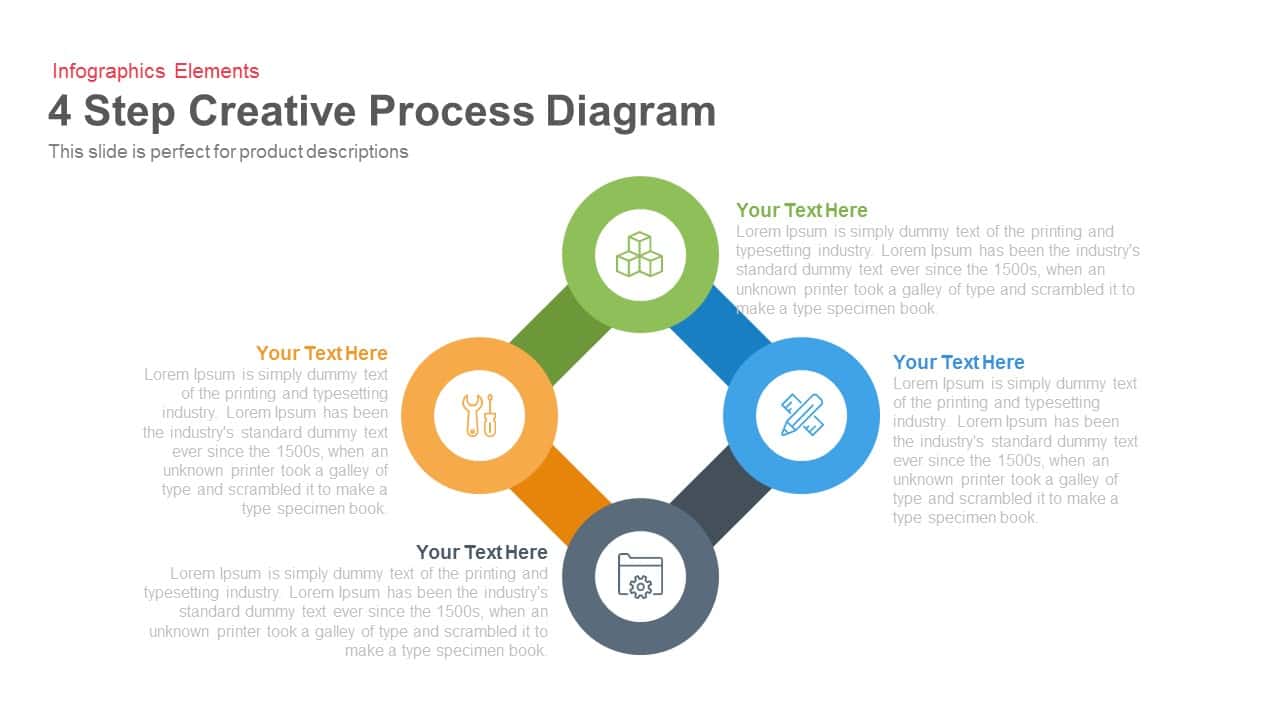
4 Step Creative Process Diagram Template for PowerPoint & Google Slides
Infographics
Six Arrow Radial Process Diagram template for PowerPoint & Google Slides
Infographics
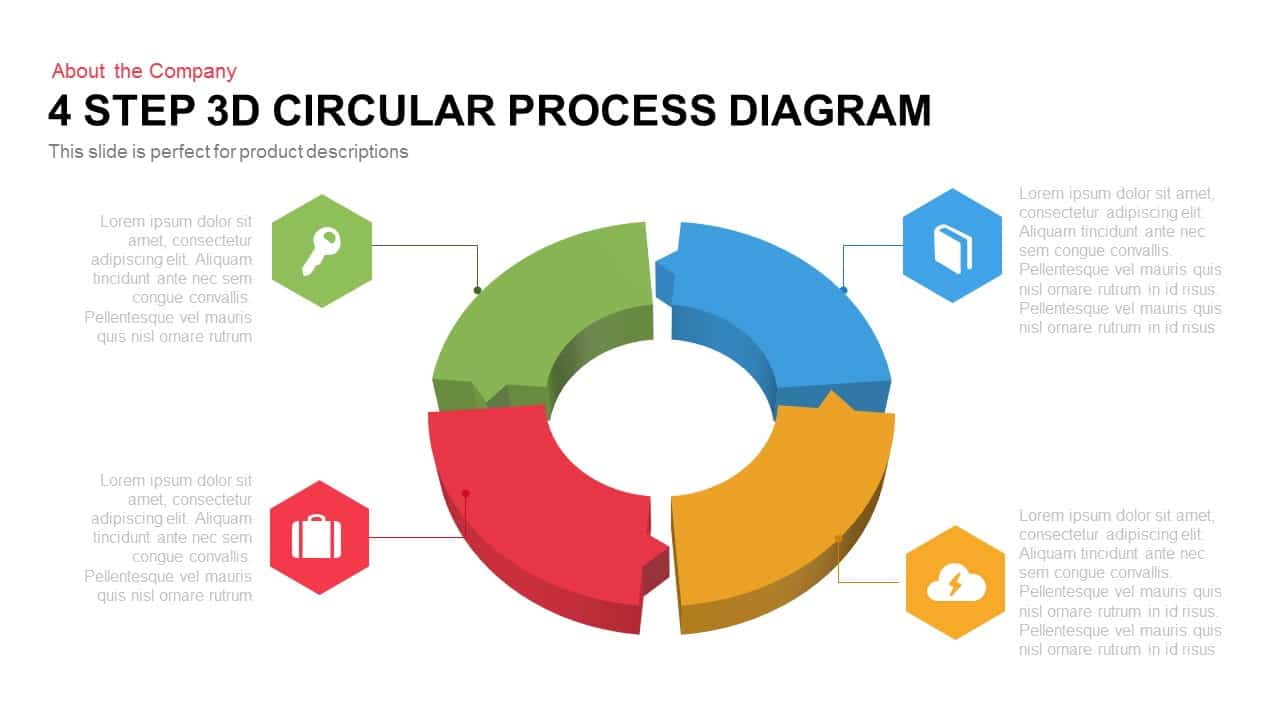
4 Step 3D Circular Process Diagram template for PowerPoint & Google Slides
Process
Three-Section Fishbone Process Diagram template for PowerPoint & Google Slides
Process
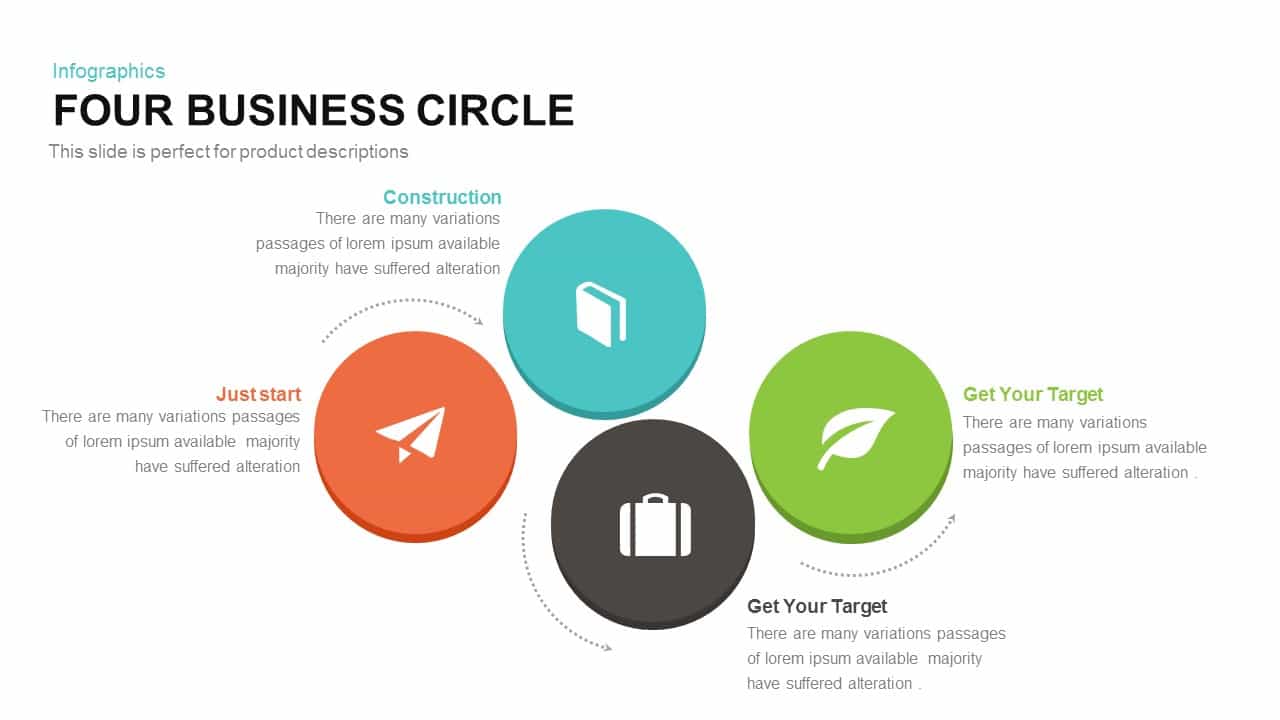
Four-Circle Business Process Infographic Template for PowerPoint & Google Slides
Circular
15-Step Process Flow Diagram Template for PowerPoint & Google Slides
Process
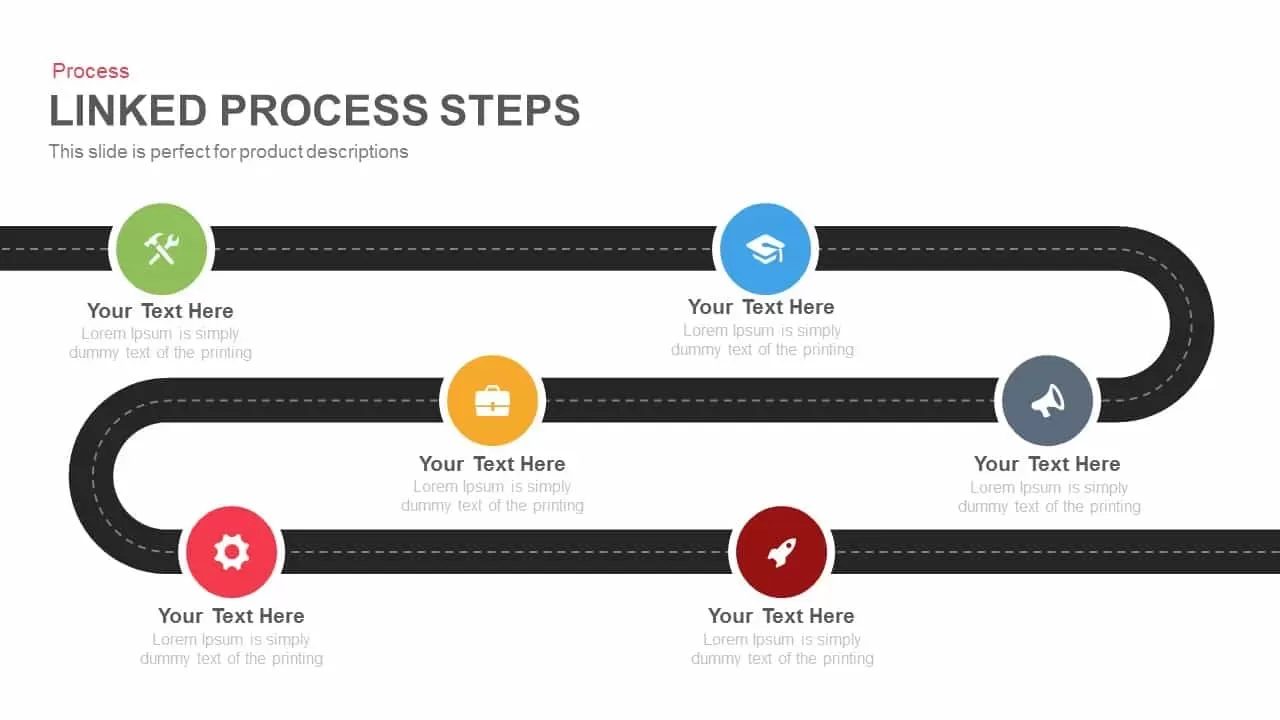
Roadmap Six-Step Process Diagram Template for PowerPoint & Google Slides
Roadmap

Four-Circle Venn Process Diagram template for PowerPoint & Google Slides
Process
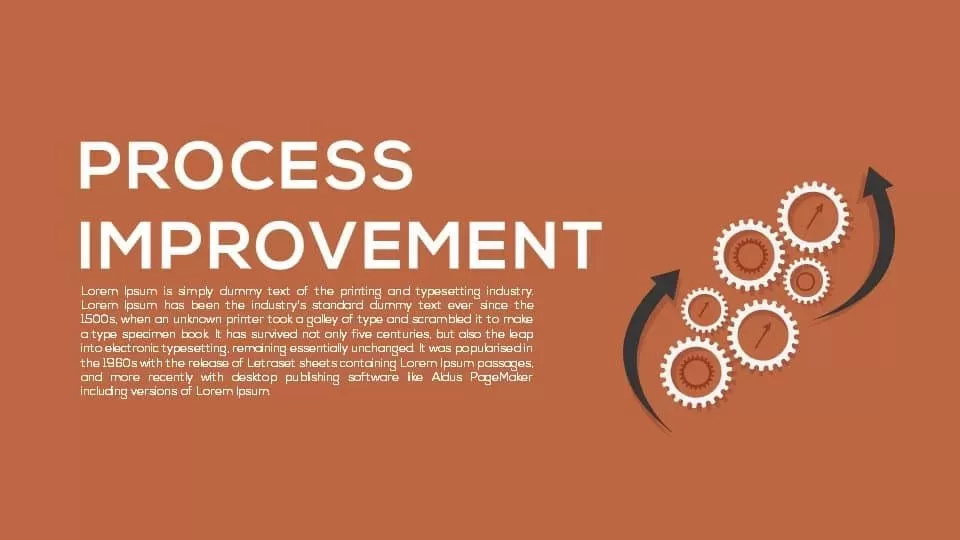
Process Improvement Metaphor Diagram Template for PowerPoint & Google Slides
Process
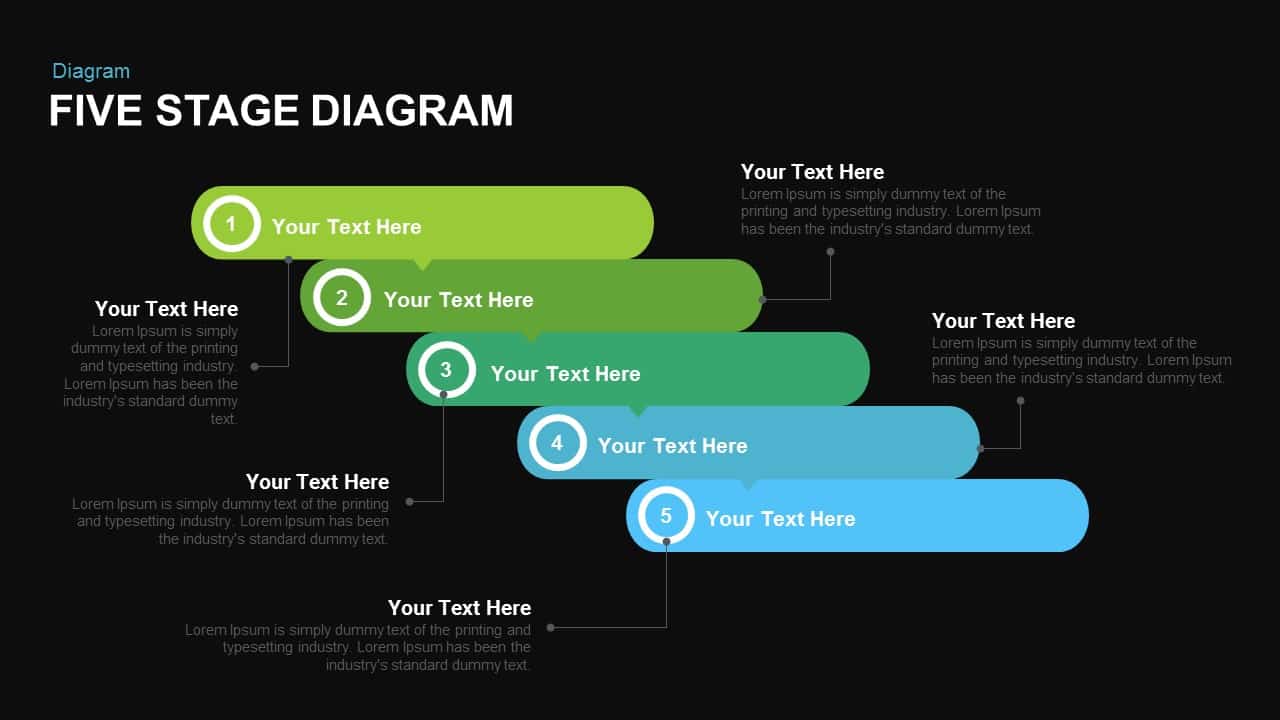
Engaging Five-Stage Process Diagram Template for PowerPoint & Google Slides
Process
8 Steps Arrow Process Diagram template for PowerPoint & Google Slides
Process
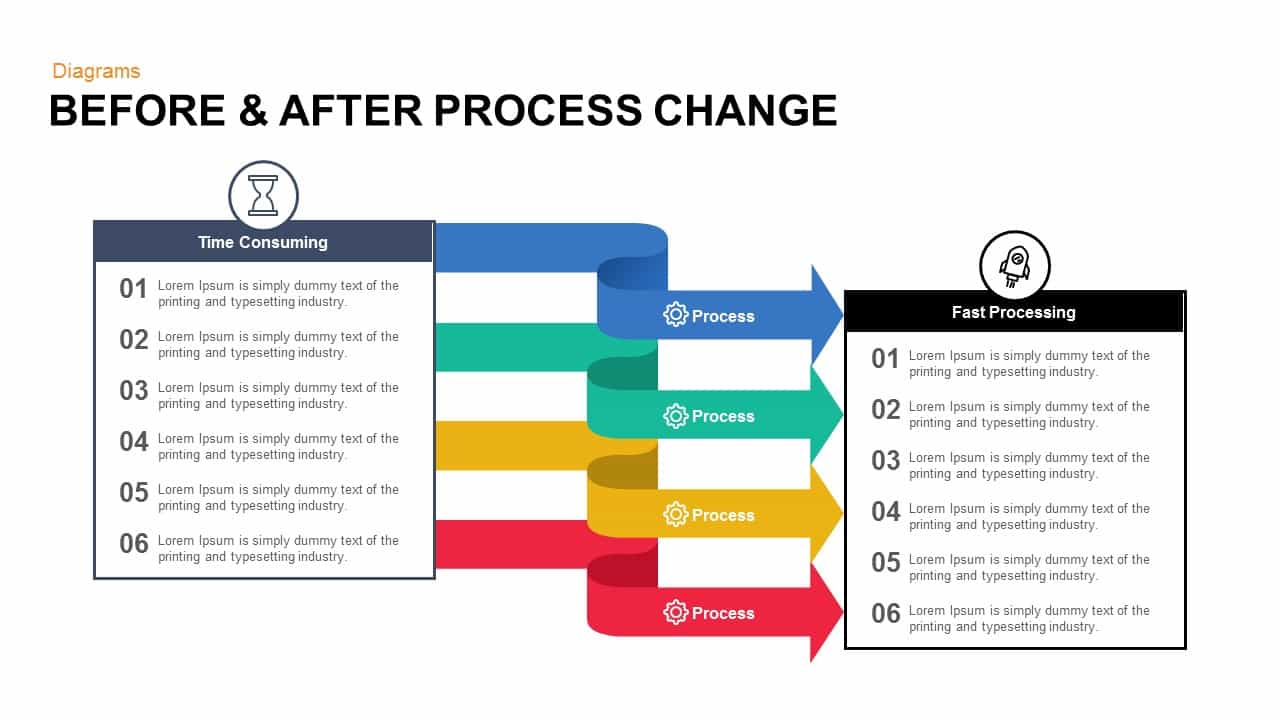
Before & After Process Change template for PowerPoint & Google Slides
Process
Five-Stage Cyclic Process Arrow Diagram Template for PowerPoint & Google Slides
Process
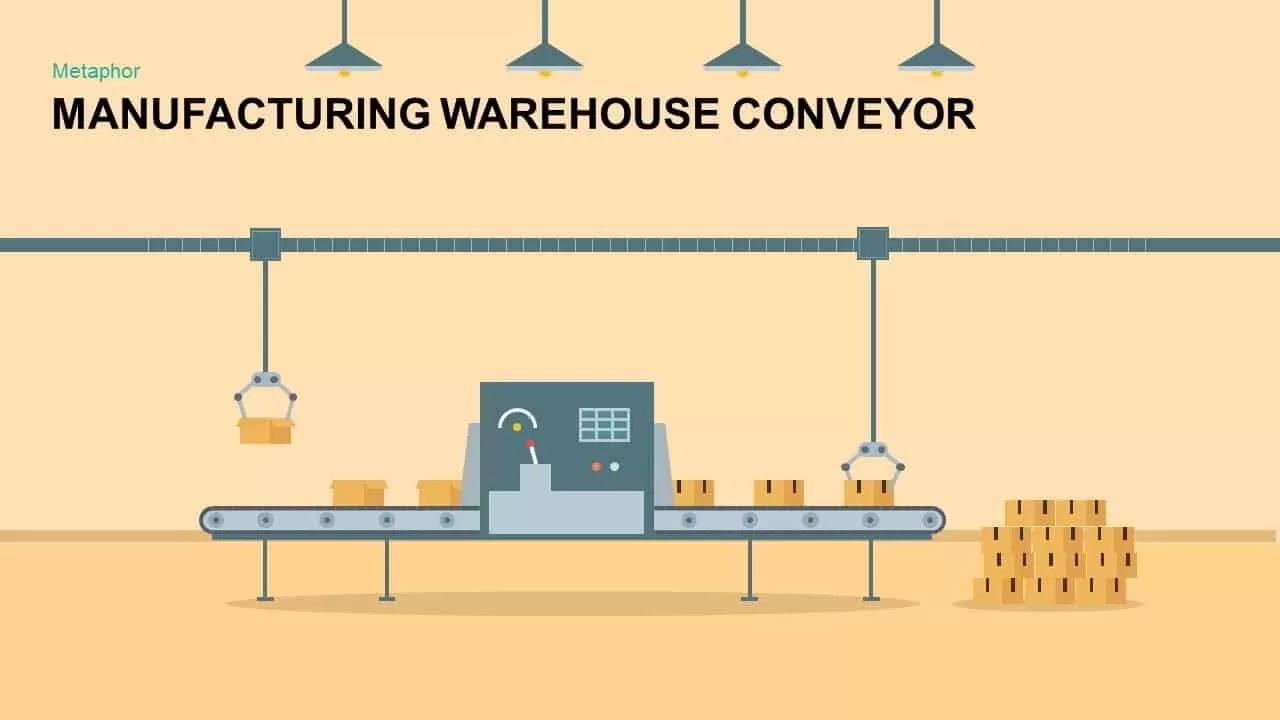
Warehouse Conveyor Process Metaphor Template for PowerPoint & Google Slides
Process

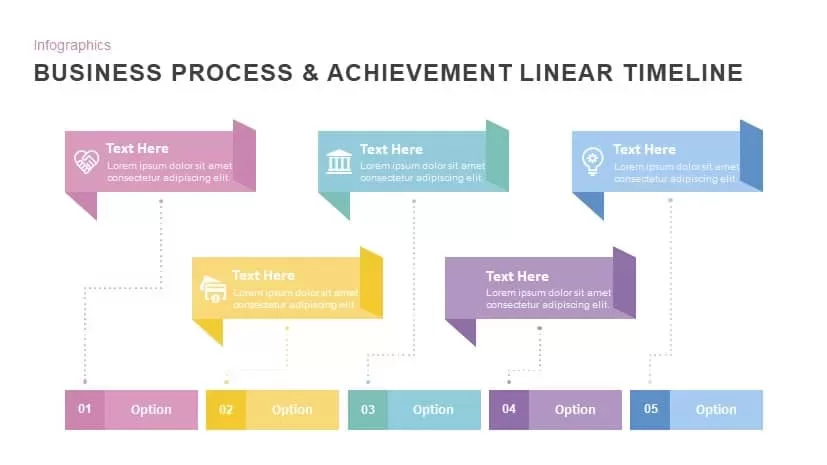
Business Process & Achievement Linear Timeline template for PowerPoint & Google Slides
Timeline
Modern Recruiting Process Cover Slide Template for PowerPoint & Google Slides
Pitch Deck
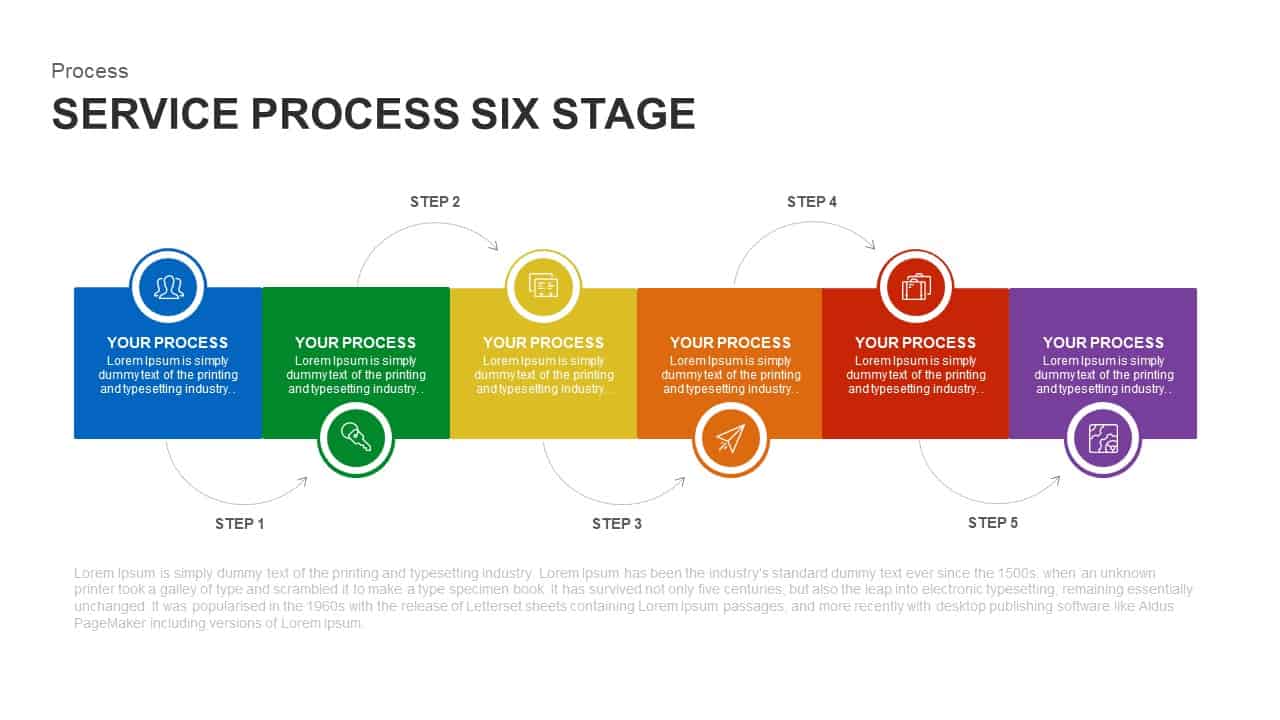
Six-Stage Service Process Workflow Template for PowerPoint & Google Slides
Process
Five-Stage Pyramid Infographics Process Template for PowerPoint & Google Slides
Pyramid
Business System Five-Step Process Template for PowerPoint & Google Slides
Process
Case Study for Change Management Process Template for PowerPoint & Google Slides
Process
HR Employee Development Plan Process Template for PowerPoint & Google Slides
Employee Performance
Colorful 5-Step Circular Process Template for PowerPoint & Google Slides
Process
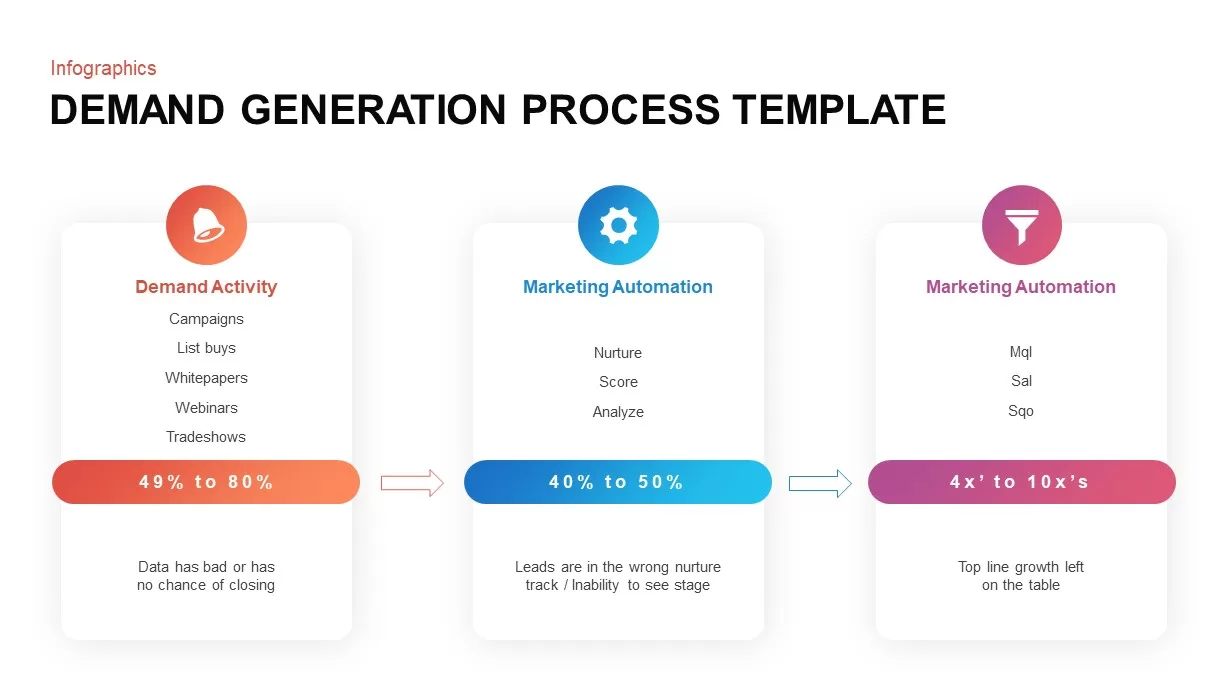
Demand Generation and Lead Nurturing Process Template for PowerPoint & Google Slides
Process
Four-Step Circular Process Infographics Template for PowerPoint & Google Slides
Circular
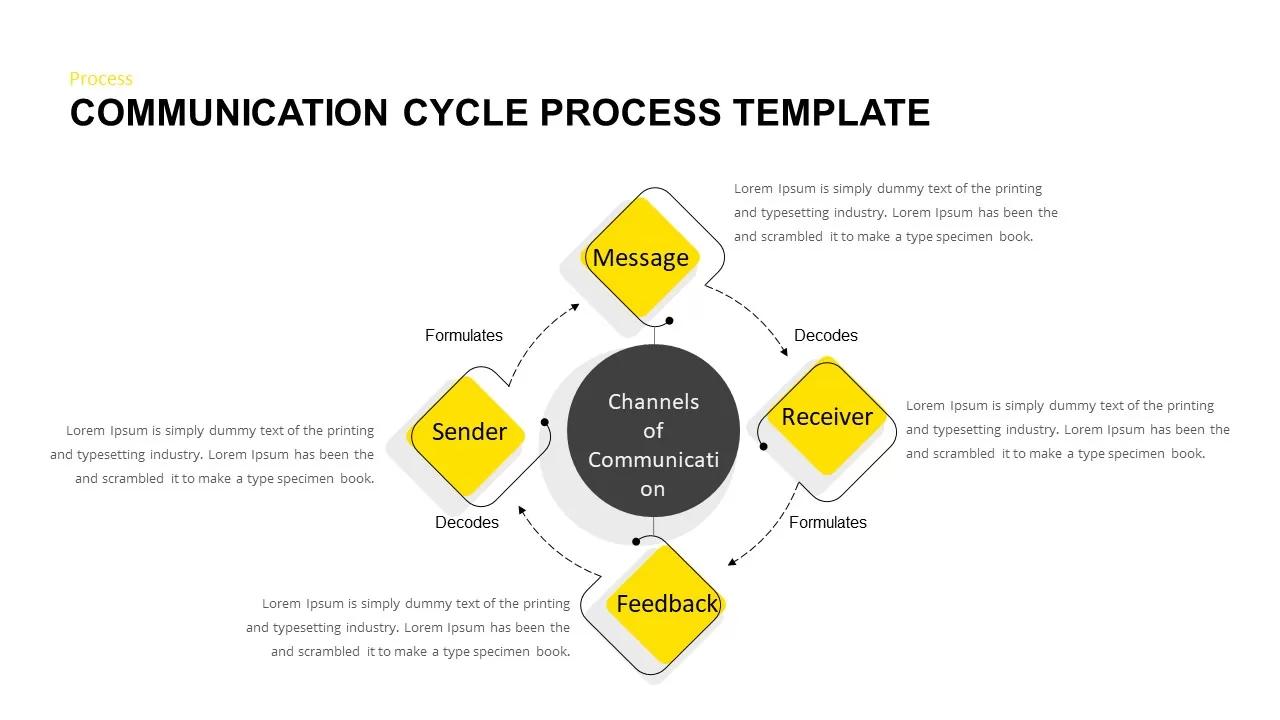
Communication Cycle Process Diagram template for PowerPoint & Google Slides
Business
Fishbone Process Diagram template for PowerPoint & Google Slides
Infographics
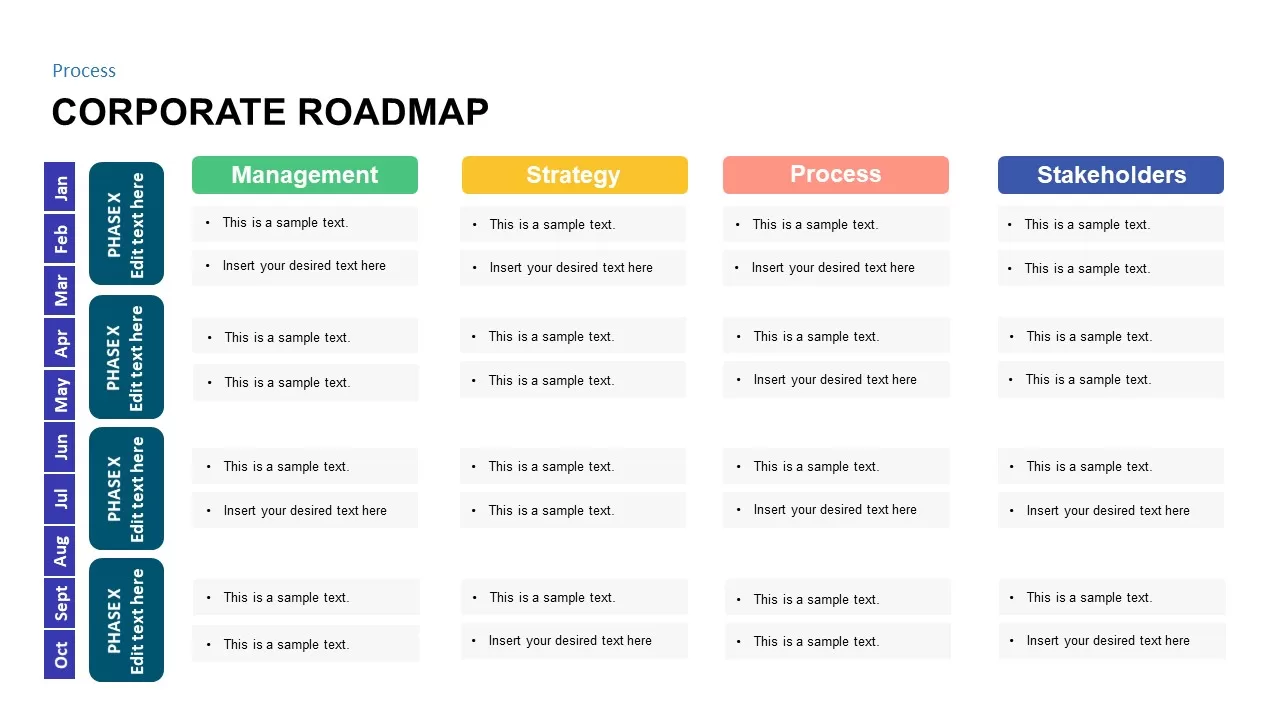
Corporate Roadmap Process Template for PowerPoint & Google Slides
Roadmap
Circular Arrow Process Diagram Template for PowerPoint & Google Slides
Circular
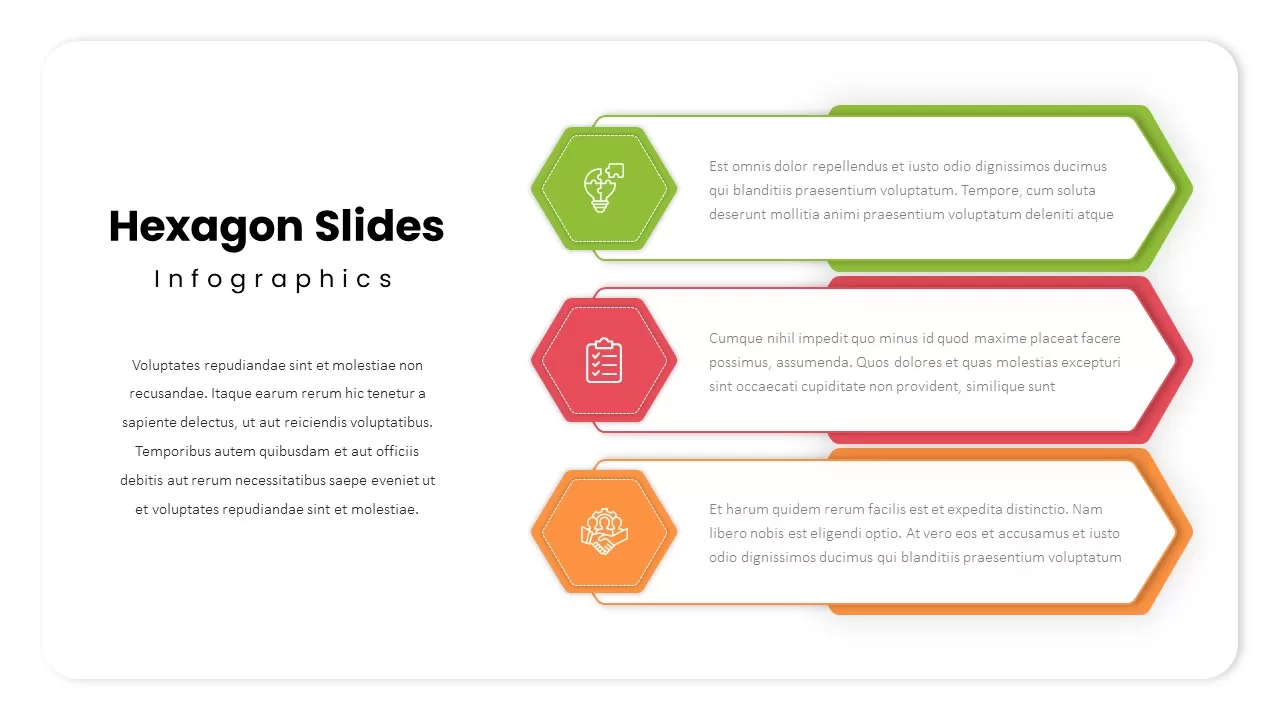
Three-Step Hexagon Infographic Process Template for PowerPoint & Google Slides
Process
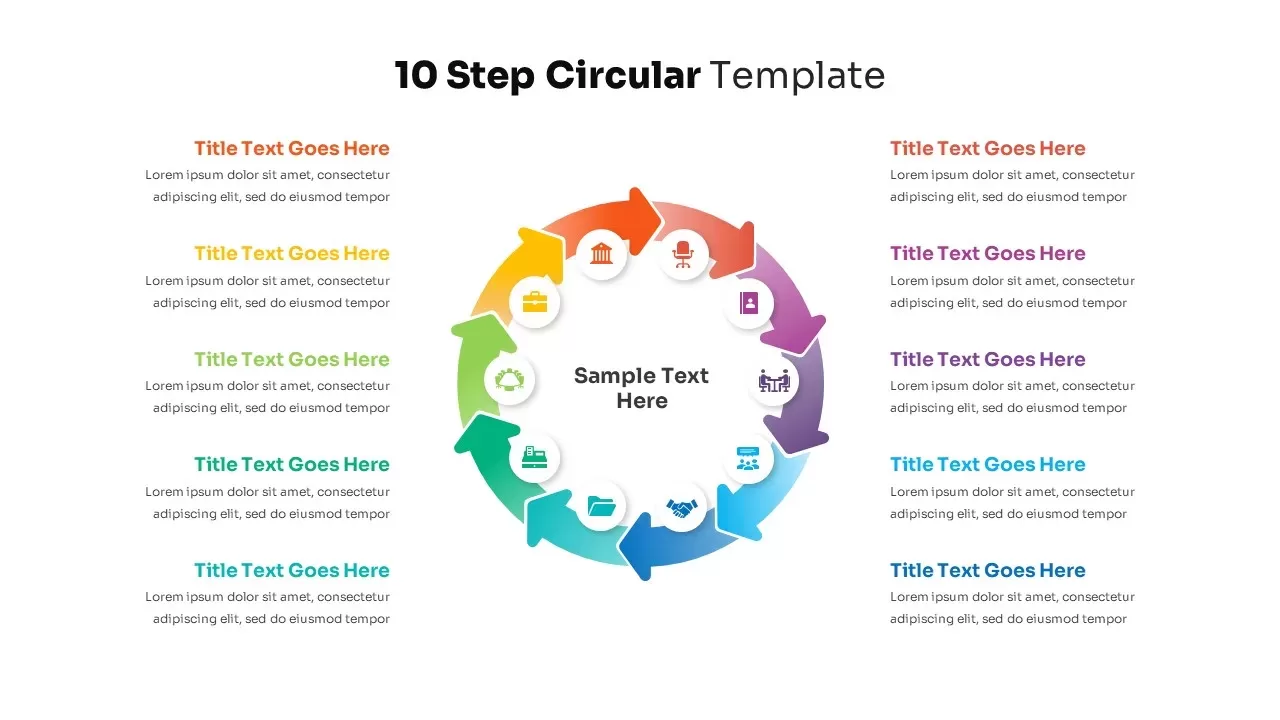
10-Step Circular Process Diagram Template for PowerPoint & Google Slides
Process
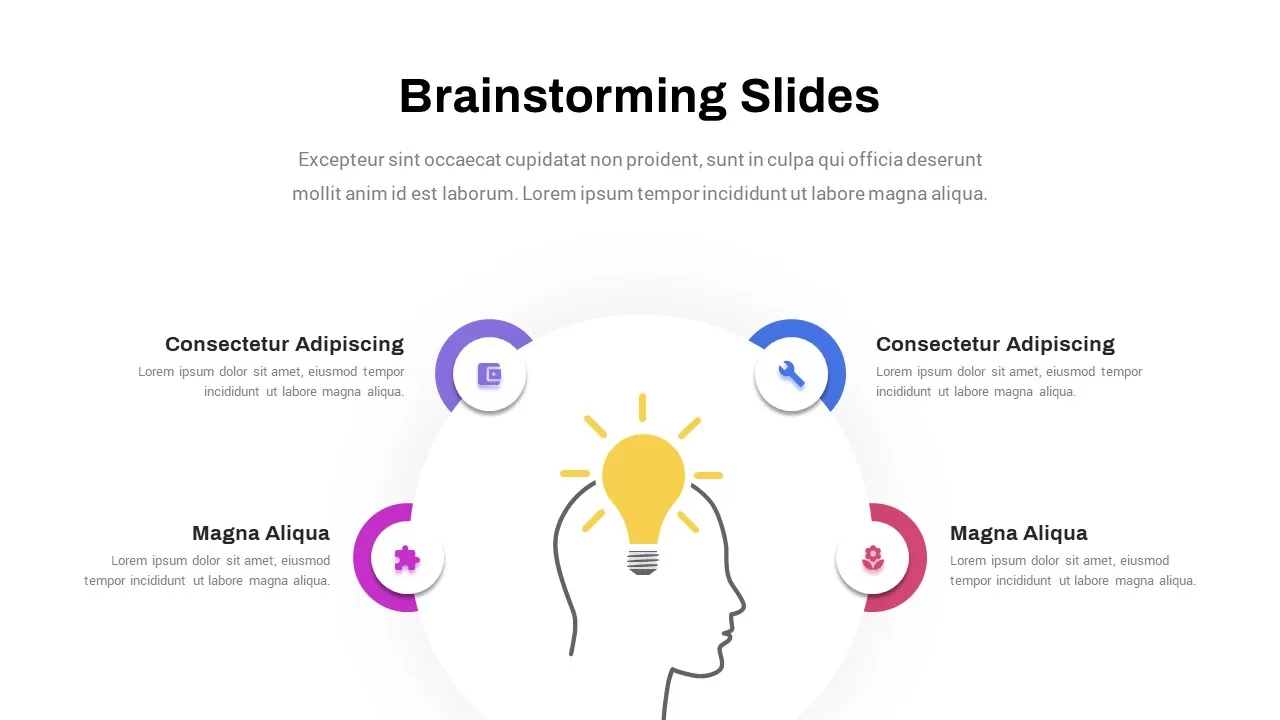
Creative Brainstorming Process Diagram Template for PowerPoint & Google Slides
Process
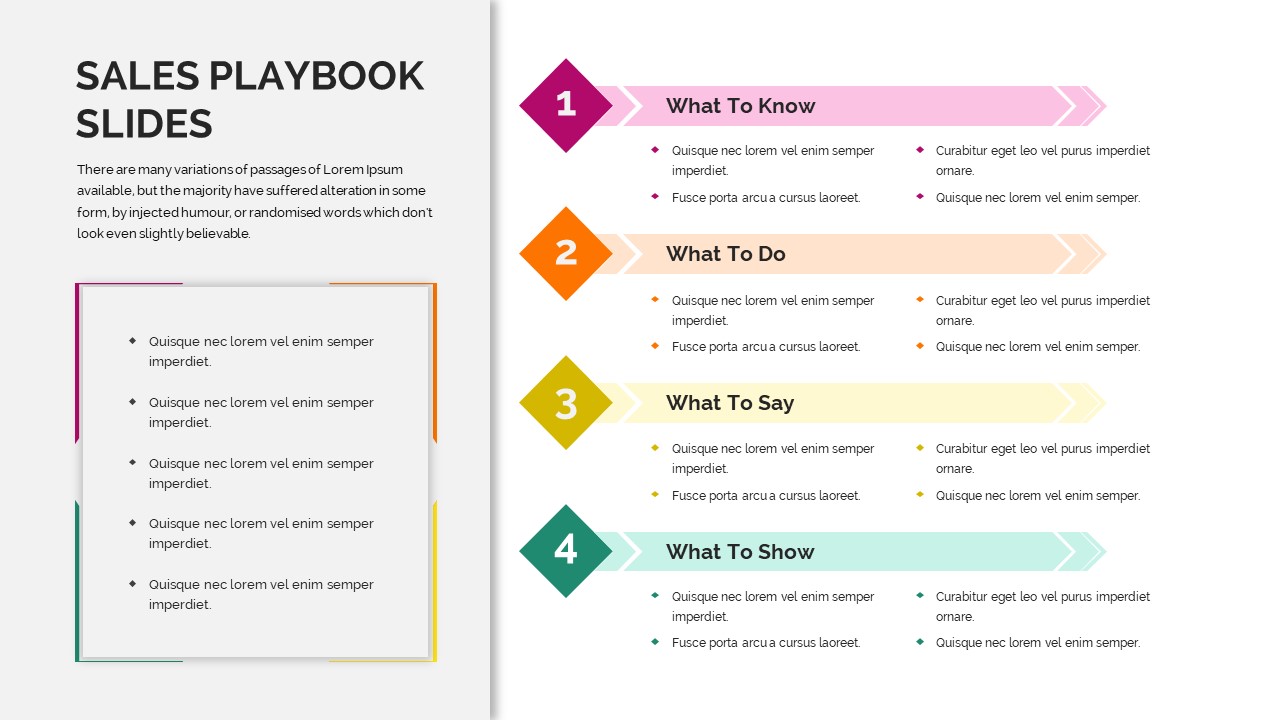
Sales Playbook Process Steps Diagram Template for PowerPoint & Google Slides
Marketing
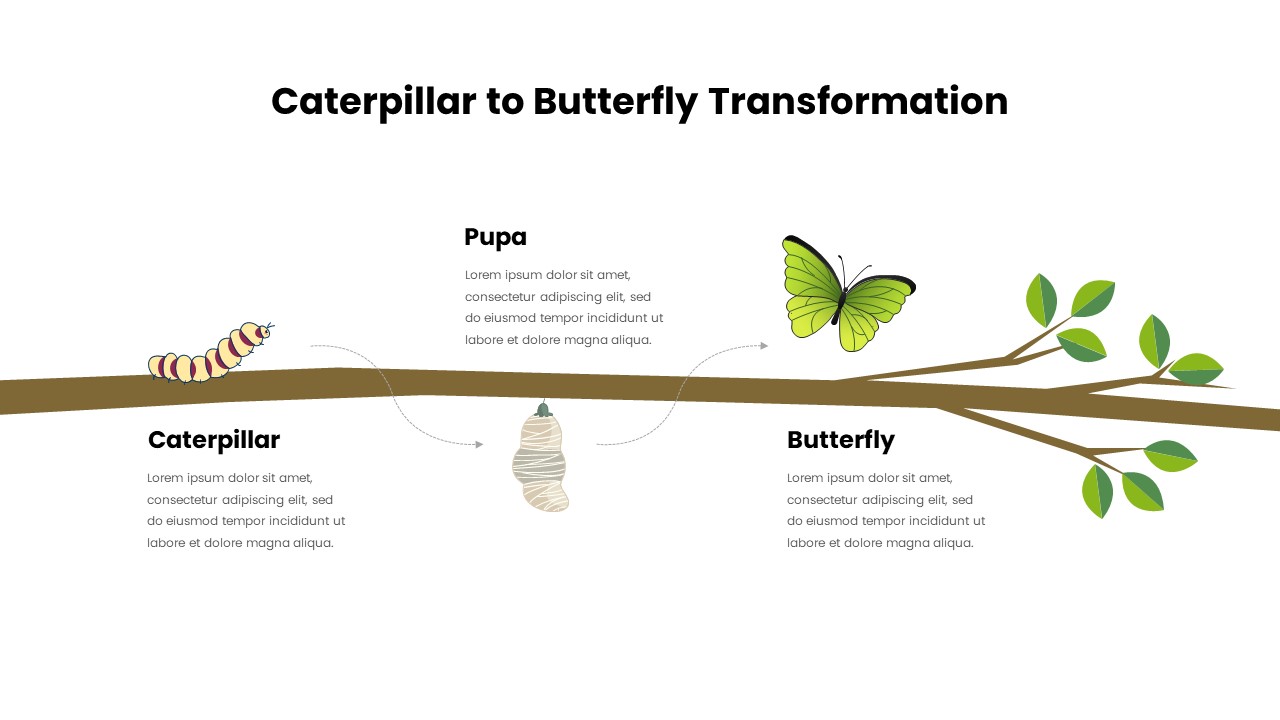
Caterpillar to Butterfly Process Template for PowerPoint & Google Slides
Process
Gear Process Diagram Template for PowerPoint & Google Slides
Process
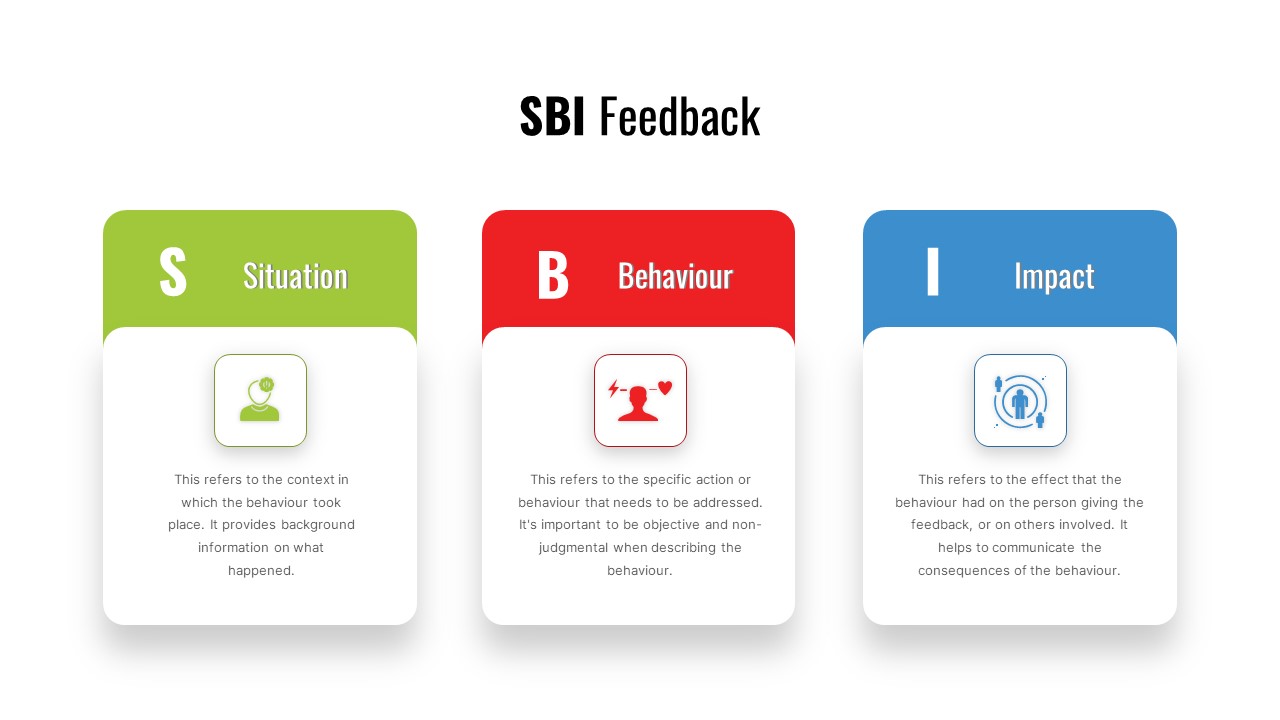
SBI Feedback Model Process Diagram Template for PowerPoint & Google Slides
Process
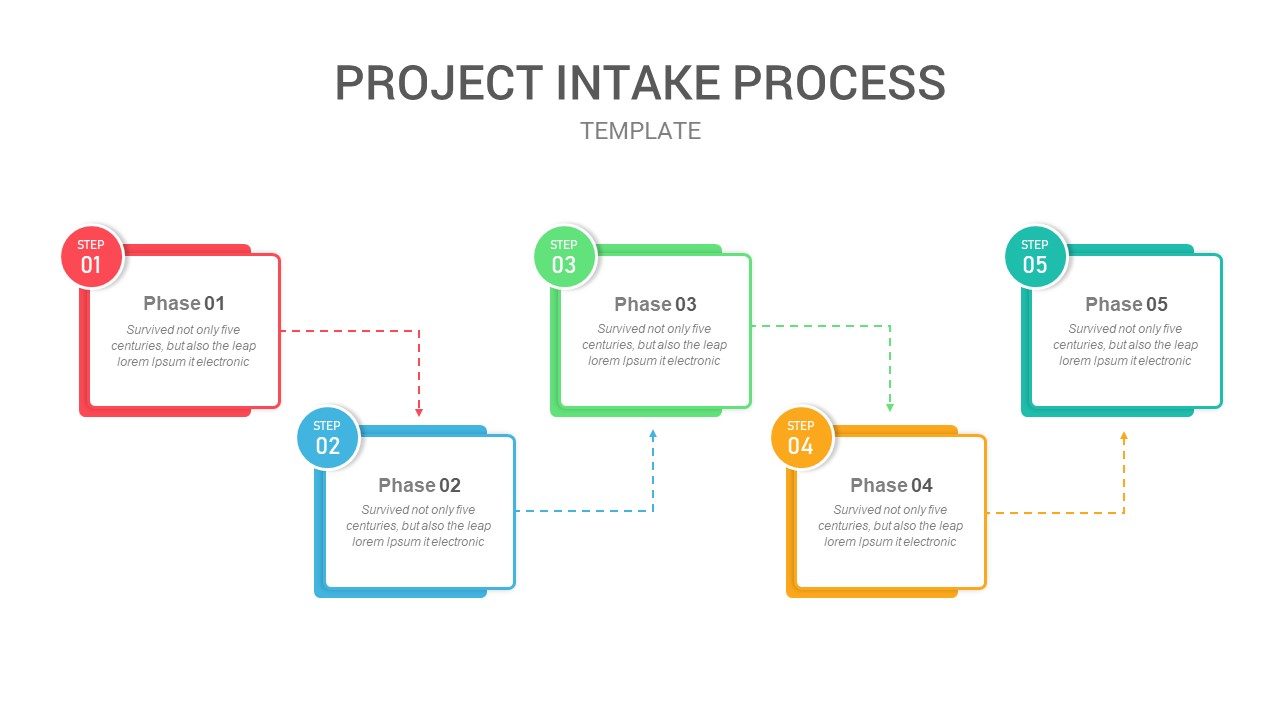
Five-Phase Project Intake Process Flow Template for PowerPoint & Google Slides
Process
Simple Flowchart Process Diagram Template for PowerPoint & Google Slides
Flow Charts
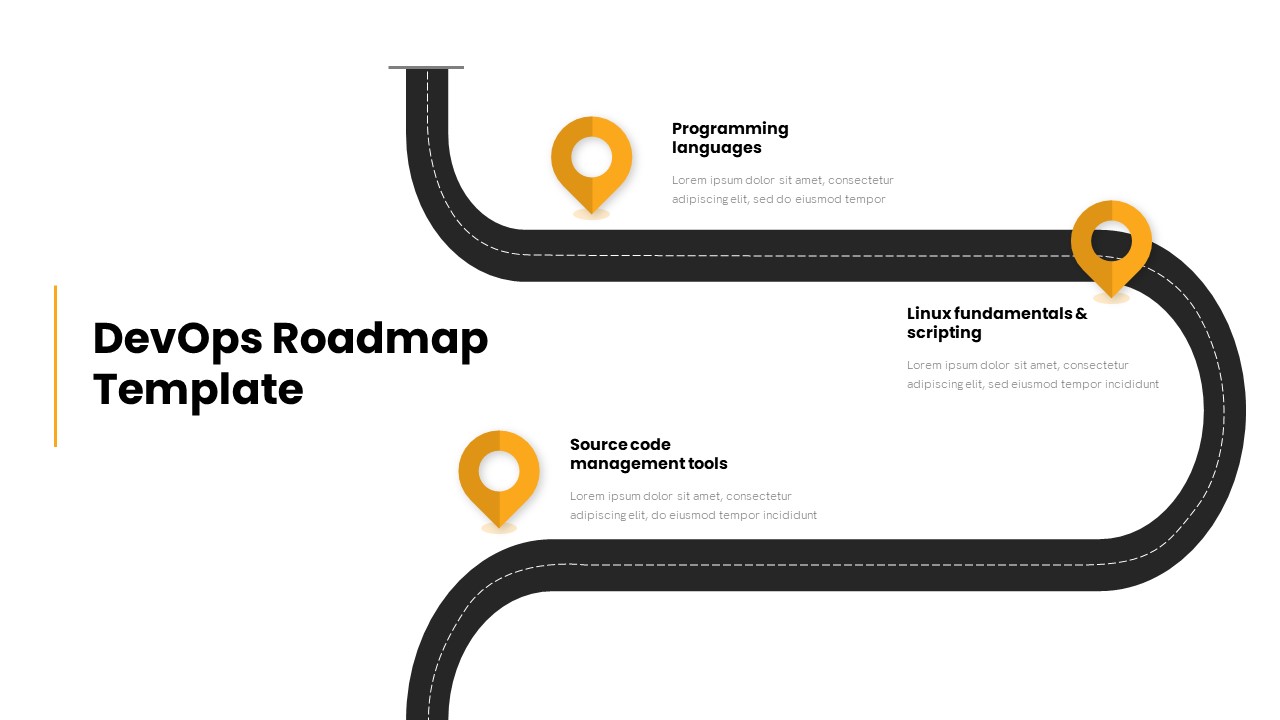
Winding DevOps Roadmap Process Template for PowerPoint & Google Slides
Software Development
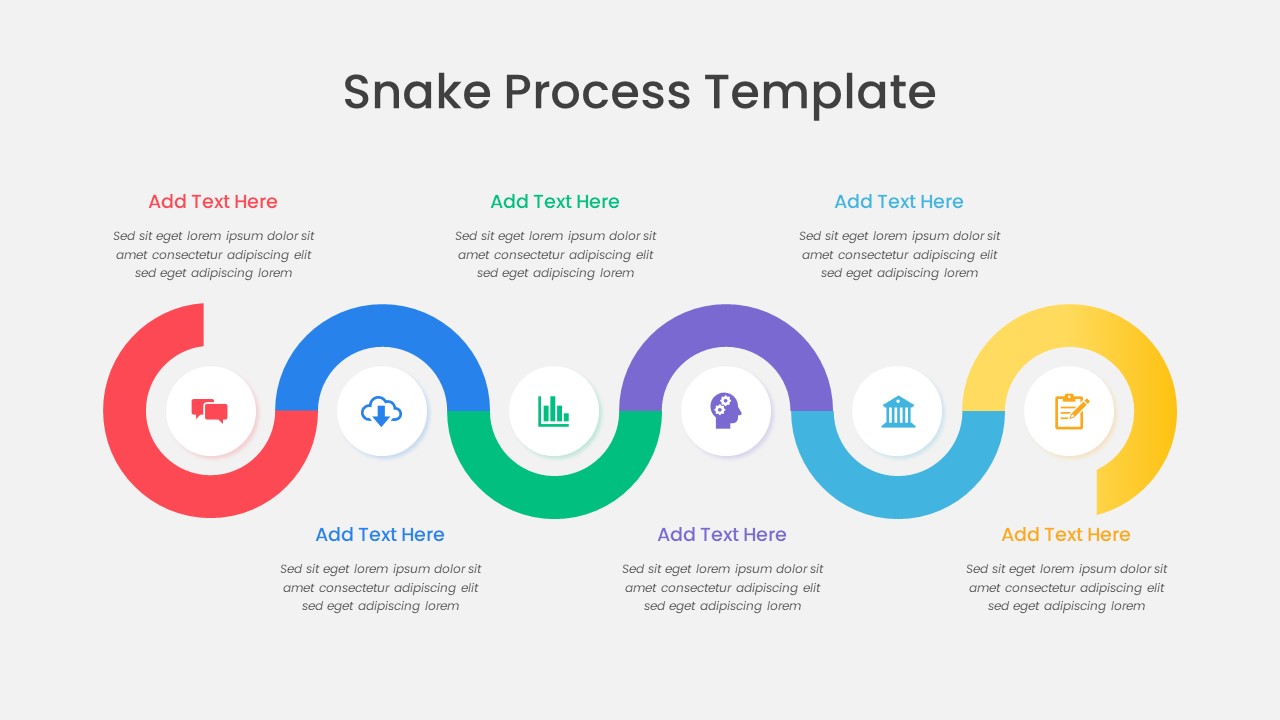
Colorful Snake Process Diagram Template for PowerPoint & Google Slides
Process
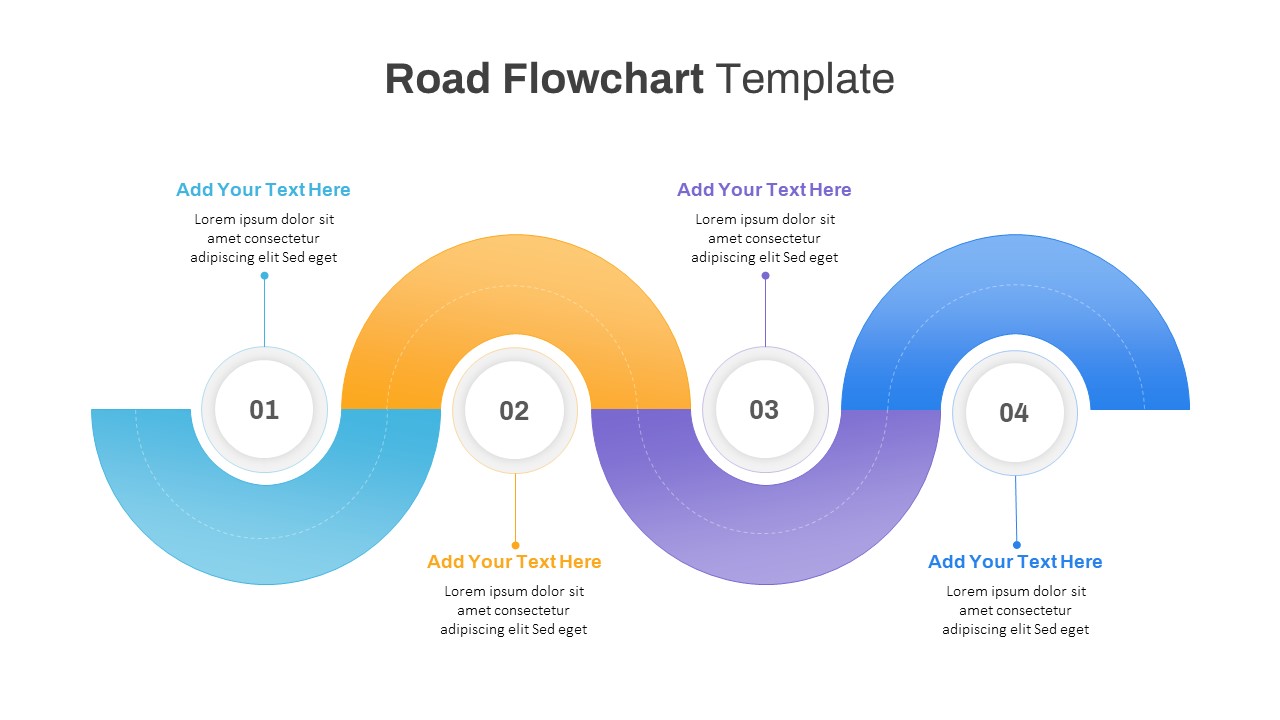
Road Flowchart Process with Four Steps Template for PowerPoint & Google Slides
Flow Charts
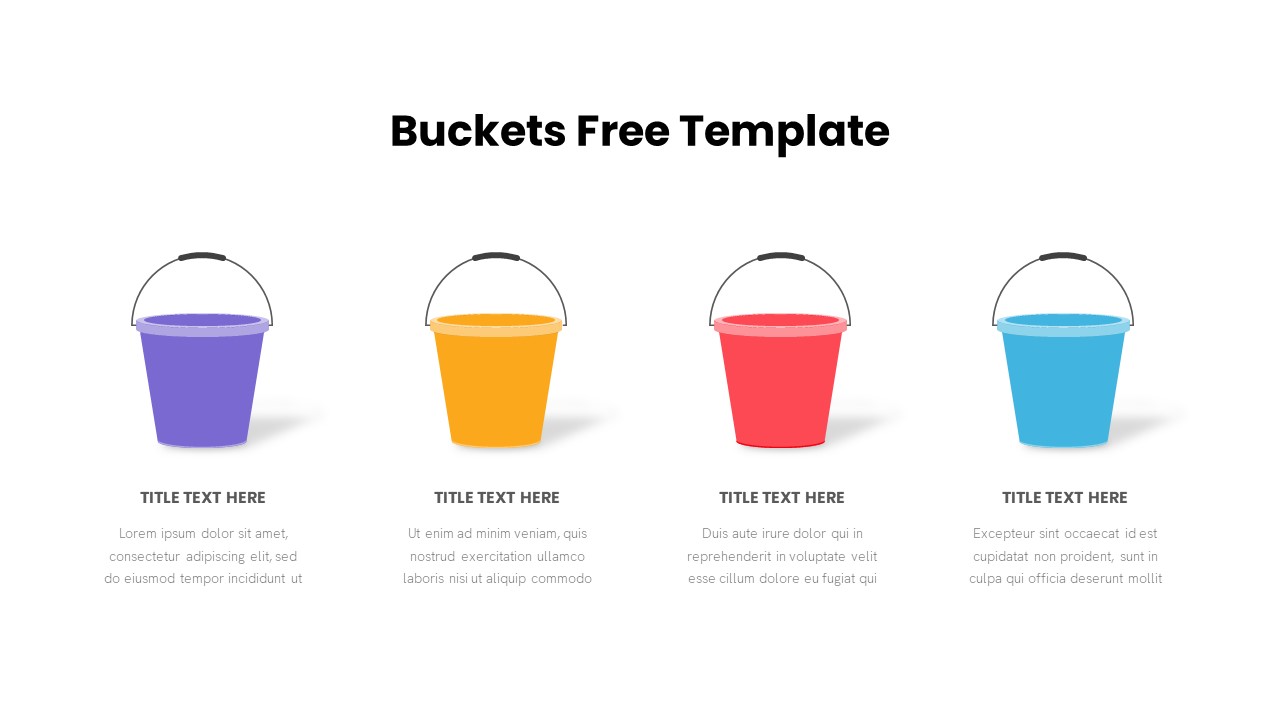
Free Bucket Process Visualization Template for PowerPoint & Google Slides
Process
Free
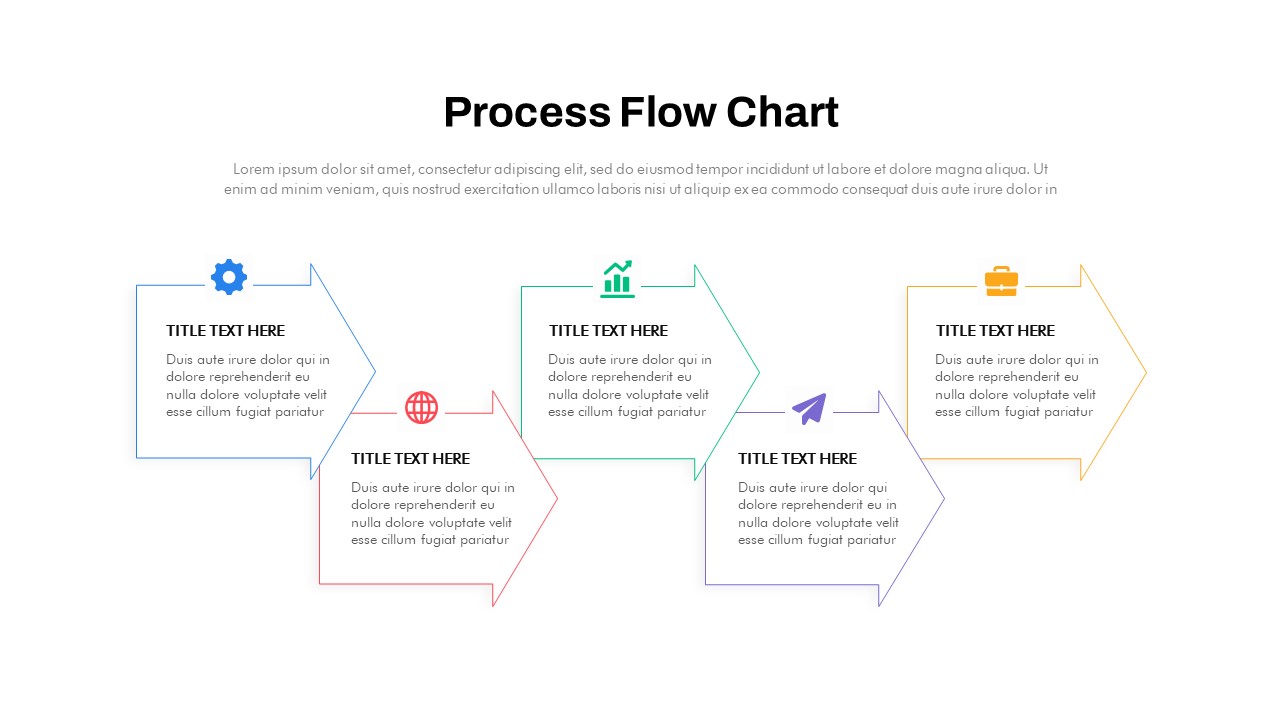
Animated Process Flow Chart Template for PowerPoint & Google Slides
Infographics
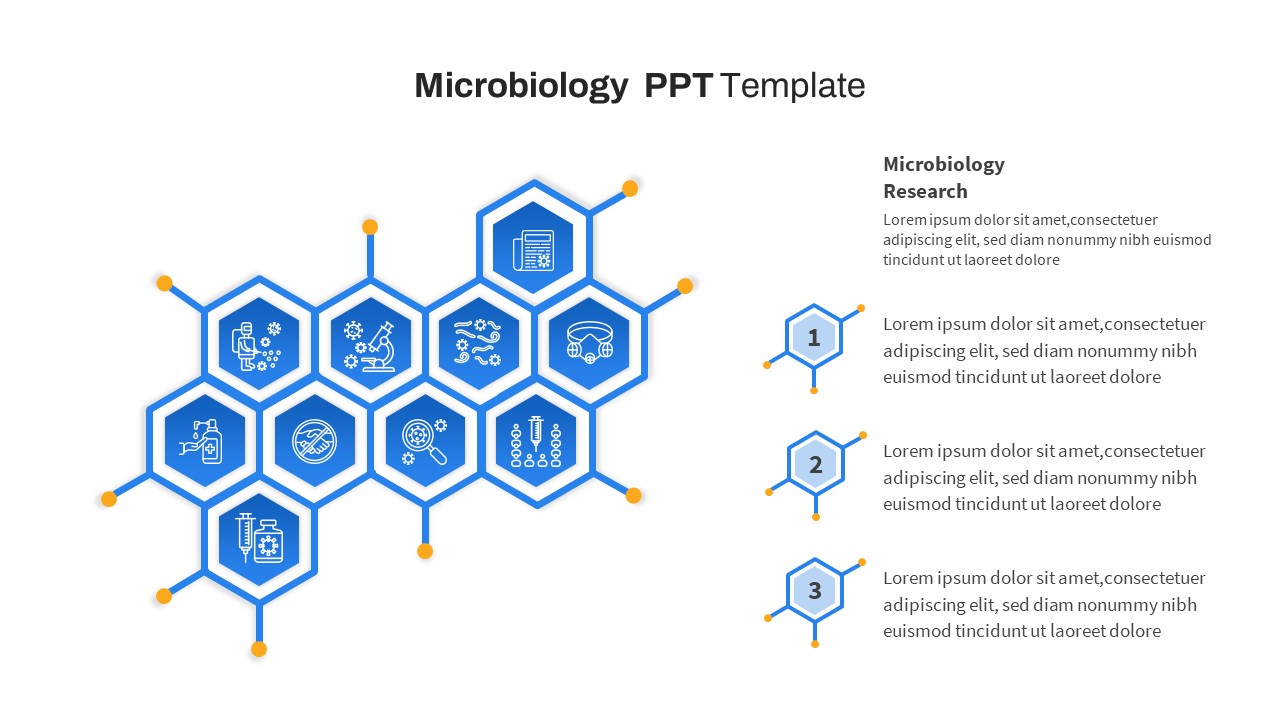
Free Hexagonal Microbiology Research Process Template for PowerPoint & Google Slides
Process
Free
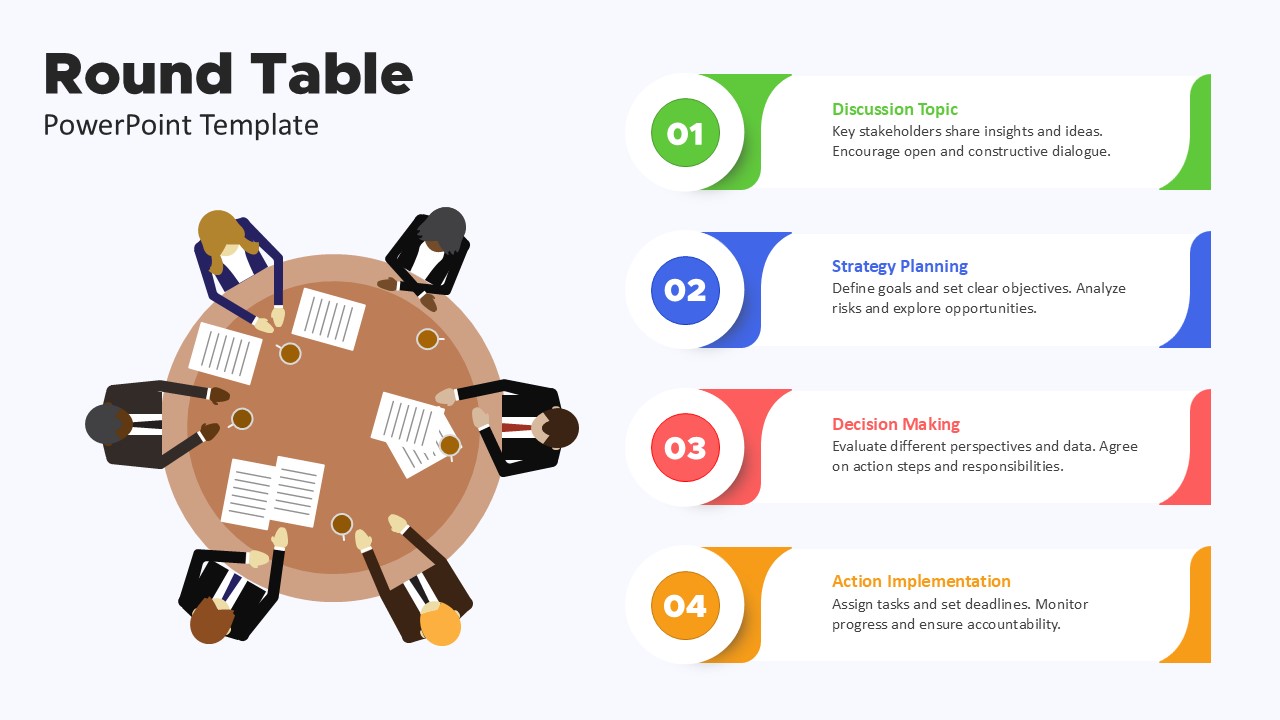
Title: Round Table Meeting Discussion Process Template for PowerPoint & Google Slides
Process
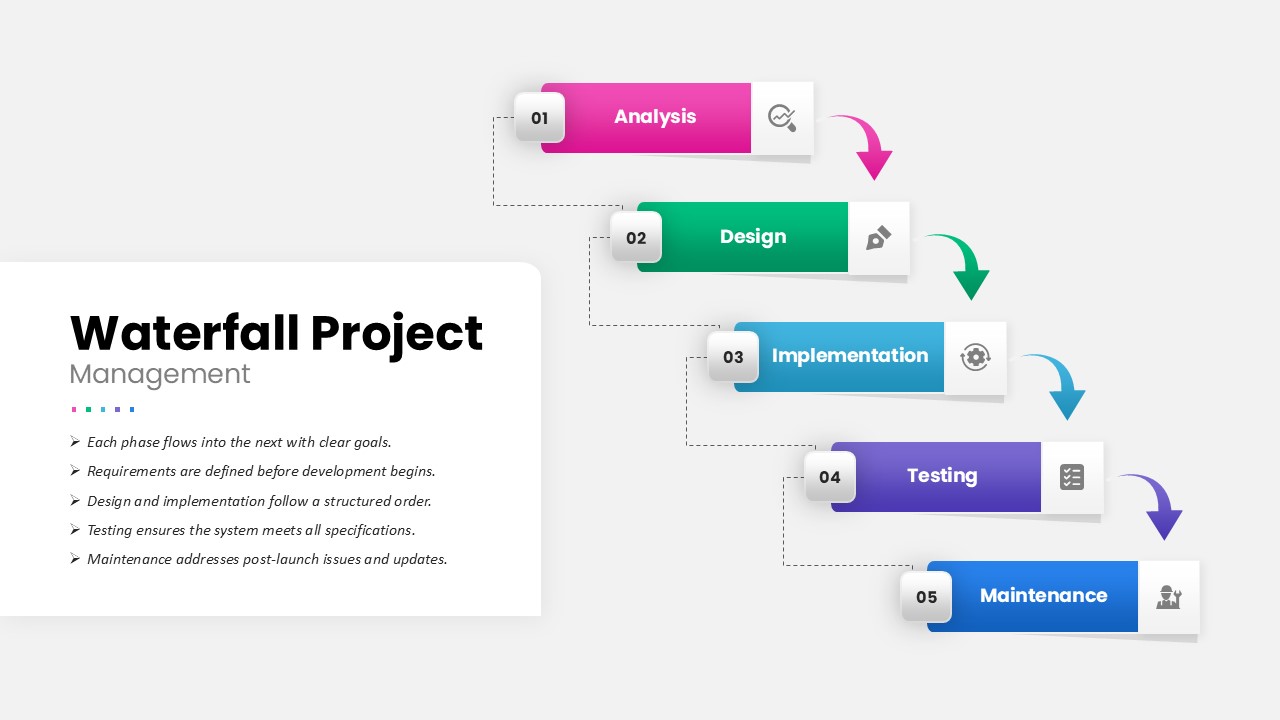
Waterfall Project Management Process template for PowerPoint & Google Slides
Process
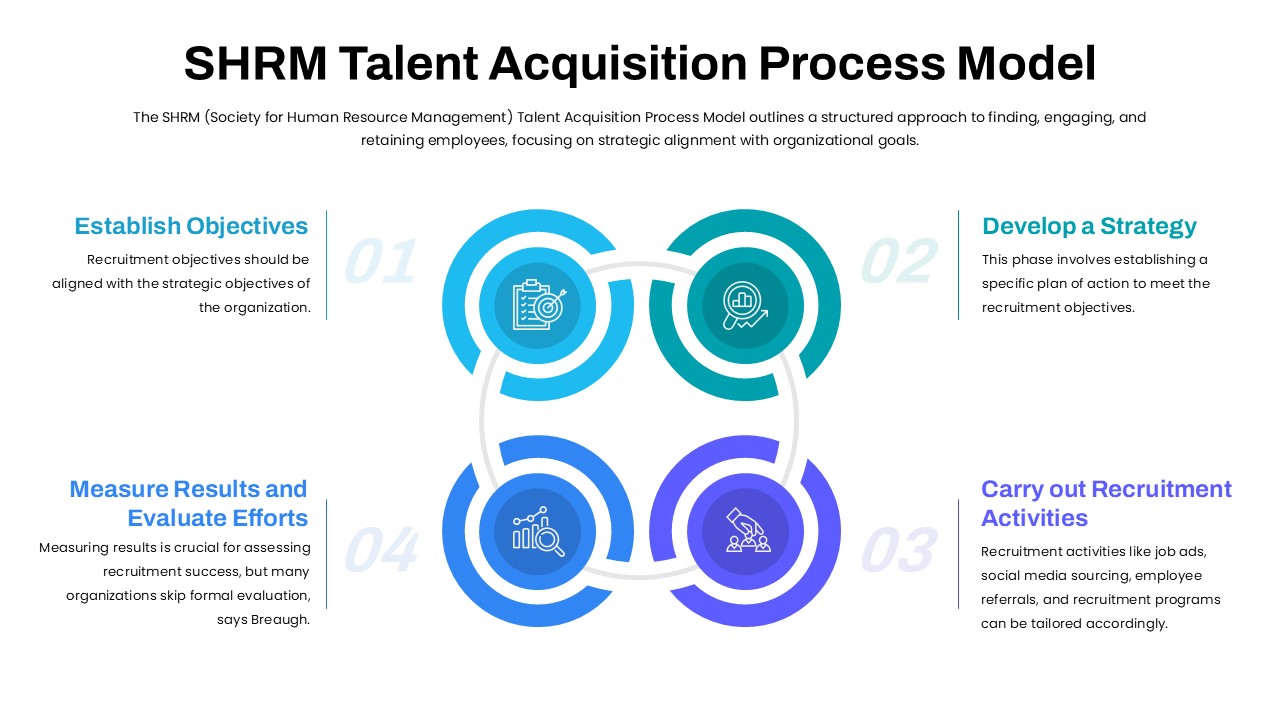
SHRM Talent Acquisition Process Model Template for PowerPoint & Google Slides
Business Models
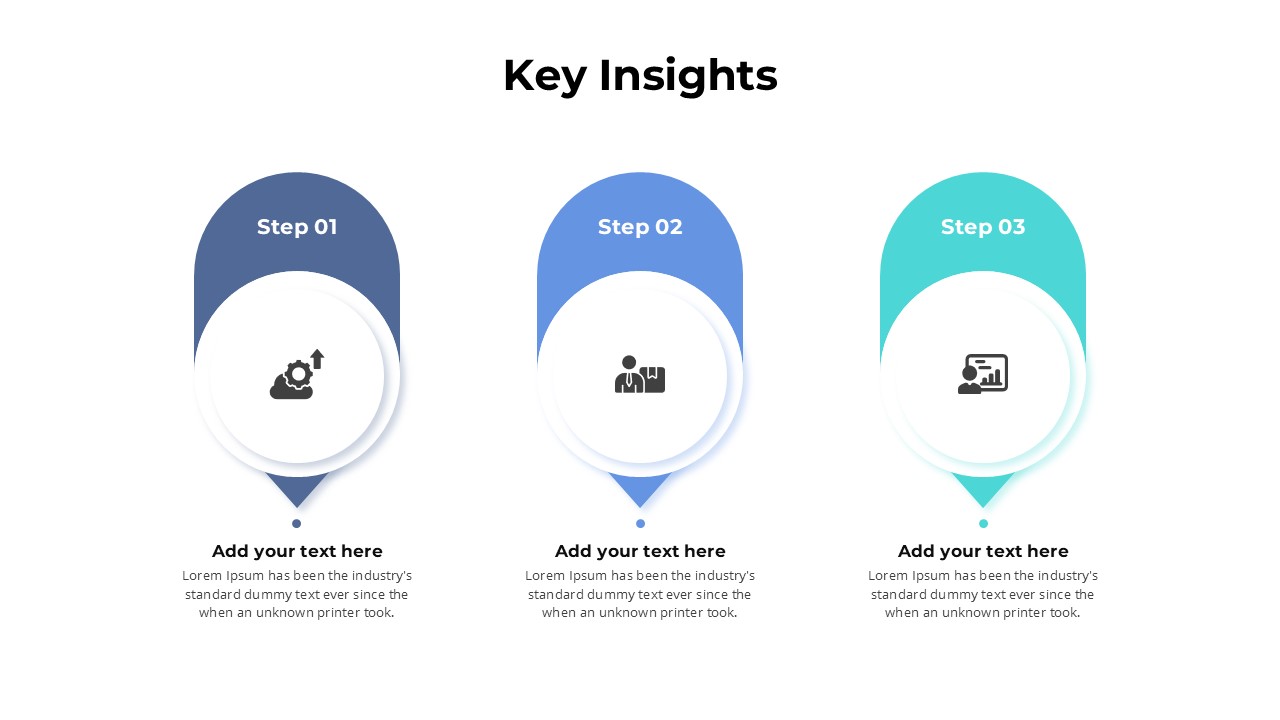
Key Insights Process Template for PowerPoint & Google Slides
Process
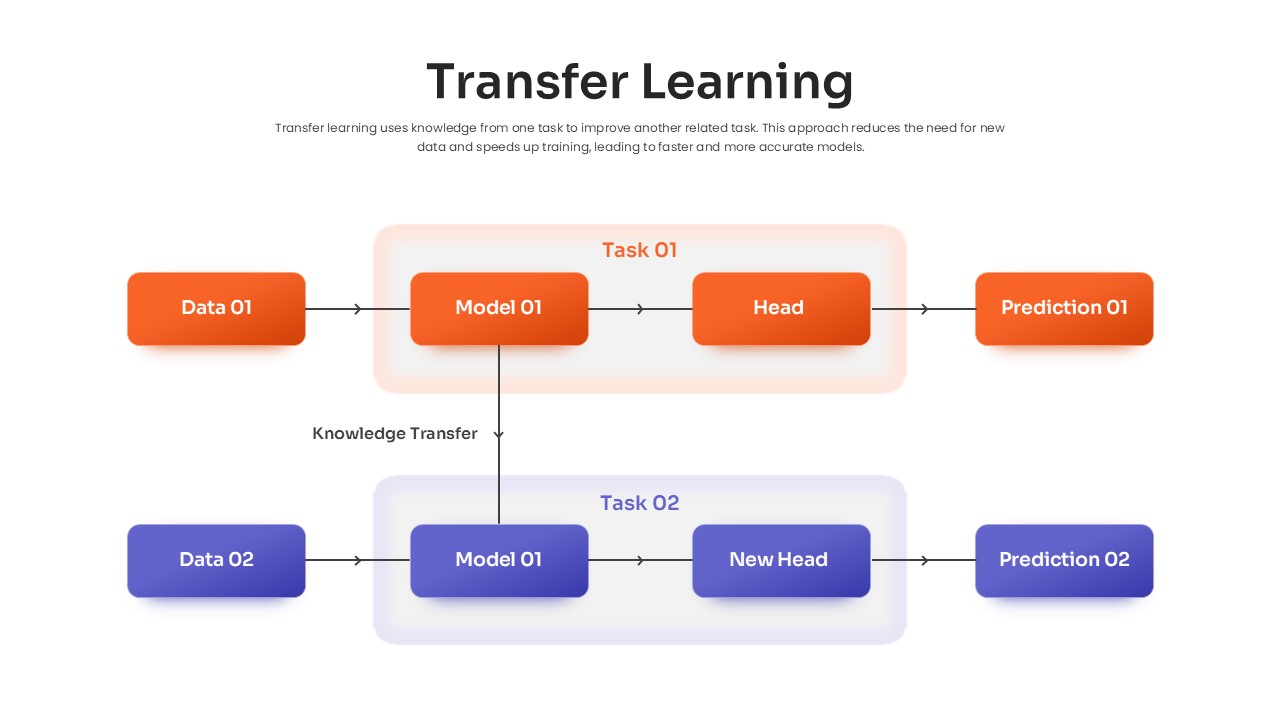
Transfer Learning Process template for PowerPoint & Google Slides
Technology
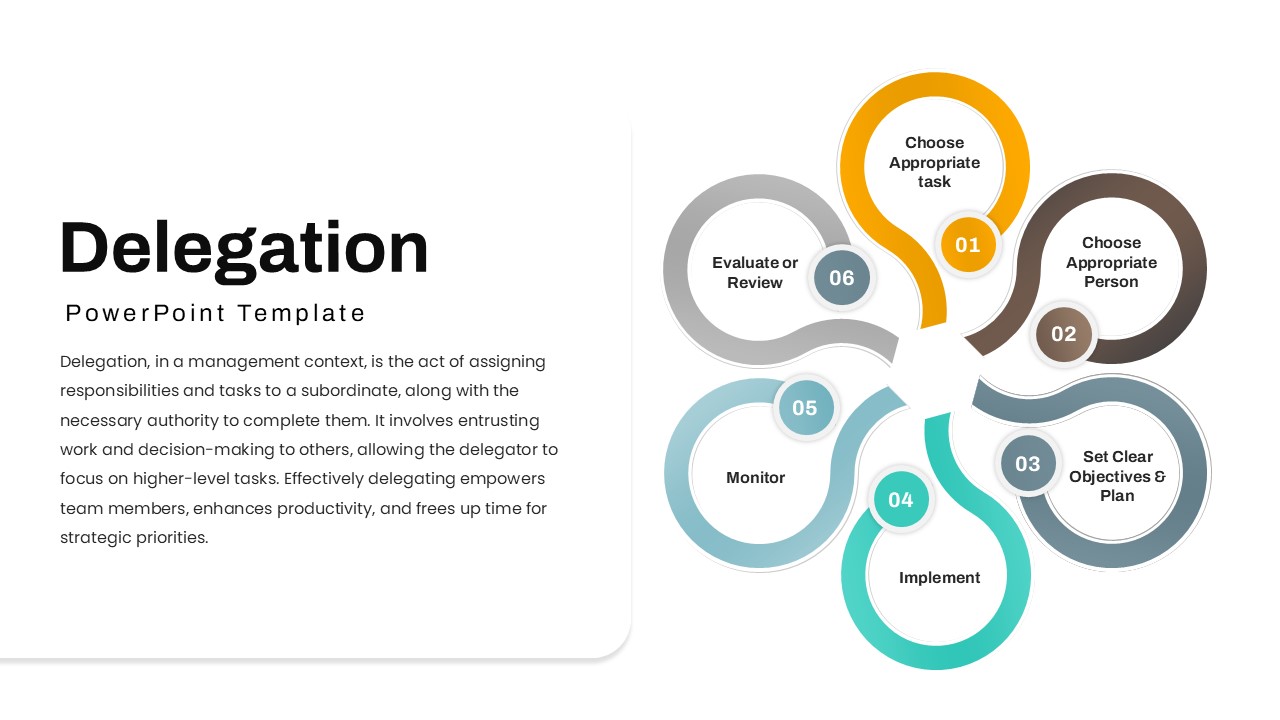
Delegation Process Overview template for PowerPoint & Google Slides
Leadership
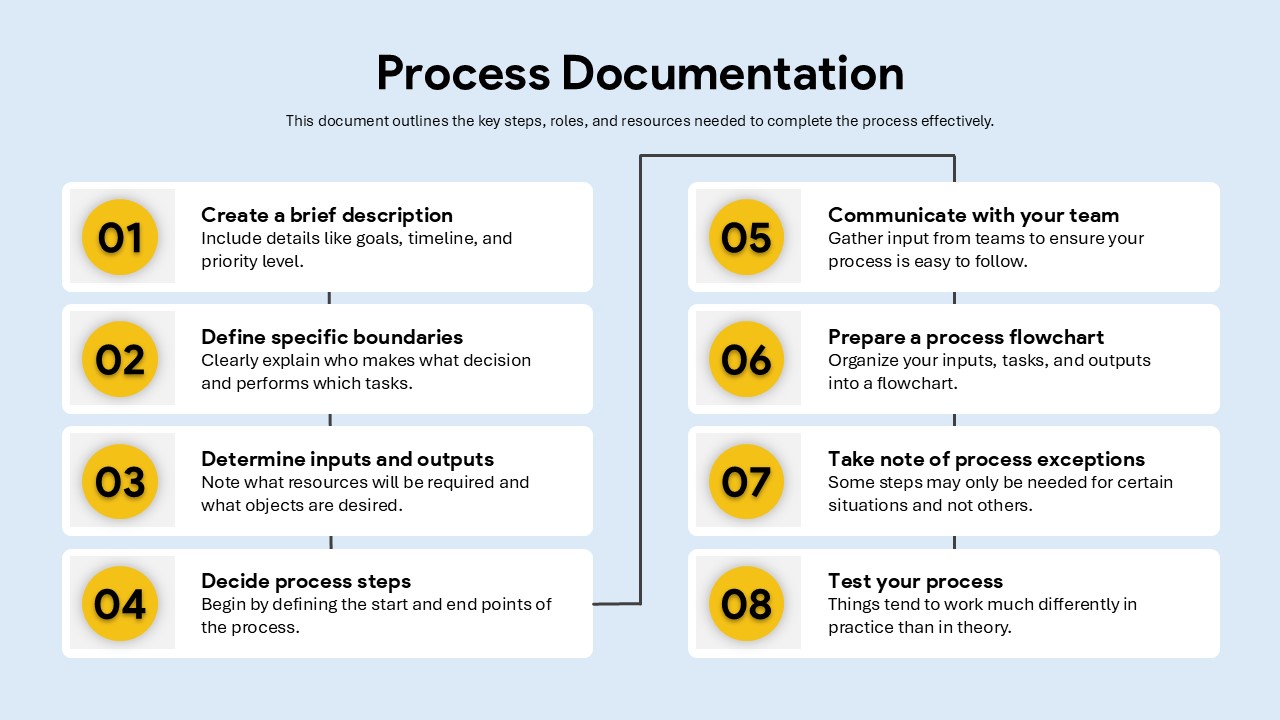
Process Documentation Workflow Slide Template for PowerPoint & Google Slides
Process
Resume Screening Process Flow Diagram Template for PowerPoint & Google Slides
Process
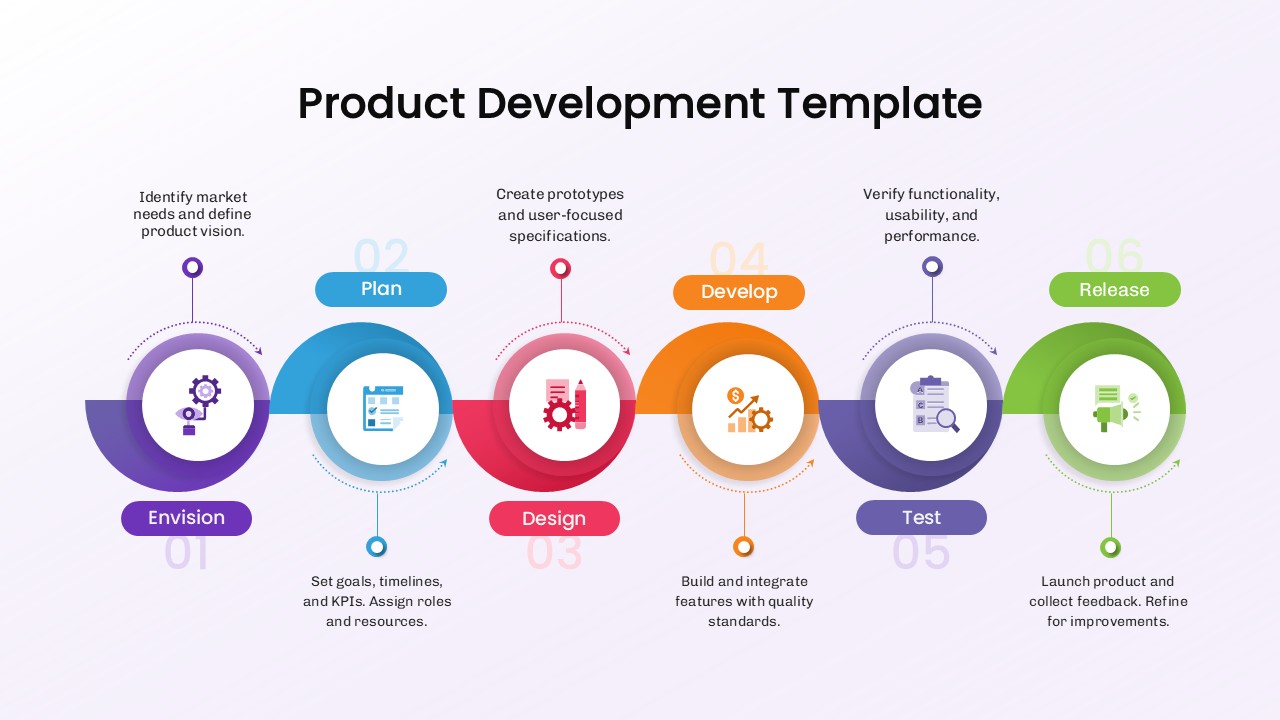
Six Stage Product Development Process Template for PowerPoint & Google Slides
Software Development
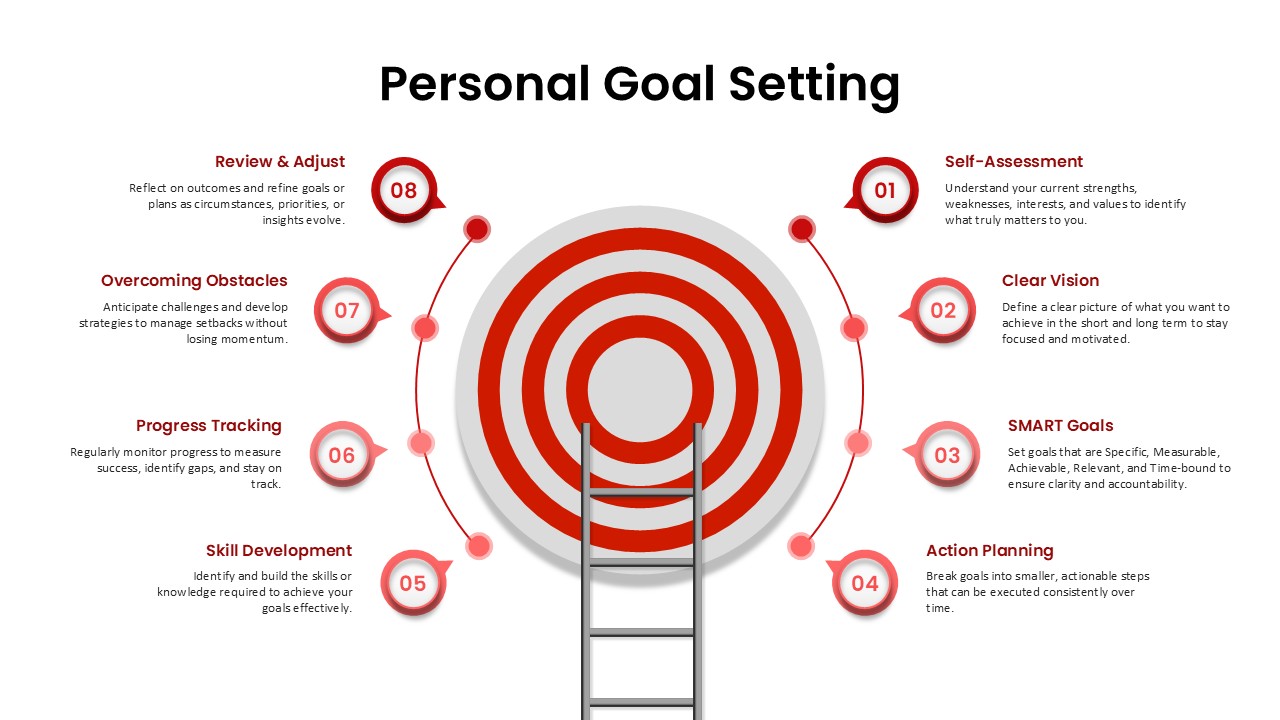
Free Personal Goal Setting Process Template for PowerPoint & Google Slides
Goals
Free