Supplier Preferencing Model Matrix Template for PowerPoint & Google Slides

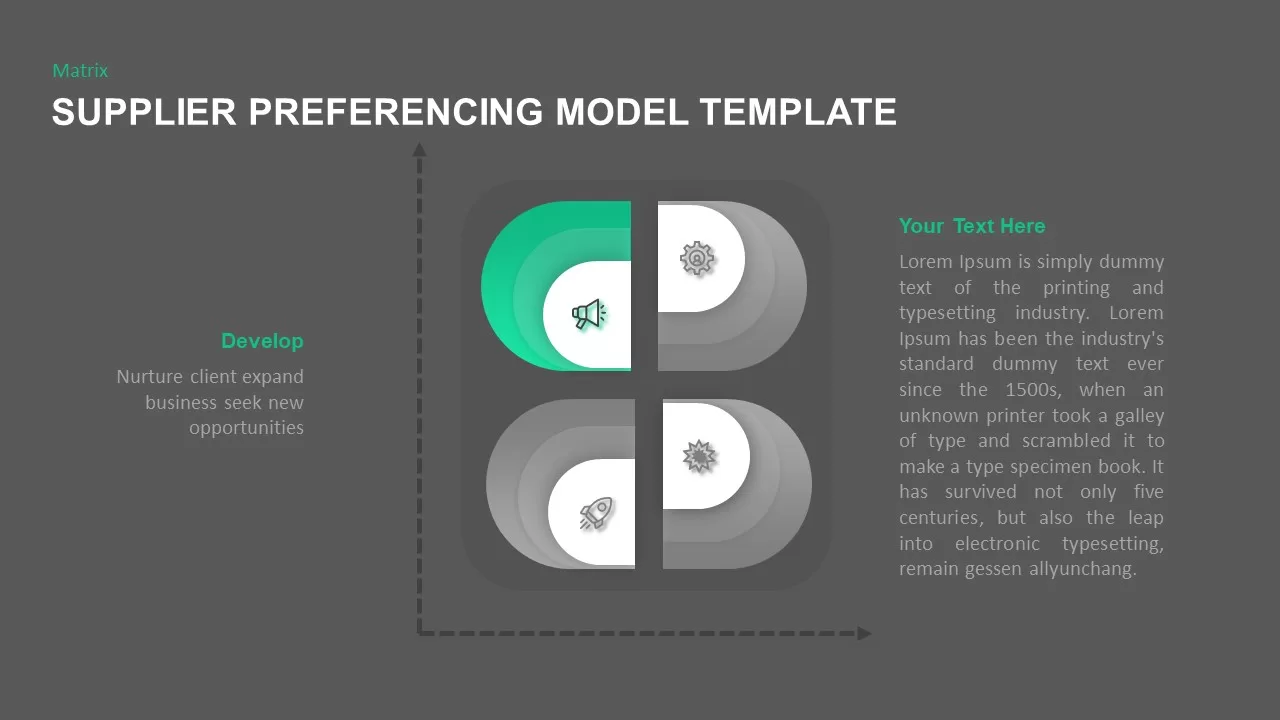
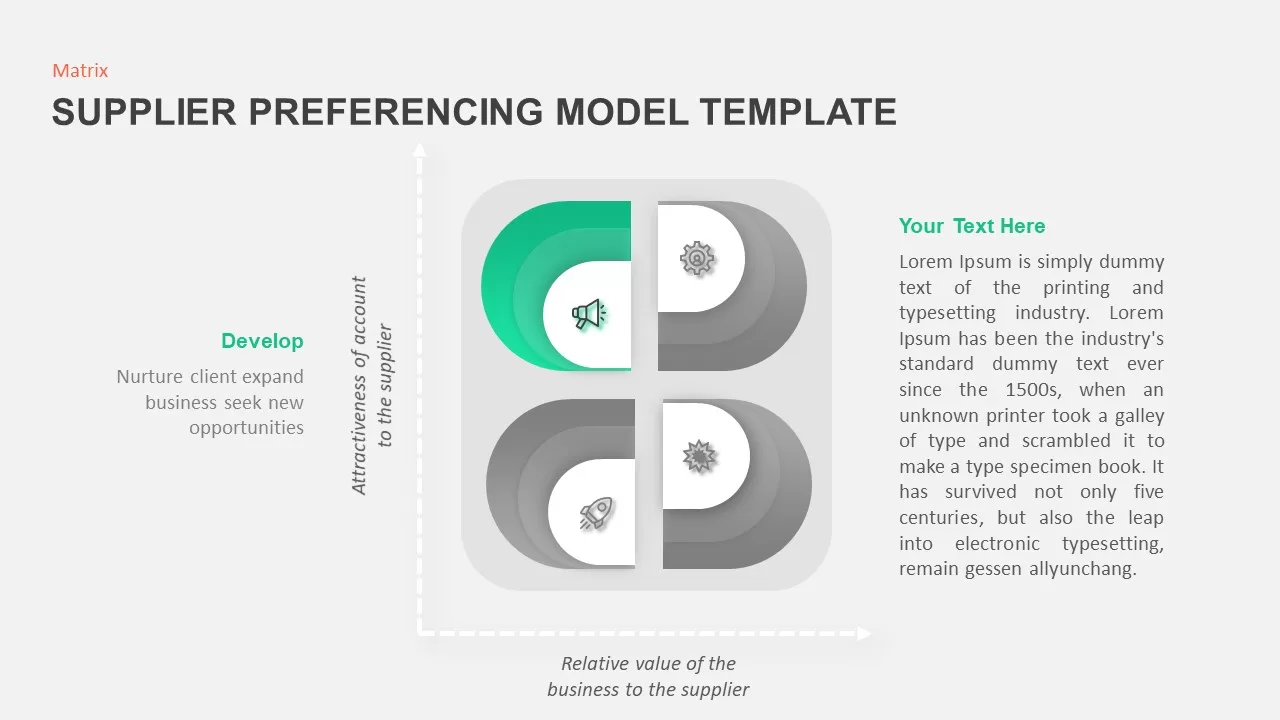

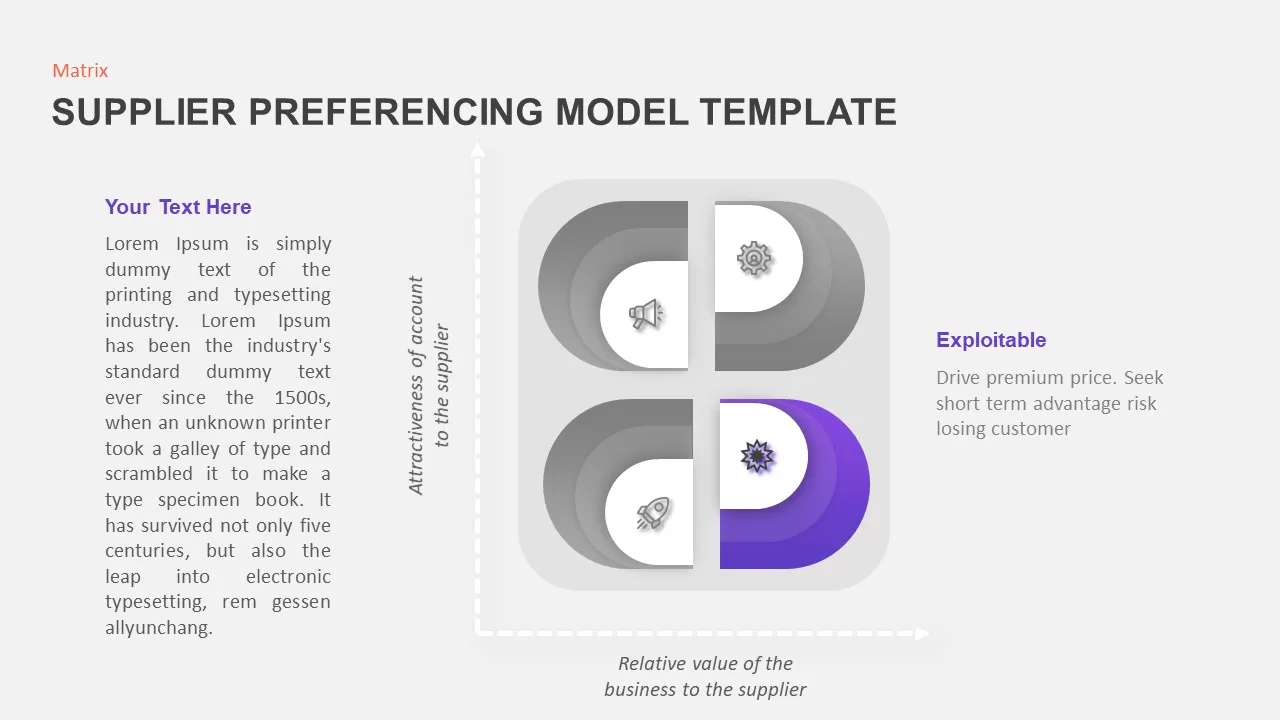
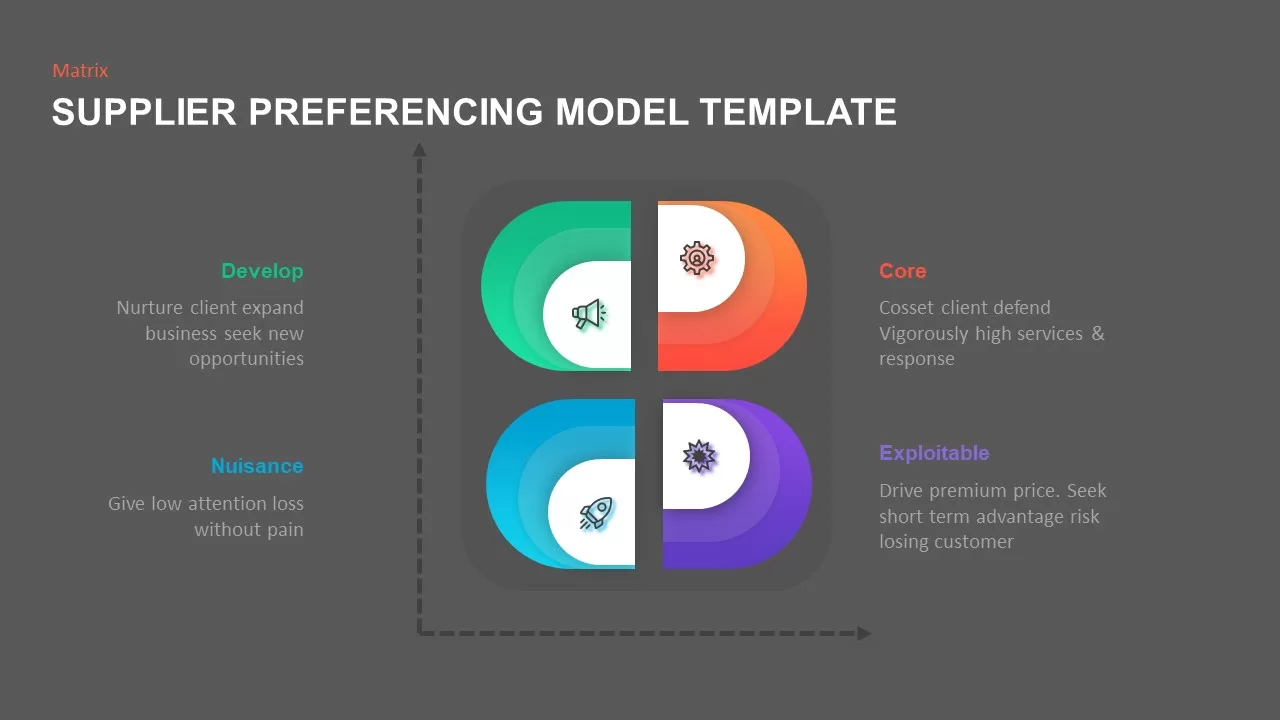
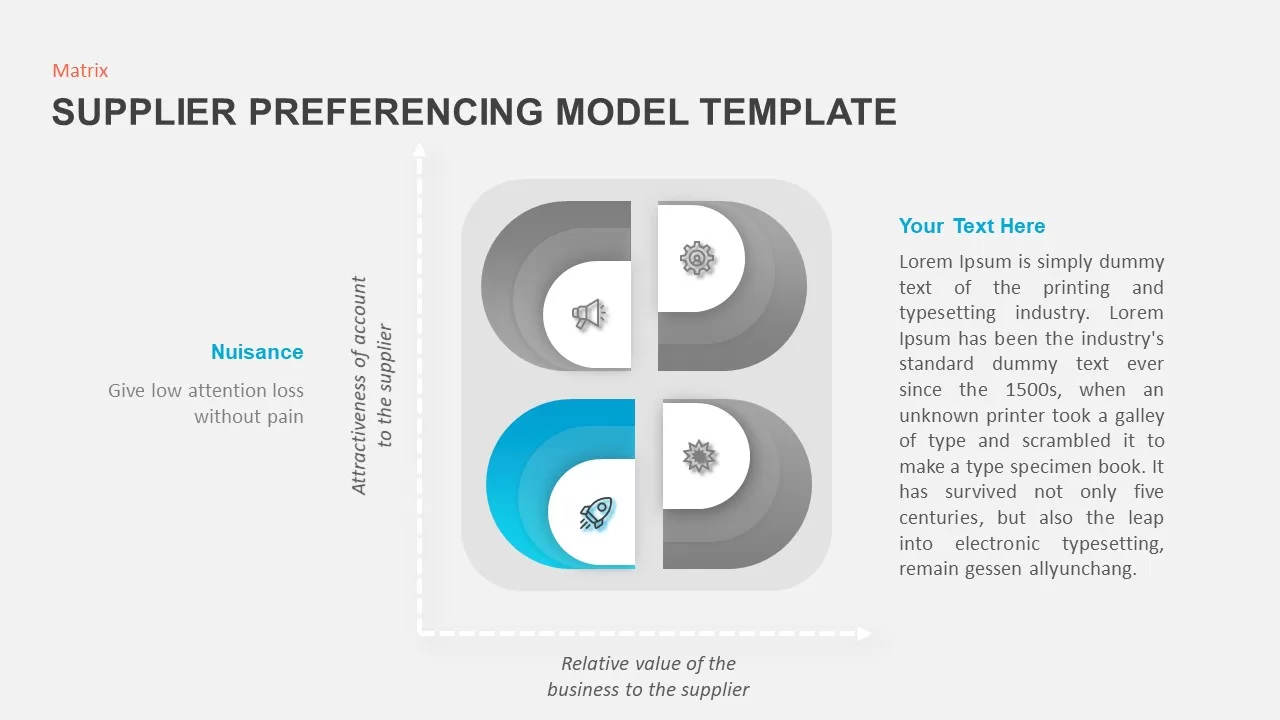
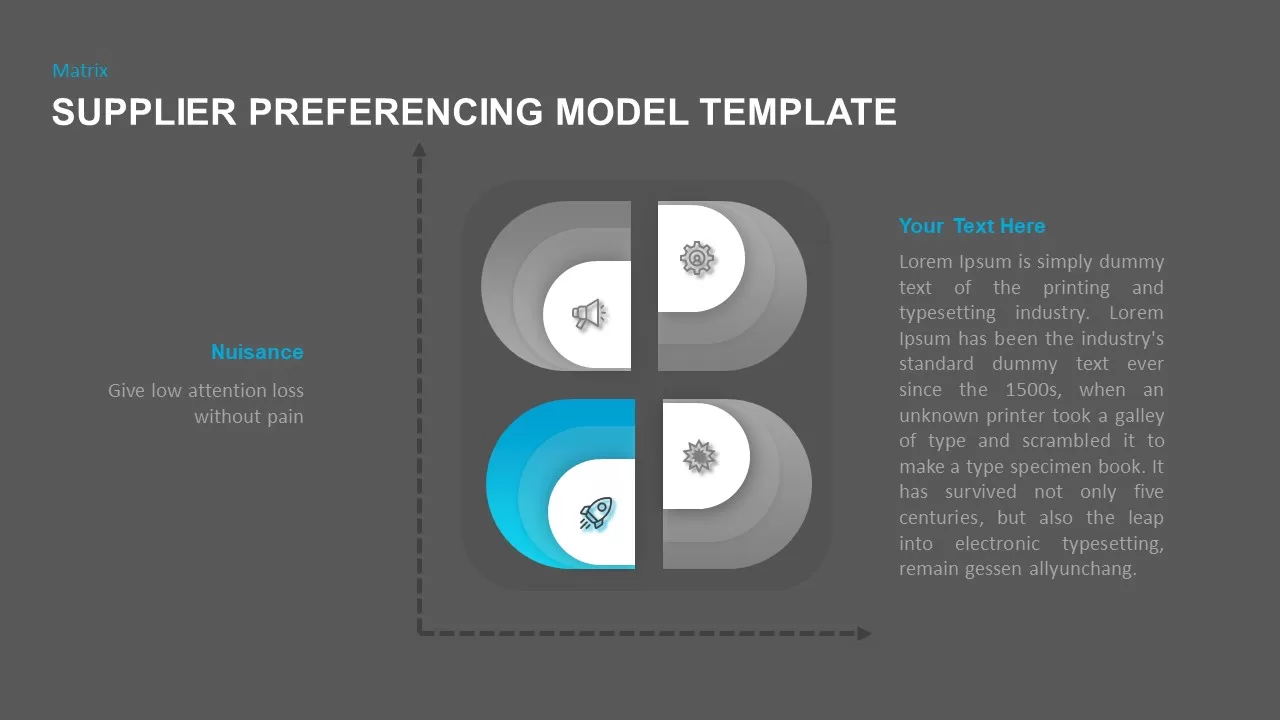

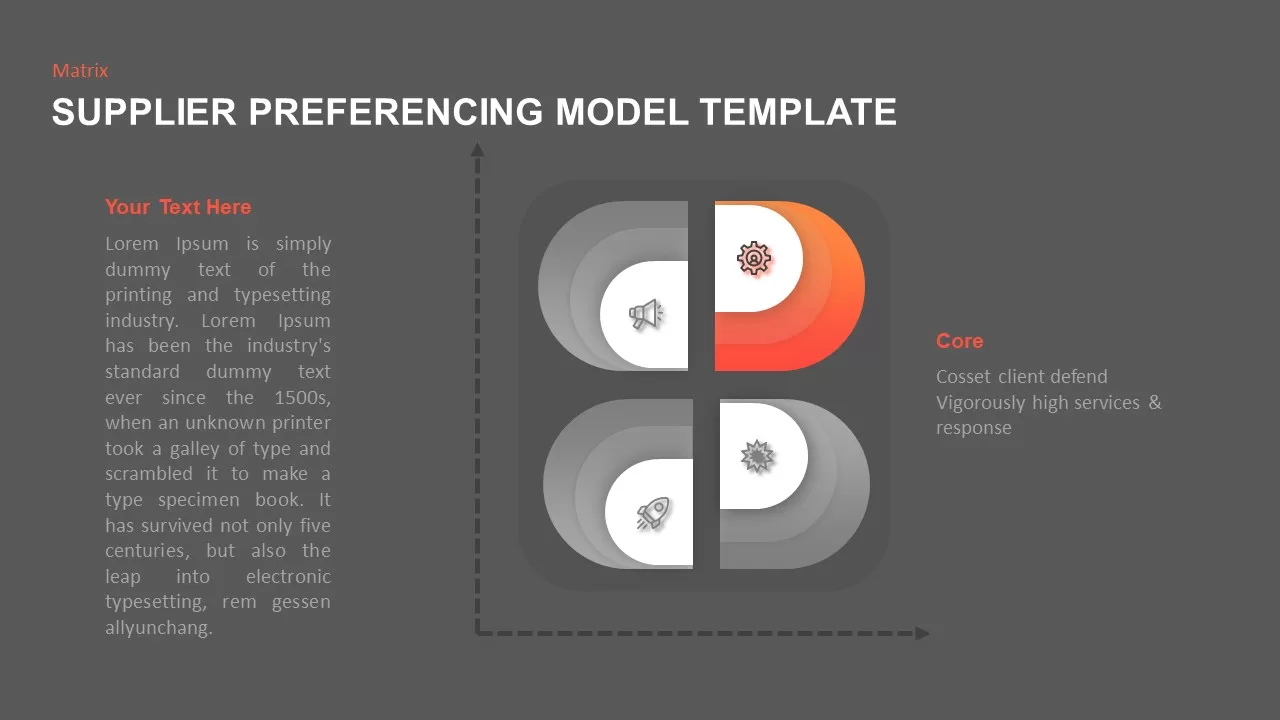
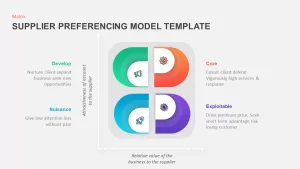
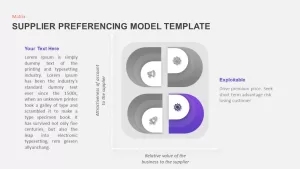
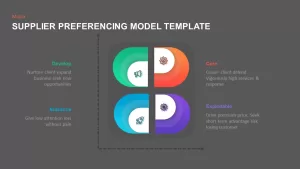


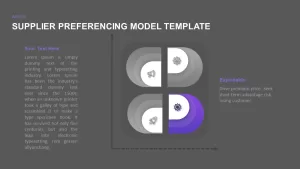

This slide features a 2×2 quadrant matrix housed in a rounded square, plotting ‘Attractiveness of account to the supplier’ on the vertical axis and ‘Relative value of the business to the supplier’ on the horizontal. Each quadrant is rendered in a distinct gradient hue—green for ‘Develop’, orange for ‘Core’, teal for ‘Nuisance’, and purple for ‘Exploitable’—and contains an icon placeholder alongside a headline and brief subtitle text. Dashed axis lines with arrowheads guide the eye, while soft drop shadows and subtle corner rounding lend a modern, polished look.
Built for rapid customization, all components are fully editable vector shapes. Simply swap icons, adjust gradient stops, or update text placeholders to define your own supplier categories. Alignment guides and master slide layouts ensure consistent spacing and branding across your presentation. The overlay grid and smart-art placeholders make it easy to replace dummy content with real metrics, objectives, or strategic actions.
Use this model to segment vendors, prioritize supplier relationships, and communicate sourcing strategies. By mapping each supplier’s account attractiveness and business value, procurement teams can identify which relationships to nurture, protect, deprioritize, or monetize. Whether you are presenting a quarterly sourcing review, negotiating service-level agreements, or designing a vendor management framework, this infographic clarifies complex vendor data at a glance.
Adaptable to other domains, this quadrant design can also support customer segmentation, risk analysis, market positioning, or product portfolio management. Duplicate or hide quadrants to suit three- or five-category frameworks, and recolor segments to align with your brand palette. Master slide integration and color-theme controls guarantee a seamless brand alignment across multiple decks.
Who is it for
Procurement managers, supply chain analysts, vendor relationship teams, and category management specialists will benefit from this slide when structuring supplier segmentation, sourcing strategies, or vendor performance reviews. Strategic sourcing consultants and C-suite stakeholders can leverage its clear, data-driven visuals to align on vendor-management priorities.
Other Uses
Beyond supplier strategies, repurpose this matrix for customer segmentation, partner prioritization, risk-assessment mapping, product portfolio categorization, and stakeholder influence analysis. Adjust titles and axis labels to apply the same quadrant layout across a variety of strategic-planning scenarios.
Login to download this file

Item ID
SB02001
Related Templates

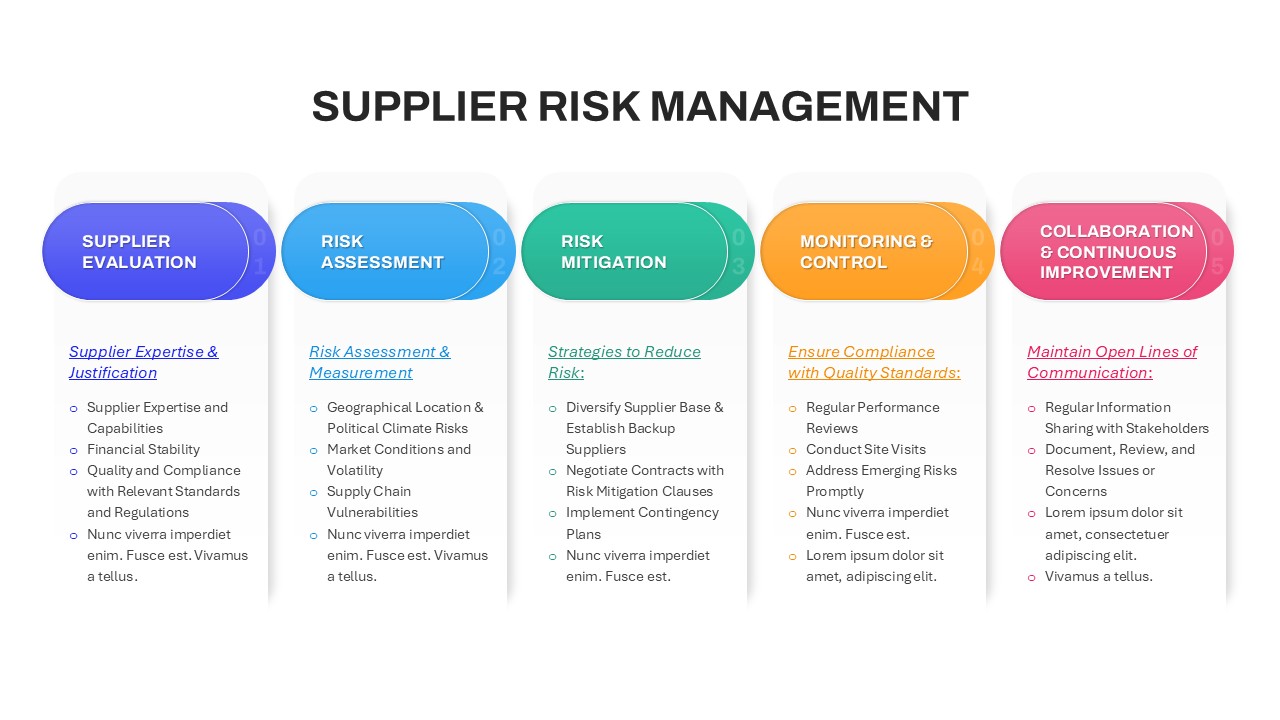
Supplier Risk Management template for PowerPoint & Google Slides
Opportunities Challenges
Ansoff Matrix Growth Strategy Model Template for PowerPoint & Google Slides
BCG
Supply Positioning Model Matrix Template for PowerPoint & Google Slides
Comparison Chart
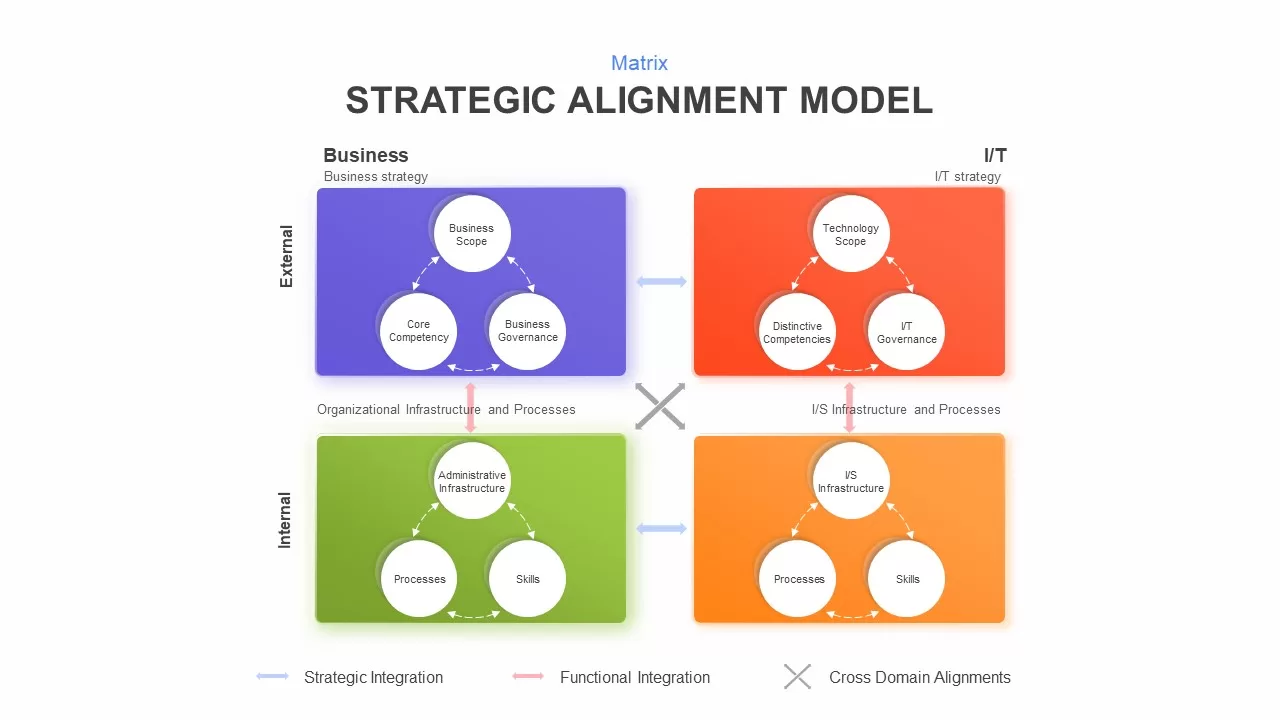
Strategic Alignment Matrix Model Template for PowerPoint & Google Slides
Project

Innovation Ambition Matrix & Funnel Strategy Slides for PowerPoint & Google Slides
Process
Market Development Matrix Chart Template for PowerPoint & Google Slides
Comparison Chart
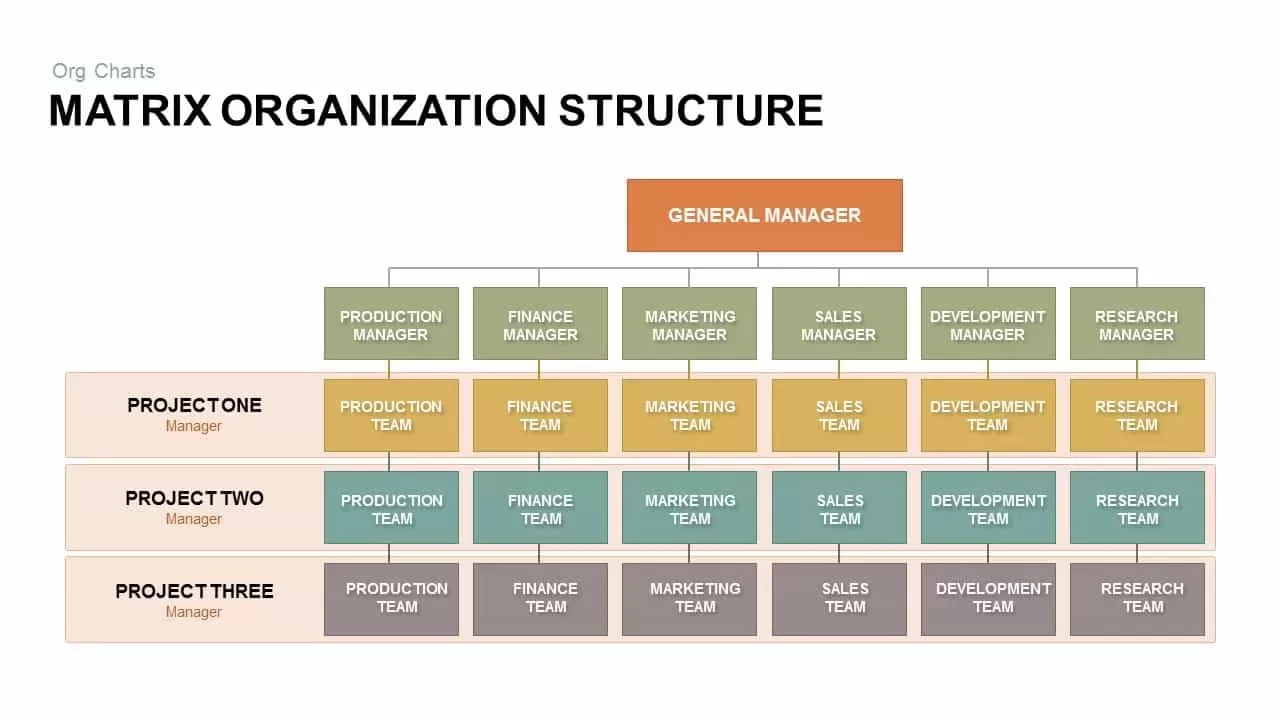
Matrix Organization Structure template for PowerPoint & Google Slides
Org Chart

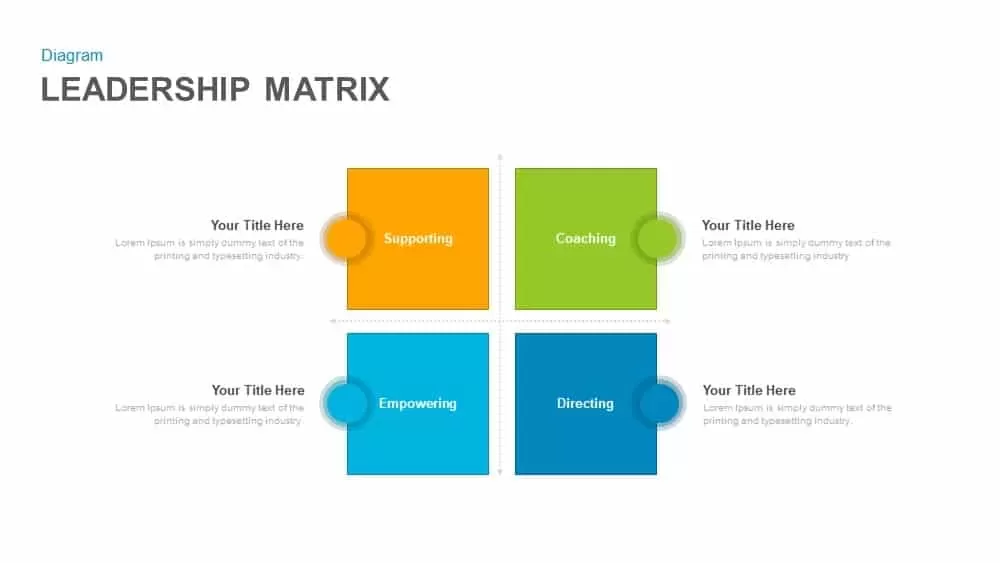
Leadership Matrix with Four Quadrants Template for PowerPoint & Google Slides
Comparison
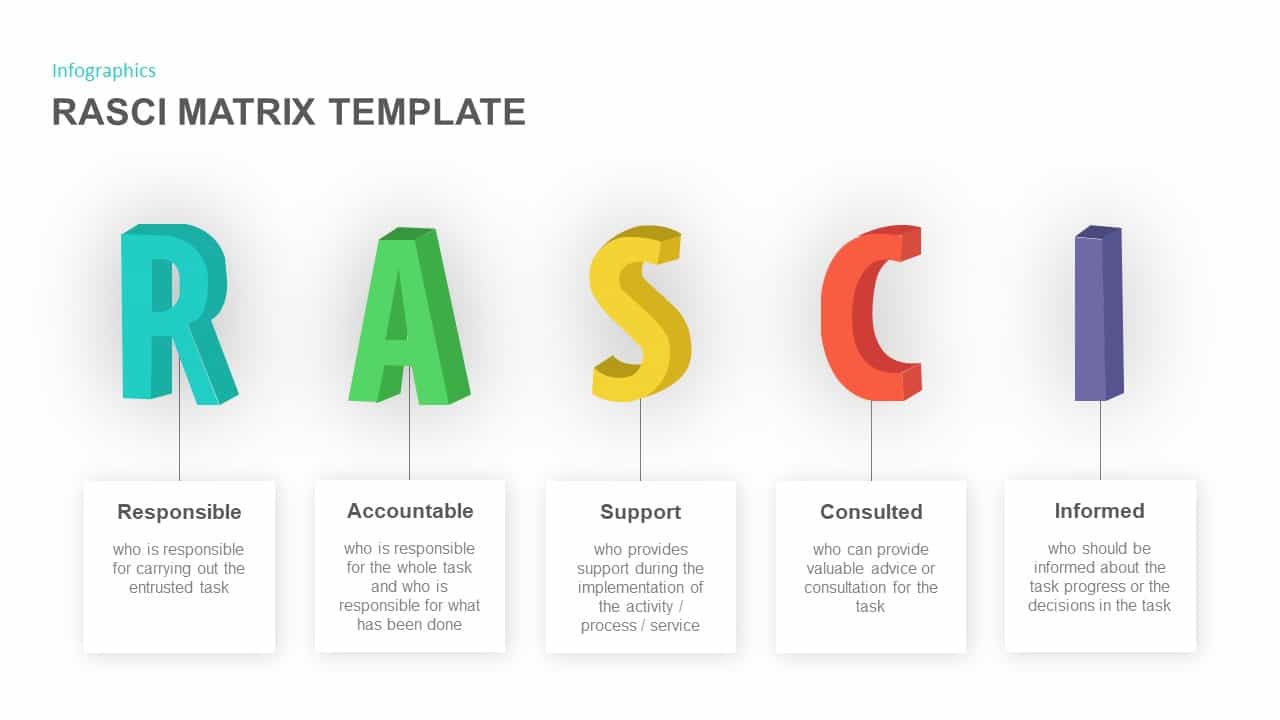
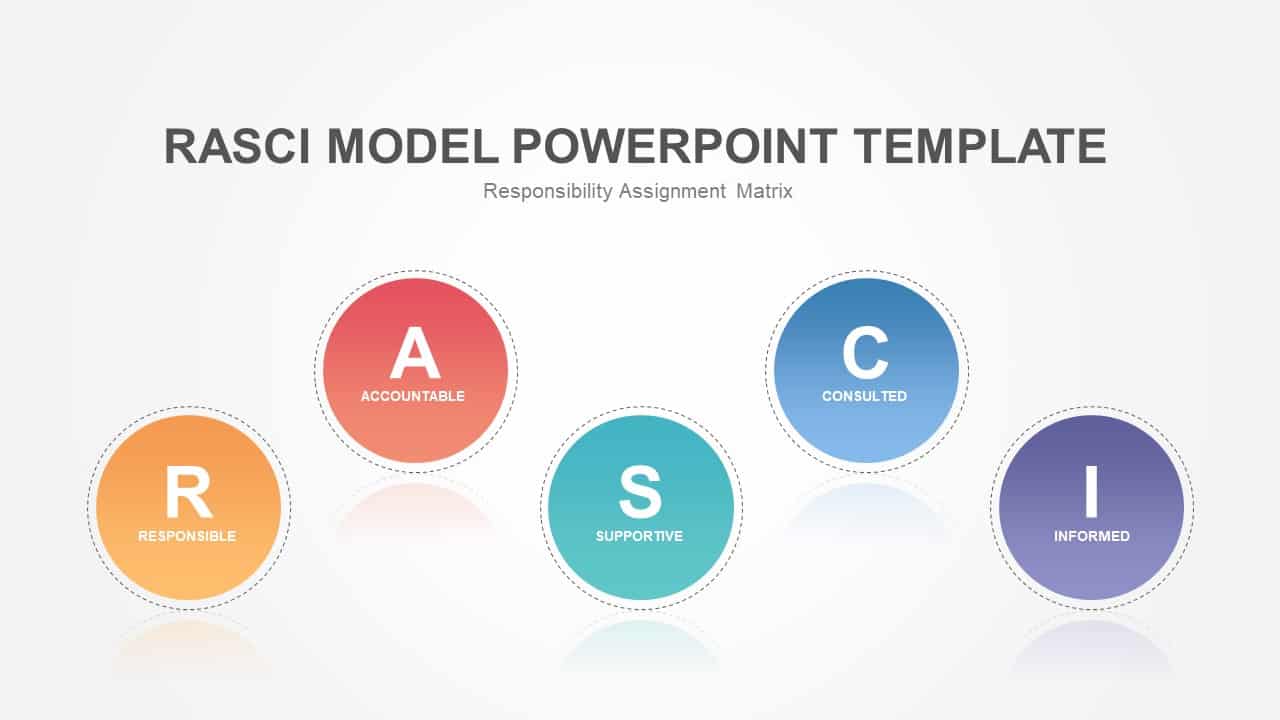
RASCI Assignment Matrix Infographic Template for PowerPoint & Google Slides
Infographics
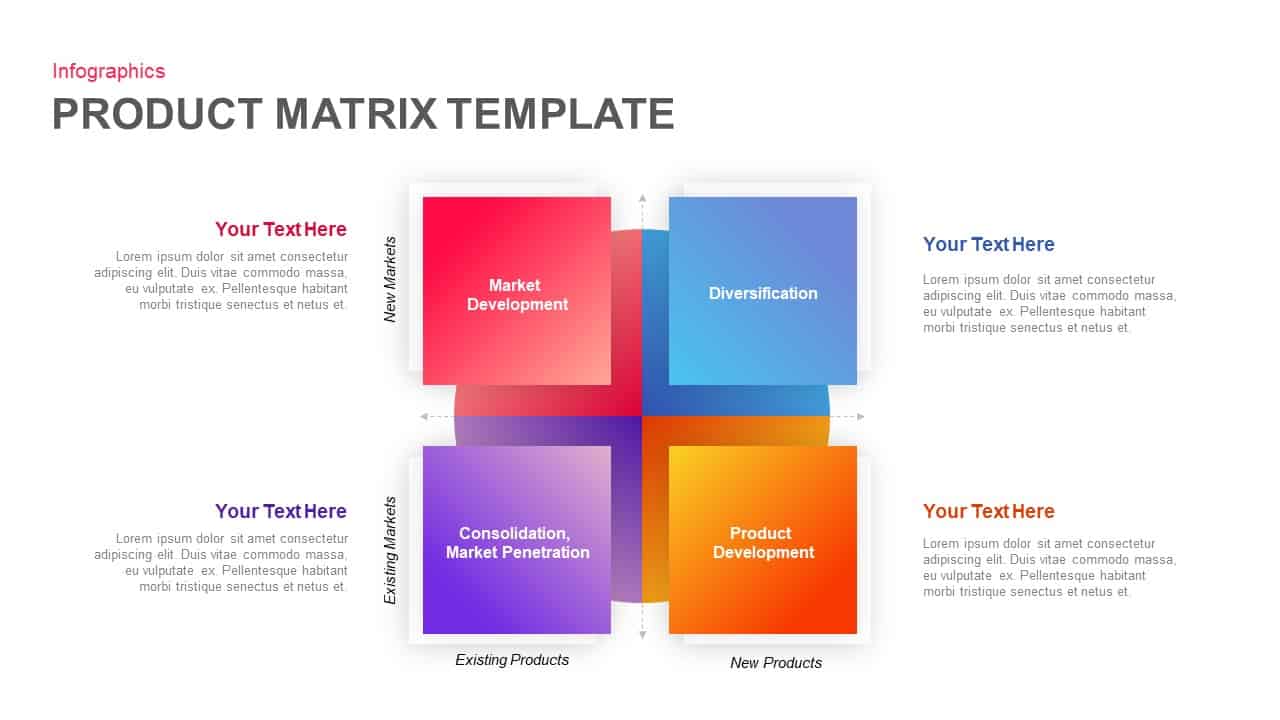
Product Market Expansion Matrix Template for PowerPoint & Google Slides
Business
RASCI Responsibility Matrix Chart Template for PowerPoint & Google Slides
Business

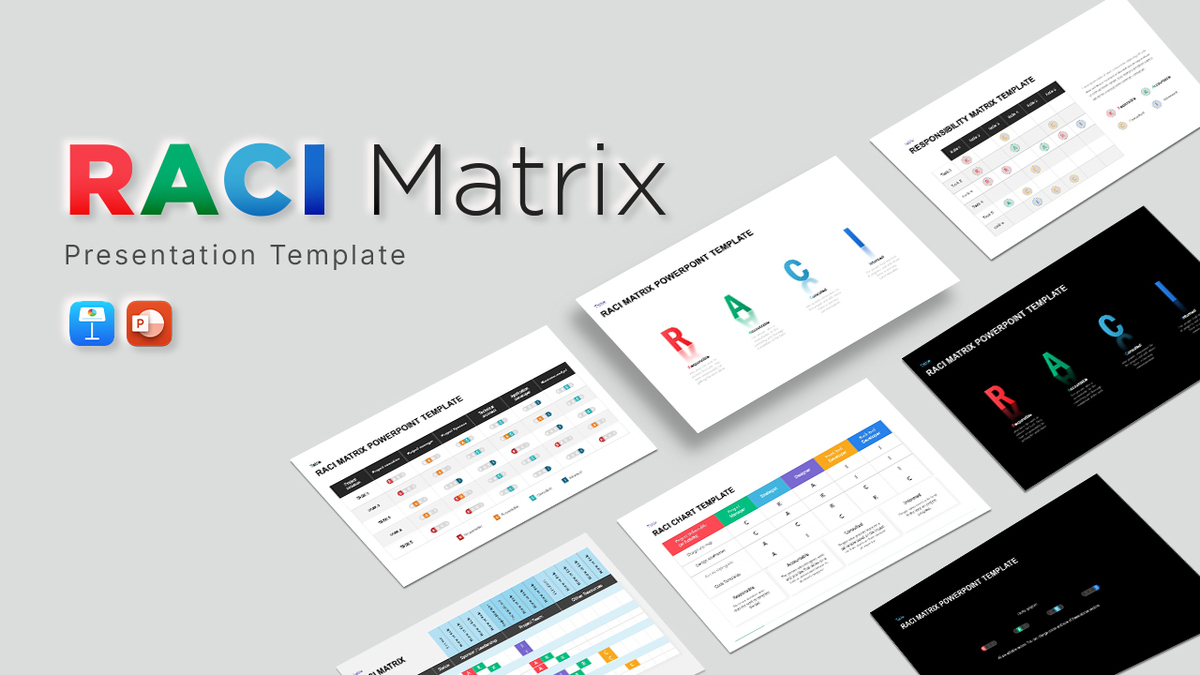
Interactive RACI Responsibility Matrix Template for PowerPoint & Google Slides
Project
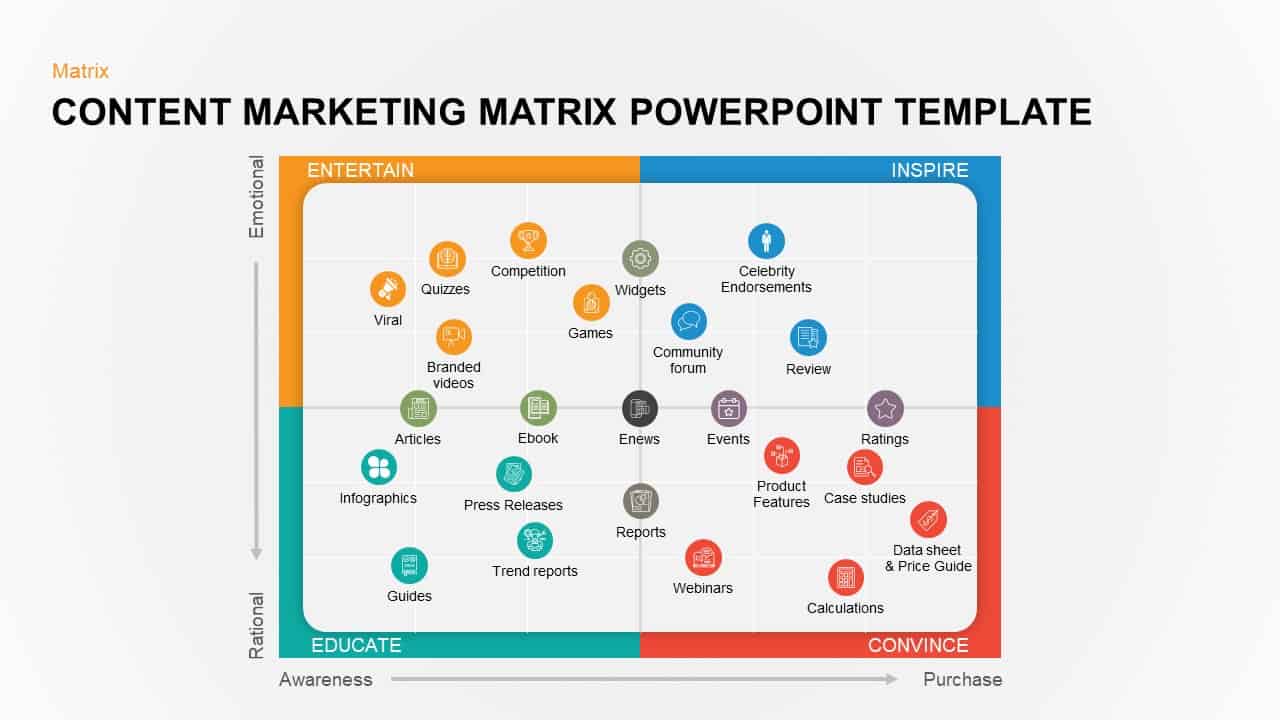
Colorful Content Marketing Matrix Template for PowerPoint & Google Slides
Comparison
Concentric Marketing Matrix Slide Template for PowerPoint & Google Slides
Circular
Three-Year Strategic Plan Matrix Template for PowerPoint & Google Slides
Timeline
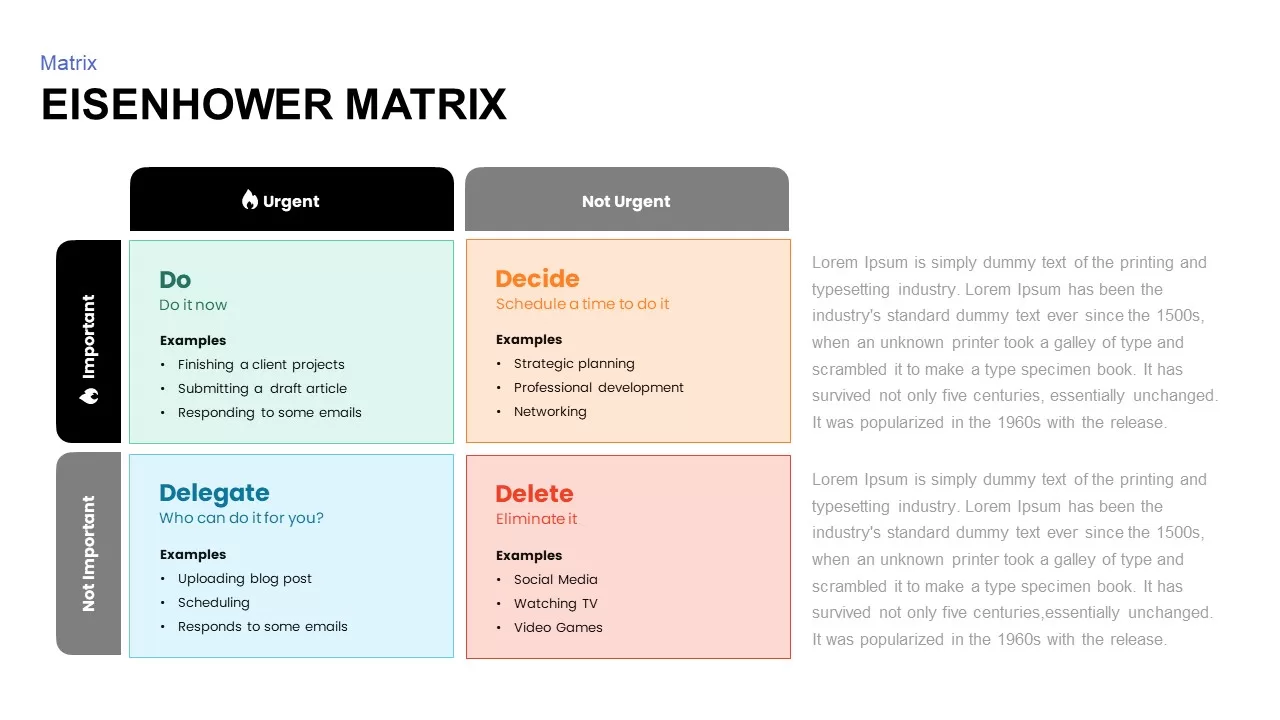
Eisenhower Matrix Task Prioritization Template for PowerPoint & Google Slides
Comparison Chart
RASCI Responsibility Assignment Matrix Template for PowerPoint & Google Slides
Project
Strategic ADL Matrix by Industry Life Cycle & Position Template for PowerPoint & Google Slides
Business Strategy
Ansoff Growth Matrix Strategy Diagram Template for PowerPoint & Google Slides
Business Strategy
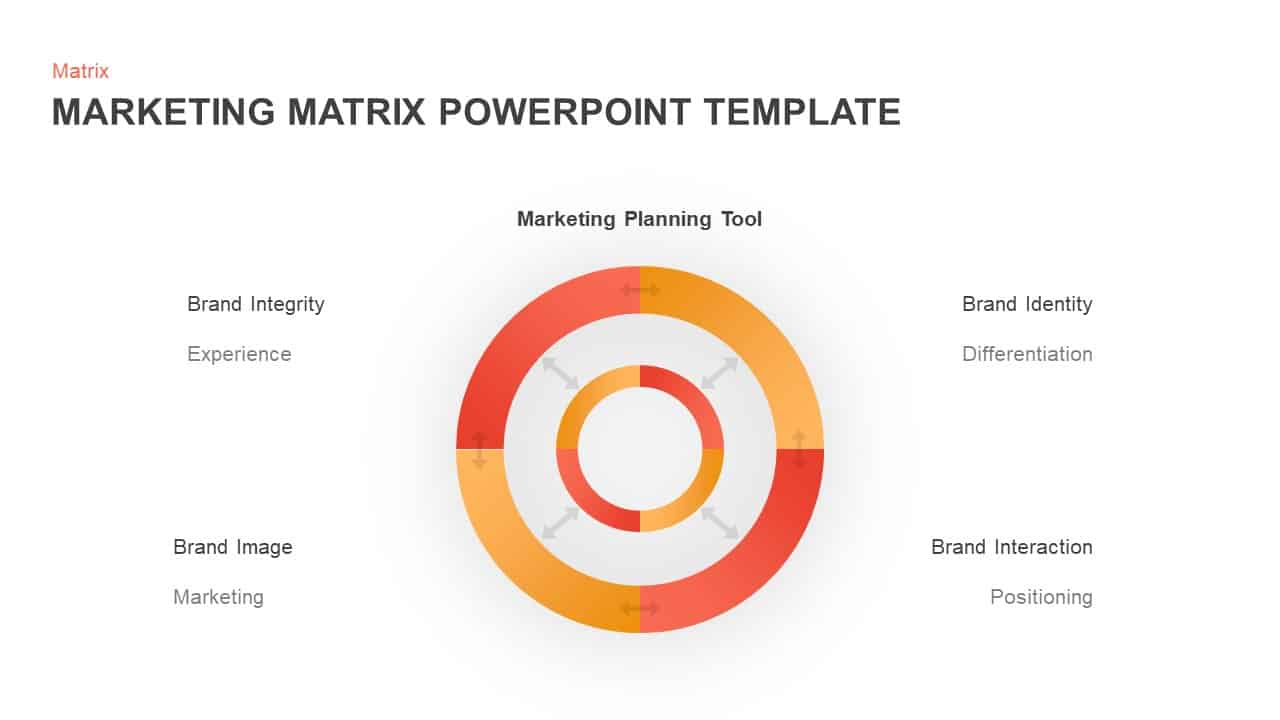
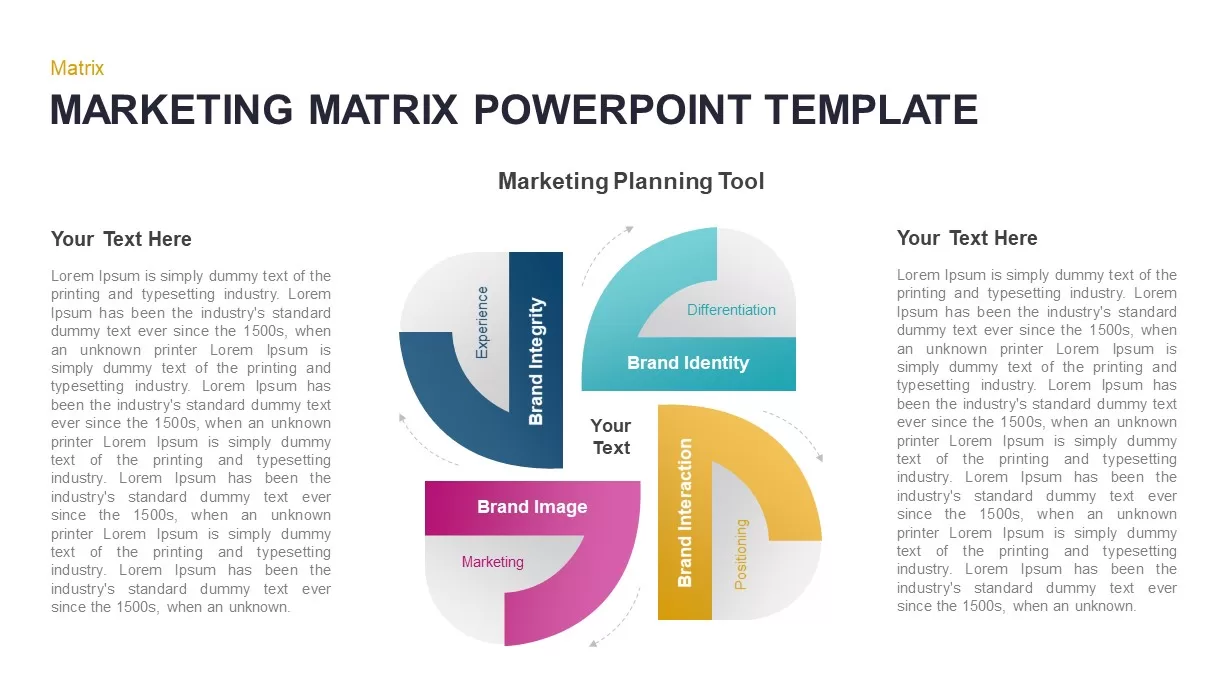
Marketing Matrix Brand Quadrant Diagram Template for PowerPoint & Google Slides
Process
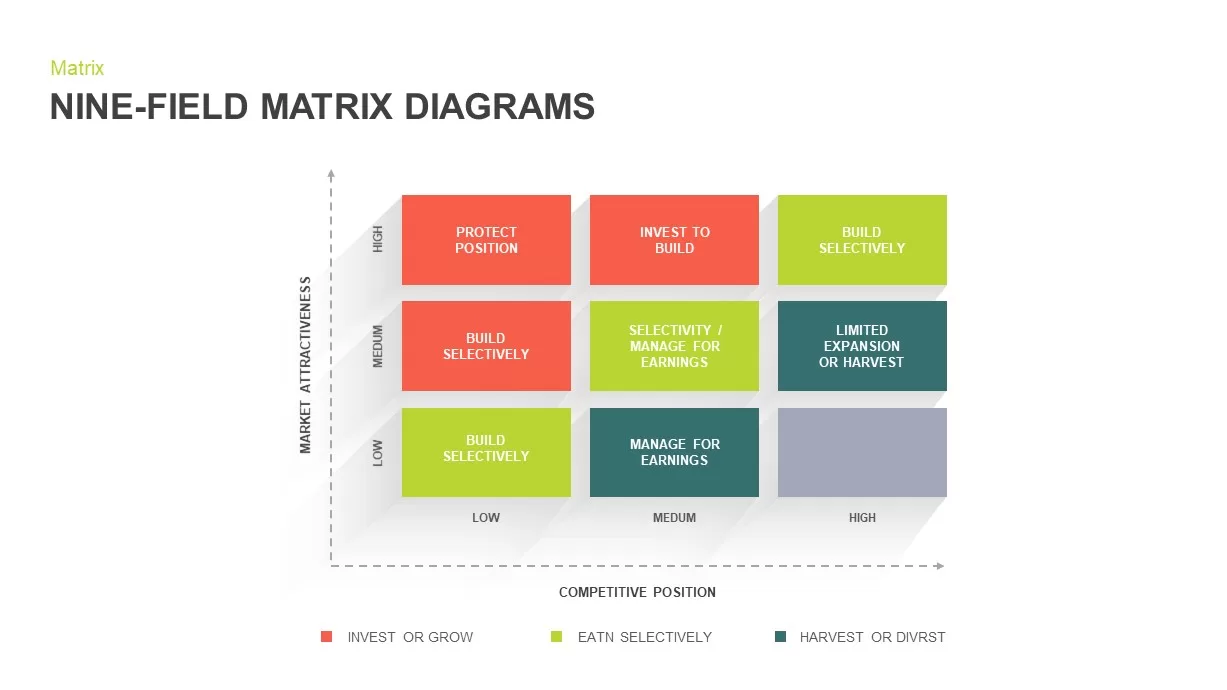
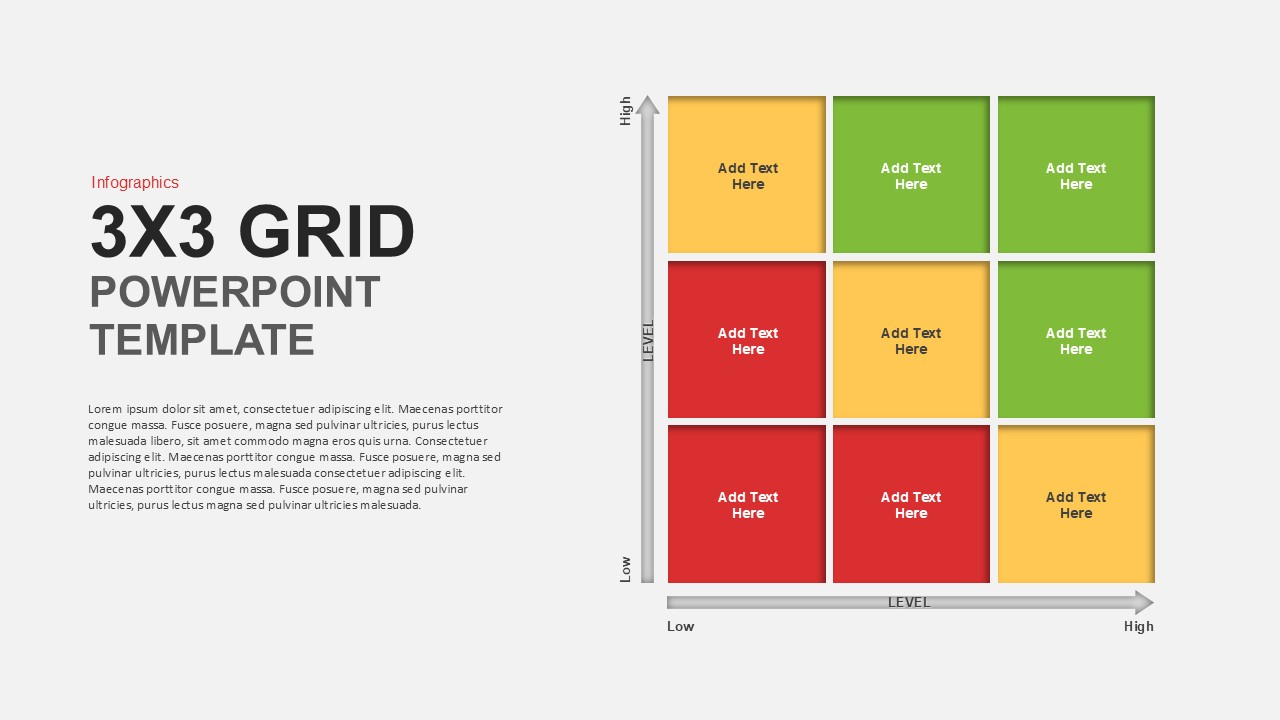
Nine-Field Matrix Diagrams Collection Template for PowerPoint & Google Slides
Comparison Chart
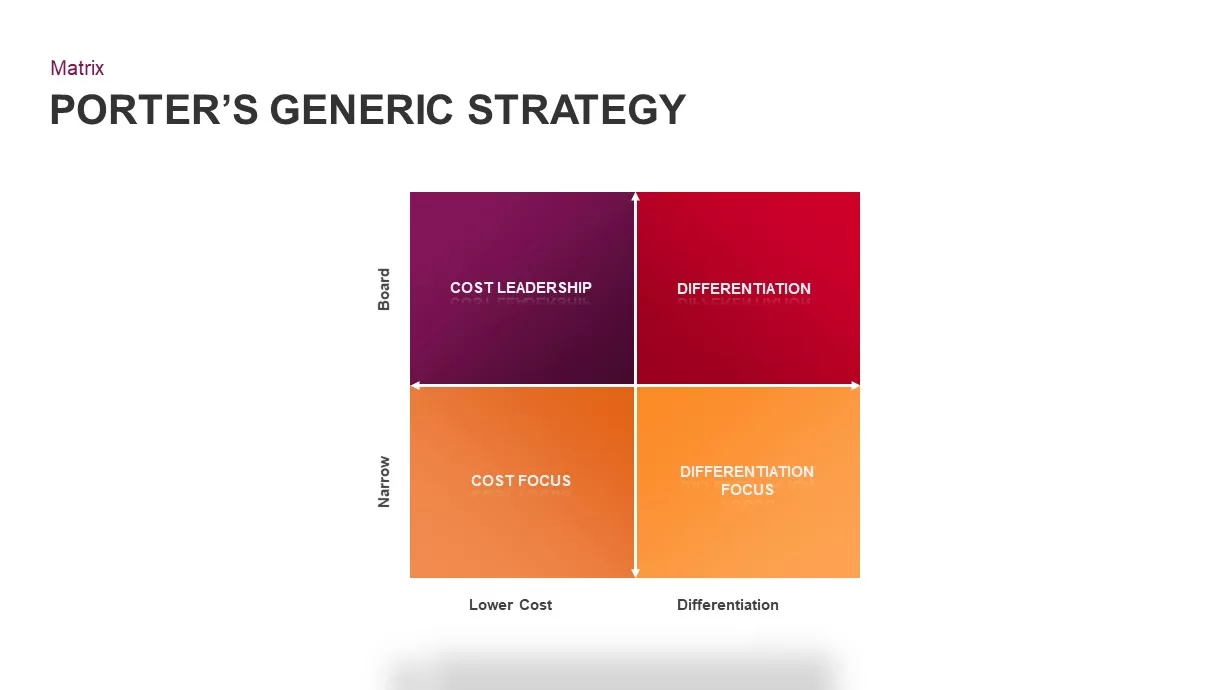
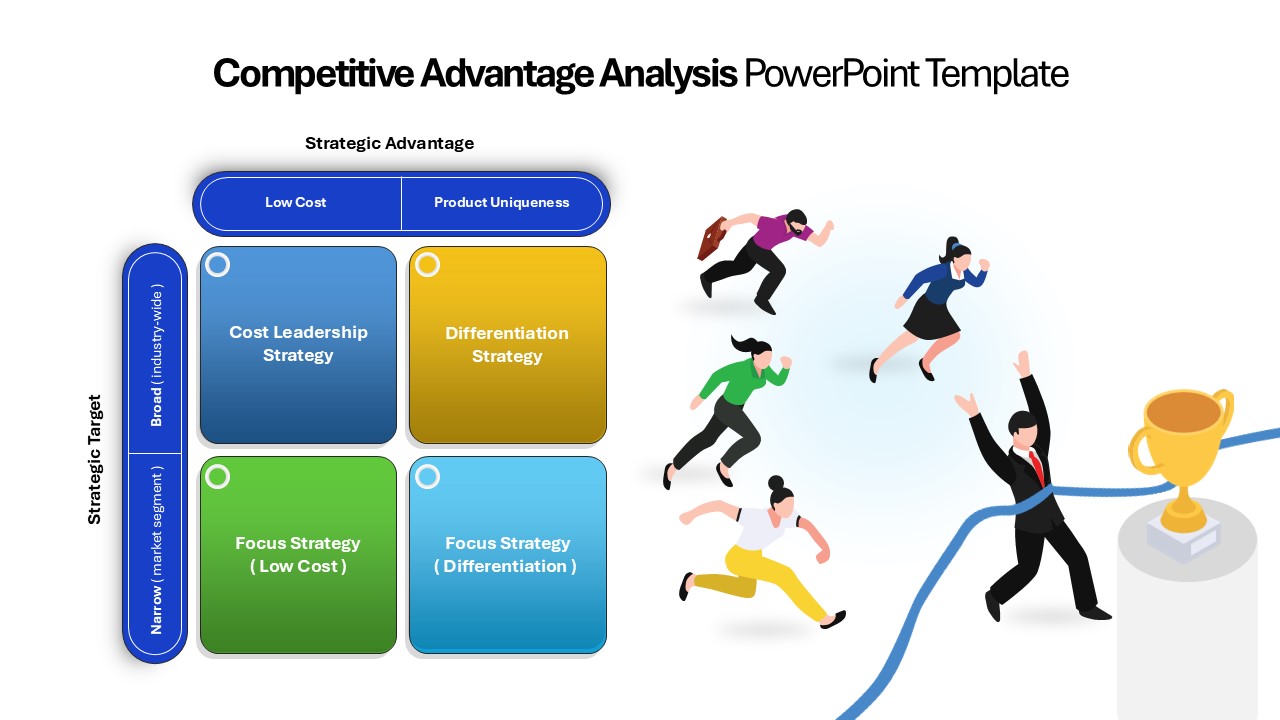
Porter’s Generic Strategy Matrix Diagram Template for PowerPoint & Google Slides
Competitor Analysis
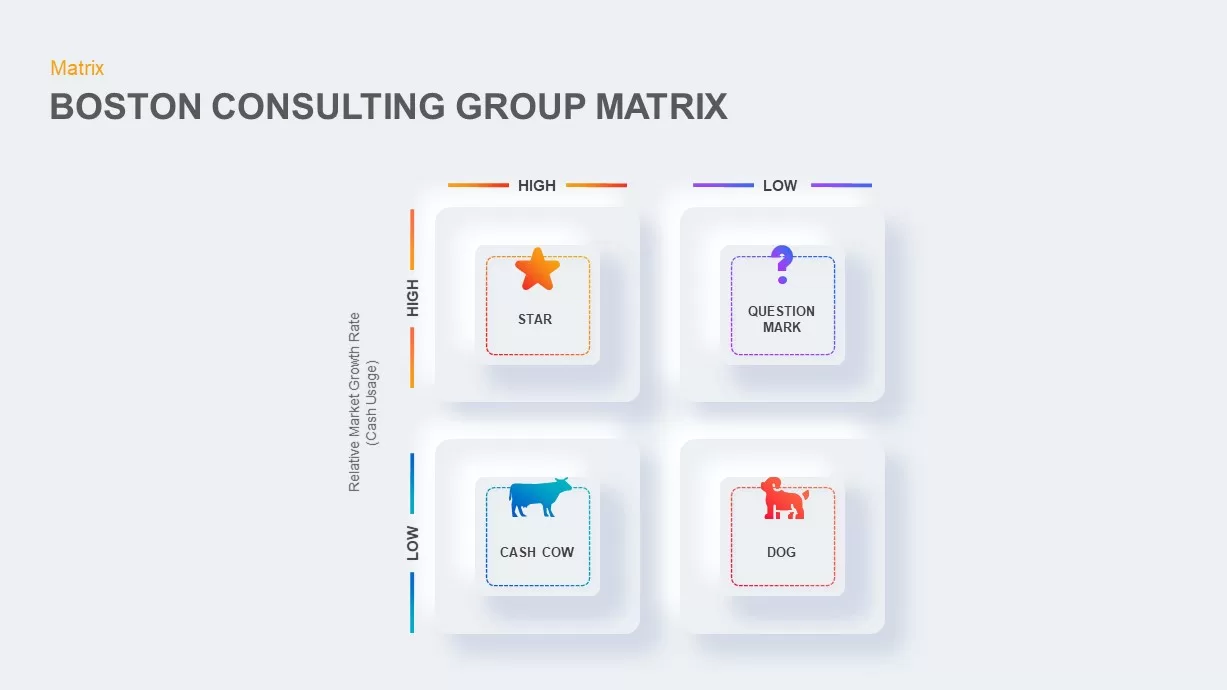
Boston Consulting Group Matrix Diagram Template for PowerPoint & Google Slides
BCG
Editable Four-Quadrant TOWS Matrix Template for PowerPoint & Google Slides
Opportunities Challenges
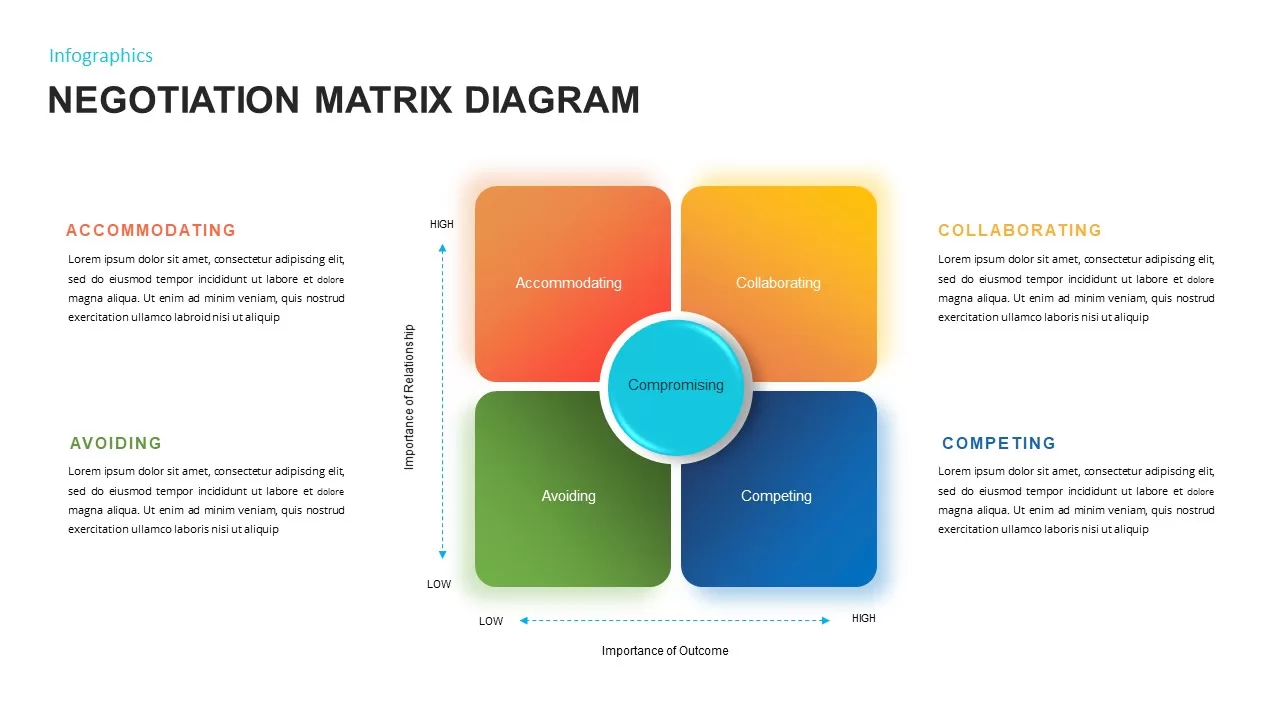
Negotiation Matrix Diagram Template for PowerPoint & Google Slides
Business
Eisenhower Matrix Decision-Making template for PowerPoint & Google Slides
Infographics
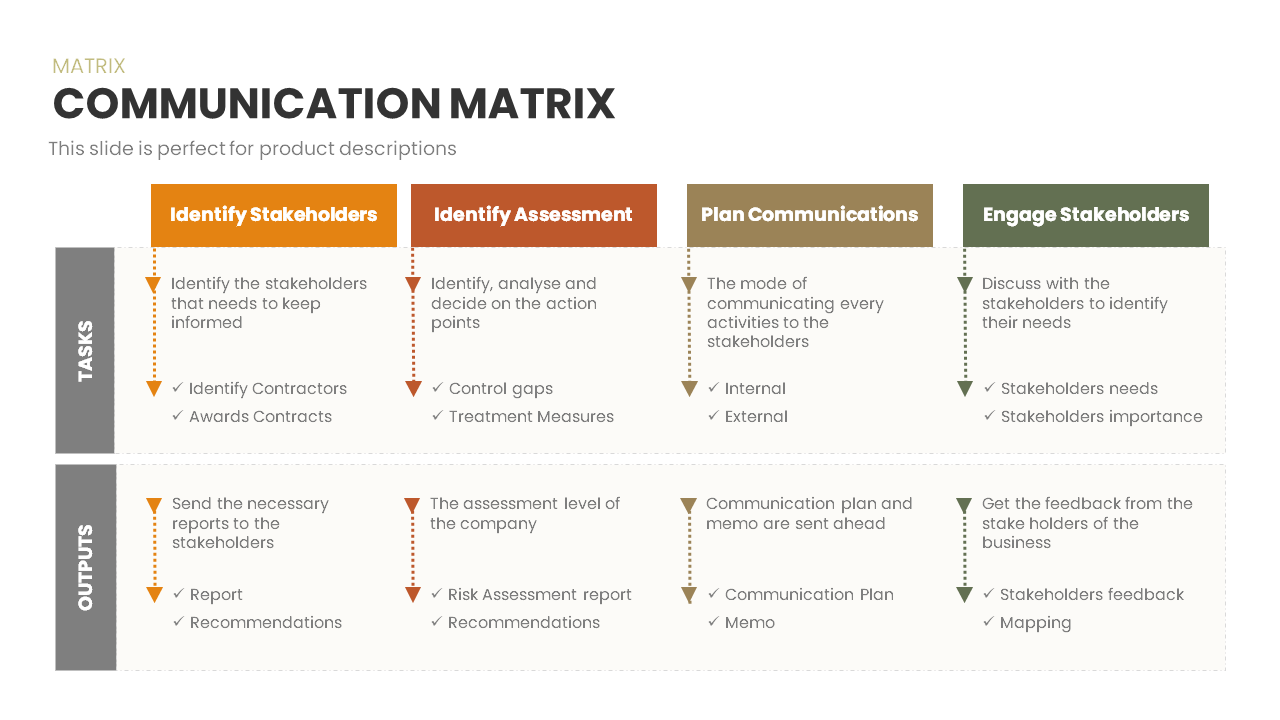
Communication Matrix Overview Template for PowerPoint & Google Slides
Business
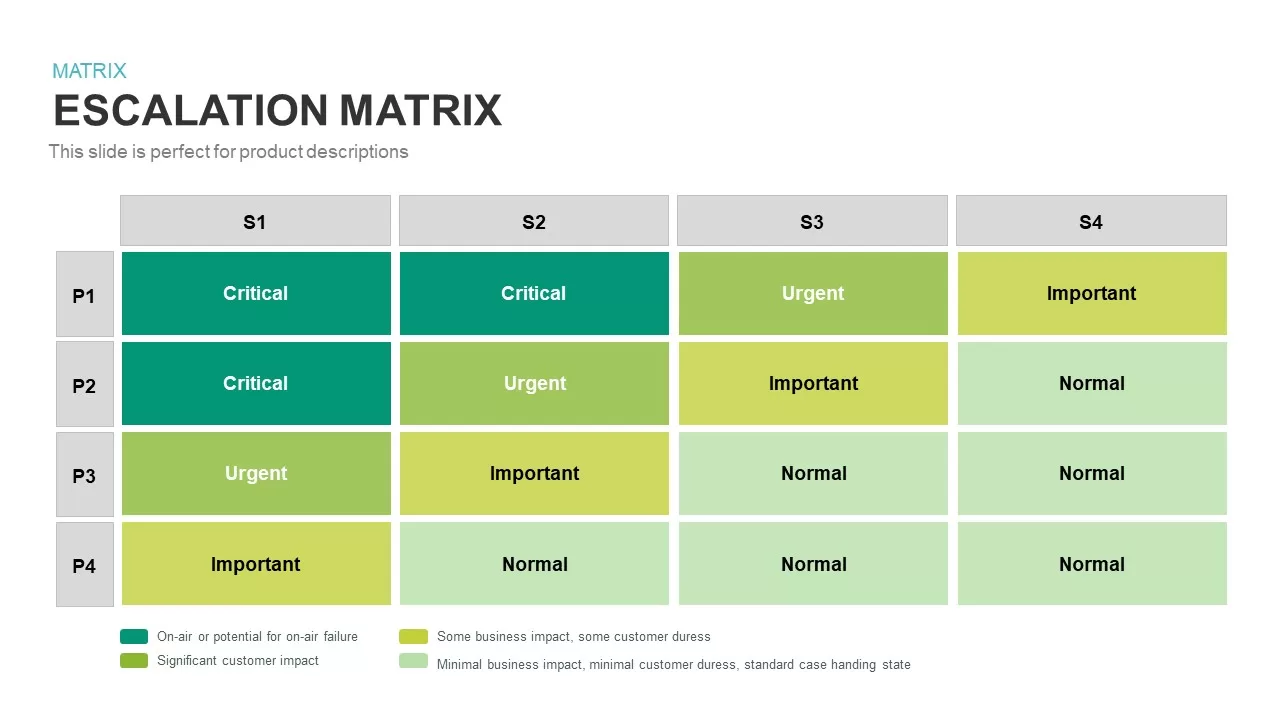
Escalation Matrix template for PowerPoint & Google Slides
Business
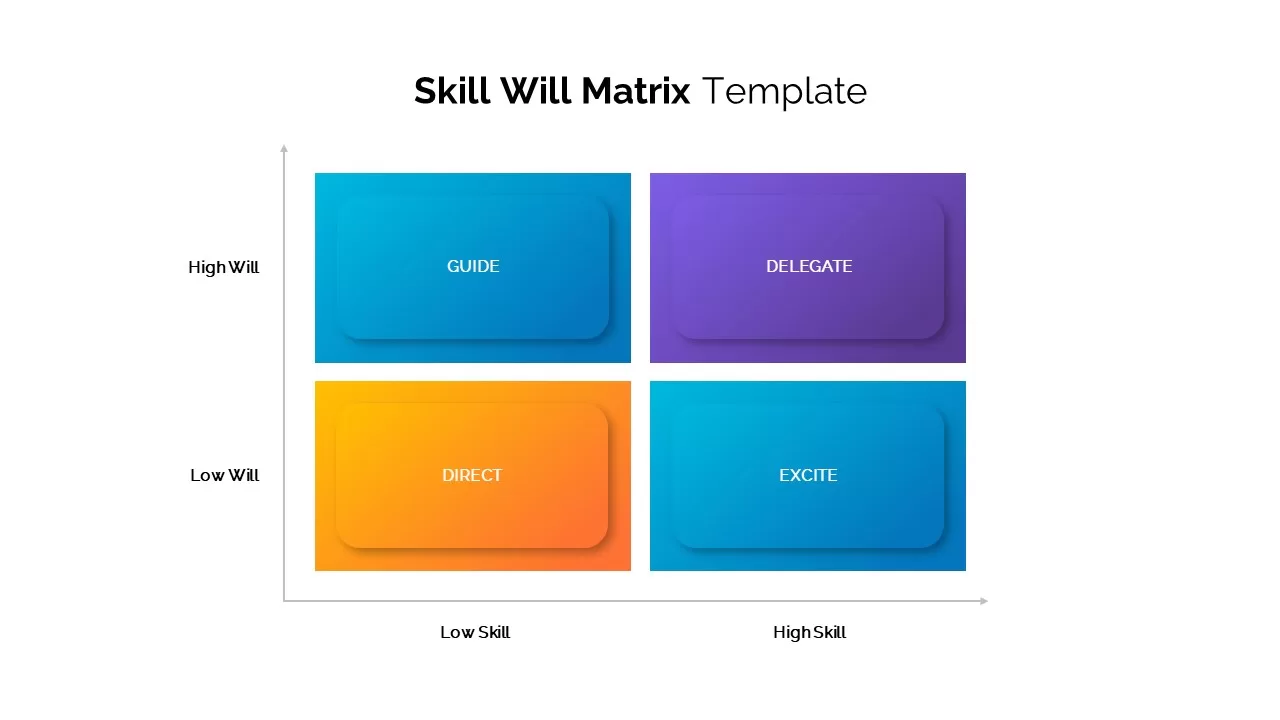
Skill Will Matrix Template for PowerPoint & Google Slides
Infographics
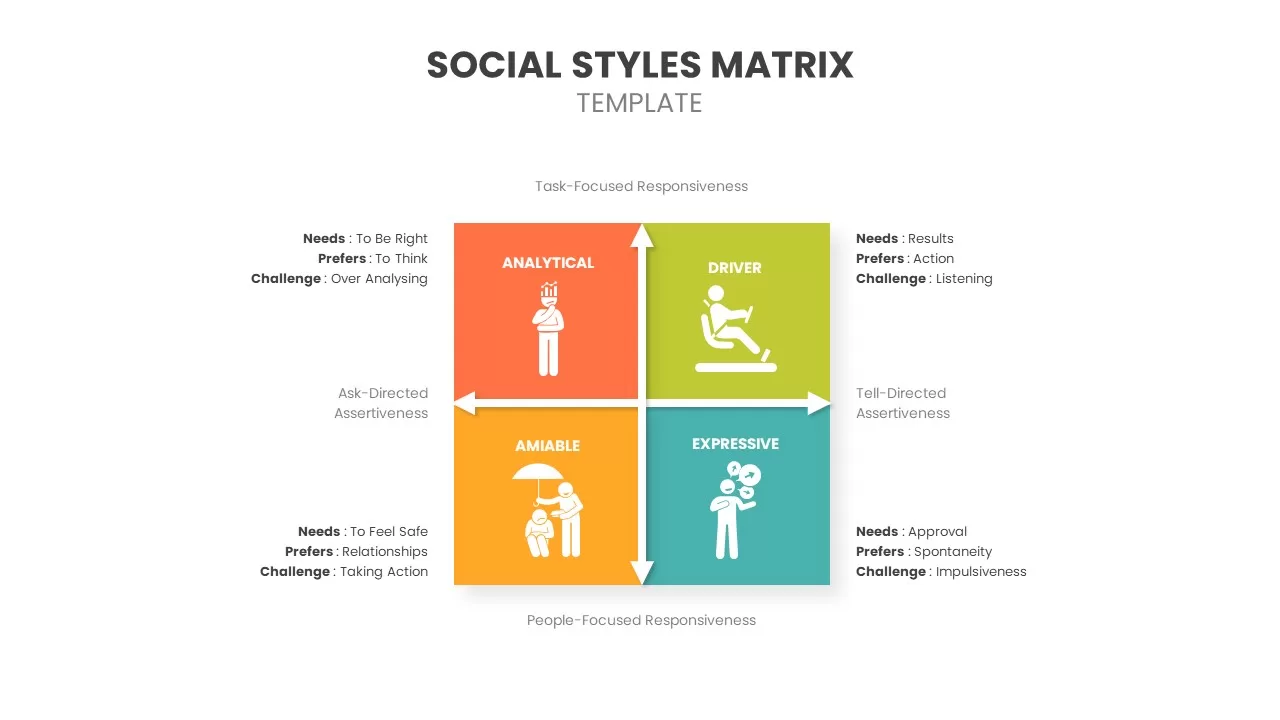
Social Styles Matrix Template for PowerPoint & Google Slides
Business
Pugh Matrix Decision Comparison Chart Template for PowerPoint & Google Slides
Comparison Chart
30 60 90 Day Plan Matrix Table Template for PowerPoint & Google Slides
Timeline
Executive 30-60-90 Day Plan Matrix Template for PowerPoint & Google Slides
Timeline
Executive 30-60-90 Day Plan Matrix Template for PowerPoint & Google Slides
Timeline
Competitive Landscape Matrix Template for PowerPoint & Google Slides
Comparison
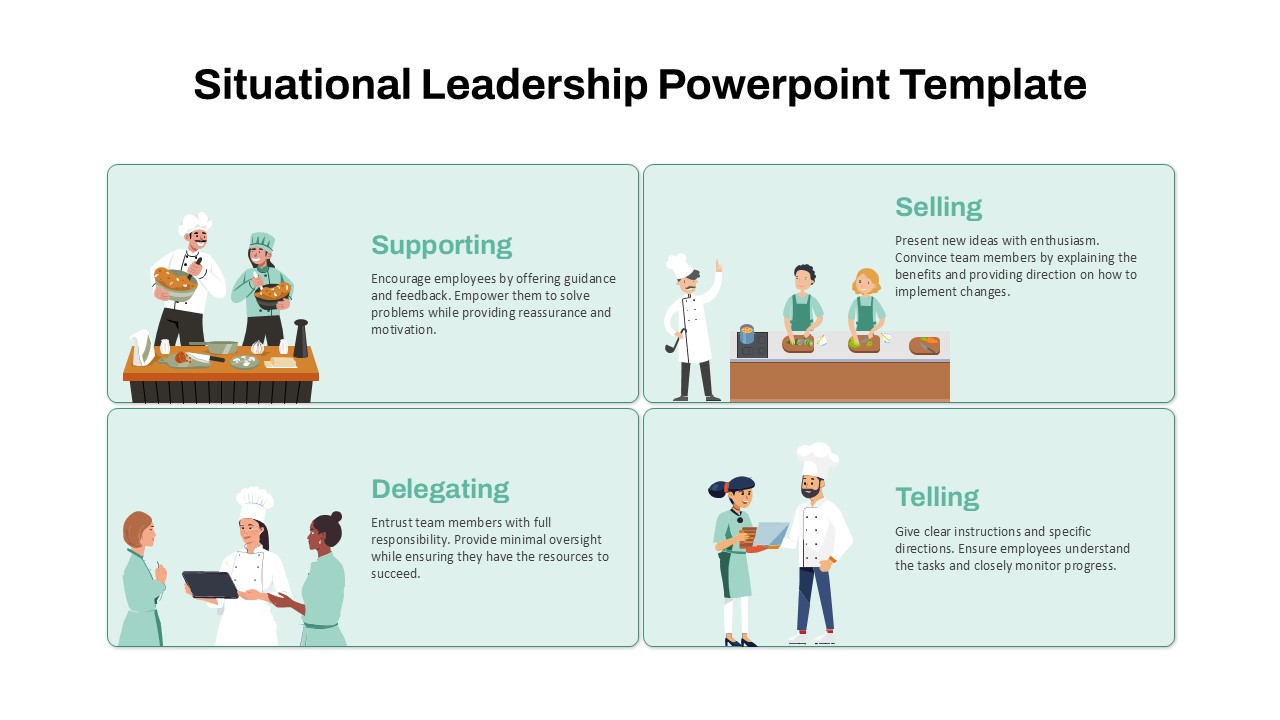
Situational Leadership Matrix Template for PowerPoint & Google Slides
Process
9-Box Matrix for Performance & Potential Template for PowerPoint & Google Slides
Employee Performance
Professional Interactive Heat Map Matrix Template for PowerPoint & Google Slides
Comparison Chart
Heat Map Risk Matrix Dashboard Template for PowerPoint & Google Slides
Comparison Chart
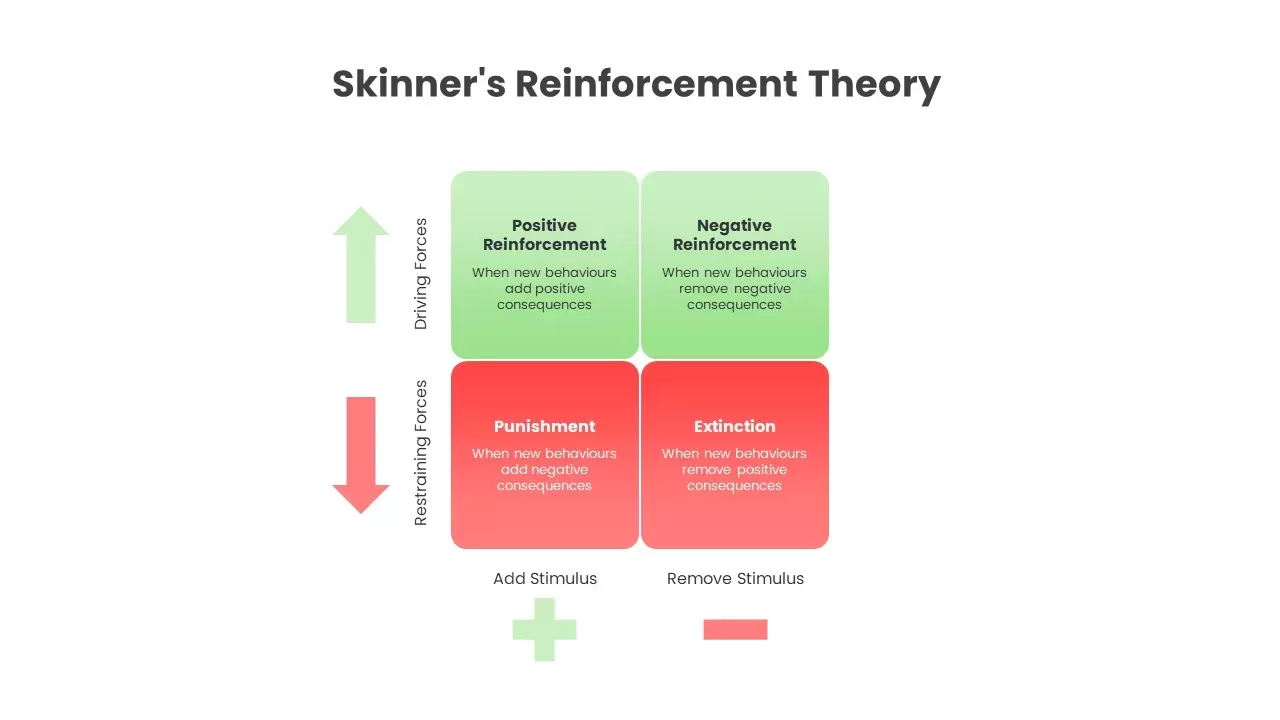
Skinner’s Reinforcement Theory Matrix Template for PowerPoint & Google Slides
Comparison
Risk Assessment Heatmap Matrix Slide Template for PowerPoint & Google Slides
Comparison Chart
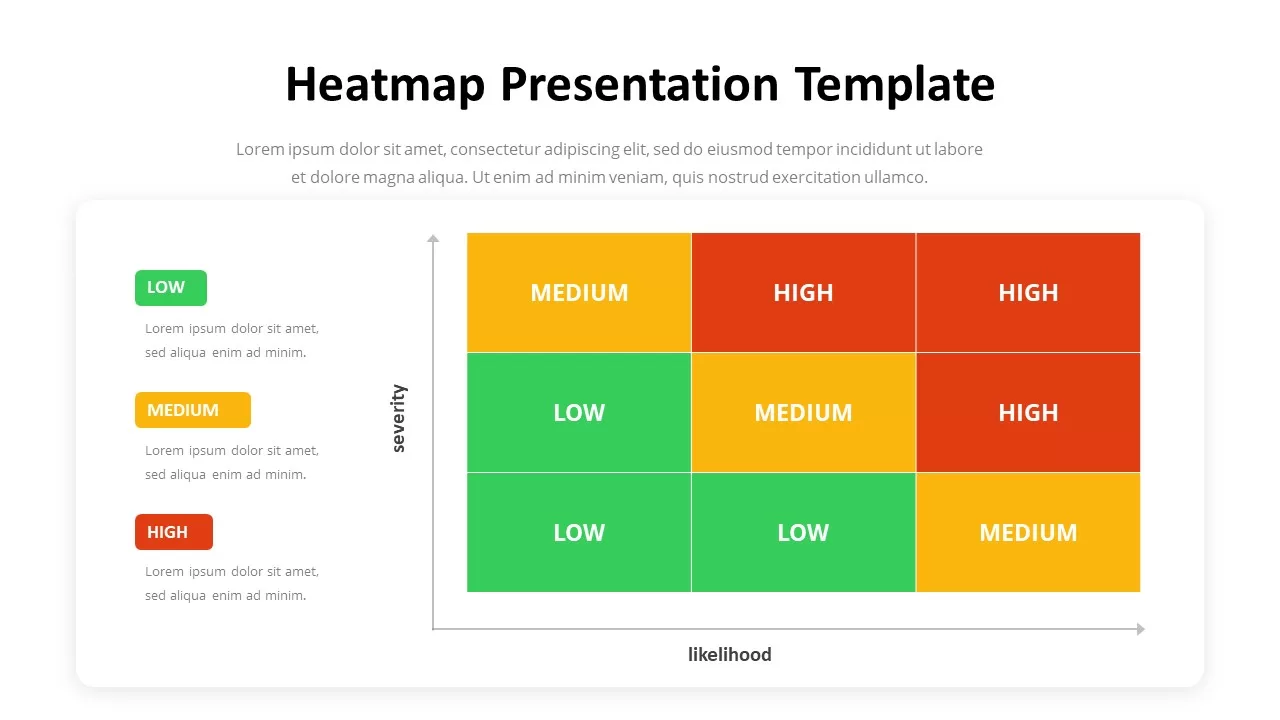
Heatmap Matrix Template for PowerPoint & Google Slides
Maps
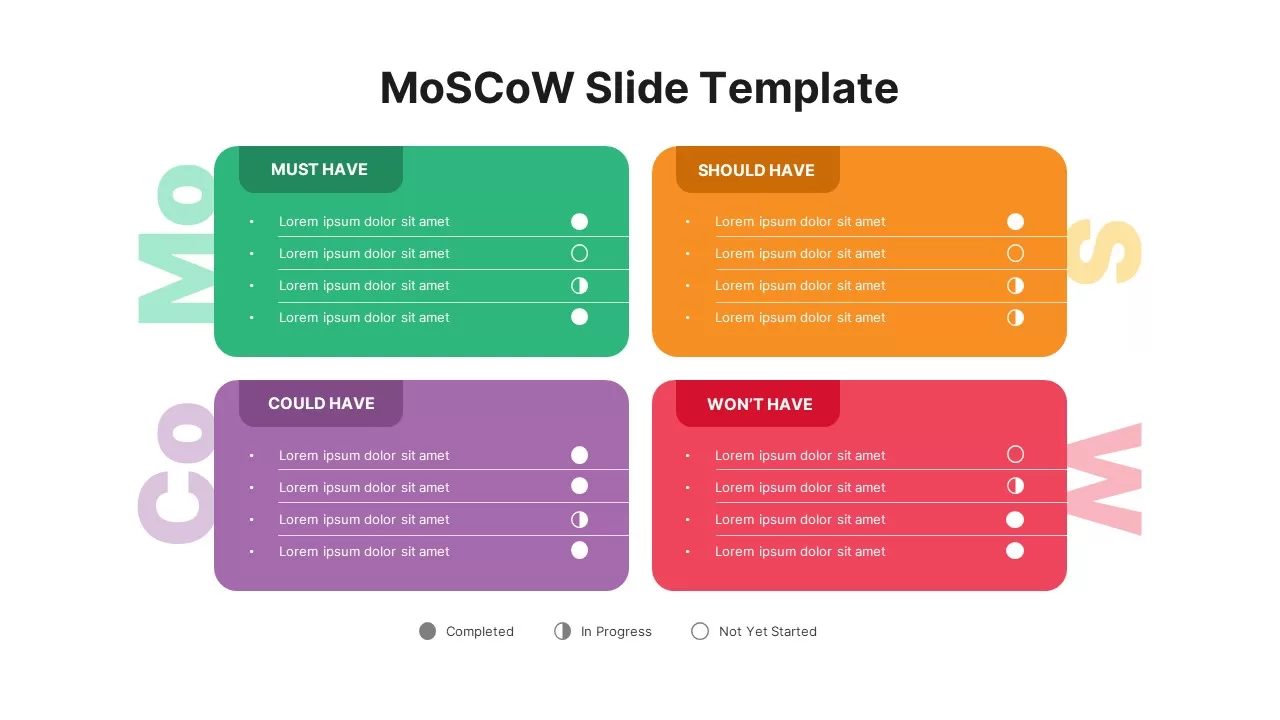
MoSCoW Prioritization Matrix Slide Template for PowerPoint & Google Slides
Business Strategy
Vendor Comparison Matrix with High-Level Requirements template for PowerPoint & Google Slides
Comparison Chart
MABA Attractiveness Matrix Chart Template for PowerPoint & Google Slides
Comparison Chart
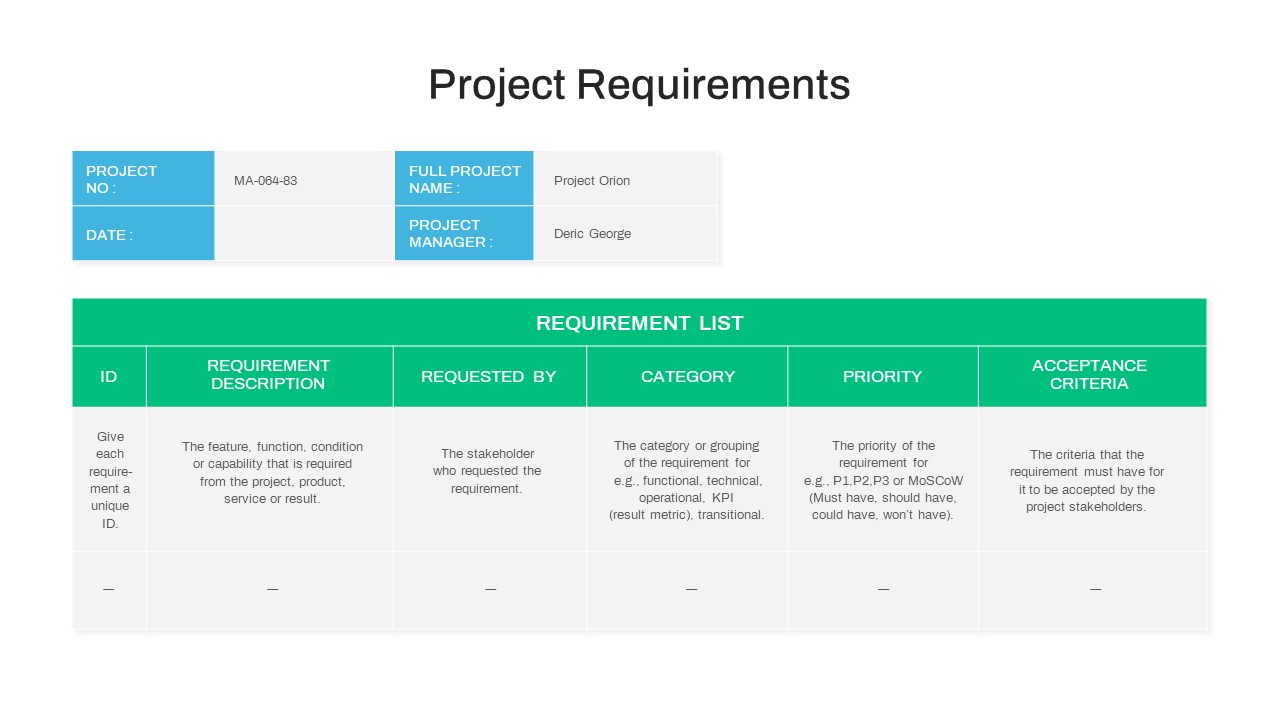
Project Requirements Matrix Template for PowerPoint & Google Slides
Project
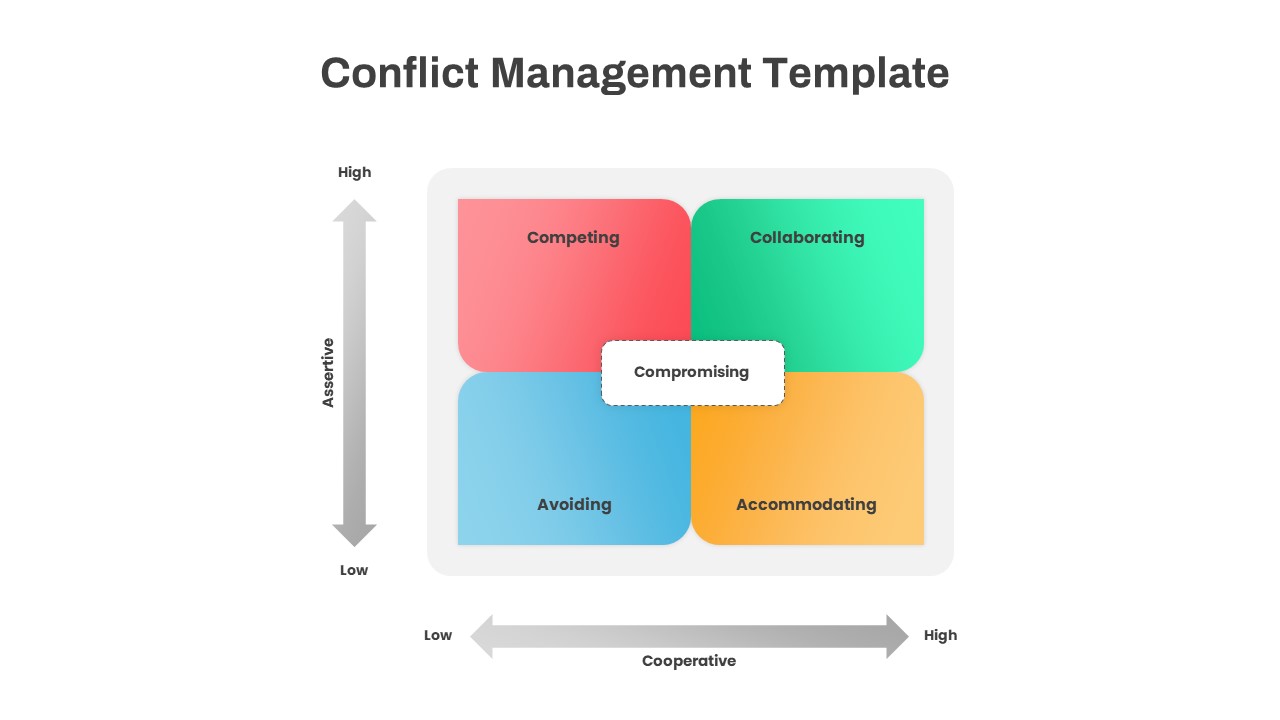
Conflict Management Matrix Template for PowerPoint & Google Slides
Leadership
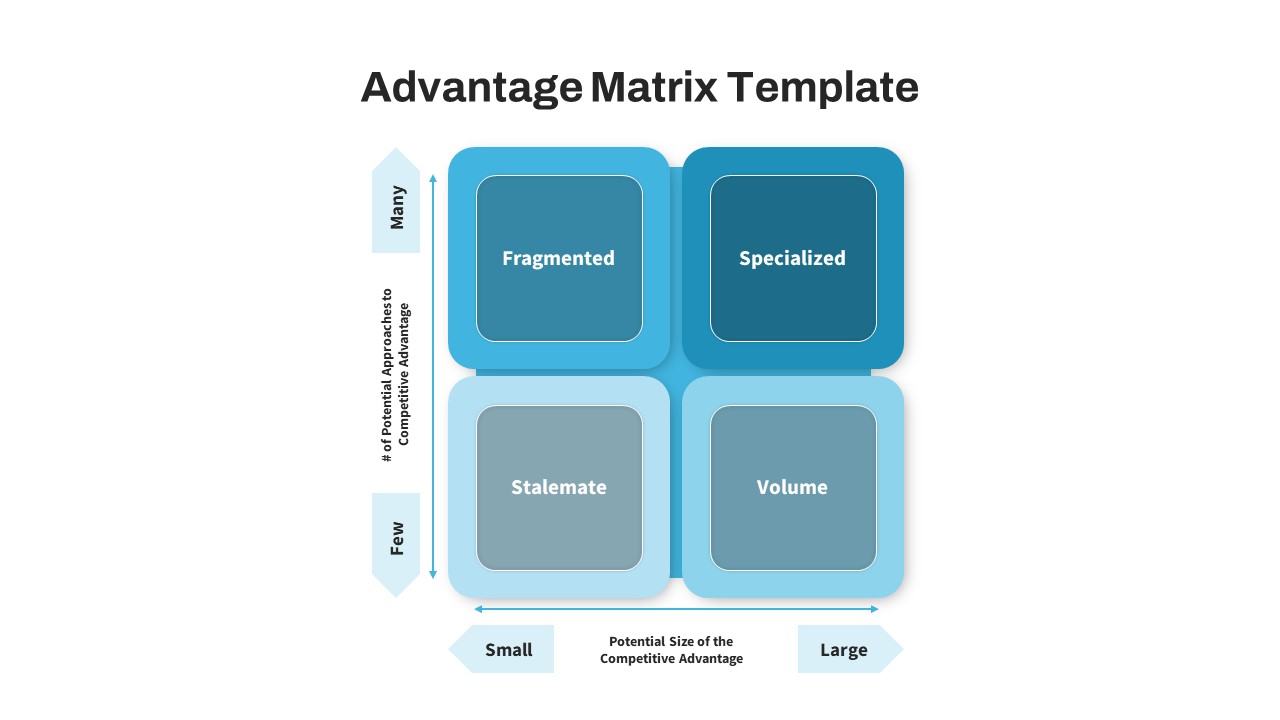
Advantage Matrix 2×2 Framework Template for PowerPoint & Google Slides
Competitor Analysis
Bubble Chart Scatter, Diagram & Matrix Template for PowerPoint & Google Slides
Comparison Chart
Business Growth Strategies Matrix Template for PowerPoint & Google Slides
Comparison
Free Competitor Analysis Matrix Template for PowerPoint & Google Slides
Competitor Analysis
Free
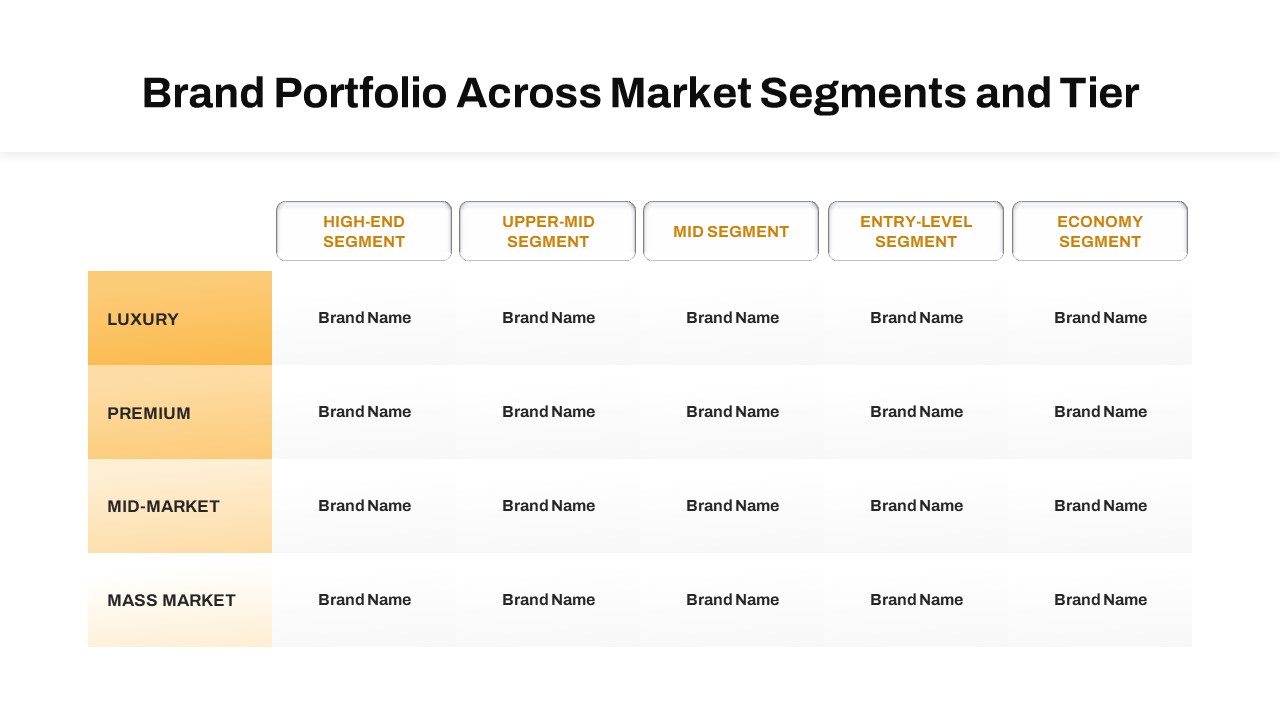
Brand Portfolio Matrix: Segments & Tiers Template for PowerPoint & Google Slides
Business Report
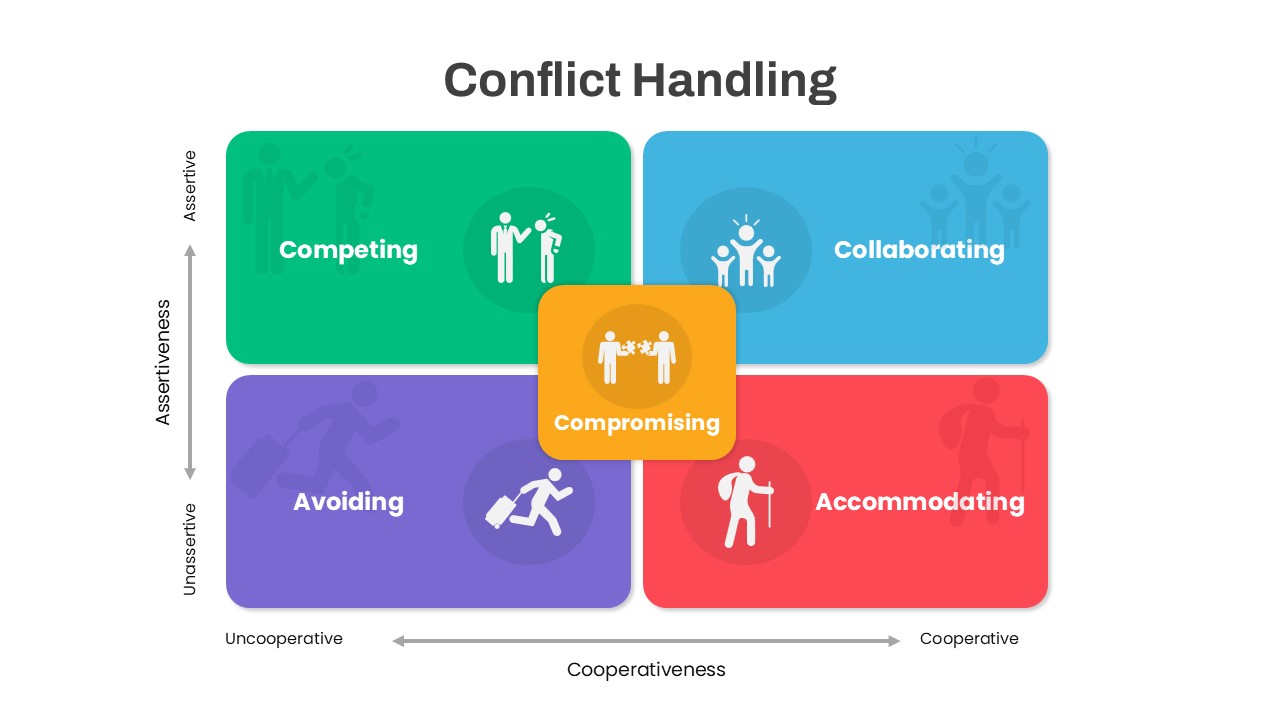
Colorful Conflict Handling Matrix Template for PowerPoint & Google Slides
Comparison
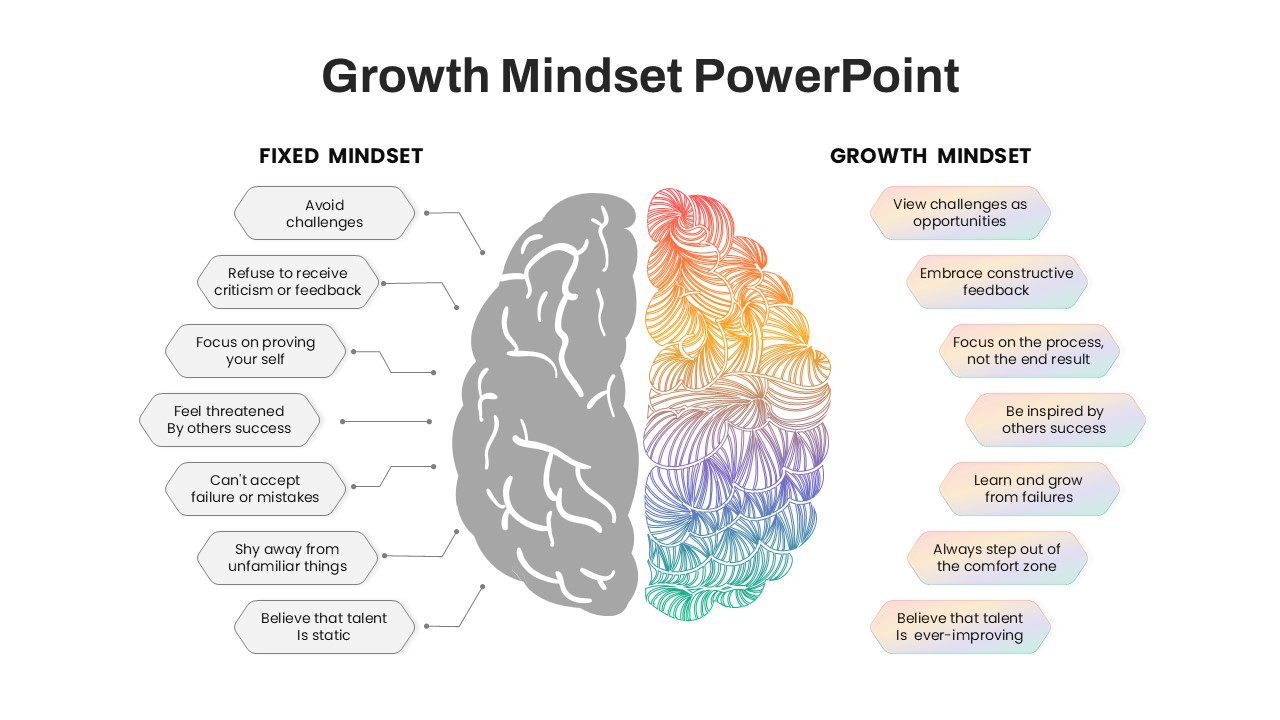
Fixed vs Growth Mindset Matrix Template for PowerPoint & Google Slides
Comparison
Decision Matrix & Prioritization Chart Template for PowerPoint & Google Slides
Comparison Chart
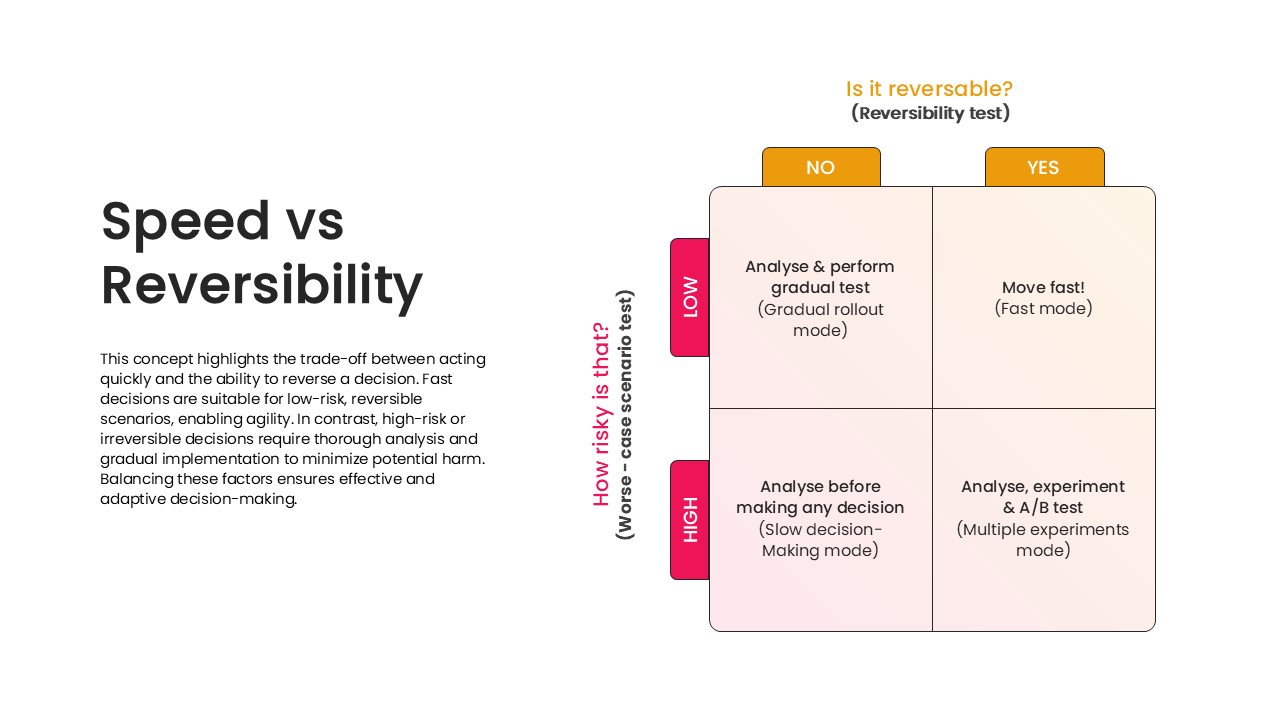
Speed vs Reversibility Decision Matrix Template for PowerPoint & Google Slides
Comparison
Ansoff Growth Matrix Professional Template for PowerPoint & Google Slides
Comparison
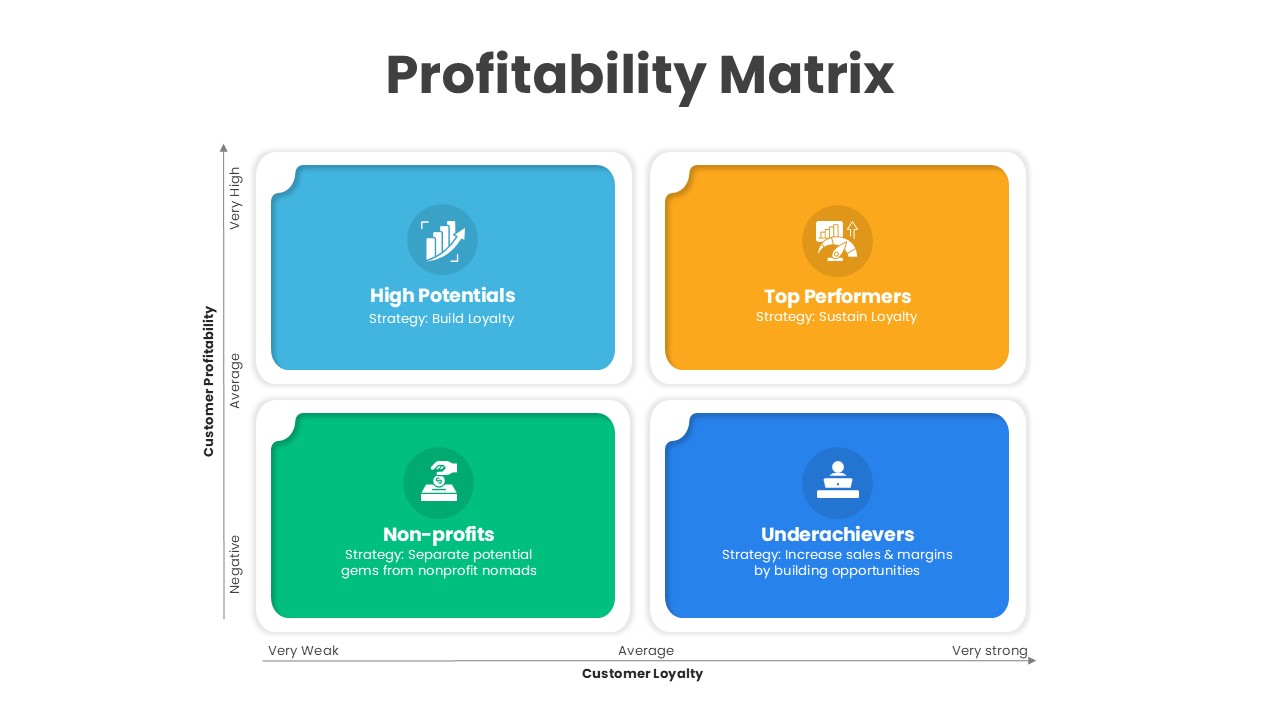
Customer Loyalty & Profitability Matrix Template for PowerPoint & Google Slides
Comparison
Matrix Grid Diagram Template for PowerPoint & Google Slides
Comparison
Porter’s Generic Strategies Matrix Template for PowerPoint & Google Slides
Business Strategy
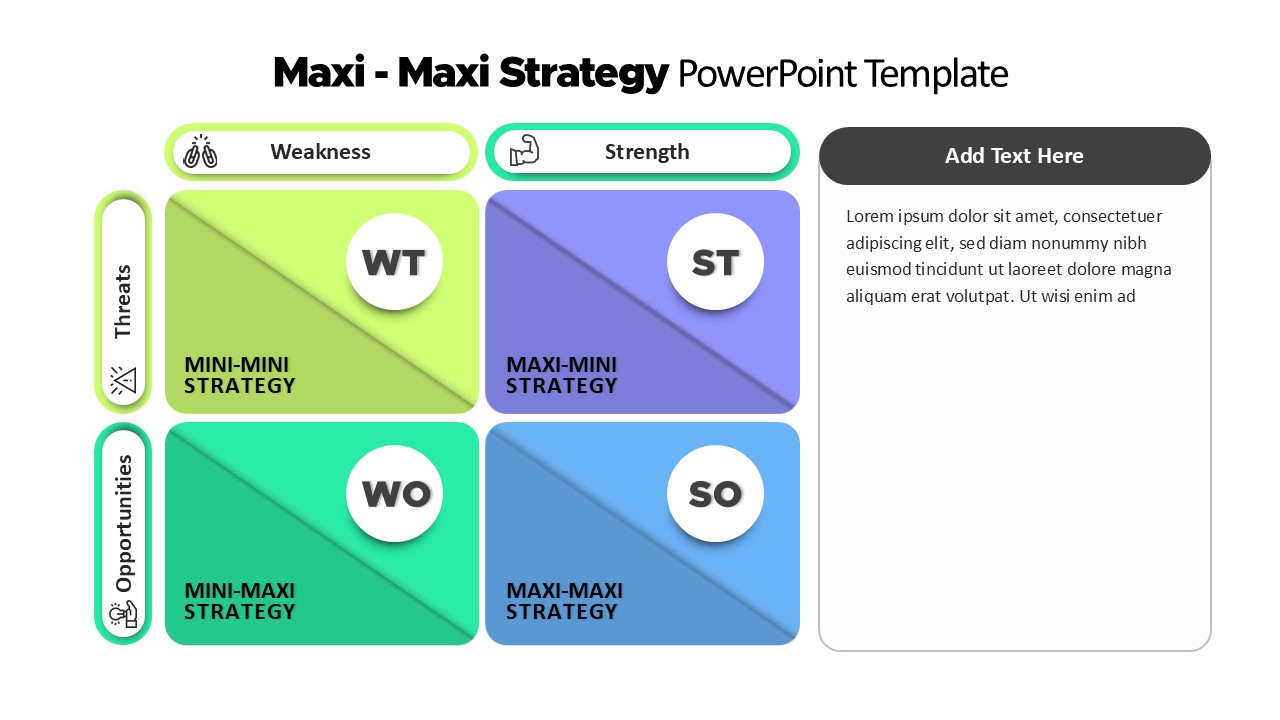
Maxi-Maxi Strategy Matrix SWOT Diagram Template for PowerPoint & Google Slides
SWOT
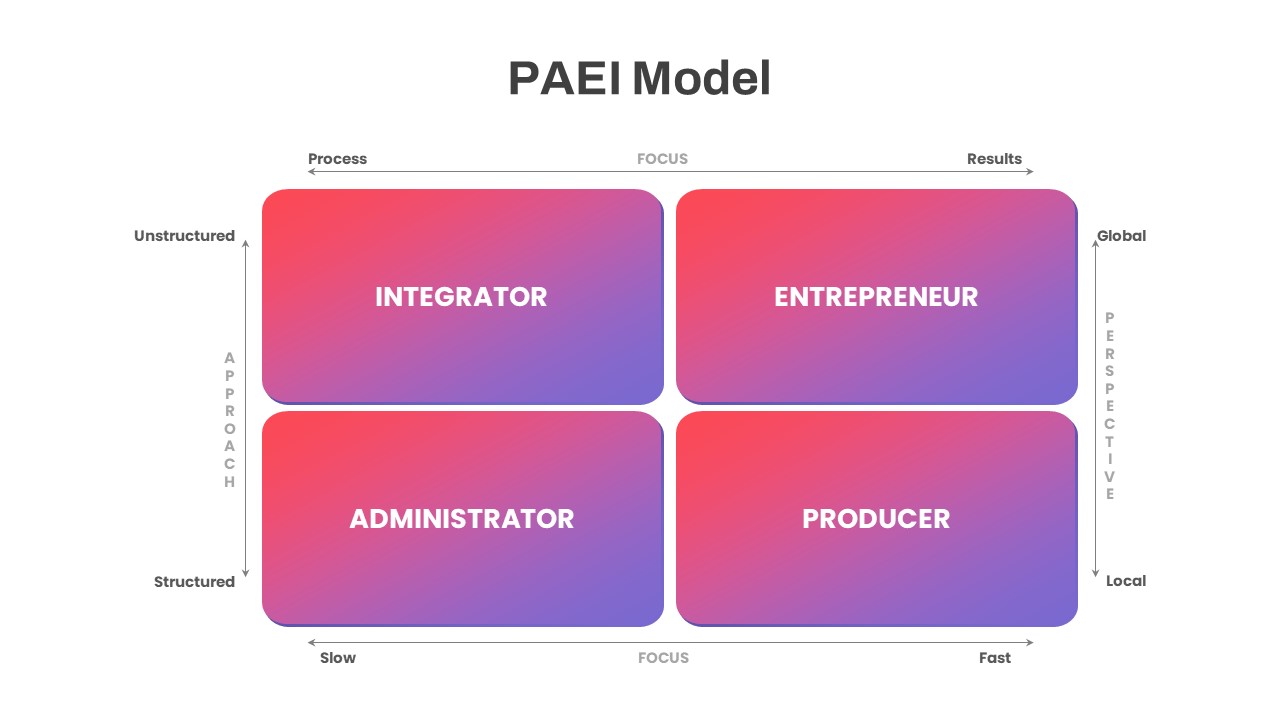
PAEI Leadership Roles 2×2 Matrix Diagram Template for PowerPoint & Google Slides
Business Models
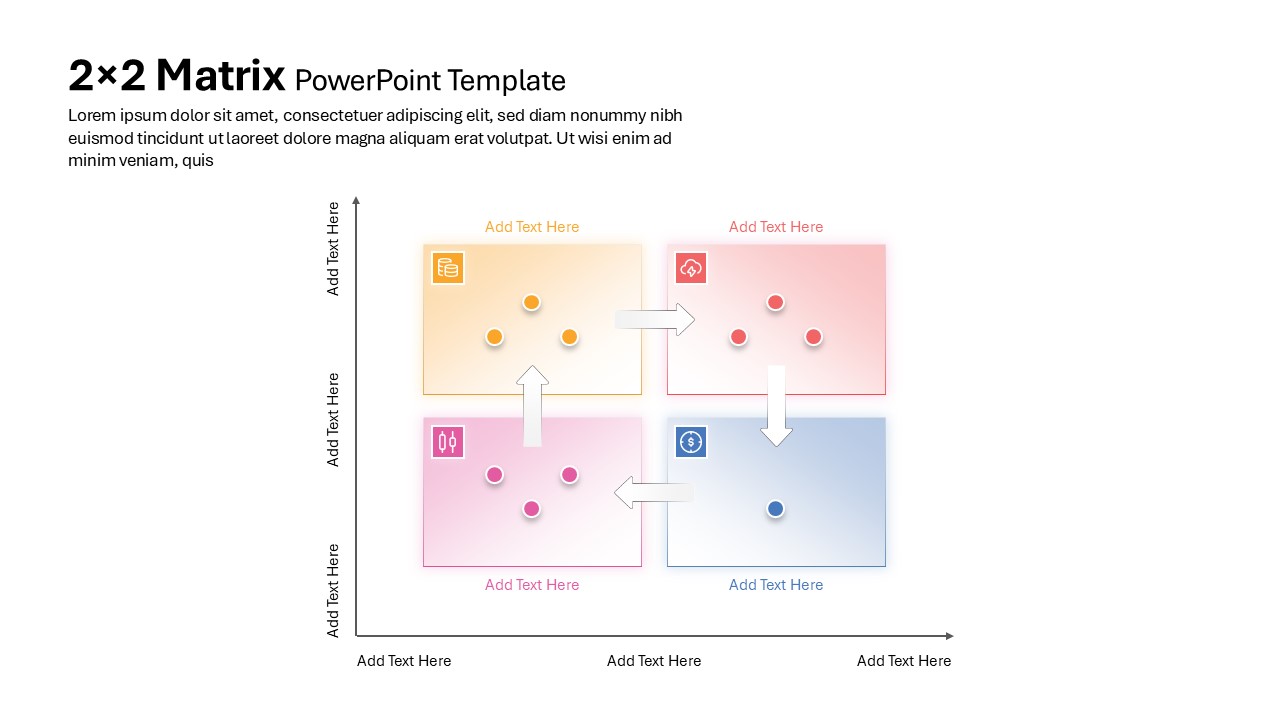
2×2 Matrix PowerPoint & Google Slides Template
Business Models
Competitor Profile Matrix Comparison Template for PowerPoint & Google Slides
Comparison Chart
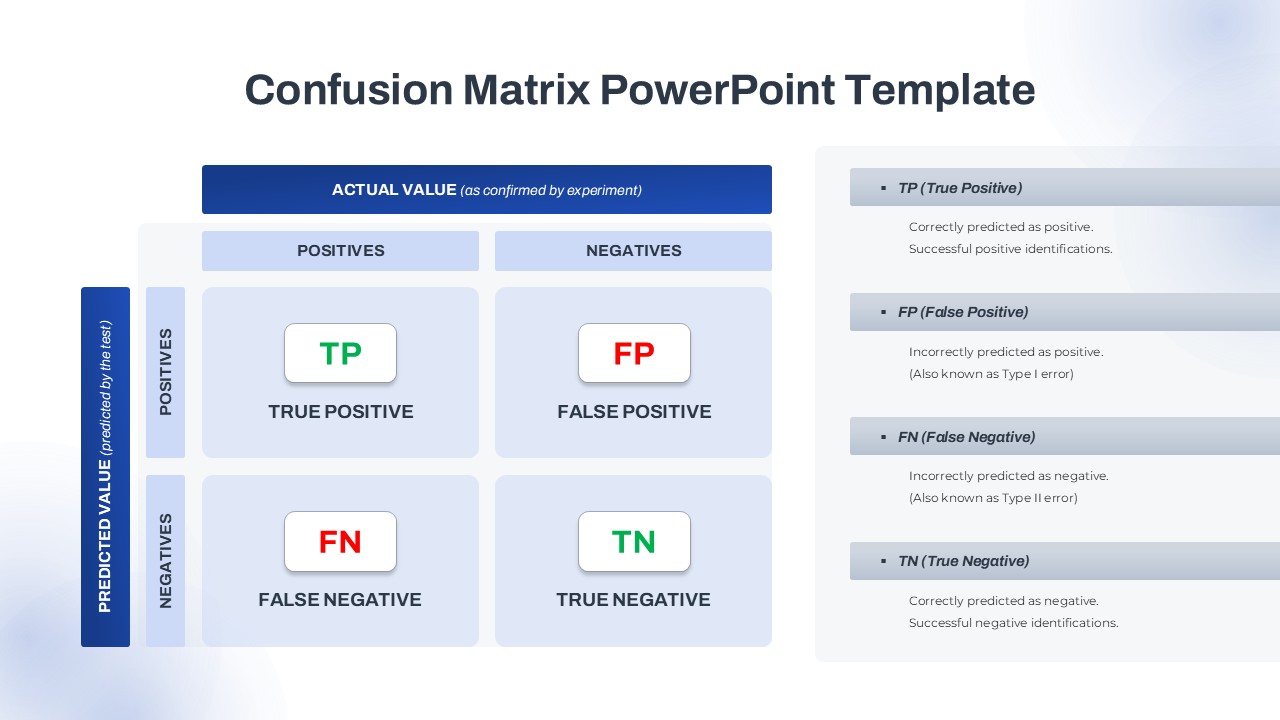
Confusion Matrix Diagram Overview Template for PowerPoint & Google Slides
Comparison
Risk Scoring & Ranking Heatmap Matrix Template for PowerPoint & Google Slides
Risk Management
Feasibility Matrix Comparison Chart Template for PowerPoint & Google Slides
Comparison Chart
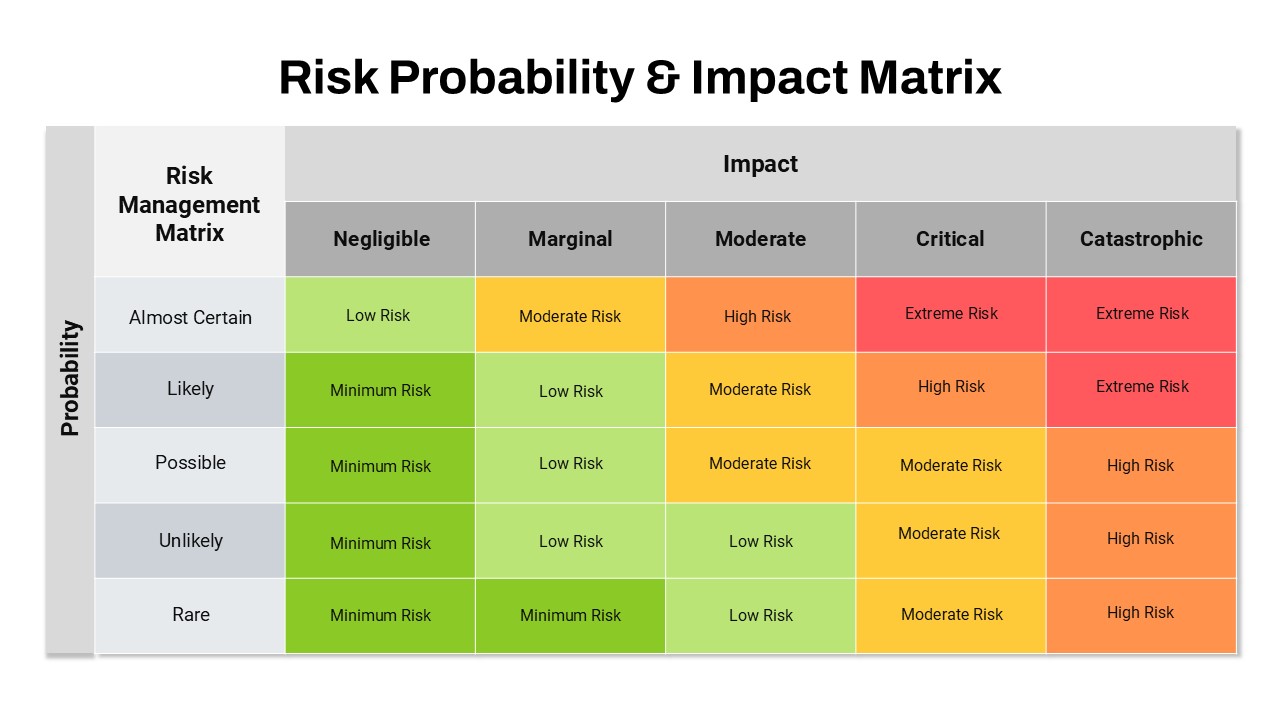
Risk Probability and Impact Matrix Template for PowerPoint & Google Slides
Risk Management
Quantitative Risk Analysis Matrix template for PowerPoint & Google Slides
Risk Management
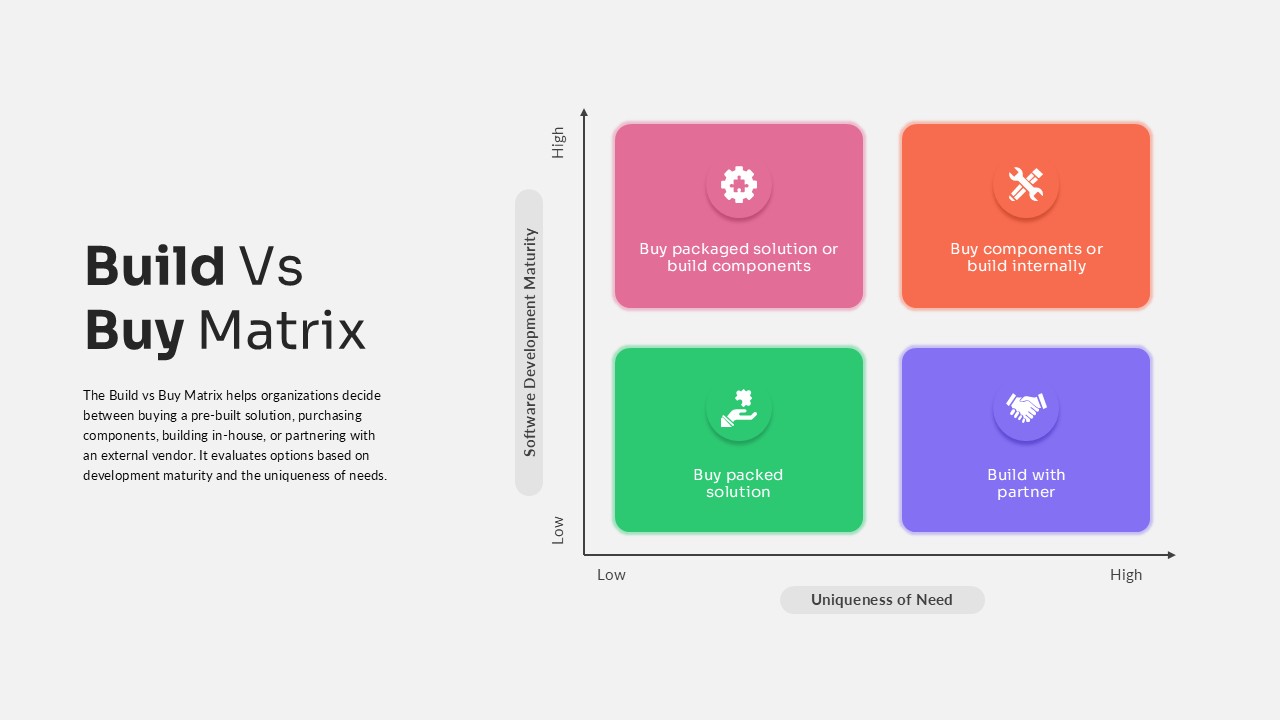
Build vs Buy Matrix Decision Framework template for PowerPoint & Google Slides
Business Strategy
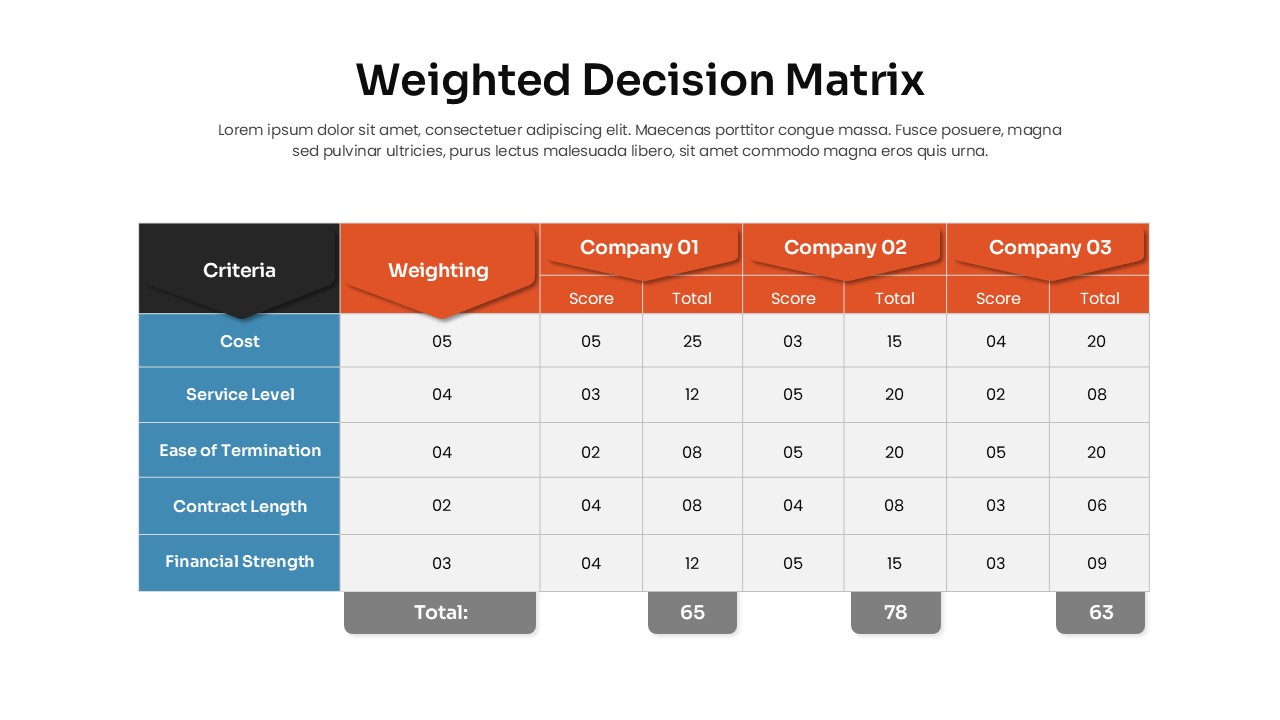
Weighted Decision Matrix template for PowerPoint & Google Slides
Business Models
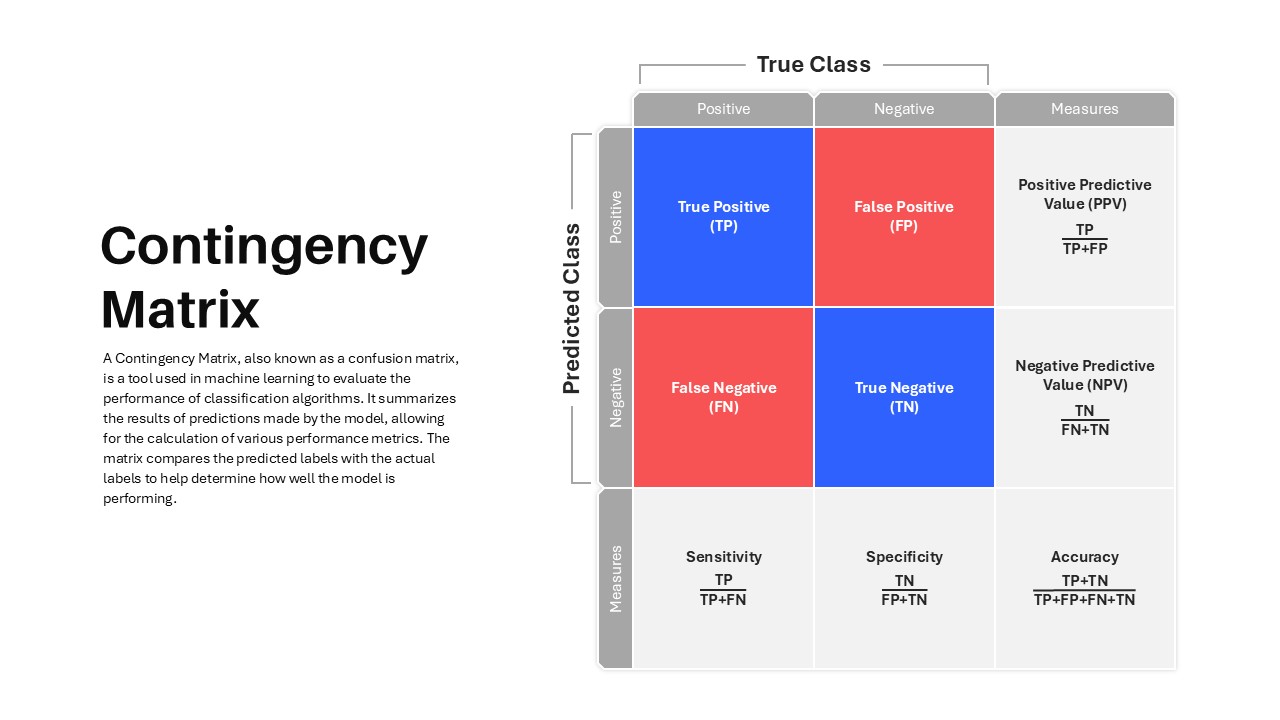
Contingency Matrix in Machine Learning template for PowerPoint & Google Slides
Technology
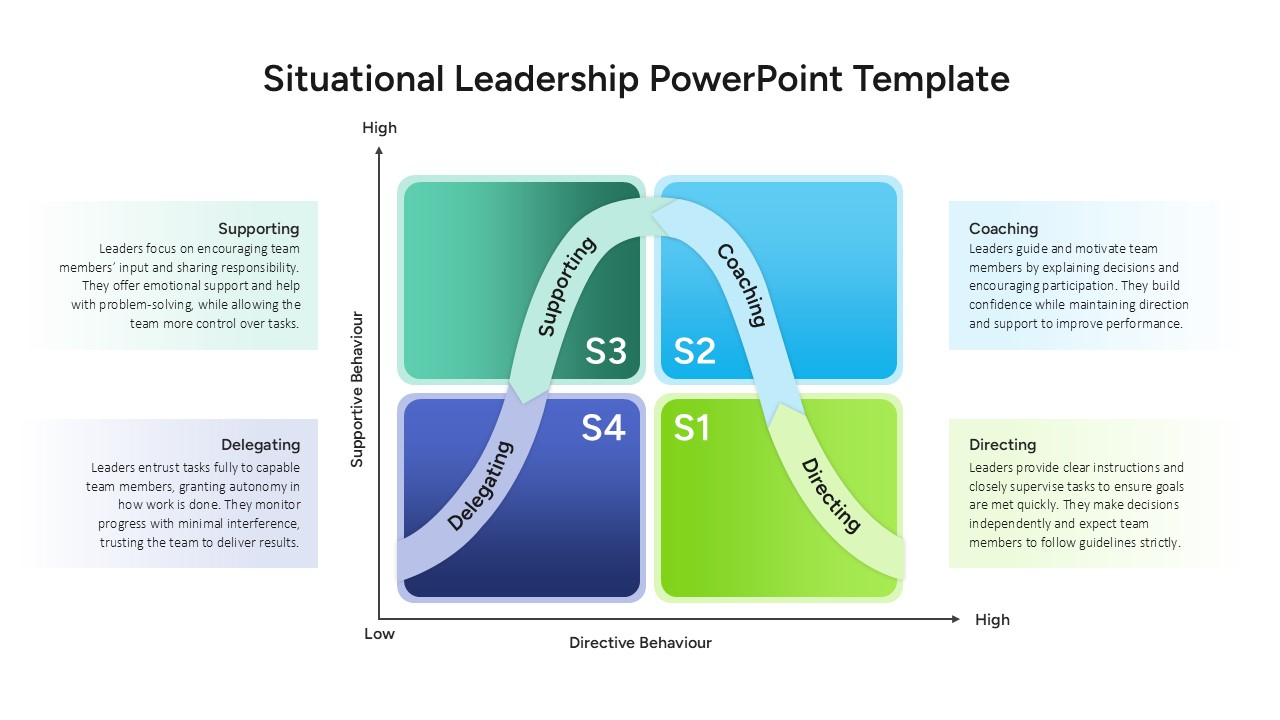
Situational Leadership Matrix Template for PowerPoint & Google Slides
Leadership
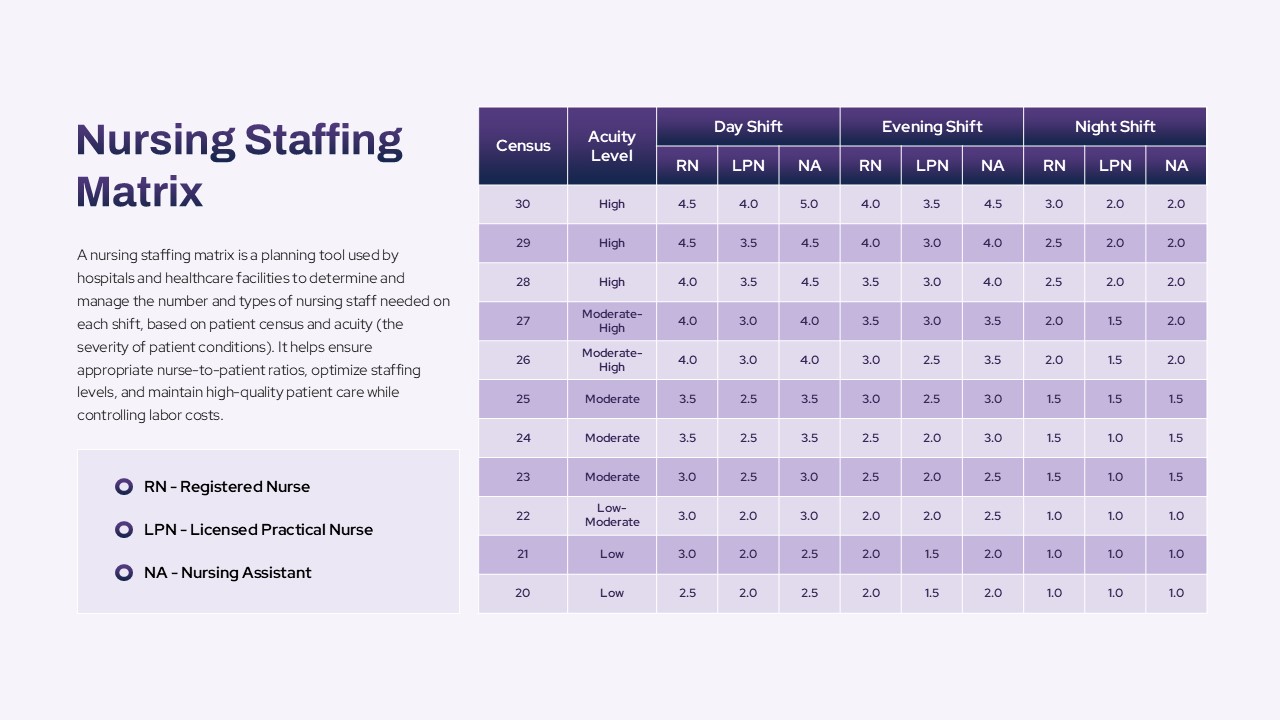
Nursing Staffing Matrix Planning Template for PowerPoint & Google Slides
Nursing
Disaster Response Role Matrix RACI Chart Template for PowerPoint & Google Slides
Project Status
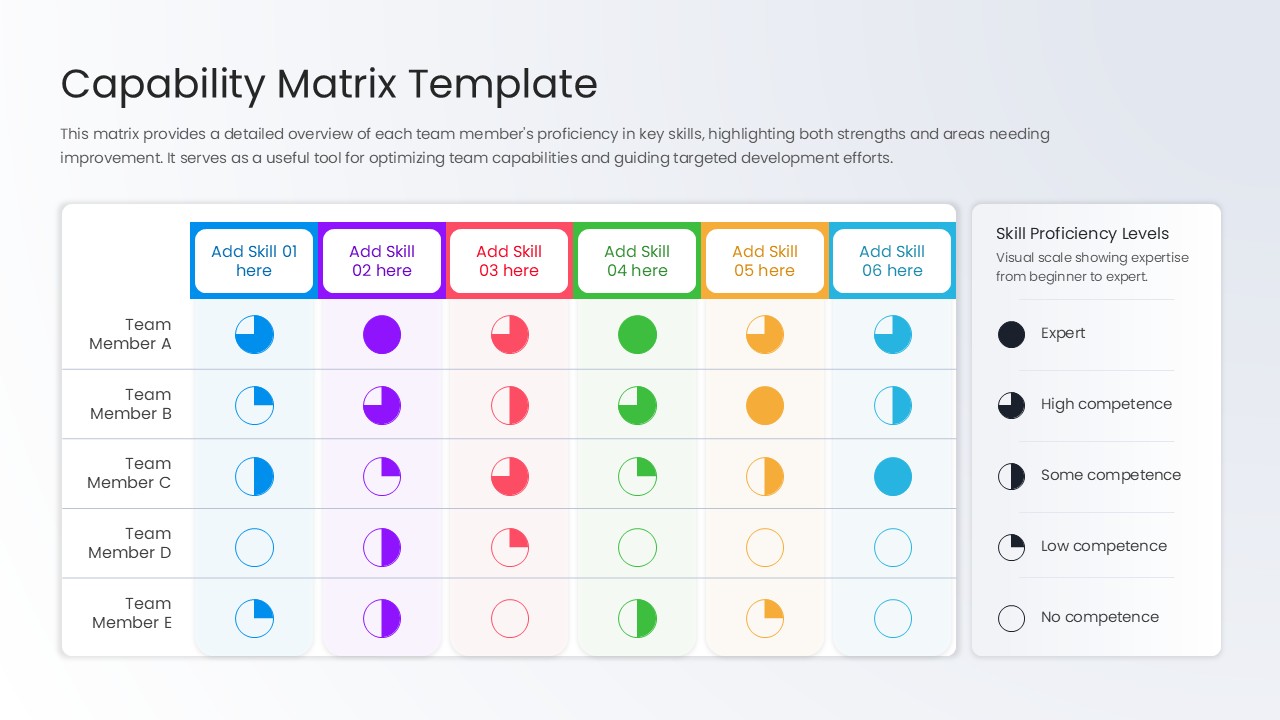
Capability Matrix Template for PowerPoint & Google Slides
HR
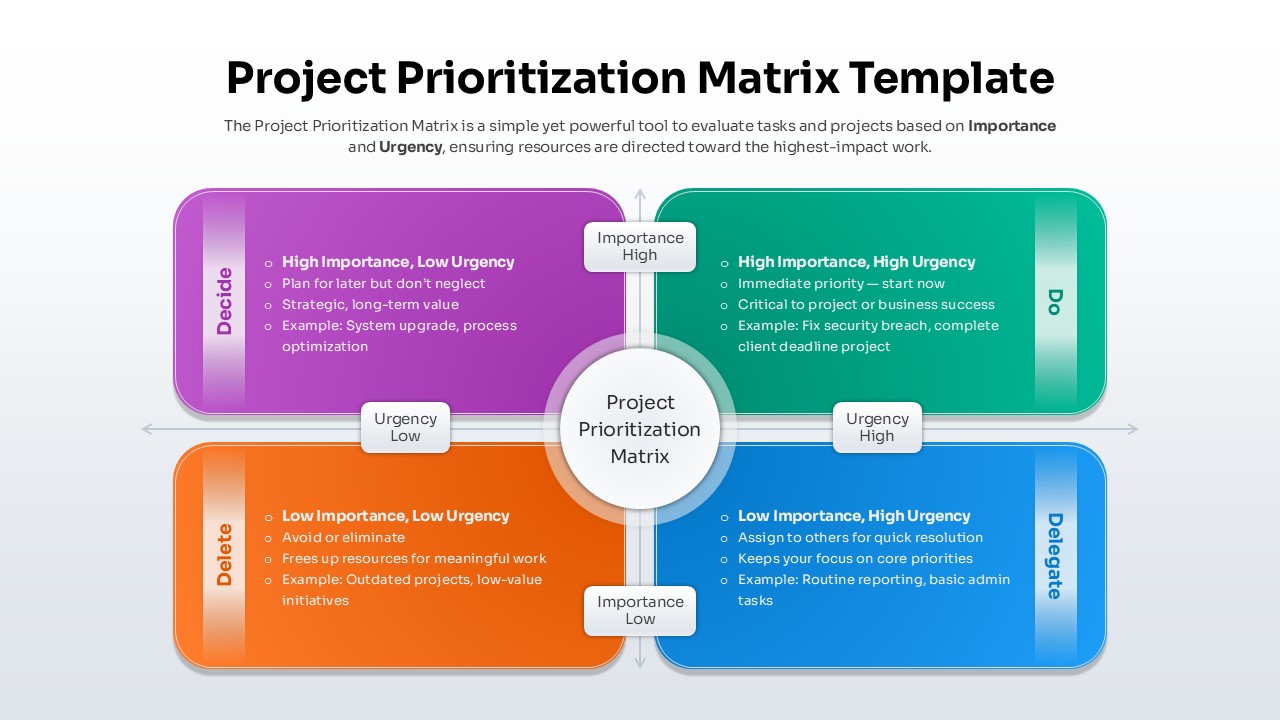
Project Prioritization Matrix Template for PowerPoint & Google Slides
Project
Personal SWOT Analysis Matrix Cards Template for PowerPoint & Google Slides
SWOT
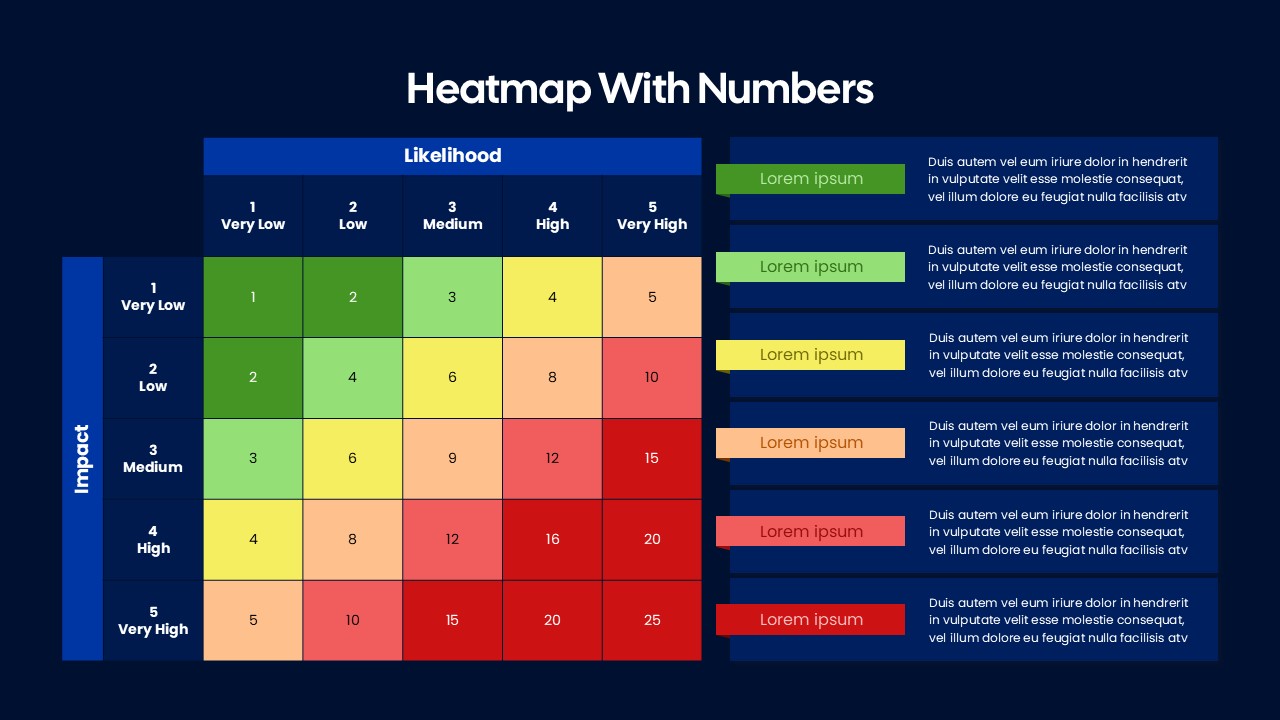
Heatmap Matrix with Numbers Template for PowerPoint & Google Slides
Project
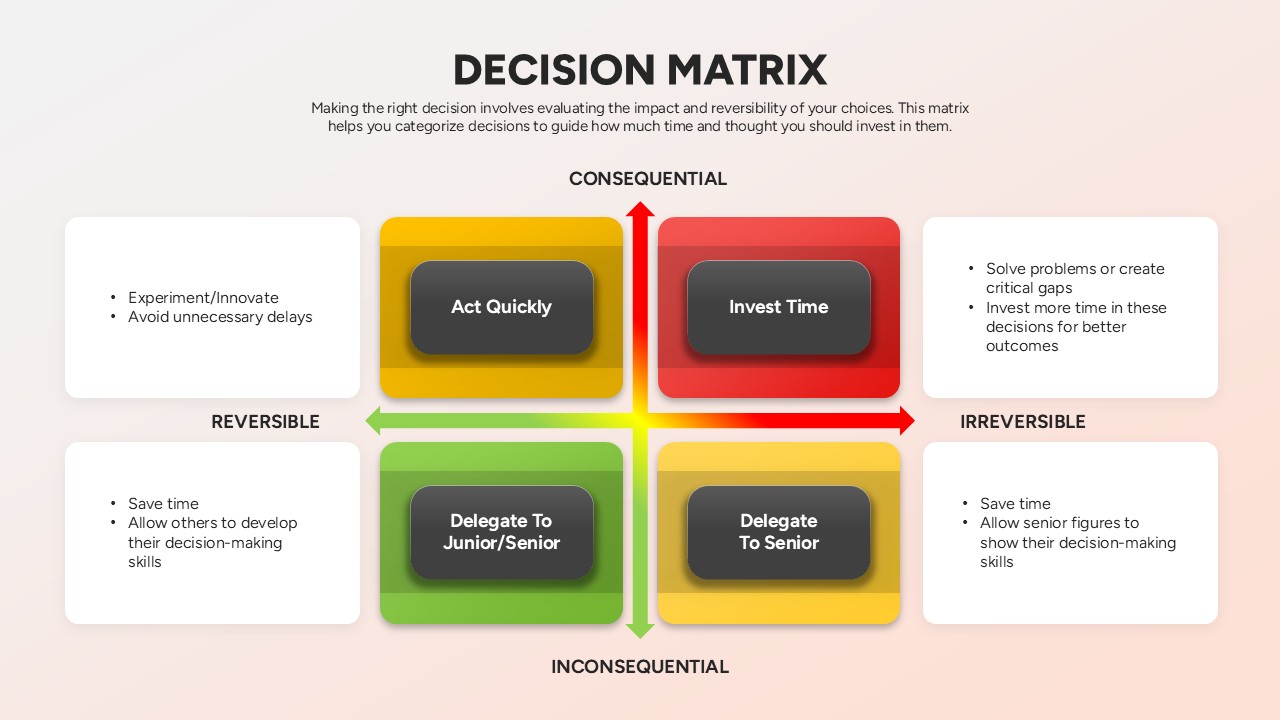
Decision Matrix Evaluation Framework Slide Template for PowerPoint & Google Slides
Leadership
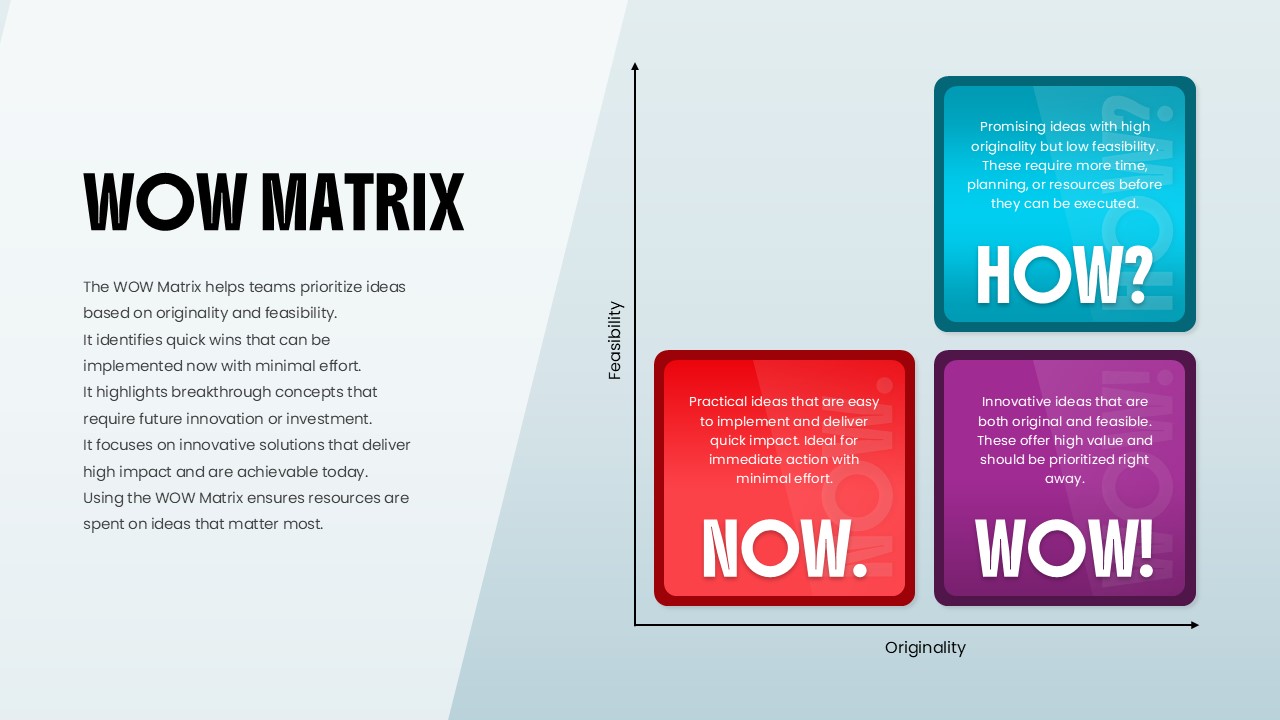
WOW Matrix Template for PowerPoint & Google Slides
Business Strategy

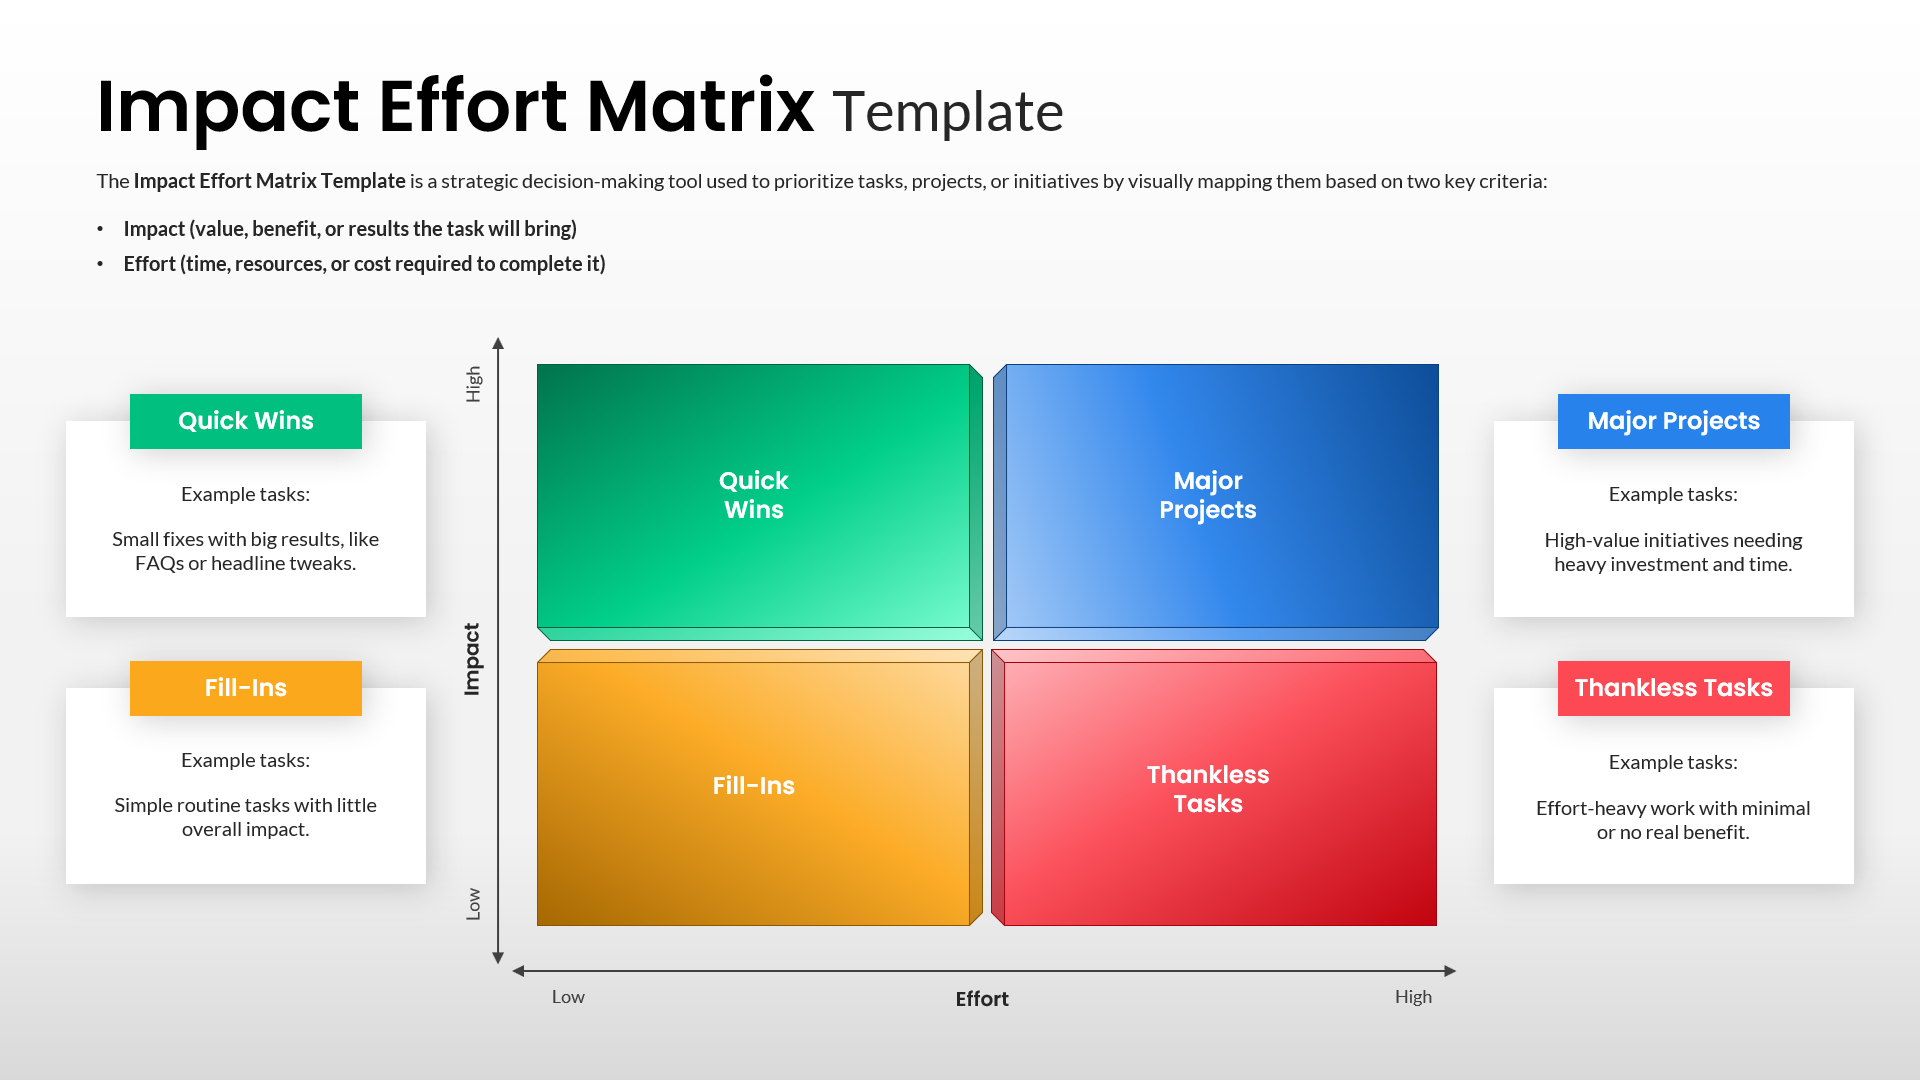
Impact Effort Matrix Template for PowerPoint & Google Slides
Comparison Chart
Ansoff Growth Matrix Template for PowerPoint & Google Slides
Business Strategy
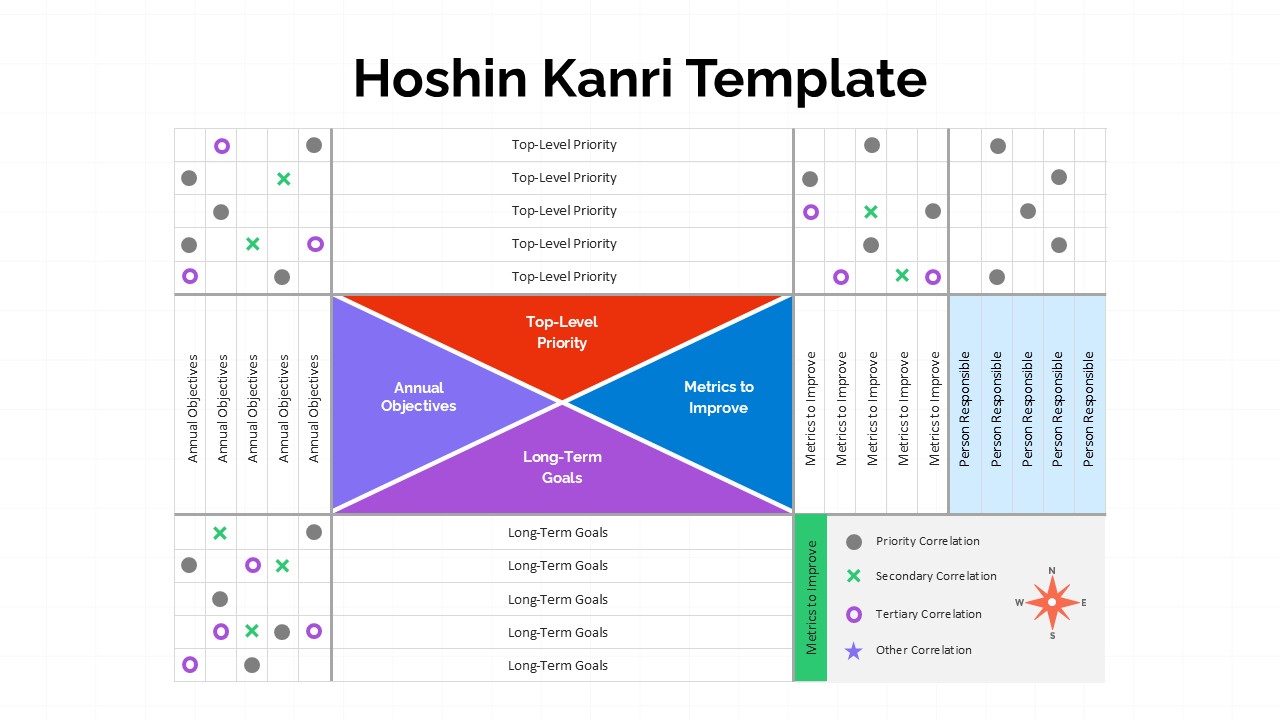
Hoshin Kanri Strategic Planning Matrix Template for PowerPoint & Google Slides
Business Strategy
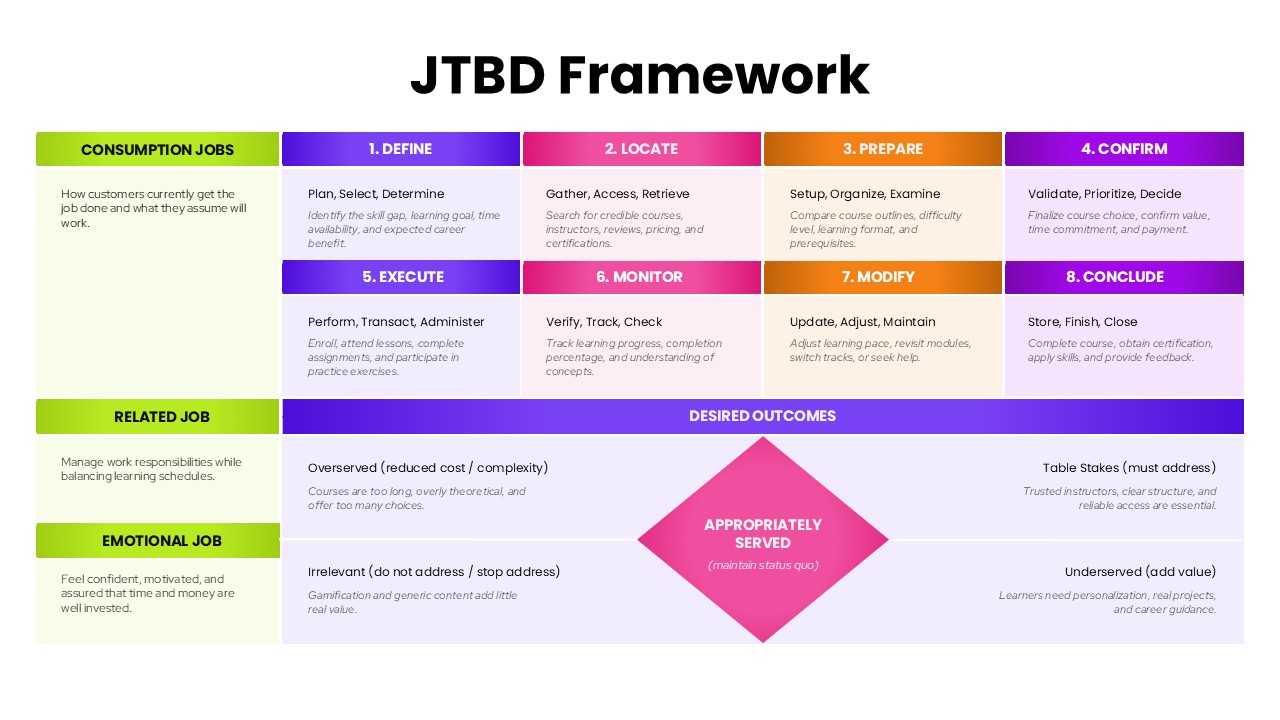
JTBD Framework Process and Outcomes Matrix Template for PowerPoint & Google Slides
Marketing
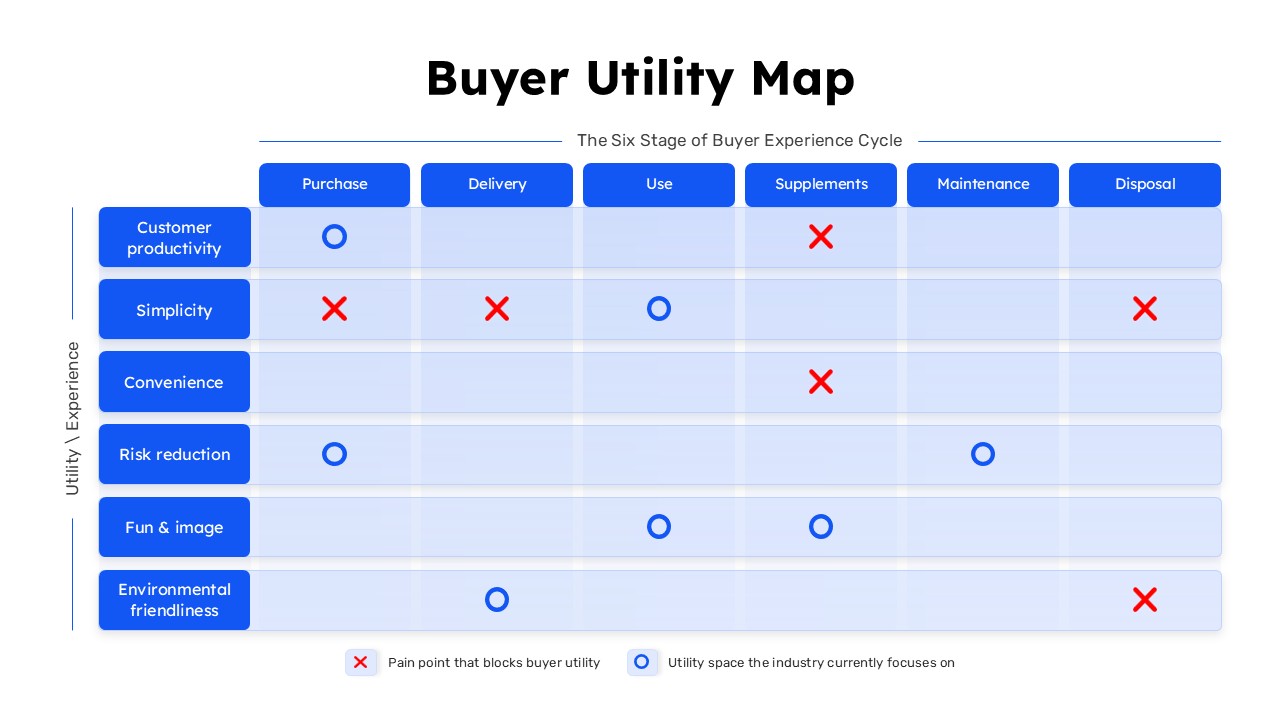
Buyer Utility Map Strategy Matrix Template for PowerPoint & Google Slides
Customer Journey
Materiality Assessment Matrix Diagram Template for PowerPoint & Google Slides
Risk Management
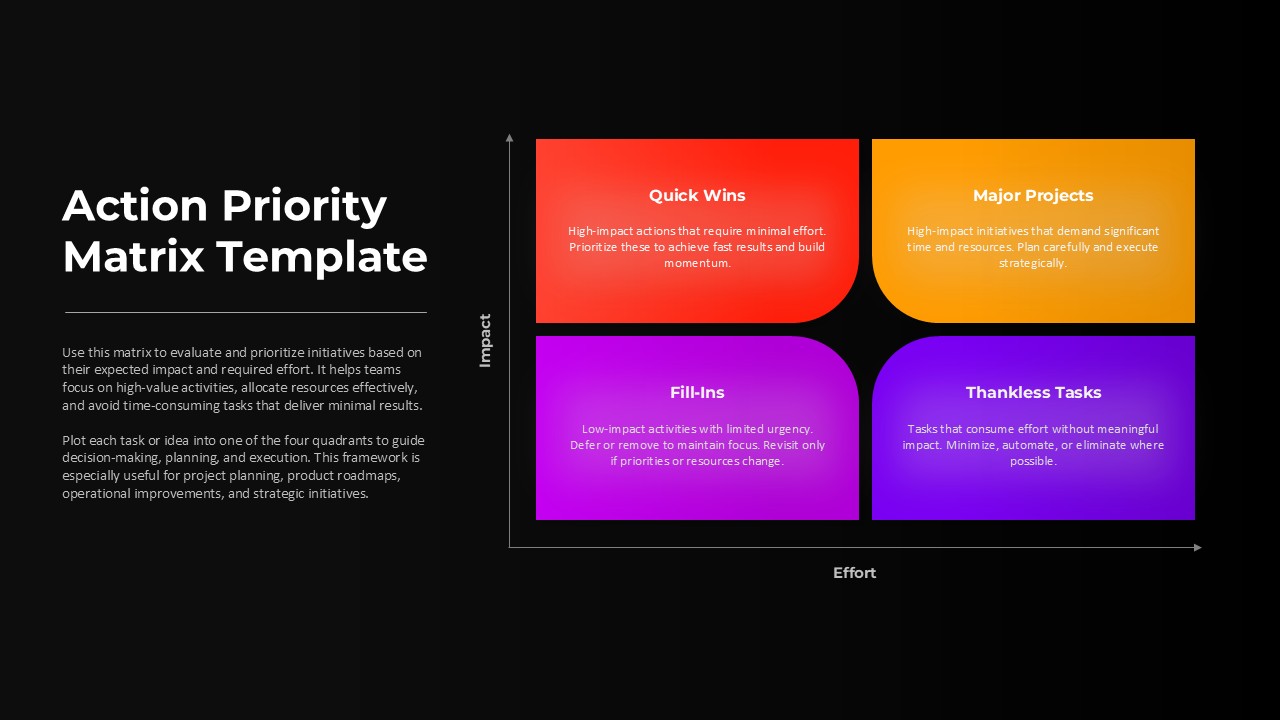
Action Priority Impact Effort Matrix Template for PowerPoint & Google Slides
Business Strategy
IT Gap Analysis Assessment Matrix Template for PowerPoint & Google Slides
Information Technology
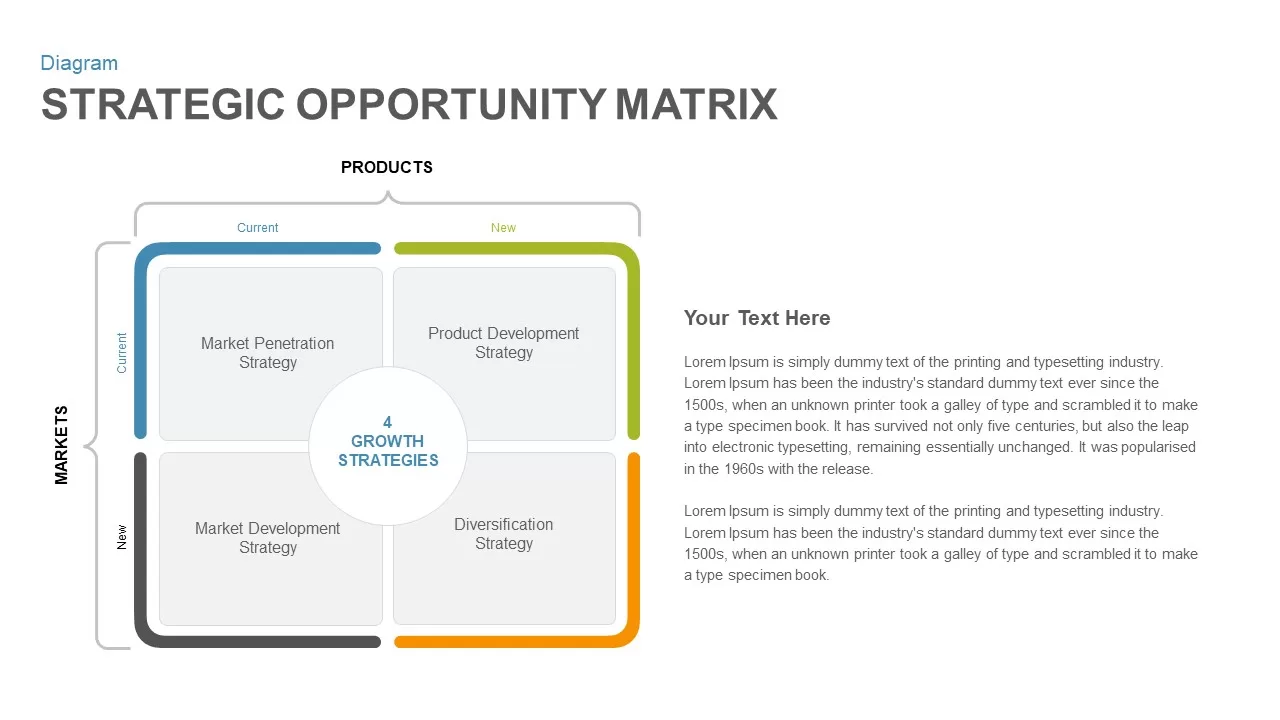
Strategic Opportunity Matrix Diagram for PowerPoint & Google Slides
Business Strategy
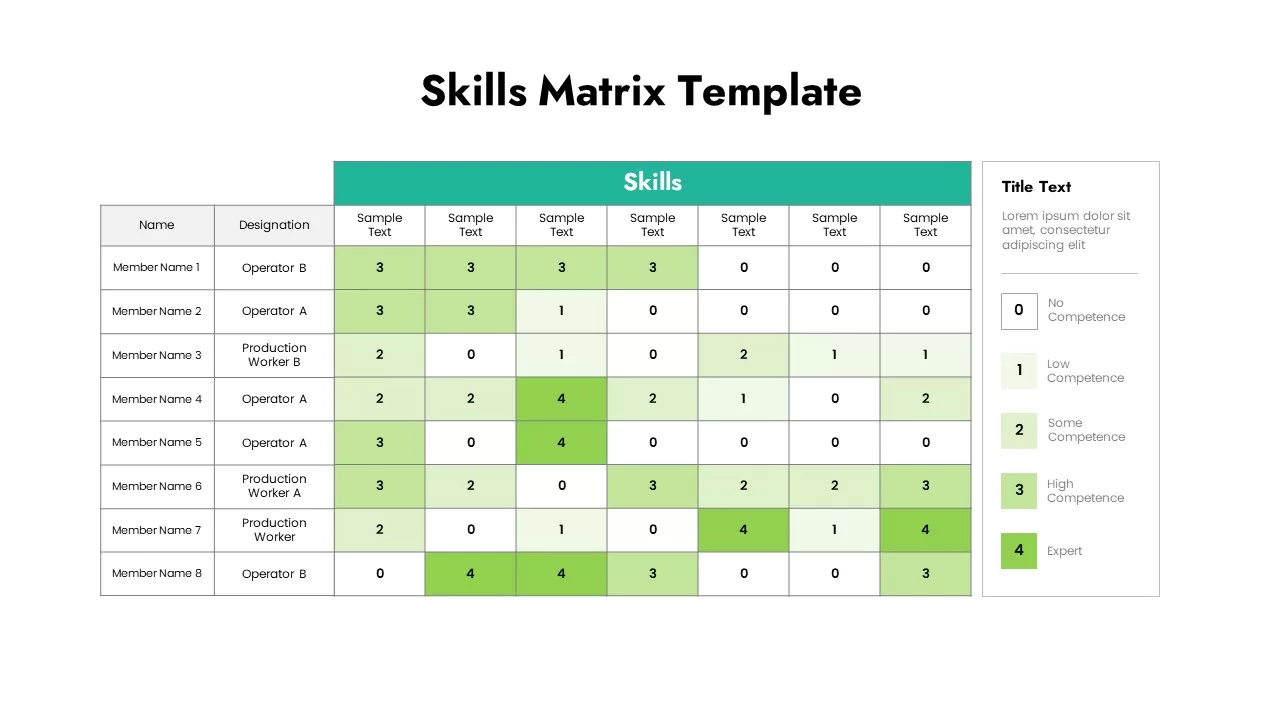
Skills Matrix infographic for PowerPoint & Google Slides
Project Status
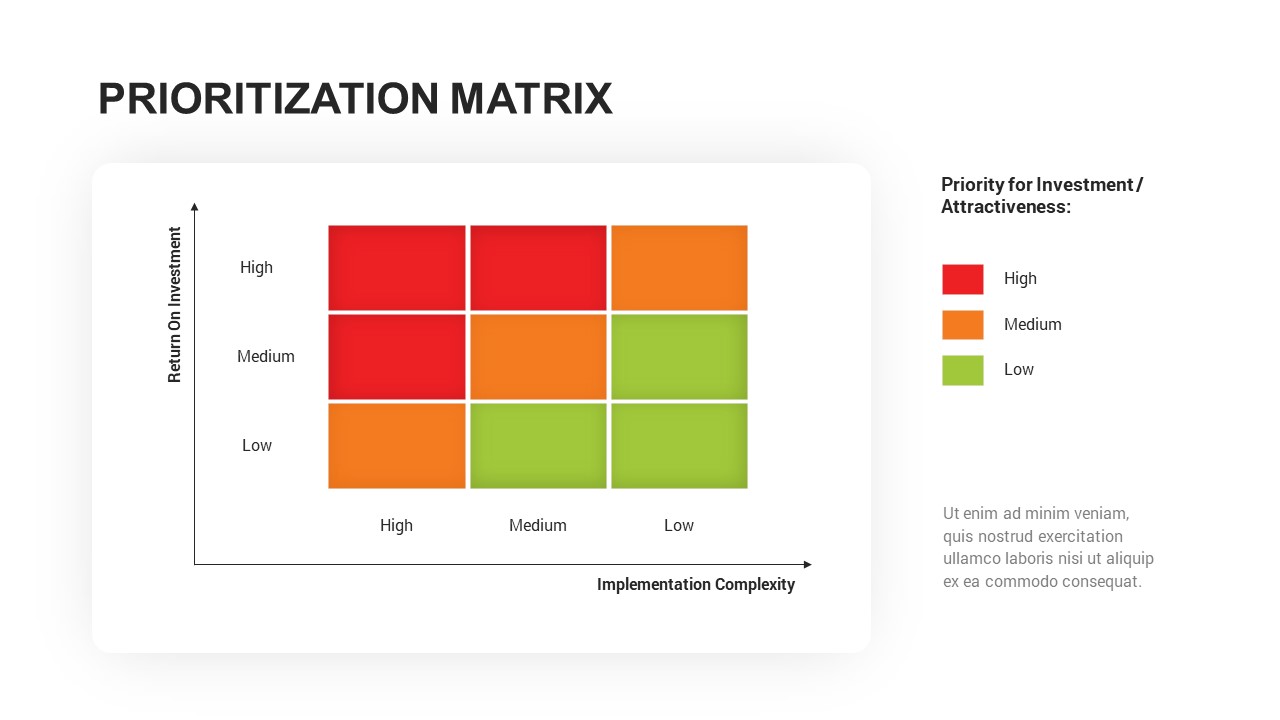
Prioritization Matrix for PowerPoint & Google Slides
Business Proposal
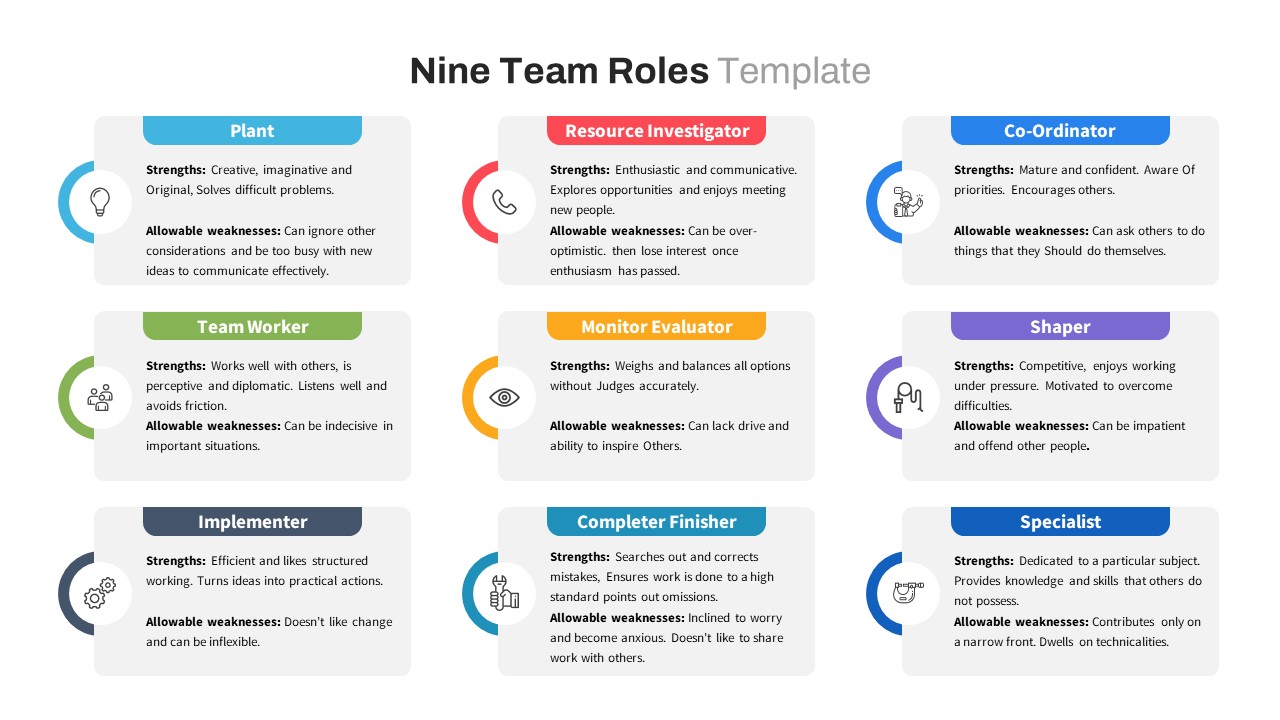
Nine Belbin Team Roles Matrix Slide for PowerPoint & Google Slides
Employee Performance
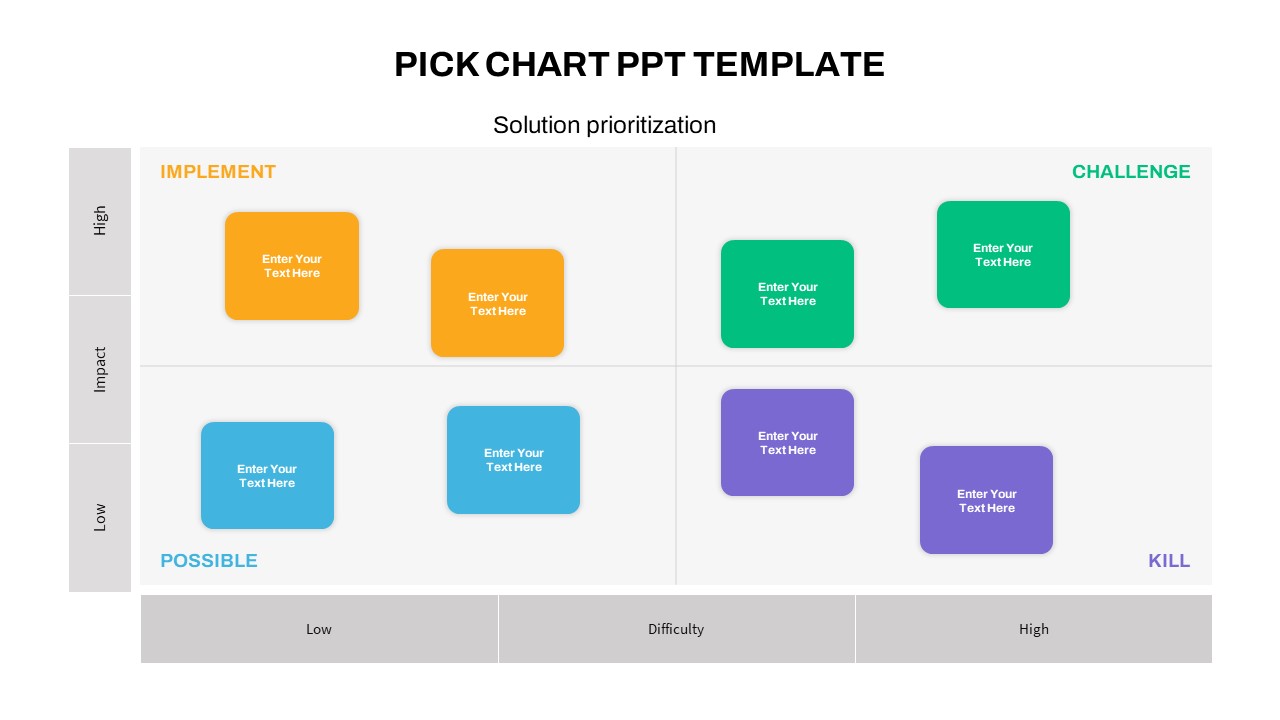
PICK Chart Matrix for Solution Prioritization in PowerPoint & Google Slides
Comparison
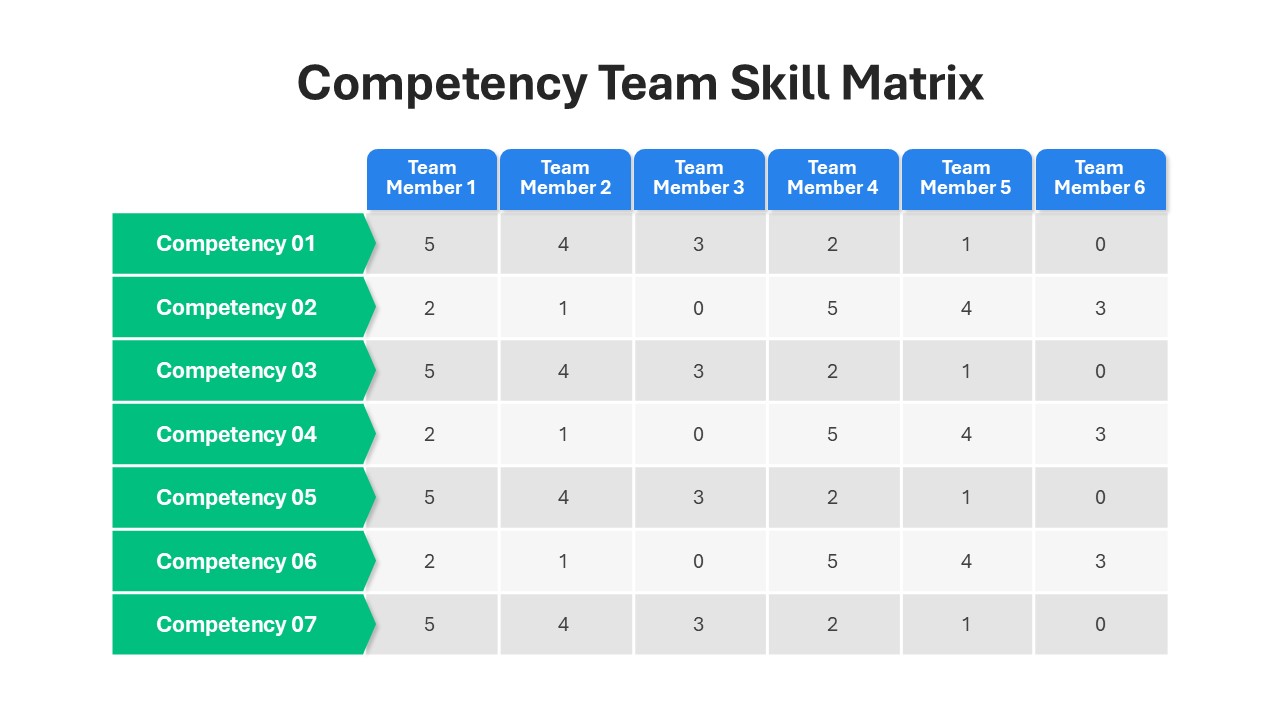
Competency Team Skill Matrix for PowerPoint & Google Slides
Employee Performance
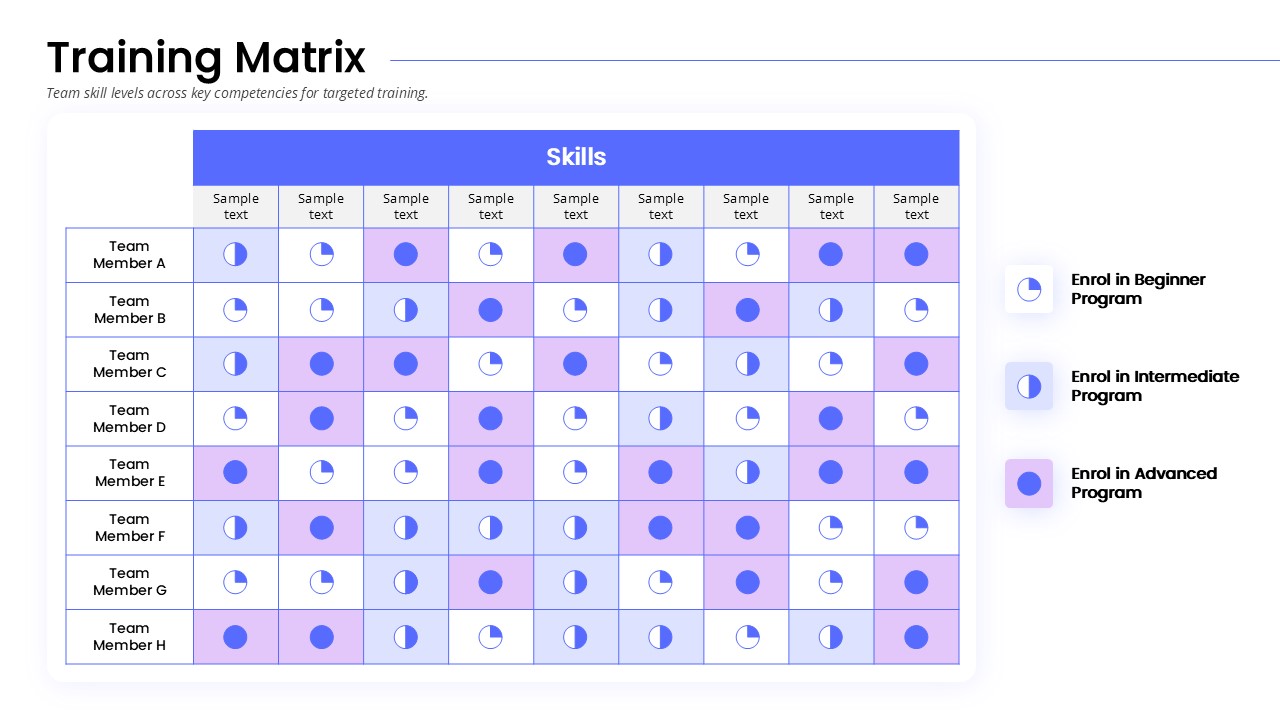
Training Matrix for PowerPoint & Google Slides
HR
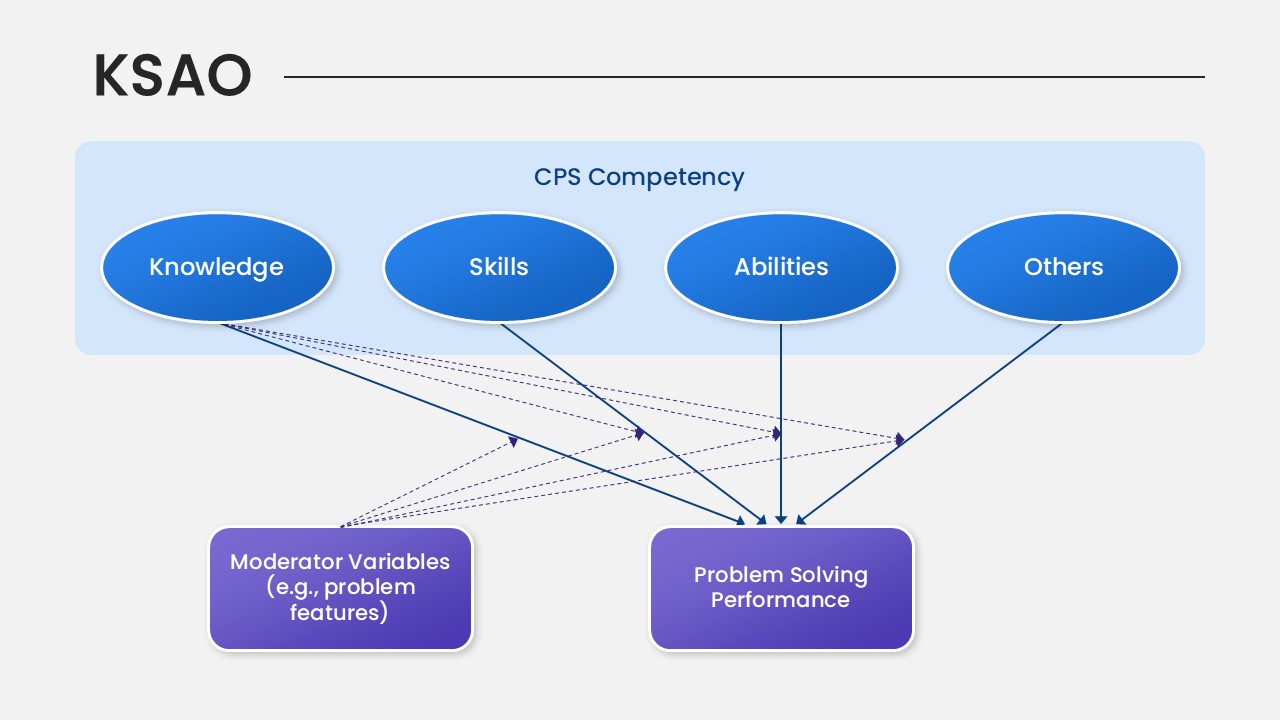
KSAO Model PowerPoint Template for PowerPoint & Google Slides
Business Strategy
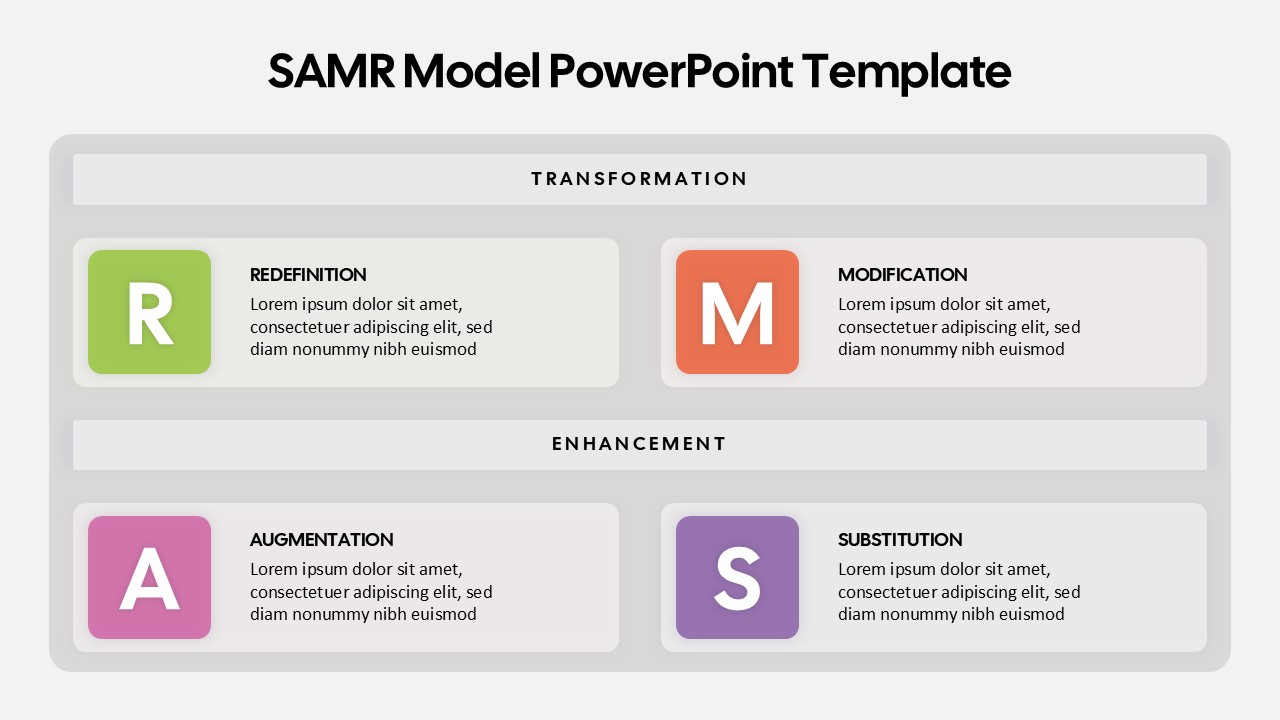
SAMR Model PowerPoint Template for PowerPoint & Google Slides
Business
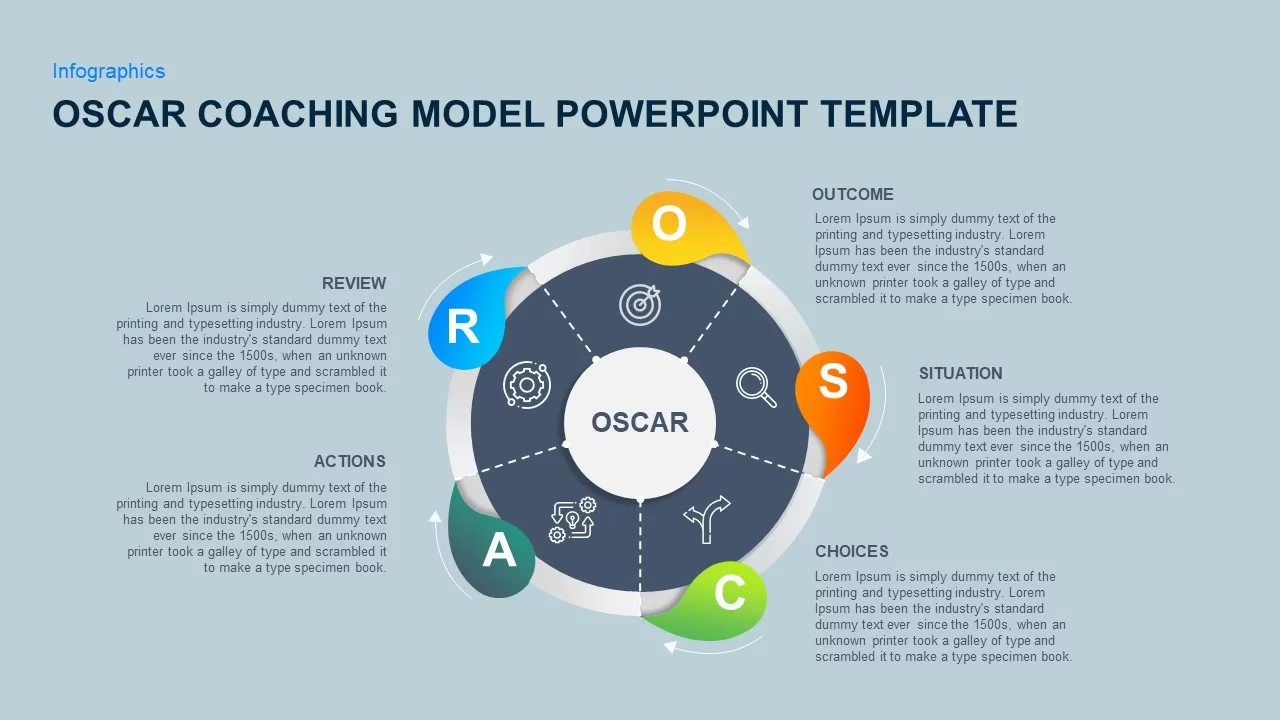
OSCAR Coaching Model Template for PowerPoint & Google Slides
Business Models
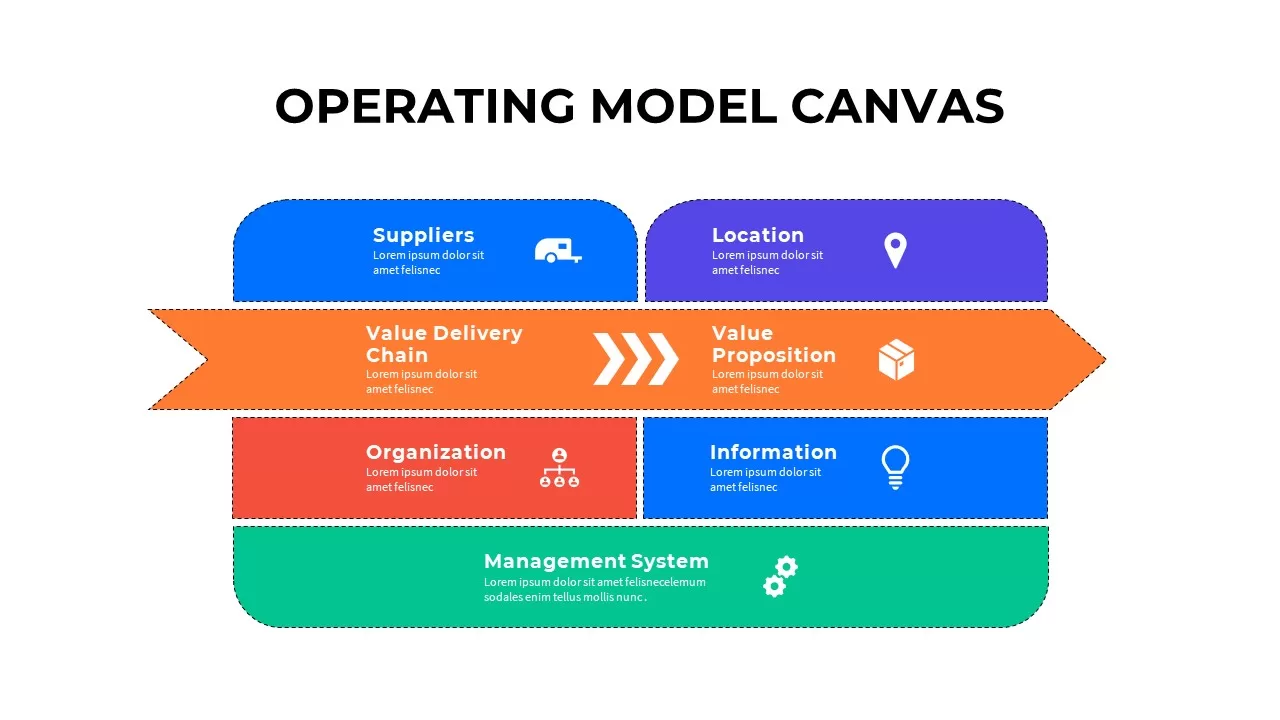
Operating Model Canvas Infographic Template for PowerPoint & Google Slides
Business Models