Social Media Network Infographic Template for PowerPoint & Google Slides

Description
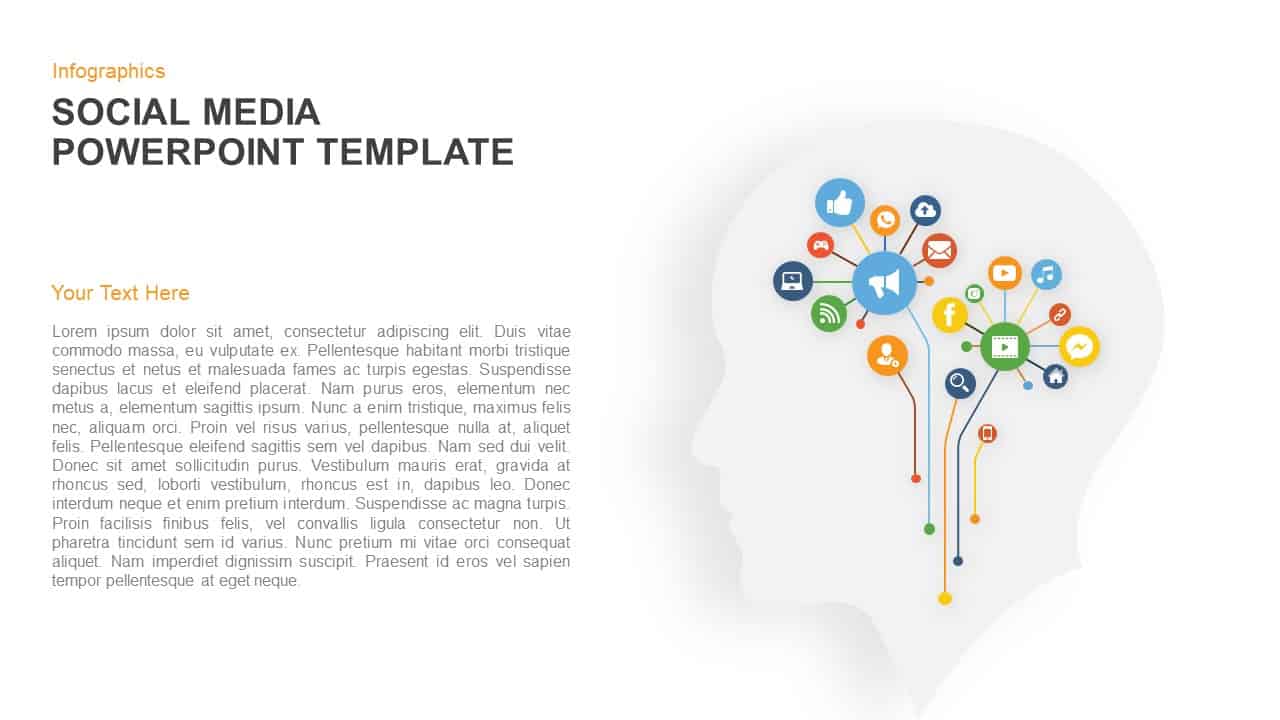
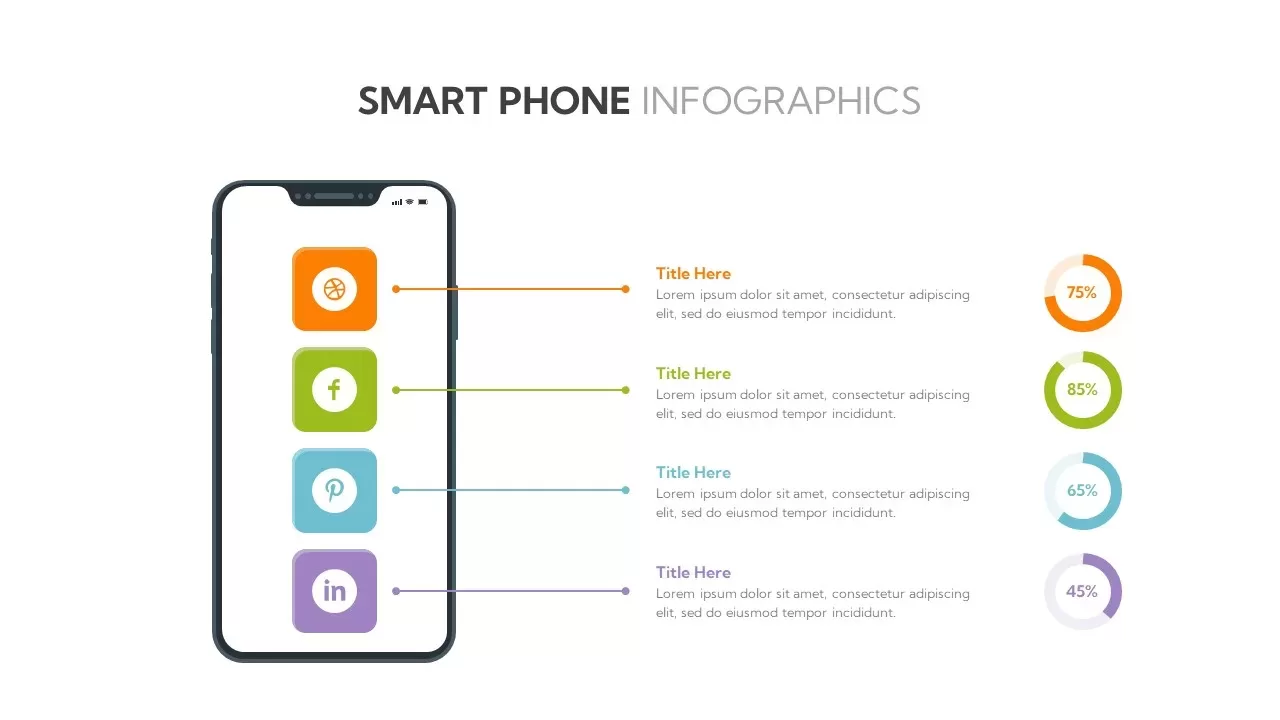
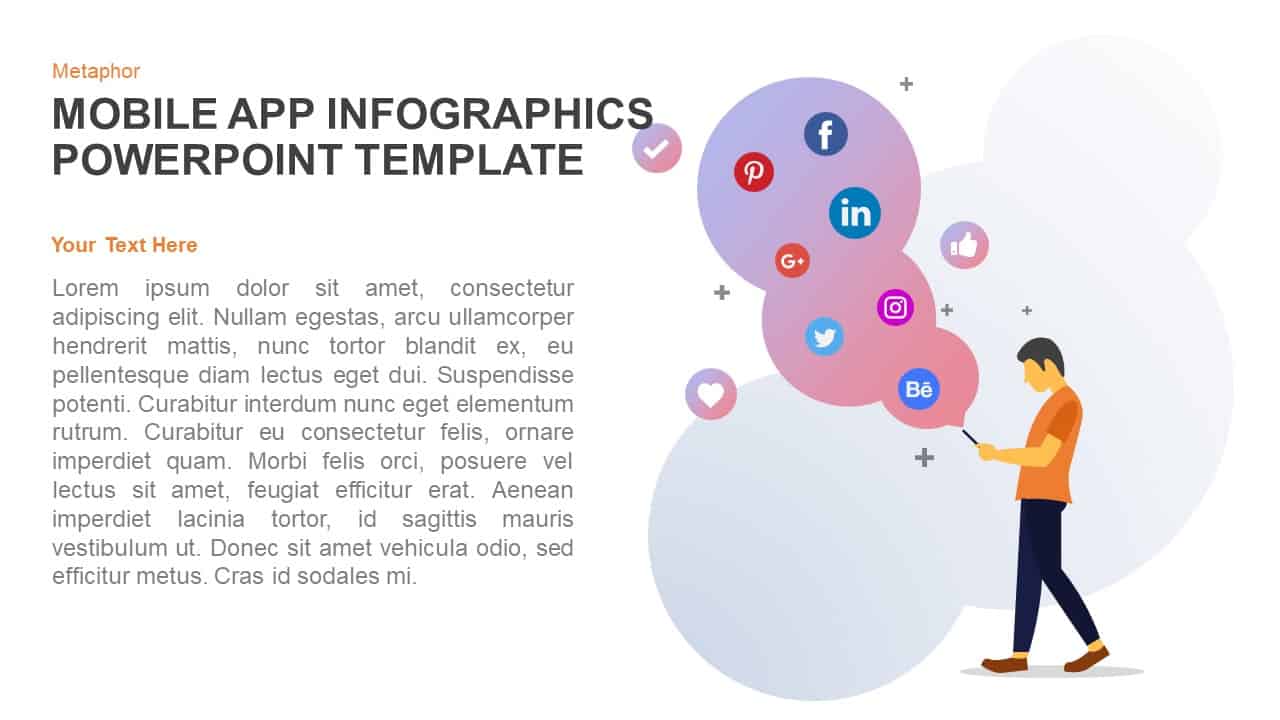
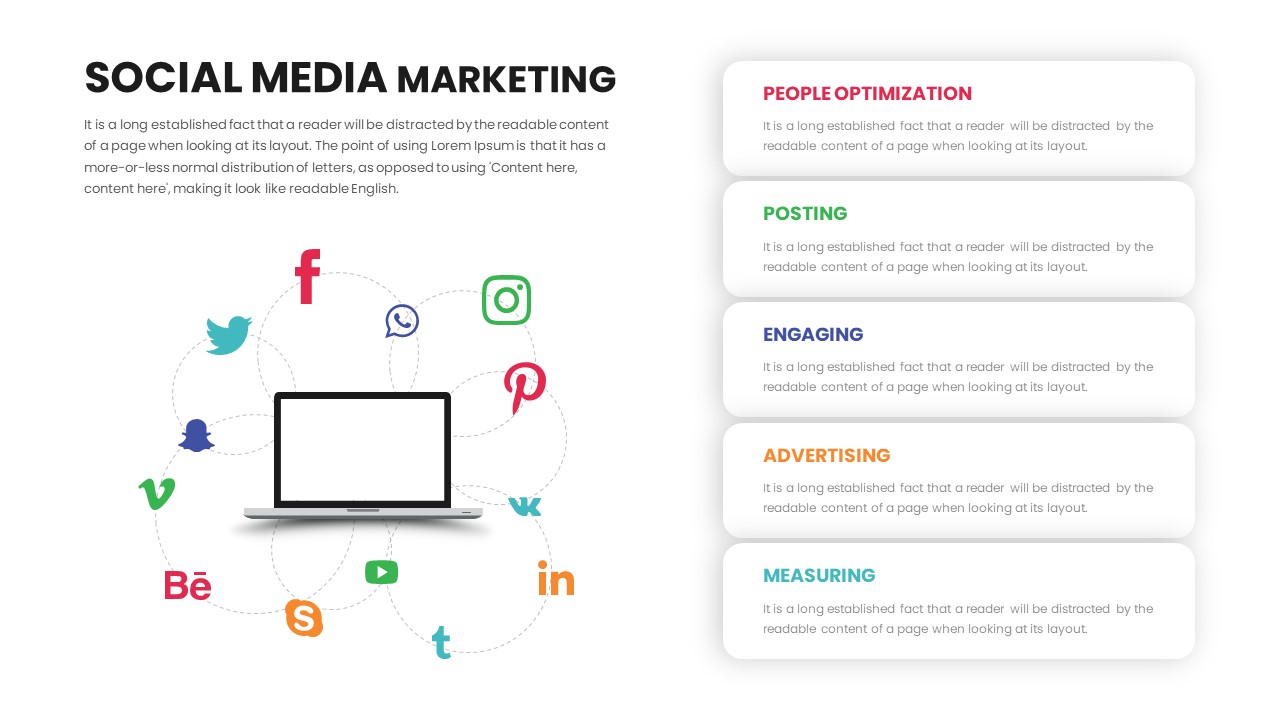
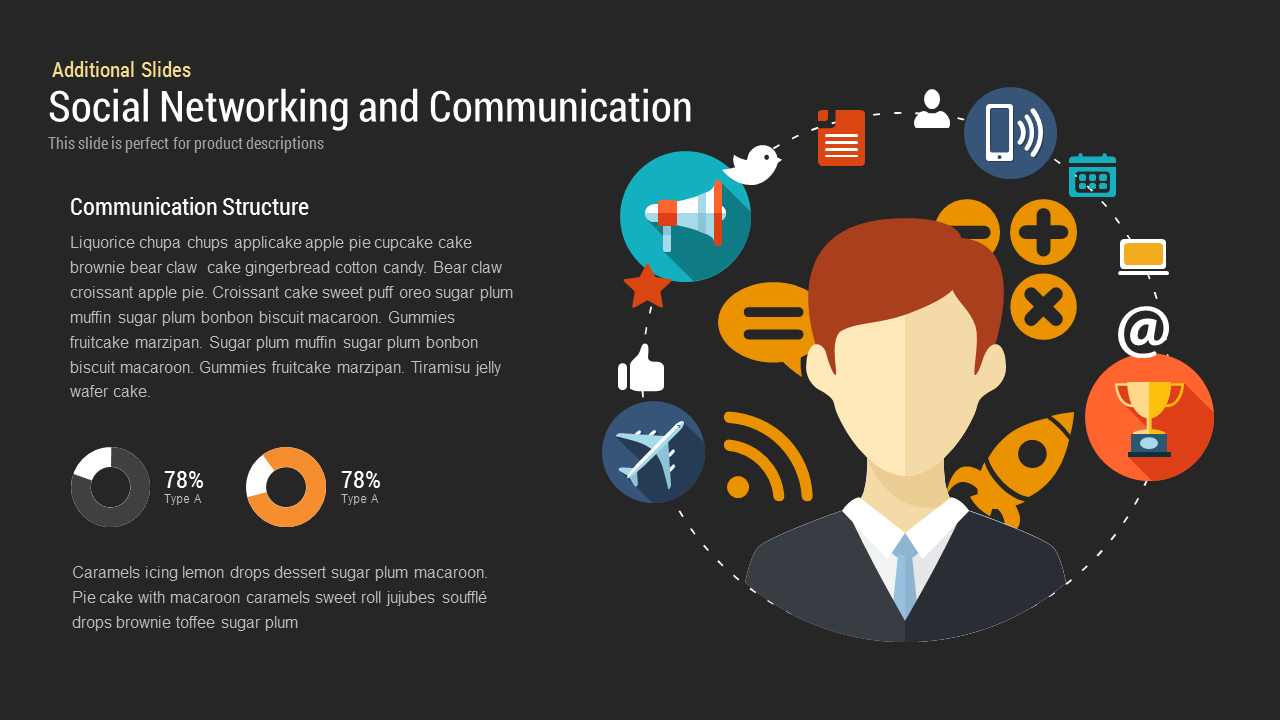
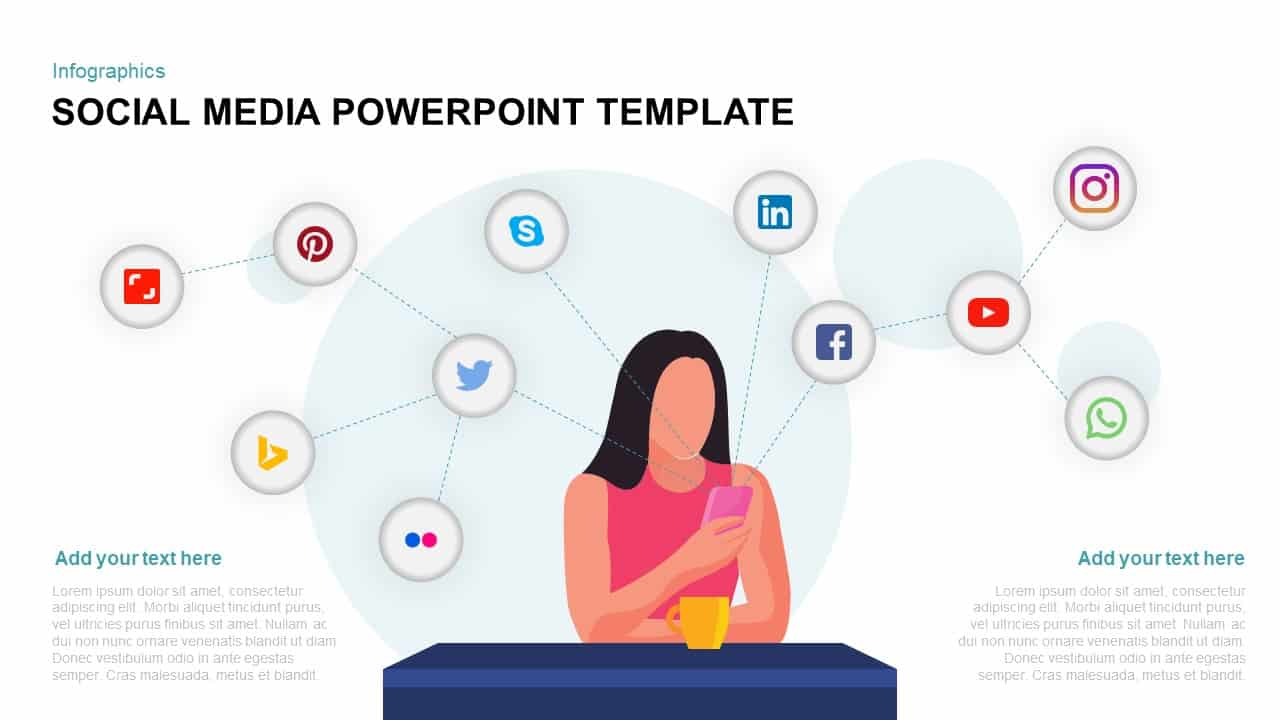
Leverage this dynamic hub-and-spoke infographic to illustrate connections between a central user and multiple social media platforms. The central figure holding a smartphone anchors dotted lines extending to circular icons representing popular networks—Facebook, Twitter, LinkedIn, Instagram, WhatsApp, YouTube, Pinterest, Skype, Flickr, and Bing—allowing you to showcase engagement channels, user touchpoints, or platform strategies in a clear visual hierarchy. Editable vector shapes and text placeholders enable quick swapping of icons, labels, and connector styles via master slides. The clean white background, subtle pastel circles, and minimal shadows create a modern, professional aesthetic that keeps audience focus on your content.
Optimized for PowerPoint and Google Slides, this template leverages SmartArt-like elements and built-in animations for sequential reveals, emphasizing each connection point with custom fade-ins or motion paths. You can easily highlight specific platforms by adjusting icon size or connector color, hide redundant spokes to simplify the layout, and apply your brand’s color palette in seconds. The modular design ensures pixel-perfect scaling across devices and consistent formatting across deck versions, eliminating manual tweaks. Enhanced for accessibility, the slide offers high-contrast icon rings, large touch targets, and screen-reader-friendly alt text placeholders to support inclusive presentations.
Designed for maximum versatility, this slide extends beyond social media mapping: use it to display sales channels, customer journey touchpoints, product distribution networks, or internal communication flows. The hub-and-spoke pattern can highlight core processes, stakeholder relationships, or technology integrations. Resizing, reordering, or duplicating spokes is effortless, while theme-based color overrides on the master slide propagate changes globally. Whether you’re a marketer outlining your omnichannel strategy, a consultant presenting digital transformation plans, or an educator explaining network theory, this infographic elevates your narrative with clarity and style.
Who is it for
Digital marketers, social media managers, communication strategists, consultants, educators, and project leads will benefit from this slide when mapping platform ecosystems and user interactions.
Other Uses
Repurpose this template to visualize sales distribution networks, customer journey touchpoints, stakeholder communication flows, IT infrastructure maps, or product ecosystem diagrams.
Login to download this file

Item ID
SB01321
Related Templates

Social Media Mind Network Infographic Template for PowerPoint & Google Slides
Digital Marketing
Social Media Community Network Slide Template for PowerPoint & Google Slides
Circular
Social Media Network Hub Diagram Slide for PowerPoint & Google Slides
Process
Social Network Connectivity Infographic Template for PowerPoint & Google Slides
Infographics
Social Network Infographic Diagram Template for PowerPoint & Google Slides
Digital Marketing
Social Media Rocket Launch Infographic Template for PowerPoint & Google Slides
Marketing
Social Media Smartphone Infographic Template for PowerPoint & Google Slides
Pie/Donut
Social Media Infographic Arrow Layout Template for PowerPoint & Google Slides
Arrow
Twitter Social Media Infographic Template for PowerPoint & Google Slides
Circular
Free Social Media Hub-and-Spoke Infographic Template for PowerPoint & Google Slides
Circular
Free
Connected Bubble Network Infographic Template for PowerPoint & Google Slides
Circular
Neural Network Brain Infographic Template for PowerPoint & Google Slides
Process
Free Social Media Users Map template for PowerPoint & Google Slides
World Maps
Free
Social Media Metrics template for PowerPoint & Google Slides
Comparison Chart
Comprehensive Social Media Icons Slide Template for PowerPoint & Google Slides
Advertising

Social Media Hub & Spoke Model Template for PowerPoint & Google Slides
Process
Social Media Market Share Pie Charts Template for PowerPoint & Google Slides
Pie/Donut
Mobile App Social Media Metaphor Template for PowerPoint & Google Slides
Infographics
Social Media Metaphor Illustration Template for PowerPoint & Google Slides
Digital Marketing
Social Media Performance Dashboard Template for PowerPoint & Google Slides
Bar/Column
Social Media Marketing Tool Template for PowerPoint & Google Slides
Digital Marketing
Free 3D Social Media Icons template for PowerPoint & Google Slides
Digital Marketing
Free
Popular Social Media Comparison Grid Template for PowerPoint & Google Slides
Digital Marketing
Social Media Analytics Dashboard Template for PowerPoint & Google Slides
Digital Marketing

Social Media Marketing Agency Pitch Deck Template for PowerPoint & Google Slides
Pitch Deck
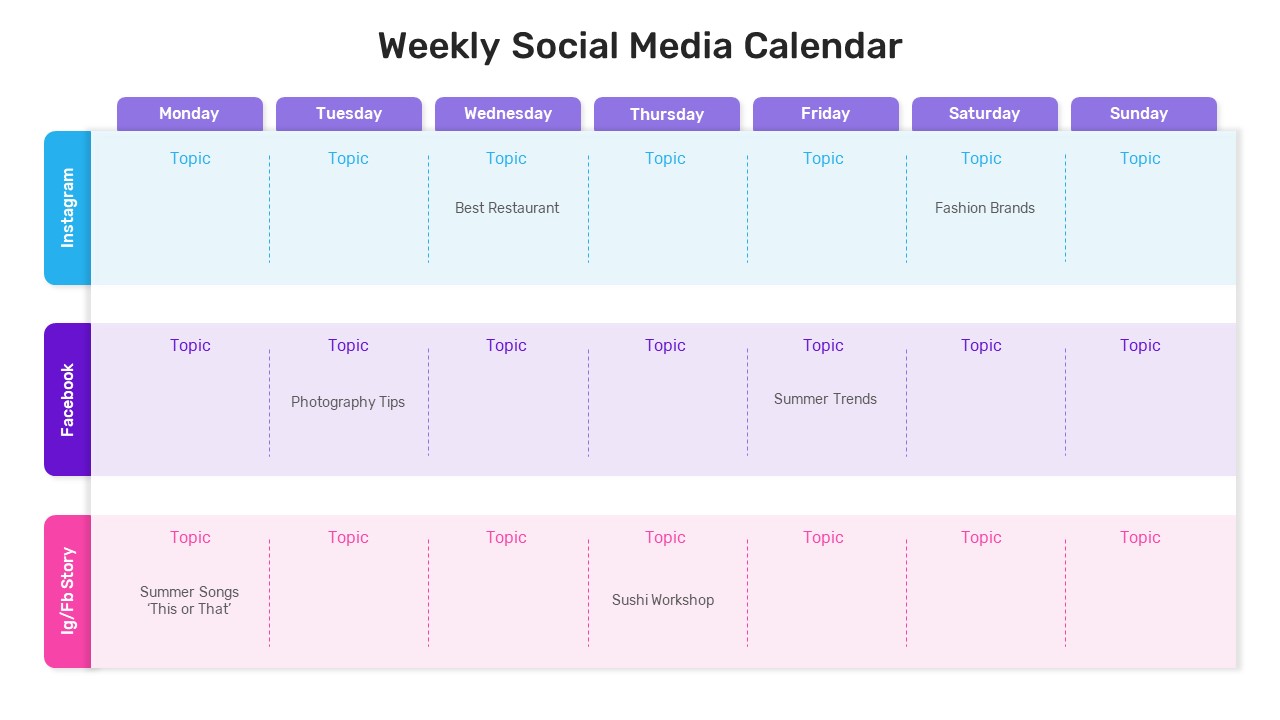
Weekly Social Media Calendar Editable Template for PowerPoint & Google Slides
Digital Marketing
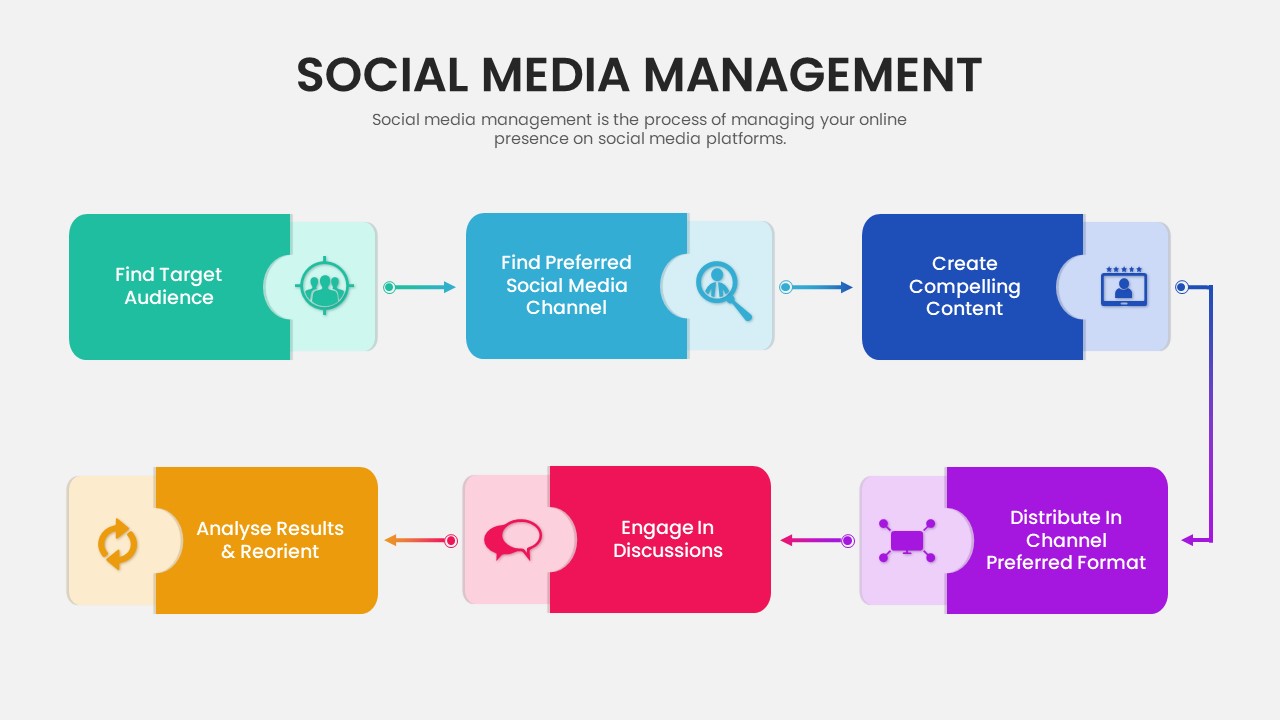
Six-Step Social Media Management Process Template for PowerPoint & Google Slides
Process
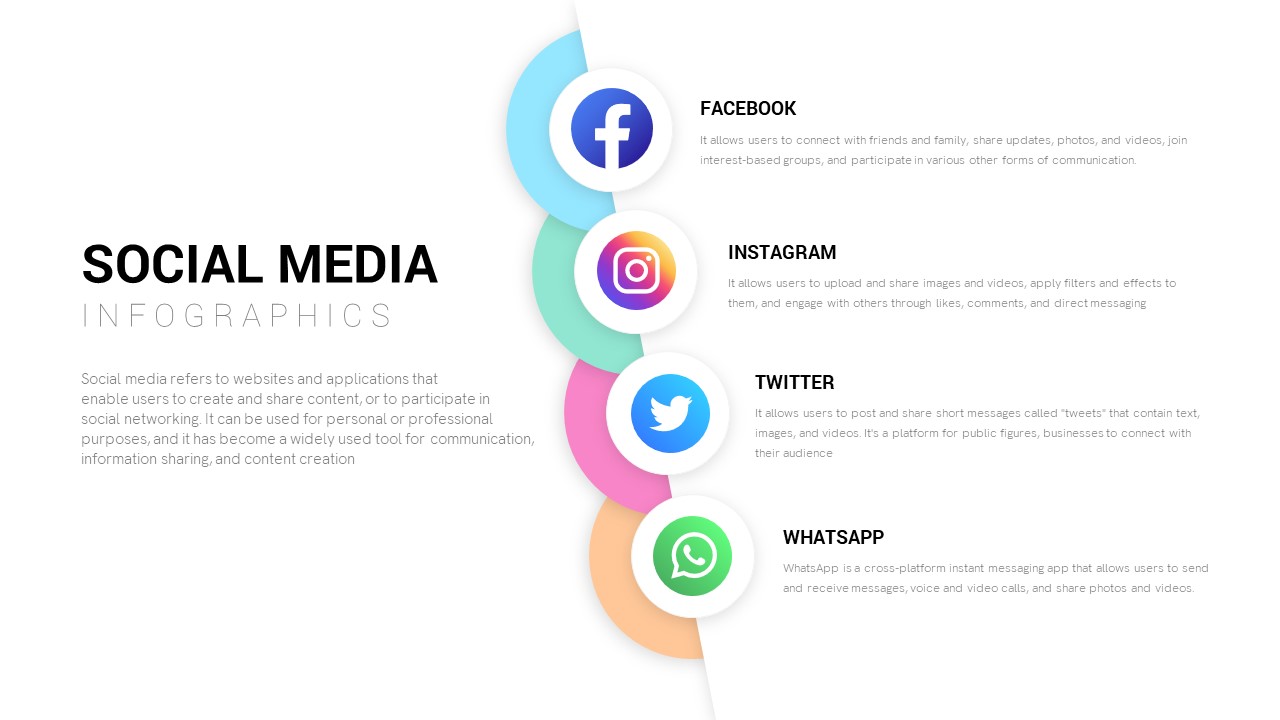
Modern Social Media Infographics Template for PowerPoint & Google Slides
Digital Marketing
Social Media Plan Table Slide Deck Template for PowerPoint & Google Slides
Process
Social Media Marketing Connection Template for PowerPoint & Google Slides
Digital Marketing
Social Media Policy Dos & Don’ts Slide Template for PowerPoint & Google Slides
Comparison
Social Media Marketing Strategy Template for PowerPoint & Google Slides
Digital Marketing
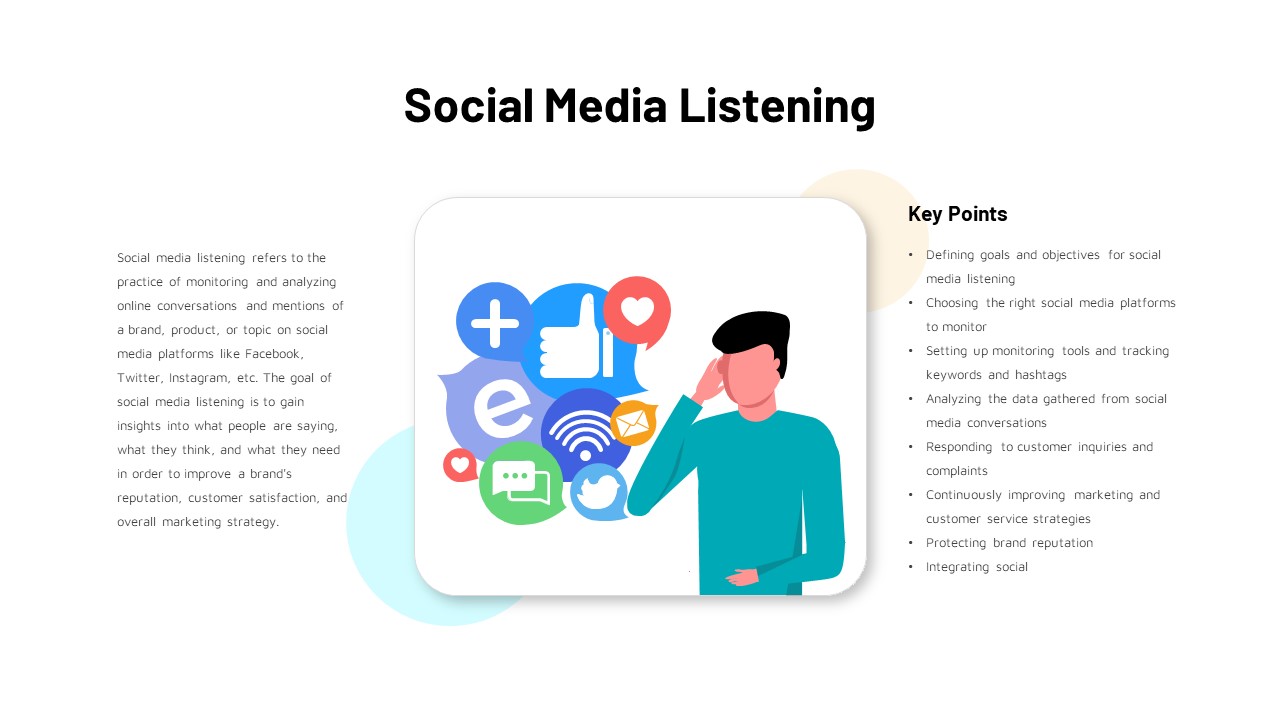
Social Media Listening Overview Slide Template for PowerPoint & Google Slides
Customer Experience
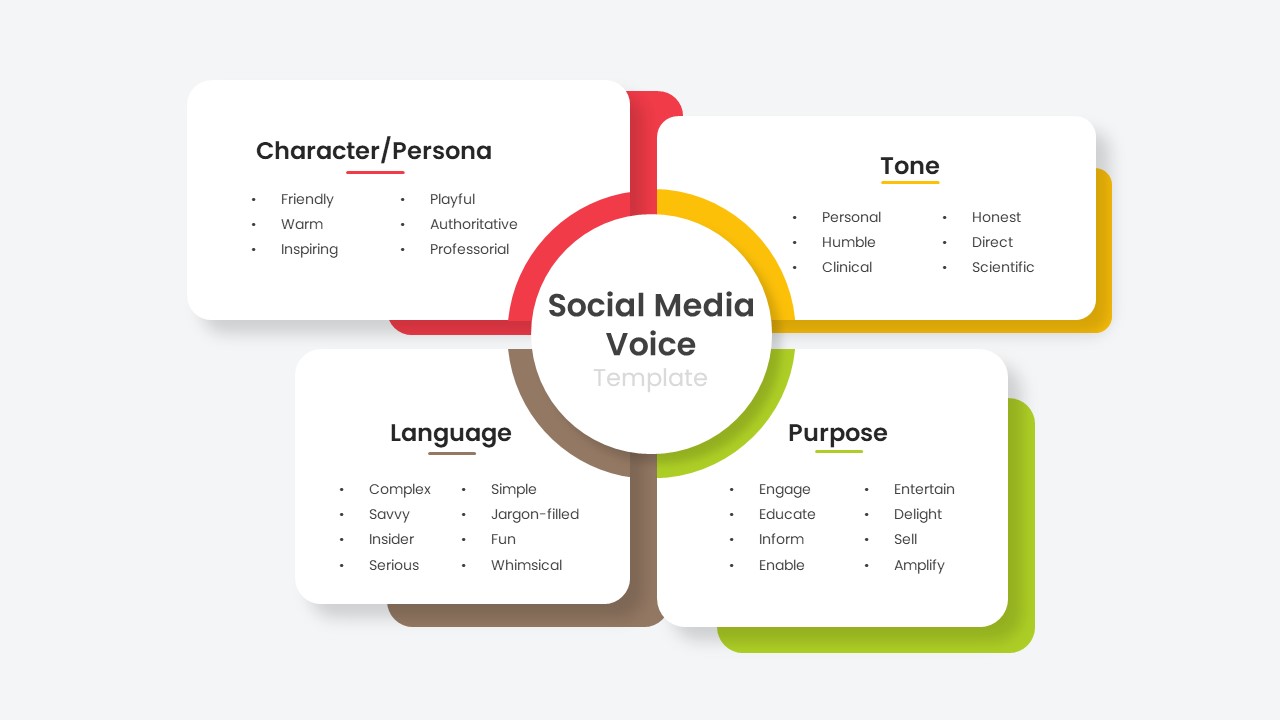
Social Media Voice Template for PowerPoint & Google Slides
Customer Experience
Social Media Hub-and-Spoke Infographics Template for PowerPoint & Google Slides
Circular
Social Media Analysis Metrics Slide Deck Template for PowerPoint & Google Slides
Digital Marketing
Social Media Statistics 2023 Dashboard Template for PowerPoint & Google Slides
Comparison
Social Media Report Presentation Template for PowerPoint & Google Slides
Digital Marketing
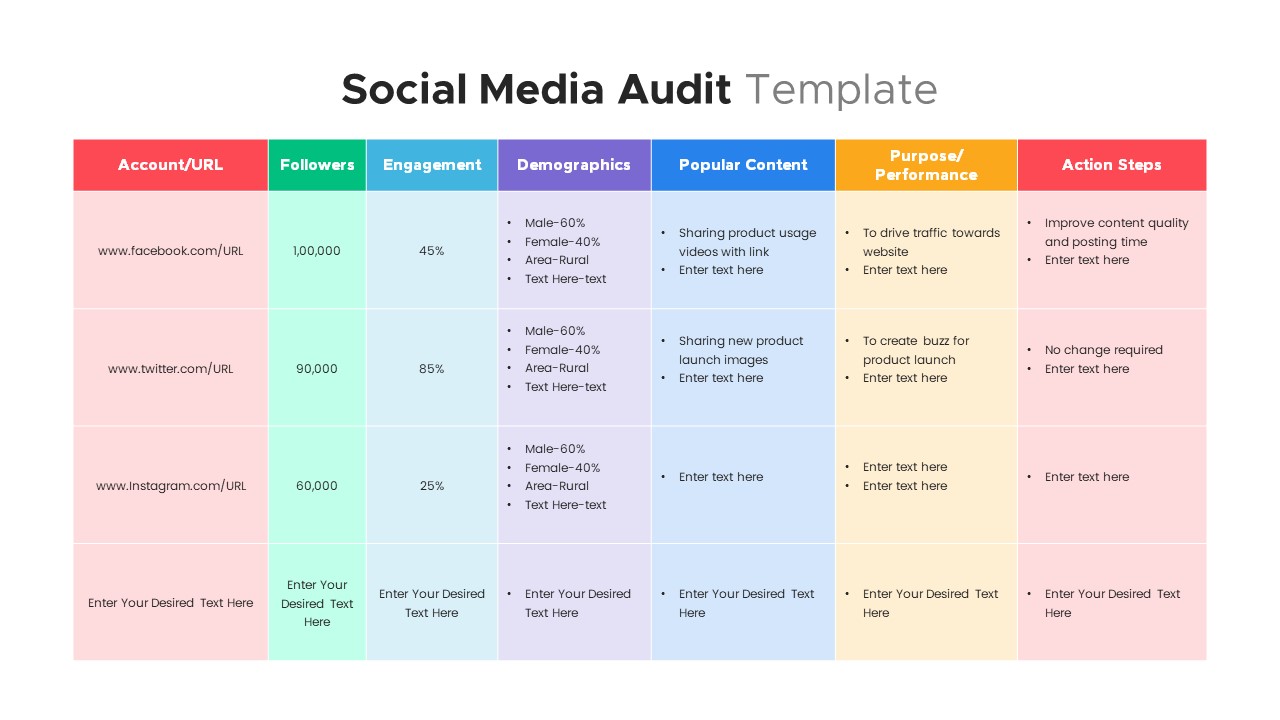
Comprehensive Social Media Audit Template for PowerPoint & Google Slides
Digital Marketing
Modern Social Media Timeline Roadmap Template for PowerPoint & Google Slides
Timeline

Social Media Marketing Presentation Template for PowerPoint & Google Slides
Decks
Social Media Presentation Template for PowerPoint & Google Slides
Pitch Deck
Social Media Marketing Overview Template for PowerPoint & Google Slides
Advertising
Social Media Timeline template for PowerPoint & Google Slides
Timeline
Social Media Recruiting Strategy template for PowerPoint & Google Slides
Business
Modern Nine Circle Network Diagram Template for PowerPoint & Google Slides
Circular
Interactive Connected Network Diagram Template for PowerPoint & Google Slides
Process
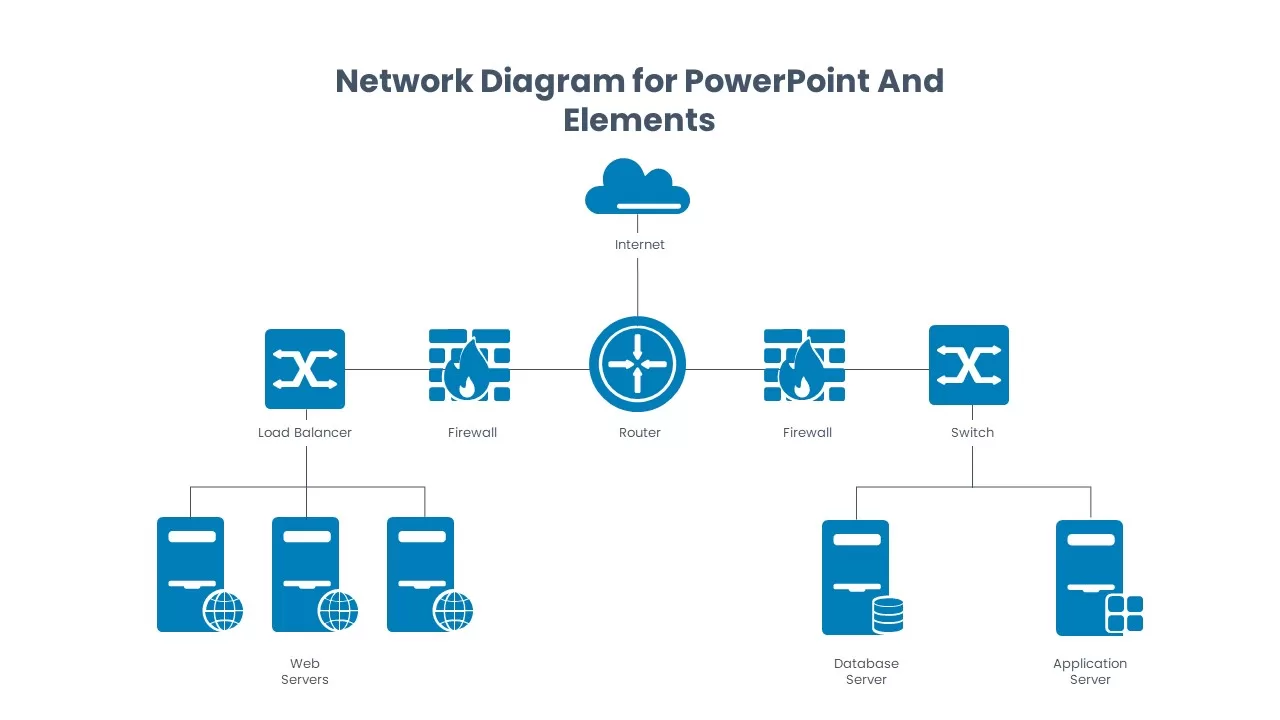
Network Diagram Elements and Icons Pack Template for PowerPoint & Google Slides
Information Technology
Free Big Data Network Visualization Template for PowerPoint & Google Slides
Circular
Free
Quarterly Network Volume Analysis Template for PowerPoint & Google Slides
Business Report
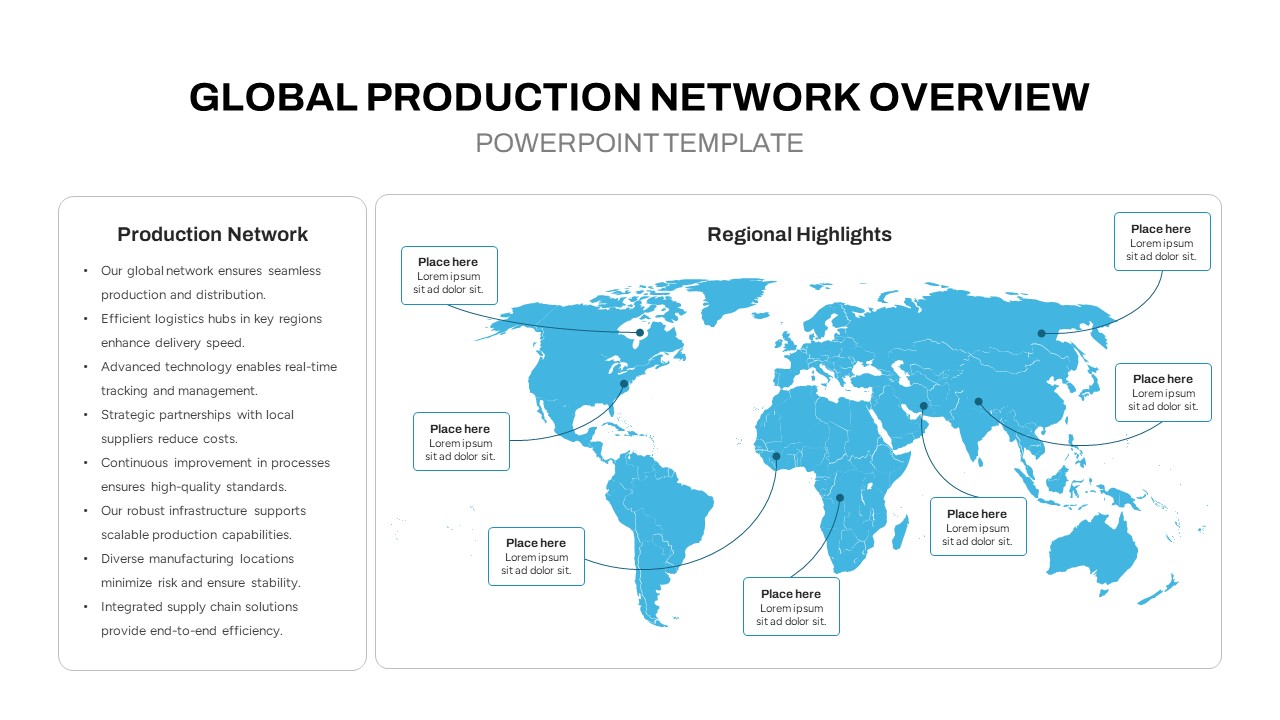
Global Production Network Overview Map Template for PowerPoint & Google Slides
World Maps
5Cs of Network Effect Circular Diagram Template for PowerPoint & Google Slides
Circular
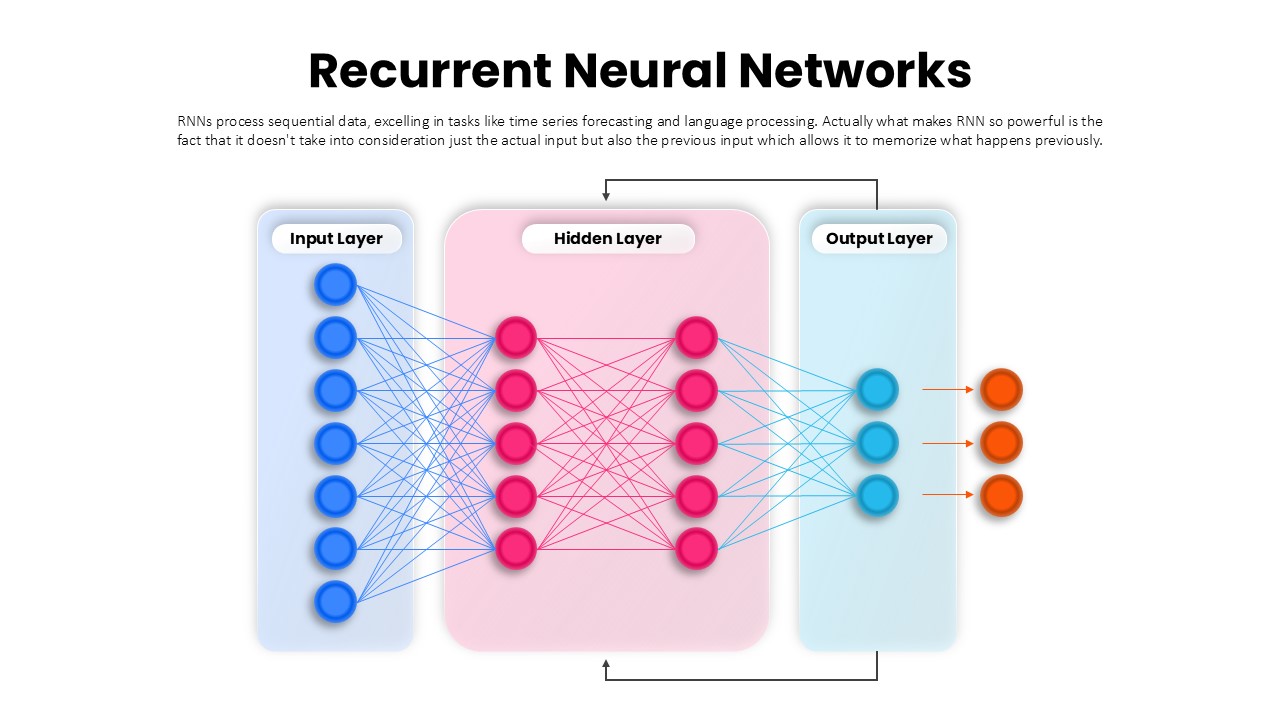
Recurrent Neural Network Architecture Template for PowerPoint & Google Slides
AI
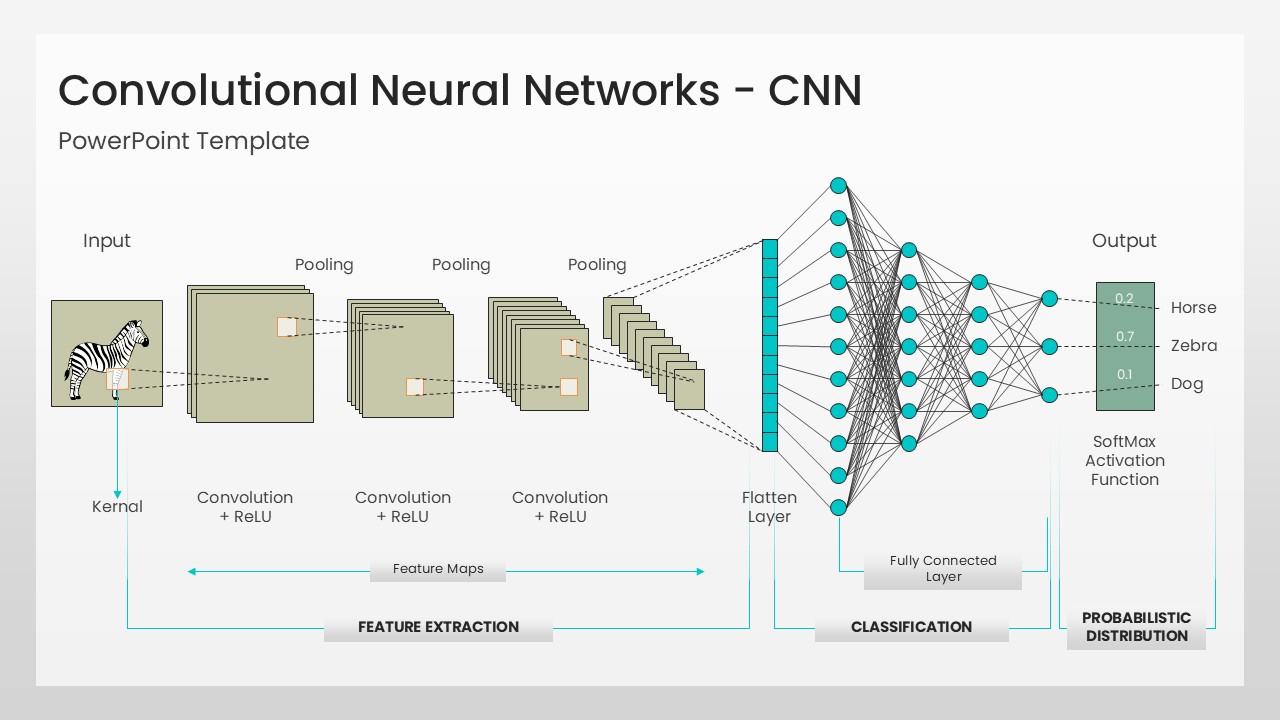
Convolutional Neural Network Architecture Template for PowerPoint & Google Slides
Machine Learning
Network Effects Template for PowerPoint & Google Slides
Software Development
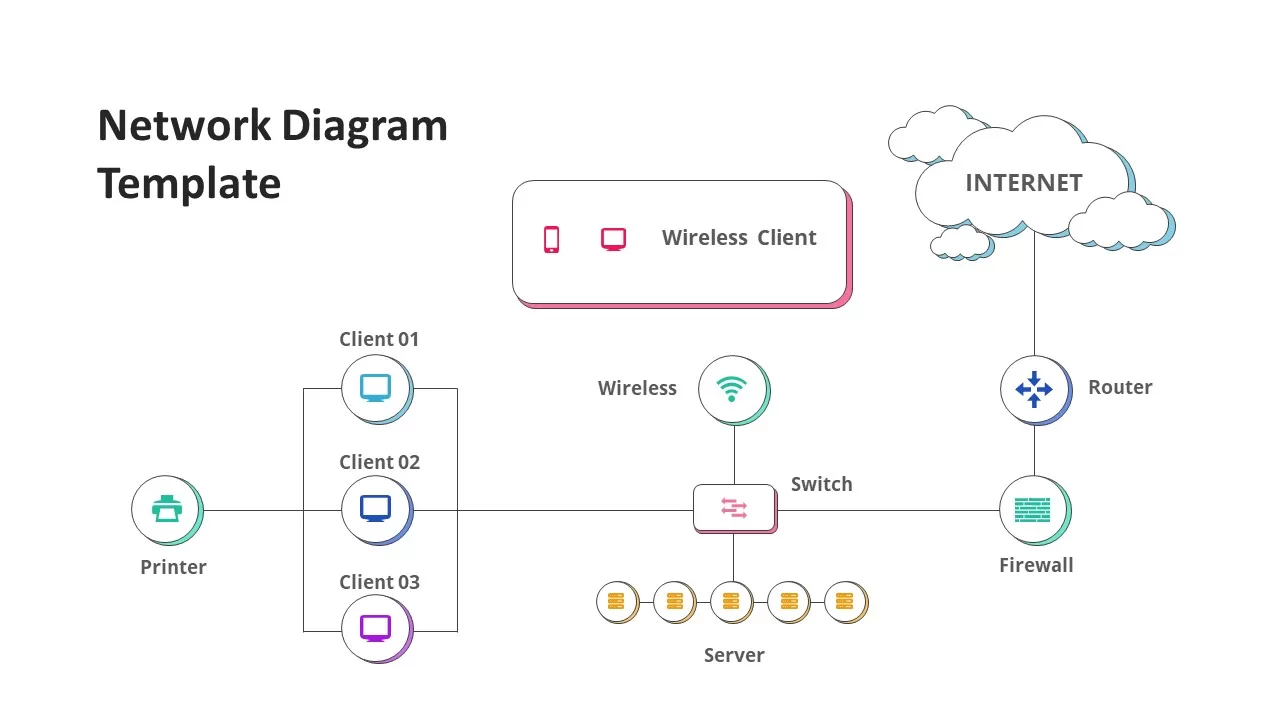
Network Diagram Infographics for PowerPoint & Google Slides
Technology
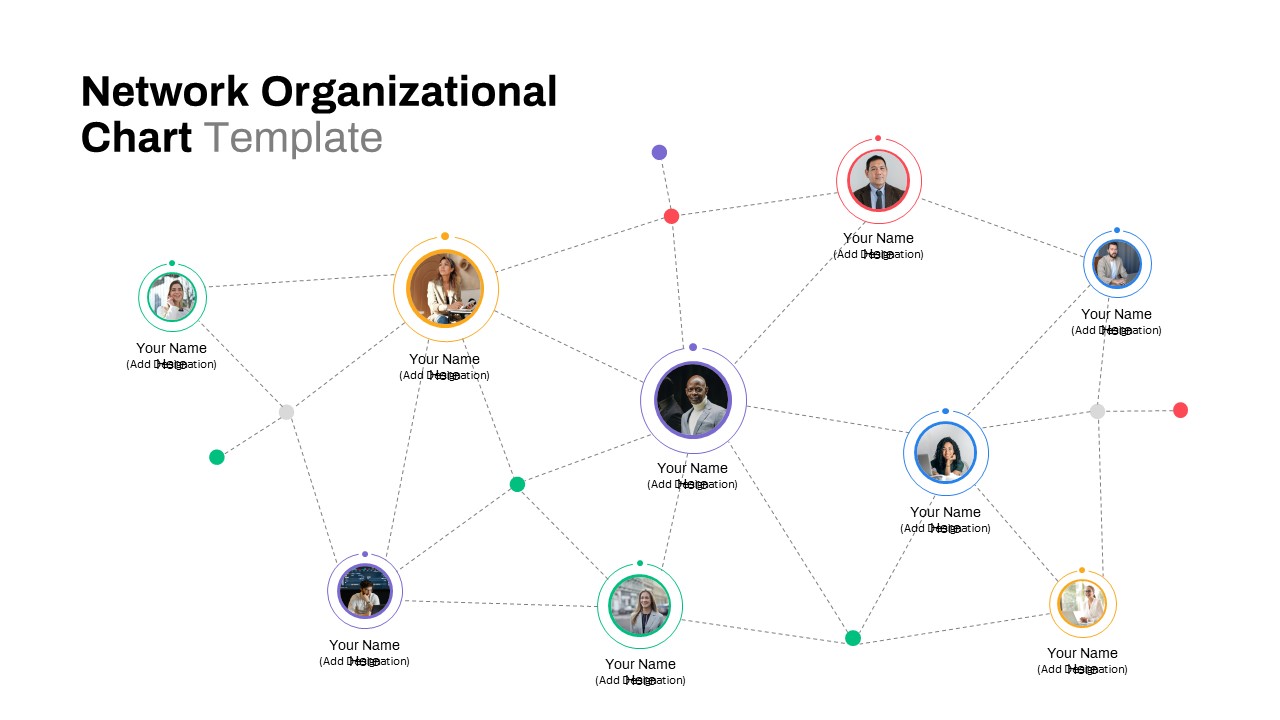
Network Organizational Chart for PowerPoint & Google Slides
Business
Cybersecurity Network Theme for PowerPoint & Google Slides
Information Technology
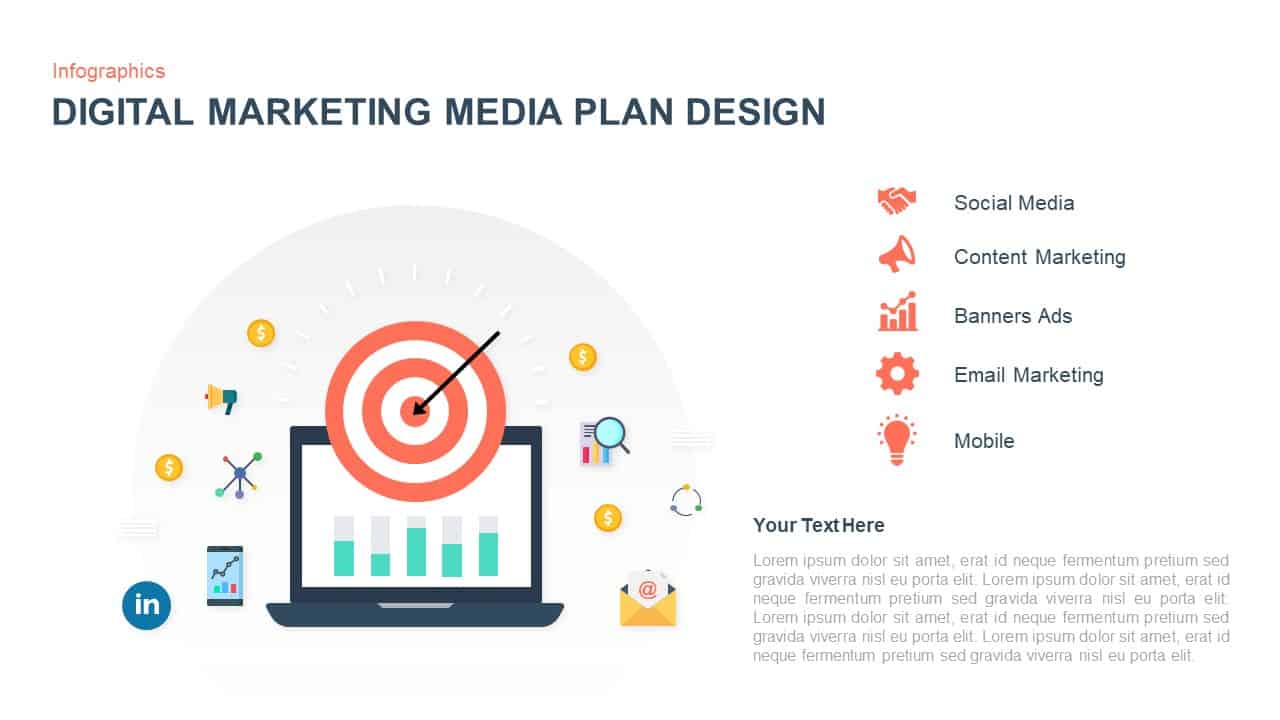
Digital Marketing Media Plan Infographic Template for PowerPoint & Google Slides
Digital Marketing
Facebook Social Metrics Infographic Template for PowerPoint & Google Slides
Graphics
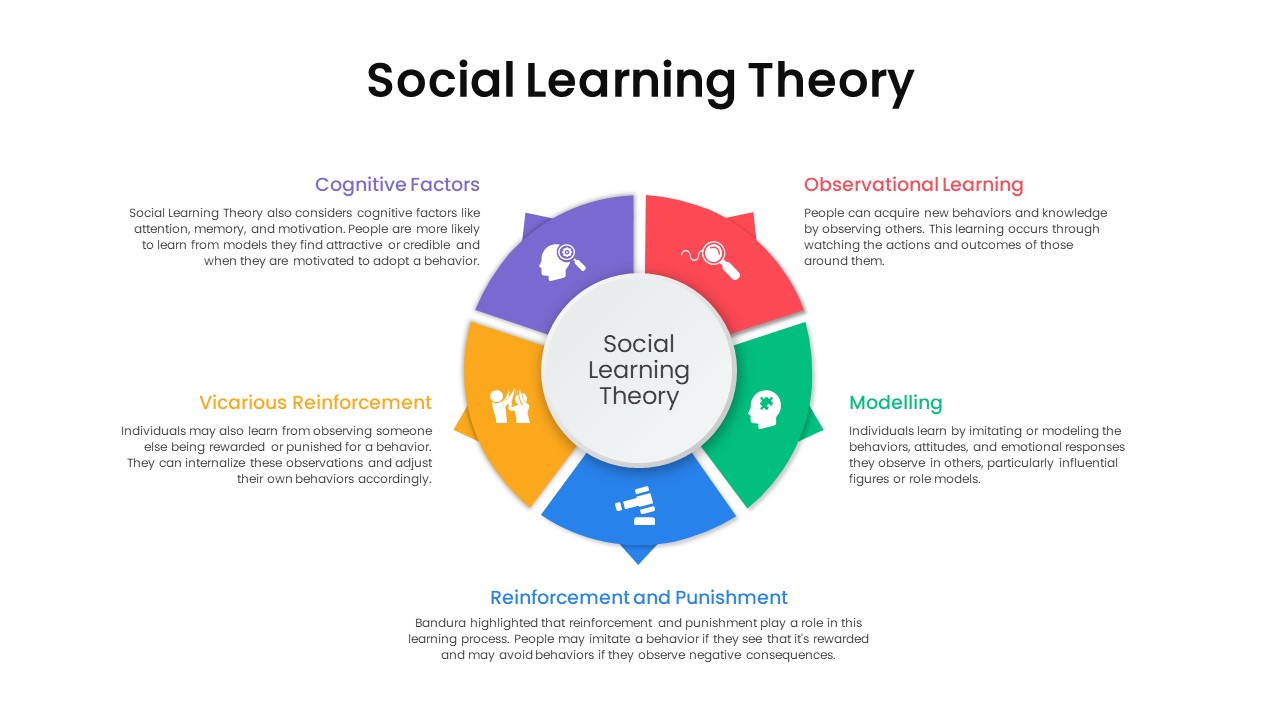
Social Learning Theory Infographic Template for PowerPoint & Google Slides
Circular

News Metaphor Media Communication Slide Template for PowerPoint & Google Slides
Business Report
Influencer Media Kit Company Profile Template for PowerPoint & Google Slides
Company Profile
Social Networking and Communication template for PowerPoint & Google Slides
Digital Marketing
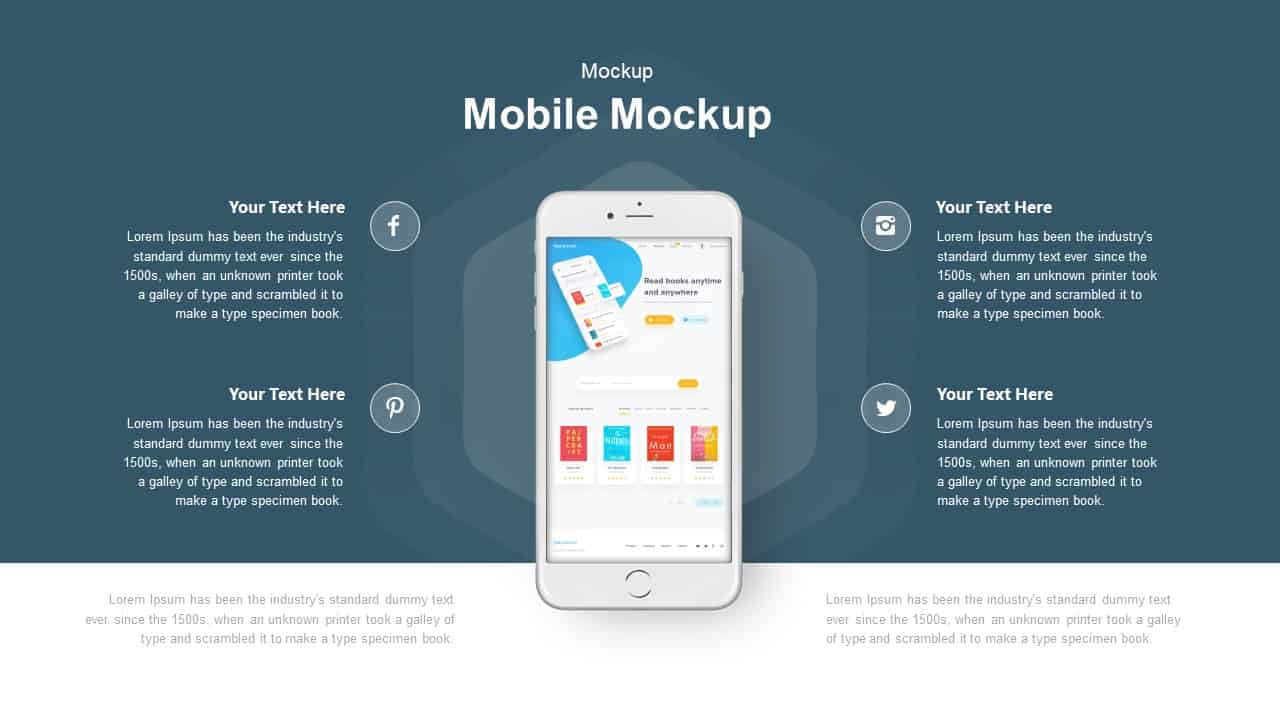
Mobile Mockup with Social Callouts Template for PowerPoint & Google Slides
Software Development
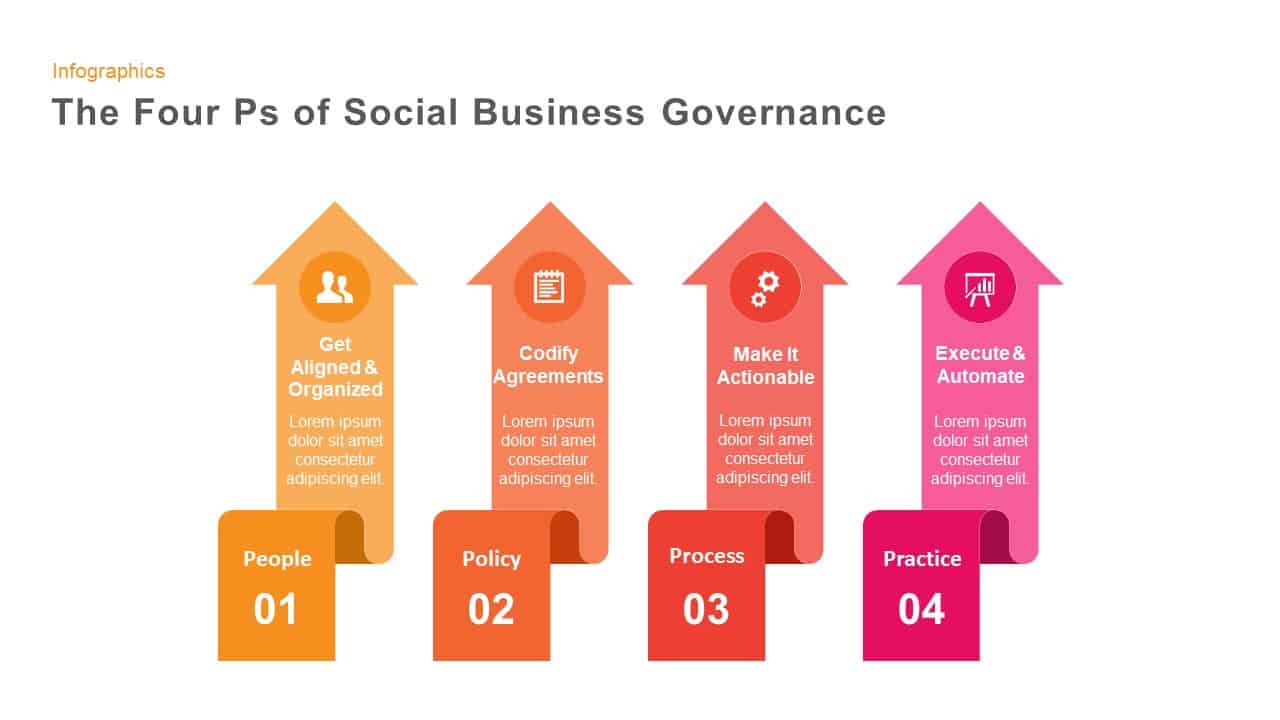
Four Ps of Social Business Governance template for PowerPoint & Google Slides
Business Strategy
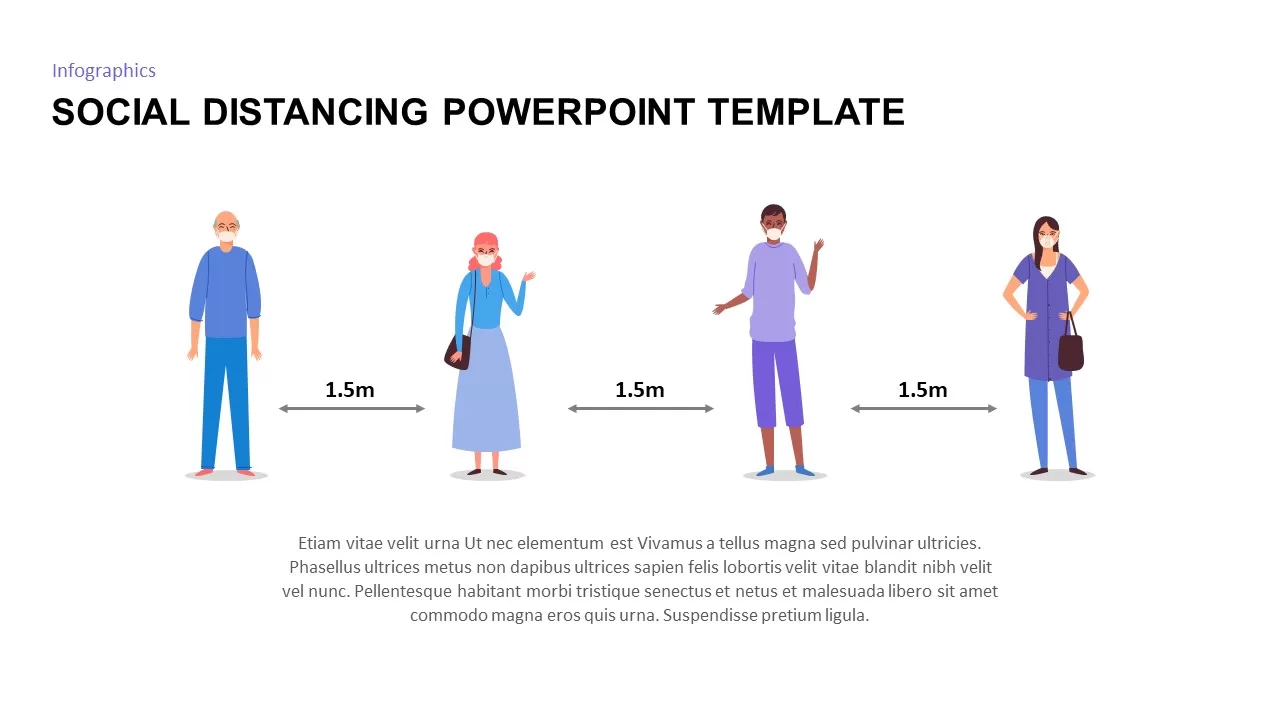
Social Distancing PowerPoint & Google Slides Template
Business Strategy
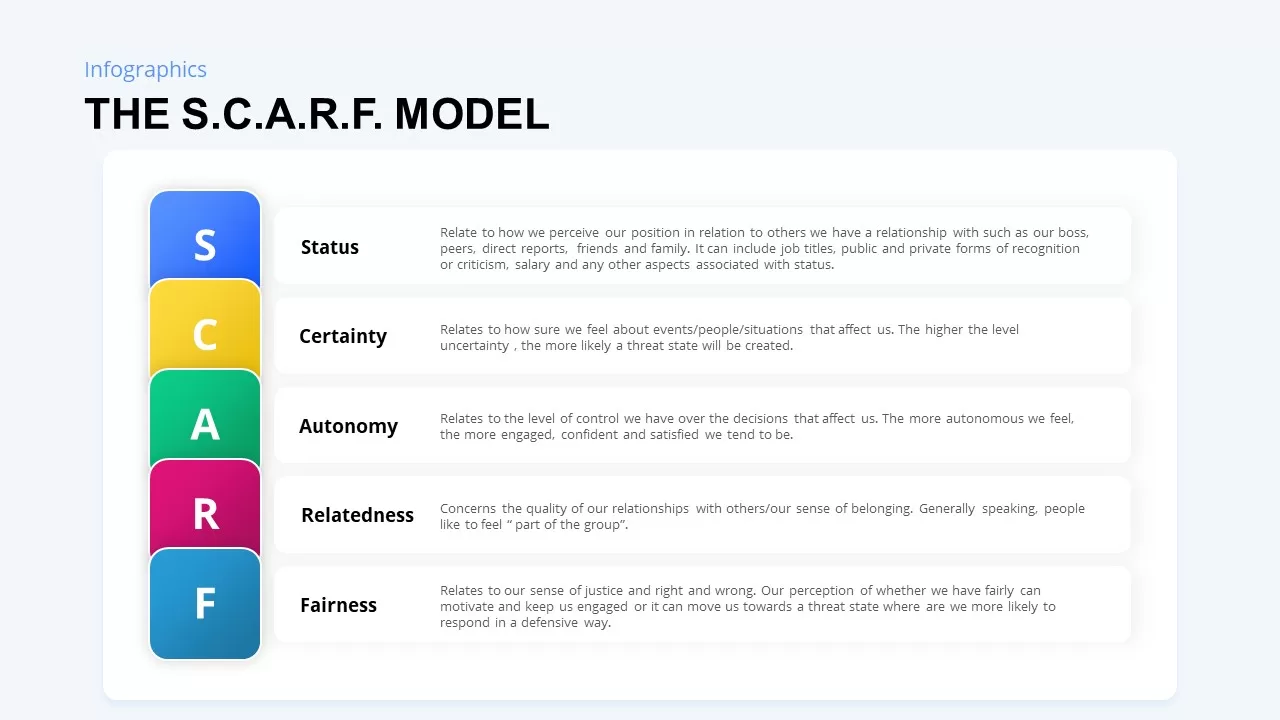
SCARF Model Social Threats & Rewards Template for PowerPoint & Google Slides
Business Strategy
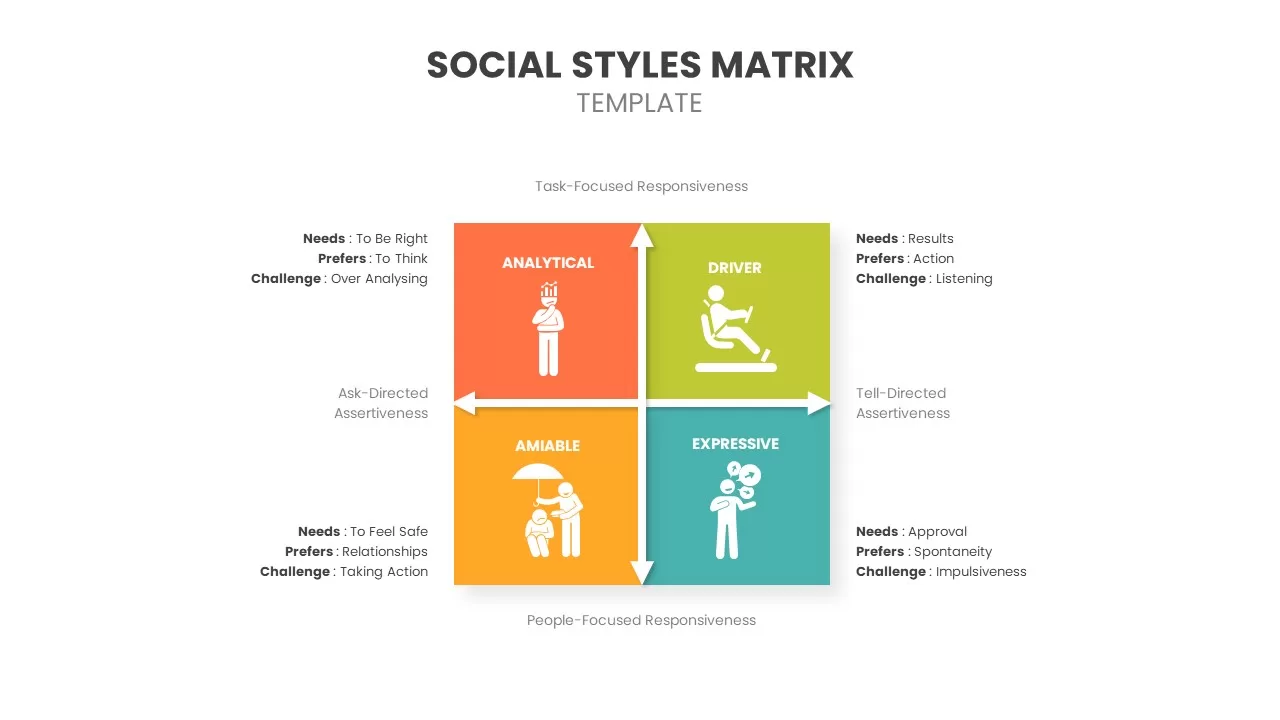
Social Styles Matrix Template for PowerPoint & Google Slides
Business
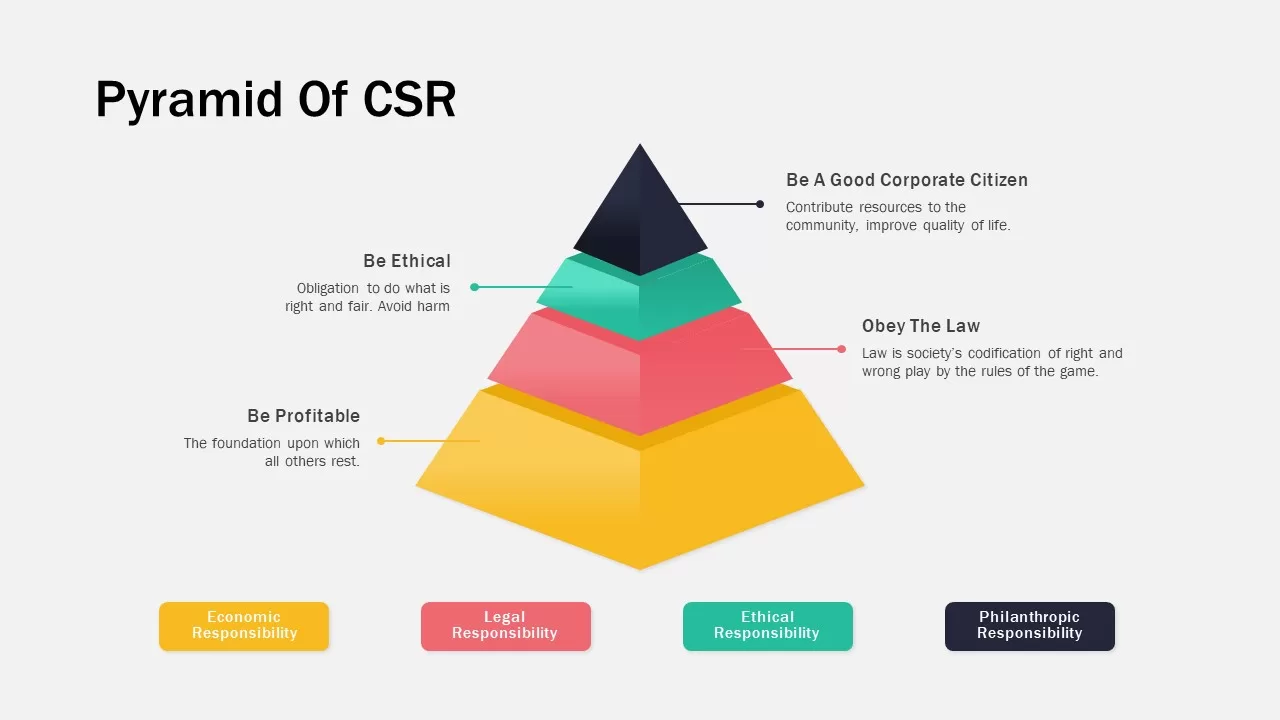
Corporate Social Responsibility Pyramid Template for PowerPoint & Google Slides
Pyramid
Corporate Social Responsibility Strategy Template for PowerPoint & Google Slides
Company Profile
Free Comprehensive Social Work Presentation Template for PowerPoint & Google Slides
Pitch Deck
Free
Free Nonprofit Charity Social Impact Deck Template for PowerPoint & Google Slides
Pitch Deck
Free
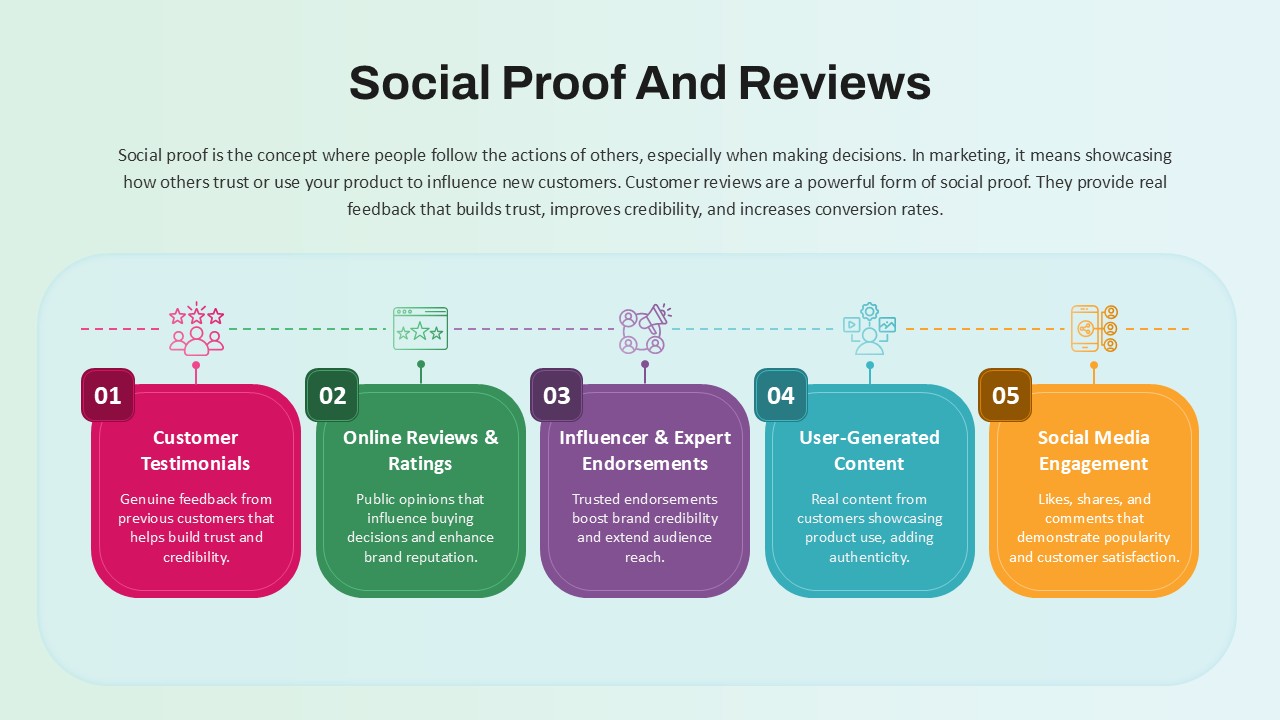
Social Proof and Reviews in Marketing template for PowerPoint & Google Slides
Customer Journey
Google Ads Optimization & Performance Infographic Template for PowerPoint & Google Slides
Digital Marketing
SQ3R Study Strategy Infographic Slides Template for PowerPoint & Google Slides
Business Strategy
Six Double Diamond Infographic Slides Template for PowerPoint & Google Slides
Process
Sales Process Infographic Slides Pack Template for PowerPoint & Google Slides
Process
Casino/Poker Chips Infographic Slides template for PowerPoint & Google Slides
Business Strategy
Agenda Infographic Pack of 2 Slides Template for PowerPoint & Google Slides
Agenda
Quad Chart Infographic Pack of 8 Slides Template for PowerPoint & Google Slides
Comparison Chart
Four Options Infographic Slides Template for PowerPoint & Google Slides
Comparison
Game Plan Infographic Slides Pack Template for PowerPoint & Google Slides
Infographics
Teamwork PowerPoint Infographic Template for PowerPoint & Google Slides
Leadership
Kite Infographic PowerPoint Template for PowerPoint & Google Slides
Process
Cladogram Infographic Di Template for PowerPoint & Google Slides Template
Decision Tree
Workflow PowerPoint Process infographic for PowerPoint & Google Slides
Process
Free Infographic Deck PowerPoint Pack for PowerPoint & Google Slides
Infographics
Free
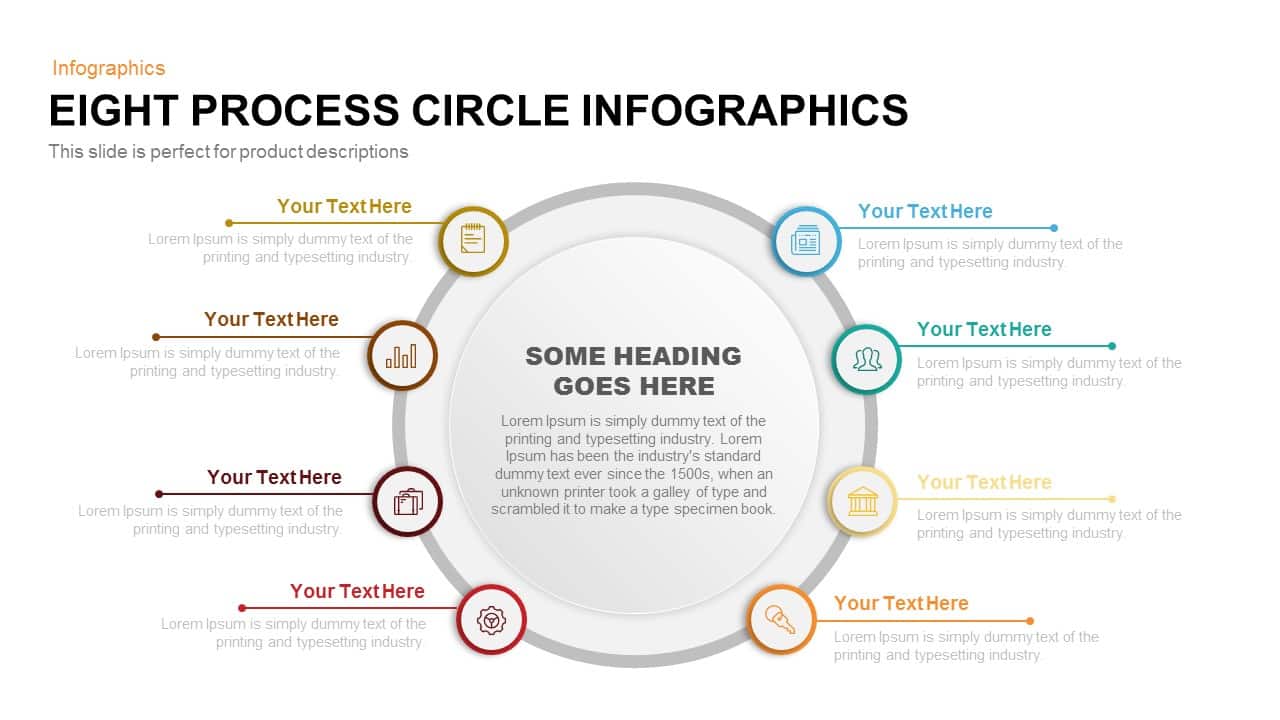
Eight-Stage Circular Process Infographic Template for PowerPoint & Google Slides
Circular
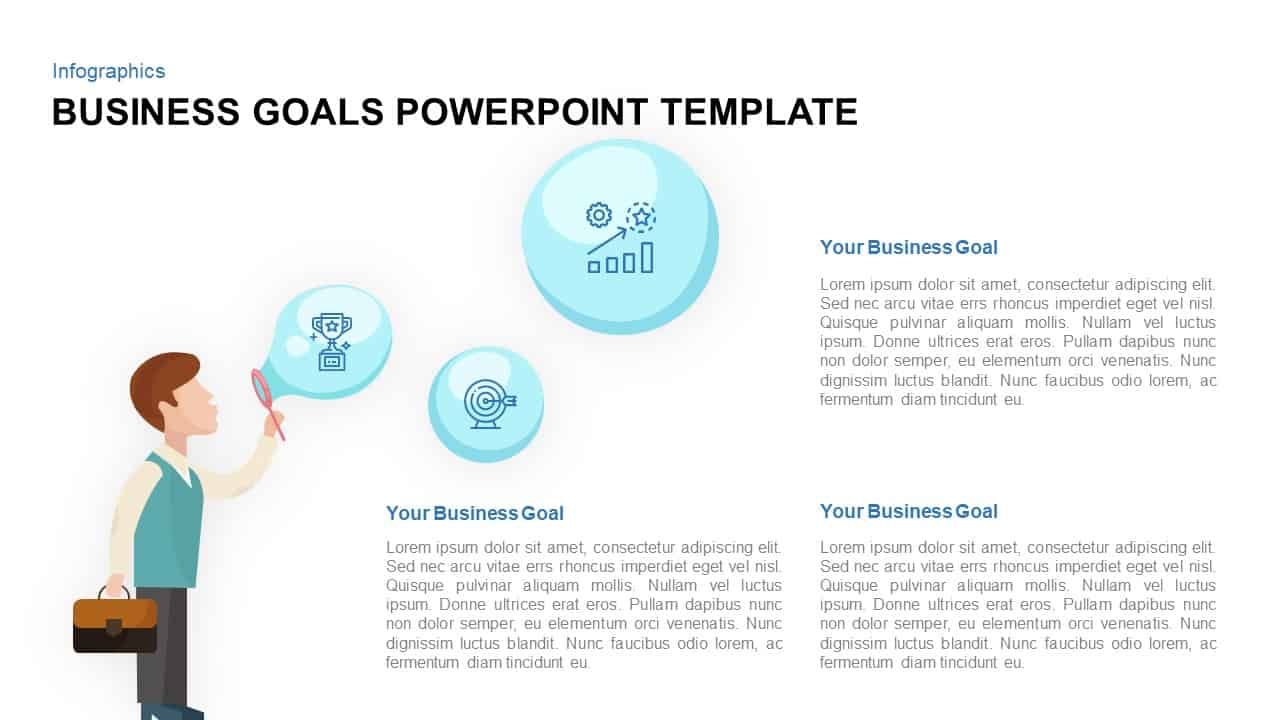
Business Goals Bubble Infographic Template for PowerPoint & Google Slides
Infographics
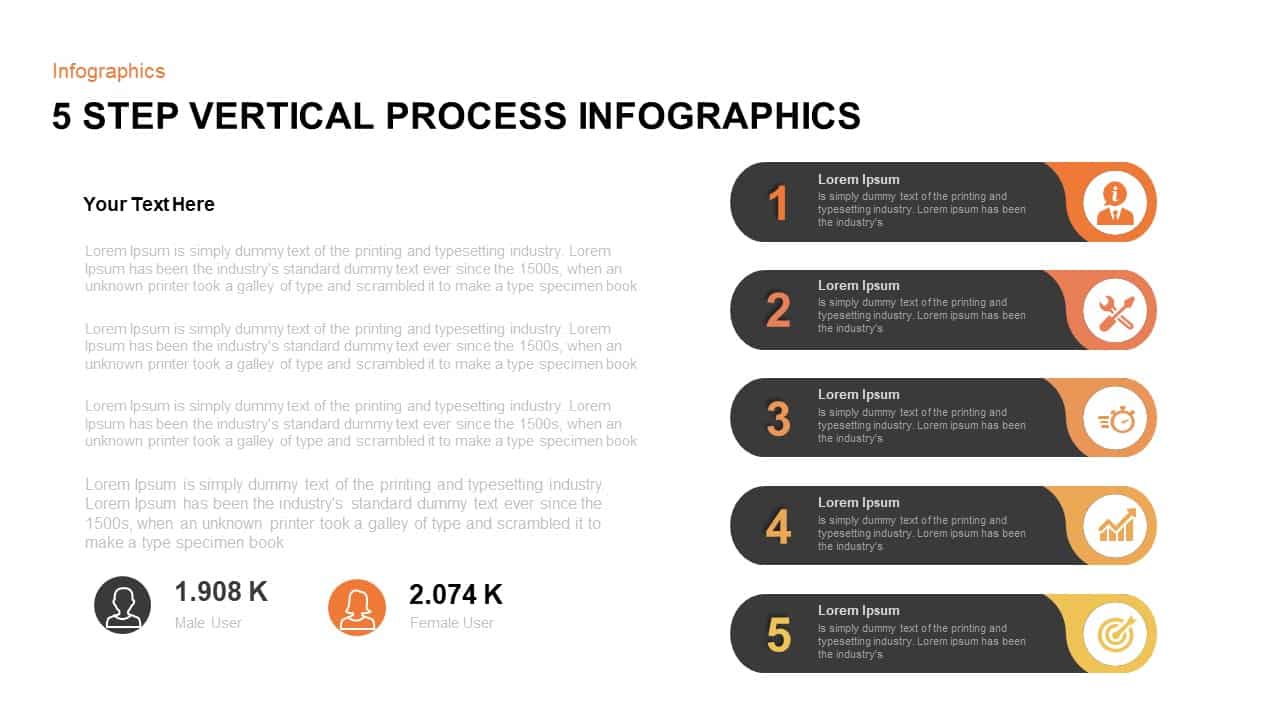
Five-Step Vertical Process Infographic Template for PowerPoint & Google Slides
Process
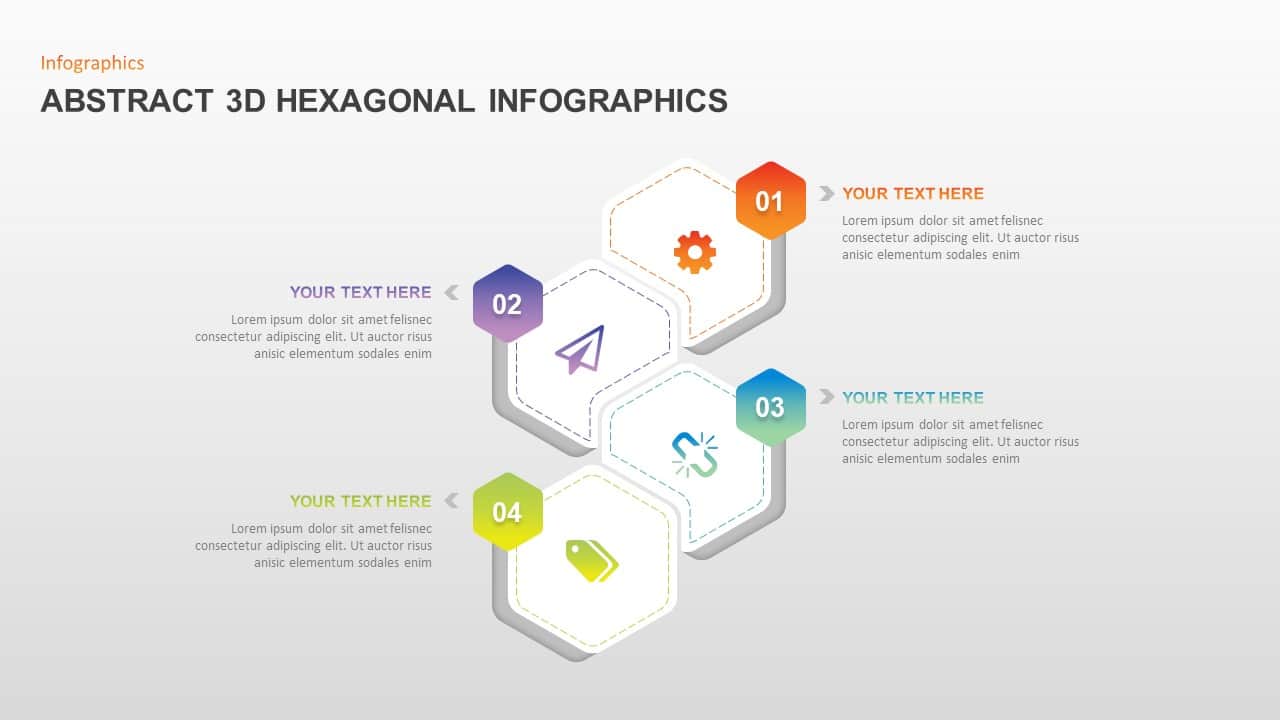
Abstract 3D Hexagonal 4-Step Infographic Template for PowerPoint & Google Slides
Process

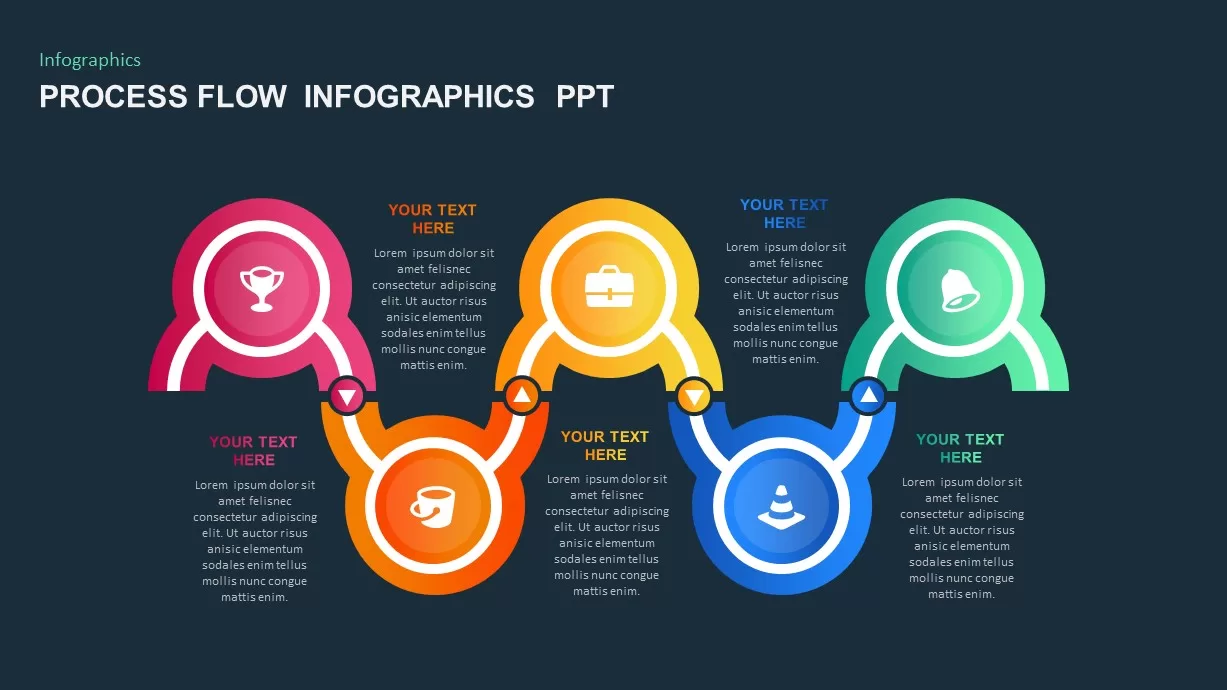
Five-Step Process Flow Infographic Template for PowerPoint & Google Slides
Process
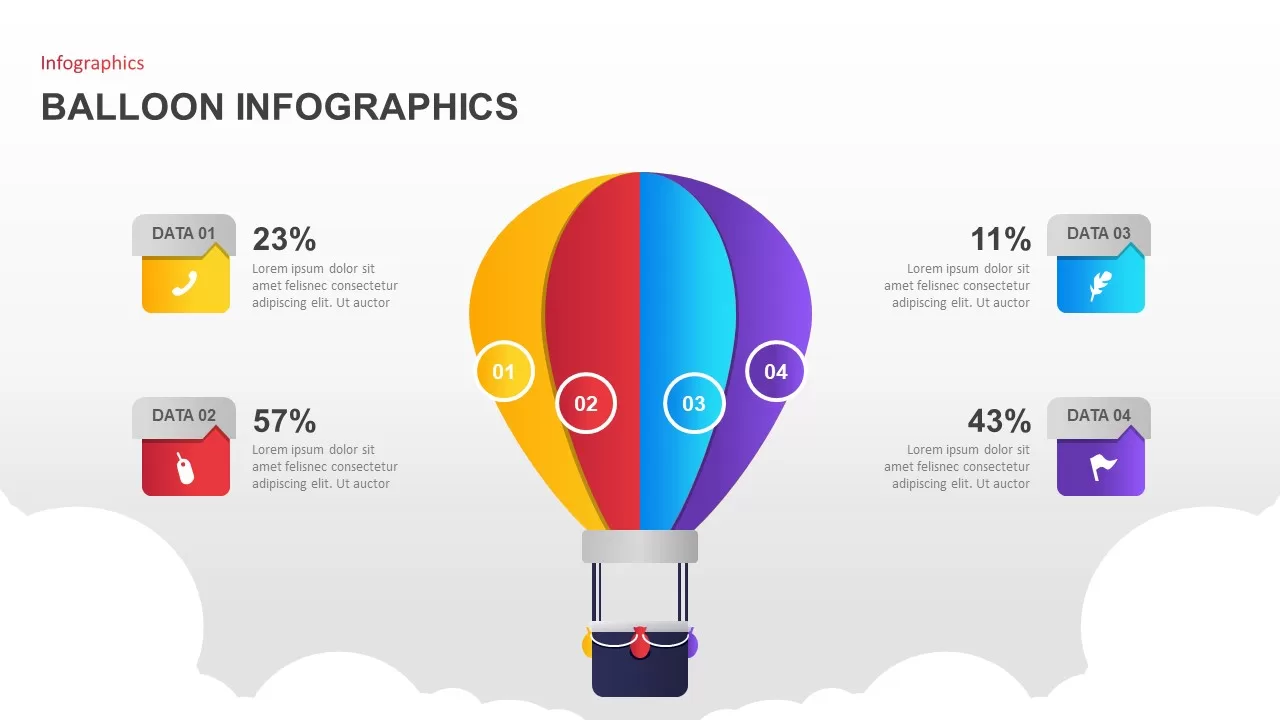
Balloon Infographic Template for PowerPoint & Google Slides
Infographics
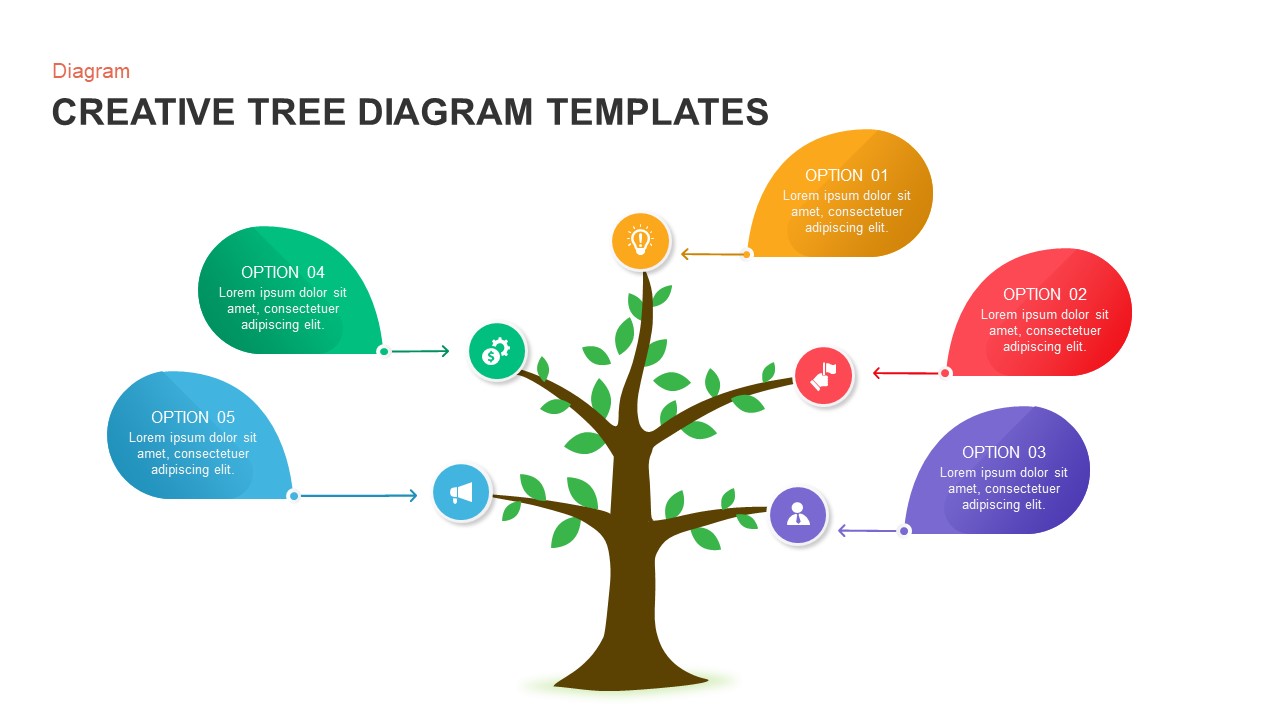
Creative Tree Diagram Infographic Template for PowerPoint & Google Slides
Decision Tree
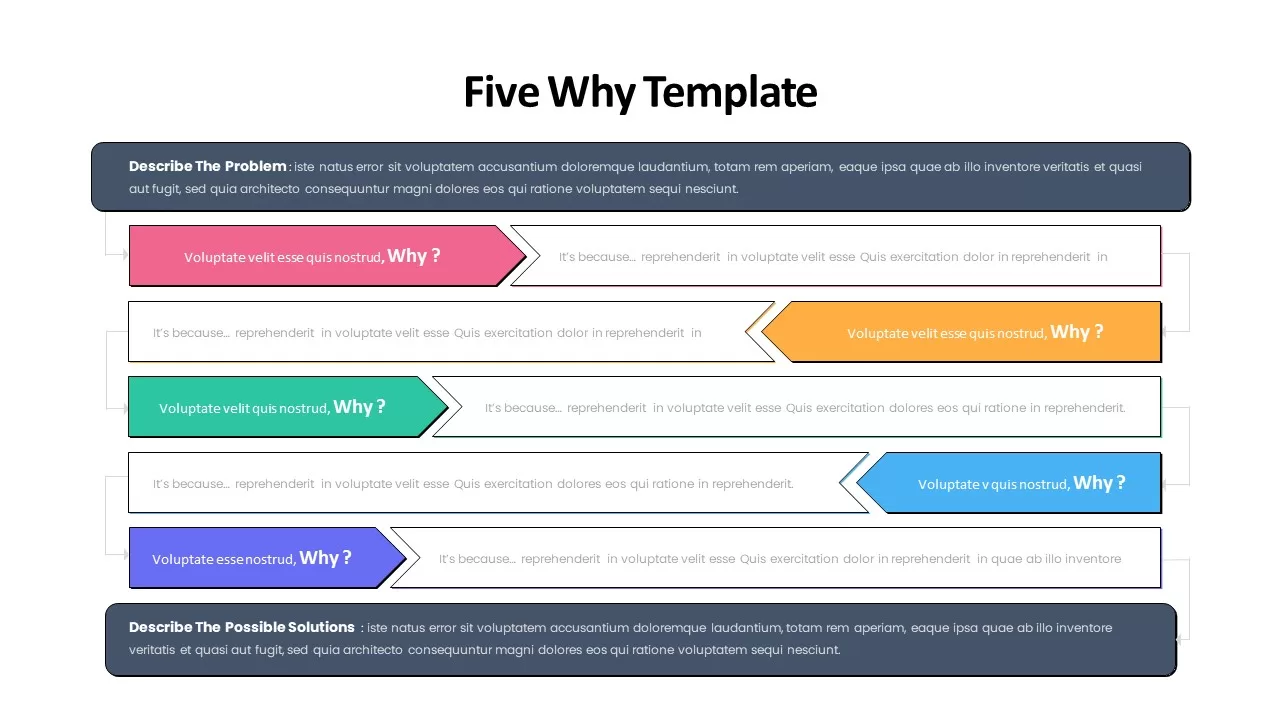
Five Whys Infographic template for PowerPoint & Google Slides
Business
Structured Mind Map Infographic Diagram Template for PowerPoint & Google Slides
Mind Maps
Four-Stage Circle Arrow Infographic Template for PowerPoint & Google Slides
Circular
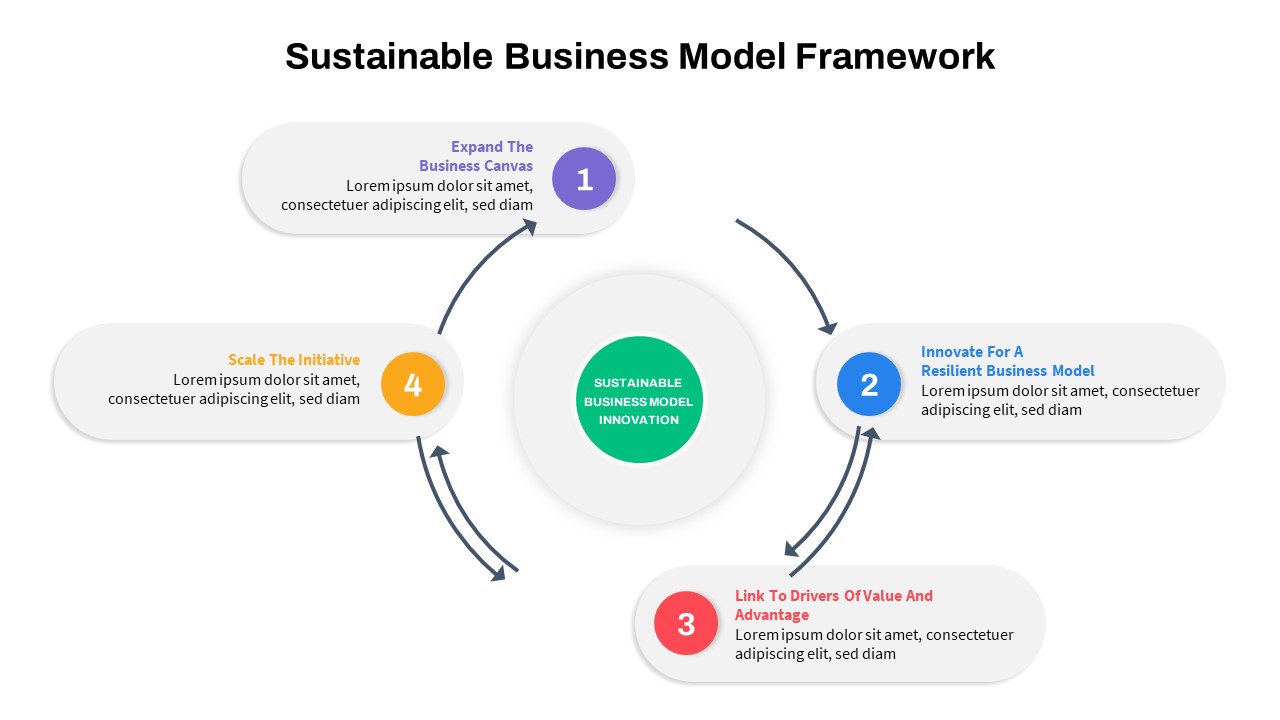
Sustainable Business Model Circular Infographic Template for PowerPoint & Google Slides
Business Strategy
Pricing Model Types Comparison Infographic Template for PowerPoint & Google Slides
Pitch Deck