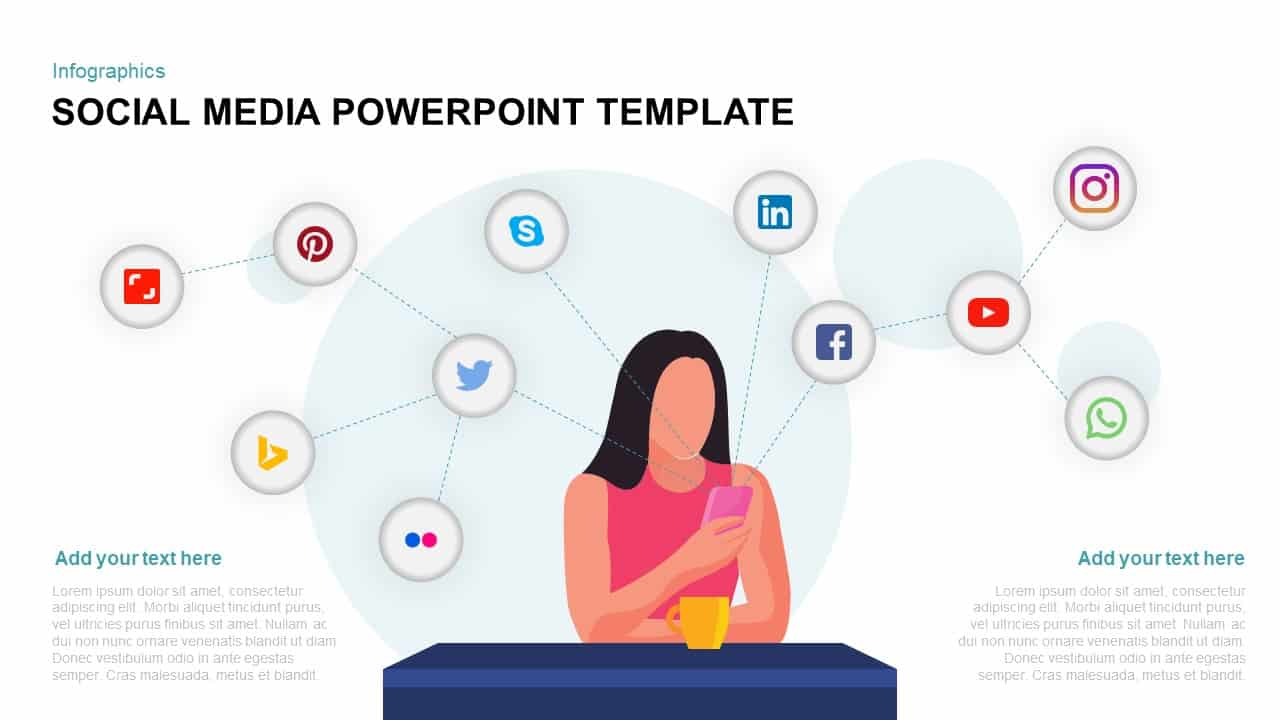
Social Media Metrics template for PowerPoint & Google Slides
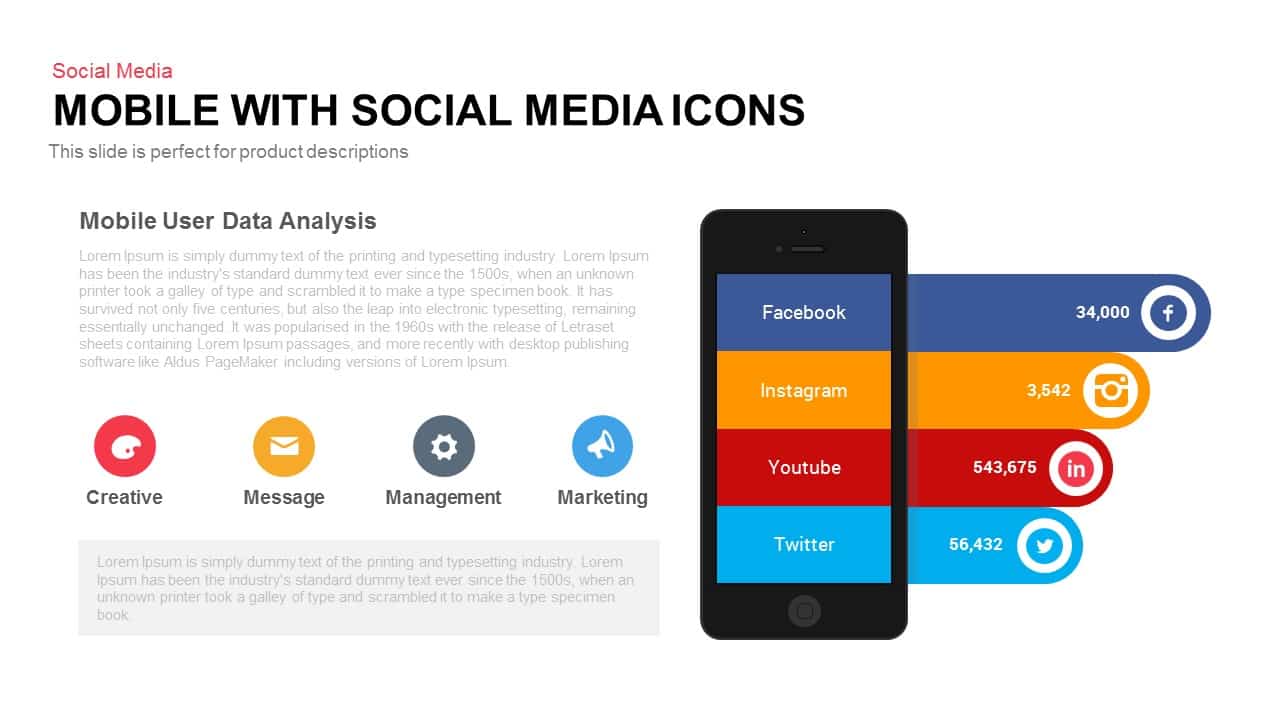
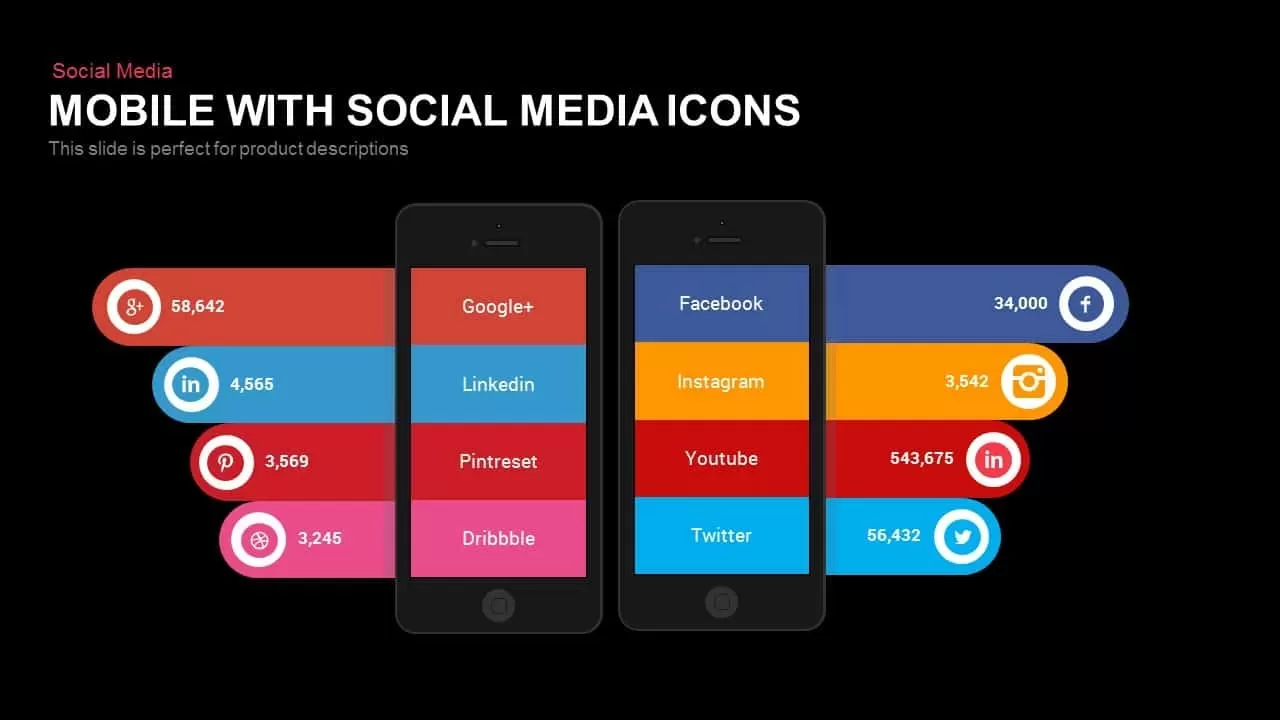

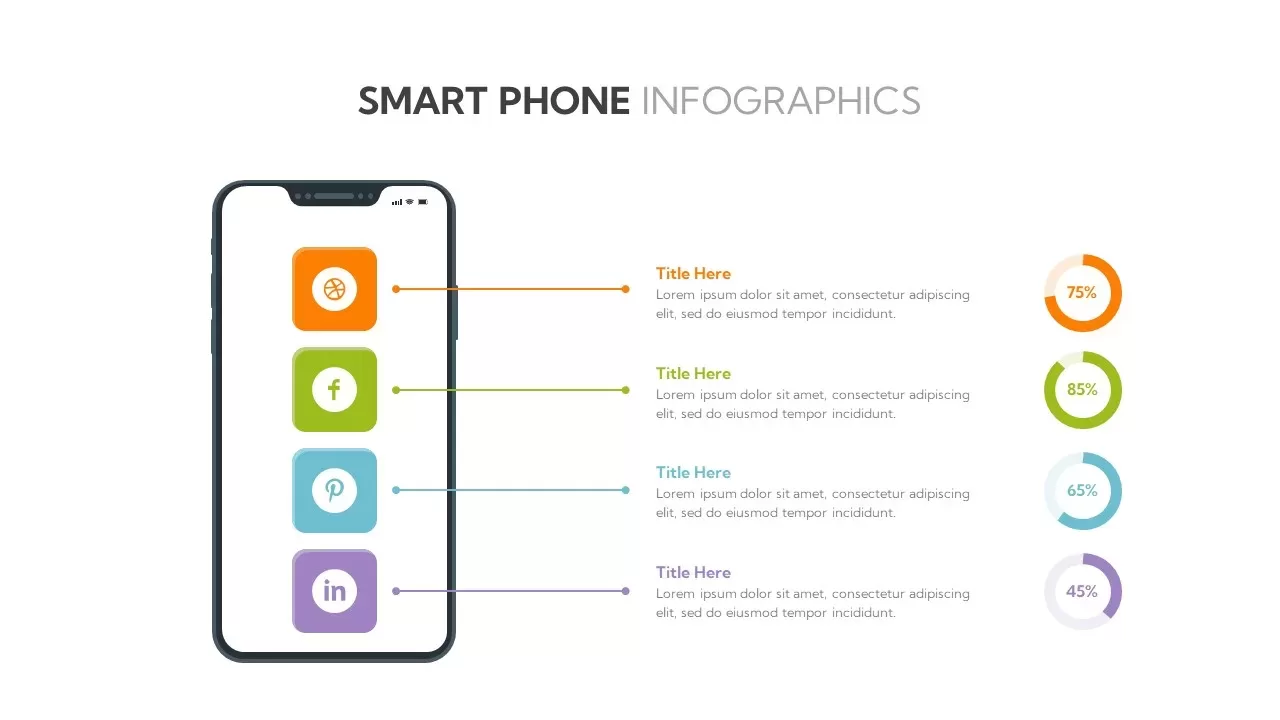
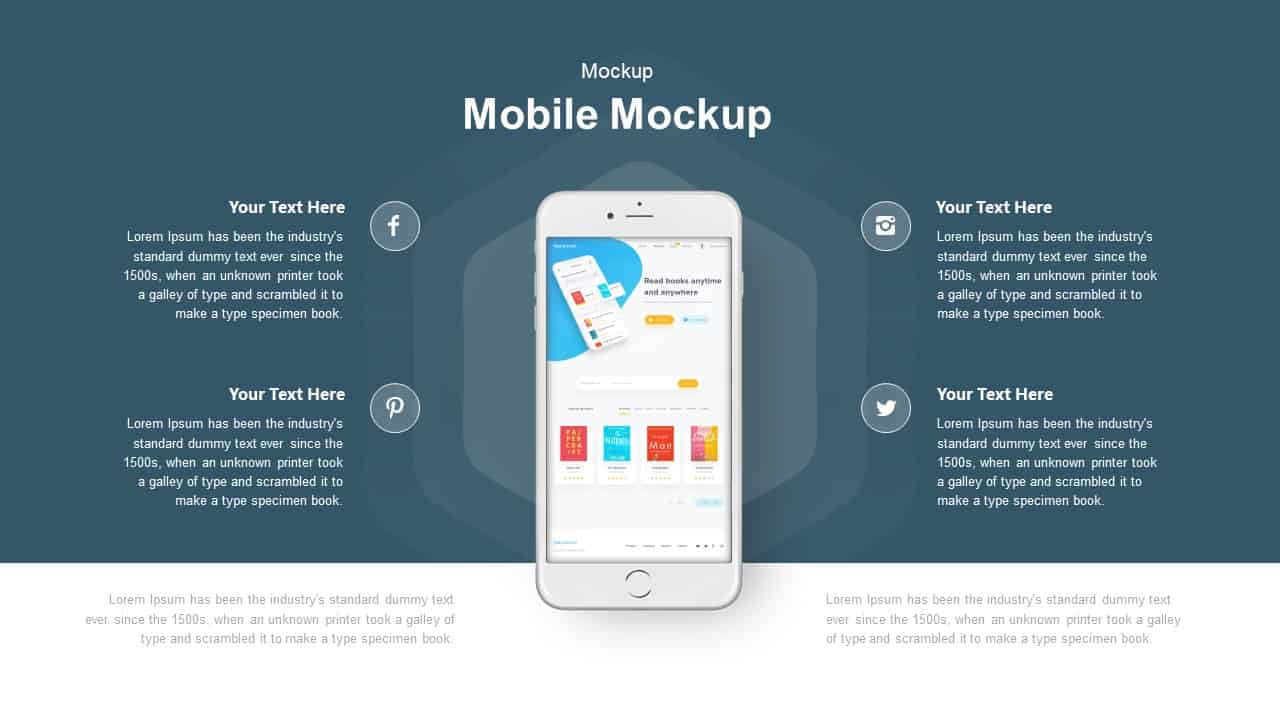
Use this mobile mockup slide to highlight social media performance across eight leading networks. Two smartphone silhouettes anchor horizontal bar charts that extend outward in signature platform hues—red for YouTube and Google+, blue for Facebook and LinkedIn, orange for Instagram, pink for Dribbble, and cyan for Twitter. Each bar features a crisp icon placeholder and follower or engagement count, delivering a clear visual comparison of audience size or activity. The search-perfect layout accommodates custom labels and metrics, while master slides, editable vector shapes, and placeholder text ensure effortless branding and seamless scaling between widescreen and standard formats. Built with fully editable vector icons, text placeholders, and master layouts, this template scales seamlessly across 16:9, 4:3, and custom aspect ratios while maintaining crisp, pixel-perfect clarity on HD screens and print outputs. All icons and vector shapes are easily replaceable, and the slide supports both PowerPoint and Google Slides without additional plug-ins. Users can adjust bar widths, icon sizes, and spacing to emphasize key data points or align with brand guidelines.
Who is it for
Social media managers, digital marketing teams, brand strategists, and product owners can leverage this slide to present audience insights, track campaign reach, or benchmark platform engagement at executive meetings. Agencies will find it invaluable when pitching performance reports to clients, while startups can compare community growth across channels. Educators and students working on marketing case studies will also benefit from its intuitive design and editable components.
Other Uses
Beyond social media, repurpose the mobile bar design to compare product ratings, feature adoption rates, app downloads, or customer satisfaction scores. Swap icons and hues to fit corporate KPIs, revenue projections, or channel analytics. The segmented bars can double as a visual roadmap, competitive feature matrix, or step-by-step process diagram—simply adjust labels, icons, and colors to suit your narrative.
Login to download this file

Item ID
SB00285
Related Templates

Social Media Analysis Metrics Slide Deck Template for PowerPoint & Google Slides
Digital Marketing
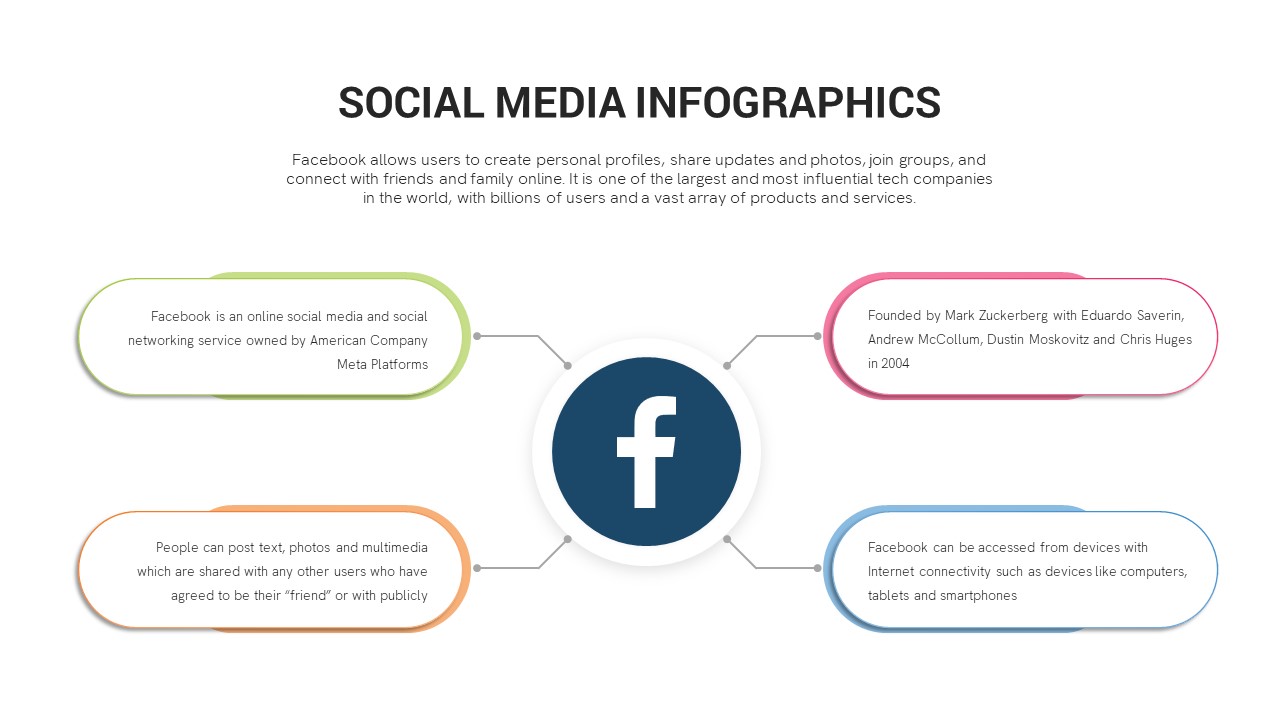
Facebook Social Metrics Infographic Template for PowerPoint & Google Slides
Graphics
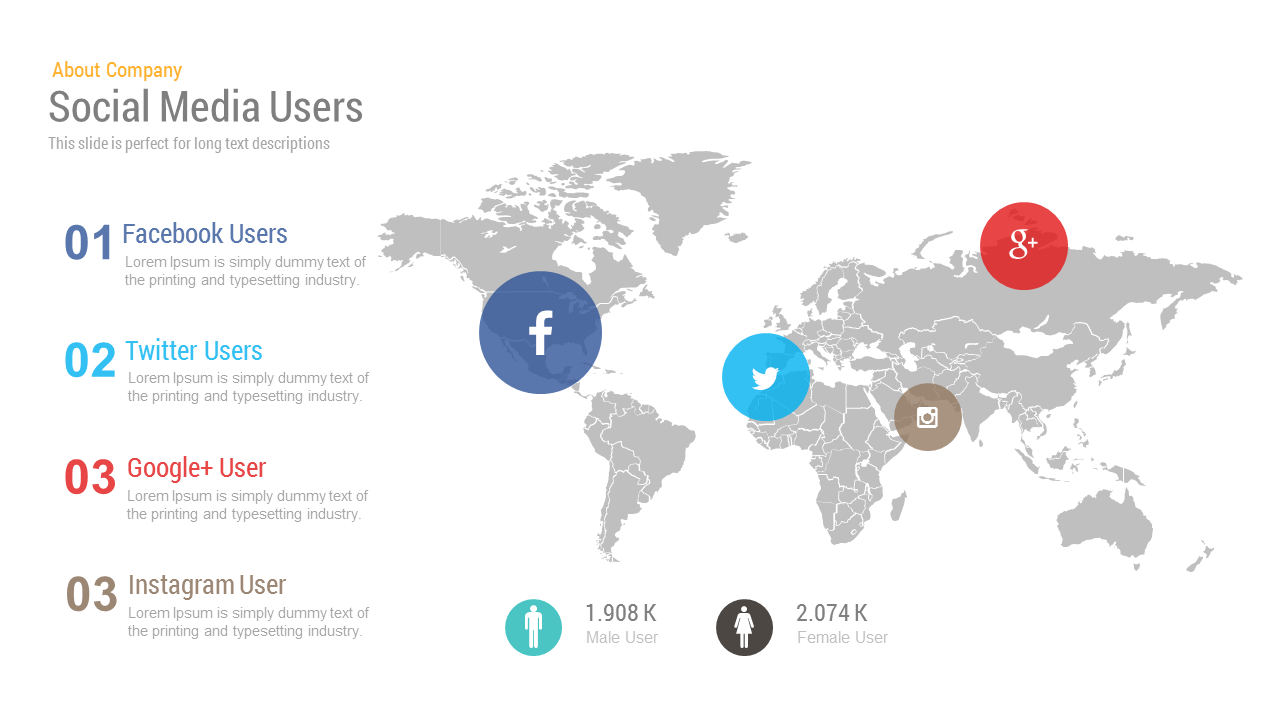
Free Social Media Users Map template for PowerPoint & Google Slides
World Maps
Free
Comprehensive Social Media Icons Slide Template for PowerPoint & Google Slides
Advertising

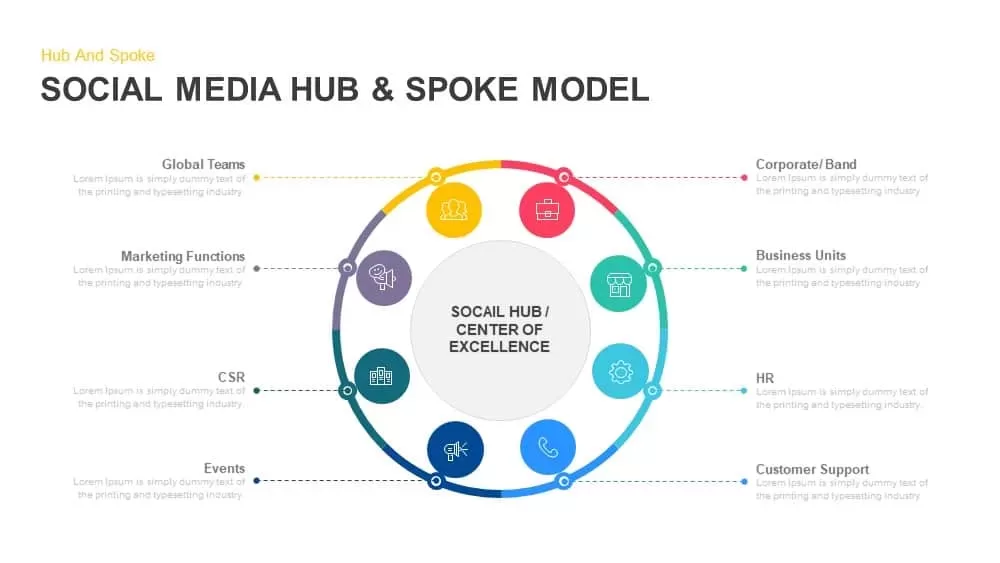
Social Media Hub & Spoke Model Template for PowerPoint & Google Slides
Process
Social Media Market Share Pie Charts Template for PowerPoint & Google Slides
Pie/Donut
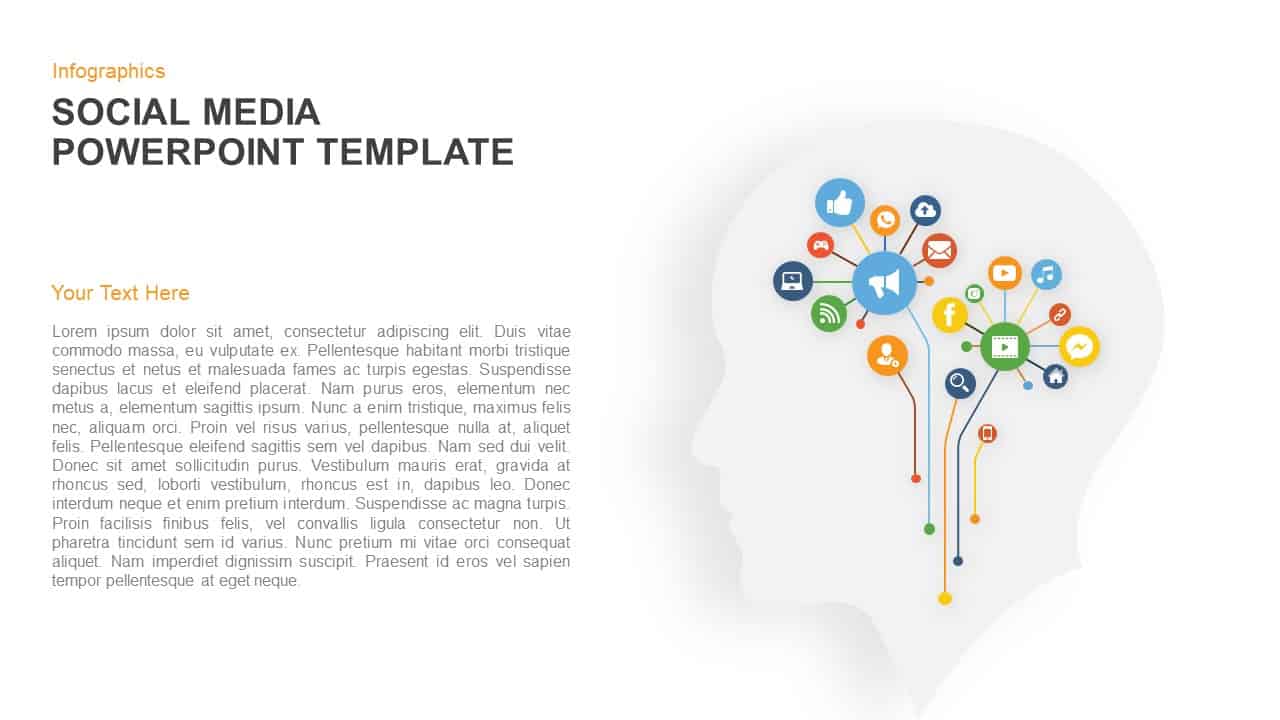
Social Media Mind Network Infographic Template for PowerPoint & Google Slides
Digital Marketing
Social Media Rocket Launch Infographic Template for PowerPoint & Google Slides
Marketing
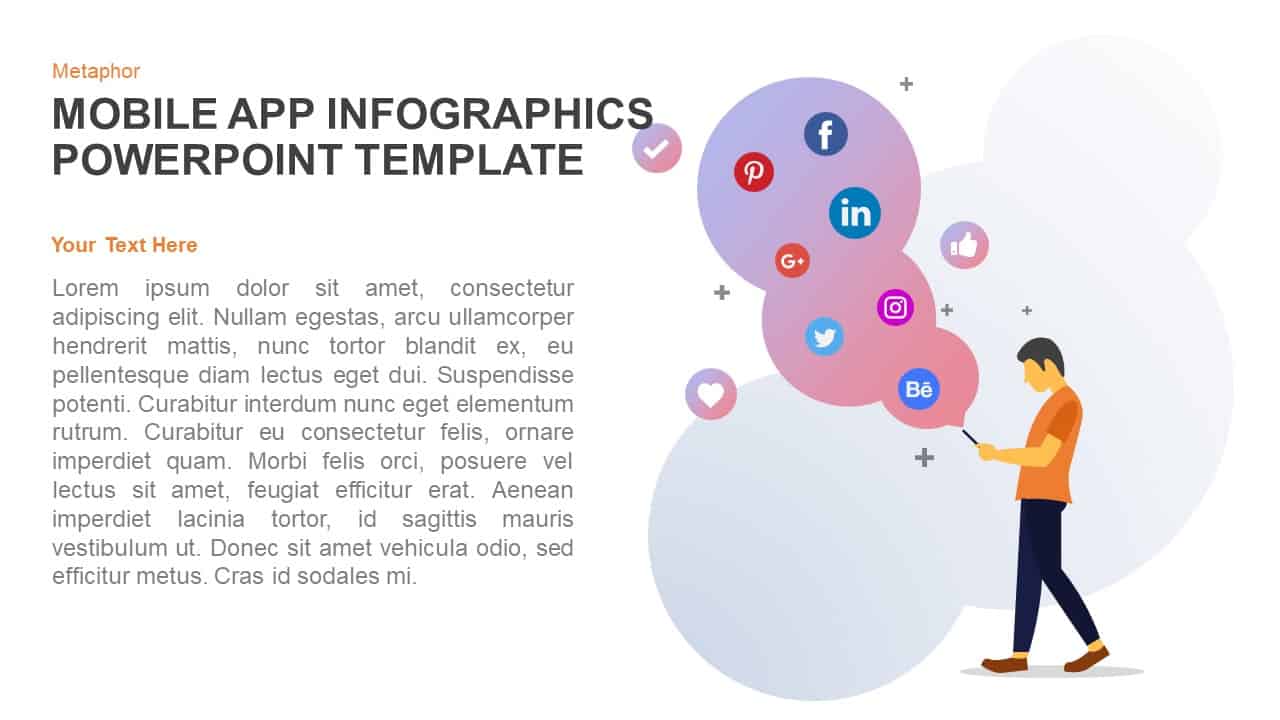
Mobile App Social Media Metaphor Template for PowerPoint & Google Slides
Infographics
Social Media Network Infographic Template for PowerPoint & Google Slides
Circular
Social Media Metaphor Illustration Template for PowerPoint & Google Slides
Digital Marketing
Social Media Performance Dashboard Template for PowerPoint & Google Slides
Bar/Column
Social Media Marketing Tool Template for PowerPoint & Google Slides
Digital Marketing
Free 3D Social Media Icons template for PowerPoint & Google Slides
Digital Marketing
Free
Social Media Smartphone Infographic Template for PowerPoint & Google Slides
Pie/Donut
Popular Social Media Comparison Grid Template for PowerPoint & Google Slides
Digital Marketing
Social Media Analytics Dashboard Template for PowerPoint & Google Slides
Digital Marketing

Social Media Marketing Agency Pitch Deck Template for PowerPoint & Google Slides
Pitch Deck
Social Media Community Network Slide Template for PowerPoint & Google Slides
Circular
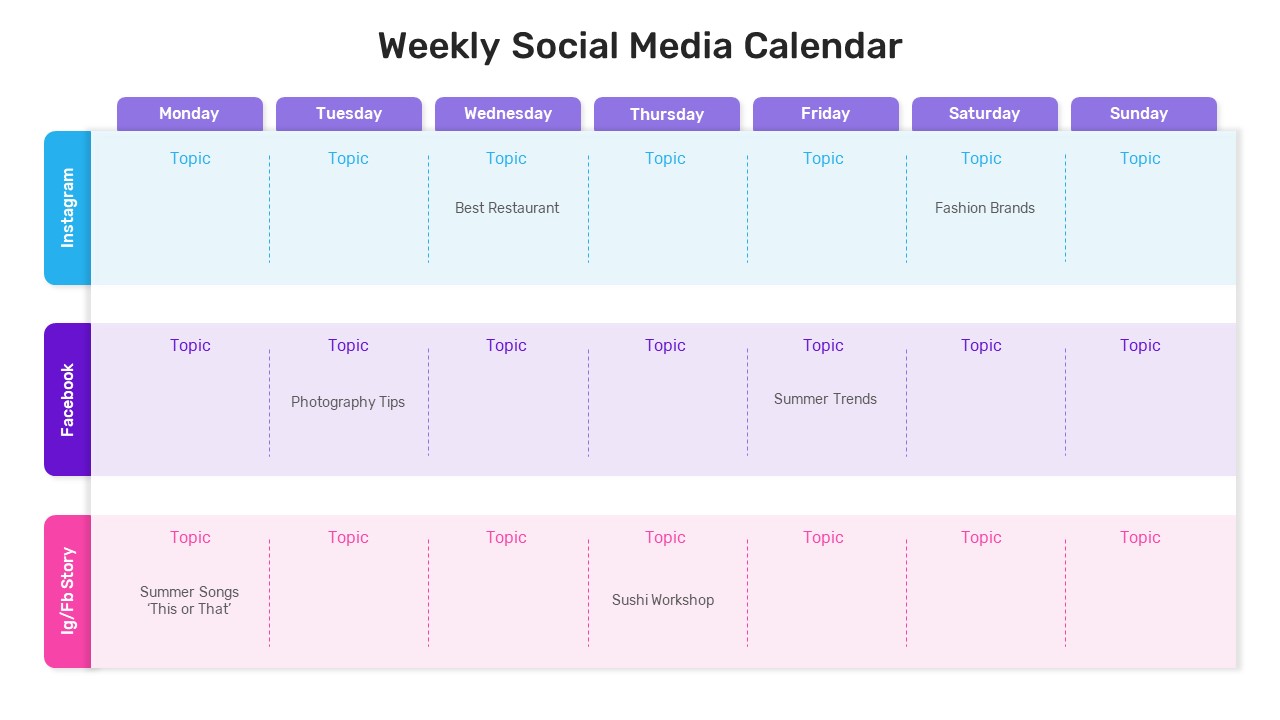
Weekly Social Media Calendar Editable Template for PowerPoint & Google Slides
Digital Marketing
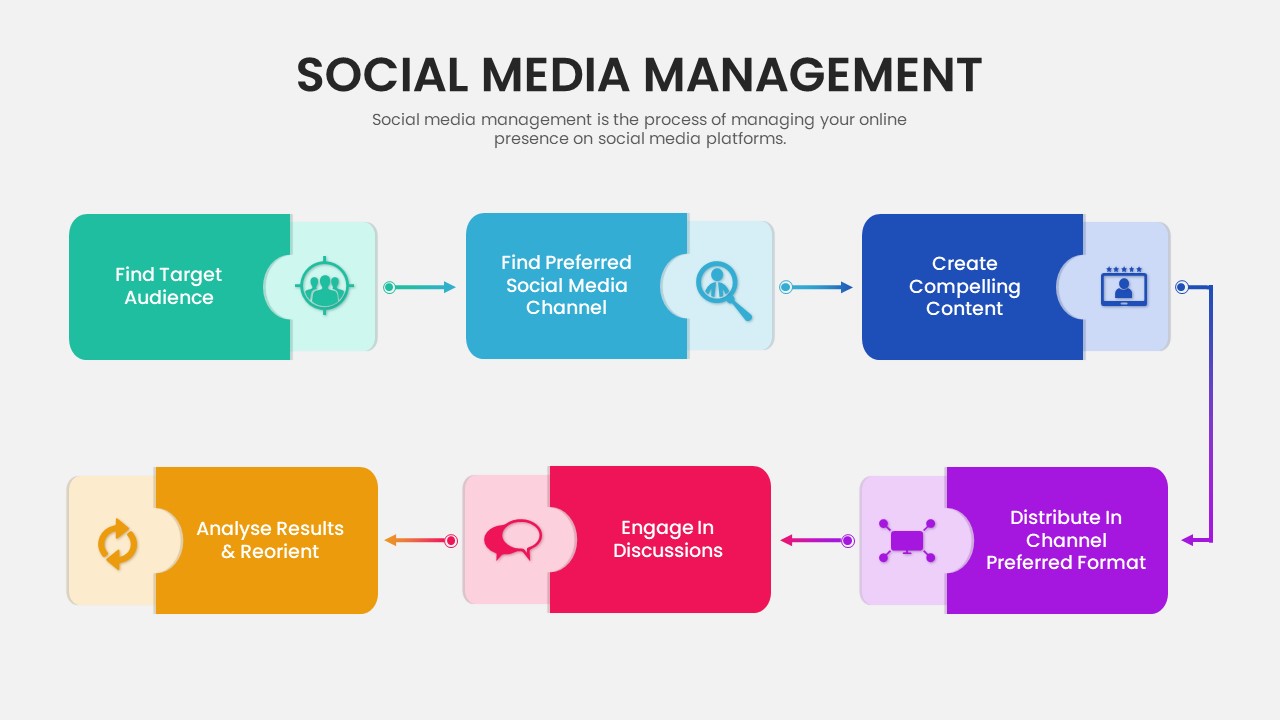
Six-Step Social Media Management Process Template for PowerPoint & Google Slides
Process
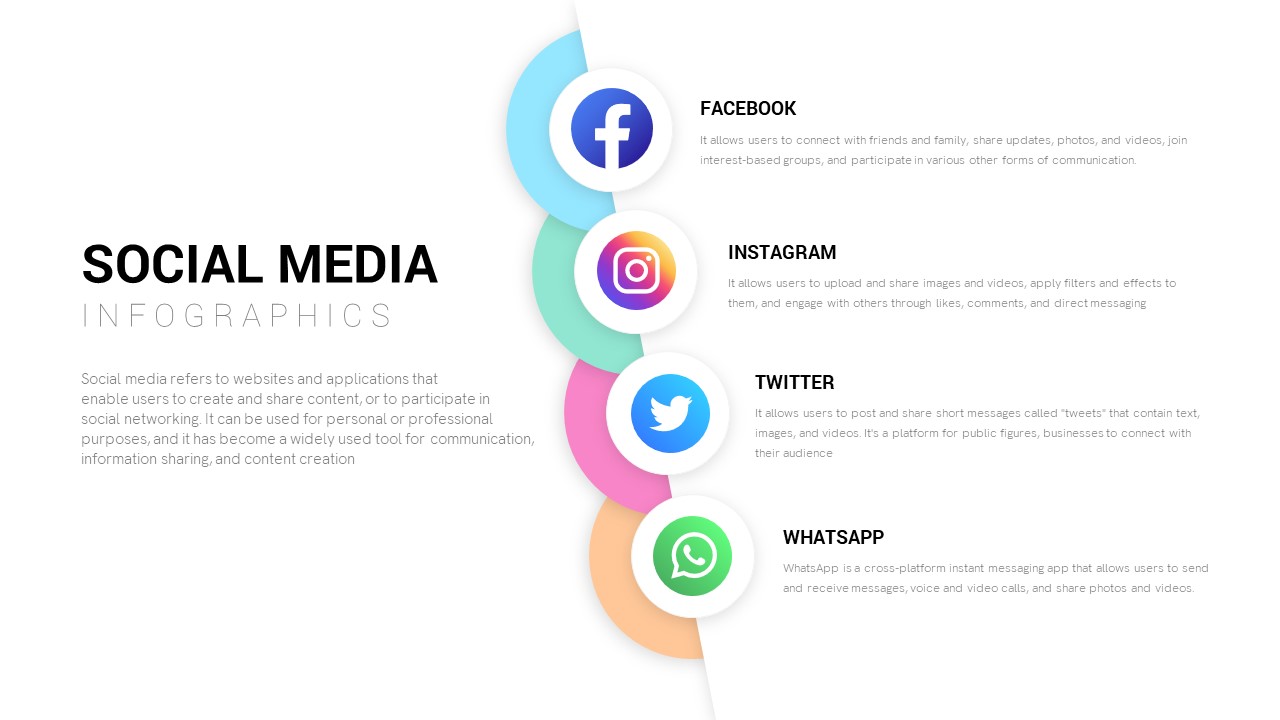
Modern Social Media Infographics Template for PowerPoint & Google Slides
Digital Marketing
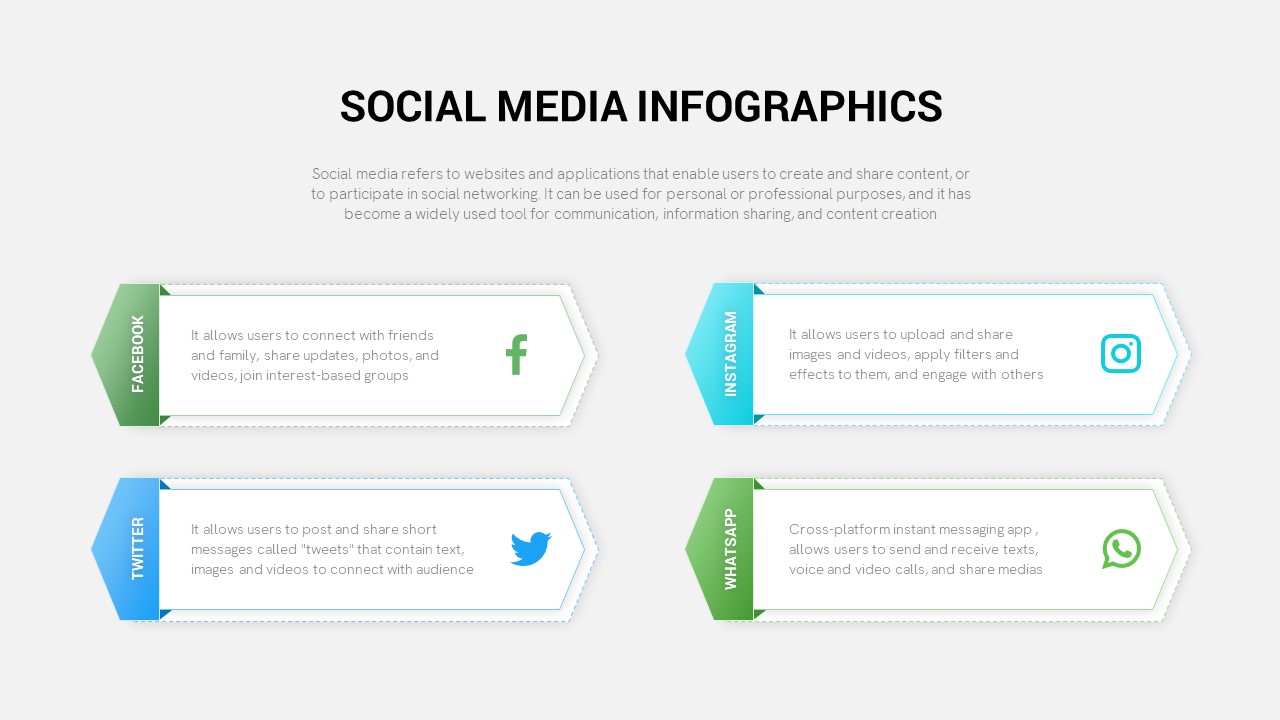
Social Media Infographic Arrow Layout Template for PowerPoint & Google Slides
Arrow
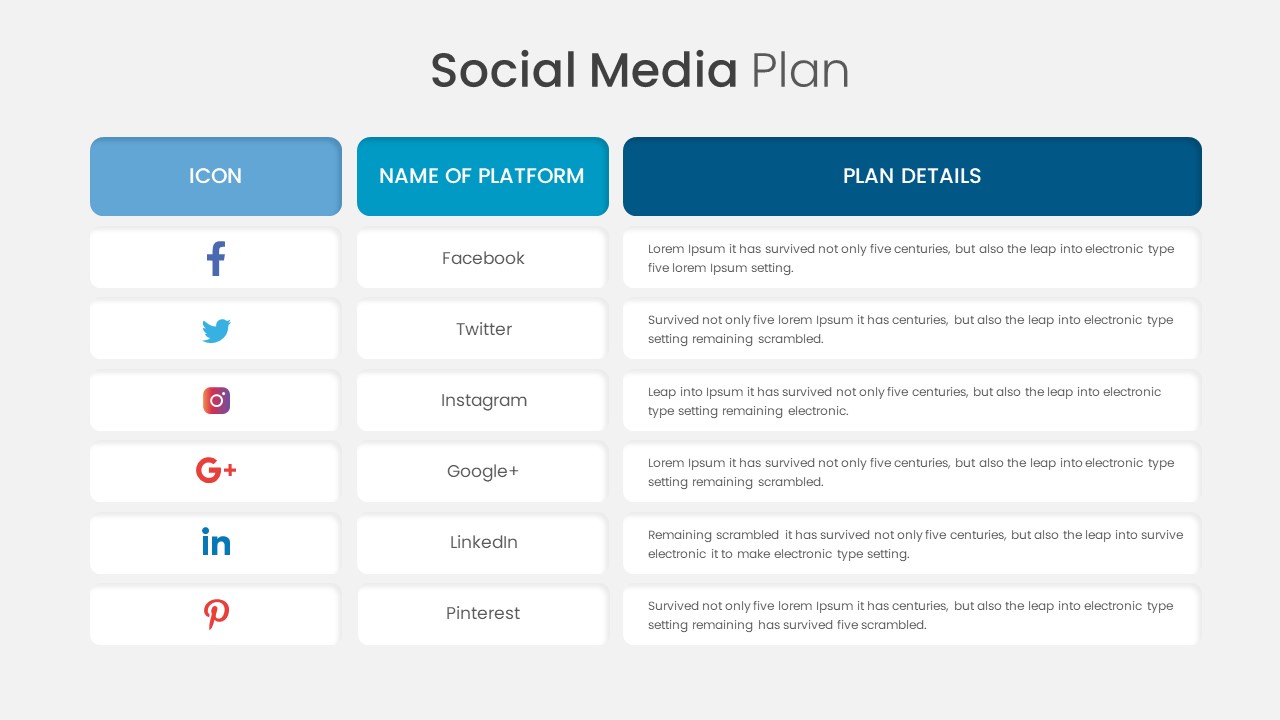
Social Media Plan Table Slide Deck Template for PowerPoint & Google Slides
Process
Social Media Marketing Connection Template for PowerPoint & Google Slides
Digital Marketing
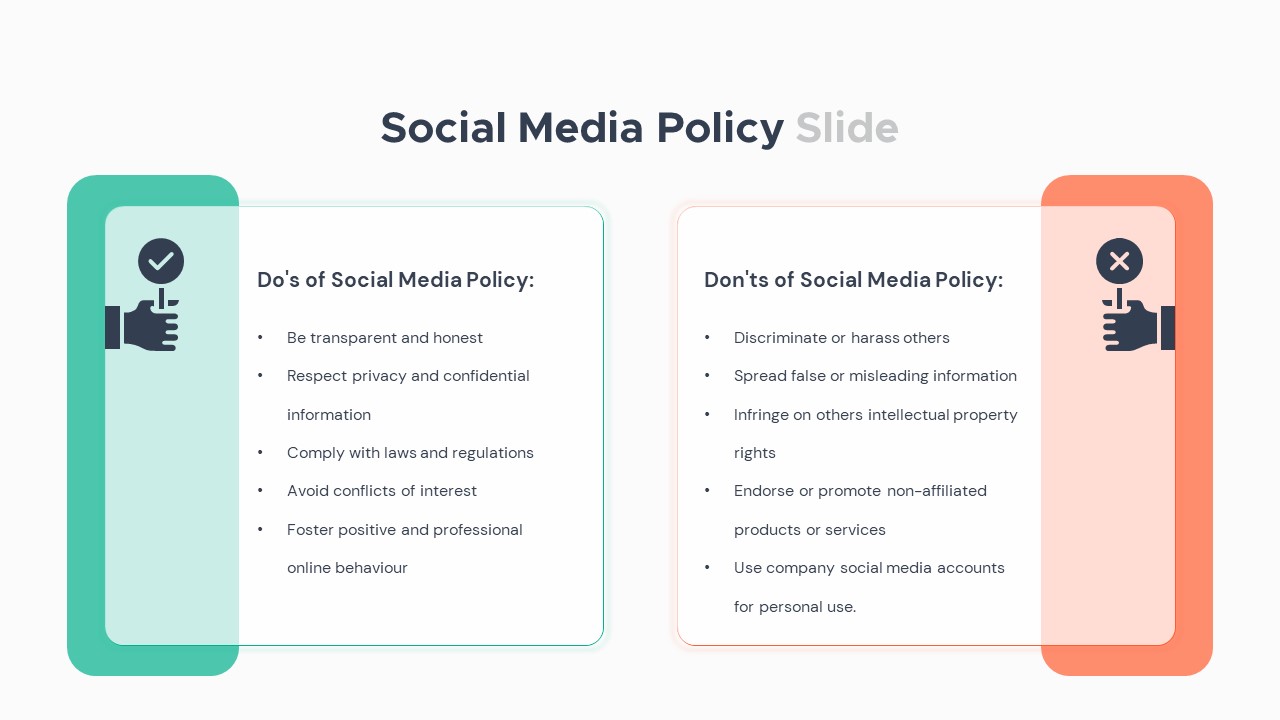
Social Media Policy Dos & Don’ts Slide Template for PowerPoint & Google Slides
Comparison
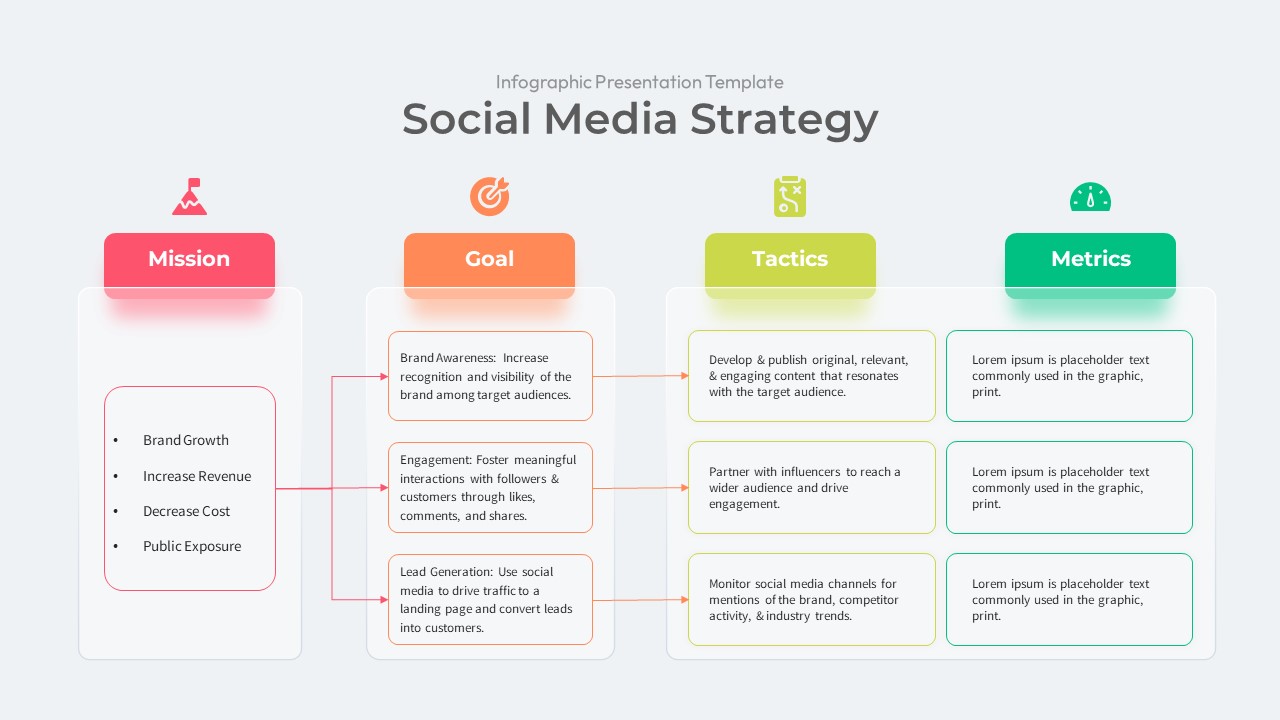
Social Media Marketing Strategy Template for PowerPoint & Google Slides
Digital Marketing
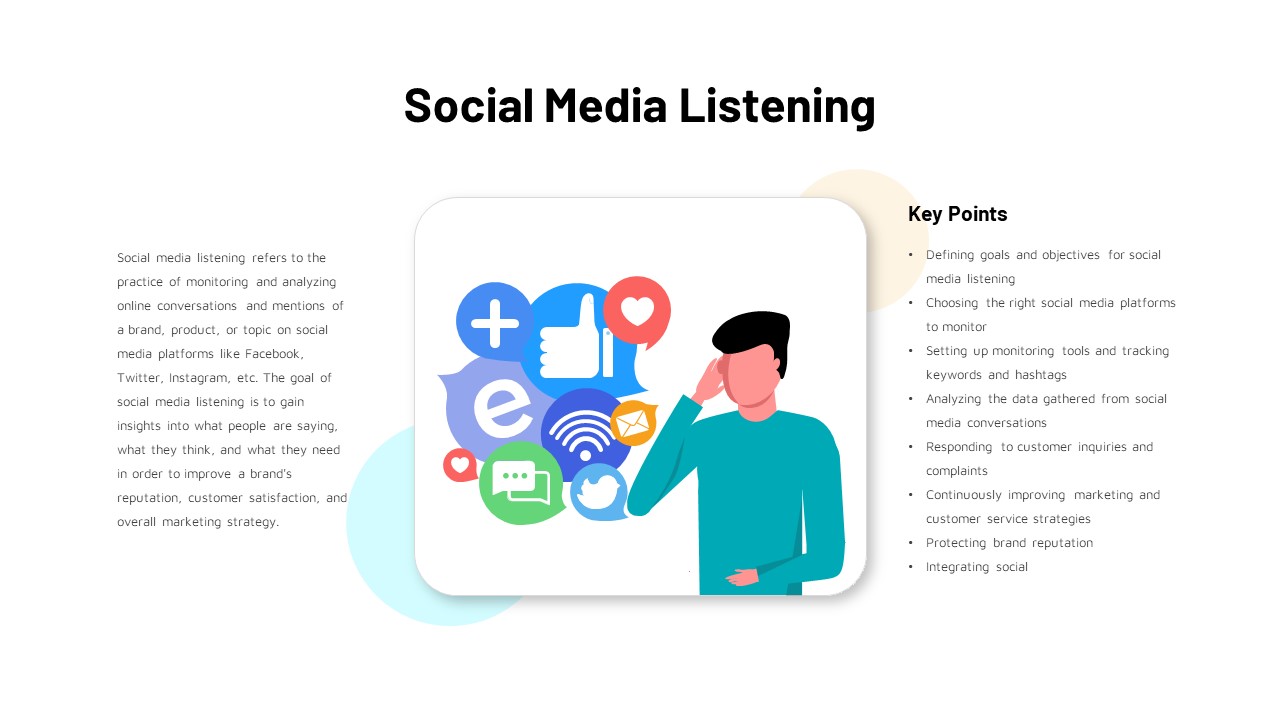
Social Media Listening Overview Slide Template for PowerPoint & Google Slides
Customer Experience
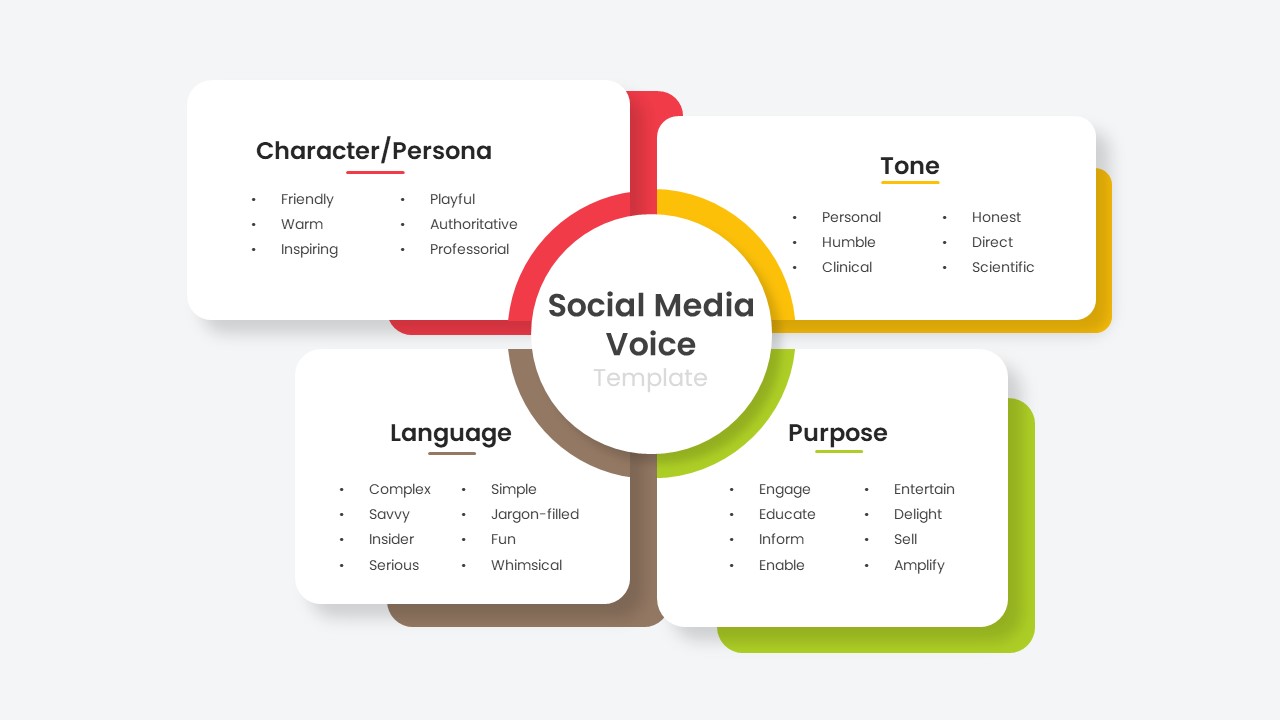
Social Media Voice Template for PowerPoint & Google Slides
Customer Experience
Social Media Hub-and-Spoke Infographics Template for PowerPoint & Google Slides
Circular
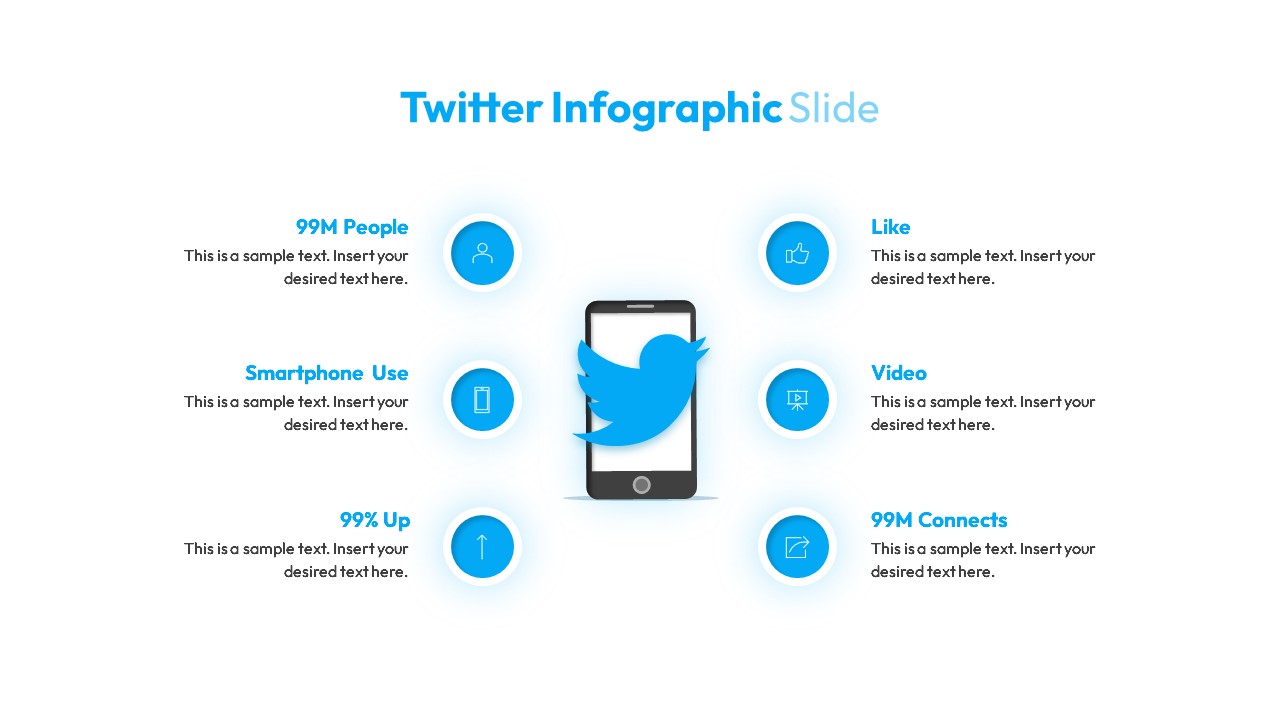
Twitter Social Media Infographic Template for PowerPoint & Google Slides
Circular
Social Media Statistics 2023 Dashboard Template for PowerPoint & Google Slides
Comparison
Social Media Report Presentation Template for PowerPoint & Google Slides
Digital Marketing
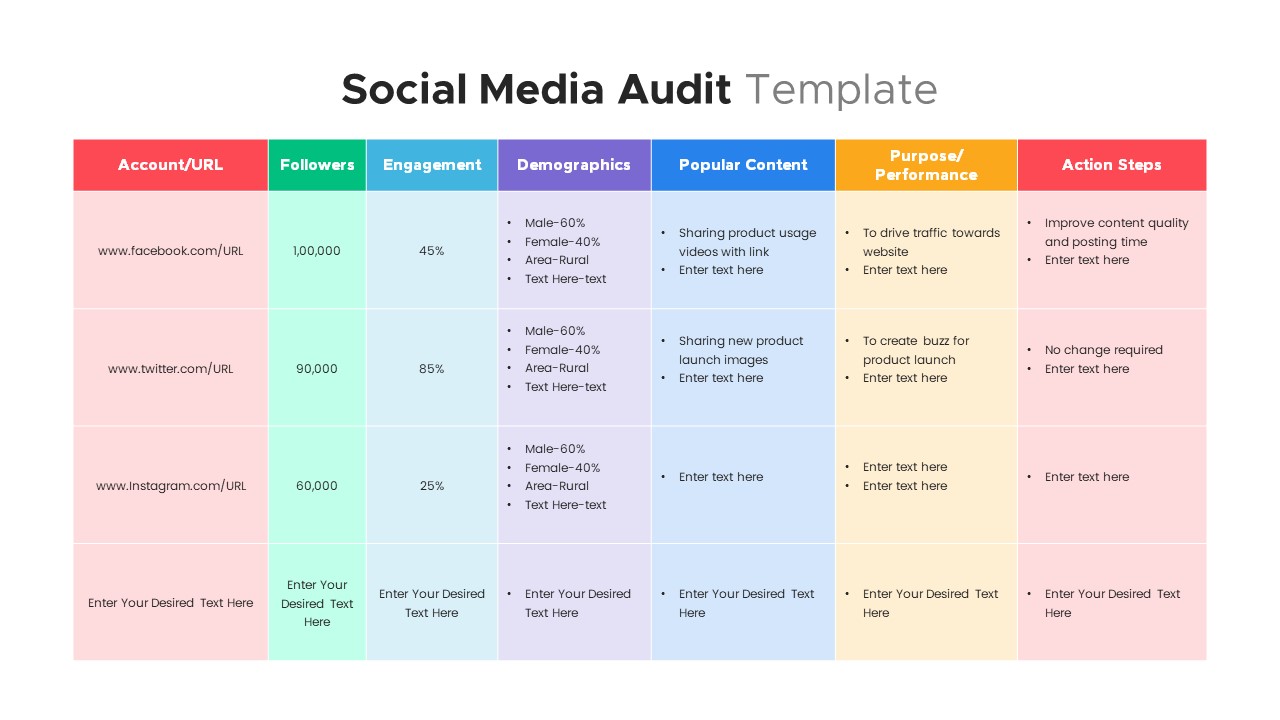
Comprehensive Social Media Audit Template for PowerPoint & Google Slides
Digital Marketing
Modern Social Media Timeline Roadmap Template for PowerPoint & Google Slides
Timeline

Social Media Marketing Presentation Template for PowerPoint & Google Slides
Decks
Free Social Media Hub-and-Spoke Infographic Template for PowerPoint & Google Slides
Circular
Free
Social Media Presentation Template for PowerPoint & Google Slides
Pitch Deck
Social Media Marketing Overview Template for PowerPoint & Google Slides
Advertising
Social Media Timeline template for PowerPoint & Google Slides
Timeline
Social Media Recruiting Strategy template for PowerPoint & Google Slides
Business
Social Media Network Hub Diagram Slide for PowerPoint & Google Slides
Process
iPad App Mockup with Progress Metrics Template for PowerPoint & Google Slides
Bar/Column
Asia Map with KPI Metrics and Legend Template for PowerPoint & Google Slides
World Maps
Bubble Head Metrics Infographic Template for PowerPoint & Google Slides
Circular
Circle Segment Sales Metrics Infographic Template for PowerPoint & Google Slides
Circular
Mobile Usage Metrics template for PowerPoint & Google Slides
Comparison Chart

Scale Metaphor Metrics Comparison Template for PowerPoint & Google Slides
Charts
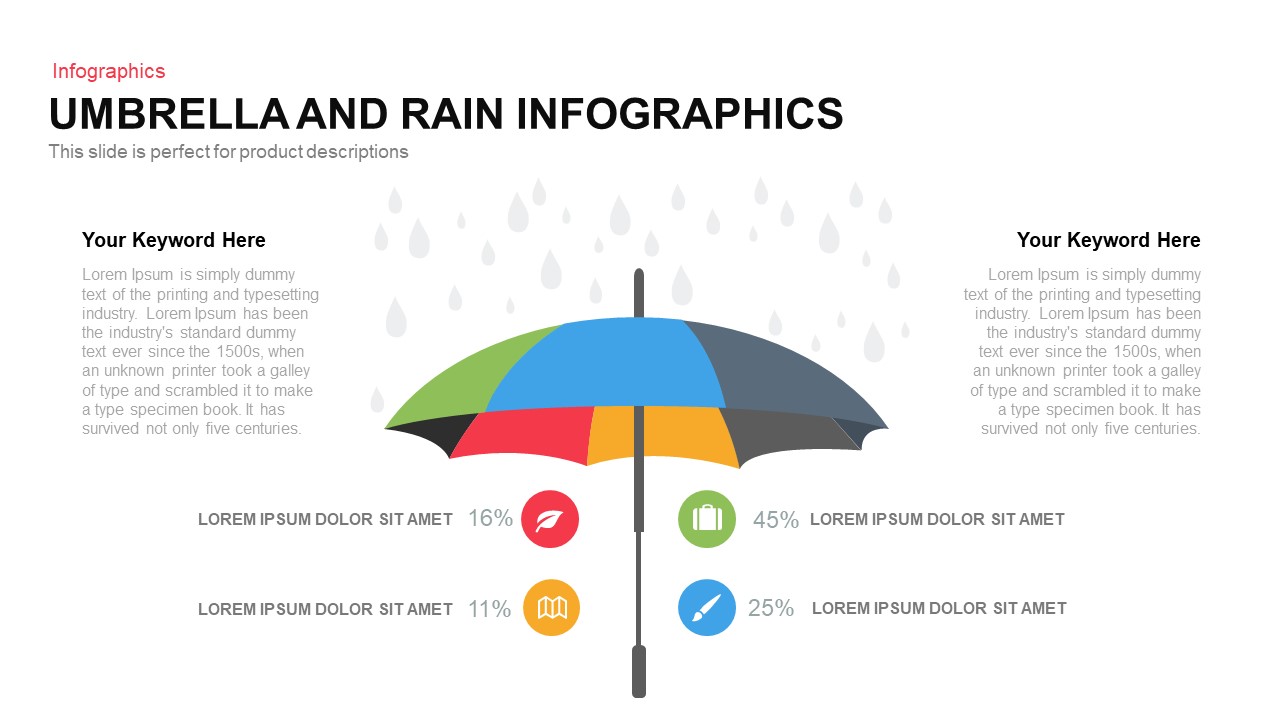
Umbrella and Rain Infographic Metrics Template for PowerPoint & Google Slides
Comparison
Comprehensive Recruitment Metrics Report Template for PowerPoint & Google Slides
Recruitment
Colorful Block Infographic Metrics Slide Template for PowerPoint & Google Slides
Infographics
Benchmarking Metrics Comparison Slide Template for PowerPoint & Google Slides
Pie/Donut
Project Status Dashboard with Metrics Template for PowerPoint & Google Slides
Project Status
Circular Image Gallery & KPI Metrics Template for PowerPoint & Google Slides
Pie/Donut
Statistics & Global Metrics Infographic Template for PowerPoint & Google Slides
Bar/Column
Agriculture Infographics Slide with Progress Rings & Metrics Template for PowerPoint & Google Slides
Pie/Donut
Annual Recurring Revenue Metrics Template for PowerPoint & Google Slides
Bar/Column
LinkedIn Metrics Infographic Slide Template for PowerPoint & Google Slides
Digital Marketing
Instagram Infographic Metrics Slide Template for PowerPoint & Google Slides
Marketing
Mastodon Metrics Infographic Dashboard Template for PowerPoint & Google Slides
Business Report
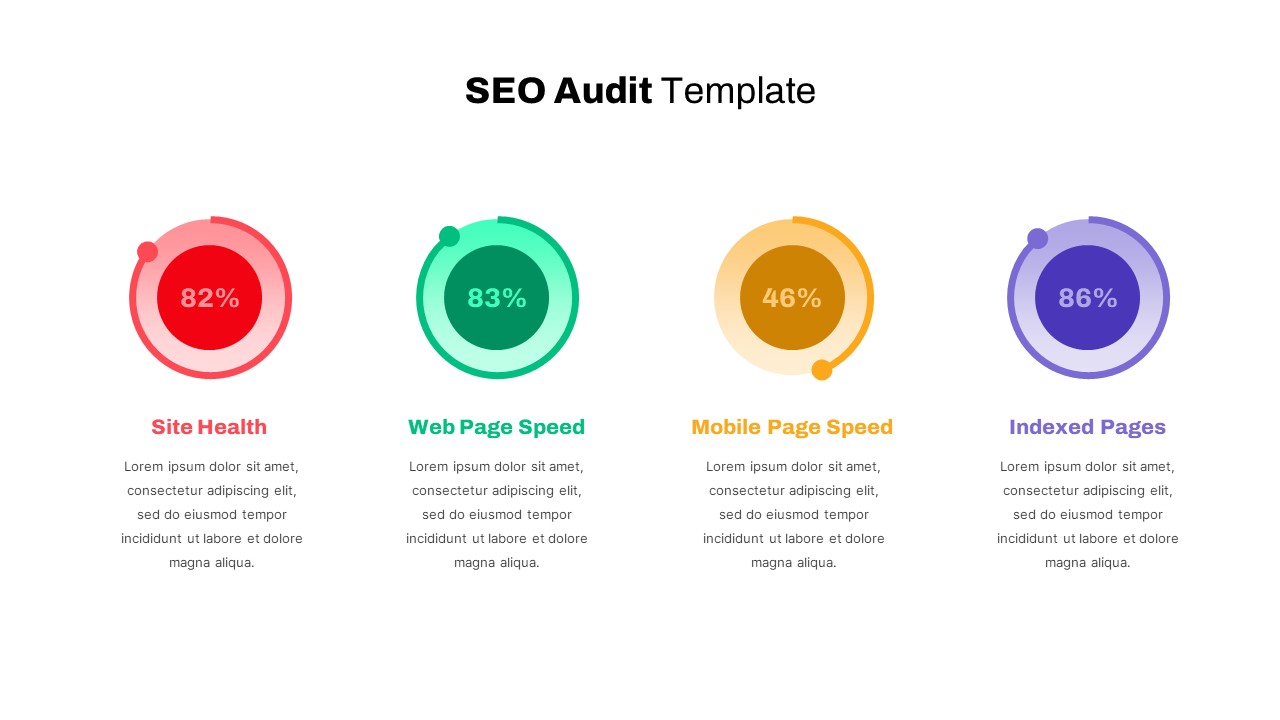
Detailed SEO Audit Metrics Overview Template for PowerPoint & Google Slides
Circular
Free Editable U.S. Map with Regional Metrics Template for PowerPoint & Google Slides
World Maps
Free
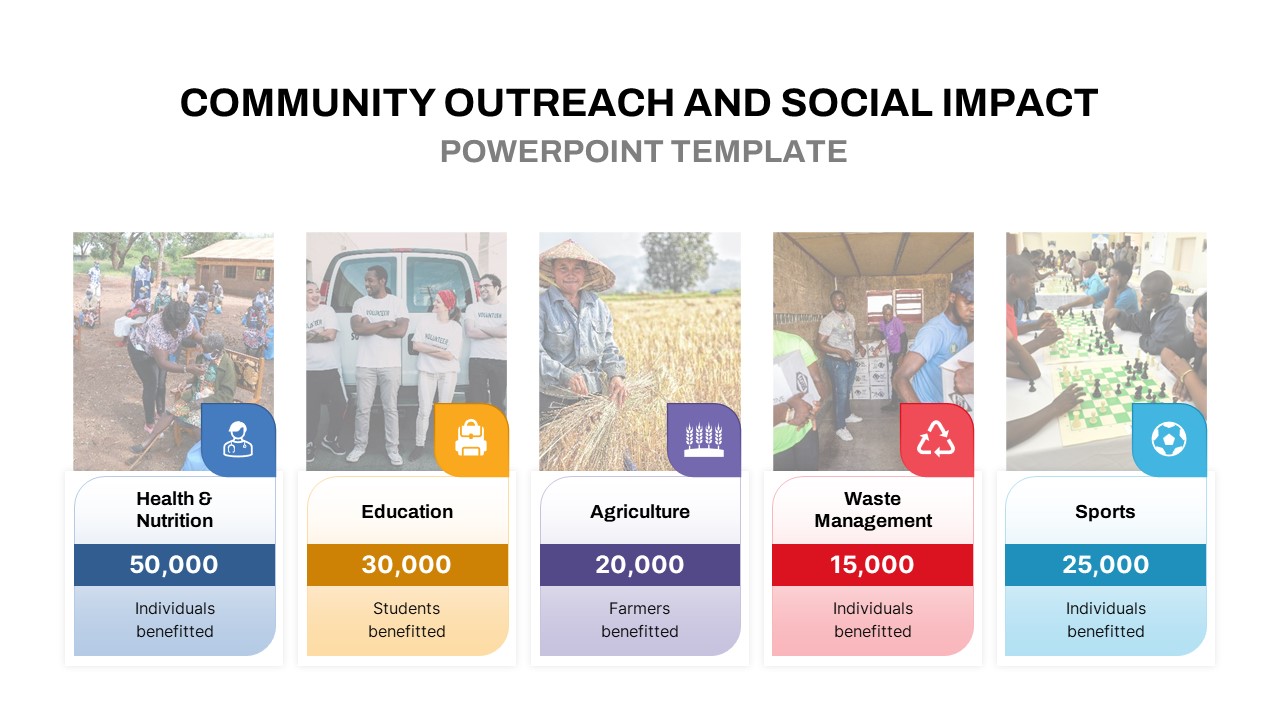
Community Outreach Impact Metrics Template for PowerPoint & Google Slides
Accomplishment
DevOps KPI Dashboard Performance Metrics Template for PowerPoint & Google Slides
Software Development
Purchasing KPI Metrics Dashboard Template for PowerPoint & Google Slides
Business Report
Financial Snapshot & Metrics Overview Template for PowerPoint & Google Slides
Finance
Procurement KPI Dashboard & Metrics Template for PowerPoint & Google Slides
Business Report
Market Validation Metrics Overview Template for PowerPoint & Google Slides
Business
Employee Performance Metrics Dashboard Template for PowerPoint & Google Slides
Employee Performance
Pirate Metrics AARRR Funnel Framework Template for PowerPoint & Google Slides
Funnel
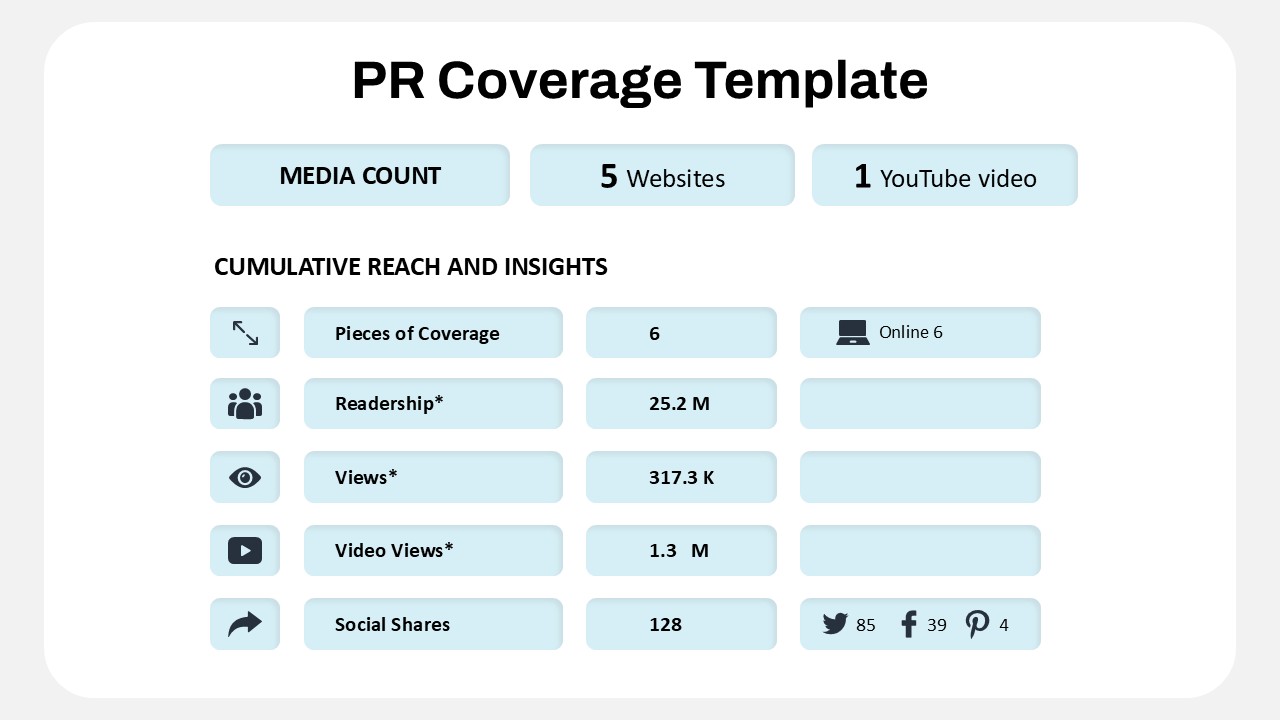
Public Relations Coverage Metrics Template for PowerPoint & Google Slides
Business Report
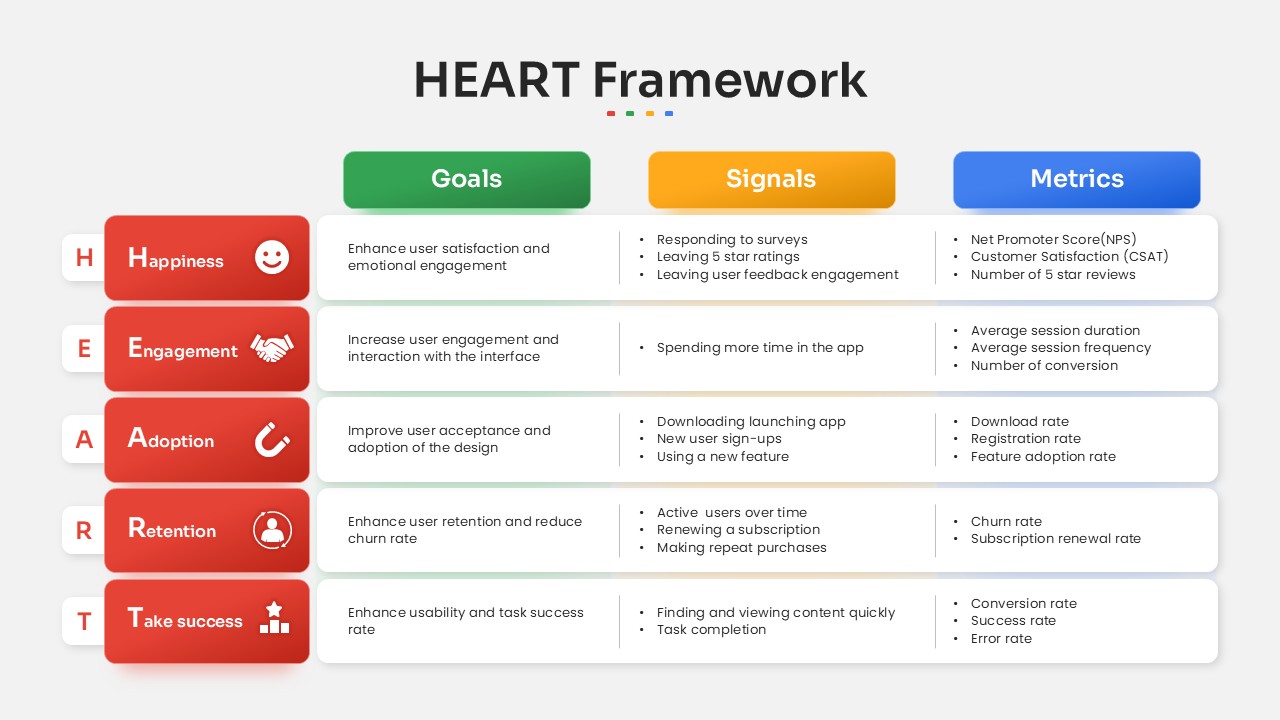
HEART Framework Goals, Signals & Metrics Template for PowerPoint & Google Slides
Process
News Metaphor Media Communication Slide Template for PowerPoint & Google Slides
Business Report
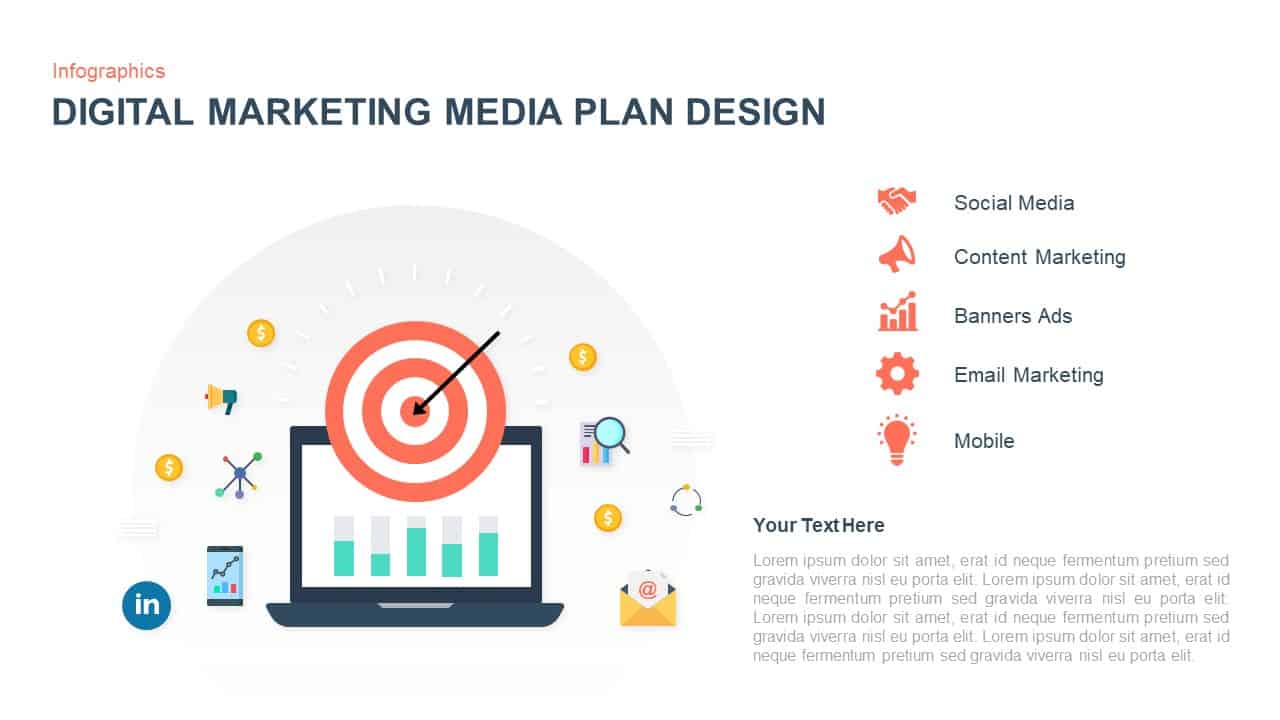
Digital Marketing Media Plan Infographic Template for PowerPoint & Google Slides
Digital Marketing
Influencer Media Kit Company Profile Template for PowerPoint & Google Slides
Company Profile
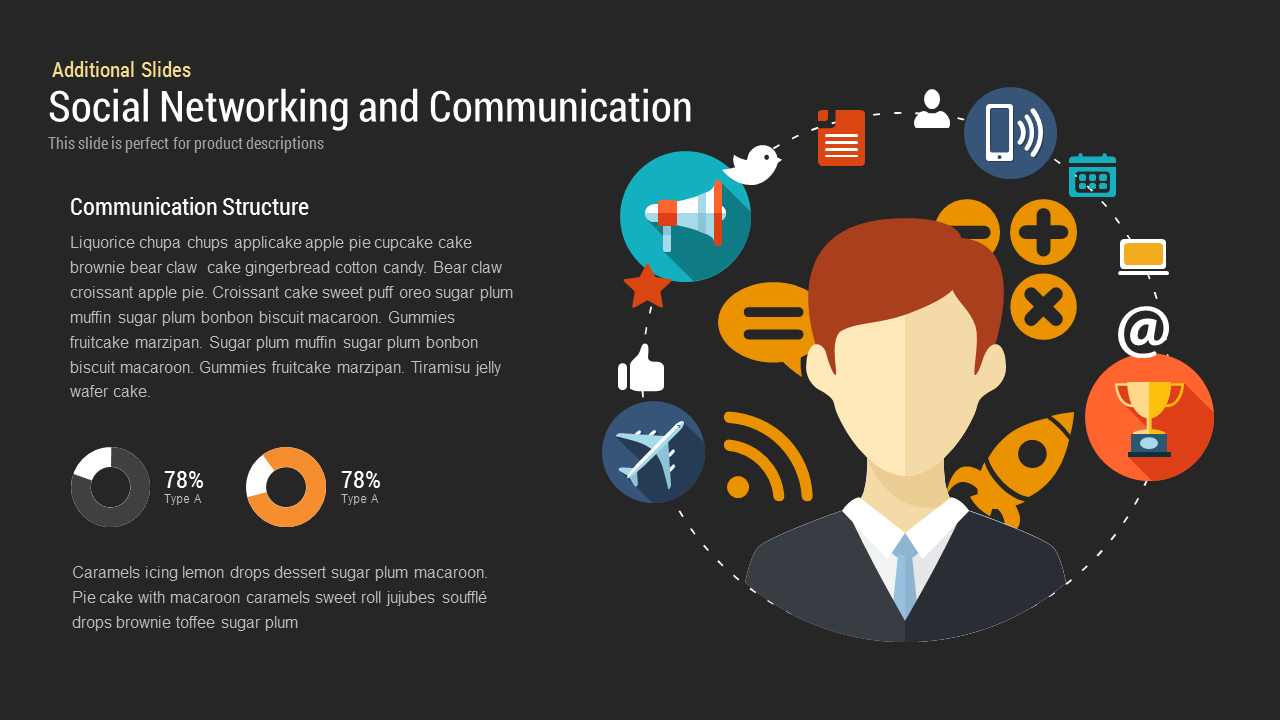
Social Networking and Communication template for PowerPoint & Google Slides
Digital Marketing
Mobile Mockup with Social Callouts Template for PowerPoint & Google Slides
Software Development
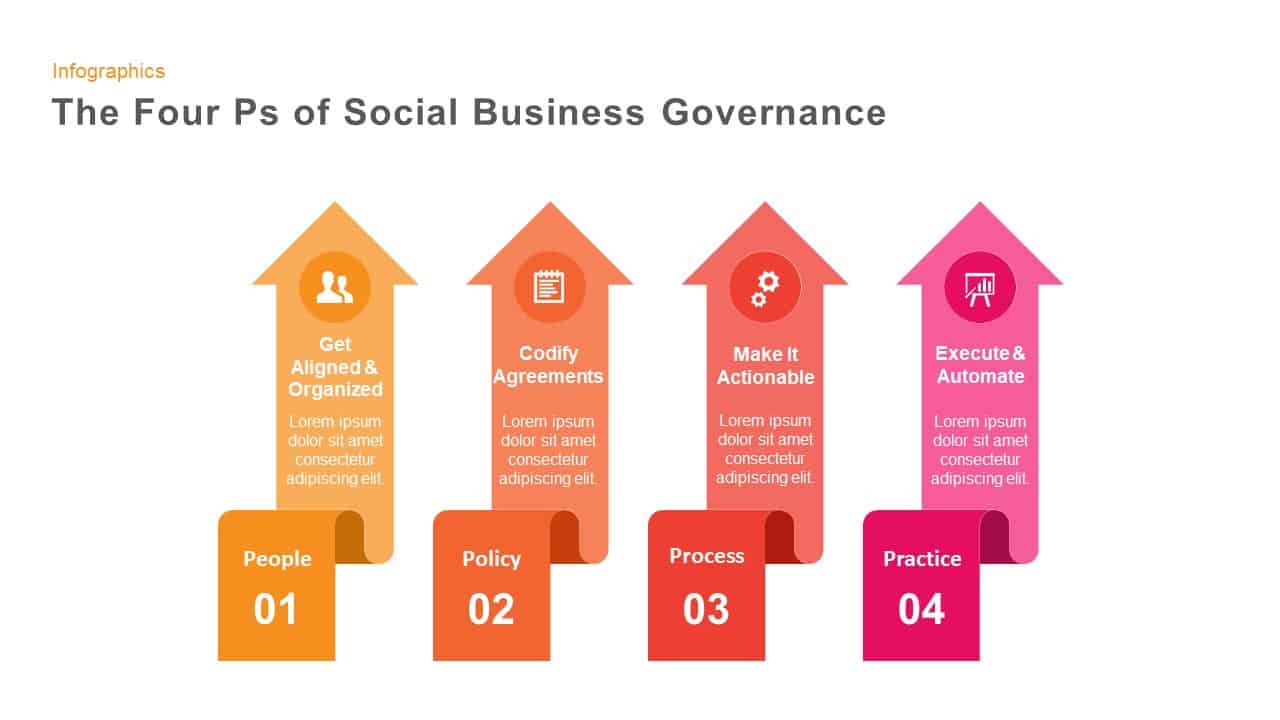
Four Ps of Social Business Governance template for PowerPoint & Google Slides
Business Strategy
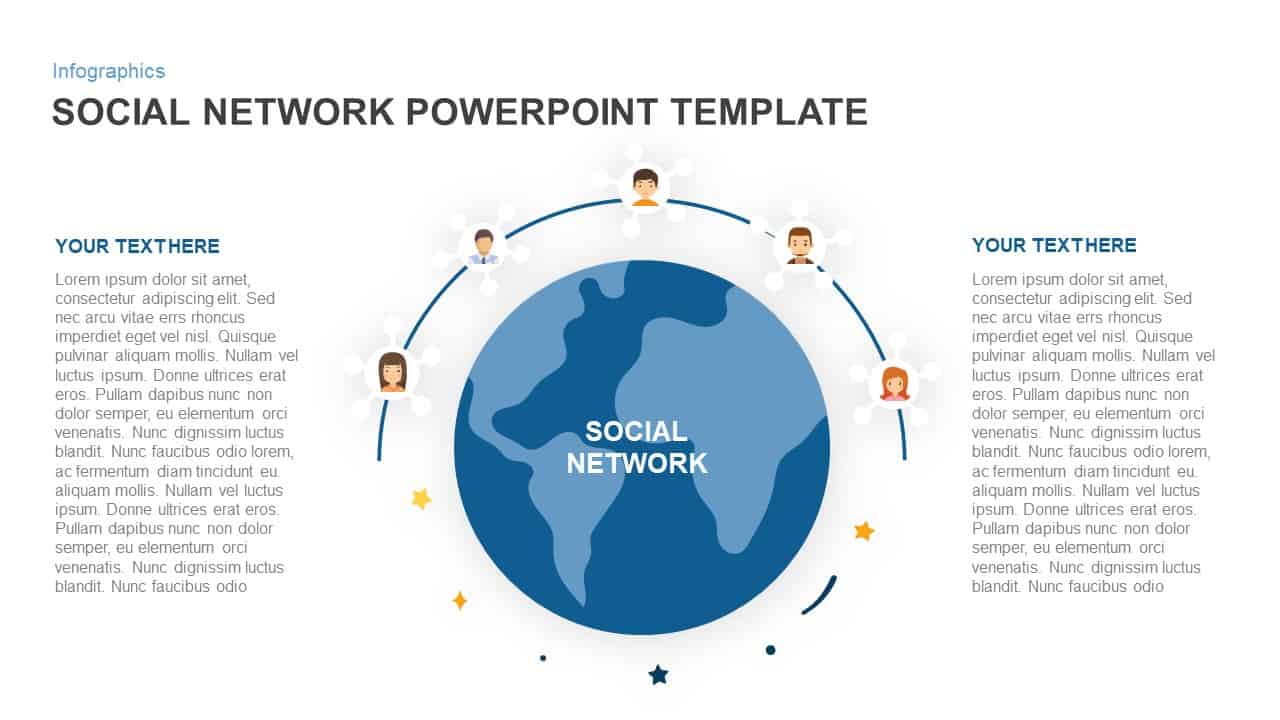
Social Network Connectivity Infographic Template for PowerPoint & Google Slides
Infographics
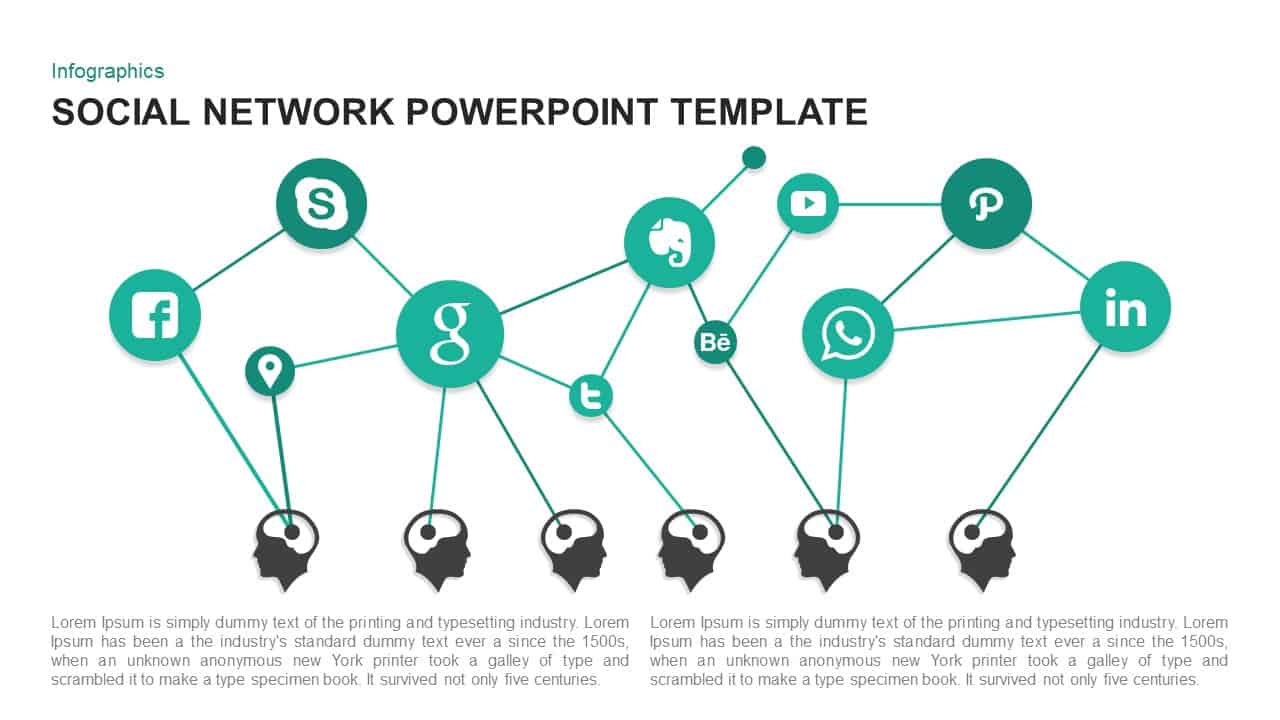
Social Network Infographic Diagram Template for PowerPoint & Google Slides
Digital Marketing
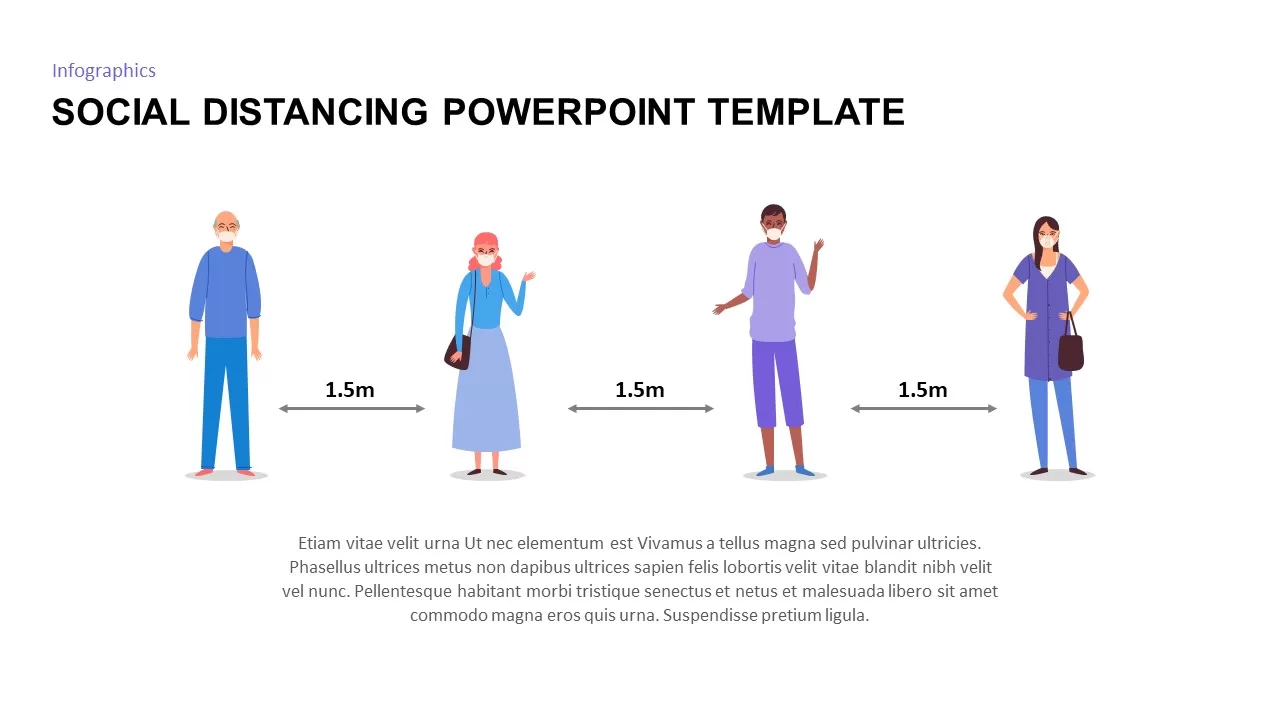
Social Distancing PowerPoint & Google Slides Template
Business Strategy
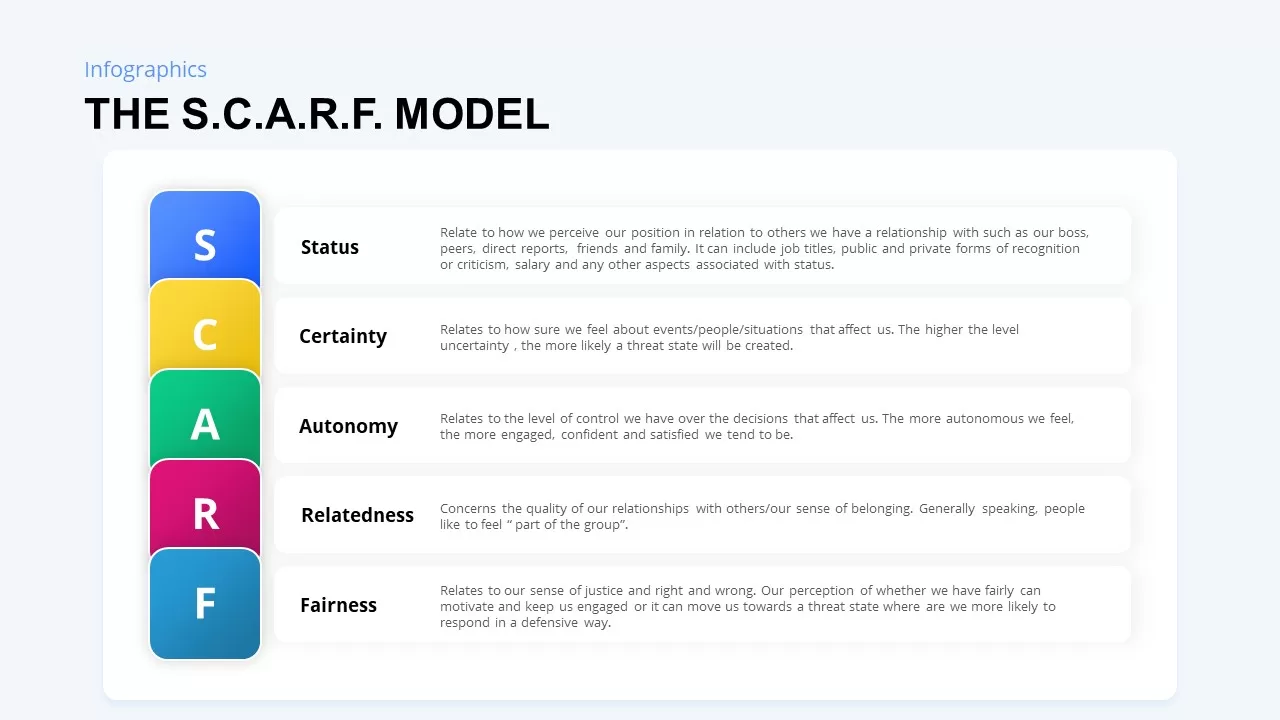
SCARF Model Social Threats & Rewards Template for PowerPoint & Google Slides
Business Strategy
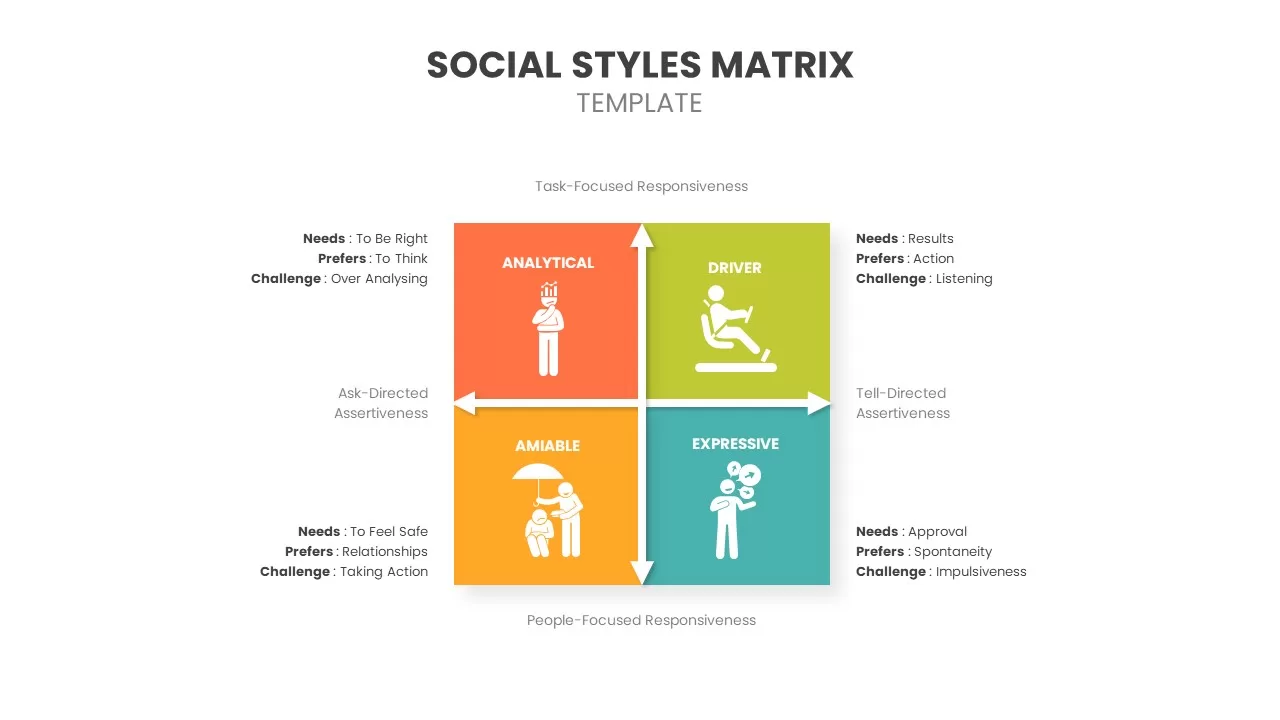
Social Styles Matrix Template for PowerPoint & Google Slides
Business
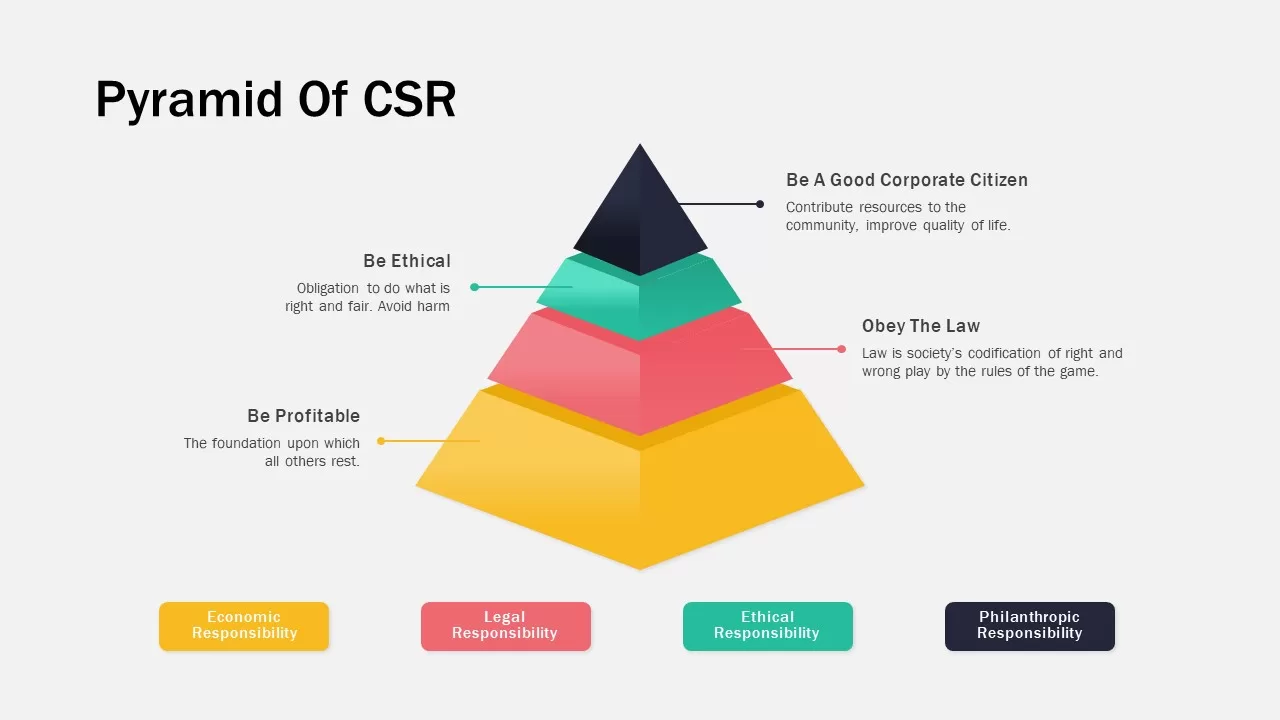
Corporate Social Responsibility Pyramid Template for PowerPoint & Google Slides
Pyramid
Corporate Social Responsibility Strategy Template for PowerPoint & Google Slides
Company Profile
Free Comprehensive Social Work Presentation Template for PowerPoint & Google Slides
Pitch Deck
Free
Free Nonprofit Charity Social Impact Deck Template for PowerPoint & Google Slides
Pitch Deck
Free
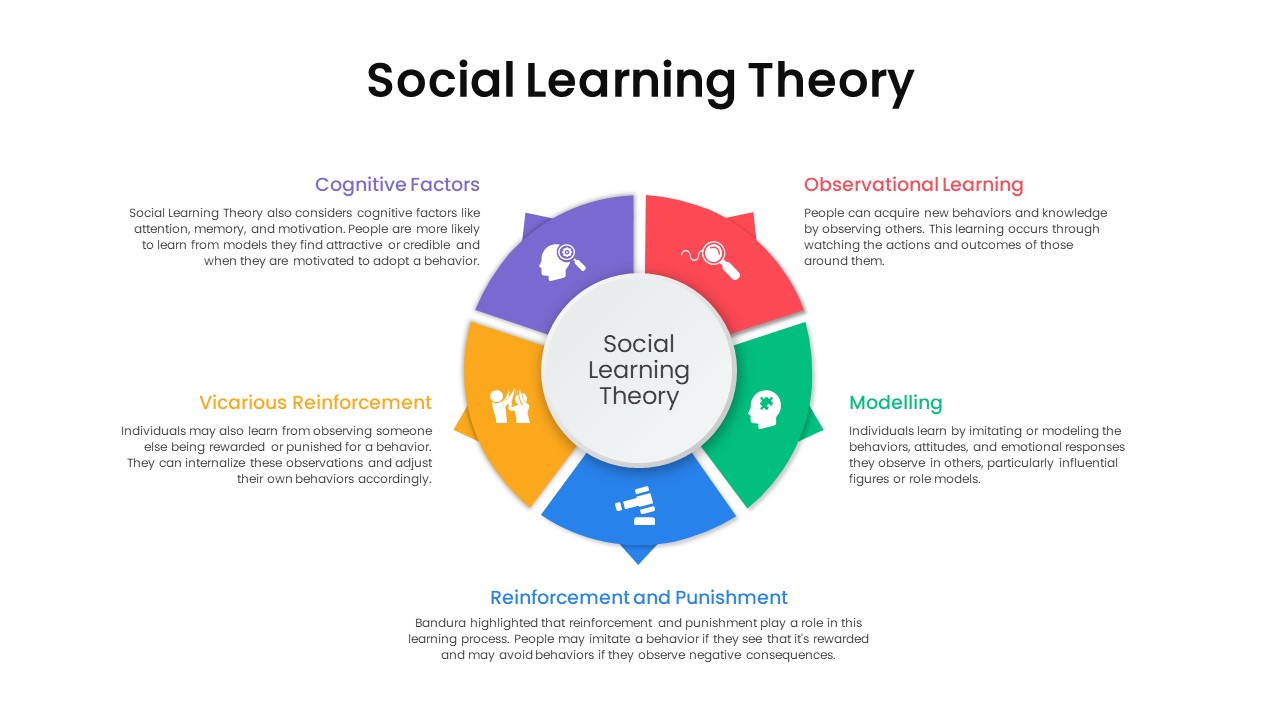
Social Learning Theory Infographic Template for PowerPoint & Google Slides
Circular
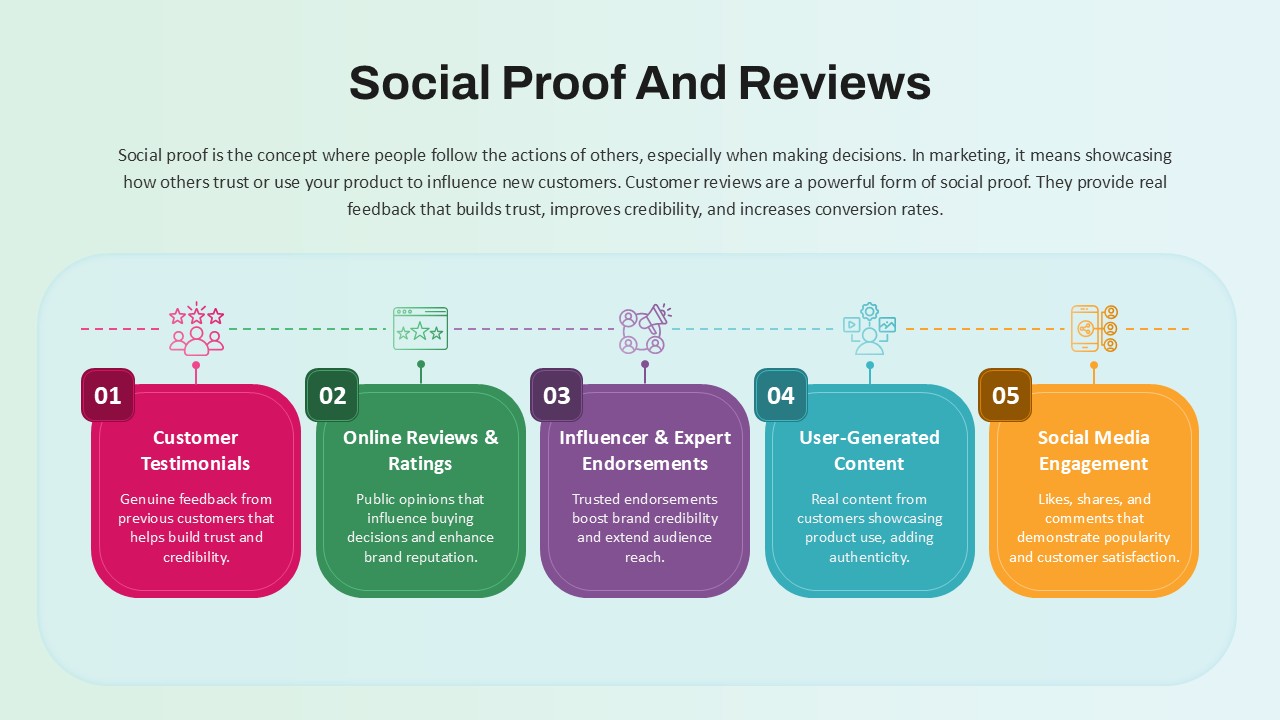
Social Proof and Reviews in Marketing template for PowerPoint & Google Slides
Customer Journey
4 Step Process PowerPoint & Google Slides Template for PowerPoint & Google Slides
Process