Popular Social Media Comparison Grid Template for PowerPoint & Google Slides

Description
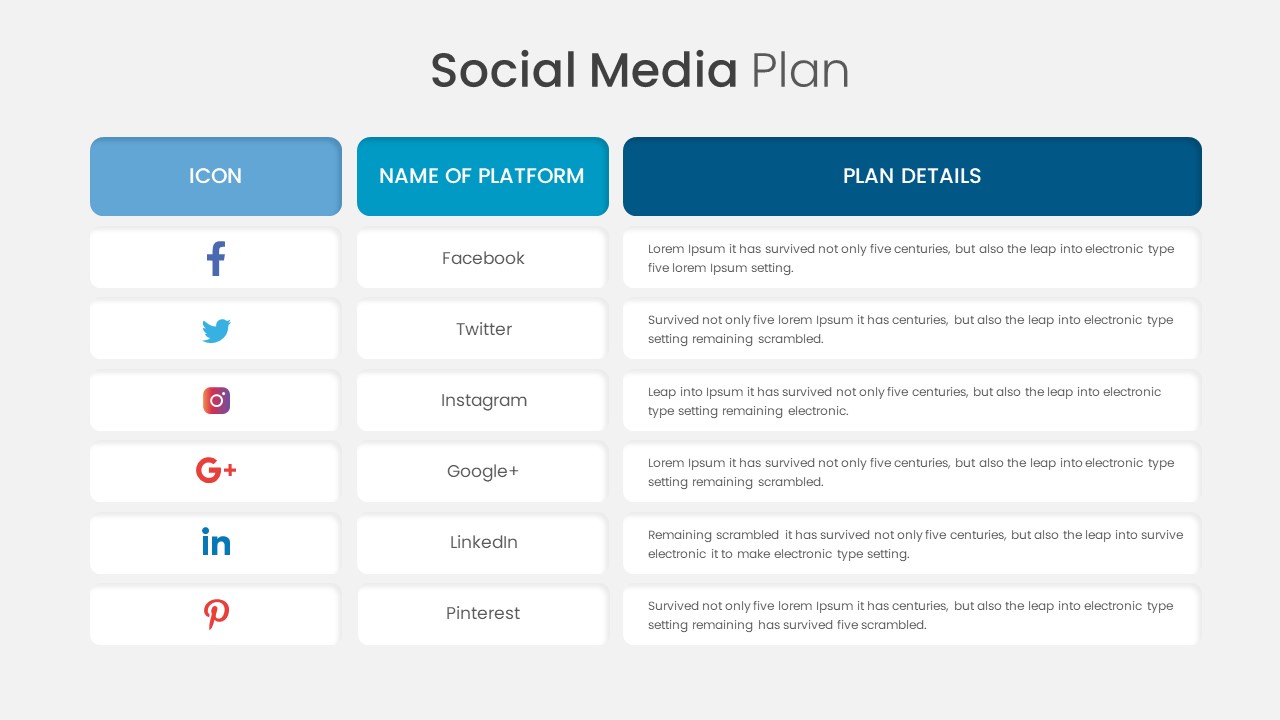
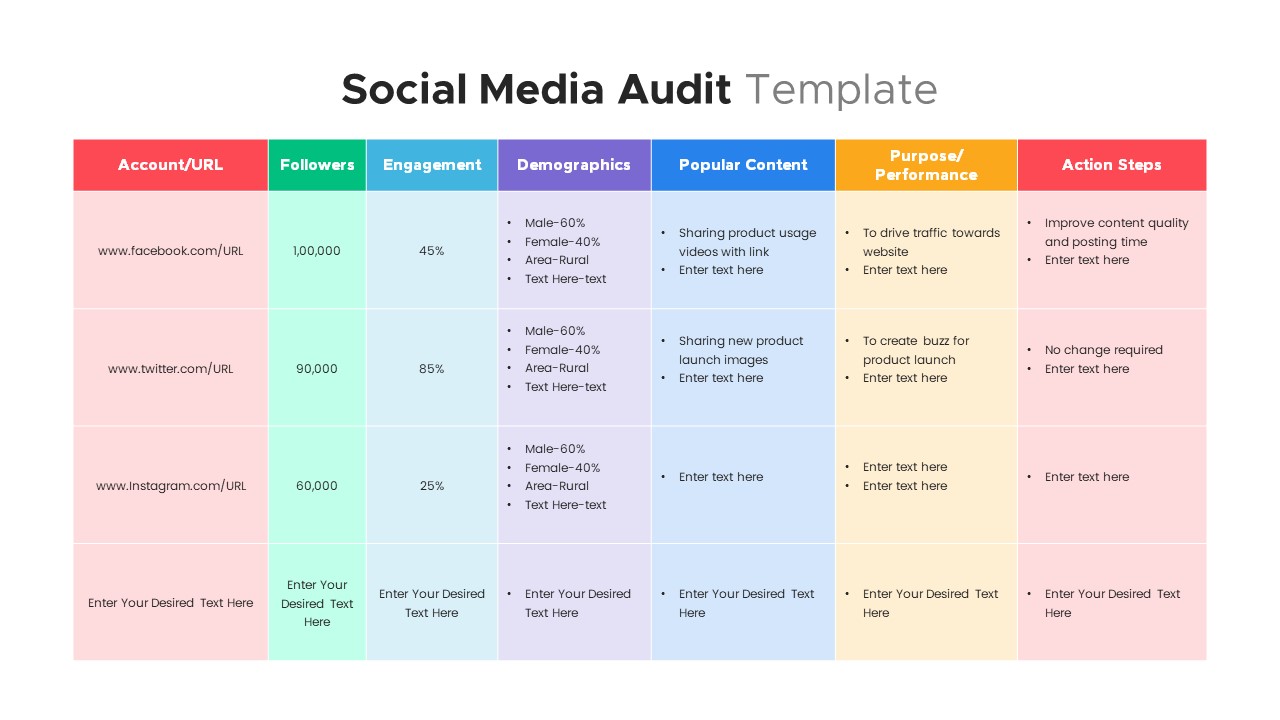
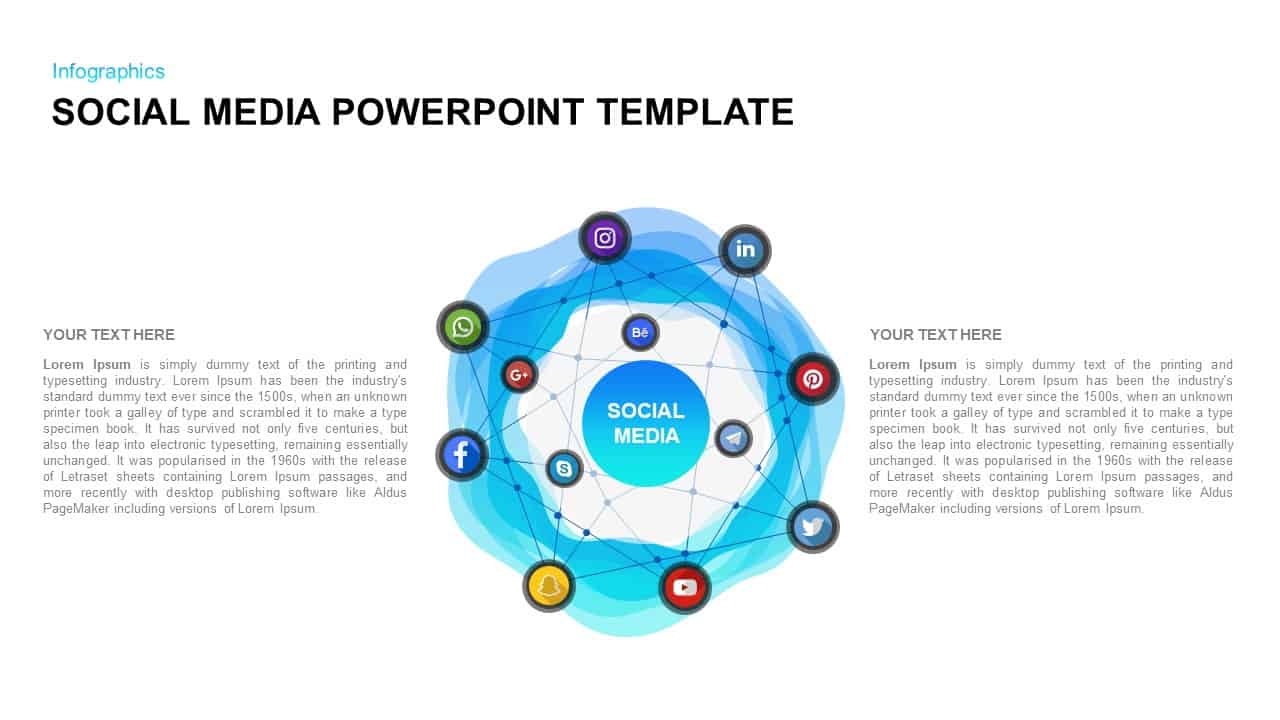
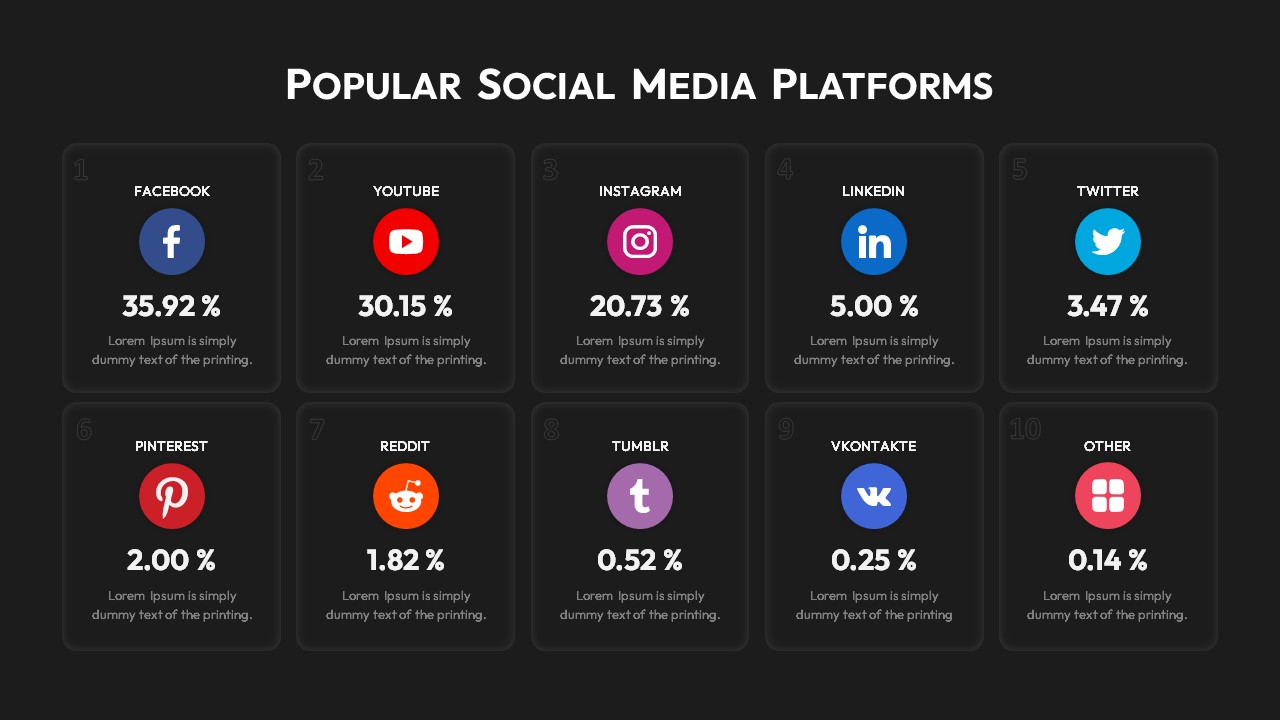
Leverage this sleek comparison grid slide to present social media platform usage metrics with clarity and visual hierarchy. The slide features ten crisp card placeholders arranged in a symmetrical two-row grid, each displaying a ranking number, circular icon, percentage figure, and brief description. Icons representing Facebook, YouTube, Instagram, LinkedIn, Twitter, Pinterest, Reddit, Tumblr, VKontakte, and Other are fully editable vector shapes, allowing you to swap icons or update platforms seamlessly. Bold numerals paired with percentage data use consistent typography, while subtle shadows and rounded corners enhance depth without cluttering the white background. Built on master slides, this layout ensures uniform spacing, easy alignment, and rapid customization across PowerPoint and Google Slides.
Intuitive placeholder text guides content entry, and theme colors can be applied globally to update icons, text accents, and card highlights in seconds. Use the slide to compare engagement rates, market share, or audience demographics across channels. Leverage built-in guides to adjust card arrangement or add transition effects for dynamic presentations. This design preserves full resolution clarity on high-definition displays and virtual meeting platforms, eliminating formatting issues between software versions.
Fine-tune the visual hierarchy using the theme color picker to apply custom brand palettes, or enable gradient overlays for modern flair. Vector-based card shapes make resizing trivial without pixelation, and built-in grid guides ensure perfect alignment. Ideal for both print and digital formats, this slide can be exported as PDF or high-resolution images for handouts, websites, or social media teasers.
Who is it for
Digital marketers, social media managers, and marketing analysts will benefit from this comparison grid when illustrating platform performance, audience reach, or campaign ROI. Corporate communicators, consultants, and educators can leverage its clean layout to deliver data-driven insights in boardroom briefings, strategy sessions, and workshops.
Other Uses
Repurpose this slide to rank product features, compare sales territories, or display KPI dashboards for executive summaries. Adjust card icons and labels to map customer satisfaction scores, survey results, or competitive analyses, making this template versatile across industries and presentations.
Login to download this file

Item ID
SB03315
Related Templates

Popular Teaching Methods Educational Template for PowerPoint & Google Slides
Decks

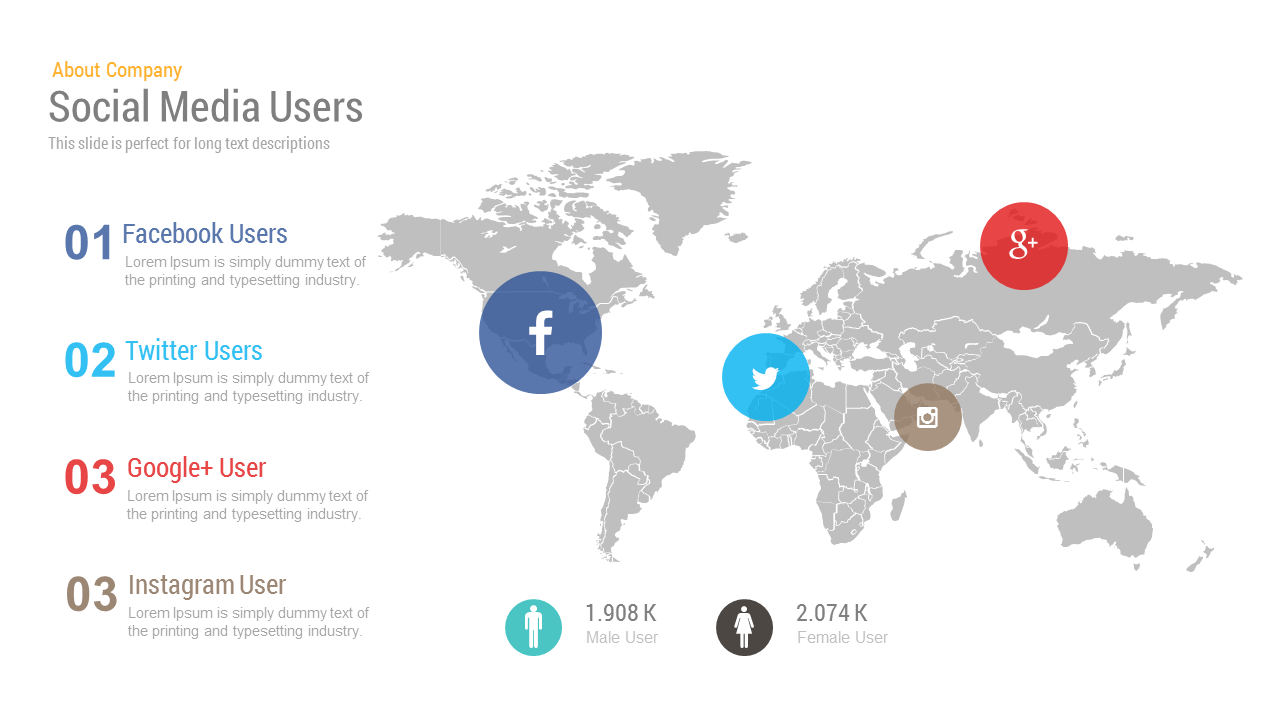
Free Social Media Users Map template for PowerPoint & Google Slides
World Maps
Free
Social Media Metrics template for PowerPoint & Google Slides
Comparison Chart
Comprehensive Social Media Icons Slide Template for PowerPoint & Google Slides
Advertising

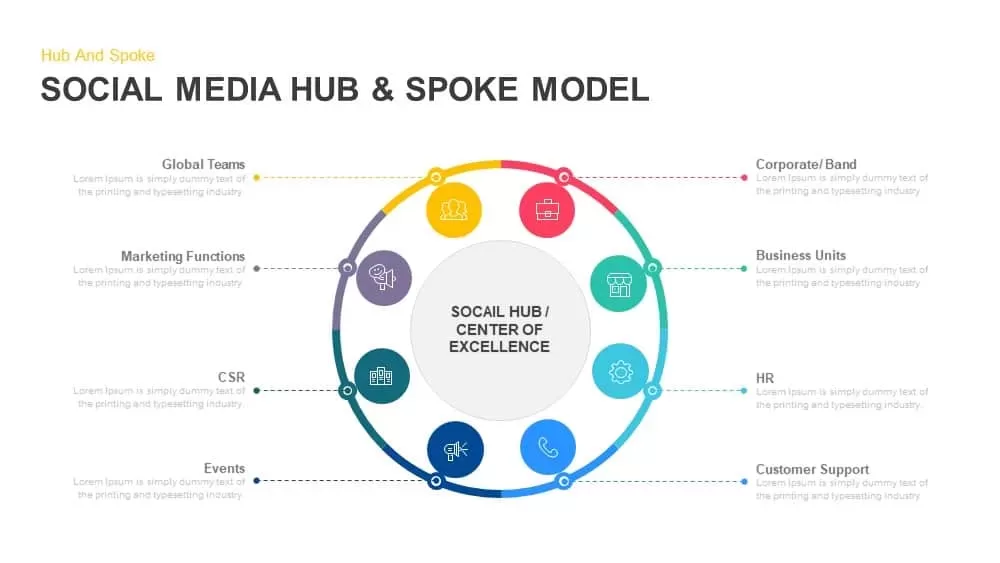
Social Media Hub & Spoke Model Template for PowerPoint & Google Slides
Process
Social Media Market Share Pie Charts Template for PowerPoint & Google Slides
Pie/Donut
Social Media Mind Network Infographic Template for PowerPoint & Google Slides
Digital Marketing
Social Media Rocket Launch Infographic Template for PowerPoint & Google Slides
Marketing
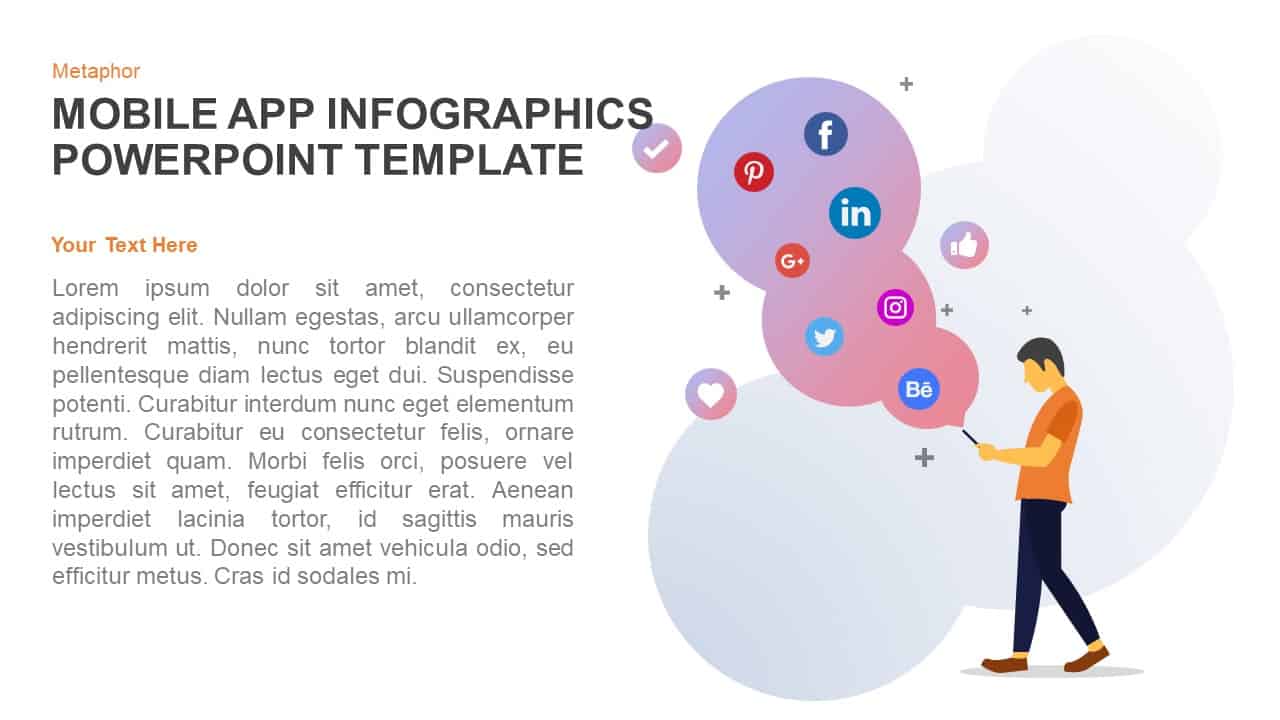
Mobile App Social Media Metaphor Template for PowerPoint & Google Slides
Infographics
Social Media Network Infographic Template for PowerPoint & Google Slides
Circular
Social Media Metaphor Illustration Template for PowerPoint & Google Slides
Digital Marketing
Social Media Performance Dashboard Template for PowerPoint & Google Slides
Bar/Column
Social Media Marketing Tool Template for PowerPoint & Google Slides
Digital Marketing
Free 3D Social Media Icons template for PowerPoint & Google Slides
Digital Marketing
Free
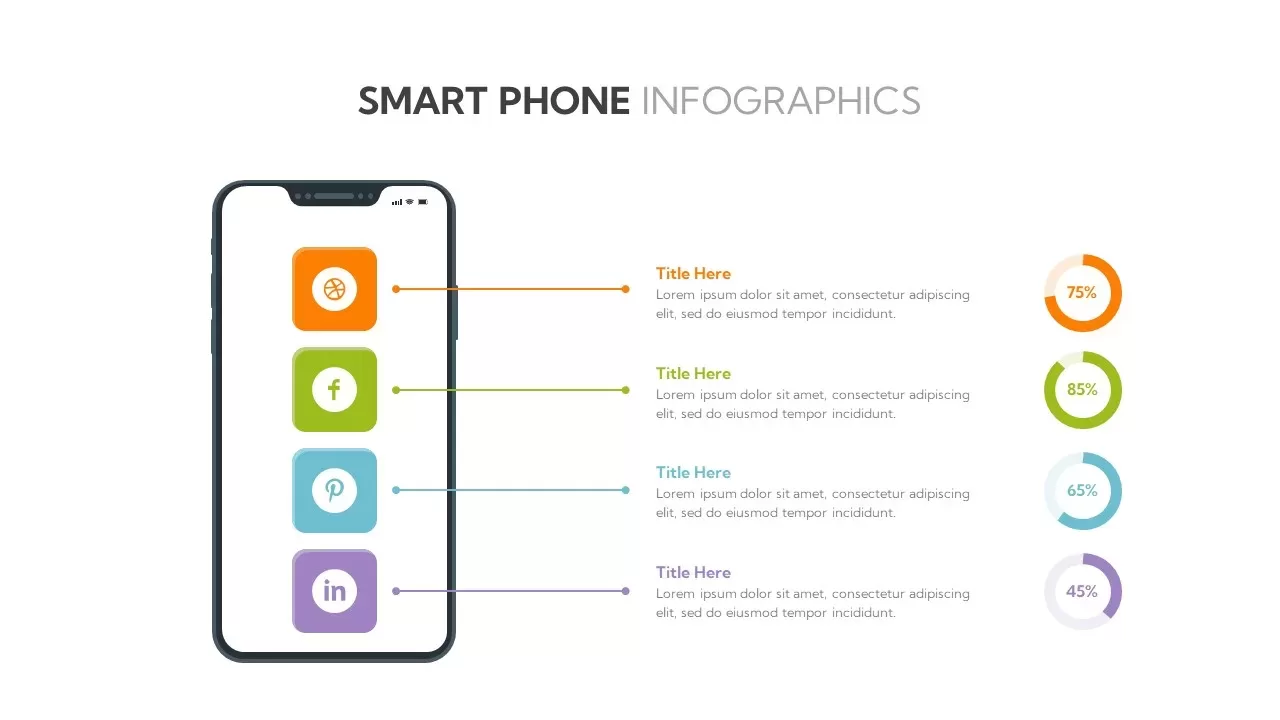
Social Media Smartphone Infographic Template for PowerPoint & Google Slides
Pie/Donut
Social Media Analytics Dashboard Template for PowerPoint & Google Slides
Digital Marketing

Social Media Marketing Agency Pitch Deck Template for PowerPoint & Google Slides
Pitch Deck
Social Media Community Network Slide Template for PowerPoint & Google Slides
Circular
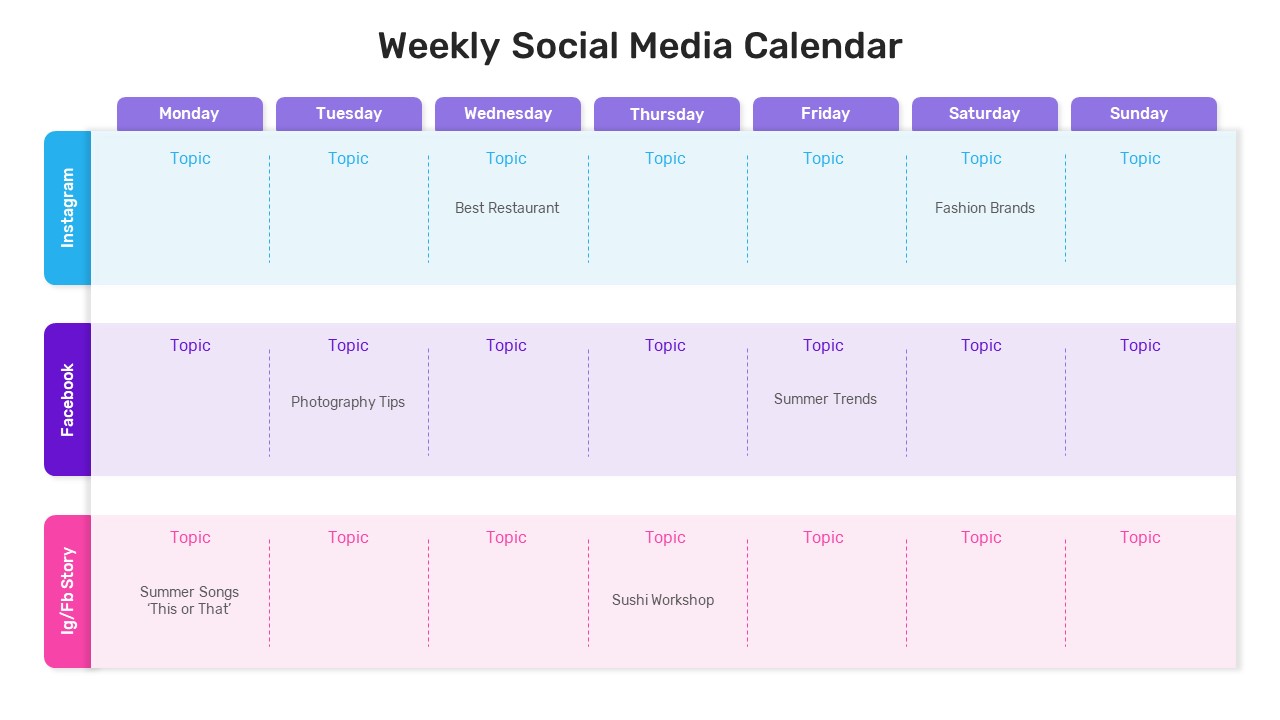
Weekly Social Media Calendar Editable Template for PowerPoint & Google Slides
Digital Marketing
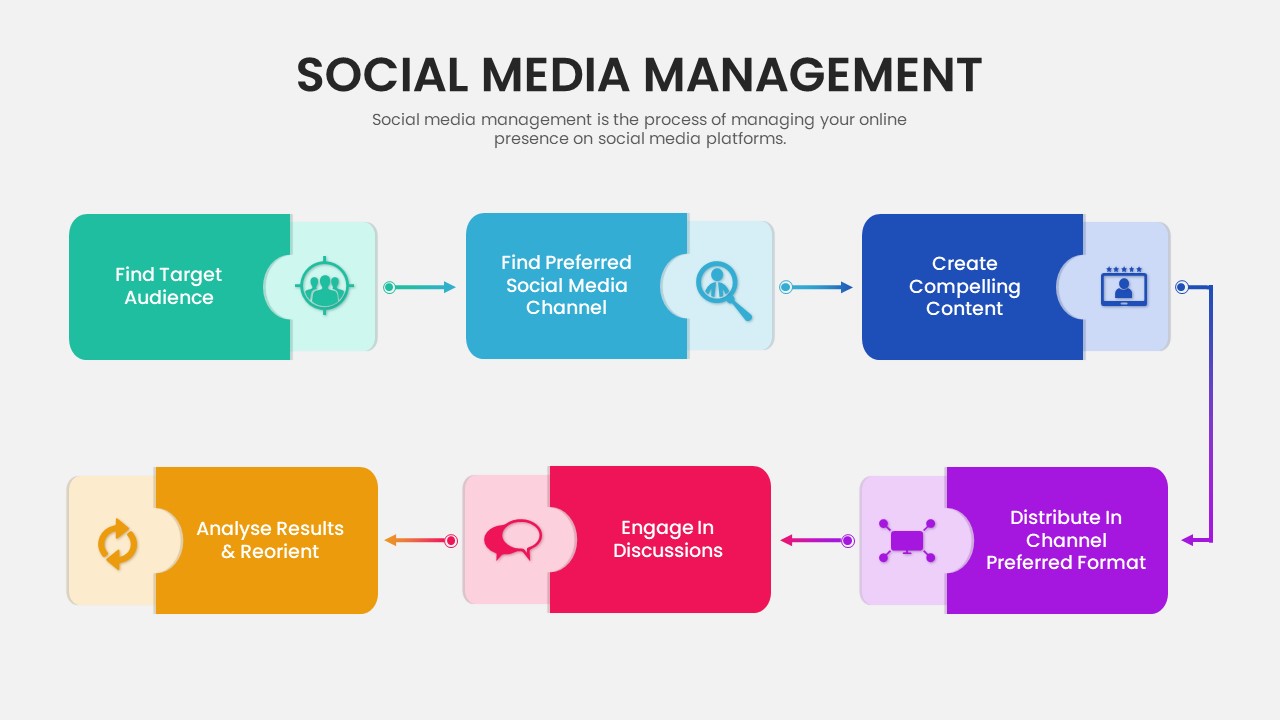
Six-Step Social Media Management Process Template for PowerPoint & Google Slides
Process
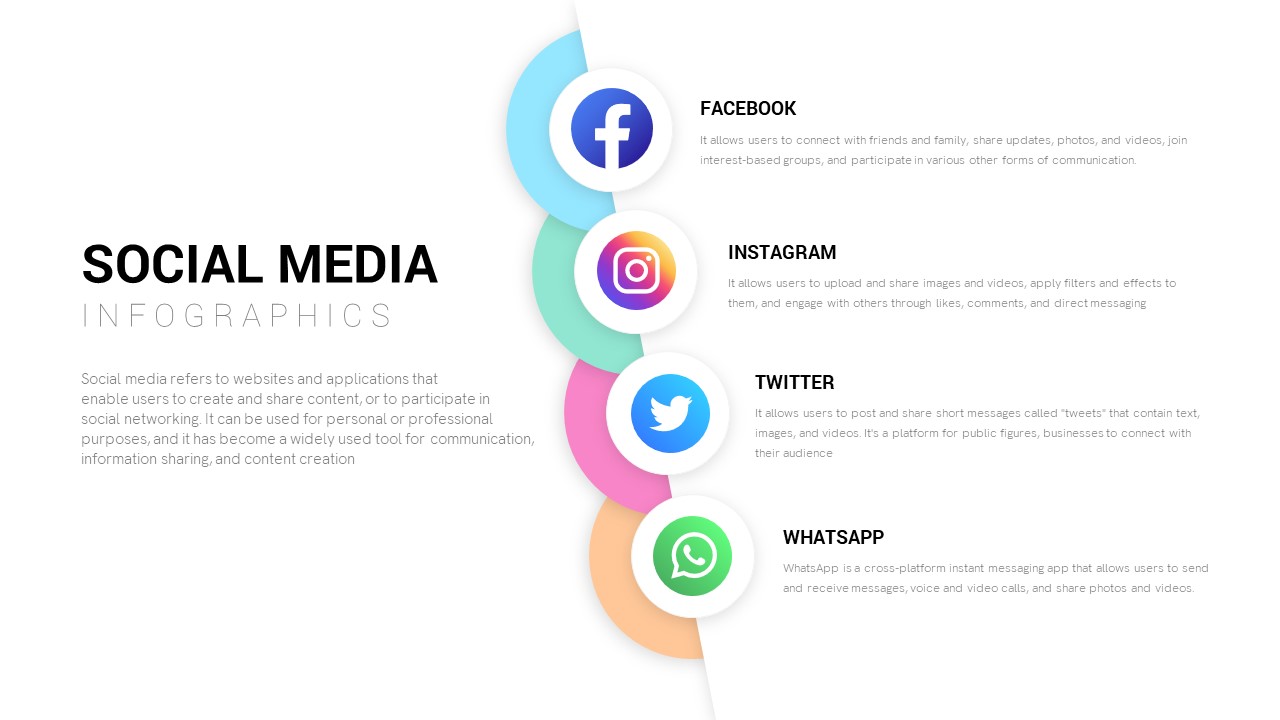
Modern Social Media Infographics Template for PowerPoint & Google Slides
Digital Marketing
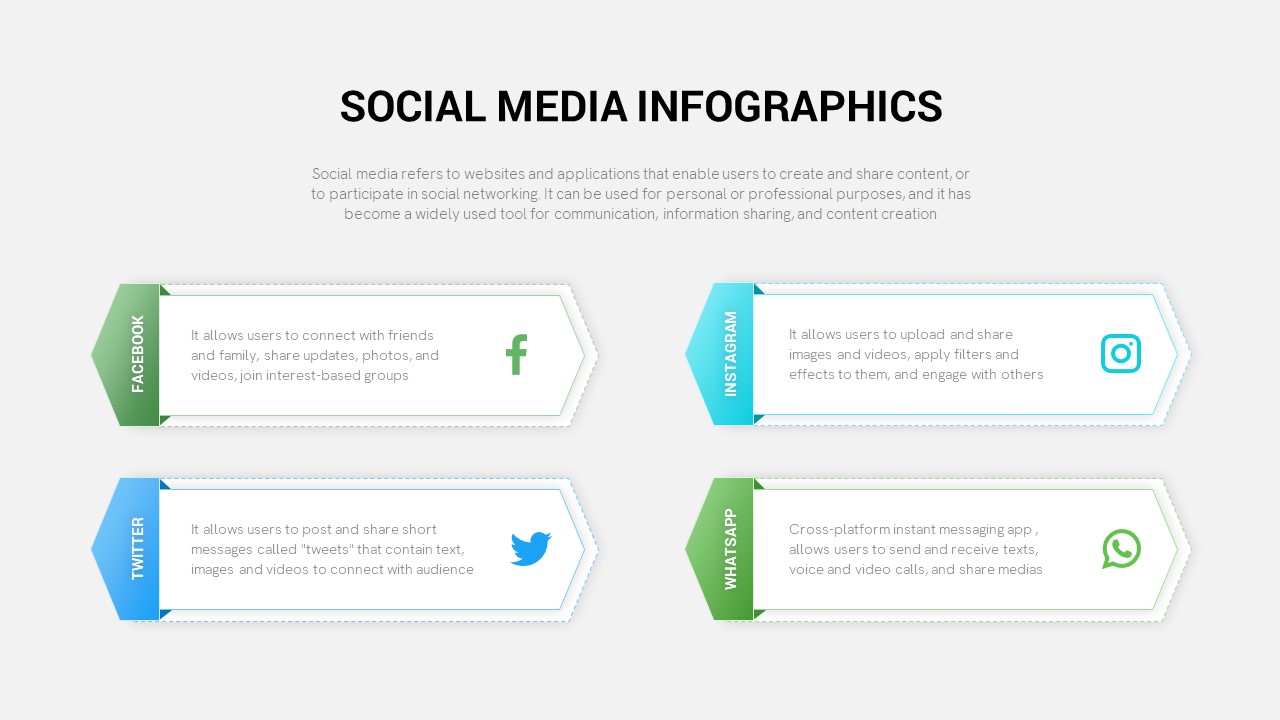
Social Media Infographic Arrow Layout Template for PowerPoint & Google Slides
Arrow
Social Media Plan Table Slide Deck Template for PowerPoint & Google Slides
Process
Social Media Marketing Connection Template for PowerPoint & Google Slides
Digital Marketing
Social Media Policy Dos & Don’ts Slide Template for PowerPoint & Google Slides
Comparison
Social Media Marketing Strategy Template for PowerPoint & Google Slides
Digital Marketing
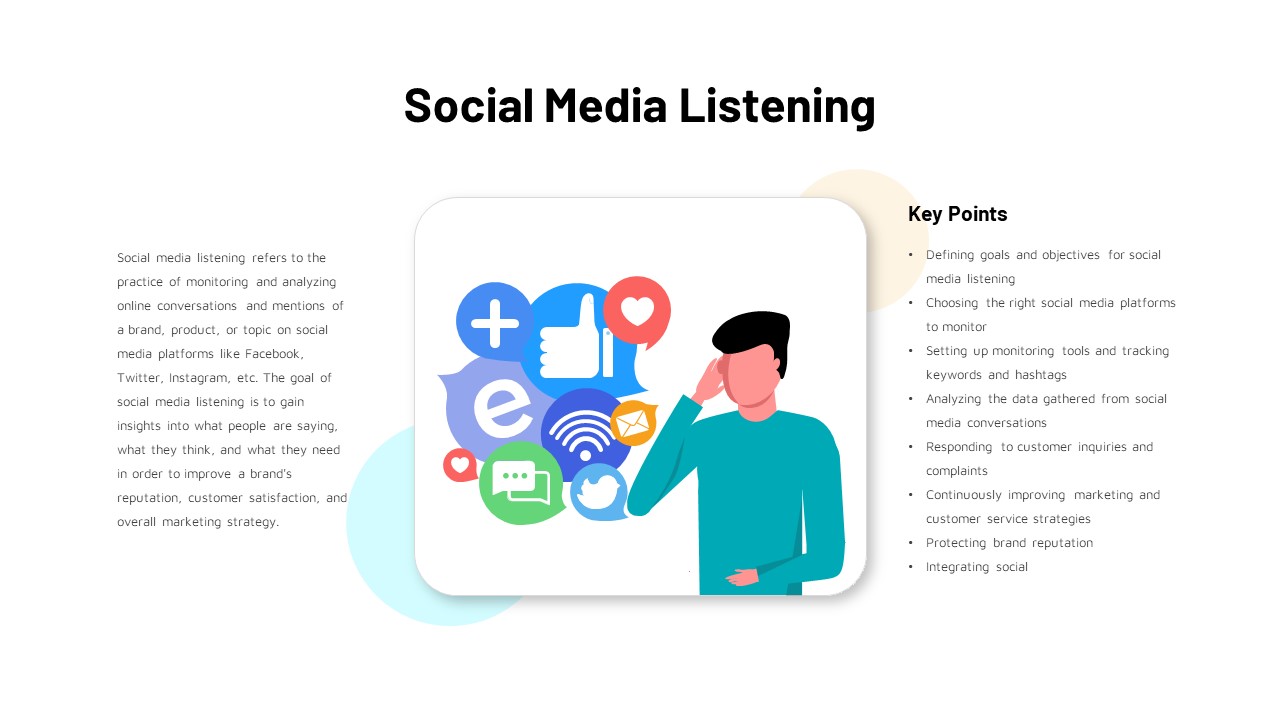
Social Media Listening Overview Slide Template for PowerPoint & Google Slides
Customer Experience
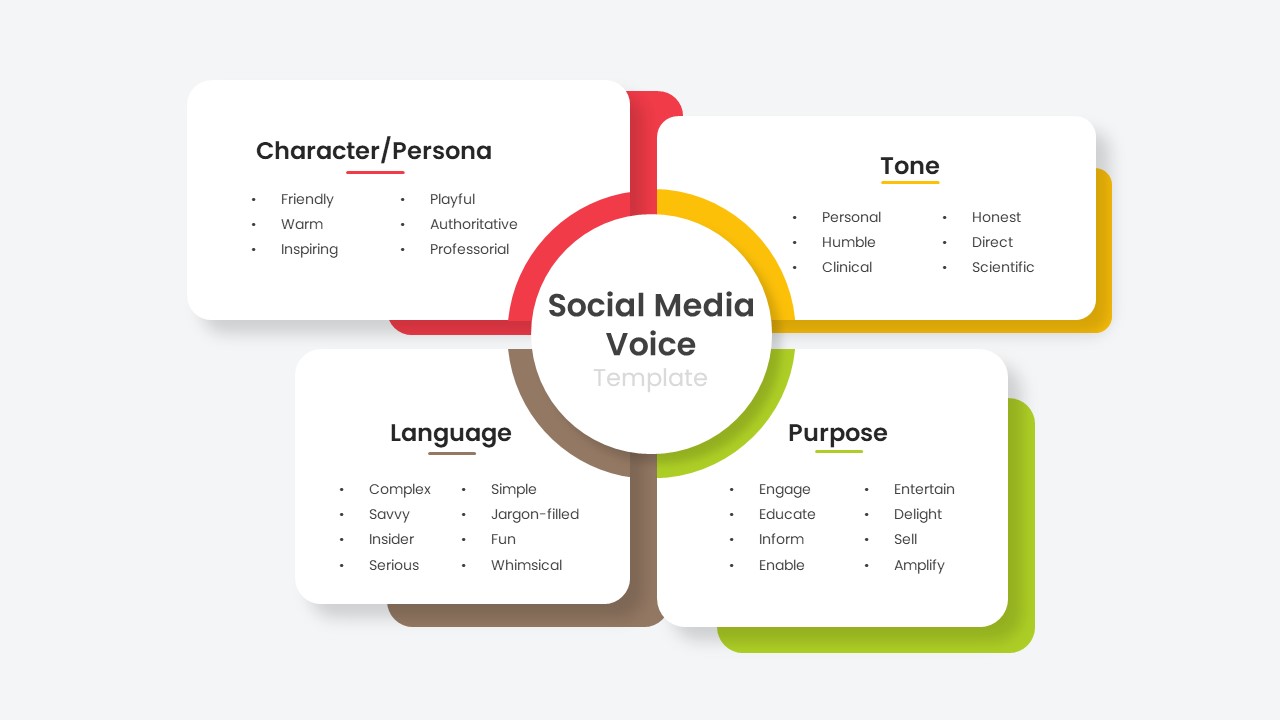
Social Media Voice Template for PowerPoint & Google Slides
Customer Experience
Social Media Hub-and-Spoke Infographics Template for PowerPoint & Google Slides
Circular
Social Media Analysis Metrics Slide Deck Template for PowerPoint & Google Slides
Digital Marketing
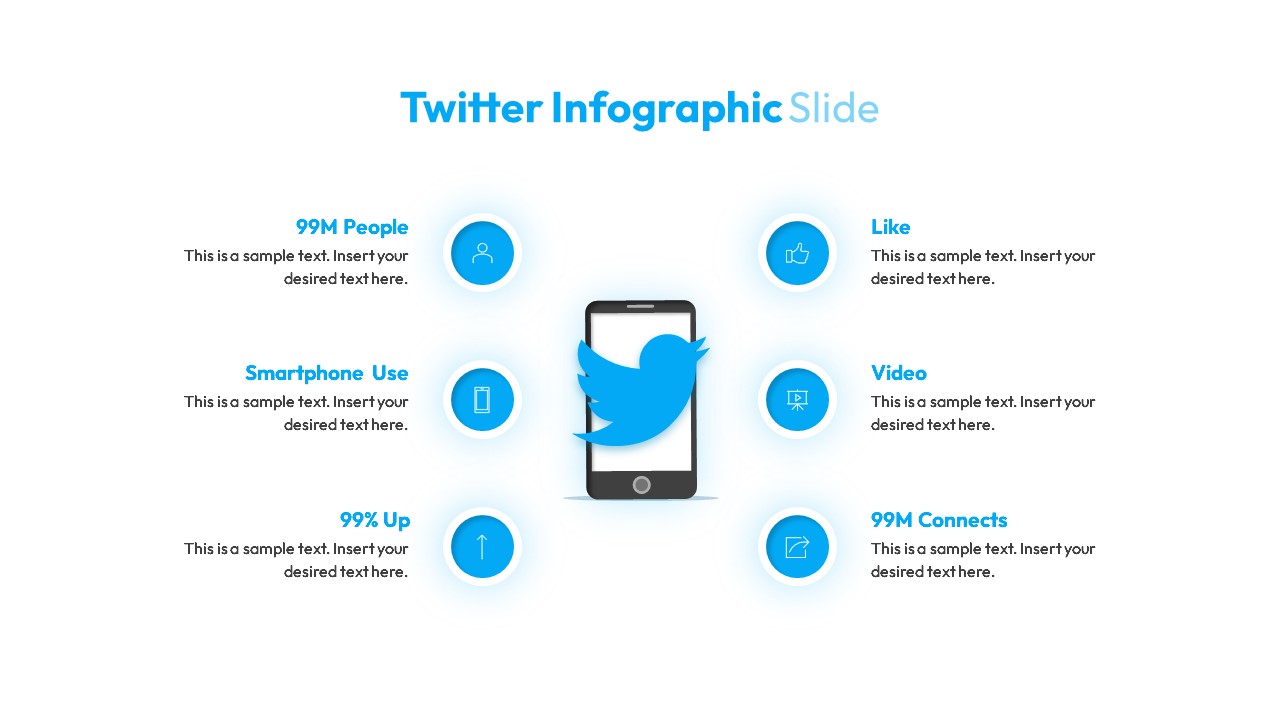
Twitter Social Media Infographic Template for PowerPoint & Google Slides
Circular
Social Media Statistics 2023 Dashboard Template for PowerPoint & Google Slides
Comparison
Social Media Report Presentation Template for PowerPoint & Google Slides
Digital Marketing
Comprehensive Social Media Audit Template for PowerPoint & Google Slides
Digital Marketing
Modern Social Media Timeline Roadmap Template for PowerPoint & Google Slides
Timeline
Social Media Marketing Presentation Template for PowerPoint & Google Slides
Decks
Free Social Media Hub-and-Spoke Infographic Template for PowerPoint & Google Slides
Circular
Free
Social Media Presentation Template for PowerPoint & Google Slides
Pitch Deck
Social Media Marketing Overview Template for PowerPoint & Google Slides
Advertising
Social Media Timeline template for PowerPoint & Google Slides
Timeline
Social Media Recruiting Strategy template for PowerPoint & Google Slides
Business
Social Media Network Hub Diagram Slide for PowerPoint & Google Slides
Process
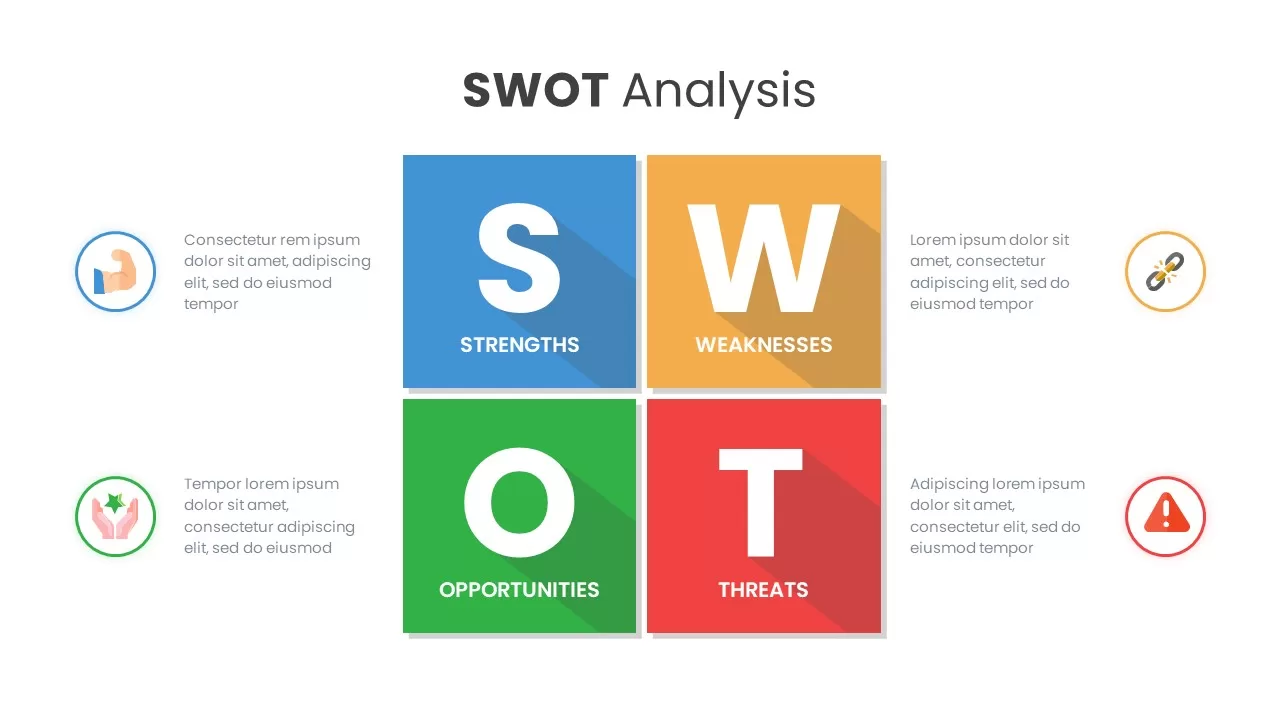
SWOT Analysis Grid Infographic Template for PowerPoint & Google Slides
SWOT
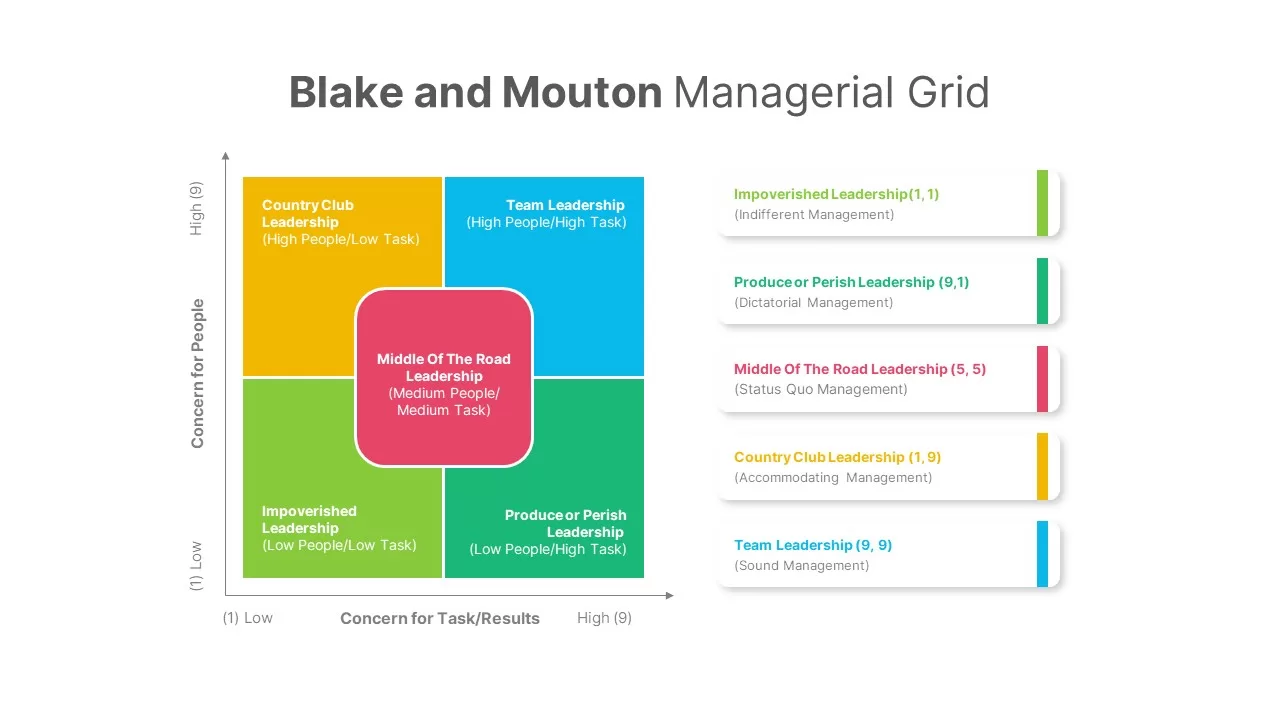
Free Blake and Mouton Leadership Grid Template for PowerPoint & Google Slides
Comparison Chart
Free
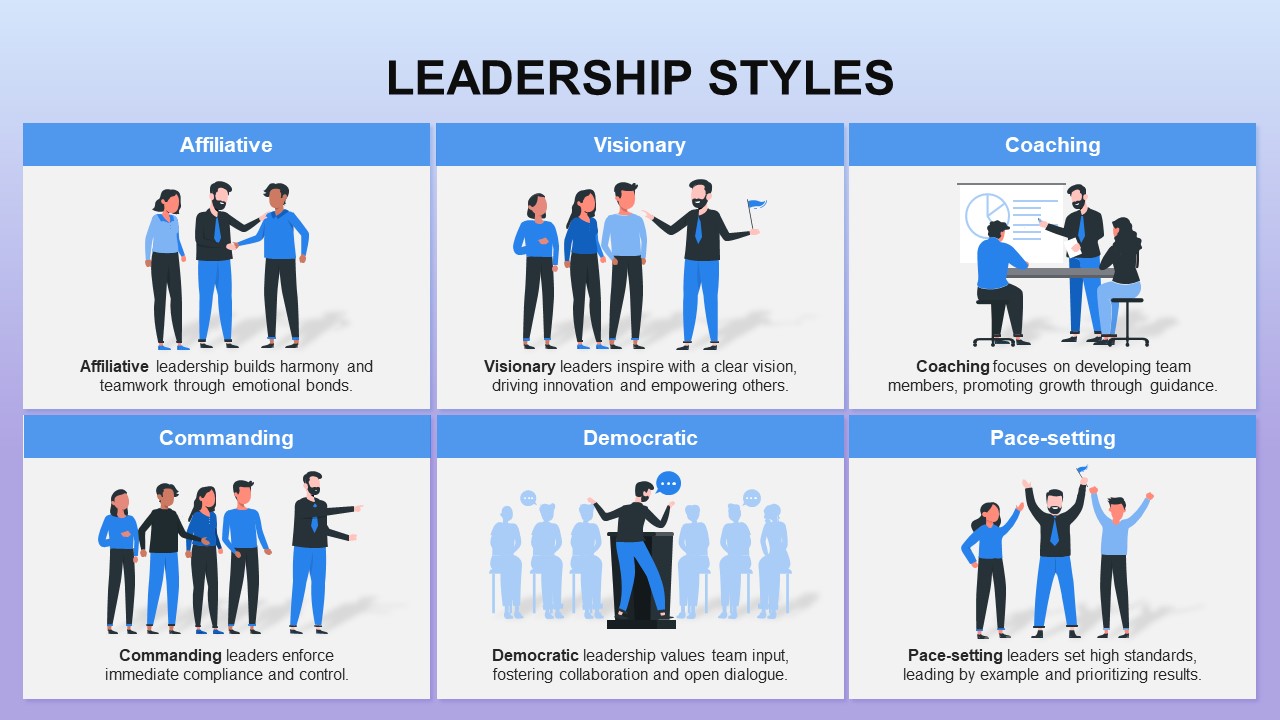
Six Leadership Styles Grid Infographic Template for PowerPoint & Google Slides
Leadership
Elegant Diamond Photo Grid Layout Template for PowerPoint & Google Slides
Graphics
Modern Mosaic Photo Grid Layout Template for PowerPoint & Google Slides
Graphics
Creative Photo Collage Grid Layout Template for PowerPoint & Google Slides
Graphics
Dessert Photo Collage Grid Layout Template for PowerPoint & Google Slides
Graphics
Contemporary Mosaic Photo Grid Cover Slide Template for PowerPoint & Google Slides
Company Profile
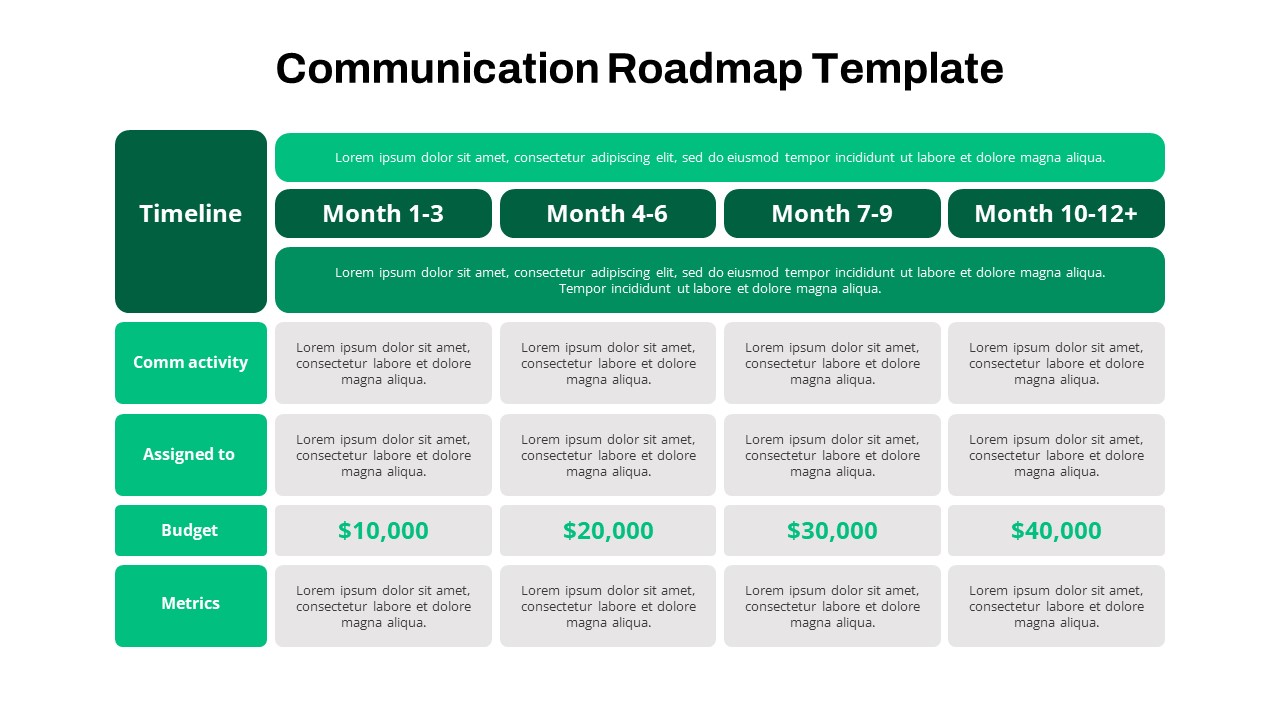
Quarterly Communication Roadmap Grid Template for PowerPoint & Google Slides
Marketing
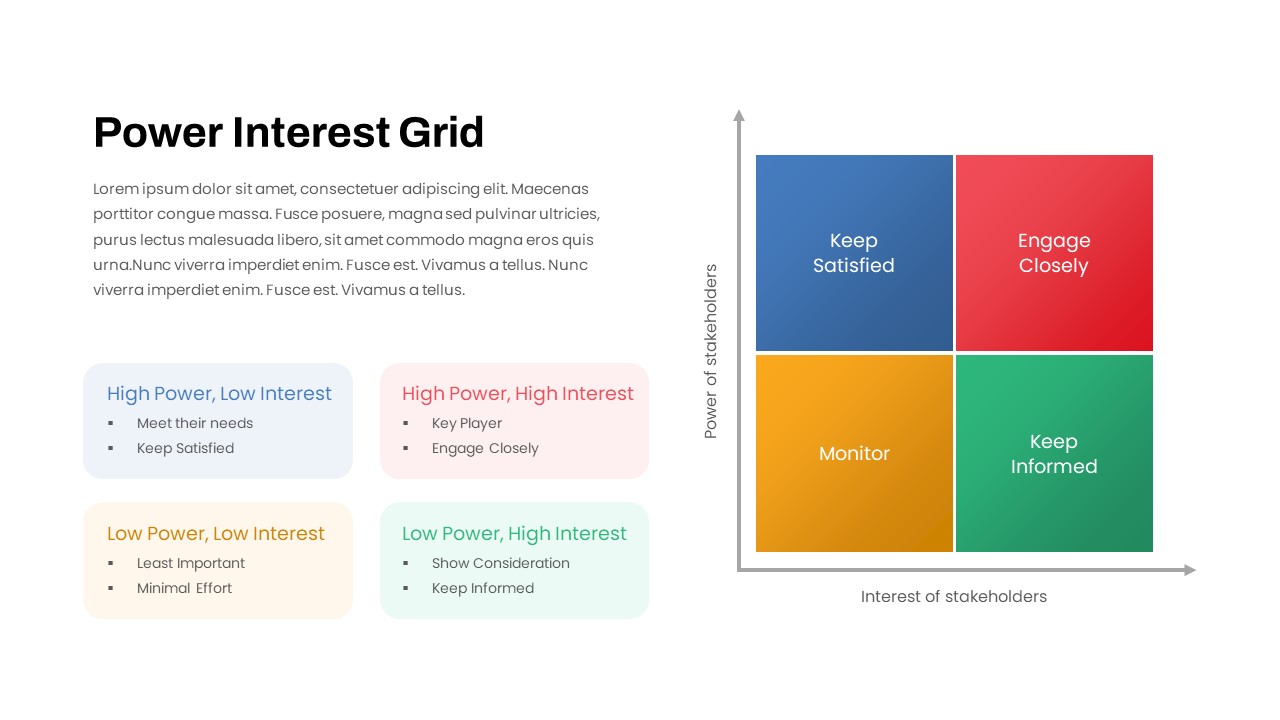
Stakeholder Power Interest Grid Template for PowerPoint & Google Slides
Comparison
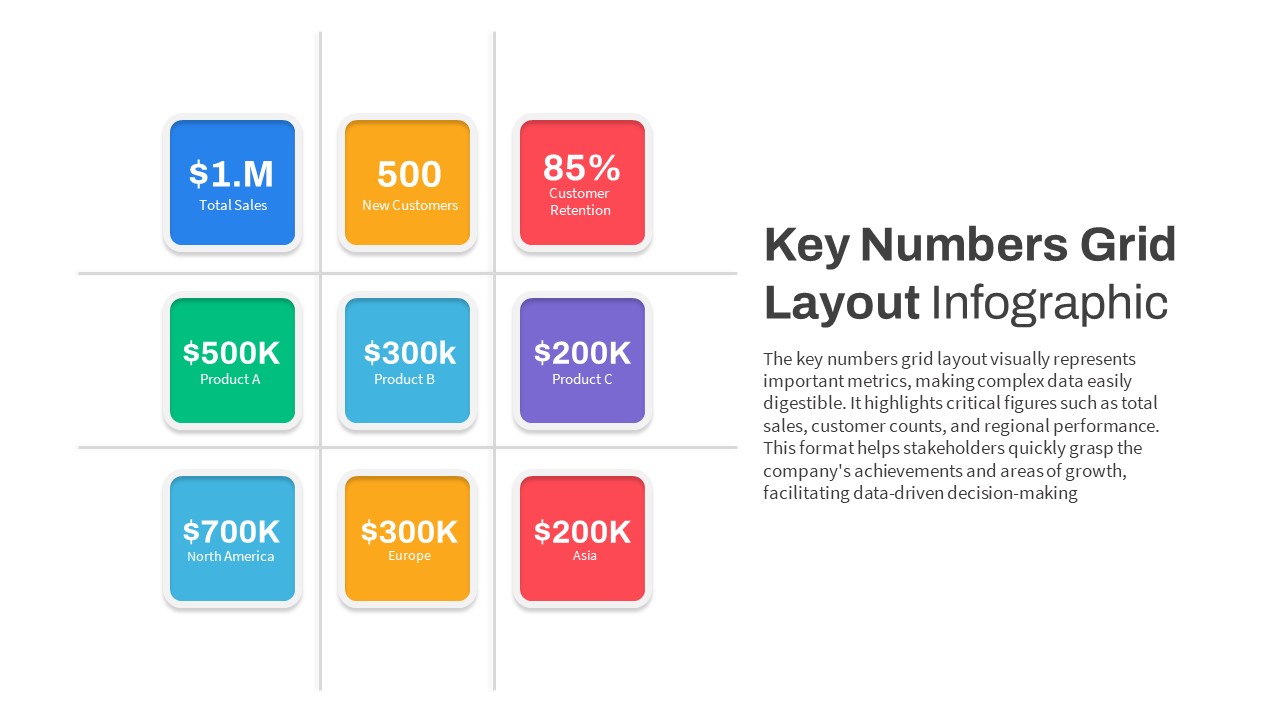
Key Numbers Grid Layout Infographic Template for PowerPoint & Google Slides
Business Report
Matrix Grid Diagram Template for PowerPoint & Google Slides
Comparison
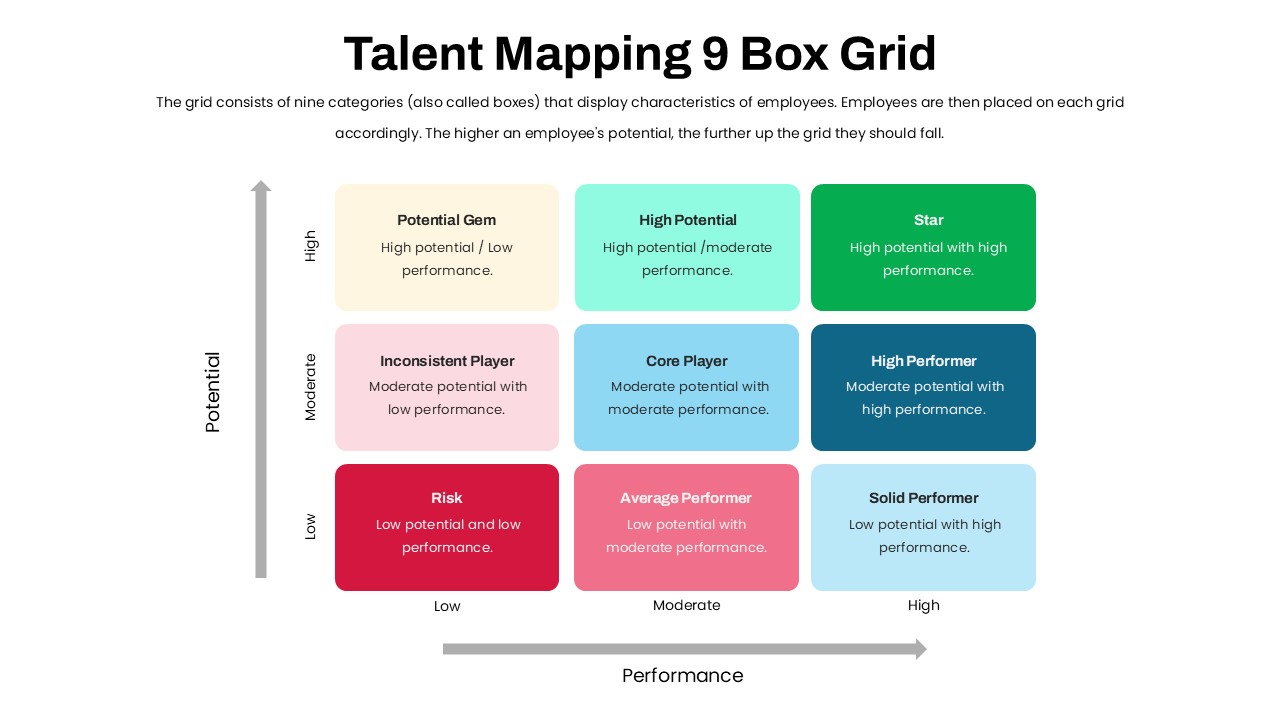
Talent Mapping 9-Box Grid Template for PowerPoint & Google Slides
Employee Performance
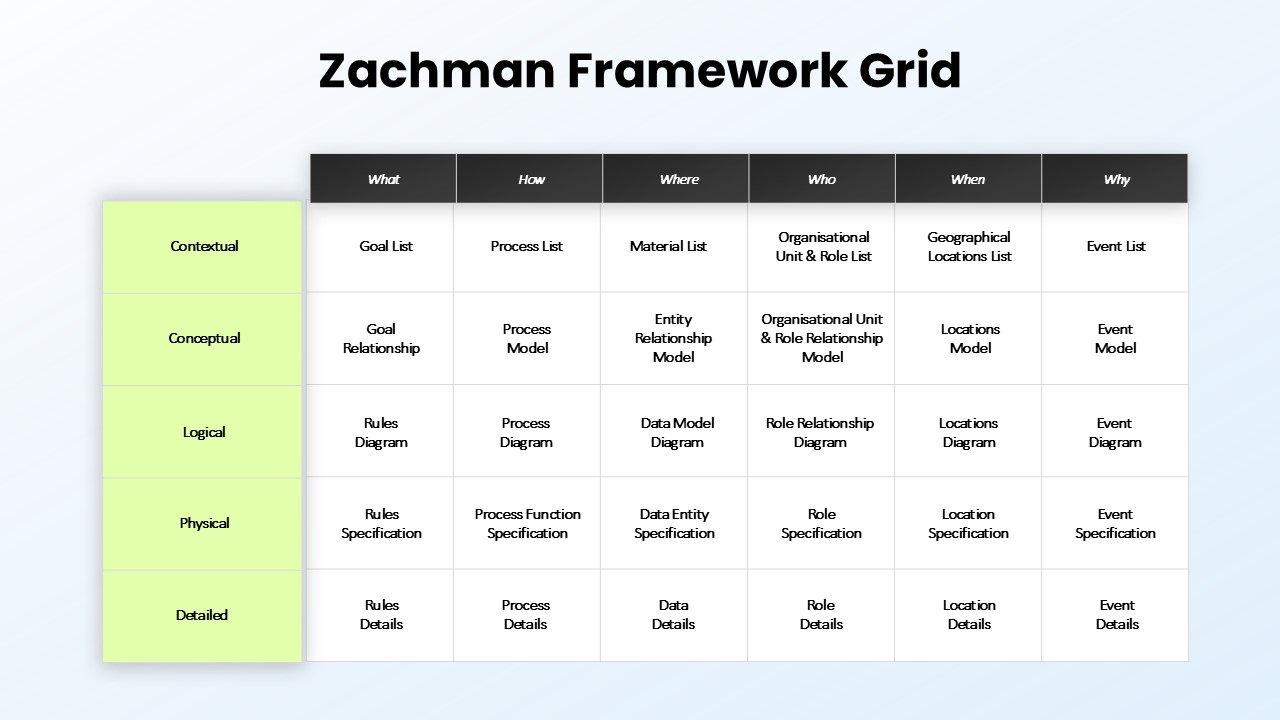
Zachman Framework Grid Overview template for PowerPoint & Google Slides
Process

News Metaphor Media Communication Slide Template for PowerPoint & Google Slides
Business Report
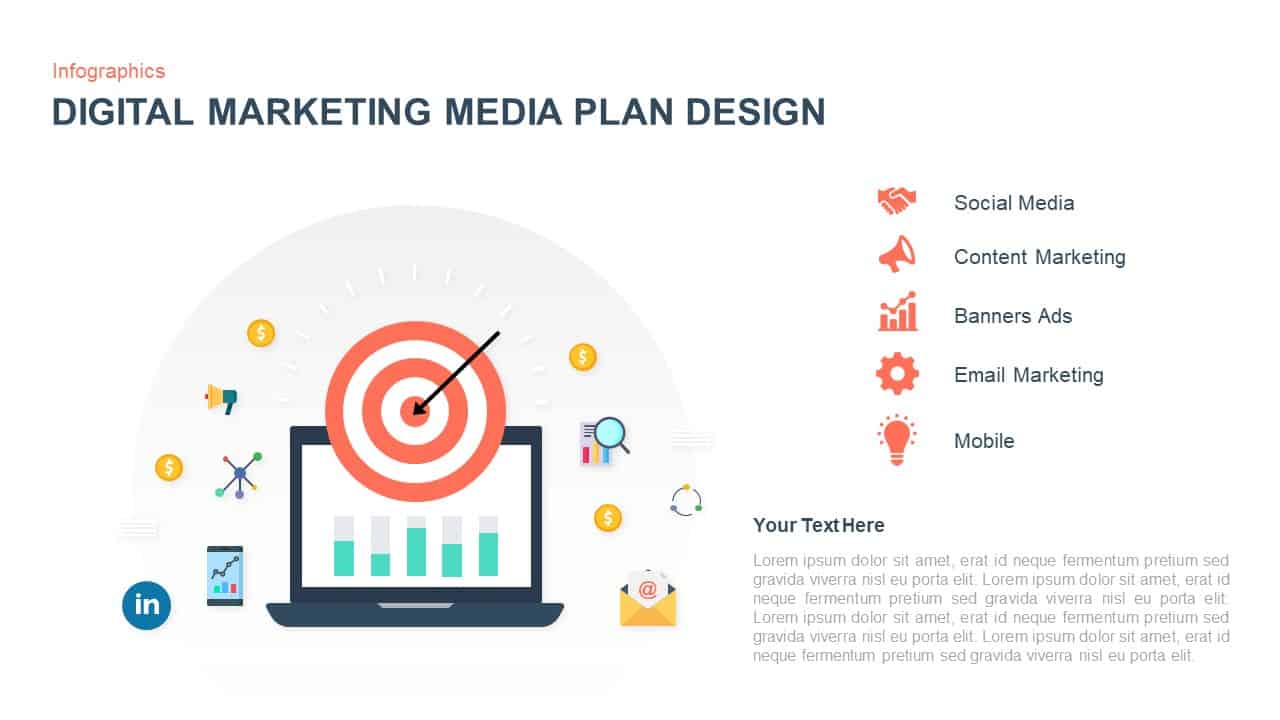
Digital Marketing Media Plan Infographic Template for PowerPoint & Google Slides
Digital Marketing
Influencer Media Kit Company Profile Template for PowerPoint & Google Slides
Company Profile
Service Zoom Feature Slides Comparison template for PowerPoint & Google Slides
Process
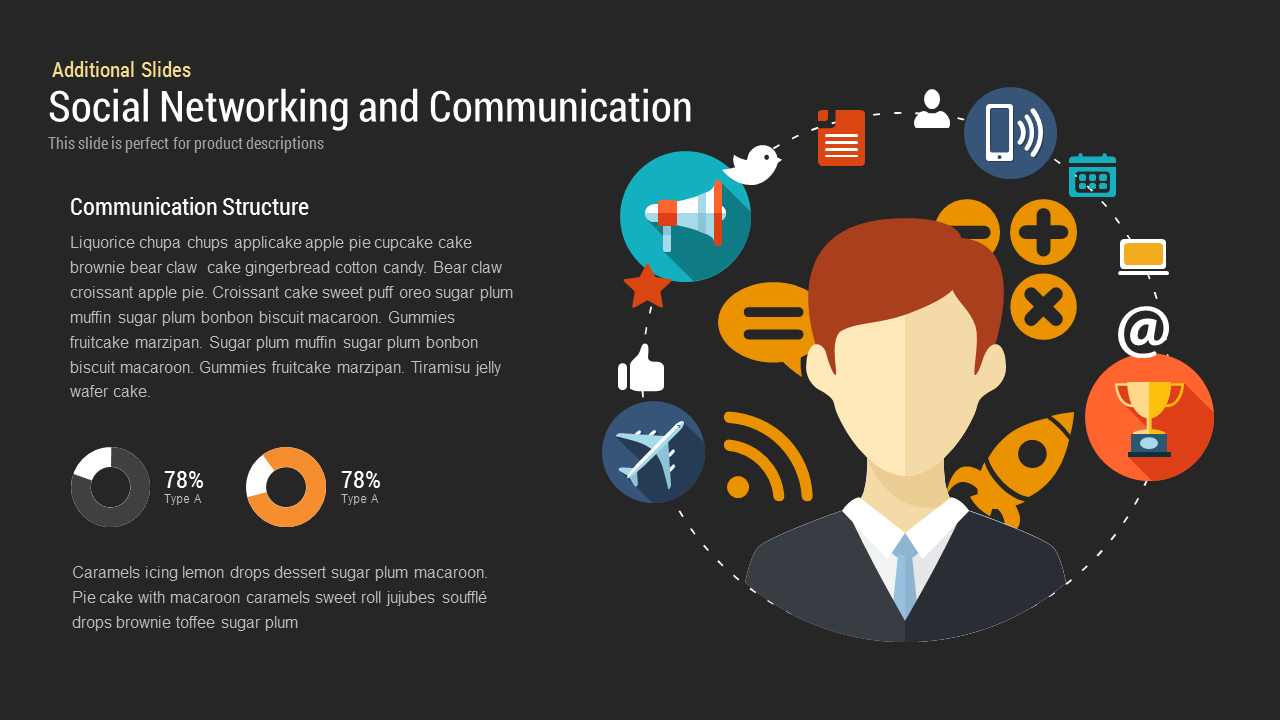
Social Networking and Communication template for PowerPoint & Google Slides
Digital Marketing
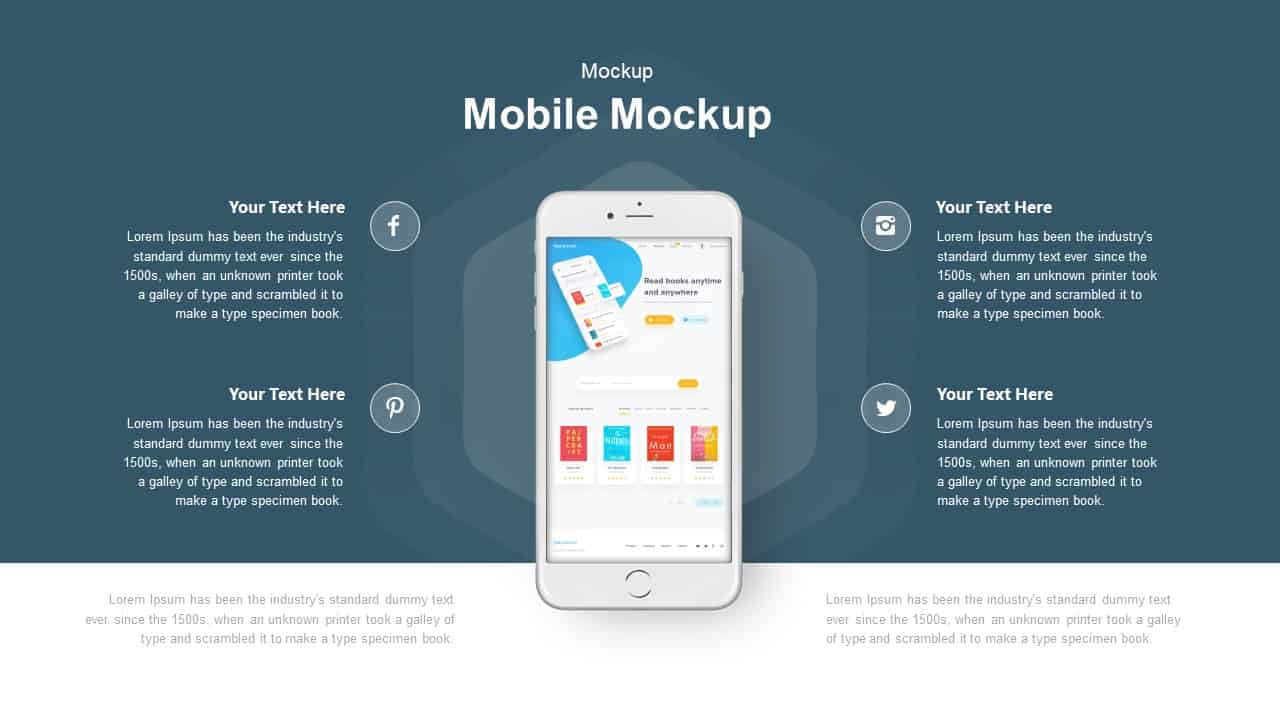
Mobile Mockup with Social Callouts Template for PowerPoint & Google Slides
Software Development
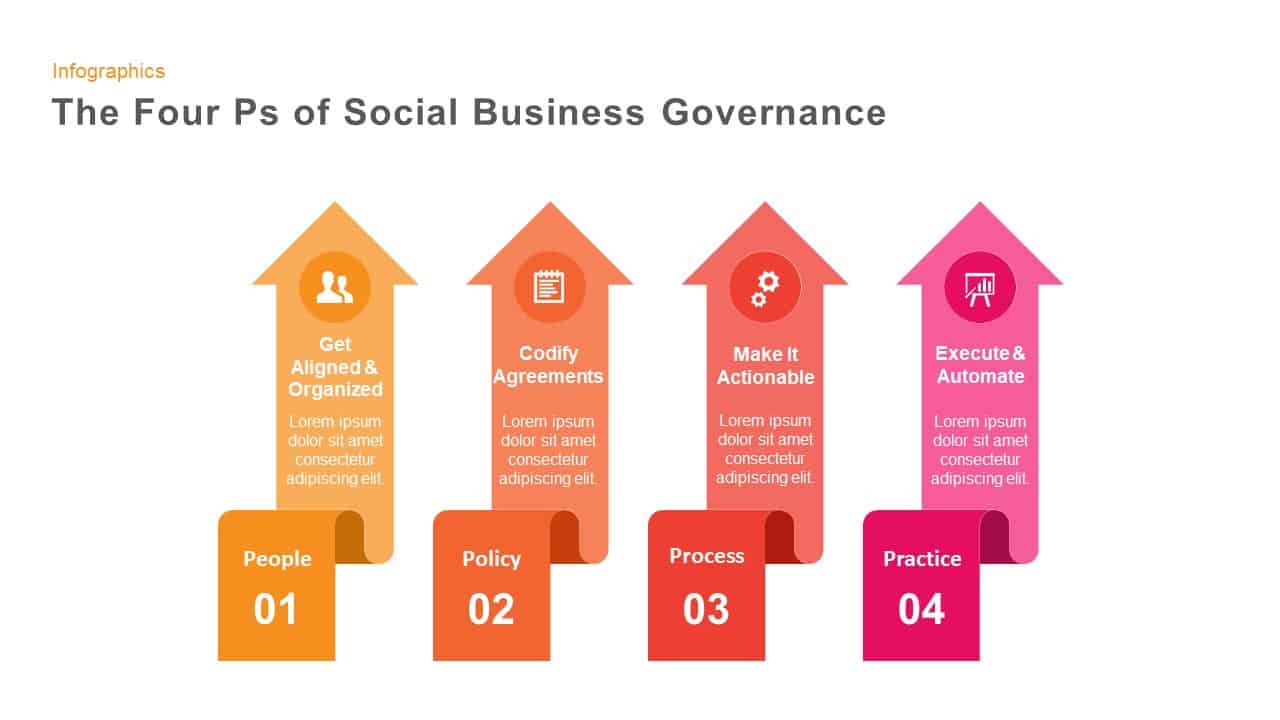
Four Ps of Social Business Governance template for PowerPoint & Google Slides
Business Strategy
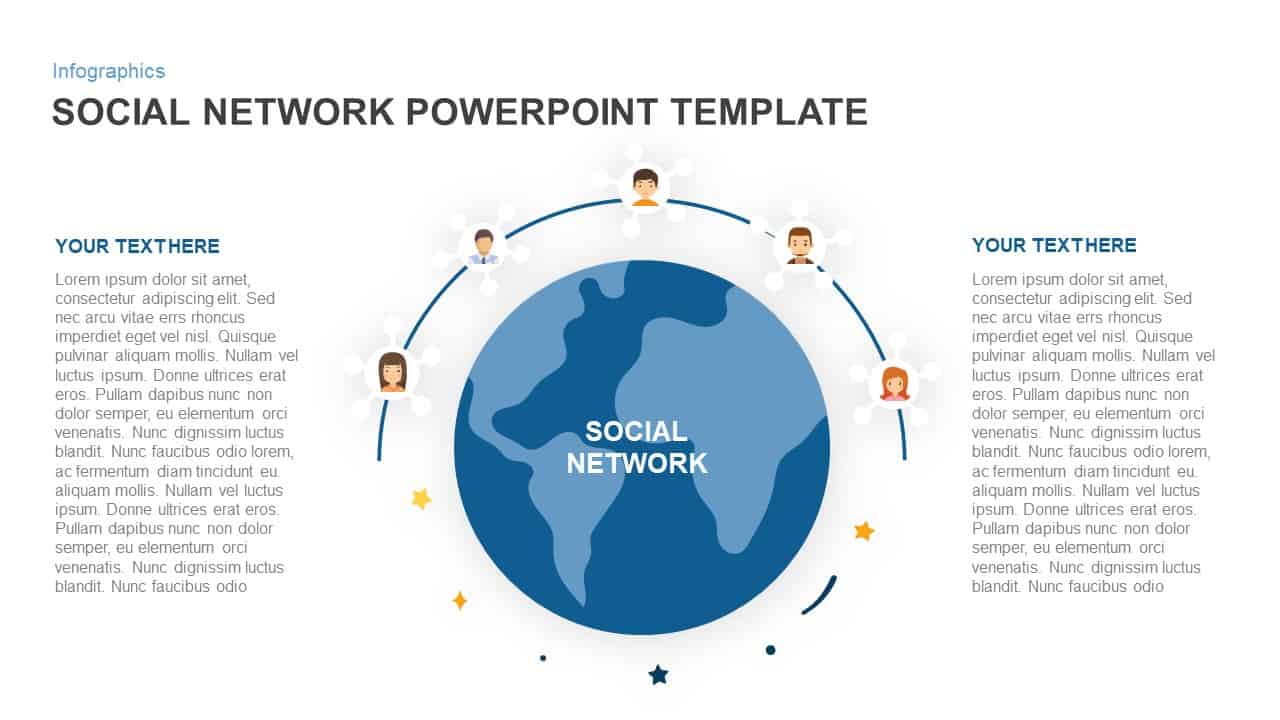
Social Network Connectivity Infographic Template for PowerPoint & Google Slides
Infographics
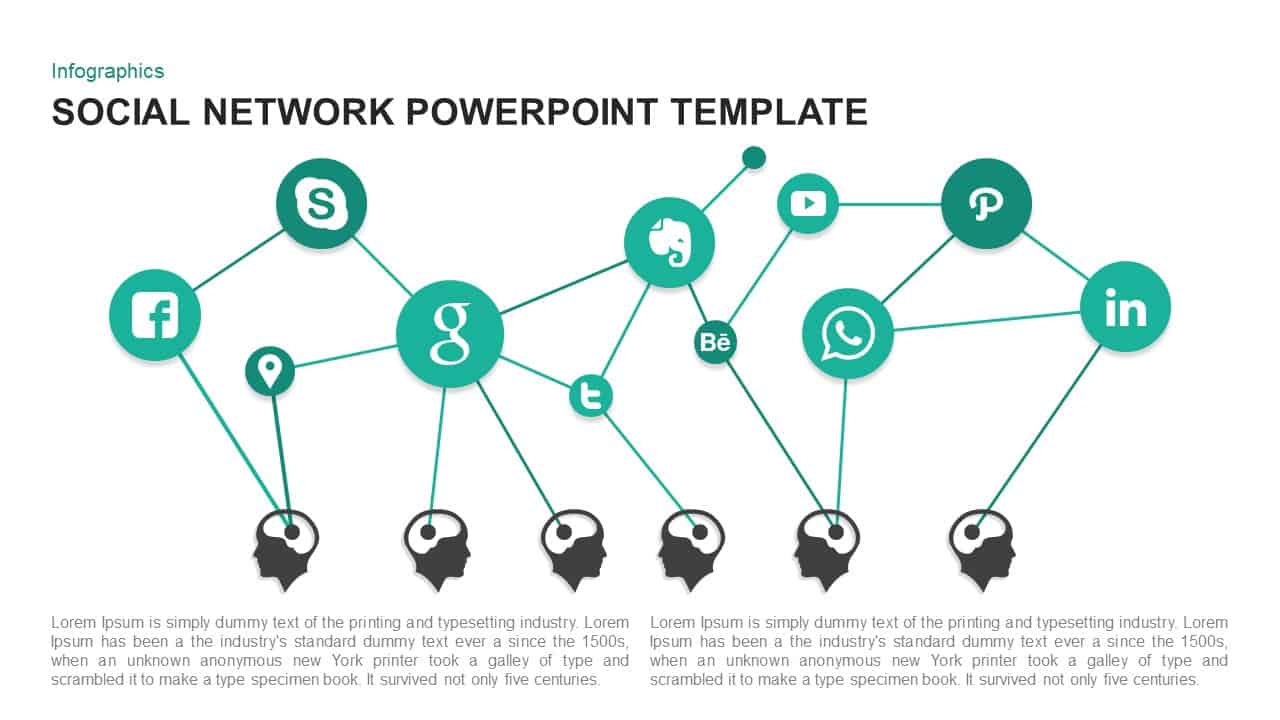
Social Network Infographic Diagram Template for PowerPoint & Google Slides
Digital Marketing
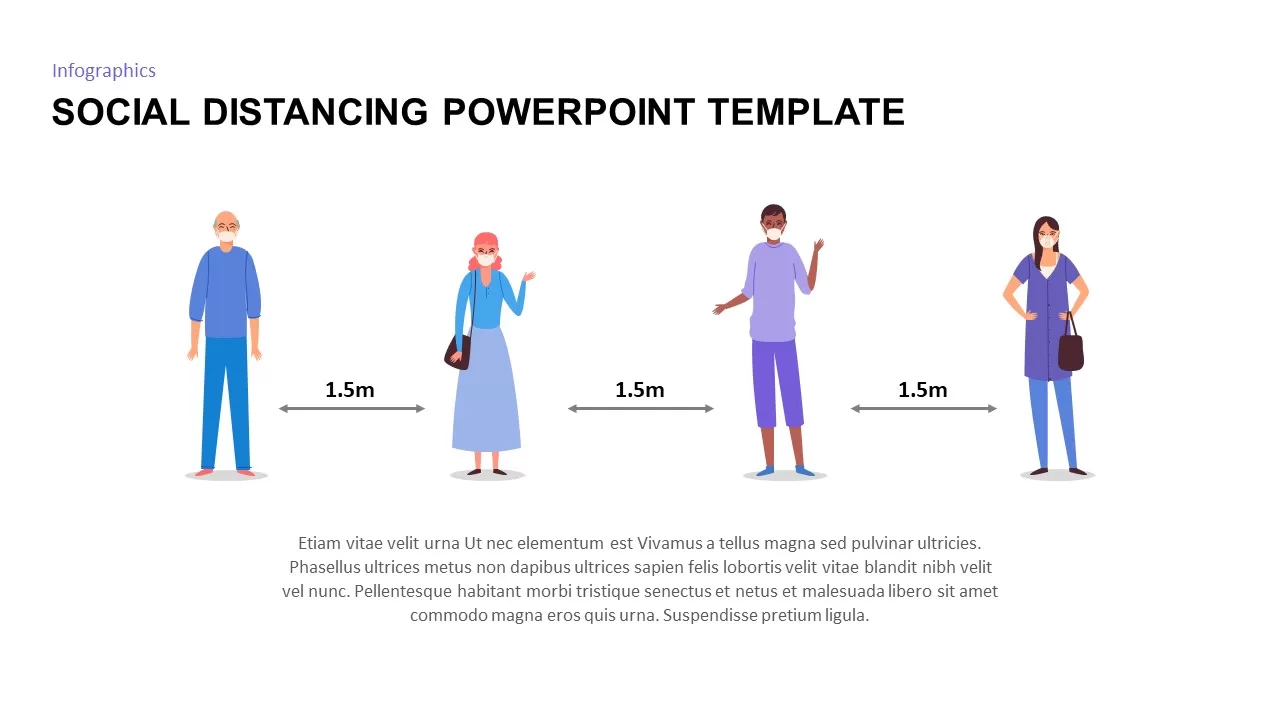
Social Distancing PowerPoint & Google Slides Template
Business Strategy
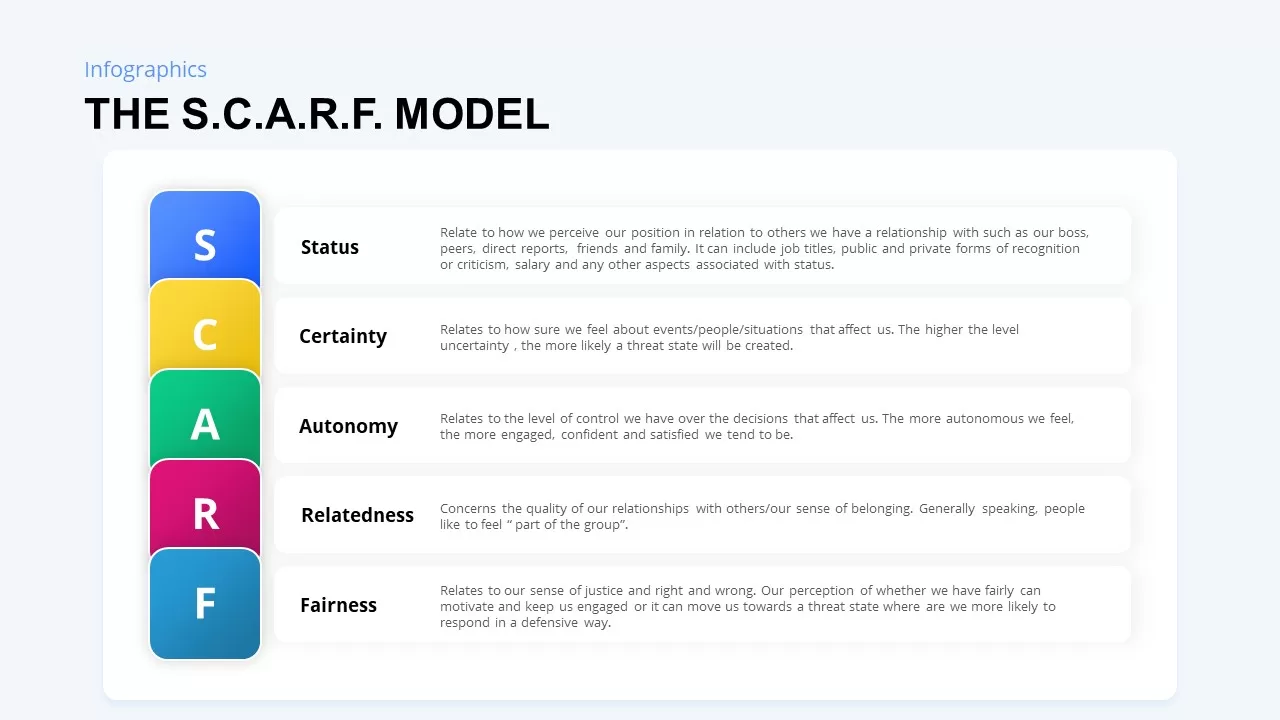
SCARF Model Social Threats & Rewards Template for PowerPoint & Google Slides
Business Strategy
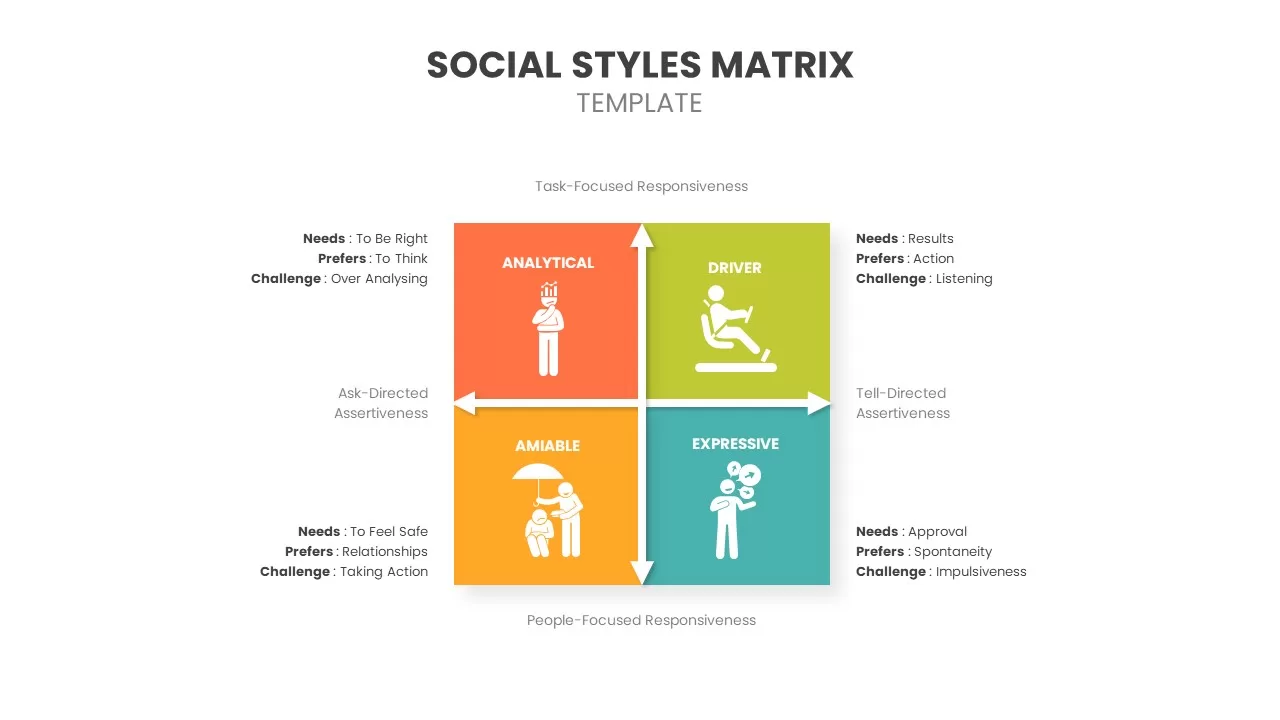
Social Styles Matrix Template for PowerPoint & Google Slides
Business
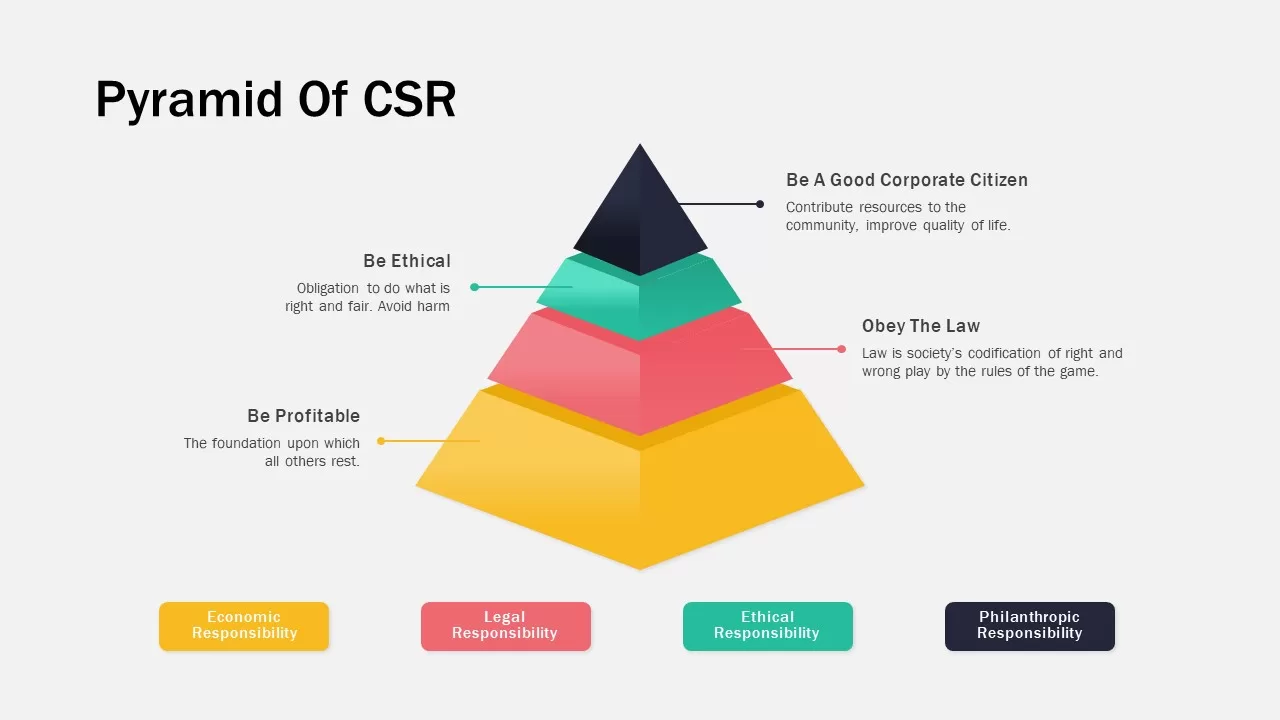
Corporate Social Responsibility Pyramid Template for PowerPoint & Google Slides
Pyramid
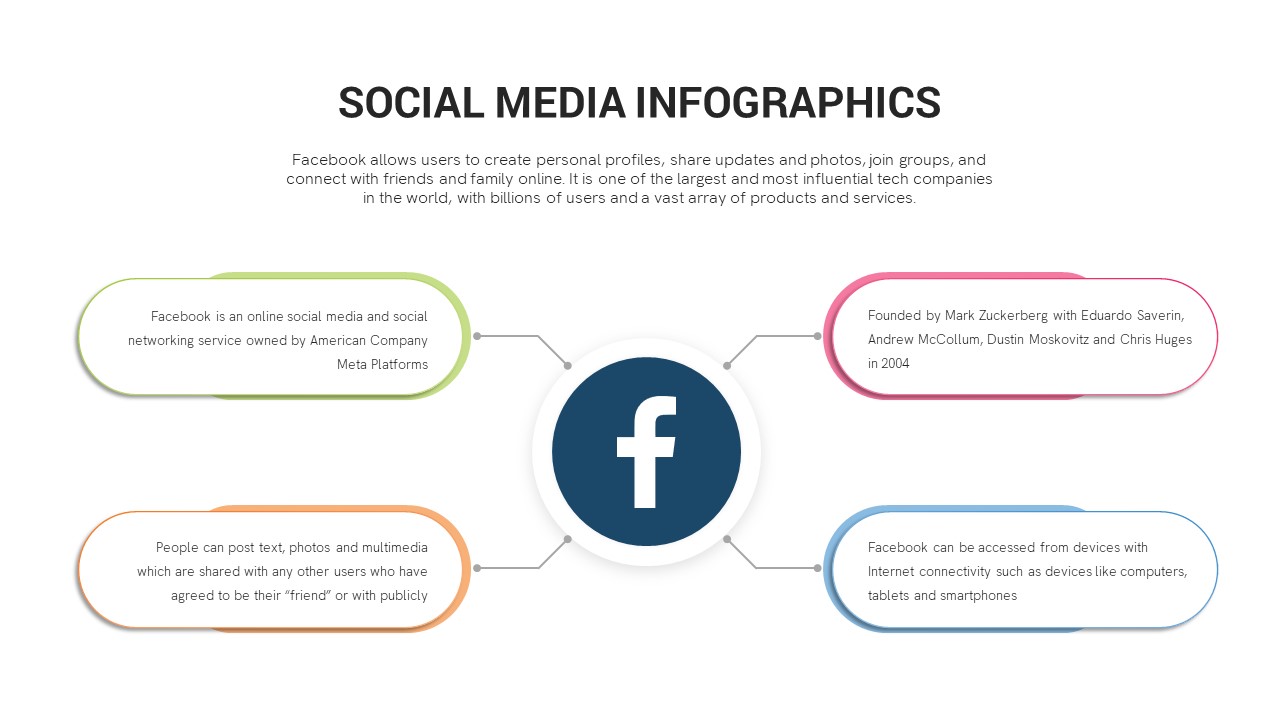
Facebook Social Metrics Infographic Template for PowerPoint & Google Slides
Graphics
Corporate Social Responsibility Strategy Template for PowerPoint & Google Slides
Company Profile
Free Comprehensive Social Work Presentation Template for PowerPoint & Google Slides
Pitch Deck
Free
Free Nonprofit Charity Social Impact Deck Template for PowerPoint & Google Slides
Pitch Deck
Free
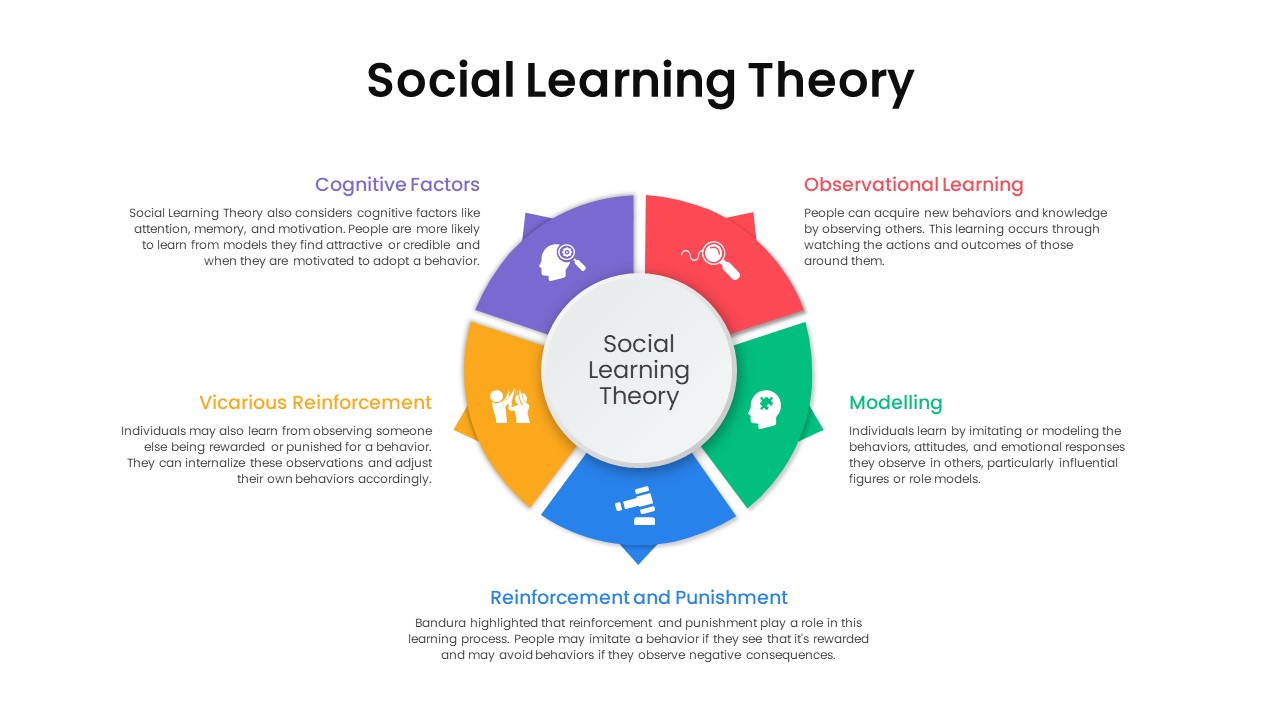
Social Learning Theory Infographic Template for PowerPoint & Google Slides
Circular
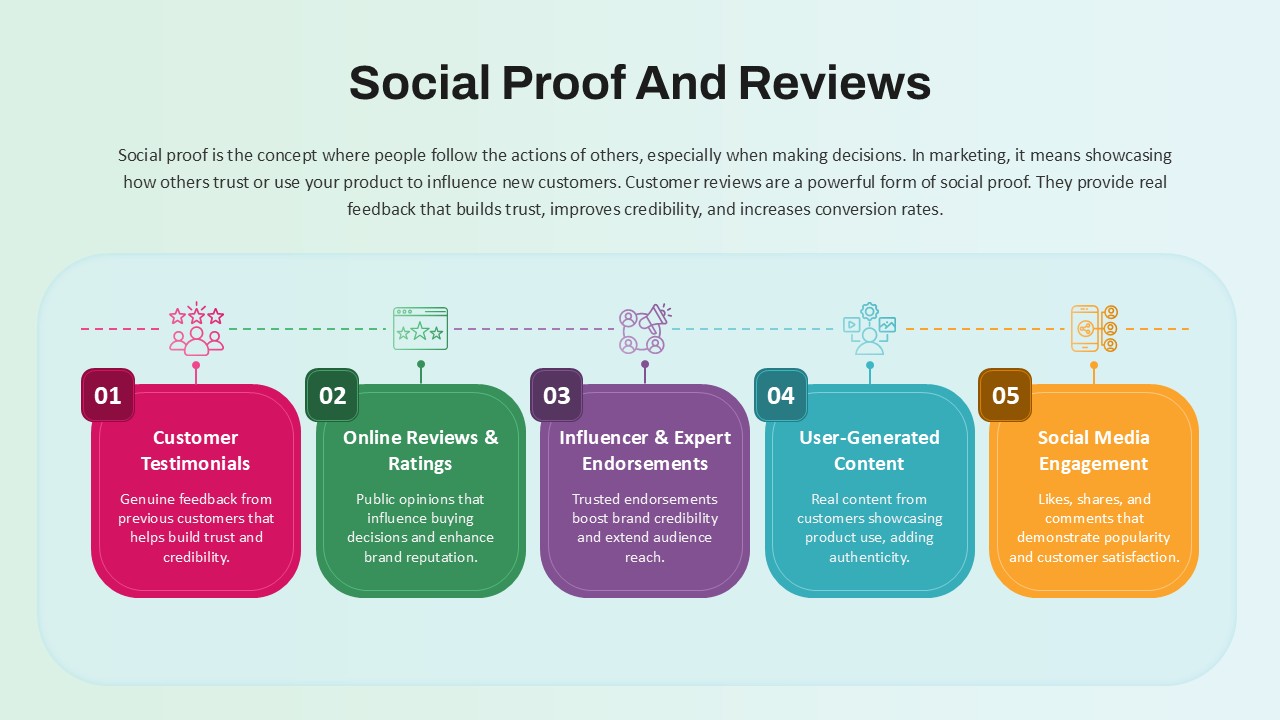
Social Proof and Reviews in Marketing template for PowerPoint & Google Slides
Customer Journey
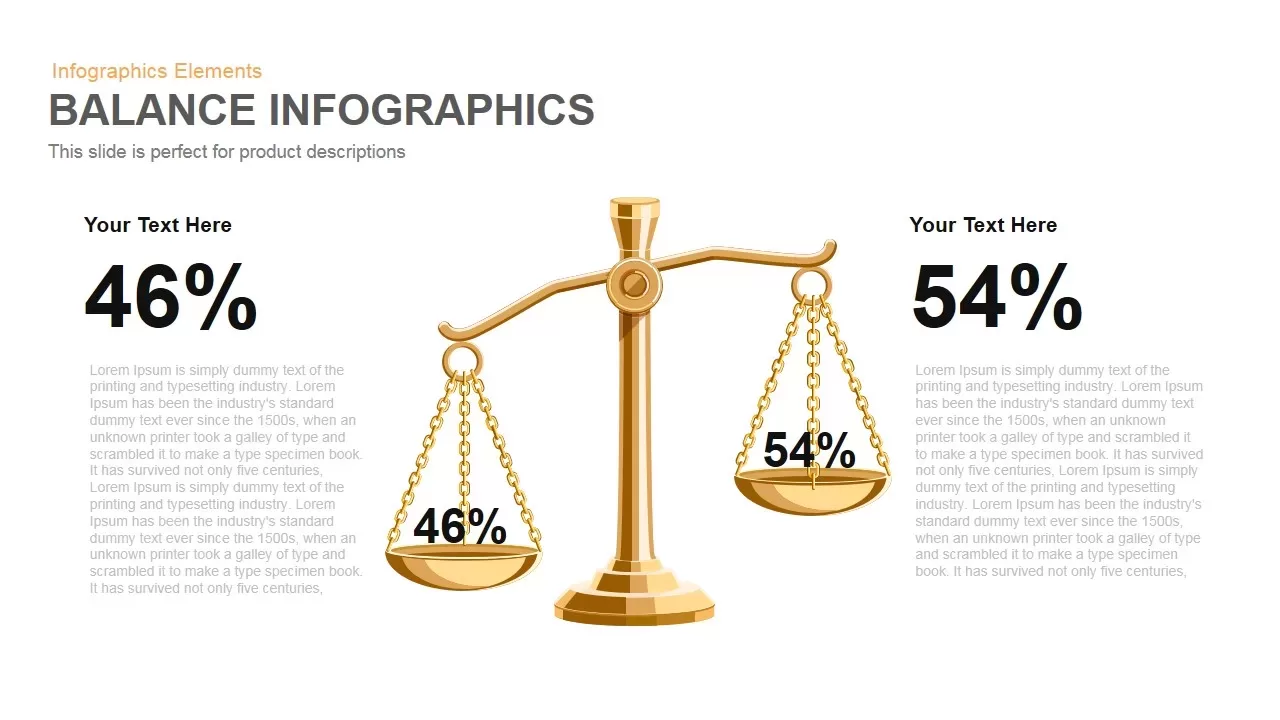
Gold Scales Balance Comparison Template for PowerPoint & Google Slides
Comparison
Four-Tier Pricing Comparison Table Template for PowerPoint & Google Slides
Comparison

A/B Testing Comparison Infographic template for PowerPoint & Google Slides
Comparison
Four-Plan Pricing Table Comparison Template for PowerPoint & Google Slides
Comparison
Interactive Pricing Plan Comparison Template for PowerPoint & Google Slides
Comparison
Six-Metric Green Product Comparison Template for PowerPoint & Google Slides
Comparison
Two-Column Comparison Infographic Slide Template for PowerPoint & Google Slides
Comparison

BMI Category Comparison Chart Template for PowerPoint & Google Slides
Comparison
Theory X and Theory Y Comparison Template for PowerPoint & Google Slides
Comparison
Competitive Landscape Comparison Template Pack for PowerPoint & Google Slides
Comparison
Before and After Comparison Infographics Template for PowerPoint & Google Slides
Comparison
Current vs Future State Comparison Slide Template for PowerPoint & Google Slides
Comparison Chart
Conflict Infographics Comparison Template for PowerPoint & Google Slides
Infographics
Clustered Bar Chart Comparison Template for PowerPoint & Google Slides
Bar/Column
Multiple Line Chart Comparison Template for PowerPoint & Google Slides
Comparison Chart
Interactive Multi-Use Cost Comparison Template for PowerPoint & Google Slides
Comparison
Regional Revenue Comparison Overview Template for PowerPoint & Google Slides
Comparison
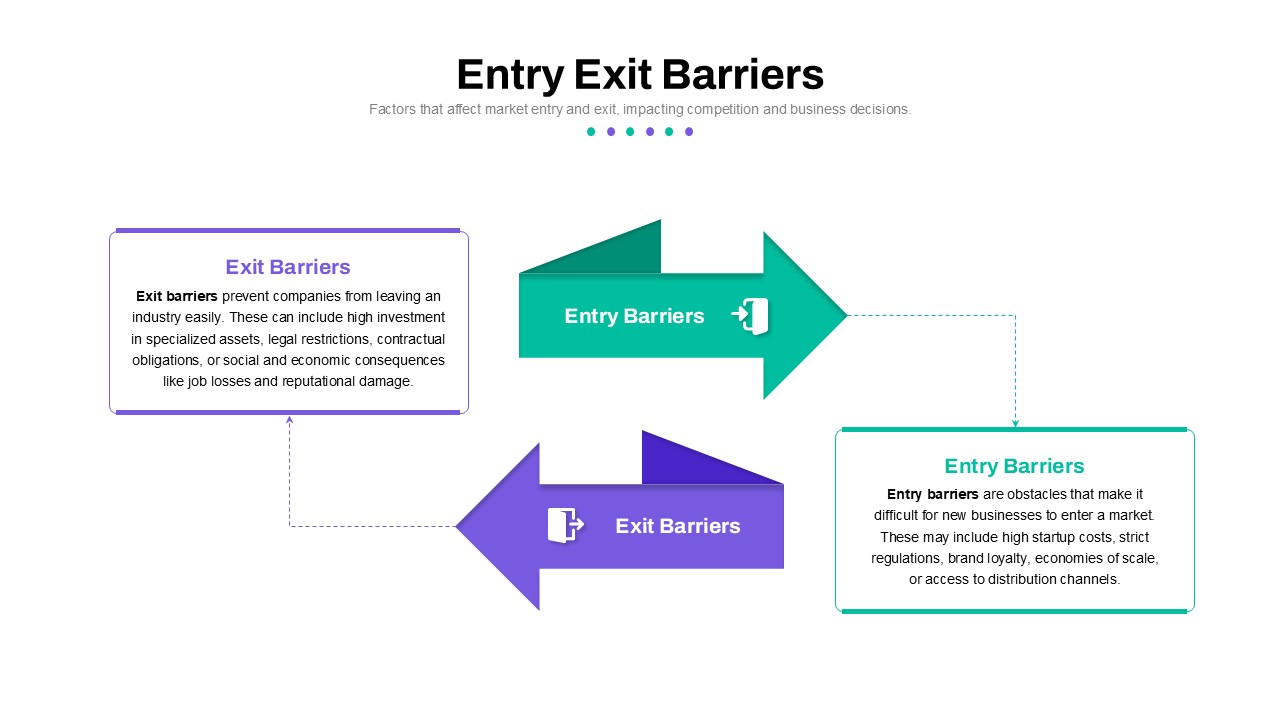
Entry and Exit Barriers Comparison Template for PowerPoint & Google Slides
Comparison
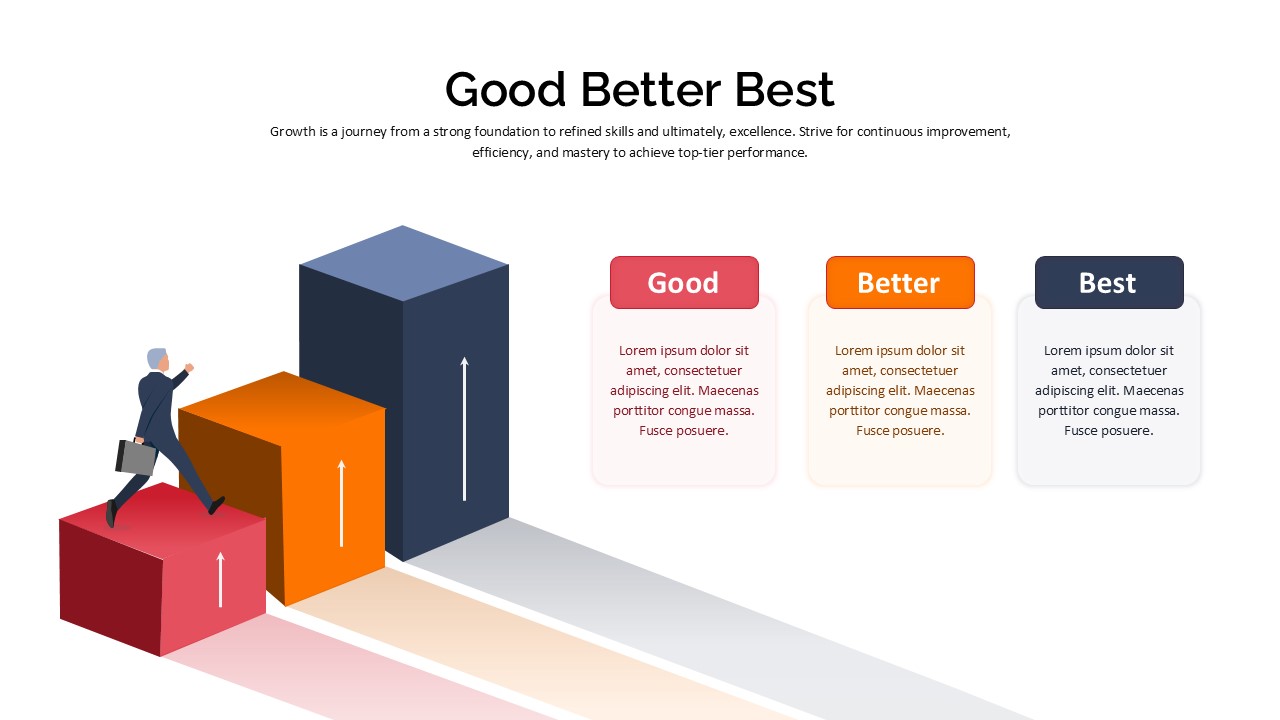
Good Better Best Comparison template for PowerPoint & Google Slides
Comparison
Competitor Profile Matrix Comparison Template for PowerPoint & Google Slides
Comparison Chart
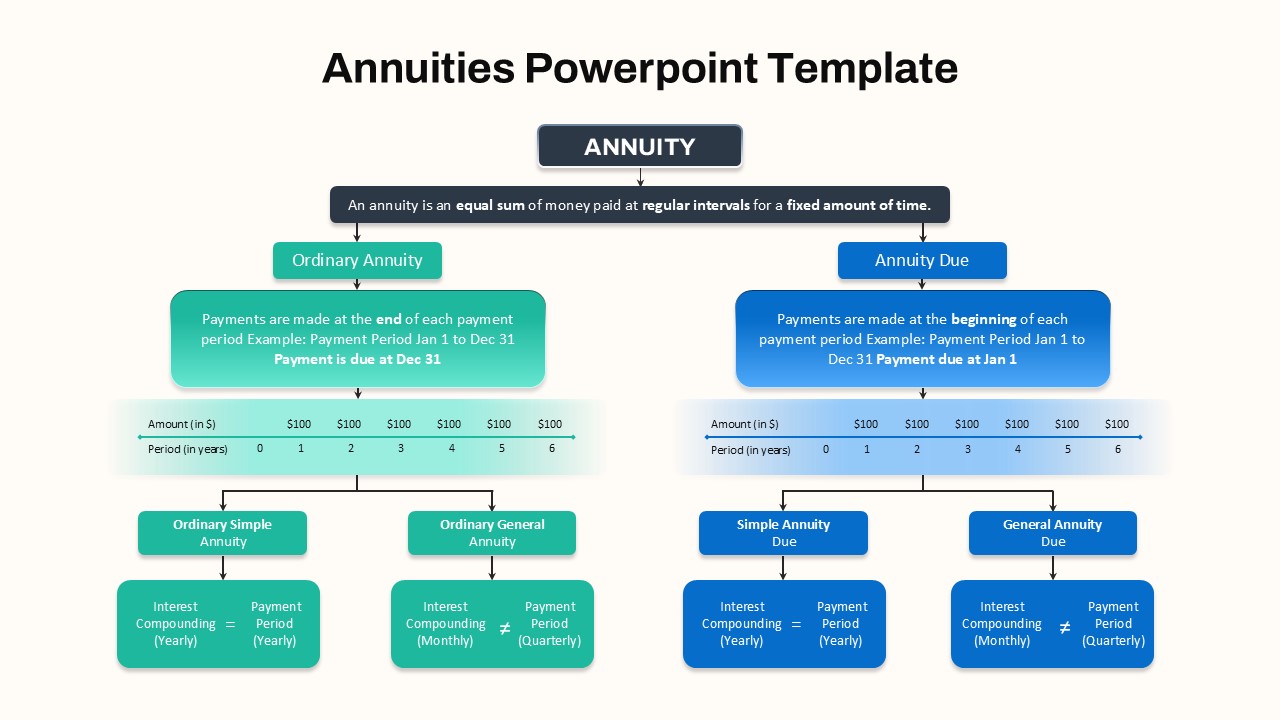
Hierarchical Annuity Comparison Flowchart Template for PowerPoint & Google Slides
Business Report
Feasibility Matrix Comparison Chart Template for PowerPoint & Google Slides
Comparison Chart
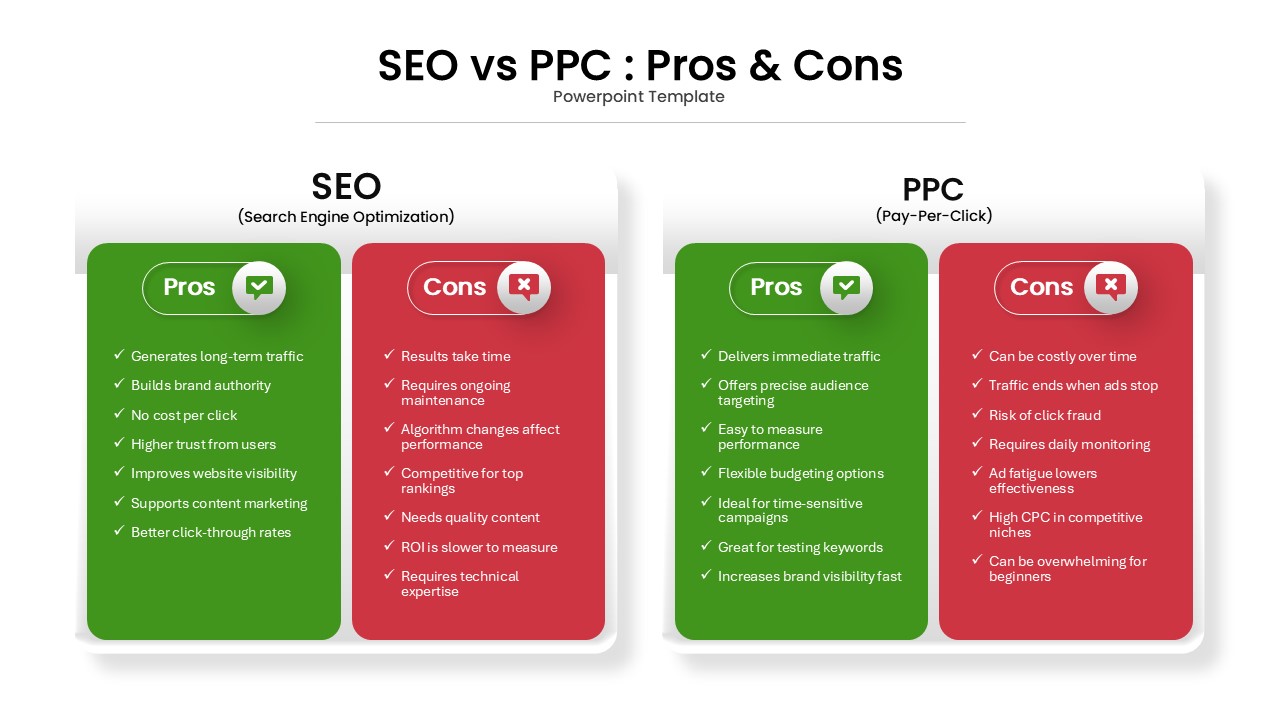
SEO vs PPC: Pros & Cons Comparison Template for PowerPoint & Google Slides
Comparison
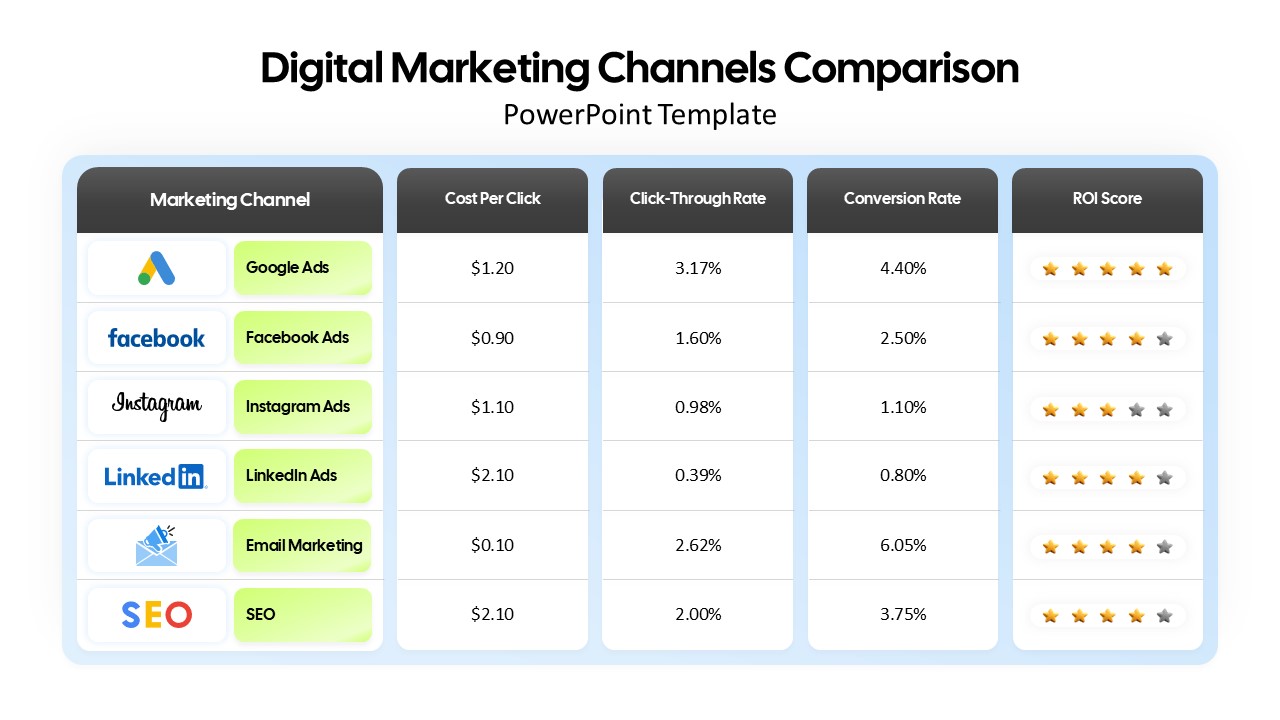
Digital Marketing Channels Comparison template for PowerPoint & Google Slides
Business
Colorful Business Data Comparison Table Template for PowerPoint & Google Slides
Table