Skills Gap Analysis Comparison Chart Template for PowerPoint & Google Slides

Description
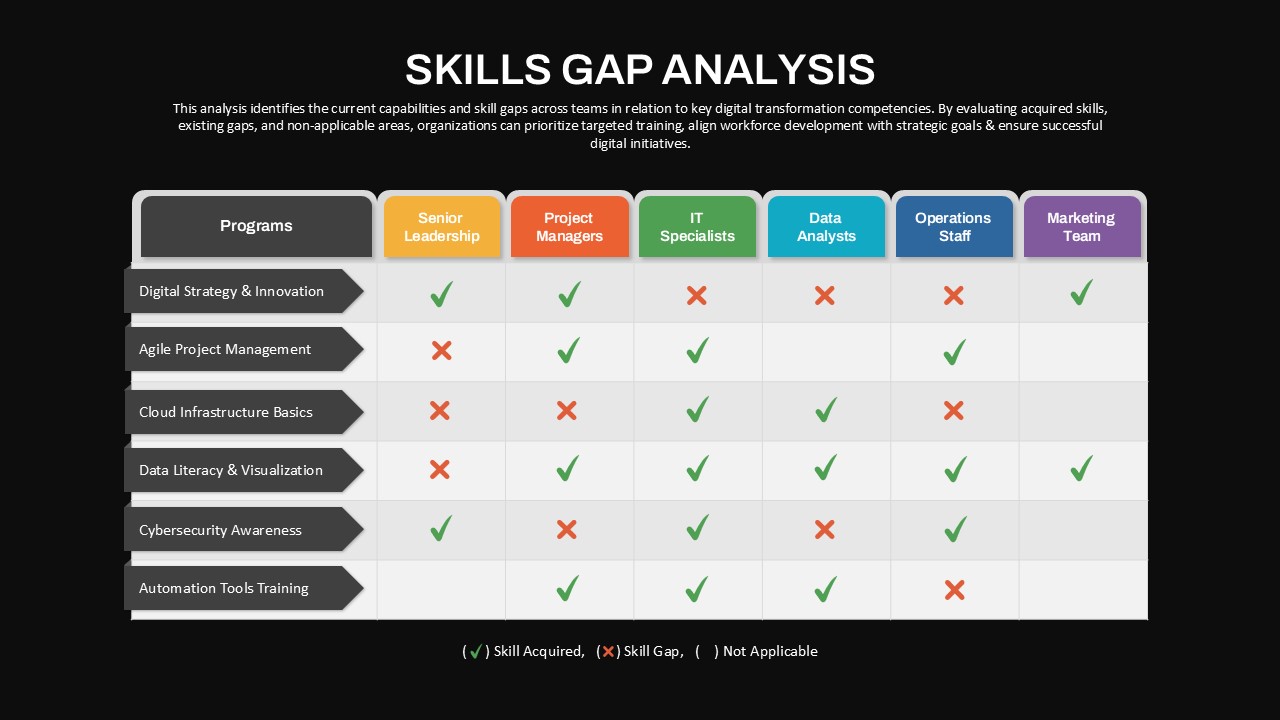
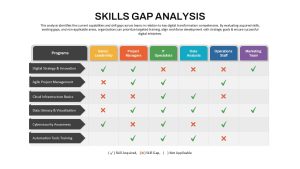
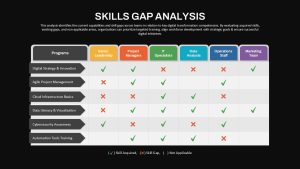
This skills gap analysis comparison chart slide provides a clear matrix for evaluating current capabilities and gaps across key digital transformation competencies. The table features six program rows—Digital Strategy & Innovation, Agile Project Management, Cloud Infrastructure Basics, Data Literacy & Visualization, Cybersecurity Awareness, and Automation Tools Training—set against a light grid layout. Color-coded headers highlight six audience columns: Senior Leadership, Project Managers, IT Specialists, Data Analysts, Operations Staff, and Marketing Team. Checkmark and cross icons visually denote acquired skills or gaps, with blank cells indicating non-applicable areas. Clean typography, subtle shadows, and minimal accent lines ensure a professional, easy-to-read infographic.
Built on fully editable master slides for PowerPoint and Google Slides, every element is unlocked for effortless customization. Swap out program labels, adjust column headers, or replace icons using theme library assets. Vector shapes maintain pixel-perfect crispness at any zoom level, and locked aspect ratios preserve alignment when resizing or exporting to PDF. Use built-in theme color settings to implement custom palettes globally in seconds, guaranteeing consistency with corporate branding across your deck.
The layout supports variant modifications, enabling you to add or remove rows and columns to reflect different competency frameworks. Simply drag and drop to reorder segments or adjust cell dimensions. Modify fonts, sizes, and numbering to suit regional or project-specific requirements. White space and grid alignment adapt seamlessly to accommodate extended text descriptions or additional metrics.
Integrate this slide seamlessly into larger presentations by preserving master layouts for global updates and real-time collaboration via shared Google Slides links. Export to .pptx, .pdf, or high-resolution images without losing fidelity. Alternative dark-mode variants and layout templates ensure clarity in printouts and on-screen displays. Ideal for board reports, training sessions, and strategic planning workshops.
Who is it for
Learning & development leads, HR managers, and digital transformation teams will use this chart to benchmark capabilities, prioritize training programs, and align workforce development with strategic goals.
Other Uses
Repurpose this slide to compare software feature adoption, audit process maturity across departments, or map technology readiness levels in consulting engagements.
Login to download this file

Item ID
SB04875
Related Templates

Technical Skills Donut Chart Overview Template for PowerPoint & Google Slides
HR

Interactive Gap Analysis Puzzle Diagram Template for PowerPoint & Google Slides
Gap
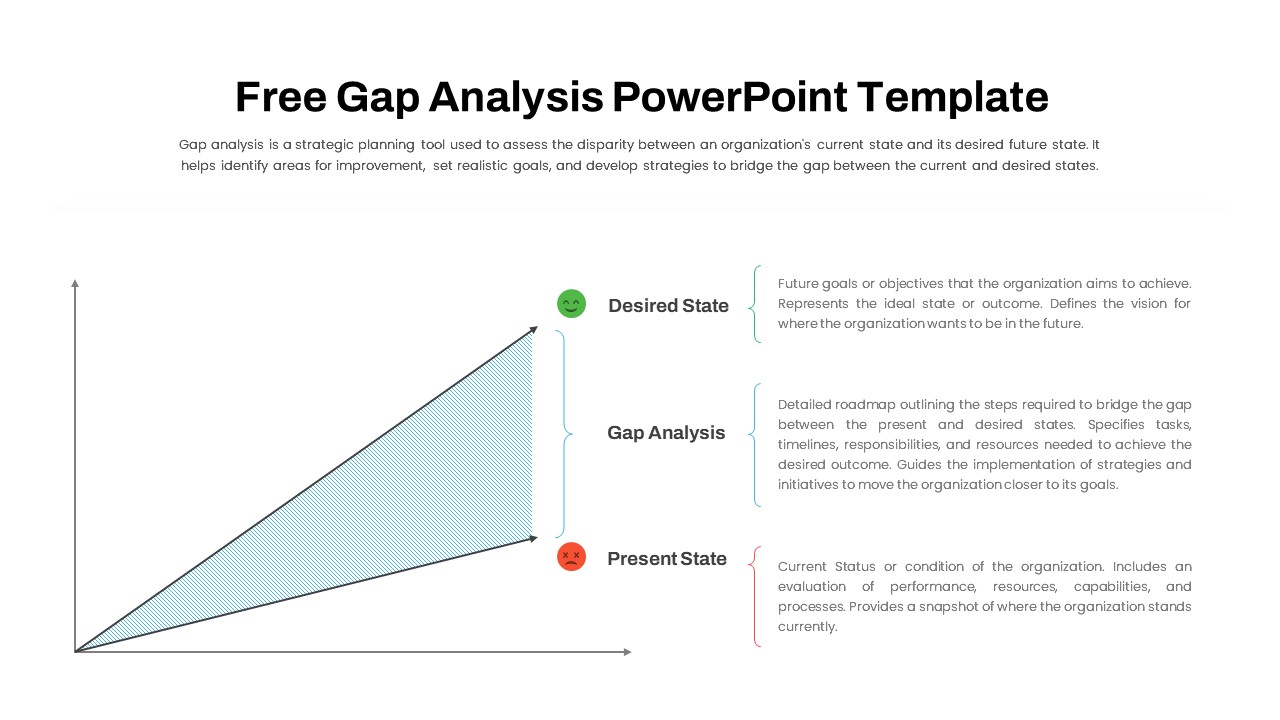
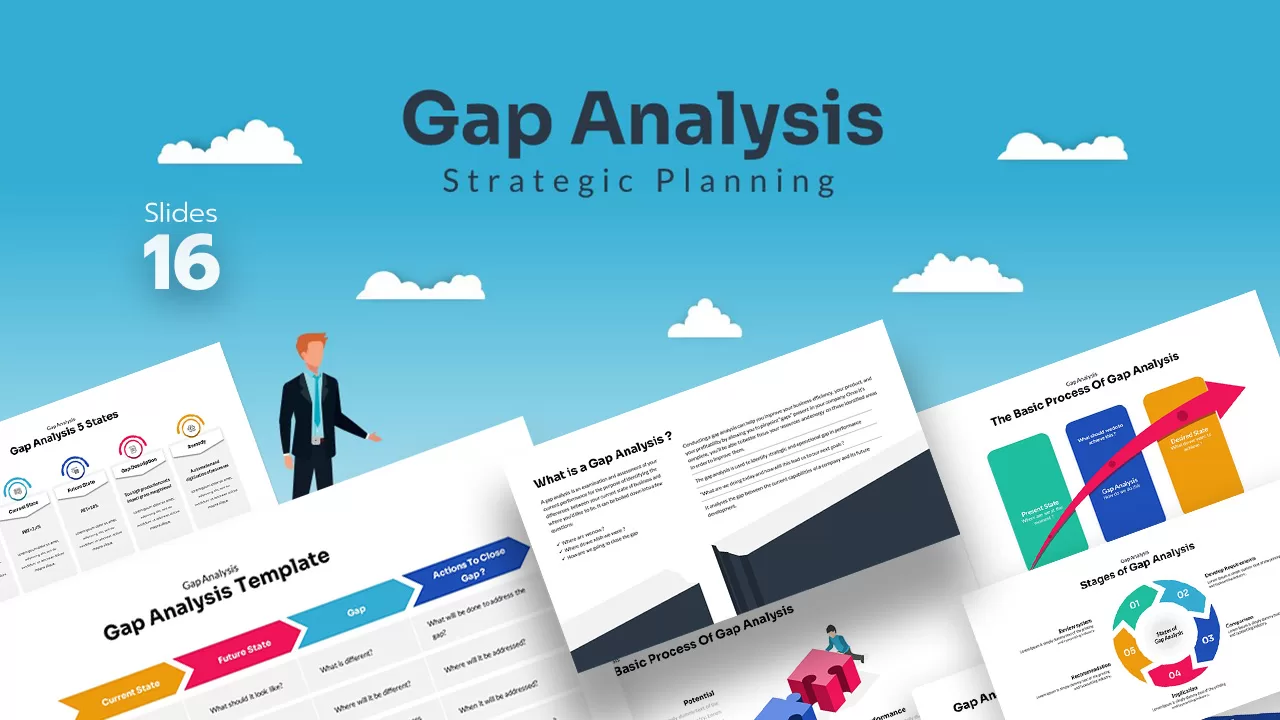
Gap Analysis Strategic Planning Template for PowerPoint & Google Slides
Gap
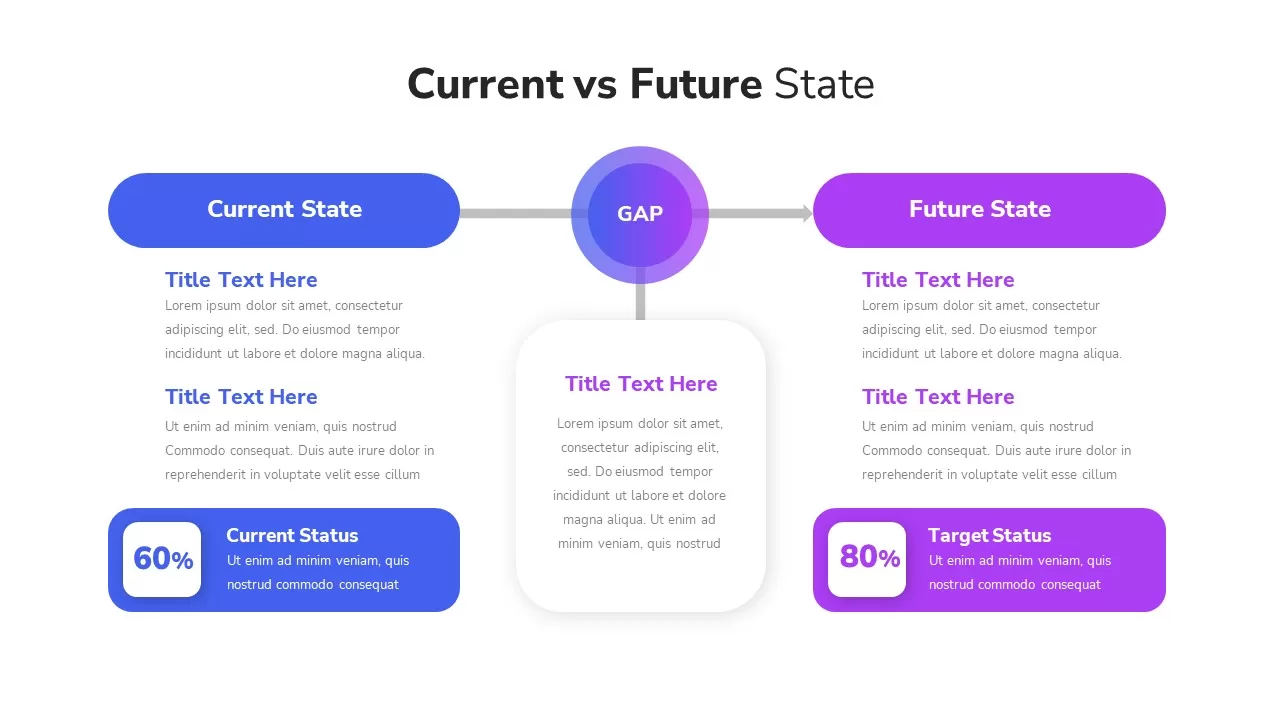
Current vs Future State Gap Analysis template for PowerPoint & Google Slides
Comparison
Free Comprehensive Gap Analysis Framework Template for PowerPoint & Google Slides
Opportunities Challenges
Free
Data Gap Analysis Template for PowerPoint & Google Slides
Business
Financial Gap Analysis Framework Template for PowerPoint & Google Slides
Finance
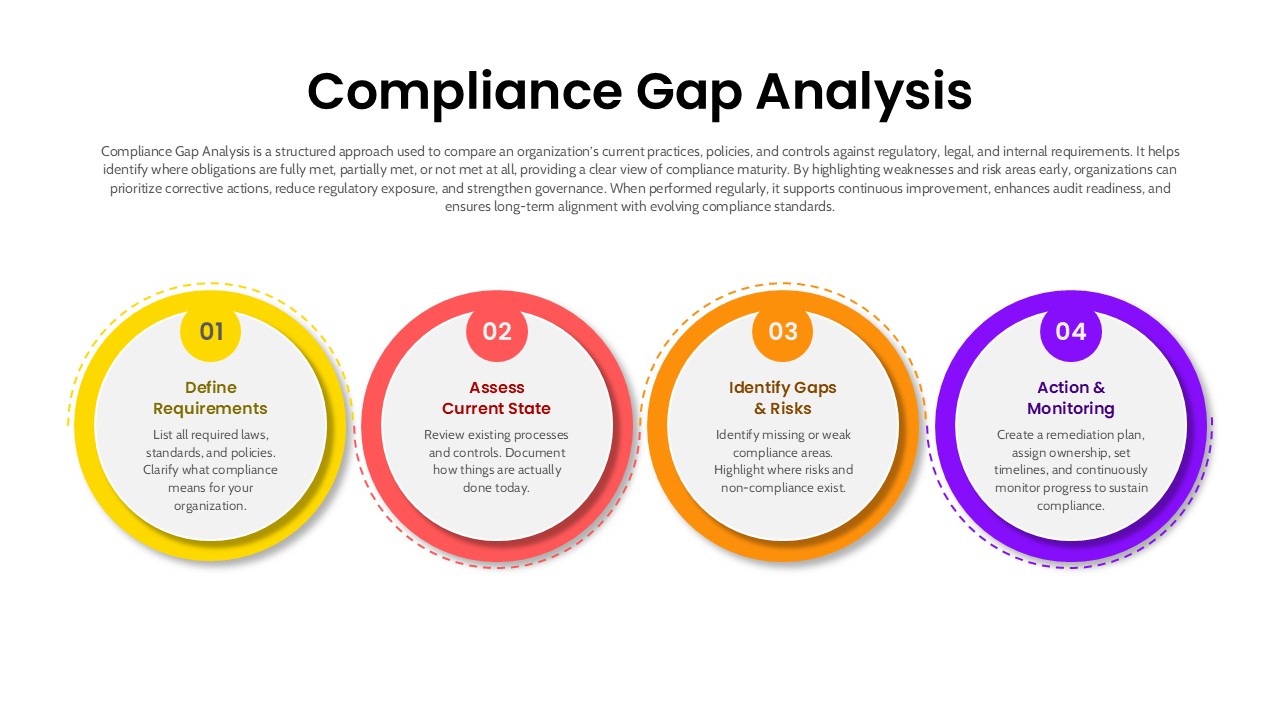
4 Step Compliance Gap Analysis Process Template for PowerPoint & Google Slides
Risk Management
IT Gap Analysis Assessment Matrix Template for PowerPoint & Google Slides
Information Technology
Gap Analysis Strategic Planning for PowerPoint & Google Slides
Business
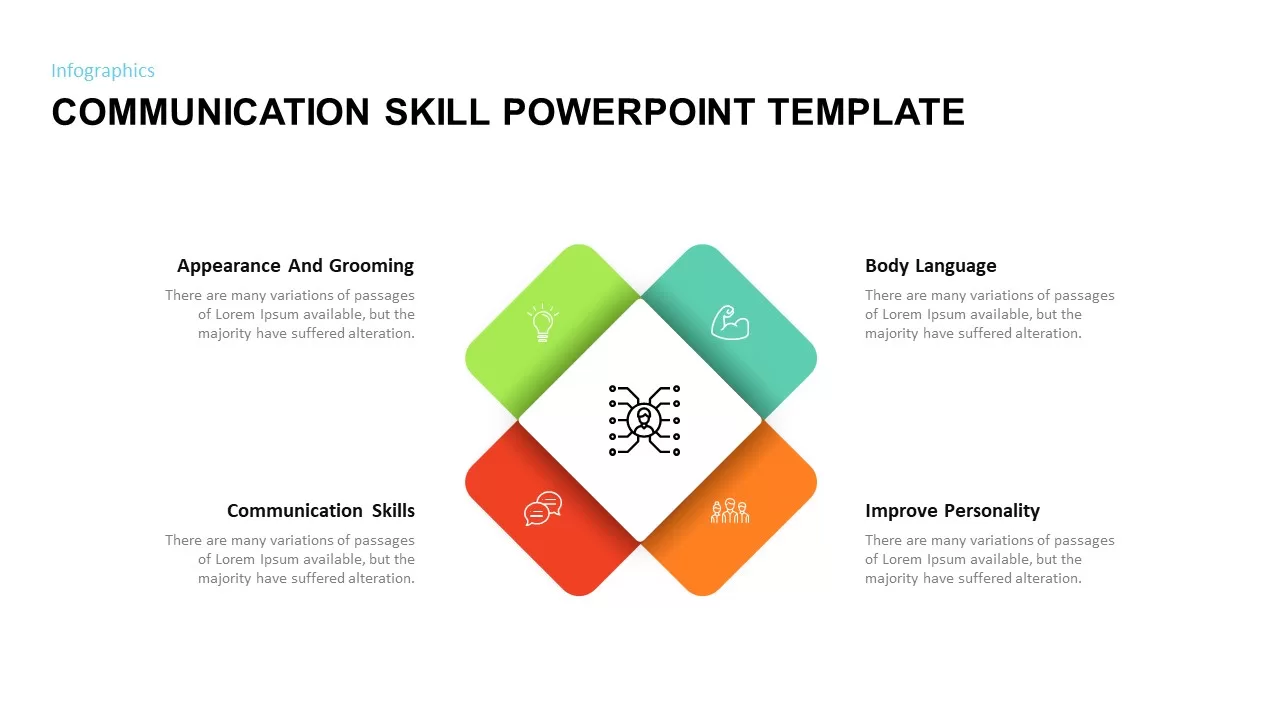
Four-Stage Communication Skills Diamond Template for PowerPoint & Google Slides
Circular
Circular Profile Resume and Skills Template for PowerPoint & Google Slides
Company Profile
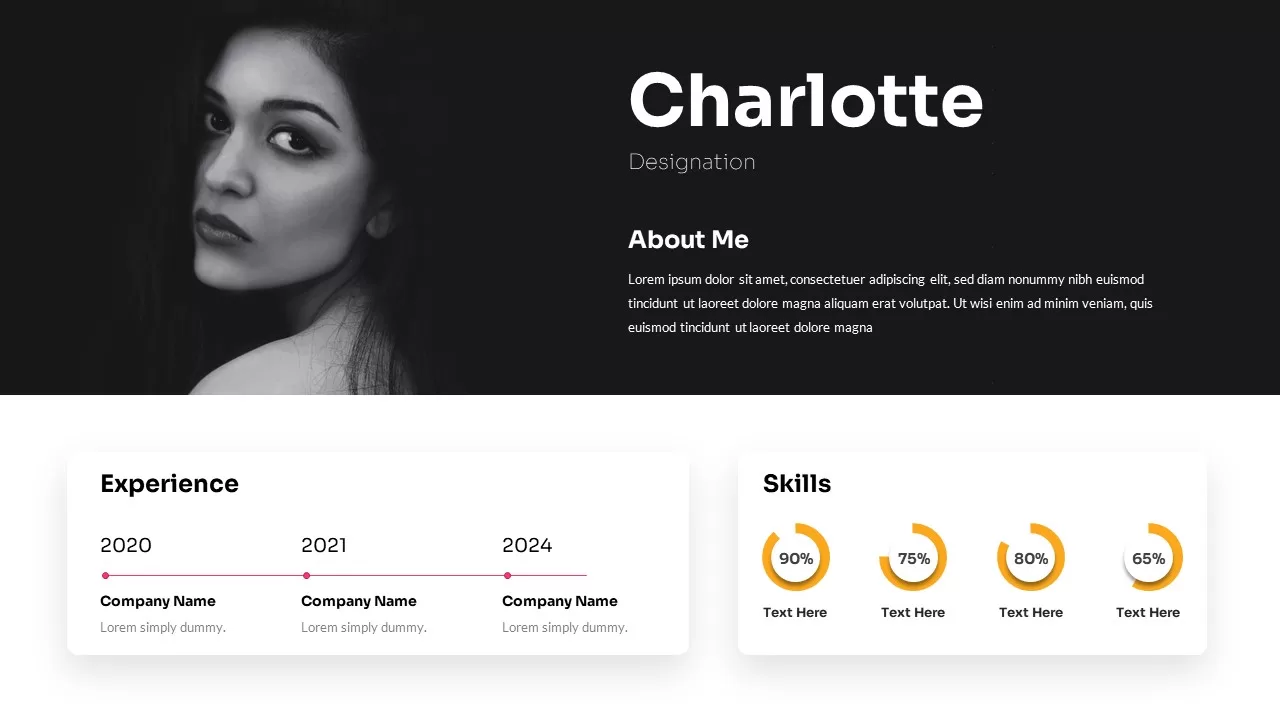
Profile Slide with Timeline & Skills Template for PowerPoint & Google Slides
Our Team
Effective Communication Skills Training Template for PowerPoint & Google Slides
Pitch Deck
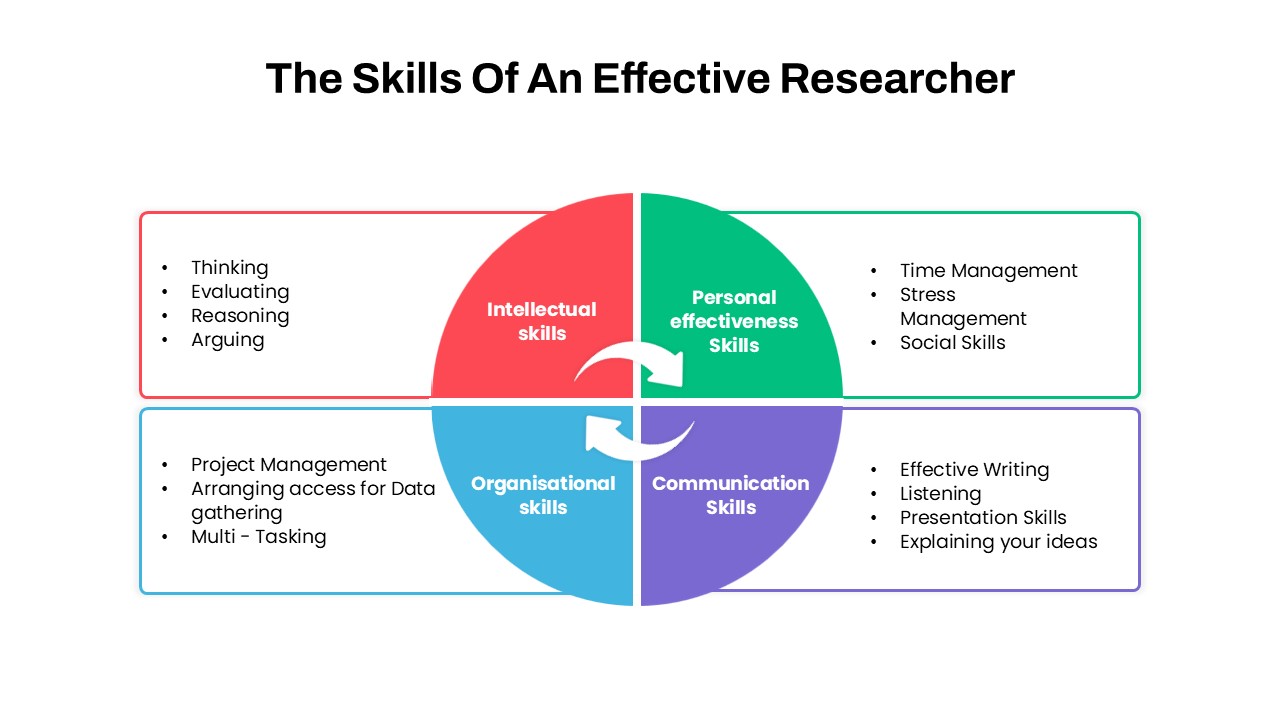
Researcher Skills Quadrant Diagram Template for PowerPoint & Google Slides
Circular
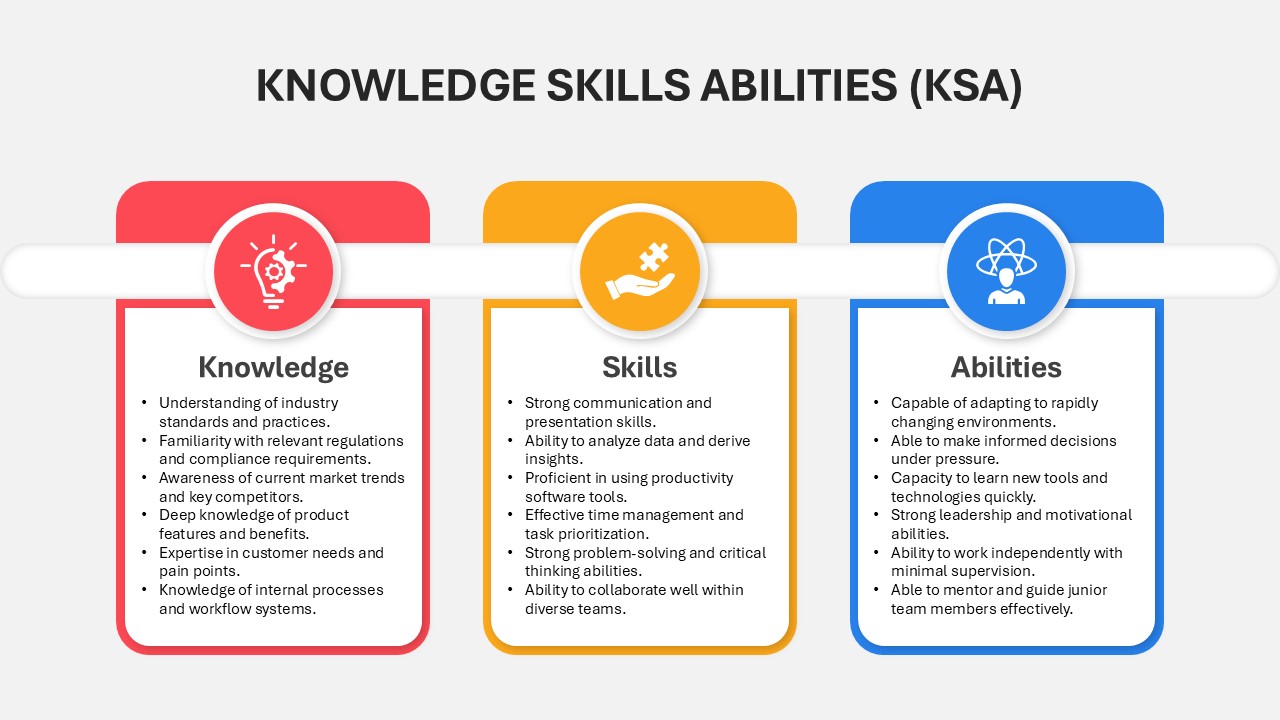
Knowledge, Skills & Abilities KSA Slide Template for PowerPoint & Google Slides
Employee Performance
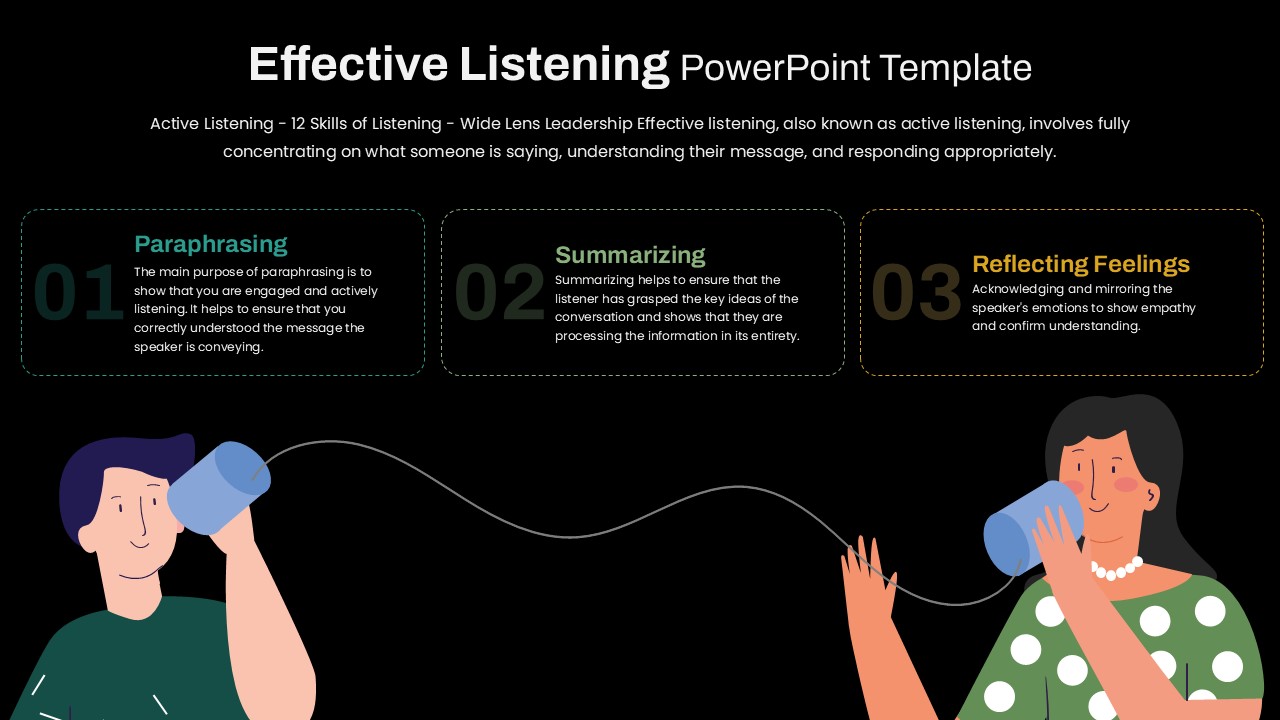
Effective Listening Skills Overview Template for PowerPoint & Google Slides
Process
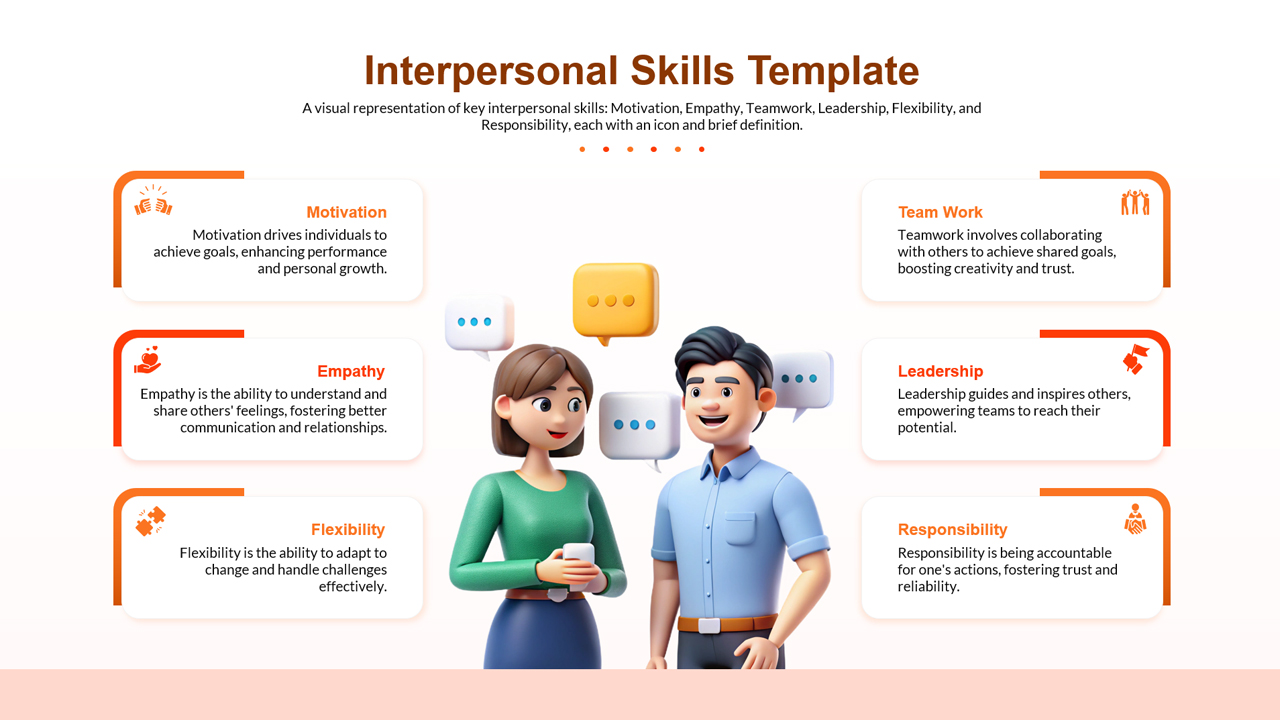
Interpersonal Skills Template for PowerPoint & Google Slides
HR
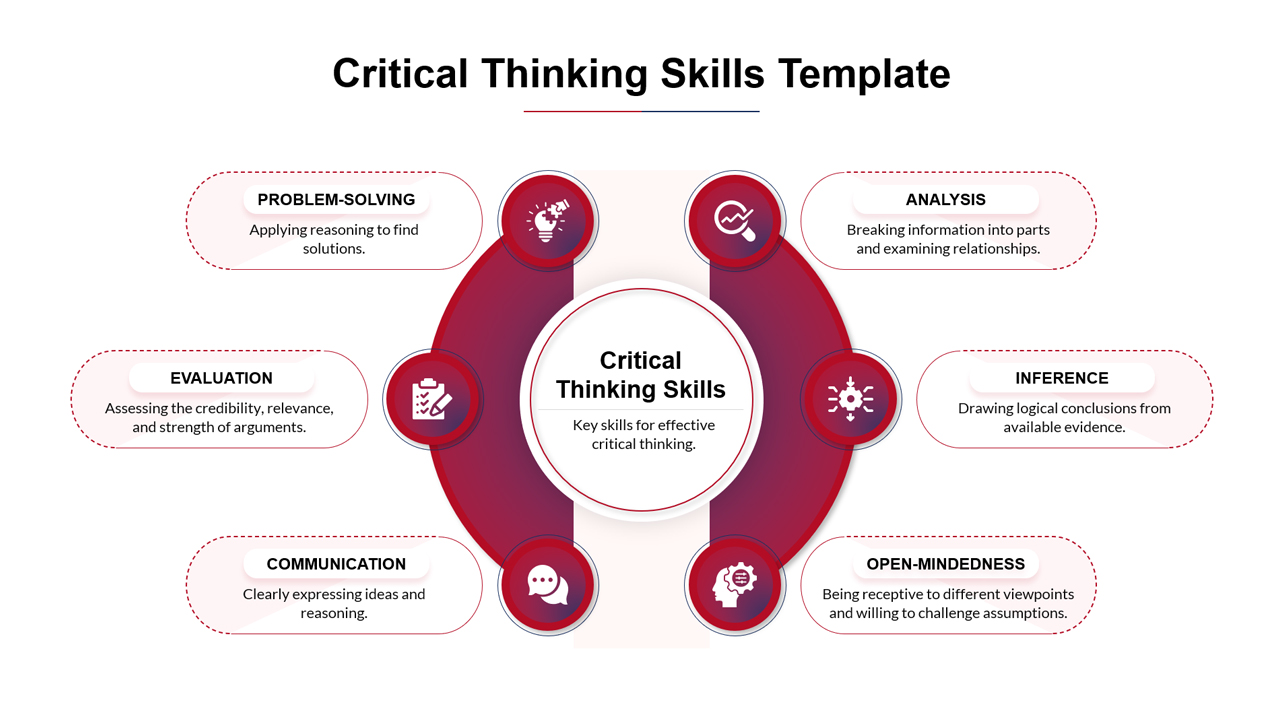
Critical Thinking Skills Template for PowerPoint & Google Slides
Process
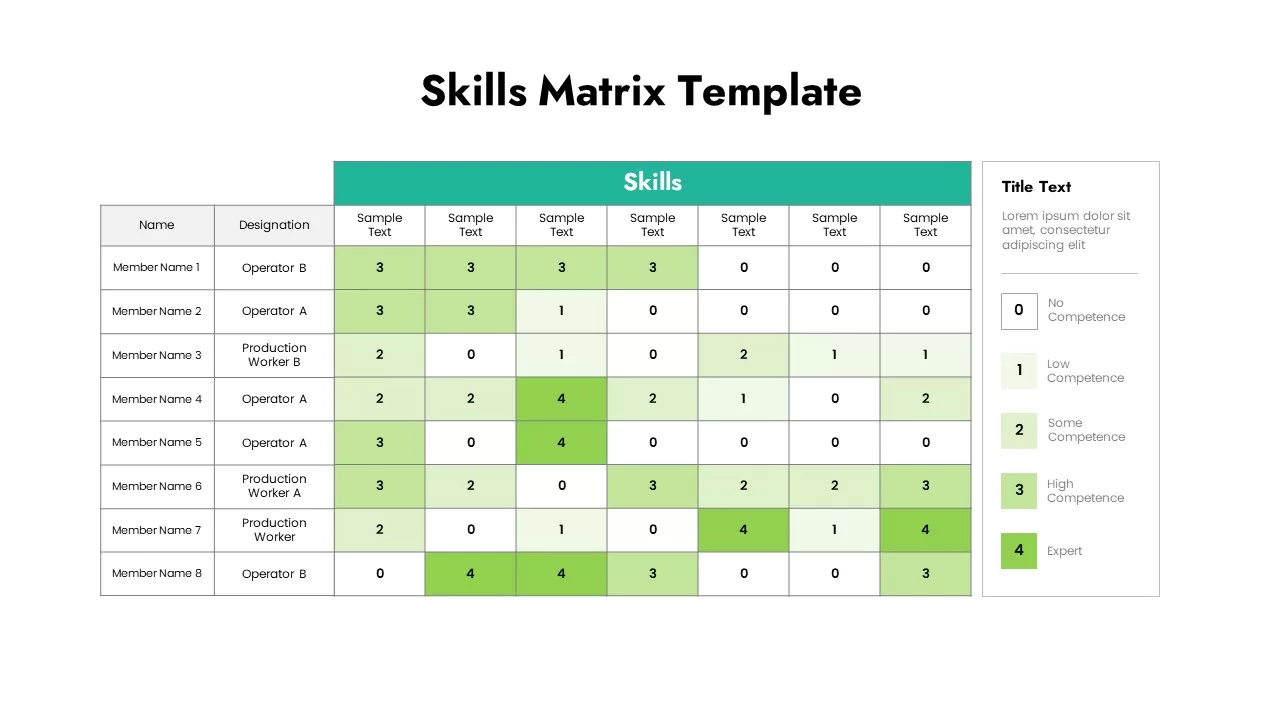
Skills Matrix infographic for PowerPoint & Google Slides
Project Status
Bridging the Gap Infographic Process template for PowerPoint & Google Slides
Process
Cost Benefit Analysis Comparison Template for PowerPoint & Google Slides
Comparison
Vendor Comparison Analysis template for PowerPoint & Google Slides
Comparison Chart
Two-Box Analysis & Target Comparison Template for PowerPoint & Google Slides
Comparison
Category Analysis Comparison Infographic Template for PowerPoint & Google Slides
Comparison
Comparison Bar Chart template for PowerPoint & Google Slides
Comparison Chart
Four Section Comparison Chart Diagram Template for PowerPoint & Google Slides
Infographics
Interactive Product Comparison Bar Chart Template for PowerPoint & Google Slides
Bar/Column
Comparison Chart Overview template for PowerPoint & Google Slides
Comparison Chart
Tornado Chart Data Comparison Slide Template for PowerPoint & Google Slides
Bar/Column
Radar Chart Product Comparison Template for PowerPoint & Google Slides
Comparison Chart

BMI Category Comparison Chart Template for PowerPoint & Google Slides
Comparison
Circular Product Comparison Chart Template for PowerPoint & Google Slides
Comparison Chart
Pugh Matrix Decision Comparison Chart Template for PowerPoint & Google Slides
Comparison Chart
Dynamic Benchmarking Comparison Chart Template for PowerPoint & Google Slides
Comparison Chart
People Demographic Comparison Chart Template for PowerPoint & Google Slides
Comparison
Clustered Bar Chart Comparison Template for PowerPoint & Google Slides
Bar/Column
Business Timeline Comparison Bar Chart Template for PowerPoint & Google Slides
Comparison Chart
Grouped Column Chart Comparison Template for PowerPoint & Google Slides
Bar/Column
Multiple Line Chart Comparison Template for PowerPoint & Google Slides
Comparison Chart
Mirror Bar Chart Comparison Template for PowerPoint & Google Slides
Bar/Column
Free Versatile Product Comparison Chart Template for PowerPoint & Google Slides
Charts
Free
Dynamic Bar-of-Pie Chart Comparison Template for PowerPoint & Google Slides
Pie/Donut
ESG Initiatives Comparison Chart Template for PowerPoint & Google Slides
Business
Quarterly Revenue Comparison Bar Chart Template for PowerPoint & Google Slides
Bar/Column
Competitor Comparison Chart Design Template for PowerPoint & Google Slides
Comparison
Two-Option Bar Chart Comparison Table Template for PowerPoint & Google Slides
Comparison
Profile Comparison Chart template for PowerPoint & Google Slides
Comparison Chart
Sales Growth Comparison Chart & Table Template for PowerPoint & Google Slides
Bar/Column
Feasibility Matrix Comparison Chart Template for PowerPoint & Google Slides
Comparison Chart
Quarterly Comparison Pie Chart Template for PowerPoint & Google Slides
Pie/Donut
Process Comparison Chart for PowerPoint & Google Slides
Infographics

Comparison Donut Chart PowerPoint Template and Keynote
Pie/Donut
Mobile Data Analysis Chart template for PowerPoint & Google Slides
Charts
Creative Data Analysis Bar Chart template for PowerPoint & Google Slides
Bar/Column
Pencil Bar Chart Data Analysis Template for PowerPoint & Google Slides
Bar/Column

Line Chart Analysis template for PowerPoint & Google Slides
Charts
Population Pyramid Chart Analysis Template for PowerPoint & Google Slides
Bar/Column
Waterfall Column Chart Analysis Template for PowerPoint & Google Slides
Bar/Column
Simple Scatter Chart Analysis Template for PowerPoint & Google Slides
Comparison Chart
Simple Area Chart Data Trends Analysis Template for PowerPoint & Google Slides
Comparison Chart
Waterfall Bar Chart Analysis Template for PowerPoint & Google Slides
Bar/Column
Four Quadrant Scatter Chart Analysis Template for PowerPoint & Google Slides
Comparison Chart
Proportional Area Chart Analysis Template for PowerPoint & Google Slides
Comparison Chart
Expanding Margins Analysis Bar Chart Template for PowerPoint & Google Slides
Charts
Annual Growth Trend Analysis Chart template for PowerPoint & Google Slides
Business Report
Dynamic Financial Analysis Line Chart Template for PowerPoint & Google Slides
Finance
Data Analysis Bar Chart with Insights Template for PowerPoint & Google Slides
Bar/Column
Free
Service Zoom Feature Slides Comparison template for PowerPoint & Google Slides
Process
Scale Metaphor Metrics Comparison Template for PowerPoint & Google Slides
Charts
Gender Comparison People Infographic Template for PowerPoint & Google Slides
Comparison
Dynamic Multicolor Comparison Table Template for PowerPoint & Google Slides
Comparison
Interactive Pricing Plan Comparison Template for PowerPoint & Google Slides
Comparison
Six-Metric Green Product Comparison Template for PowerPoint & Google Slides
Comparison
Manpower Planning Concept Comparison Template for PowerPoint & Google Slides
Comparison Chart
Internal vs External Factors Comparison Template for PowerPoint & Google Slides
Comparison
Comparison Infographic Overview template for PowerPoint & Google Slides
Business
Business Silhouettes Comparison Slide Template for PowerPoint & Google Slides
HR
Before and After Comparison Infographic Template for PowerPoint & Google Slides
Comparison
Free
Before and After Comparison Slide Template for PowerPoint & Google Slides
Comparison
Benchmarking Metrics Comparison Slide Template for PowerPoint & Google Slides
Pie/Donut
Heatmap Comparison Template for PowerPoint & Google Slides
Maps
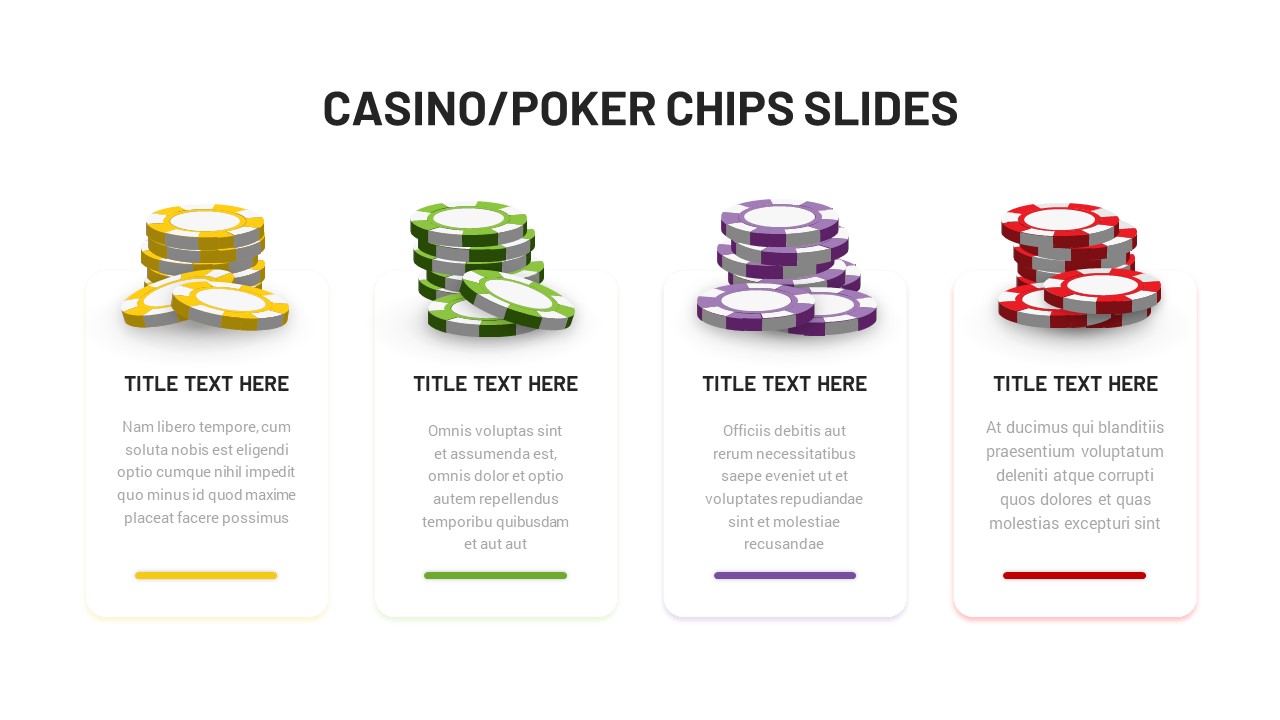
Casino Poker Chips Comparison Slide Template for PowerPoint & Google Slides
Comparison
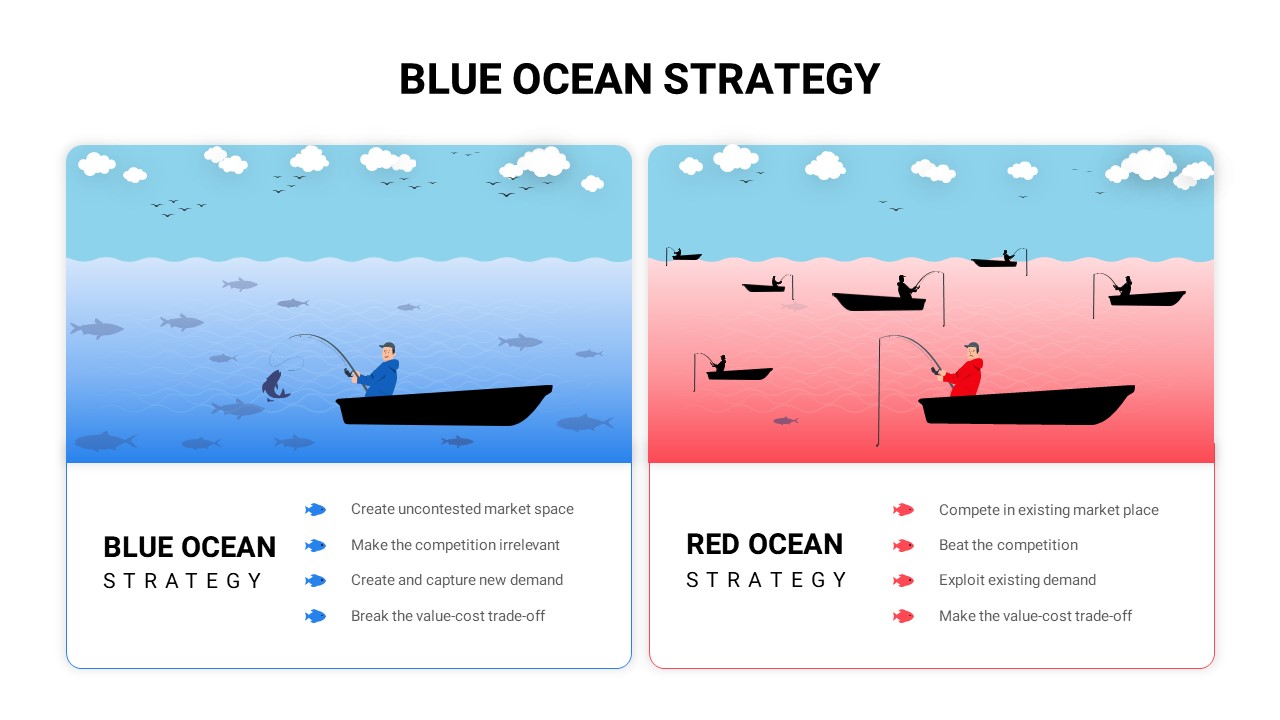
Blue vs Red Ocean Strategy Comparison Template for PowerPoint & Google Slides
Business Strategy
Surgery Infographics Comparison Template for PowerPoint & Google Slides
Health
Economies of Scale Cost Curve Comparison Template for PowerPoint & Google Slides
Comparison Chart
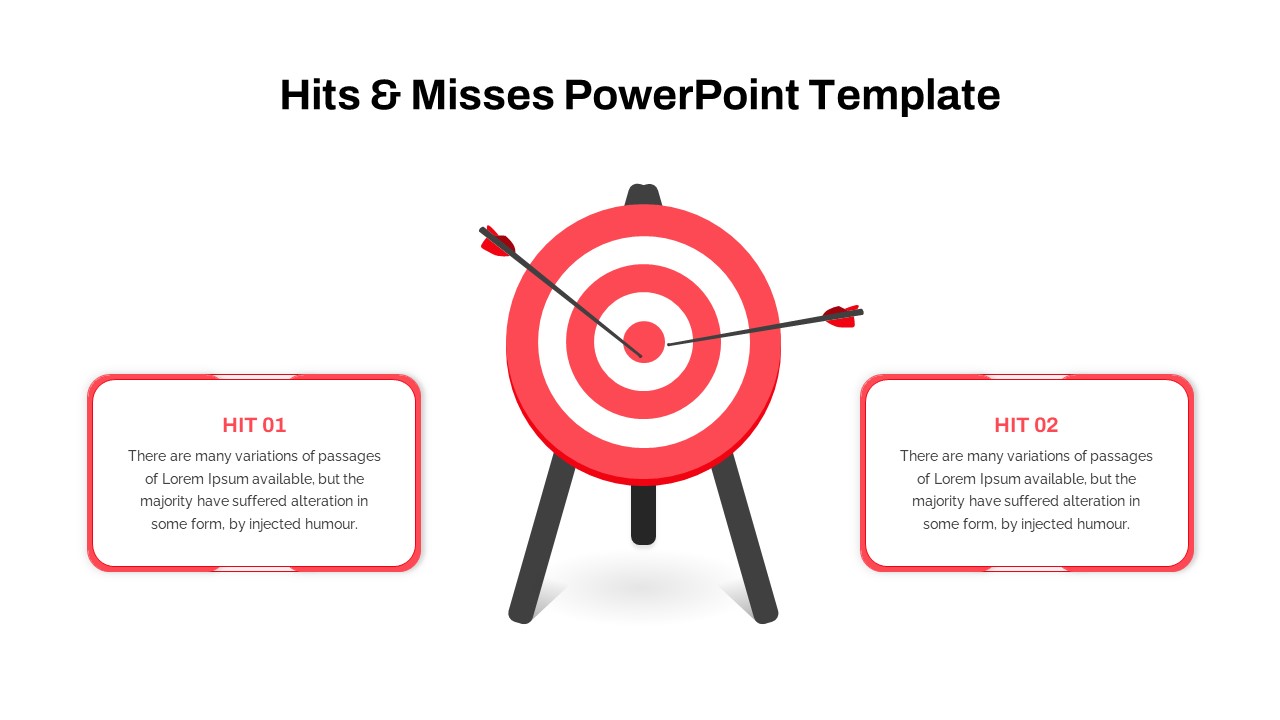
Hits & Misses Comparison Infographic Template for PowerPoint & Google Slides
Pitch Deck
Pricing Model Types Comparison Infographic Template for PowerPoint & Google Slides
Pitch Deck
Risk Level Gauge Comparison Dashboard Template for PowerPoint & Google Slides
Comparison
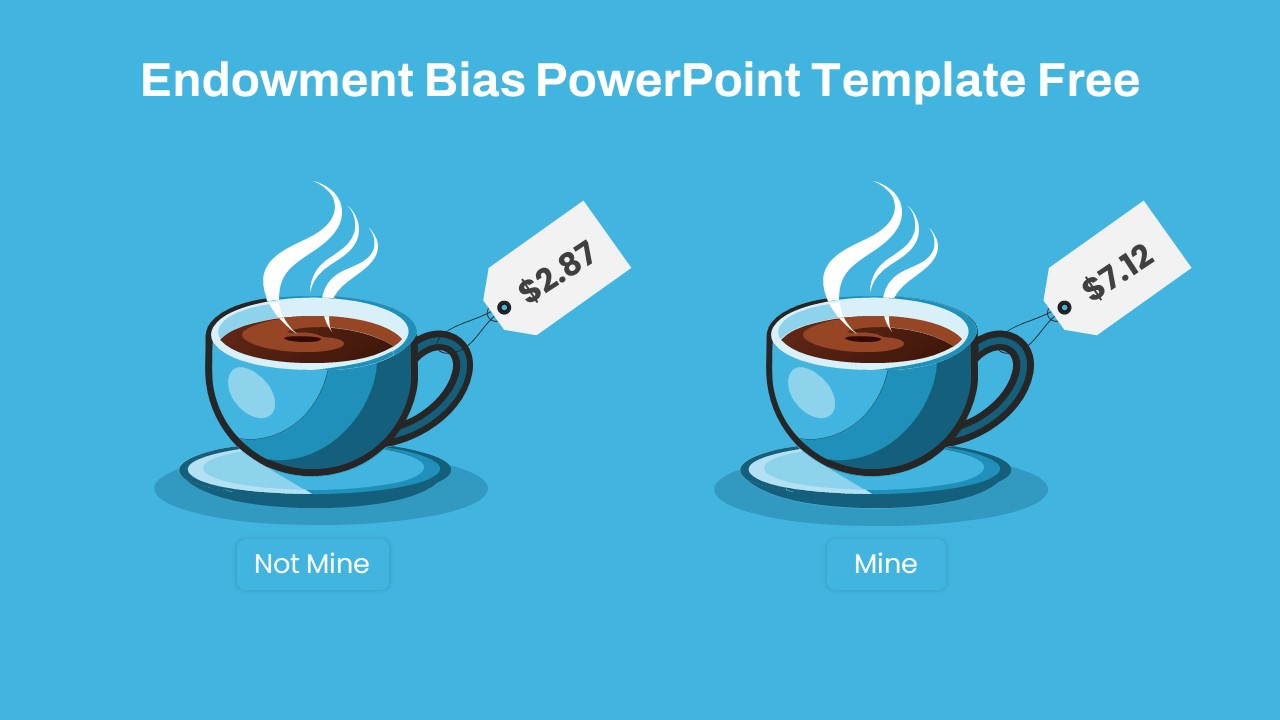
Endowment Bias Coffee Price Comparison Template for PowerPoint & Google Slides
Comparison
Free
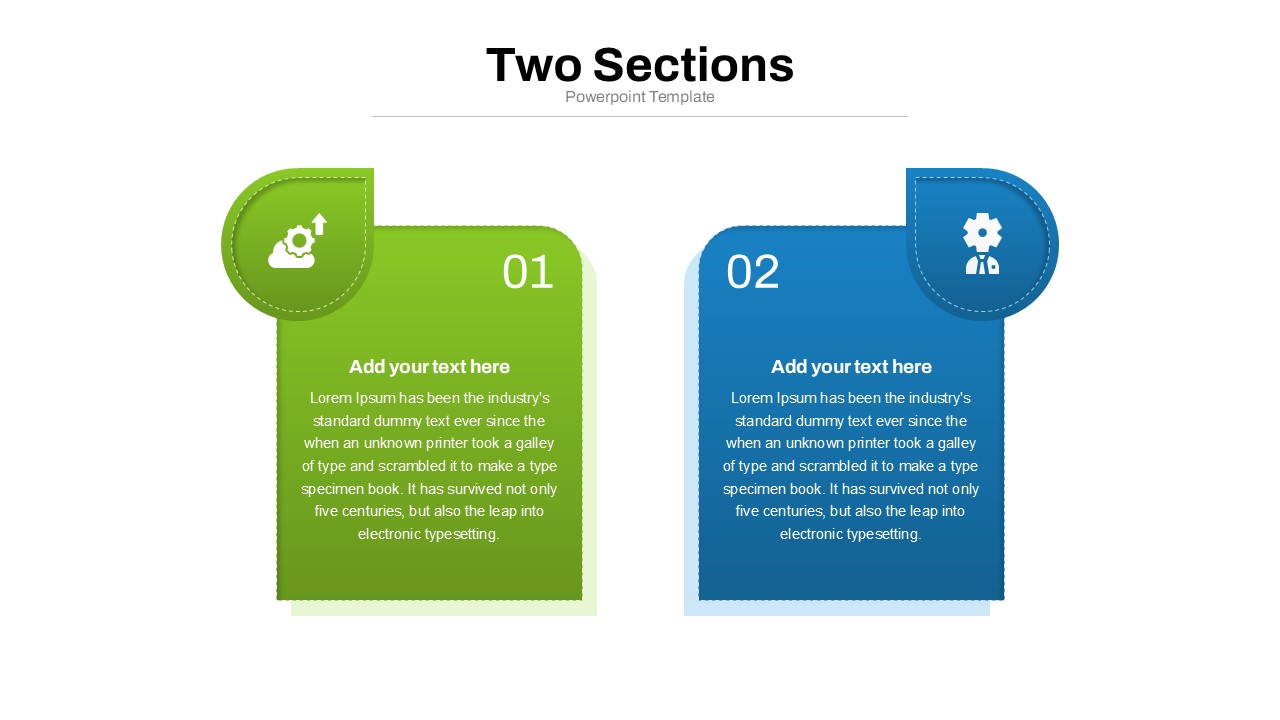
Two Section Comparison template for PowerPoint & Google Slides
Business Proposal
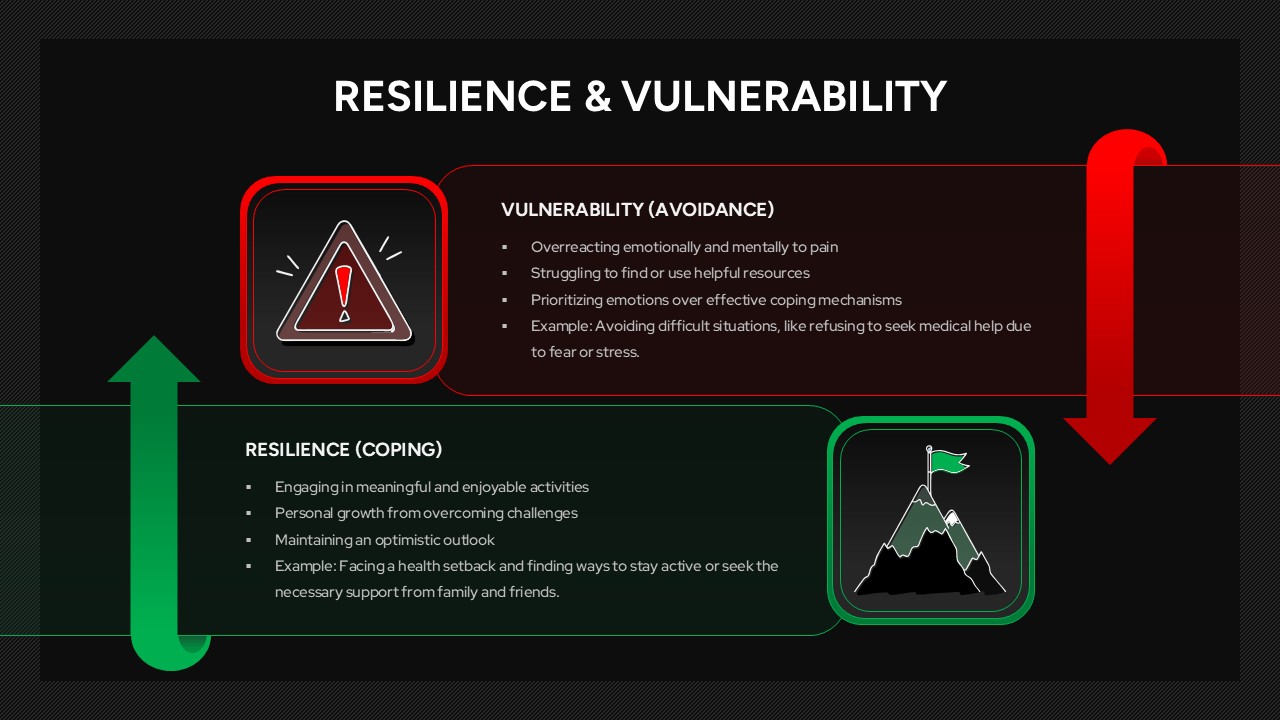
Resilience & Vulnerability Comparison Template for PowerPoint & Google Slides
Comparison
Attribution Models Comparison Diagram Template for PowerPoint & Google Slides
Comparison
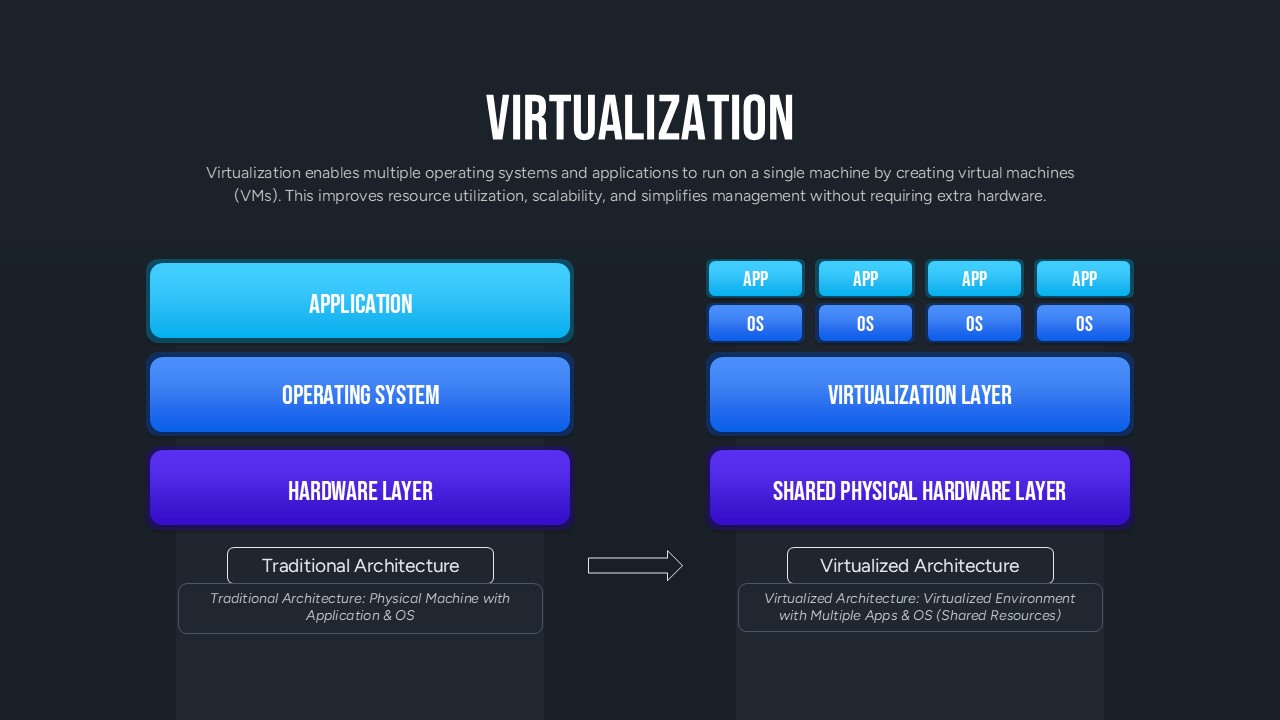
Virtualization Architecture Comparison Template for PowerPoint & Google Slides
Comparison Chart
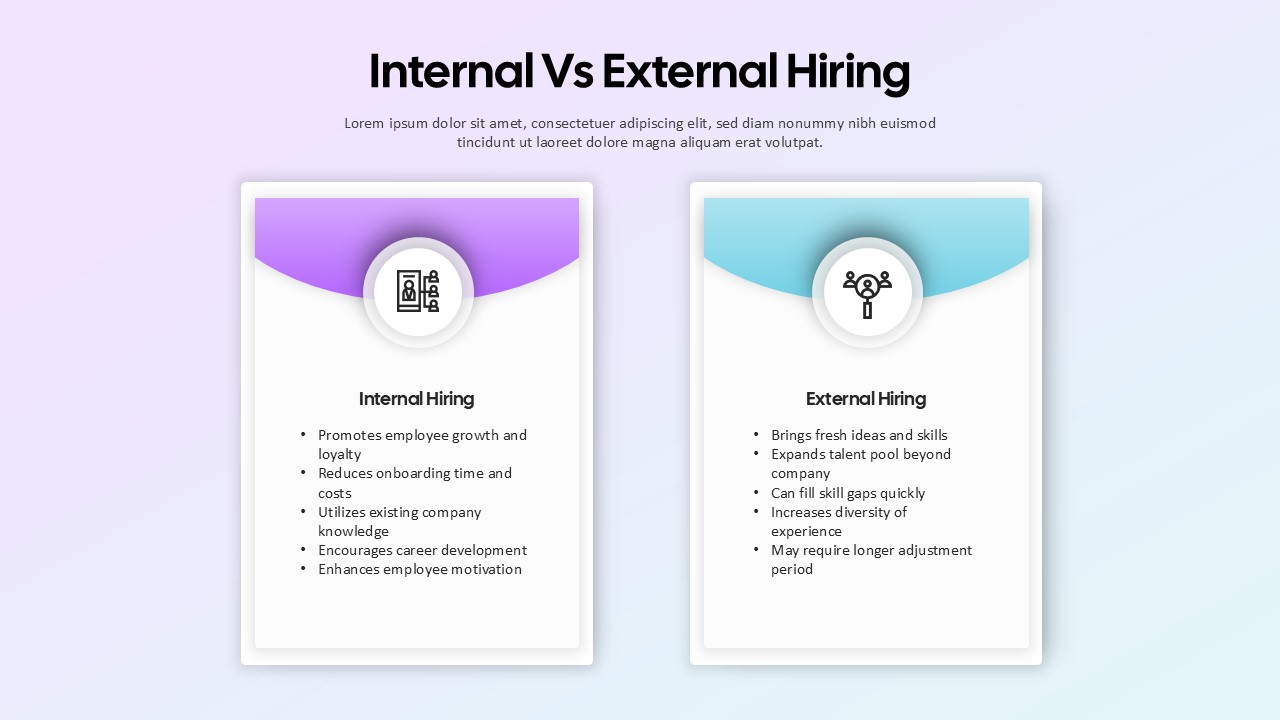
Internal vs External Hiring Comparison Template for PowerPoint & Google Slides
Comparison
Pros and Cons Comparison Table Template for PowerPoint & Google Slides
Comparison Chart
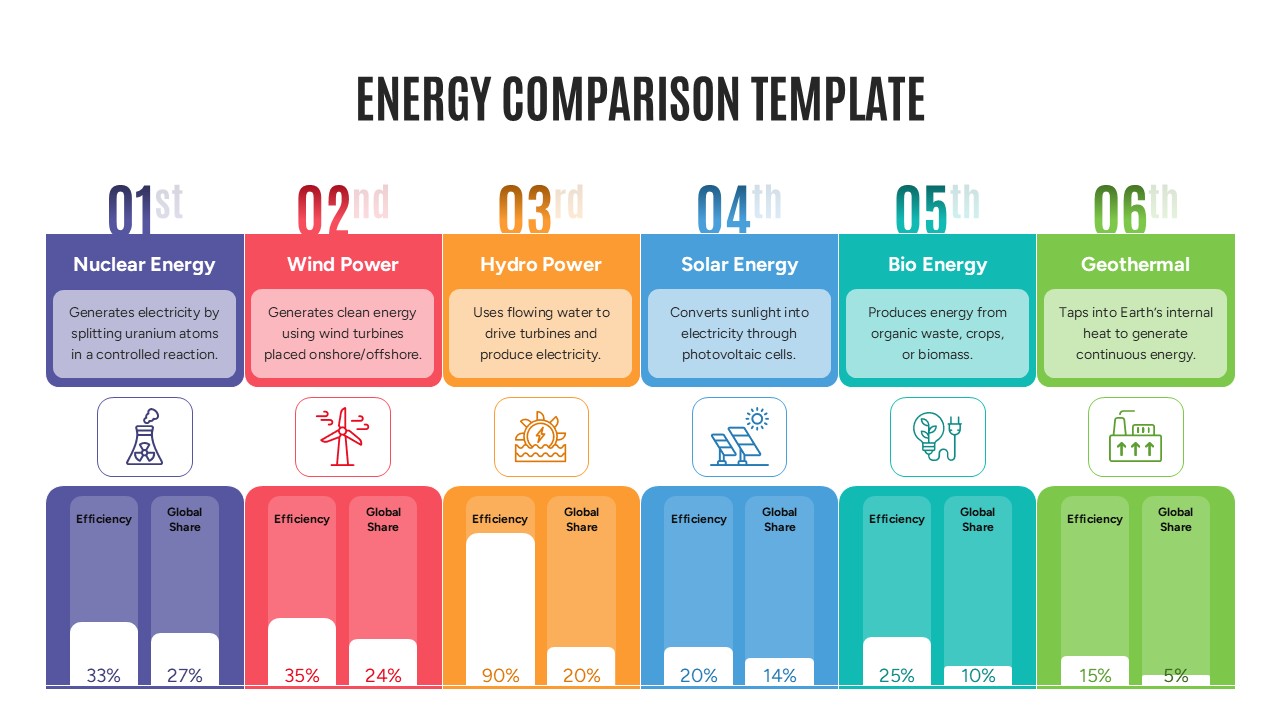
Energy Comparison Template for PowerPoint & Google Slides
Comparison
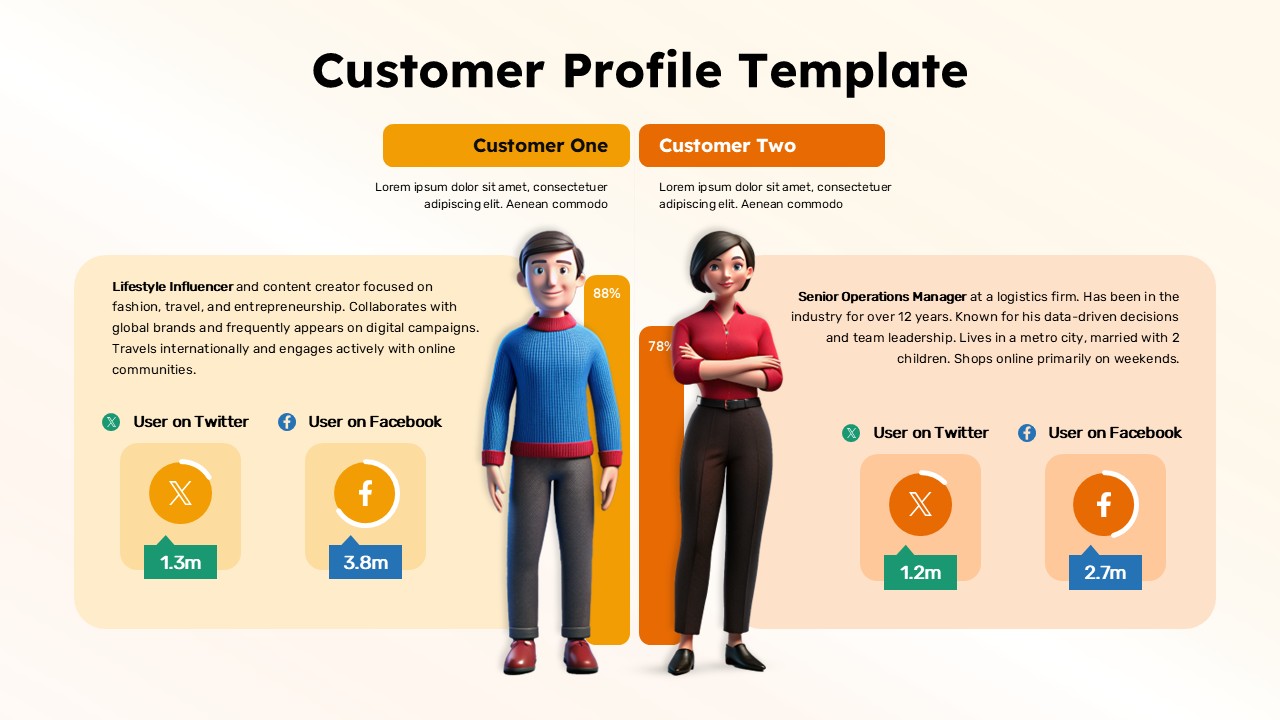
Customer Persona Comparison Profile Template for PowerPoint & Google Slides
Business
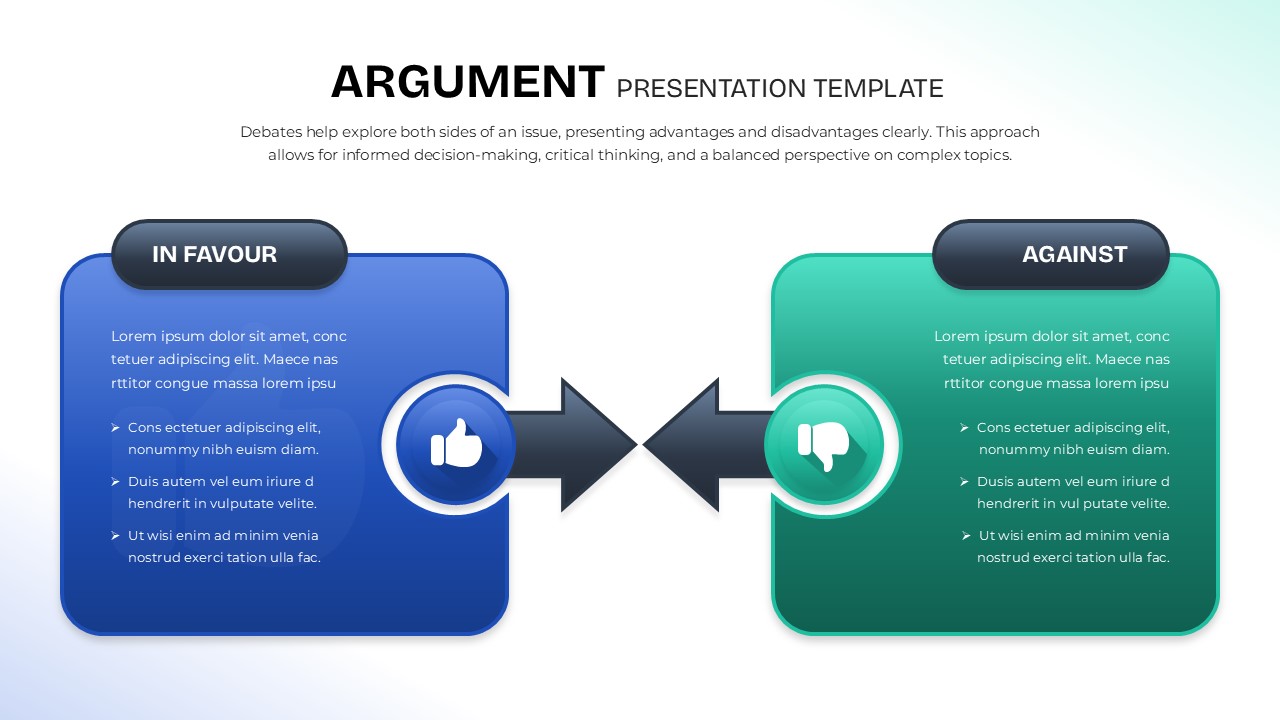
Argument Comparison Template for PowerPoint & Google Slides
Comparison
Year-over-Year Performance Comparison Template for PowerPoint & Google Slides
Comparison Chart