Sales Bar Chart for PowerPoint & Google Slides

Description
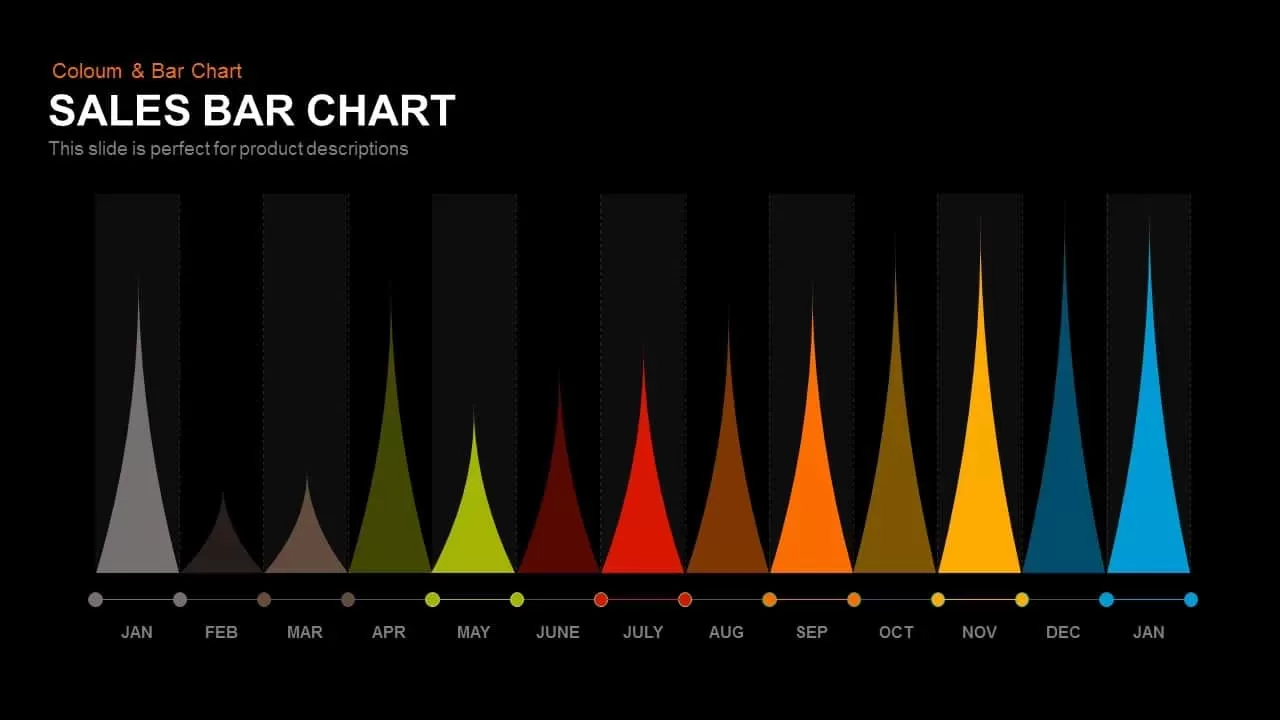
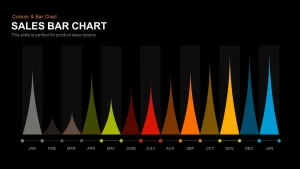
The Sales Bar Chart is an excellent visual tool for tracking performance and trends across the year. With its multi-colored bar design representing each month, it helps to quickly identify seasonal patterns, high and low sales periods, and any key fluctuations. The smooth gradient colors from gray, green, red, orange, yellow, to blue visually engage your audience while providing clear insights into monthly data. Ideal for business reports, presentations, or financial analyses, this chart enhances understanding by displaying the information in an easy-to-interpret format.
Who is it for
This slide is particularly useful for sales teams, marketing professionals, business analysts, and project managers who need to present monthly performance data, highlight trends, and make data-driven decisions. It’s perfect for end-of-quarter reviews, annual reports, or strategy meetings where a clear visual representation of sales growth or decline is necessary.
Other Uses
Beyond sales, this bar chart can be used to track monthly project milestones, customer acquisition rates, marketing campaign performance, or even seasonal product demand. It can easily be adapted for use in various industries, including retail, finance, tech, and service-based sectors.
Login to download this file

Item ID
SB00387
Related Templates

Quarterly Sales Review Bar Chart Template for PowerPoint & Google Slides
Bar/Column
Bar Chart Sample template for PowerPoint & Google Slides
Bar/Column
Creative Data Analysis Bar Chart template for PowerPoint & Google Slides
Bar/Column
3D Bar Chart Data Infographics Template for PowerPoint & Google Slides
Bar/Column
Creative Bar Chart template for PowerPoint & Google Slides
Charts
Comparison Bar Chart template for PowerPoint & Google Slides
Comparison Chart
Three-Year Bar Chart template for PowerPoint & Google Slides
Charts
3D Cylinder Bar Chart Template for PowerPoint & Google Slides
Bar/Column
Pencil Bar Chart Data Analysis Template for PowerPoint & Google Slides
Bar/Column

Monthly Reports Bar Chart template for PowerPoint & Google Slides
Bar/Column

Colorful Radial Bar Chart Template for PowerPoint & Google Slides
Bar/Column
Interactive Product Comparison Bar Chart Template for PowerPoint & Google Slides
Bar/Column
Bar Data Chart Slide for PowerPoint & Google Slides
Bar/Column

Radial Bar Chart Diagram for PowerPoint & Google Slides
Bar/Column
For and Against Vote Count Bar Chart Template for PowerPoint & Google Slides
Bar/Column
Entertainment Industry Revenue Bar Chart Template for PowerPoint & Google Slides
Bar/Column
Distracting Factors at Work Bar Chart Template for PowerPoint & Google Slides
Bar/Column
Statistics Infographic & KPI Bar Chart Template for PowerPoint & Google Slides
Bar/Column
Stacked Bar Chart for PowerPoint & Google Slides
Bar/Column
100% Stacked Bar Chart for PowerPoint & Google Slides
Bar/Column
Multi-Series Stacked Bar Chart Template for PowerPoint & Google Slides
Bar/Column
Monthly Recurring Revenue KPI Bar Chart Template for PowerPoint & Google Slides
Bar/Column
Combination Bar and Line Chart Template for PowerPoint & Google Slides
Bar/Column
Animated Clustered Bar Chart Template for PowerPoint & Google Slides
Bar/Column
Animated Stacked Bar Chart Template for PowerPoint & Google Slides
Bar/Column
Simple Bar Chart Data Visualization Template for PowerPoint & Google Slides
Bar/Column
Clustered Bar Chart Comparison Template for PowerPoint & Google Slides
Bar/Column
Waterfall Bar Chart Analysis Template for PowerPoint & Google Slides
Bar/Column
Business Timeline Comparison Bar Chart Template for PowerPoint & Google Slides
Comparison Chart
Year-over-Year Stacked Gender Bar Chart Template for PowerPoint & Google Slides
Bar/Column
Mirror Bar Chart Comparison Template for PowerPoint & Google Slides
Bar/Column
Dynamic Bar-of-Pie Chart Comparison Template for PowerPoint & Google Slides
Pie/Donut
Expanding Margins Analysis Bar Chart Template for PowerPoint & Google Slides
Charts
Quarterly Revenue Comparison Bar Chart Template for PowerPoint & Google Slides
Bar/Column
Data Analysis Bar Chart with Insights Template for PowerPoint & Google Slides
Bar/Column
Free
Horizontal Bar Chart Slide with Icons Template for PowerPoint & Google Slides
Bar/Column
Two-Option Bar Chart Comparison Table Template for PowerPoint & Google Slides
Comparison
Bar Gantt Chart Template for PowerPoint & Google Slides
Gantt Chart
USA Map with Bar Chart Template for PowerPoint & Google Slides
World Maps
3D Cylinder Bar Chart Visualization Template for PowerPoint
Bar/Column
Sales vs Budget Performance Chart Template for PowerPoint & Google Slides
Bar/Column
Car Sales Market Share Pie Chart Template for PowerPoint & Google Slides
BCG
Sales Growth Comparison Chart & Table Template for PowerPoint & Google Slides
Bar/Column

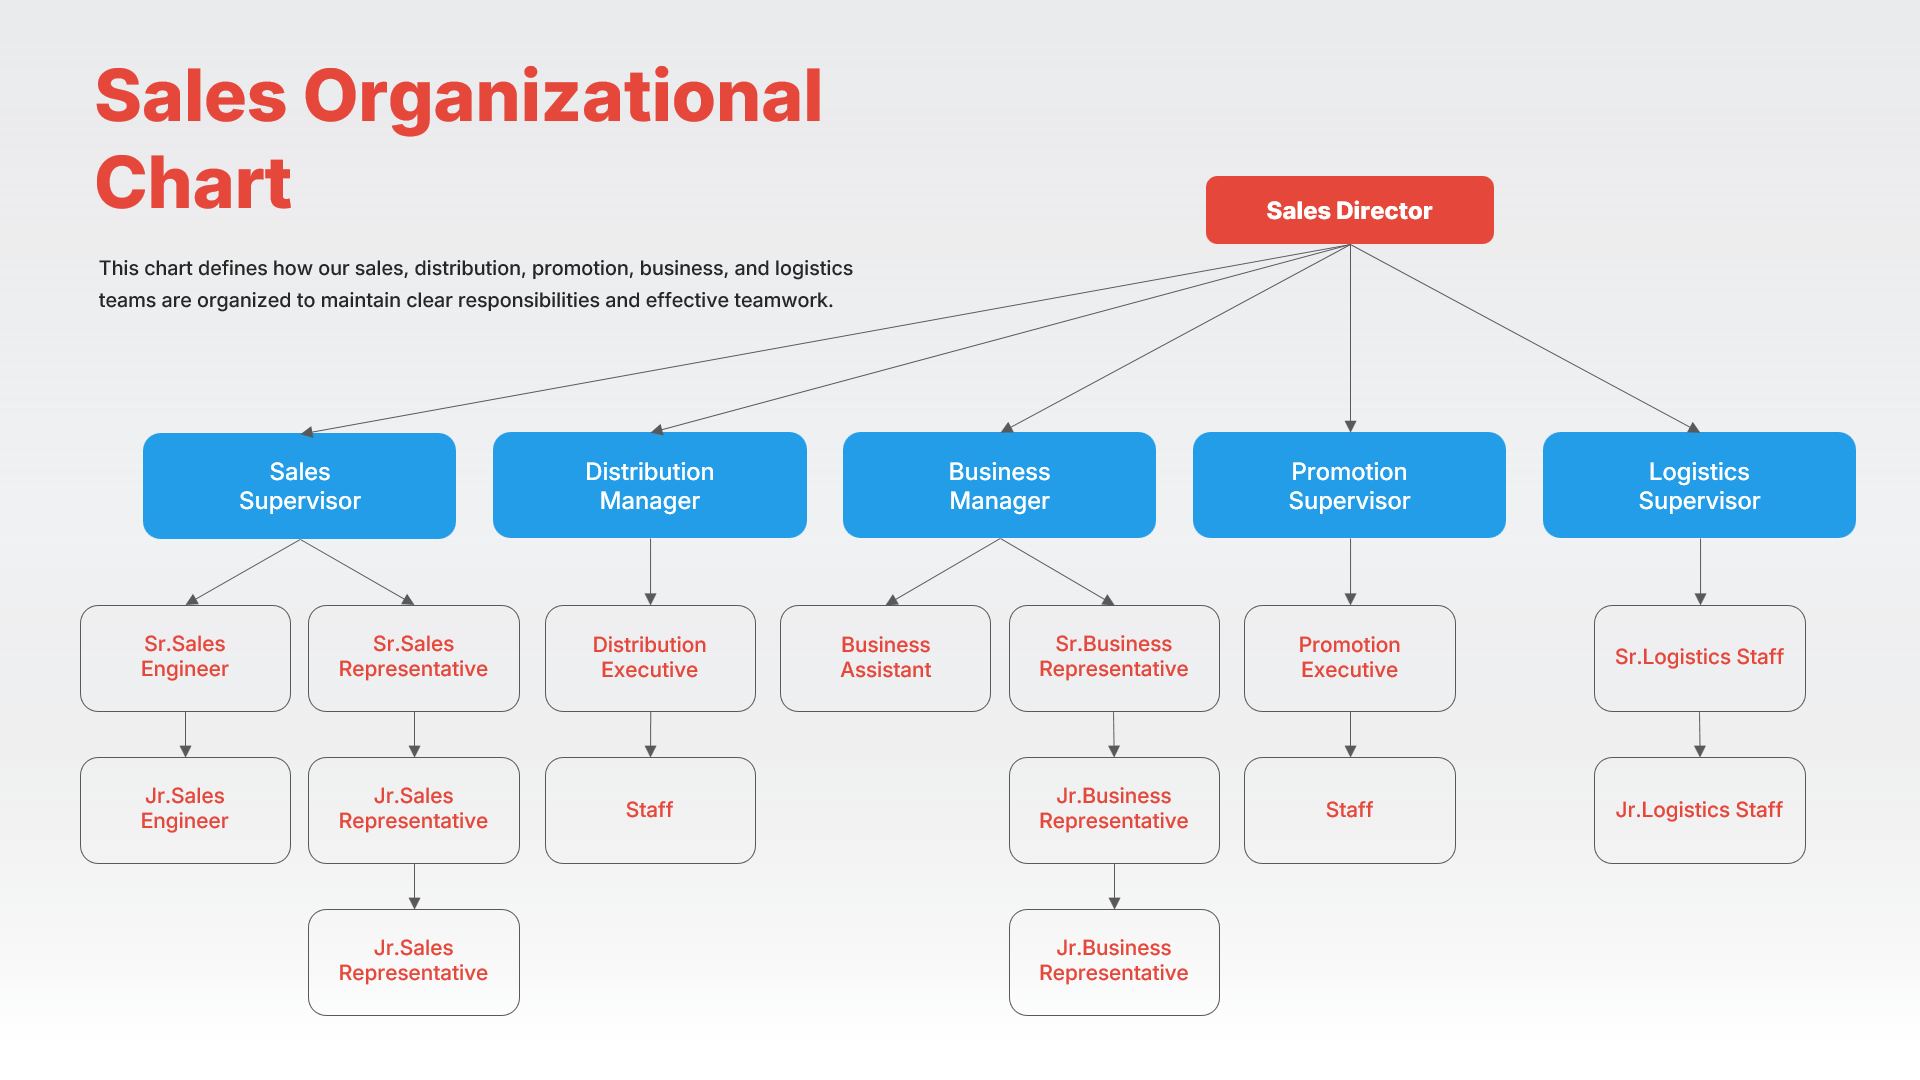
Sales Organizational Chart Hierarchy Template for PowerPoint & Google Slides
Org Chart
3D Bar Graph Infographic Template for PowerPoint & Google Slides
Bar/Column
Five-Stage Vertical Bar Process Template for PowerPoint & Google Slides
Process
Progress Bar Graph Layout Design for PowerPoint & Google Slides
Charts
Progress Bar Infographic for PowerPoint & Google Slides
Business
Progress Bar infographic pack for PowerPoint & Google Slides
Business
Timeline Roadmap with Progress Bar Template for PowerPoint & Google Slides
Timeline
Progress Bar and Milestone Visualization Template for PowerPoint & Google Slides
Timeline
Five Options Business Bar Graph for PowerPoint & Google Slides
Business Report
Blank Bar Graph Template for PowerPoint & Google Slides
Bar/Column
Sales Process Infographic Slides Pack Template for PowerPoint & Google Slides
Process
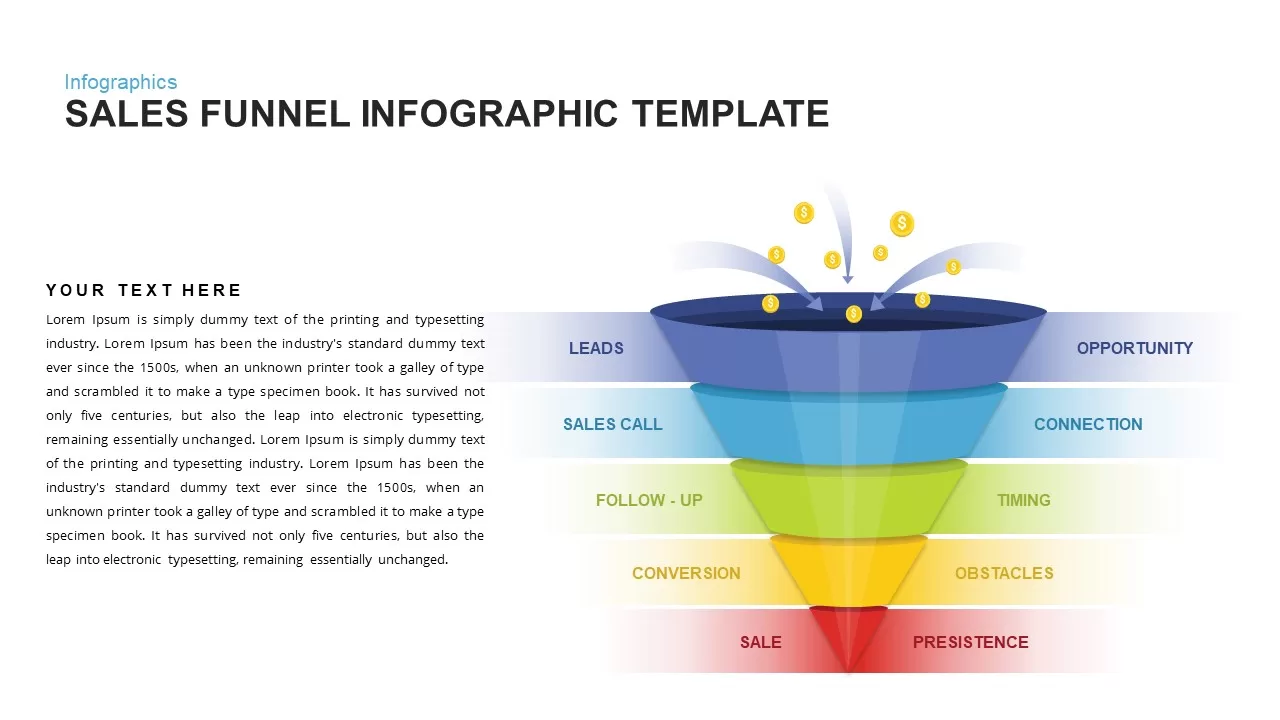
Sales Process Workflow Funnel Diagram PowerPoint Template for PowerPoint & Google Slides
Funnel
Circle Segment Sales Metrics Infographic Template for PowerPoint & Google Slides
Circular
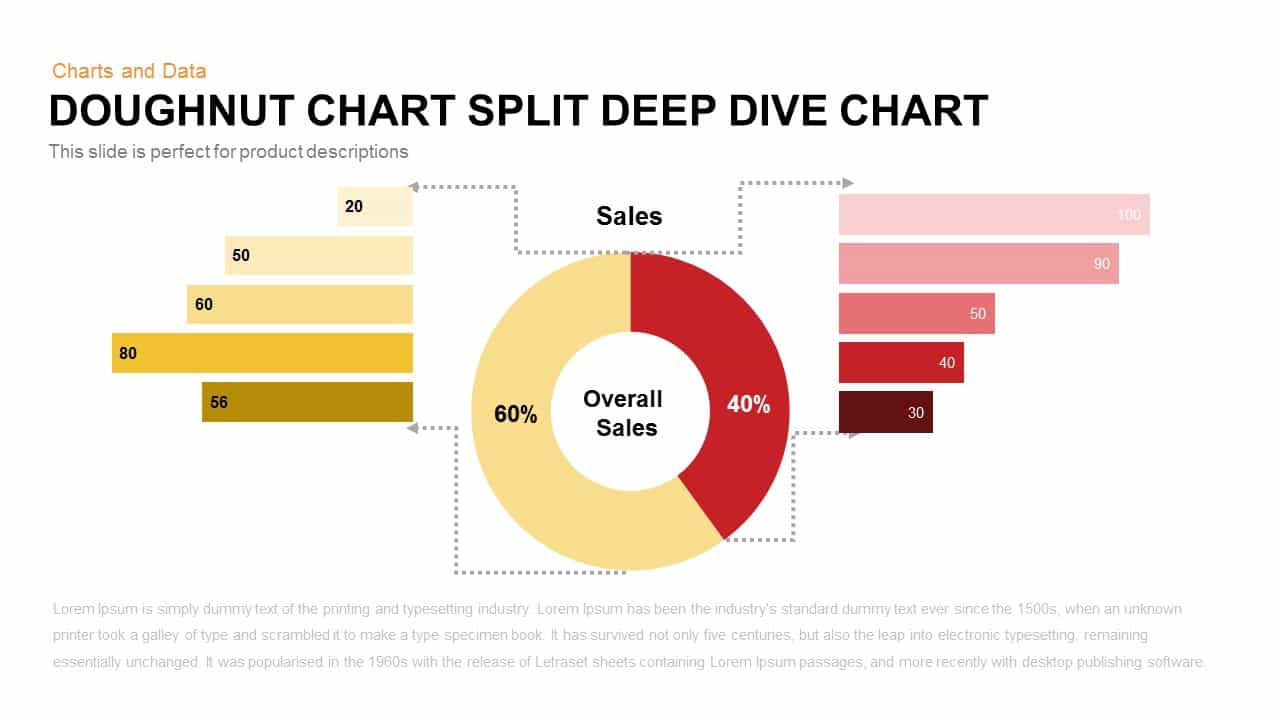
Split Doughnut Deep Dive Sales Analysis Template for PowerPoint & Google Slides
Pie/Donut

Sales Performance Dashboard template for PowerPoint & Google Slides
Business Report
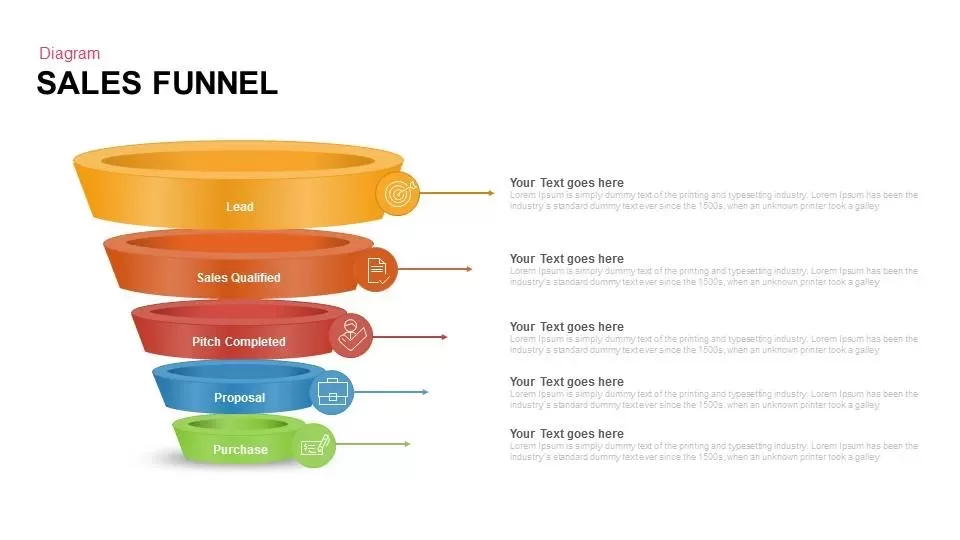
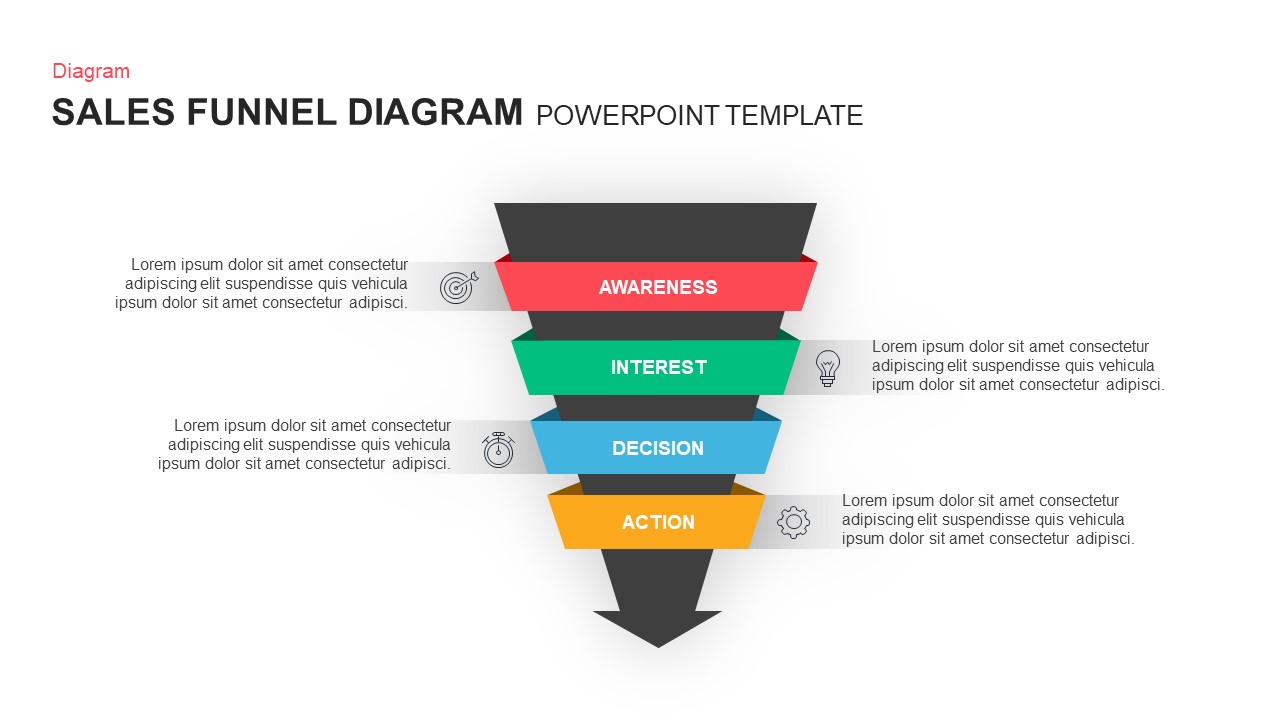
Sales Funnel Diagram for PowerPoint & Google Slides
Marketing Funnel
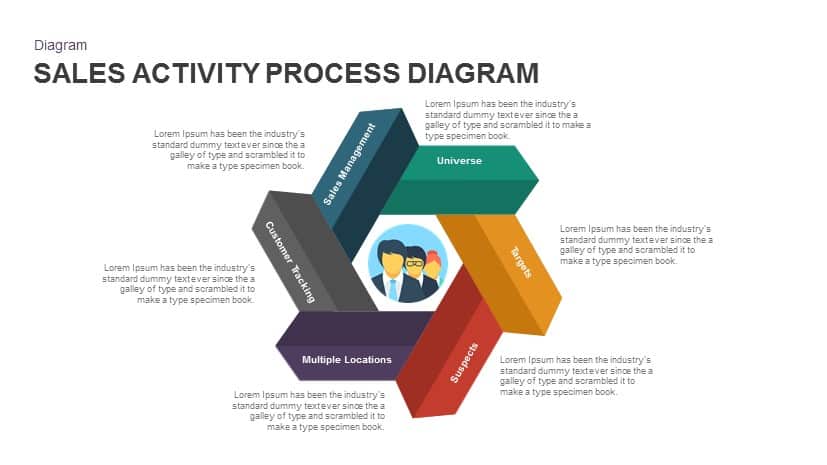
Sales Activity Hexagon Process Diagram Template for PowerPoint & Google Slides
Process
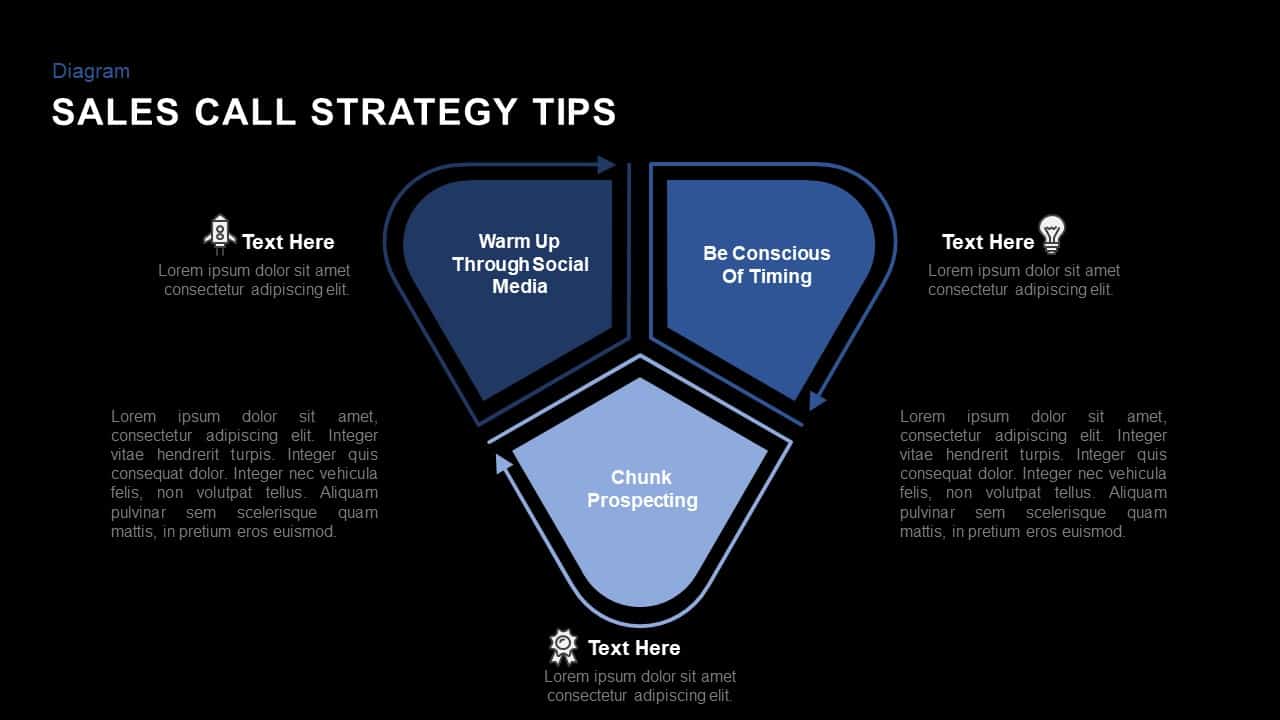
Sales Call Strategy Tips template for PowerPoint & Google Slides
Business Strategy
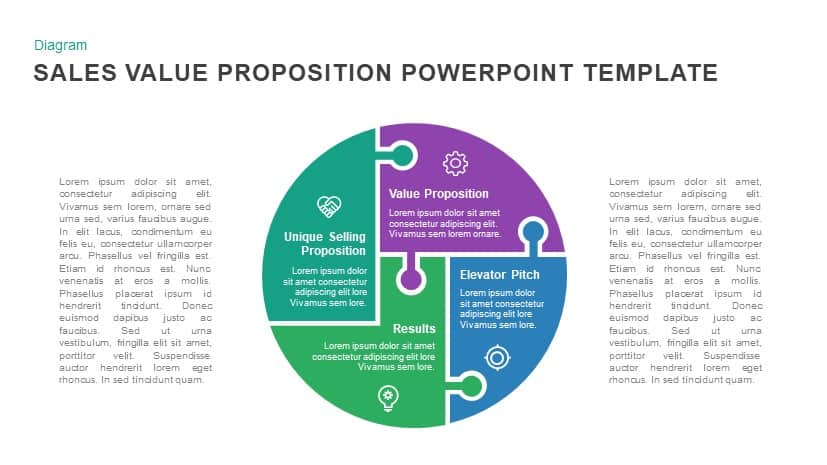
Sales Value Proposition template for PowerPoint & Google Slides
Infographics
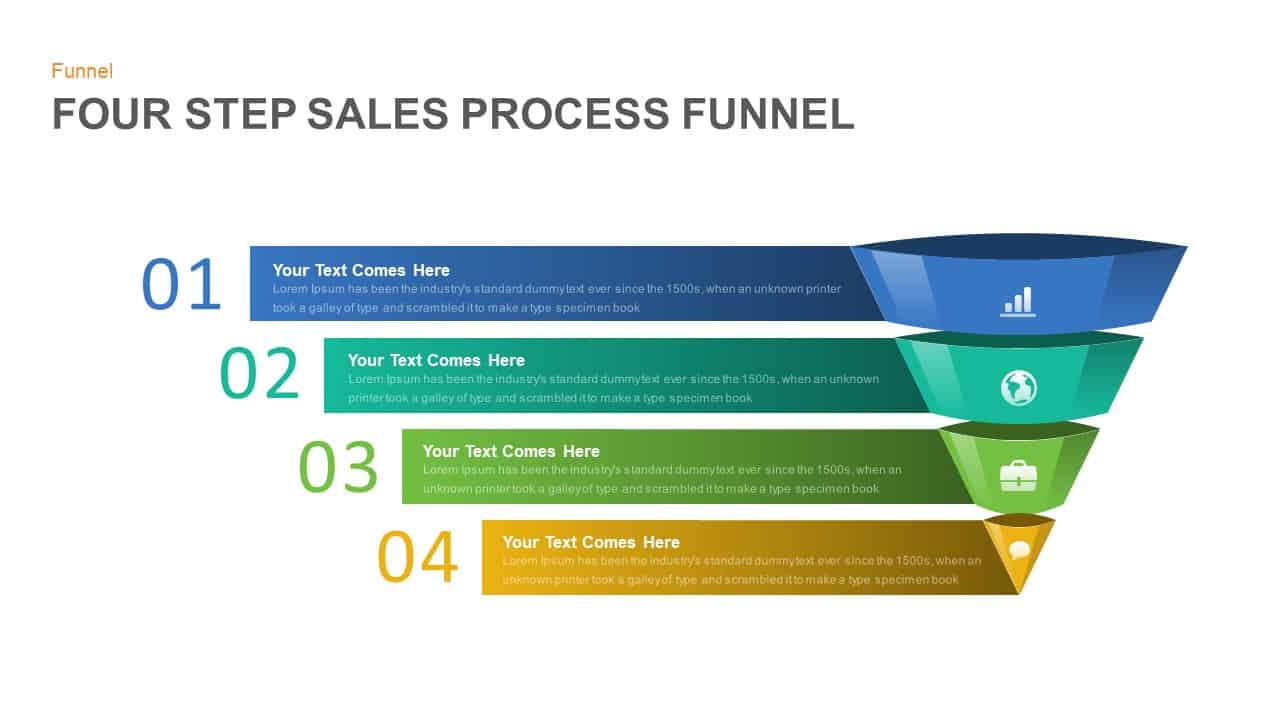
Four Step Sales Process Funnel Template for PowerPoint & Google Slides
Funnel
Professional Sales Funnel Diagram Template for PowerPoint & Google Slides
Funnel
Sales Growth Dashboard: KPI Gauge & Line Template for PowerPoint & Google Slides
Revenue
Sales Process Improvement Gear Diagram Template for PowerPoint & Google Slides
Process
Professional Sales Performance Report Template for PowerPoint & Google Slides
Business Report

5 Step Sales Planning Infographics for PowerPoint & Google Slides
Infographics
Four-Area Sales Partnering Process Template for PowerPoint & Google Slides
Process
4 Level Sales Funnel Diagram Design for PowerPoint & Google Slides
Marketing Funnel
Sales Funnel Infographic Diagram Template for PowerPoint & Google Slides
Funnel
Sales Meeting Overview template for PowerPoint & Google Slides
Pitch Deck
Sales Presentation Deck for PowerPoint & Google Slides
Decks
Black and White Sales Presentation Template for PowerPoint & Google Slides
Decks
Sales Plan Presentation Template for PowerPoint & Google Slides
Business Plan
Sales Plan & Strategy Overview template for PowerPoint & Google Slides
Business Strategy
Customizable Sales Tree Diagram Template for PowerPoint & Google Slides
Org Chart
Cloud Revel Sales Presentation Template for PowerPoint & Google Slides
Marketing

Bueno Sales Proposal Template for PowerPoint & Google Slides
Pitch Deck
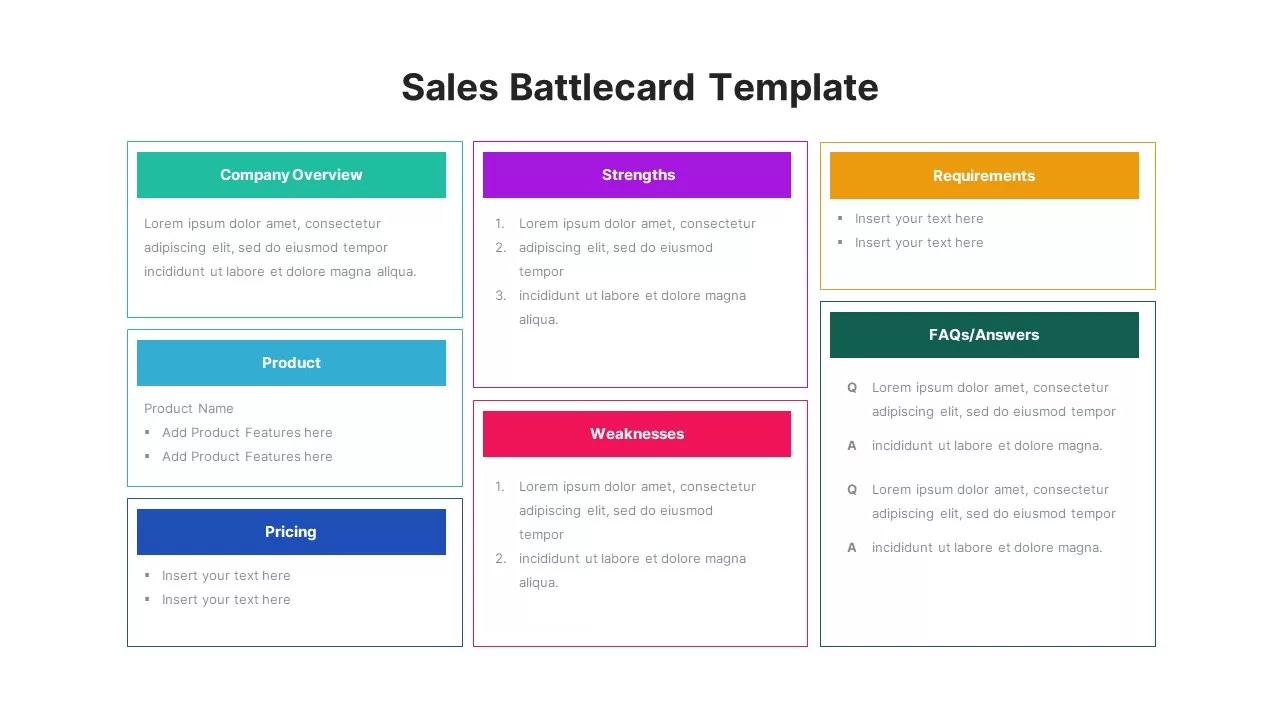
Sales Battlecard Overview Template for PowerPoint & Google Slides
Marketing
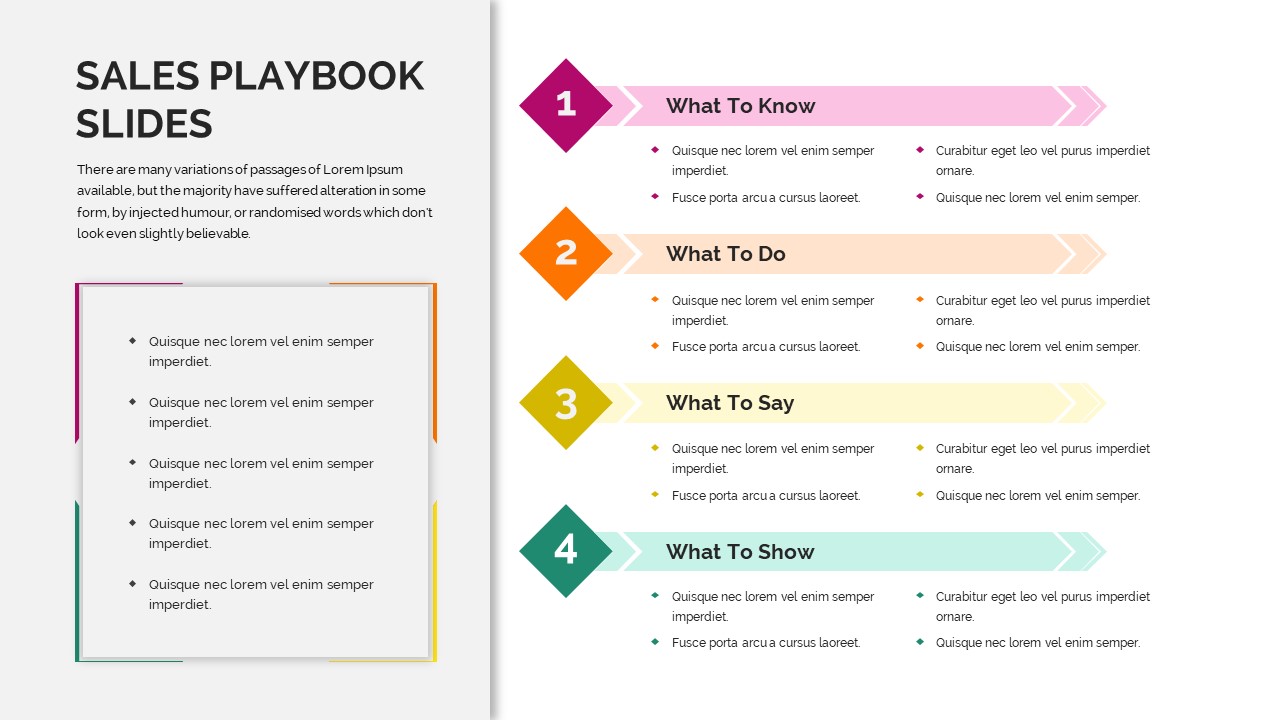
Sales Playbook Process Steps Diagram Template for PowerPoint & Google Slides
Marketing
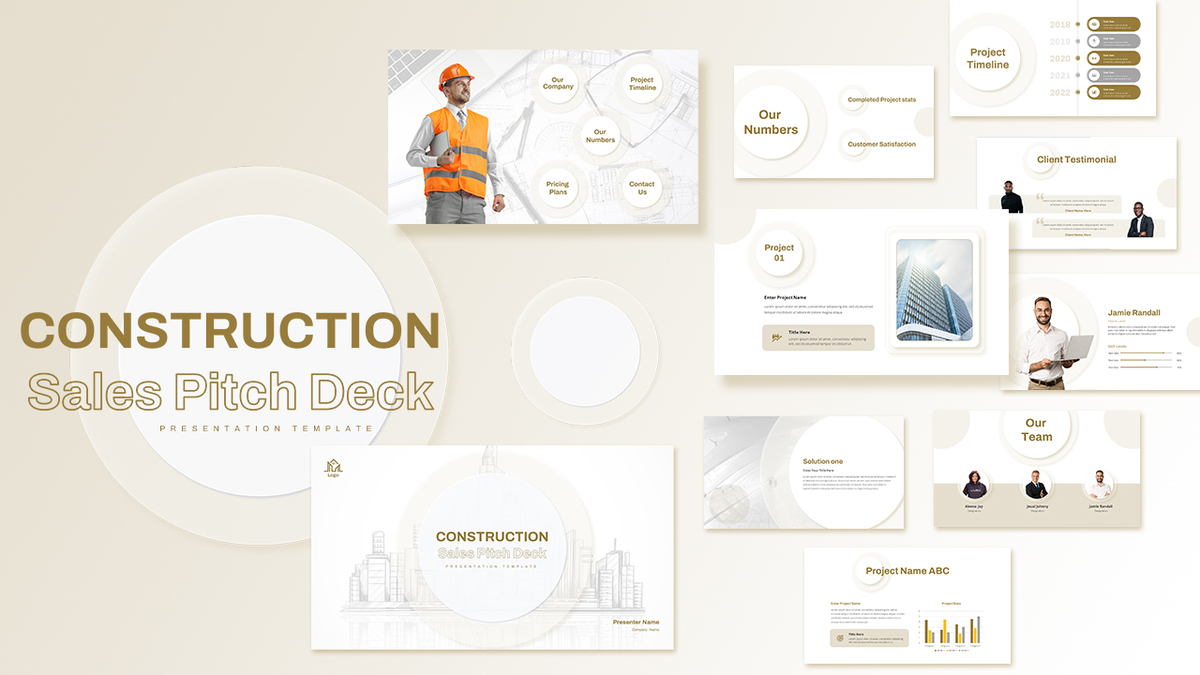
Prezi-Style Construction Sales Pitch Template for PowerPoint & Google Slides
Company Profile
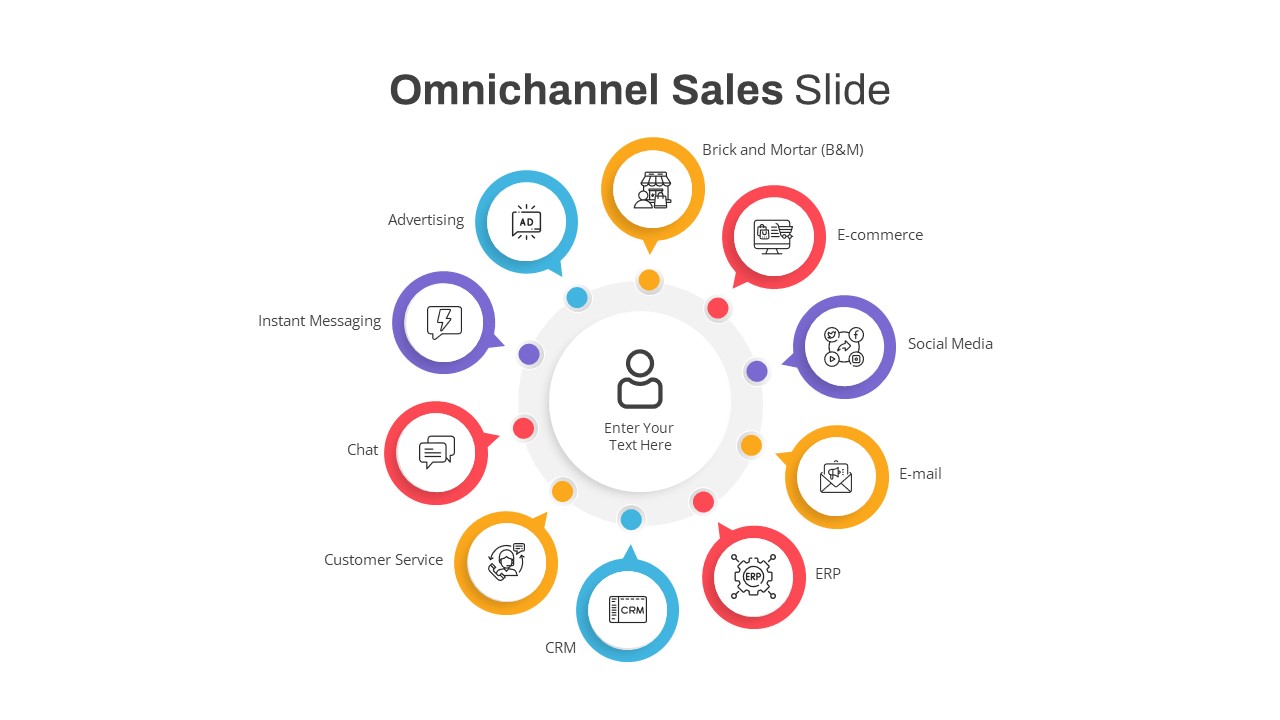
Omnichannel Sales Circular Hub & Spoke Template for PowerPoint & Google Slides
Digital Marketing
Consulting Sales Presentation Pitch Deck Template for PowerPoint & Google Slides
Pitch Deck
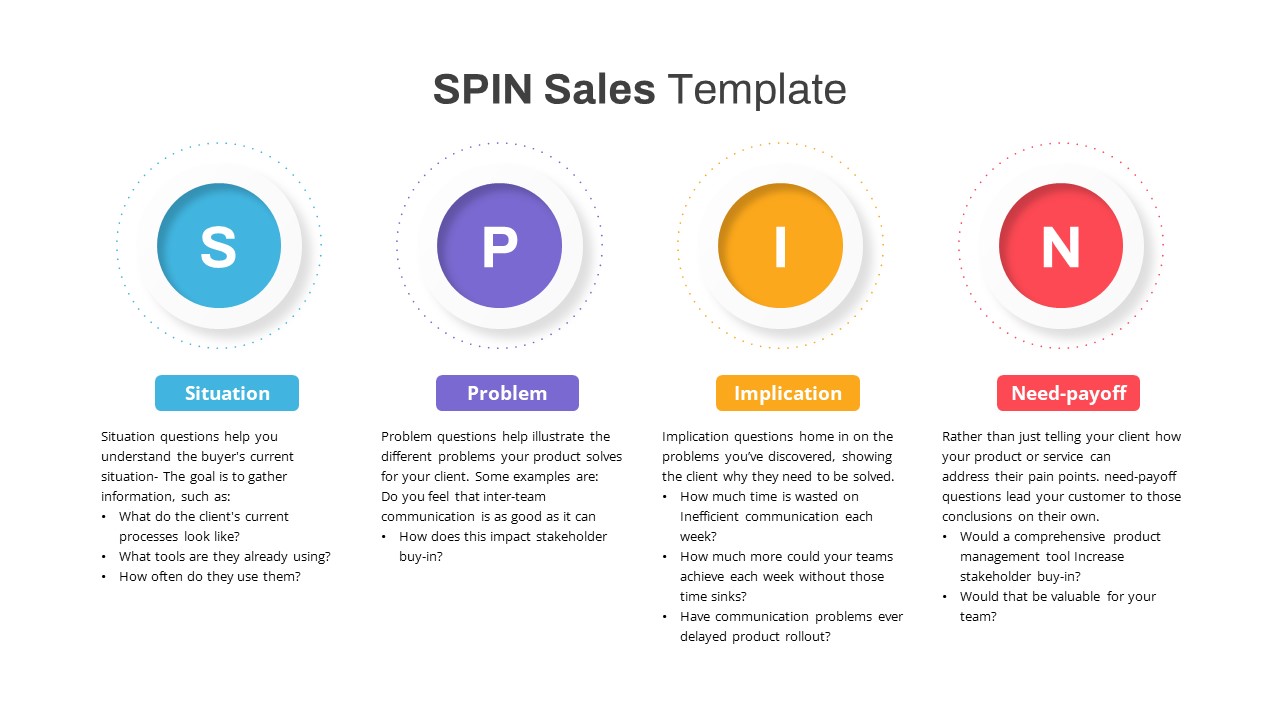
SPIN Sales Methodology Diagram Template for PowerPoint & Google Slides
Process
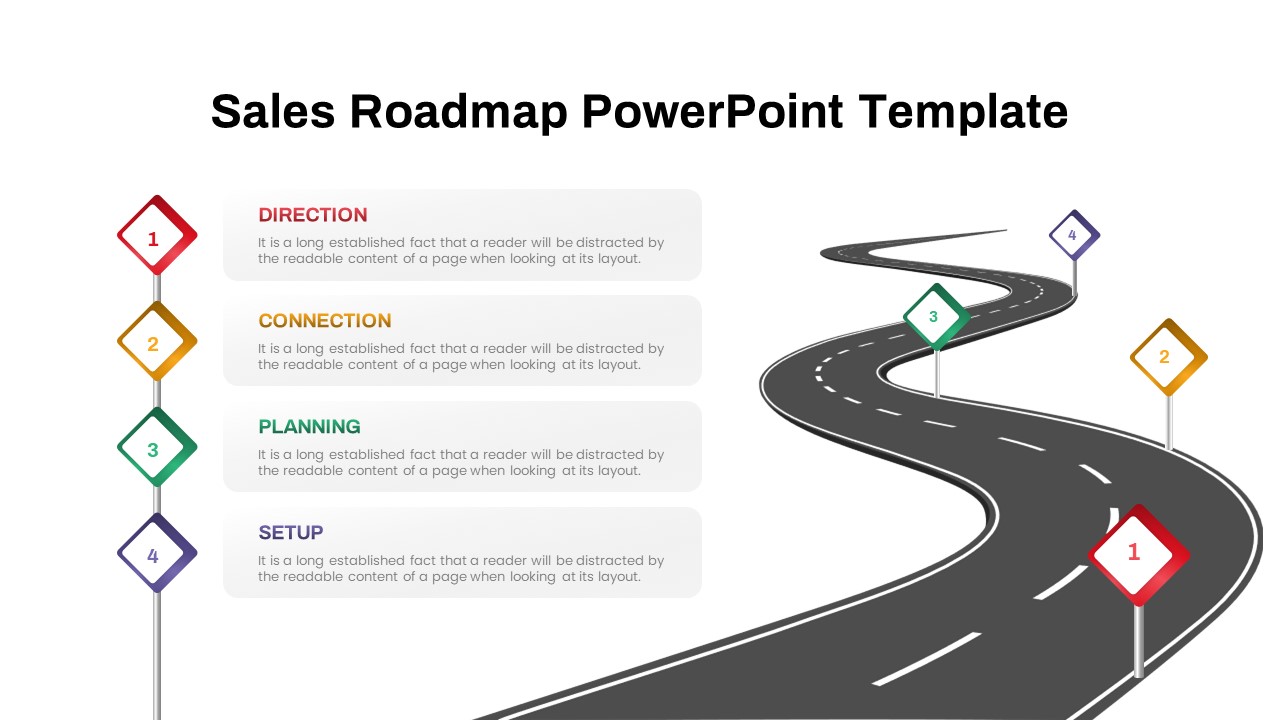
Professional Winding Road Sales Roadmap Template for PowerPoint & Google Slides
Roadmap
Free Modern Sales Pitch Deck Template for PowerPoint & Google Slides
Pitch Deck
Free
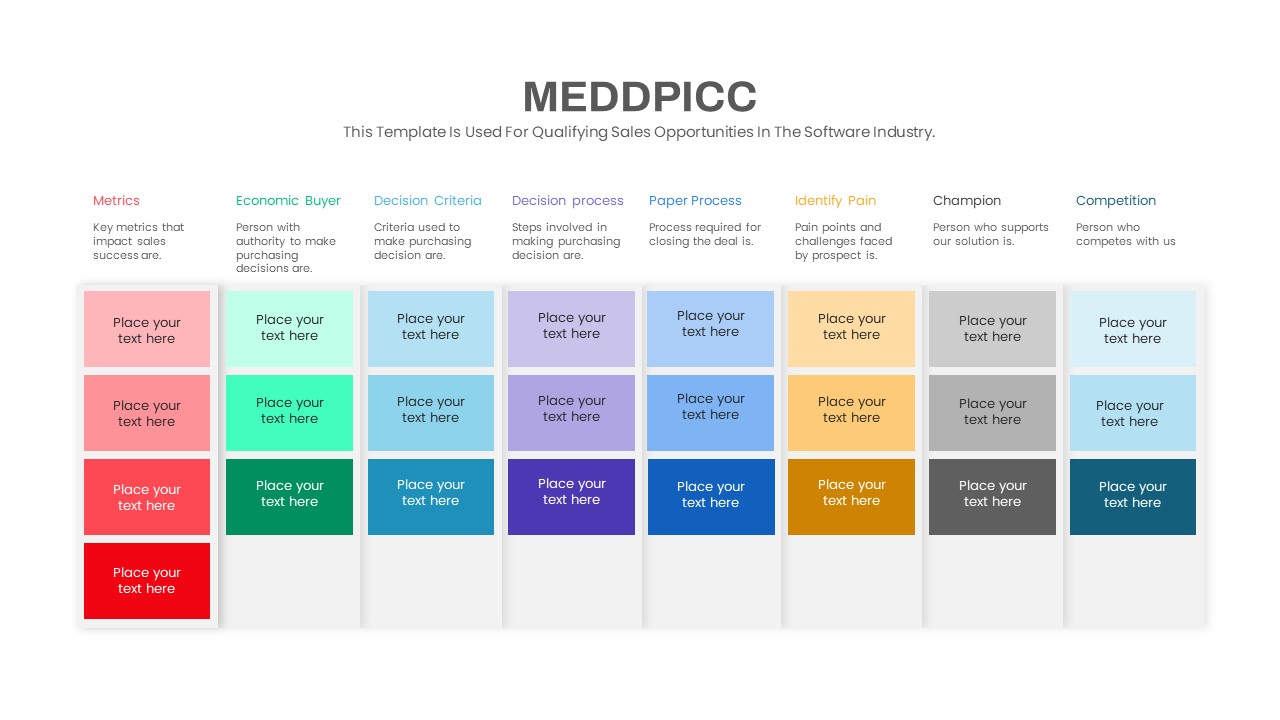
MEDDPICC Sales Qualification Framework Template for PowerPoint & Google Slides
Process
B2B Marketing and Sales Deck Template for PowerPoint & Google Slides
Advertising
Monthly Sales Performance Dashboard Template for PowerPoint & Google Slides
Charts
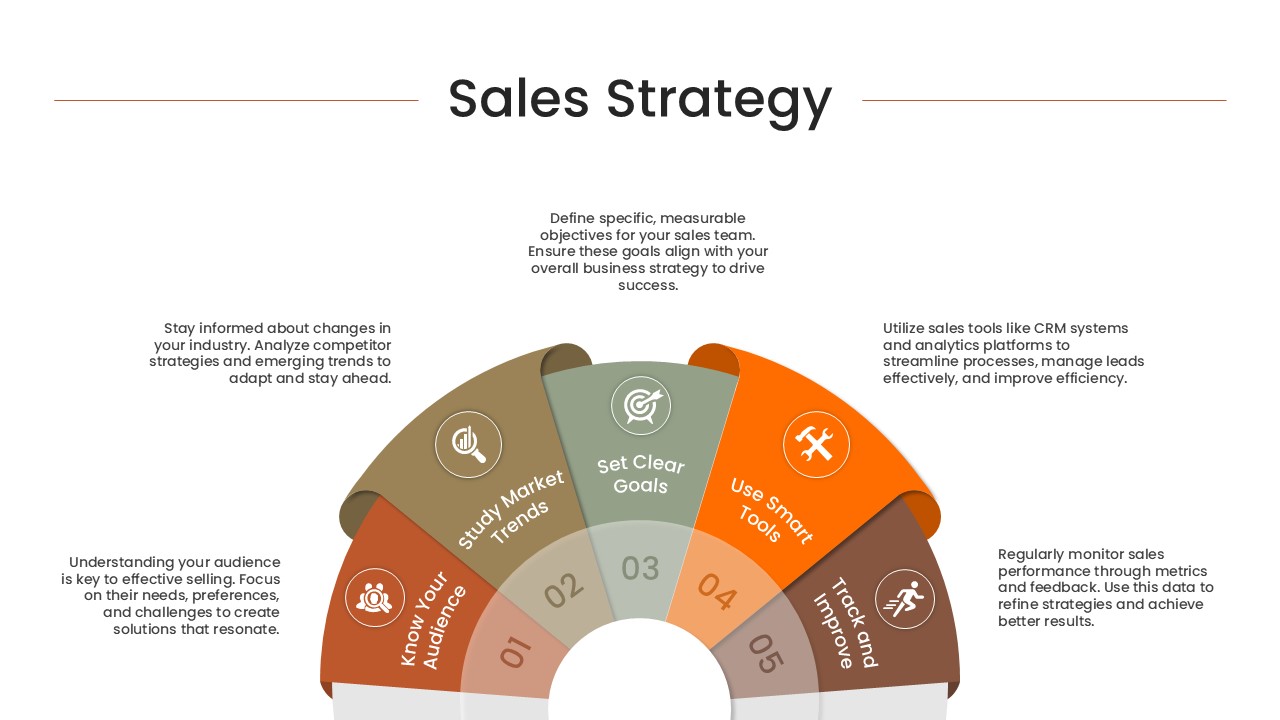
Semi-Circular Sales Strategy Roadmap Template for PowerPoint & Google Slides
Circular
Professional Animated Sales Presentation Template for PowerPoint & Google Slides
Pitch Deck
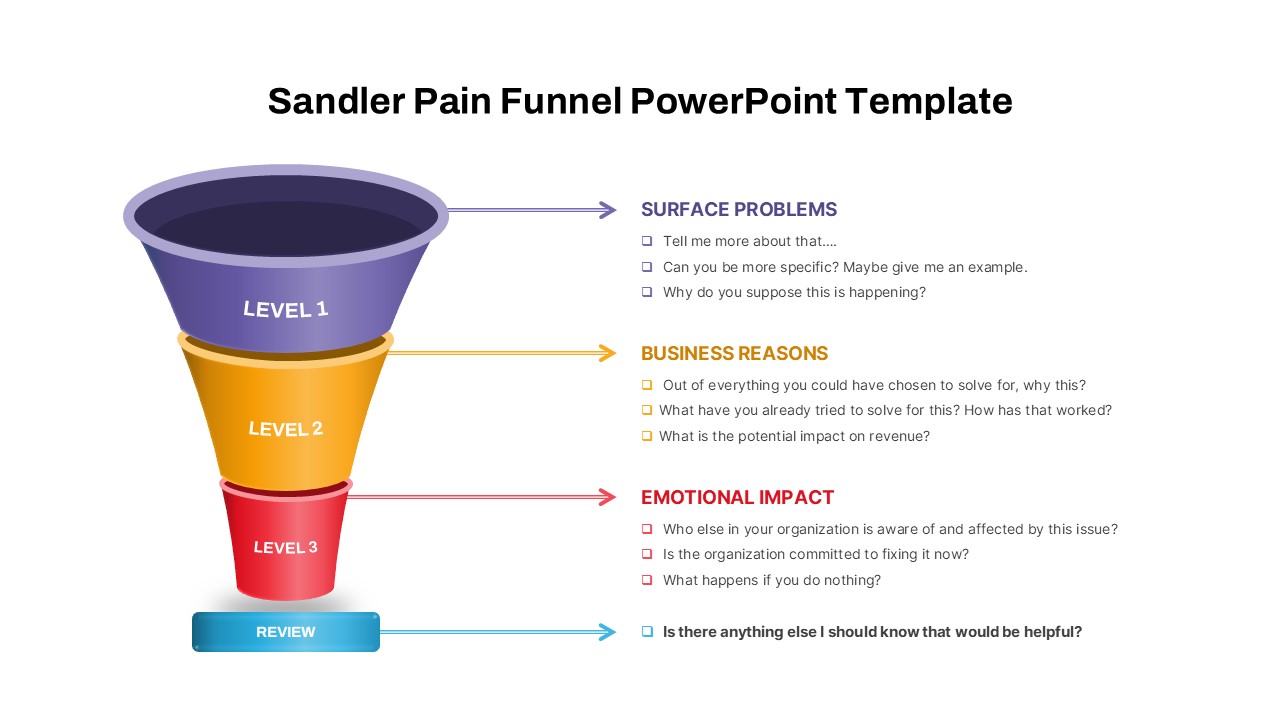
Sandler Pain Funnel Sales Qualification Template for PowerPoint & Google Slides
Funnel
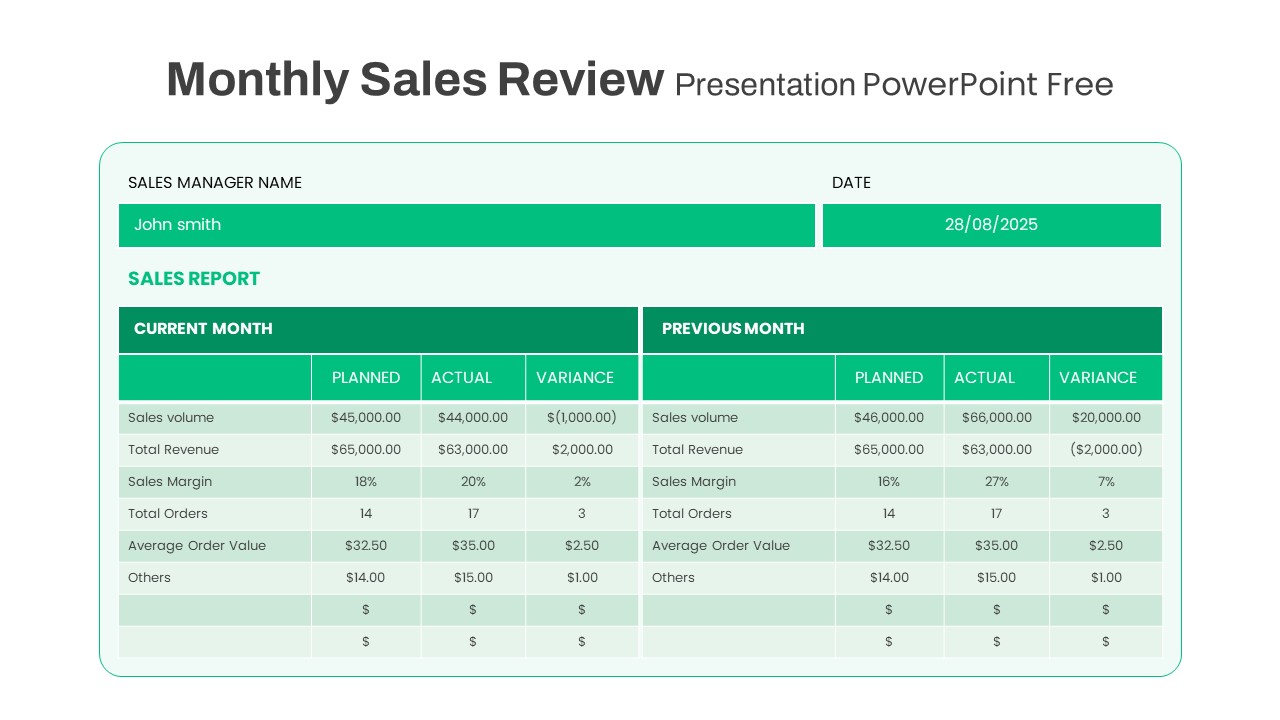
Free Monthly Sales Review template for PowerPoint & Google Slides
Business Report
Free
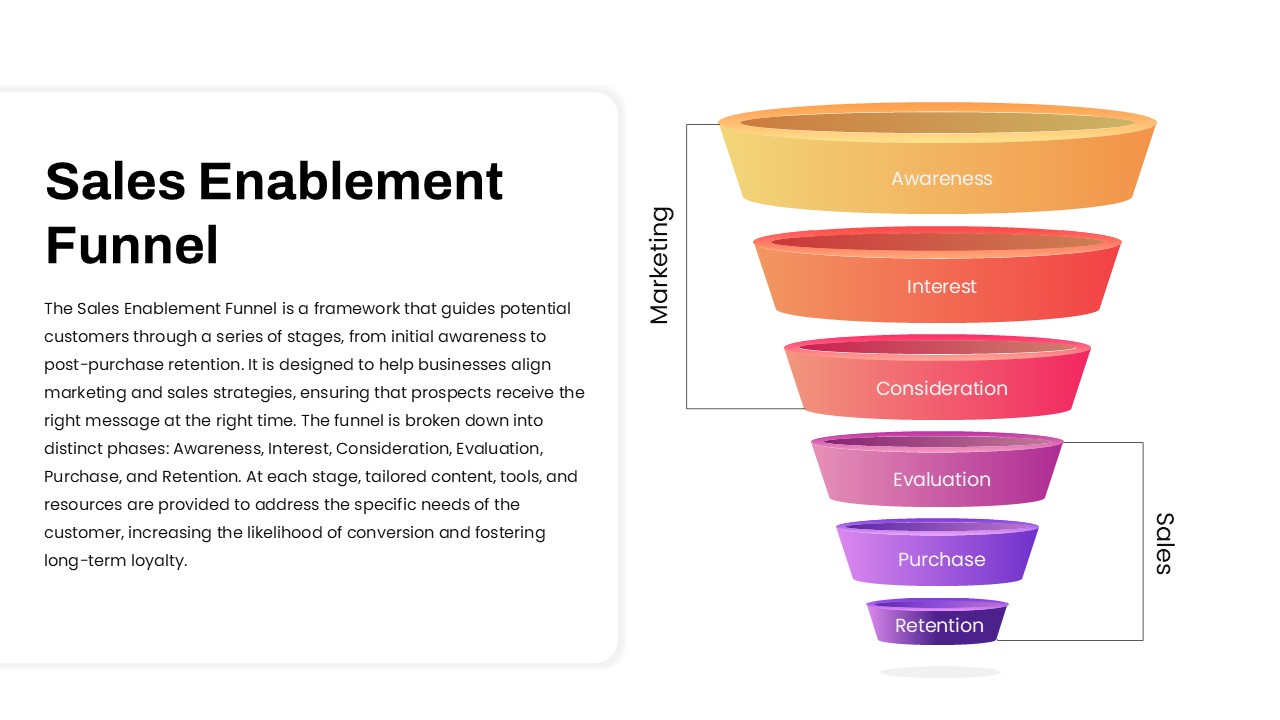
Sales Enablement Funnel diagram for PowerPoint & Google Slides
Funnel
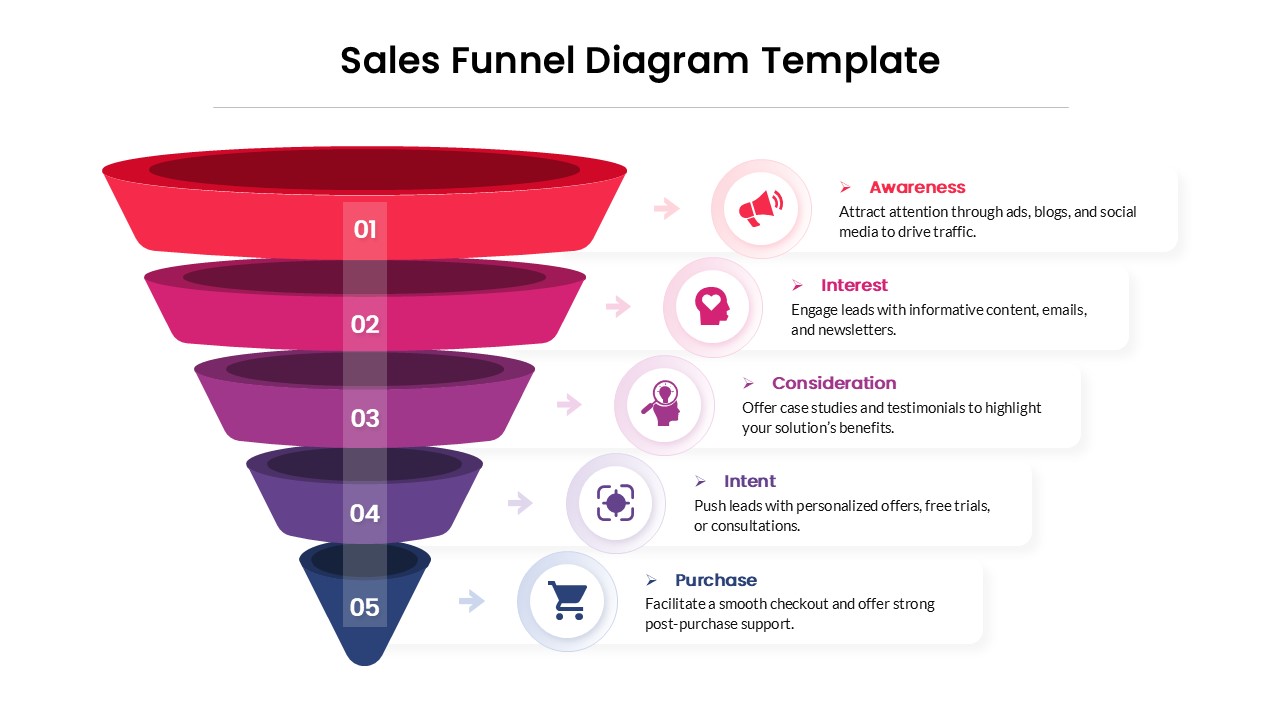
5 Stage Sales Funnel Diagram Template for PowerPoint & Google Slides
Funnel
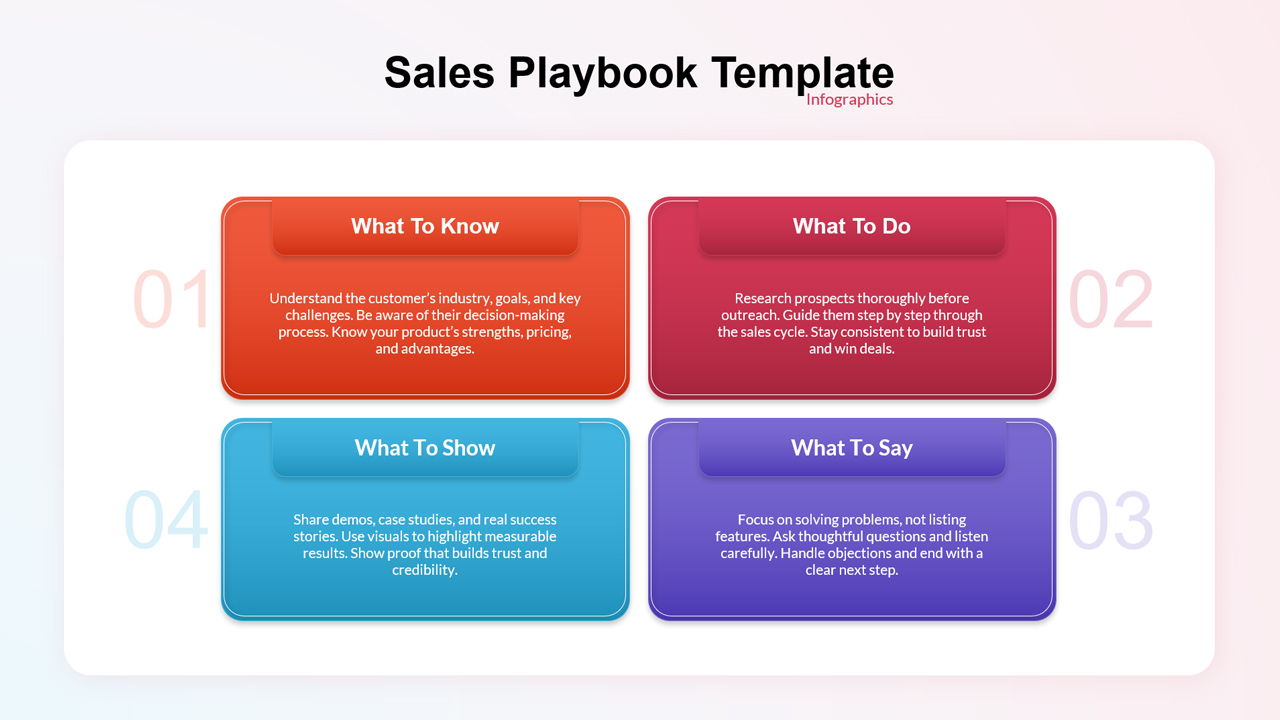
Four Step Sales Playbook Guide Template for PowerPoint & Google Slides
Marketing
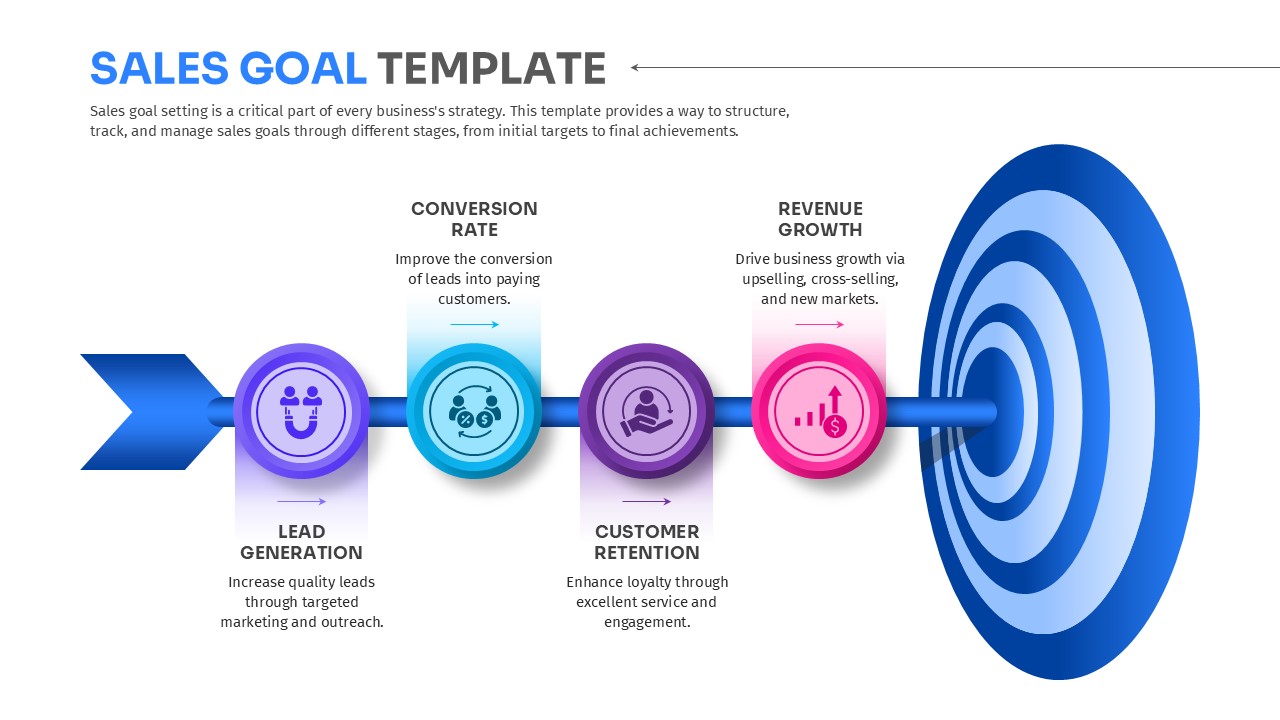
Sales Goal Template for PowerPoint & Google Slides
Goals
Data-Driven Sales Strategy Diagram Template for PowerPoint & Google Slides
Marketing
Sales Proposal Template for PowerPoint & Google Slides
Business Proposal