Risk Probability and Impact Matrix Template for PowerPoint & Google Slides

Description
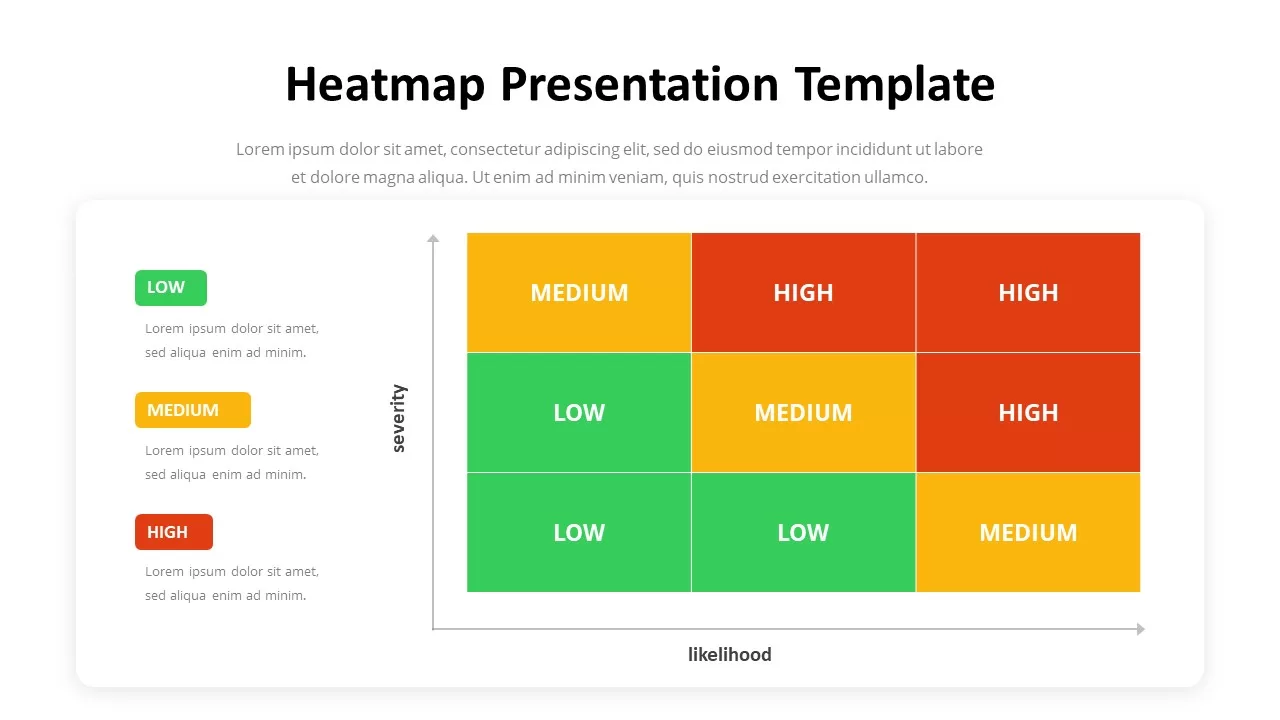
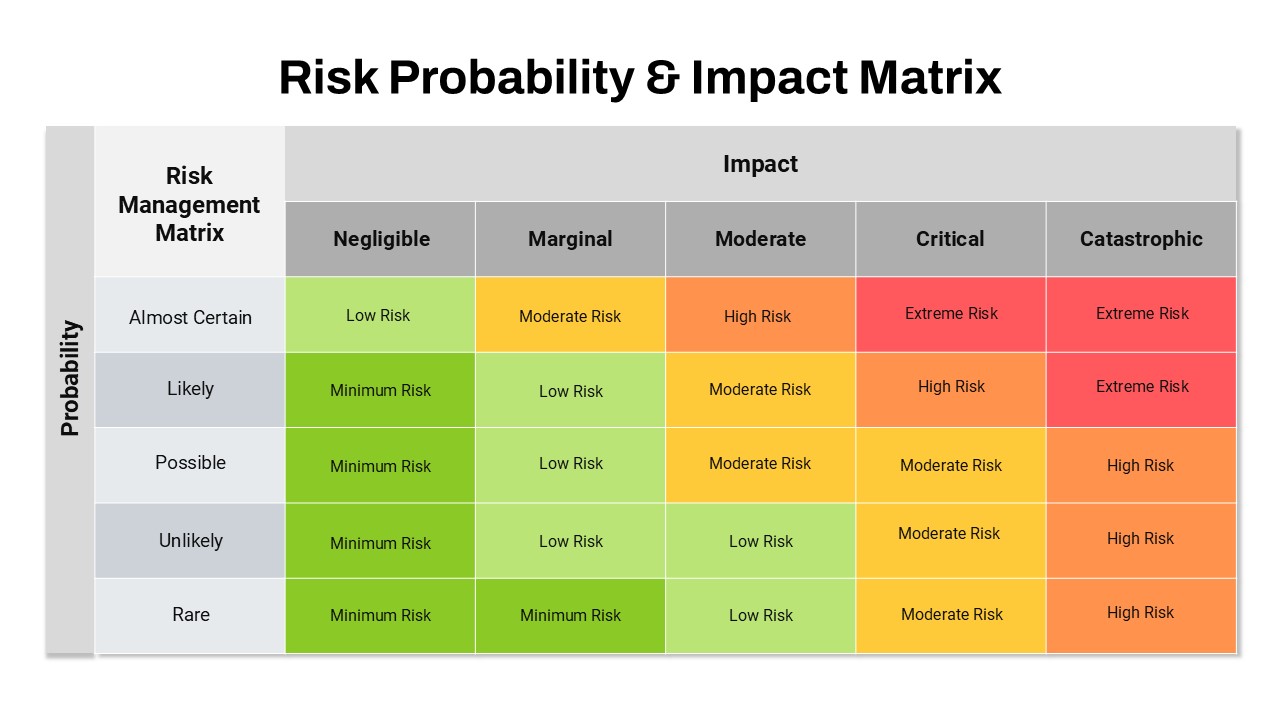
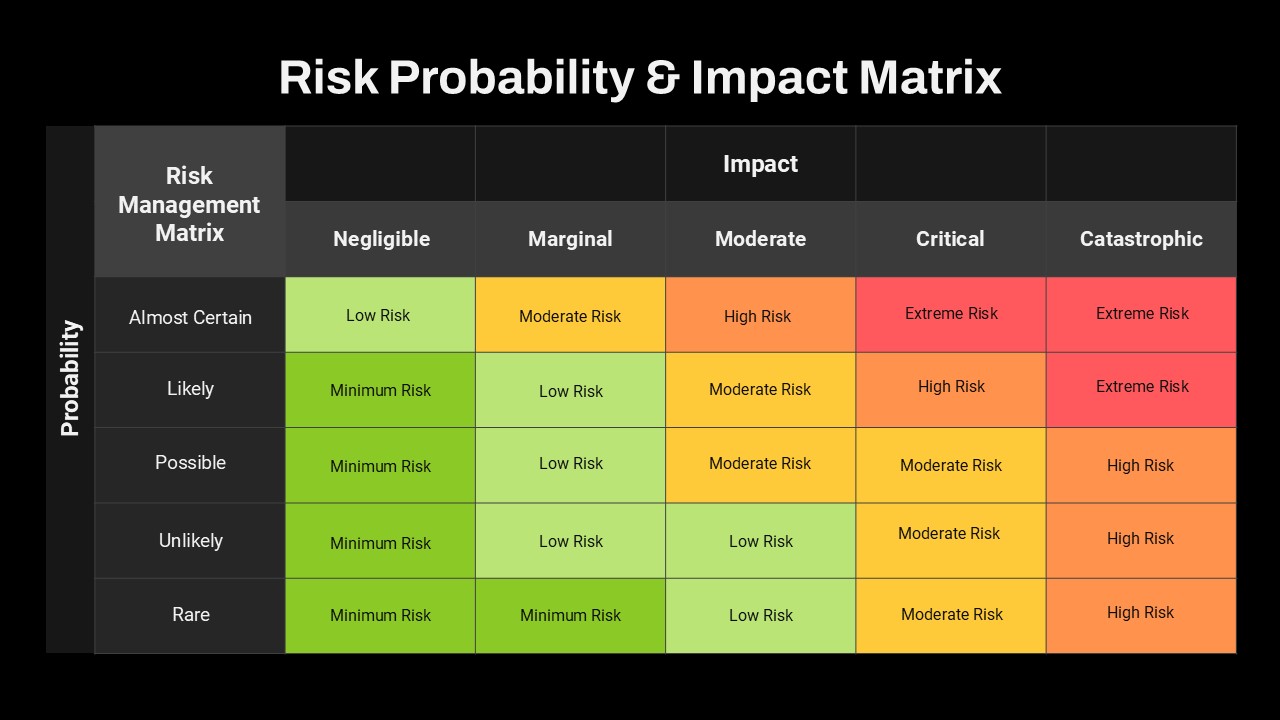
Use this Risk Probability and Impact Matrix slide to assess and visualize how likely risks are to occur versus their potential impact. The 5×5 grid plots Probability (Rare to Almost Certain) on the vertical axis against Impact (Negligible to Catastrophic) on the horizontal, with each cell color-coded from green (low risk) through yellow and orange to red (extreme risk). Editable labels let you tailor the likelihood and consequence descriptors, while the legend style coloring makes it easy to pinpoint high-priority areas at a glance. Built on master slides, this template supports quick updates to cell texts, color thresholds, and axis titles without disrupting the clean alignment.
Master-slide placeholders ensure a polished look in both PowerPoint and Google Slides: simply swap out the row/column headings, adjust the color palette to match your brand, or duplicate the matrix to show multiple scenarios. The minimalist white background, subtle drop shadows, and uniform typography maintain readability on any device or projector. Streamline your risk workshops, audit reviews, or project-planning meetings by presenting complex risk profiles in a simple, actionable format that drives focused mitigation efforts.
Who is it for
Risk managers, safety officers, auditors, project managers, and compliance teams will benefit from this slide when evaluating and communicating risk levels, prioritizing controls, or reporting heatmap-style risk assessments to stakeholders.
Other Uses
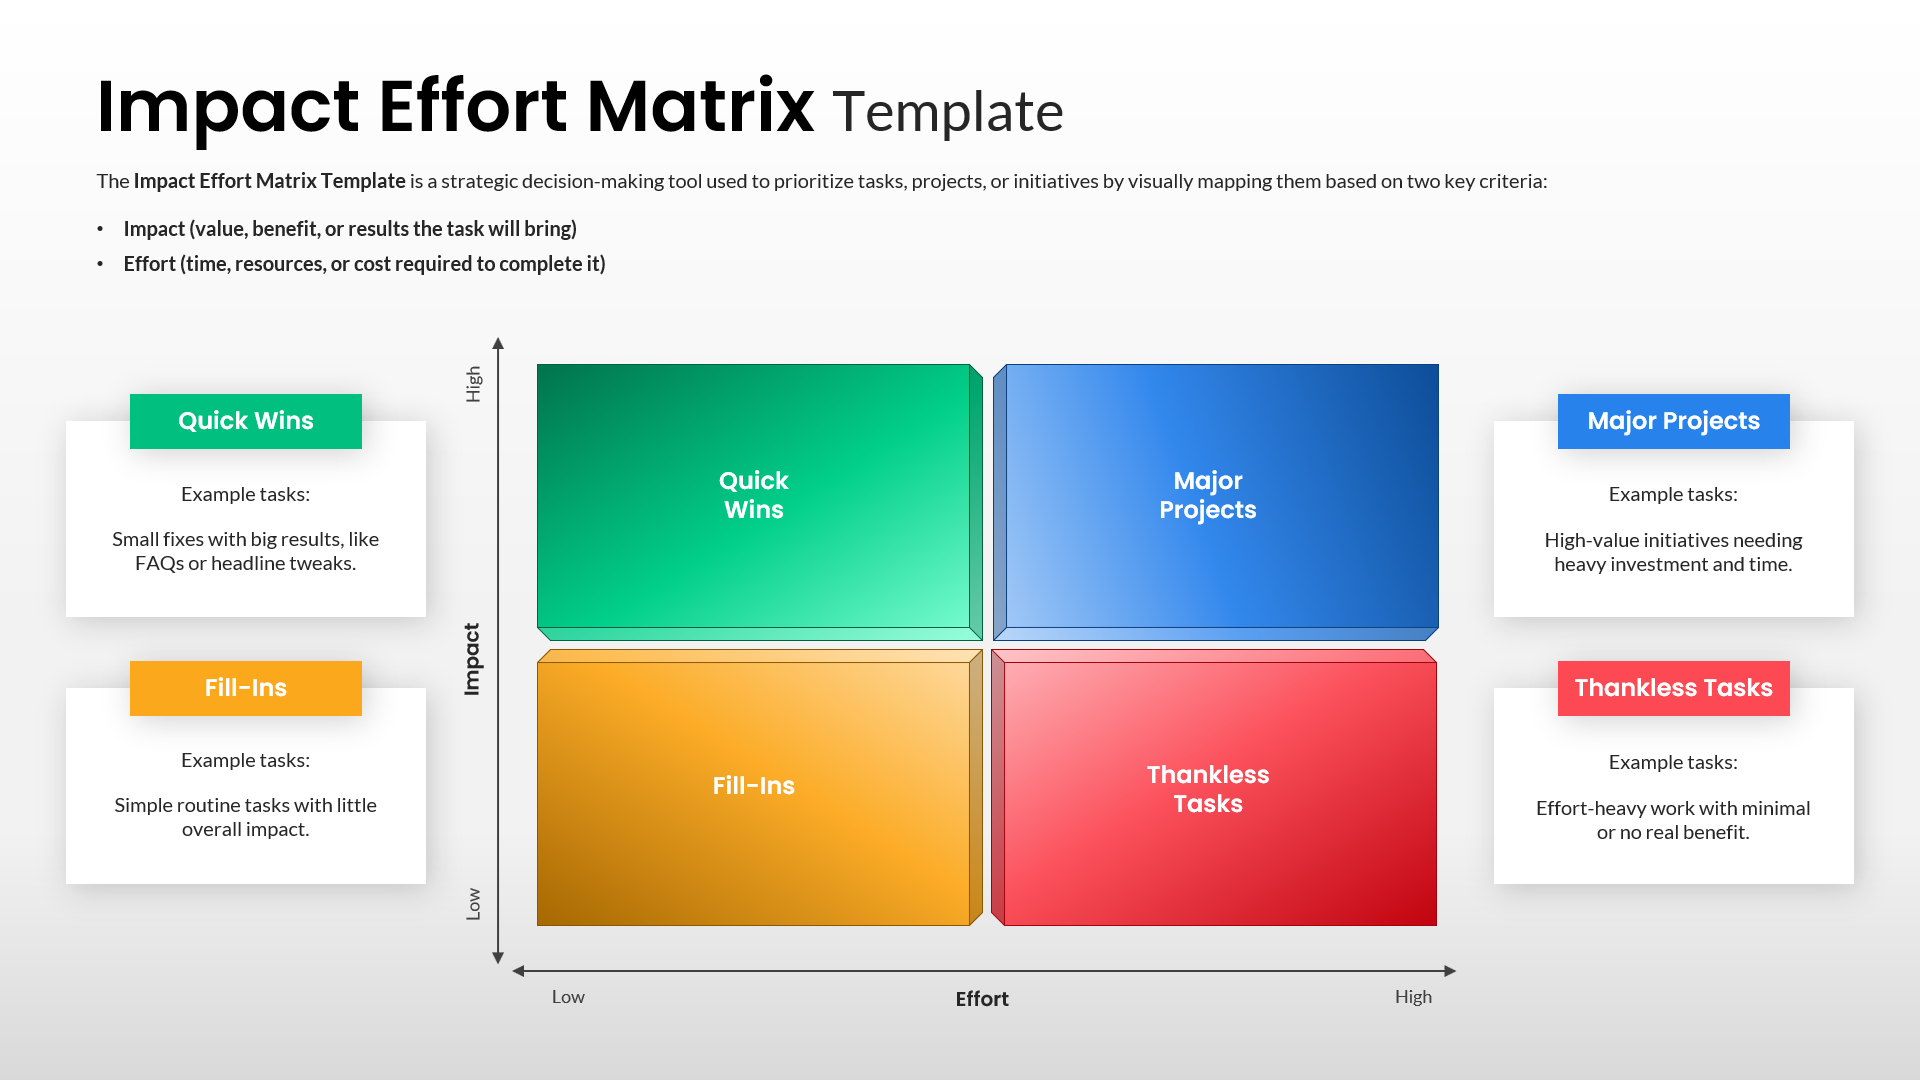
Repurpose this matrix for impact-versus-effort prioritization, vendor performance rankings, budget allocation heatmaps, or customer satisfaction grids by updating the row and column labels to fit any two-dimensional scoring framework.
Login to download this file

Item ID
SB05387
Related Templates

Comprehensive Risk Impact Analysis Template for PowerPoint & Google Slides
Risk Management

Impact Effort Matrix Template for PowerPoint & Google Slides
Comparison Chart
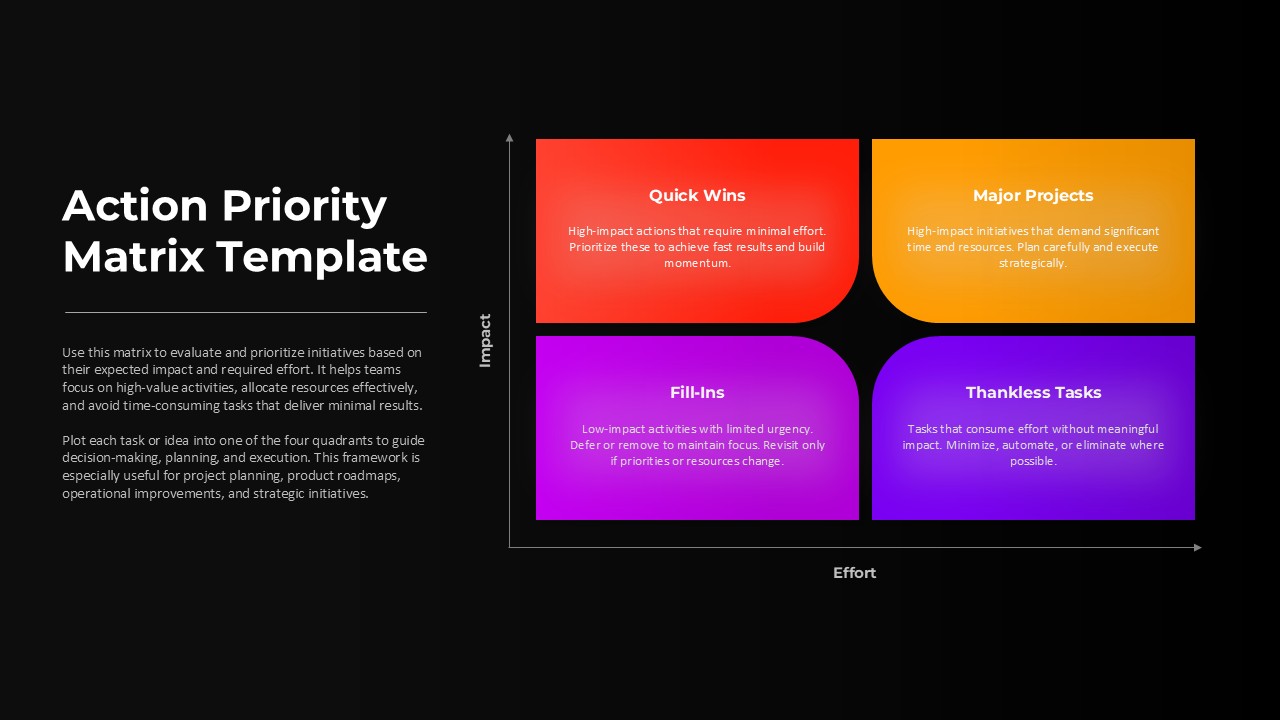
Action Priority Impact Effort Matrix Template for PowerPoint & Google Slides
Business Strategy
Heat Map Risk Matrix Dashboard Template for PowerPoint & Google Slides
Comparison Chart
Risk Assessment Heatmap Matrix Slide Template for PowerPoint & Google Slides
Comparison Chart
Risk Scoring & Ranking Heatmap Matrix Template for PowerPoint & Google Slides
Risk Management
Quantitative Risk Analysis Matrix template for PowerPoint & Google Slides
Risk Management
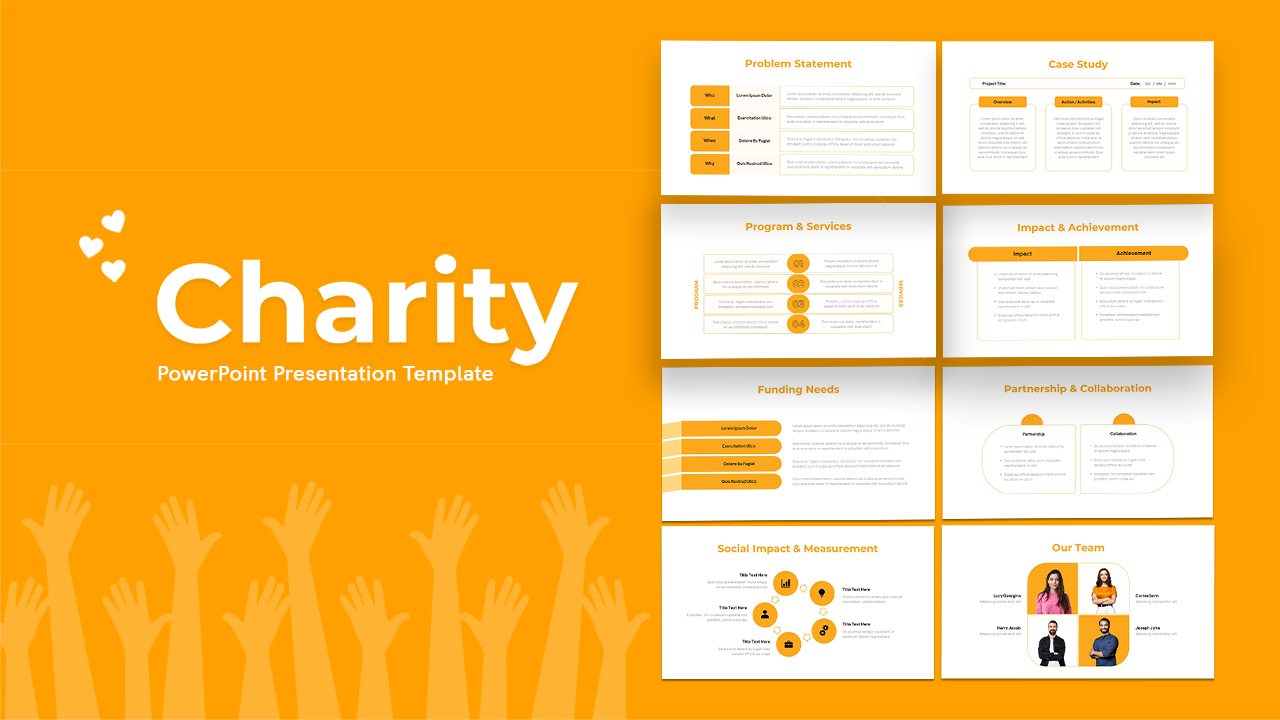
Free Nonprofit Charity Social Impact Deck Template for PowerPoint & Google Slides
Pitch Deck
Free
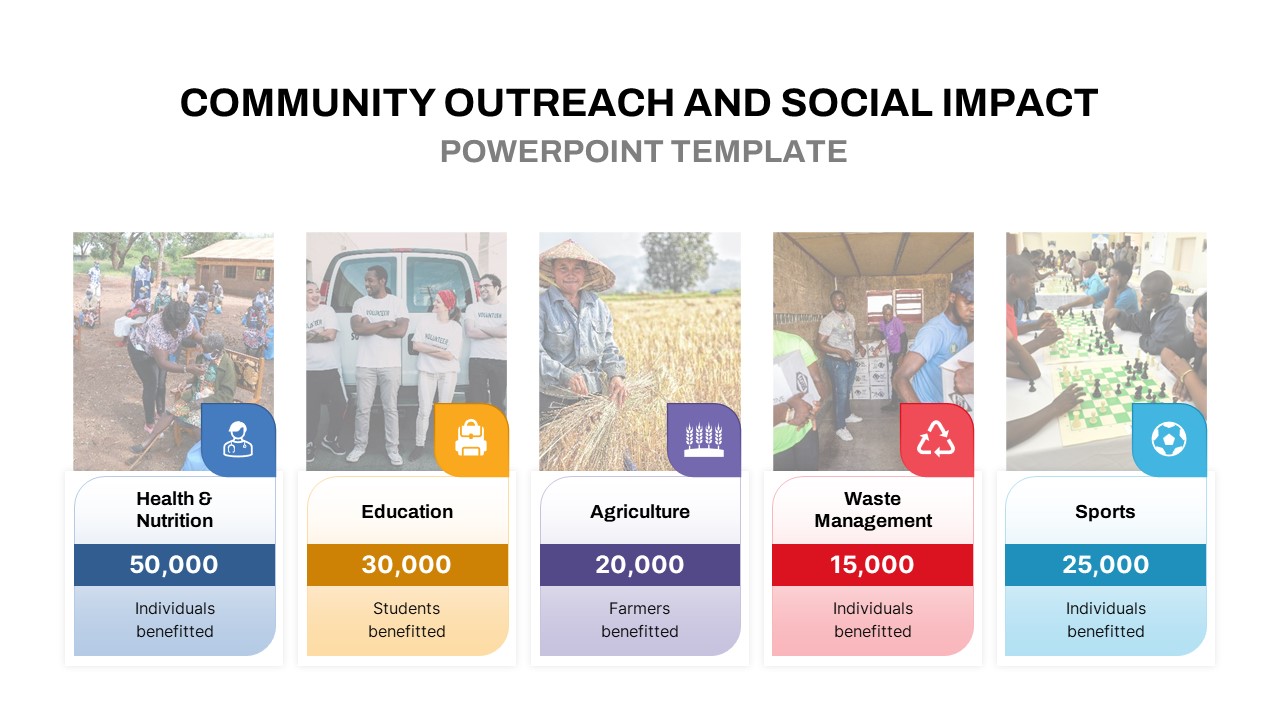
Community Outreach Impact Metrics Template for PowerPoint & Google Slides
Accomplishment
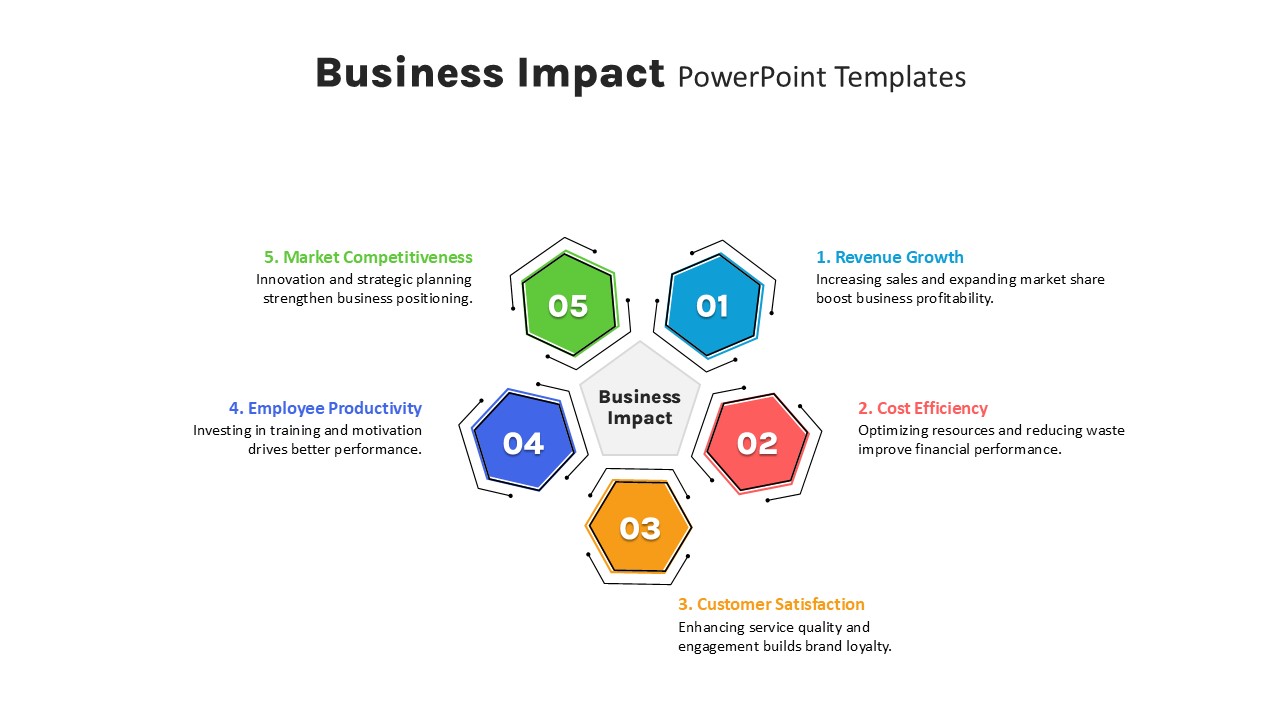
Five-Step Hexagon Business Impact Template for PowerPoint & Google Slides
Circular
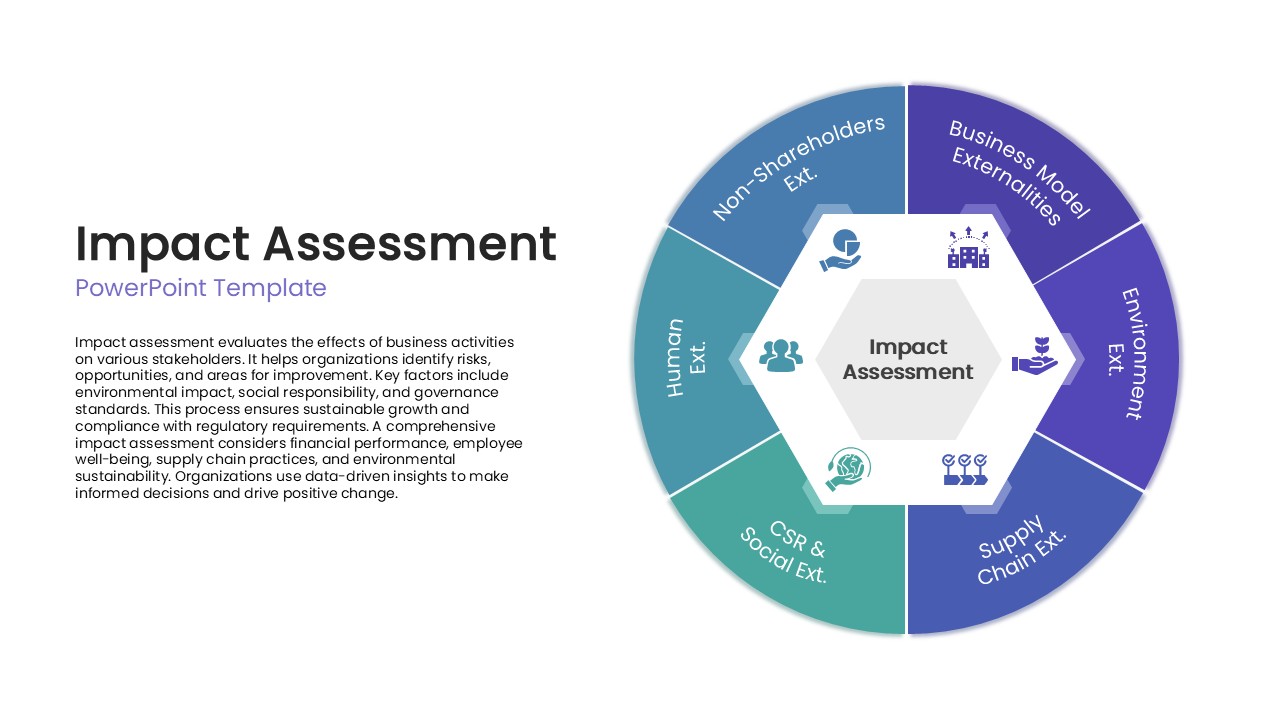
Impact Assessment Circular Diagram Template for PowerPoint & Google Slides
Circular
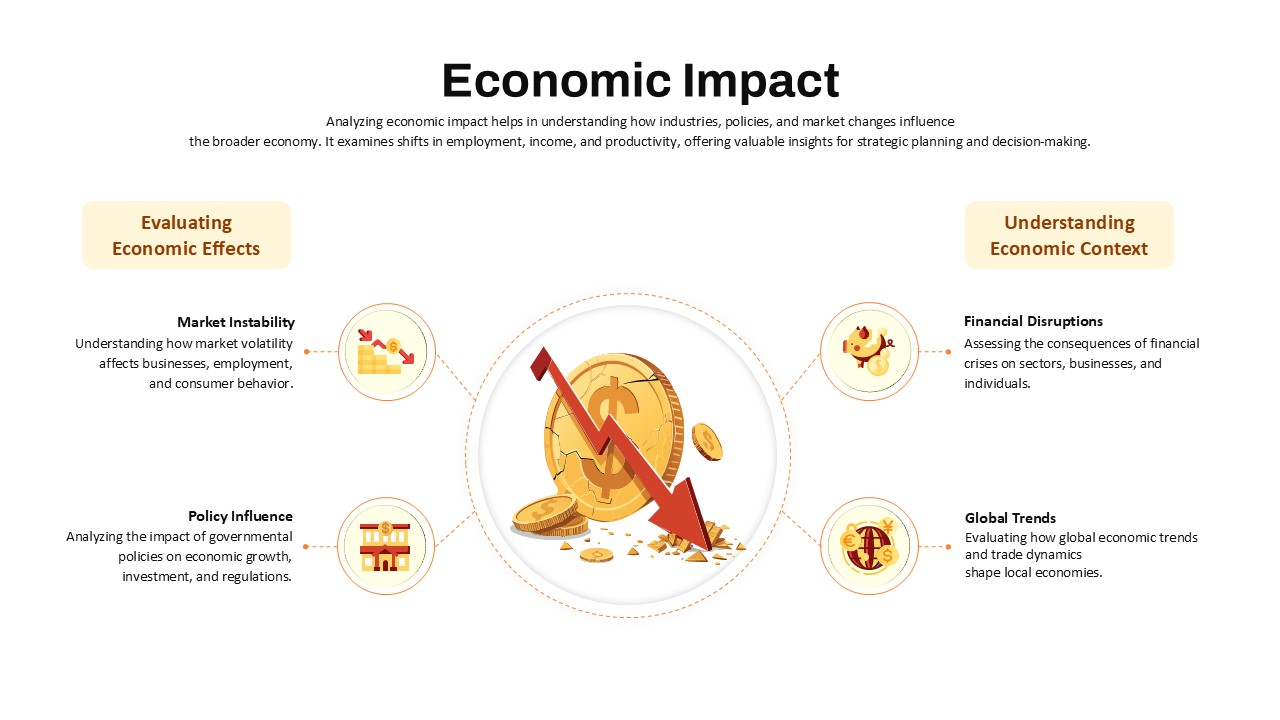
Economic Impact Assessment template for PowerPoint & Google Slides
Business Report
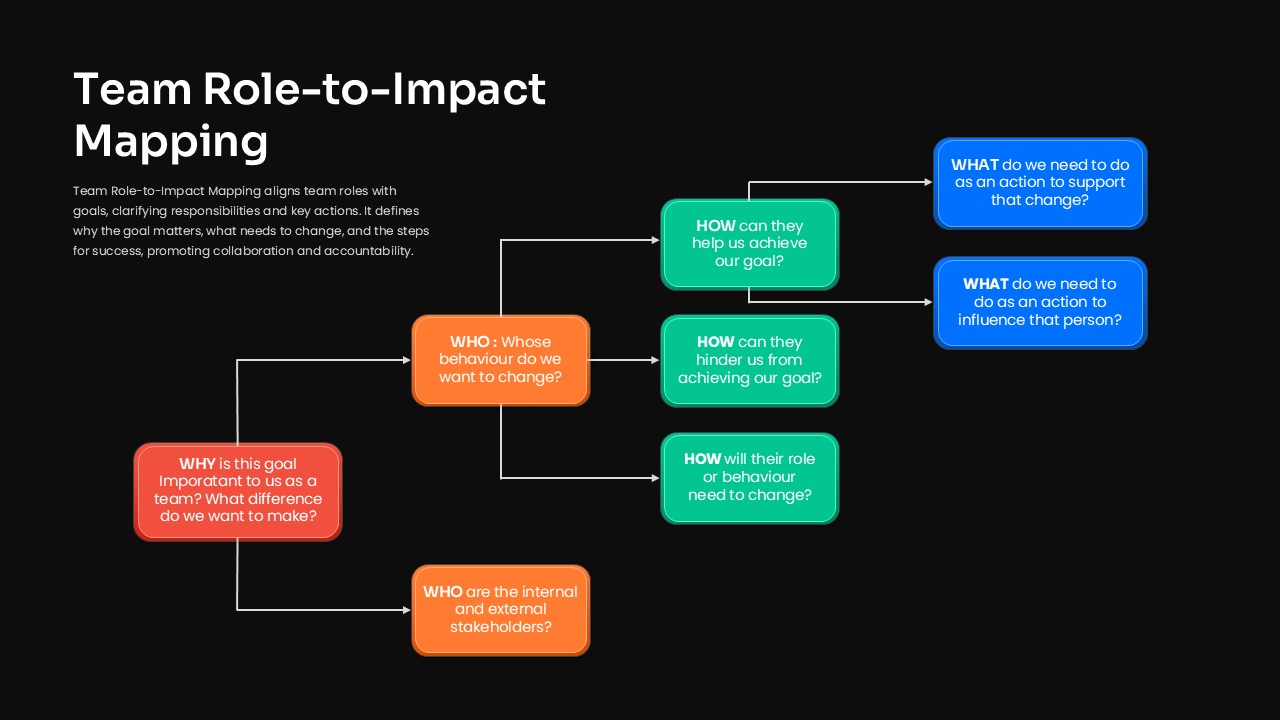
Team Role-to-Impact Mapping Flowchart Template for PowerPoint & Google Slides
Process
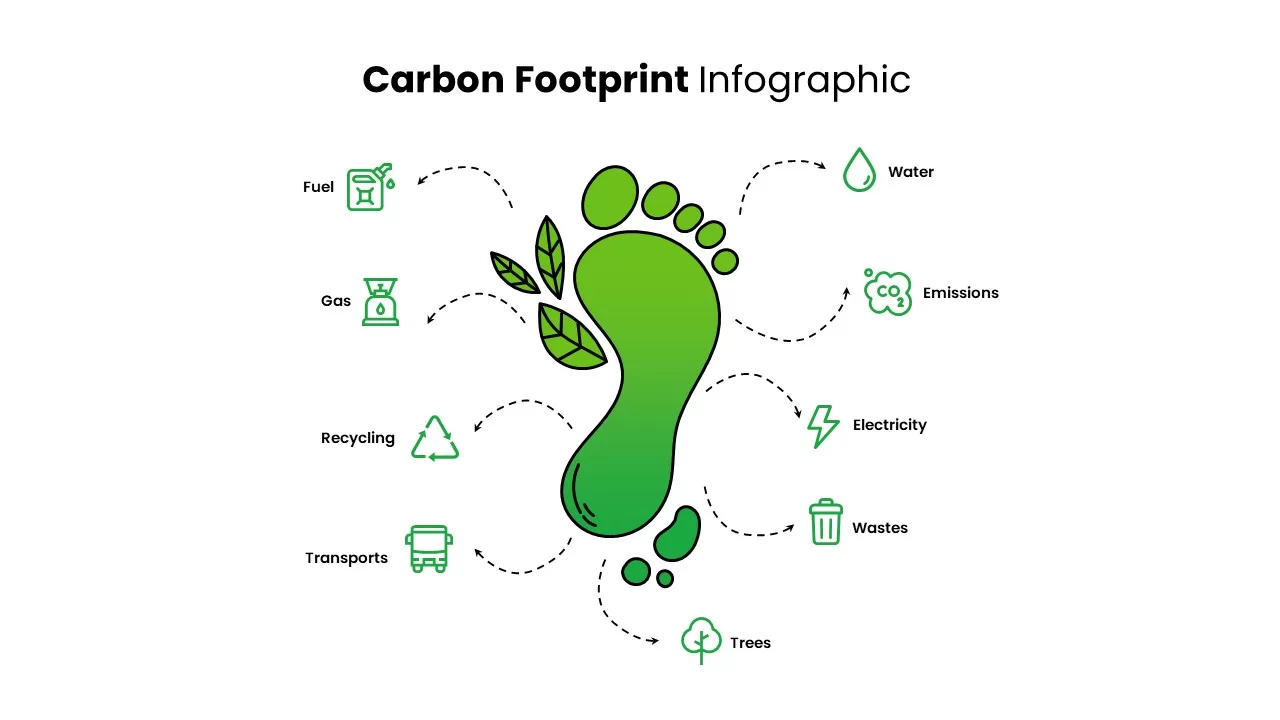
Carbon Footprint Environmental Impact Slide for PowerPoint & Google Slides
Risk Management
Risk Management Mind Map Radial Diagram template for PowerPoint & Google Slides
Mind Maps

Bold Diamond Risk Alert Visualization Template for PowerPoint & Google Slides
Risk Management
Risk Management Presentation Template for PowerPoint and Google Slides
Decks
Marketing Risk Management Gear Diagram Template for PowerPoint & Google Slides
Risk Management
Risk Management Heat Map Diagram Template for PowerPoint & Google Slides
Comparison Chart
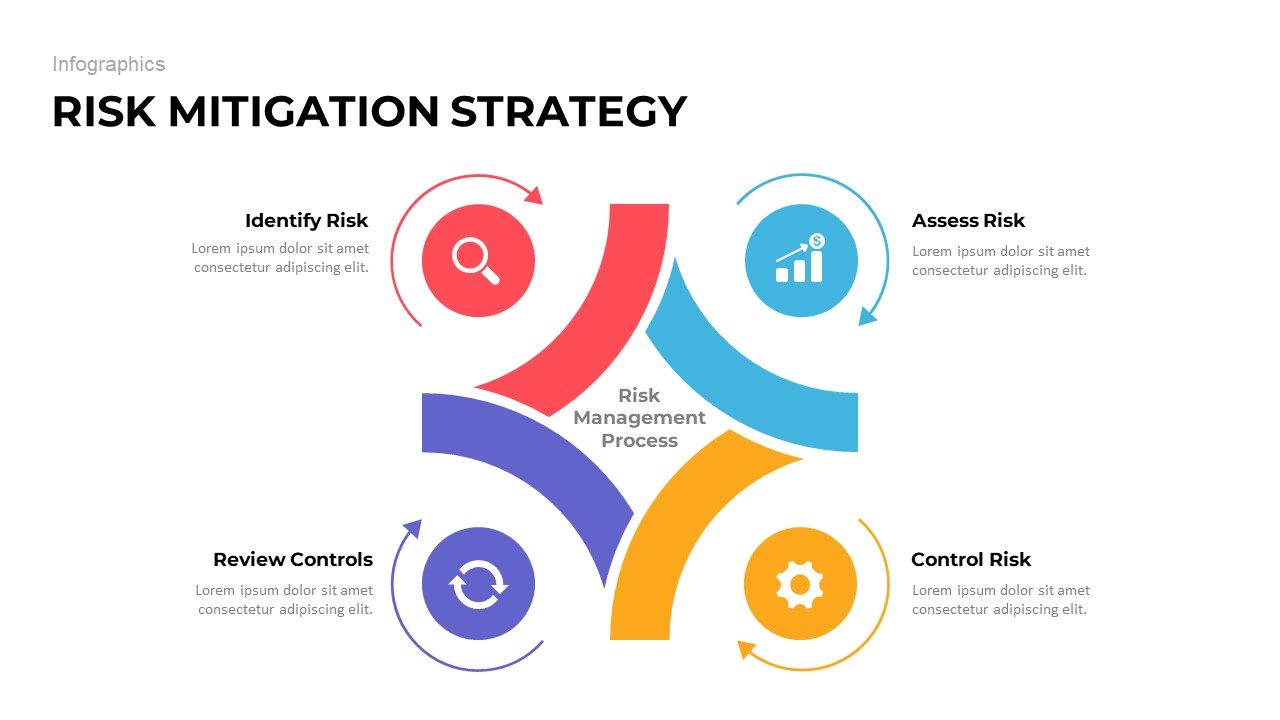
Risk Mitigation Strategy template for PowerPoint & Google Slides
Risk Management
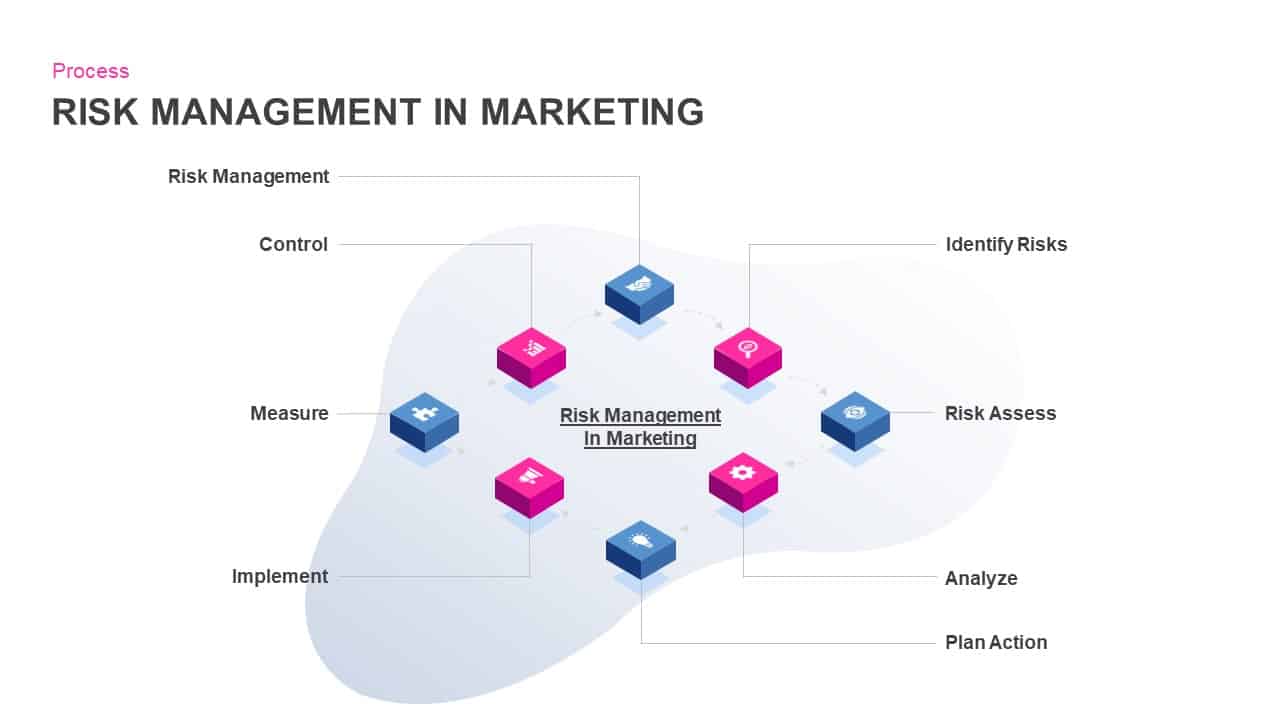
Risk Management in Marketing Process Template for PowerPoint & Google Slides
Risk Management
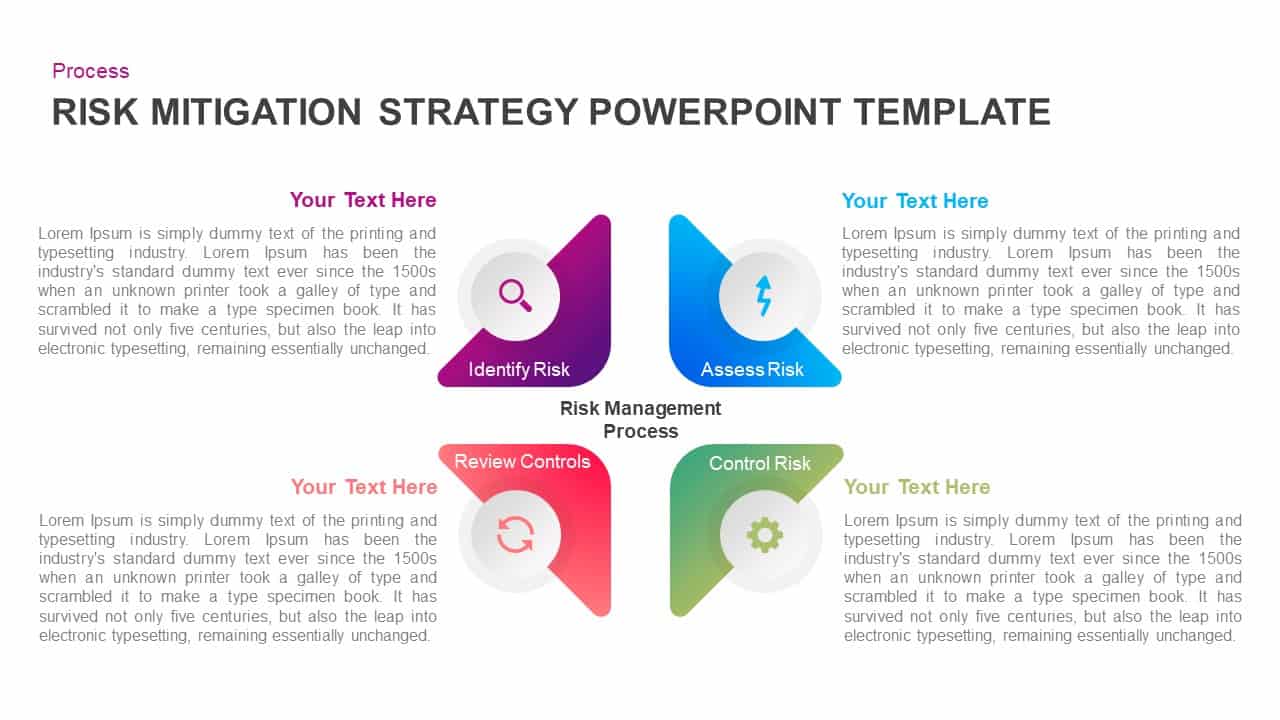
Four-Step Risk Mitigation Strategy Template for PowerPoint & Google Slides
Process
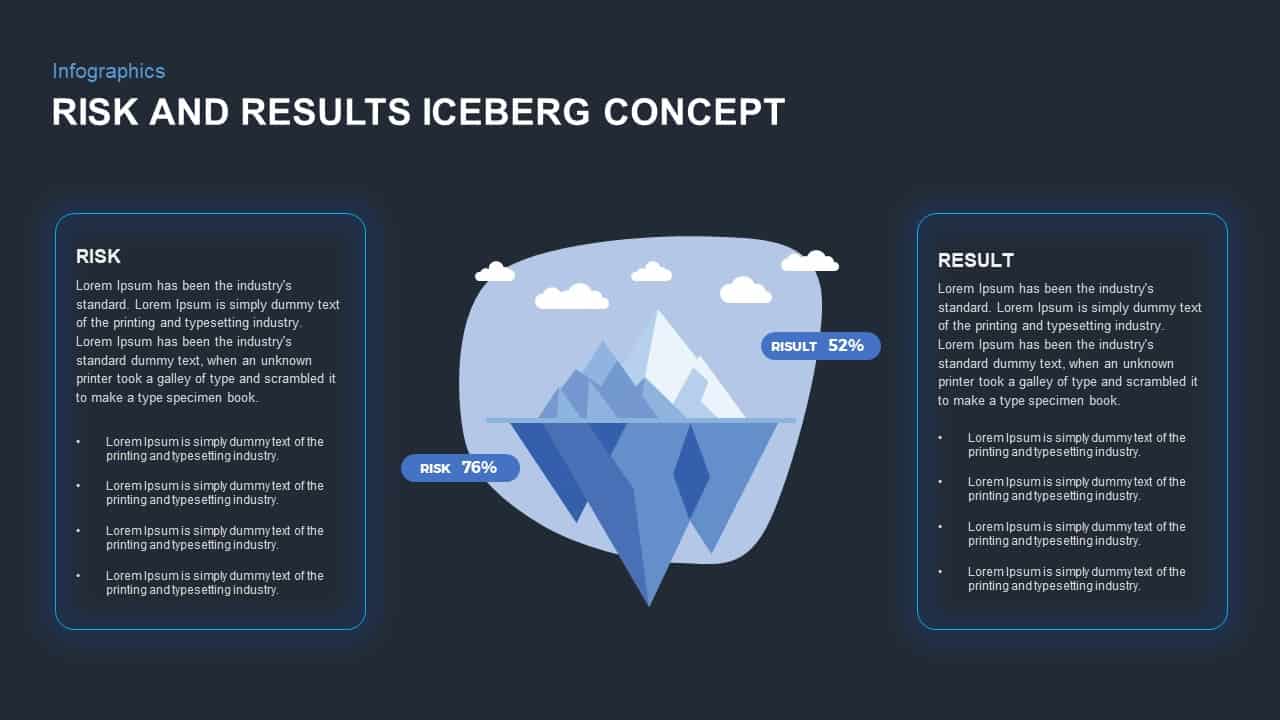
Risk and Results Iceberg Infographic Template for PowerPoint & Google Slides
Comparison

Enterprise Risk Management Cycle Diagram Template for PowerPoint & Google Slides
Process
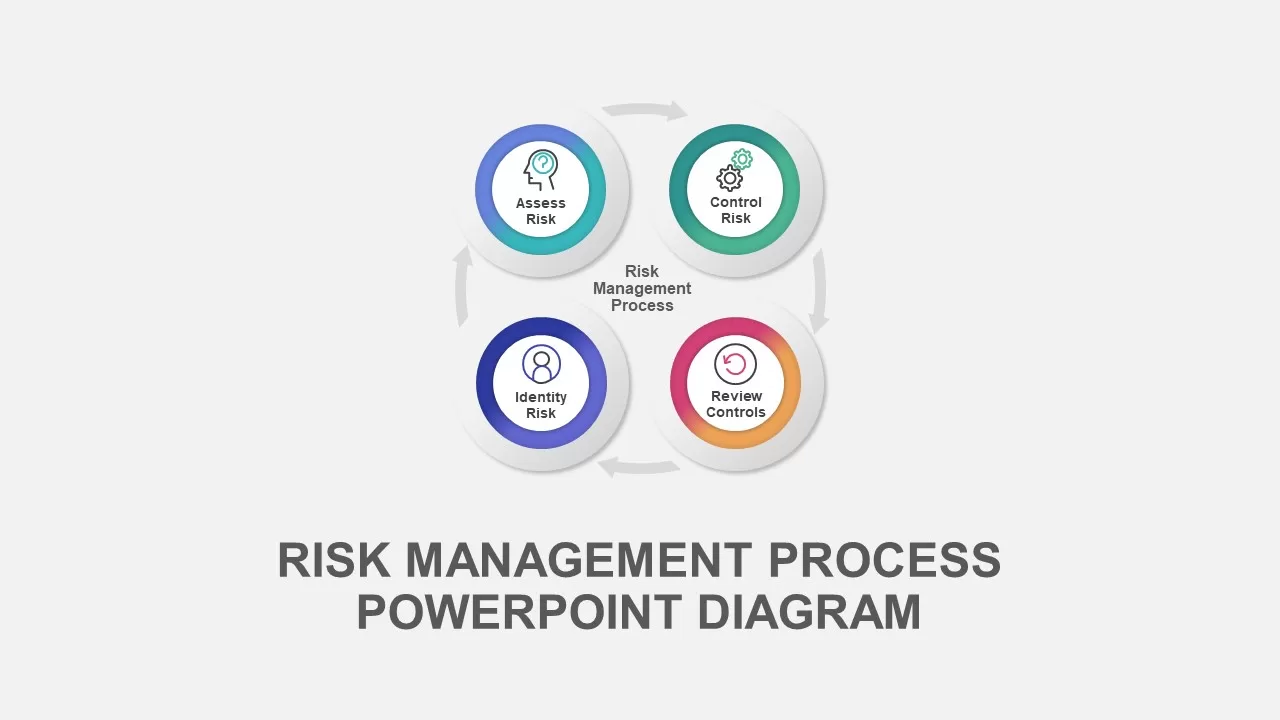
Risk Management Process Diagram Template for PowerPoint & Google Slides
Risk Management
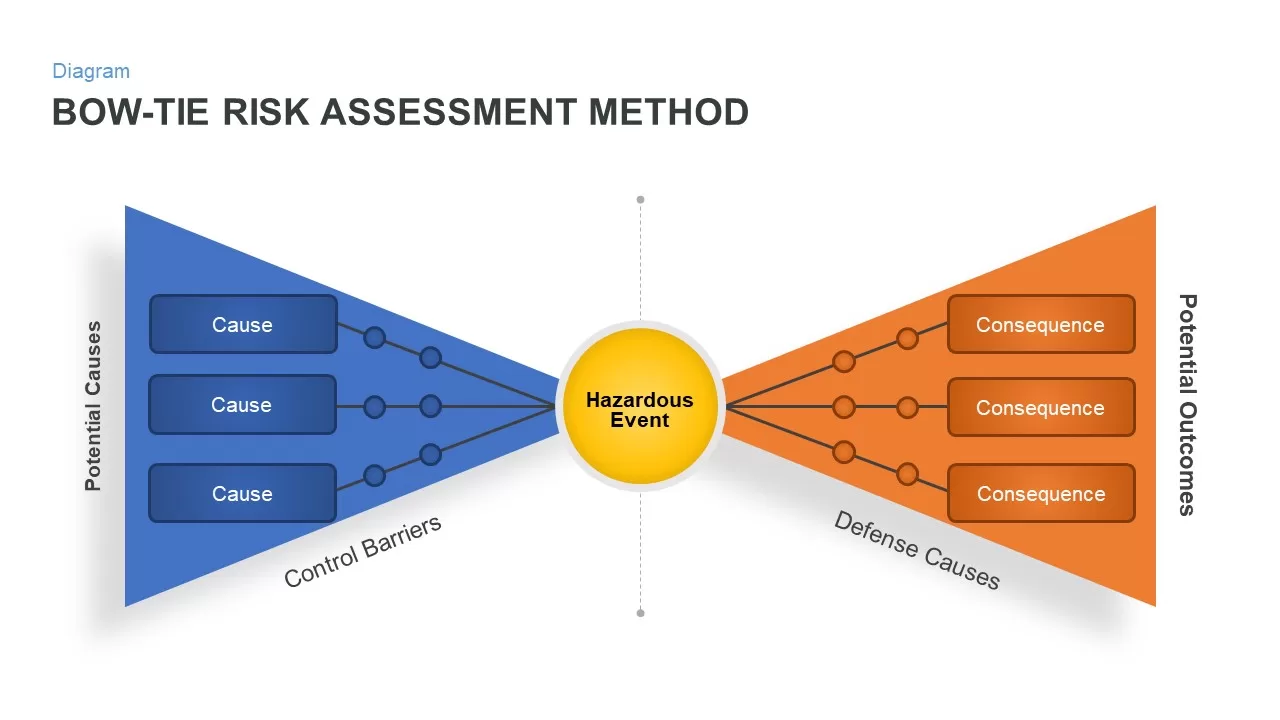
Bow-Tie Risk Assessment Diagram Template for PowerPoint & Google Slides
Risk Management
Heat Map Risk Assessment Presentation Template for PowerPoint & Google Slides
Risk Management
Professional Risk Heat Map Visualization Template for PowerPoint & Google Slides
Risk Management
Risk Heatmap Comparison Template for PowerPoint & Google Slides
Maps
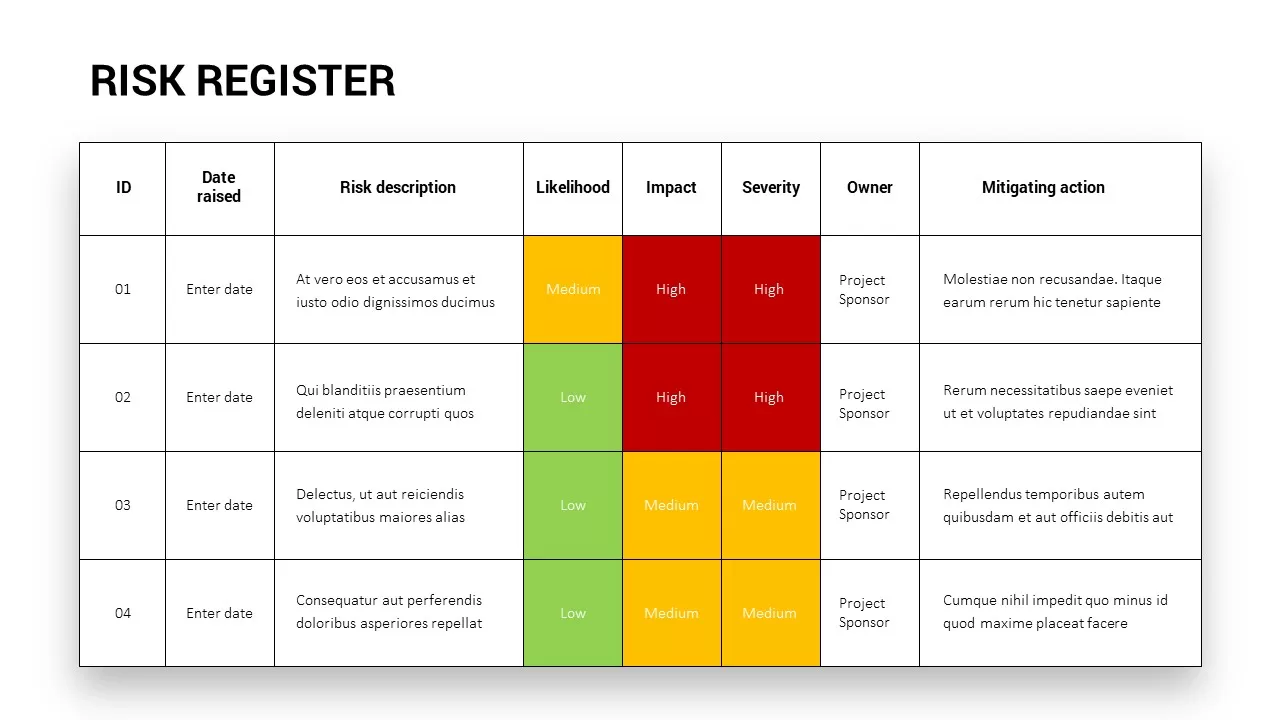
Comprehensive Risk Register Table Template for PowerPoint & Google Slides
Risk Management
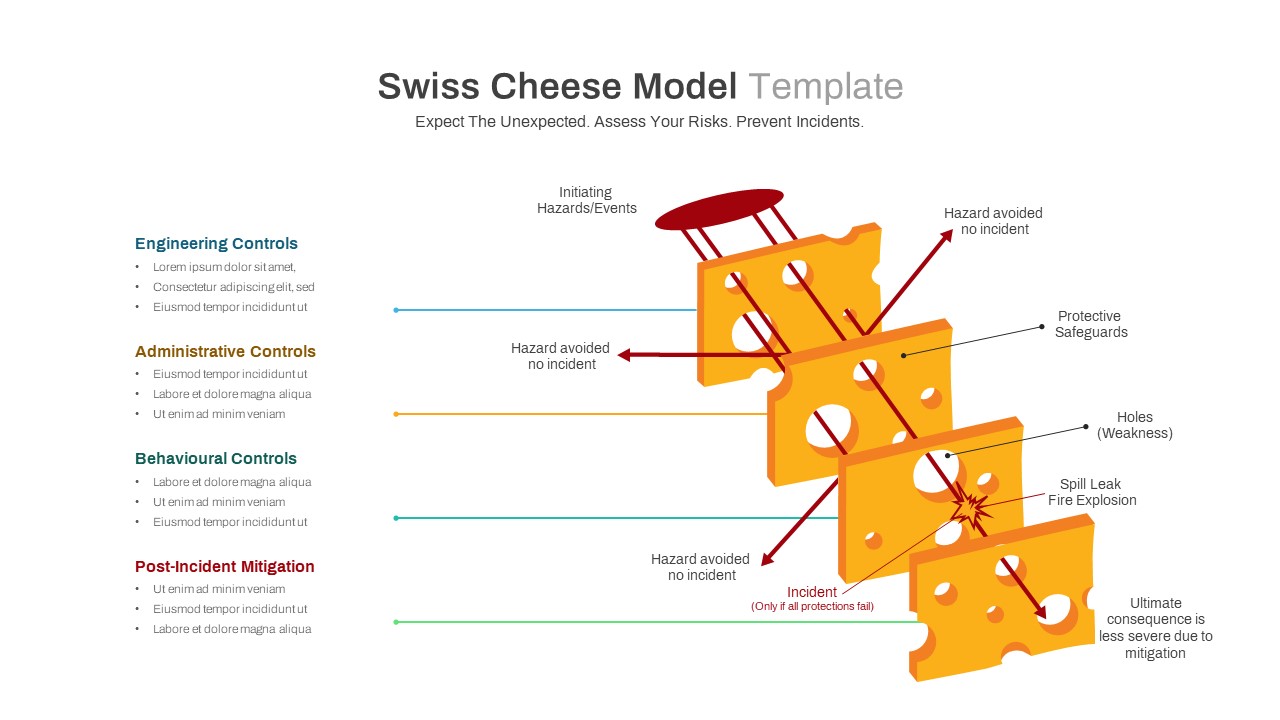
Swiss Cheese Risk Management Model Template for PowerPoint & Google Slides
Risk Management
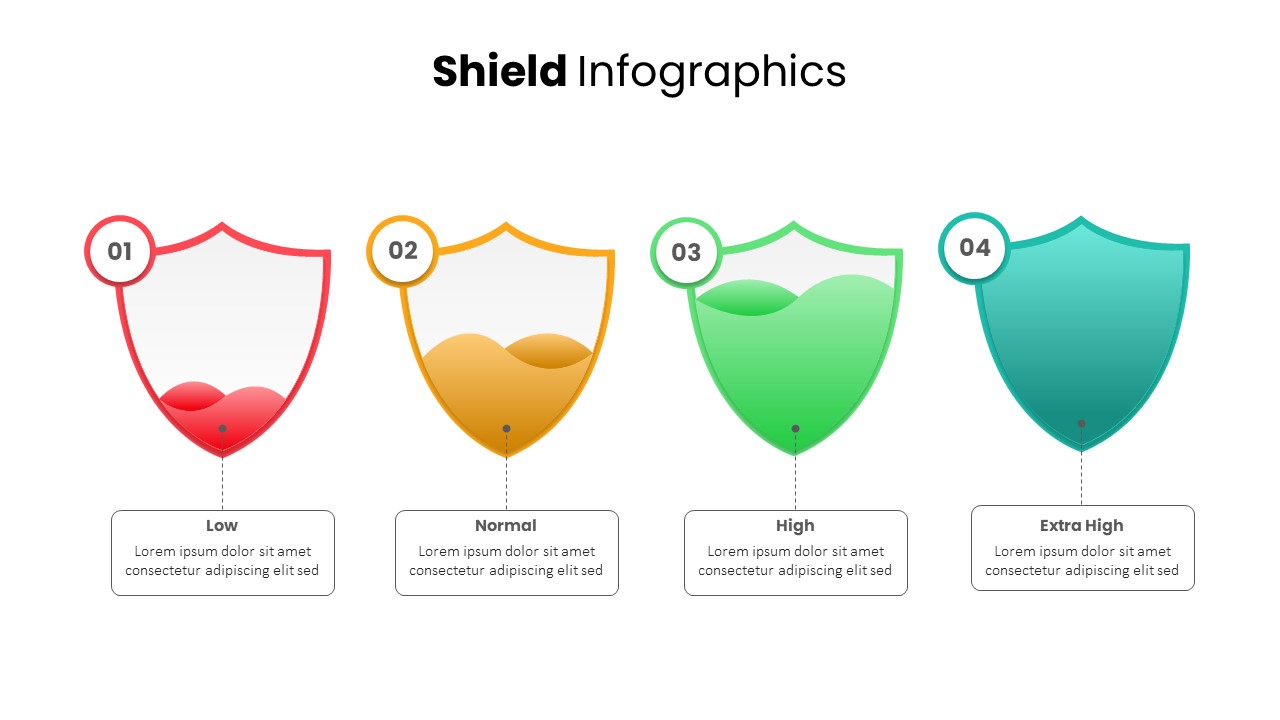
Shield Infographics Risk Indicators Template for PowerPoint & Google Slides
Infographics
Risk Pyramid Hierarchy Analysis Template for PowerPoint & Google Slides
Pyramid
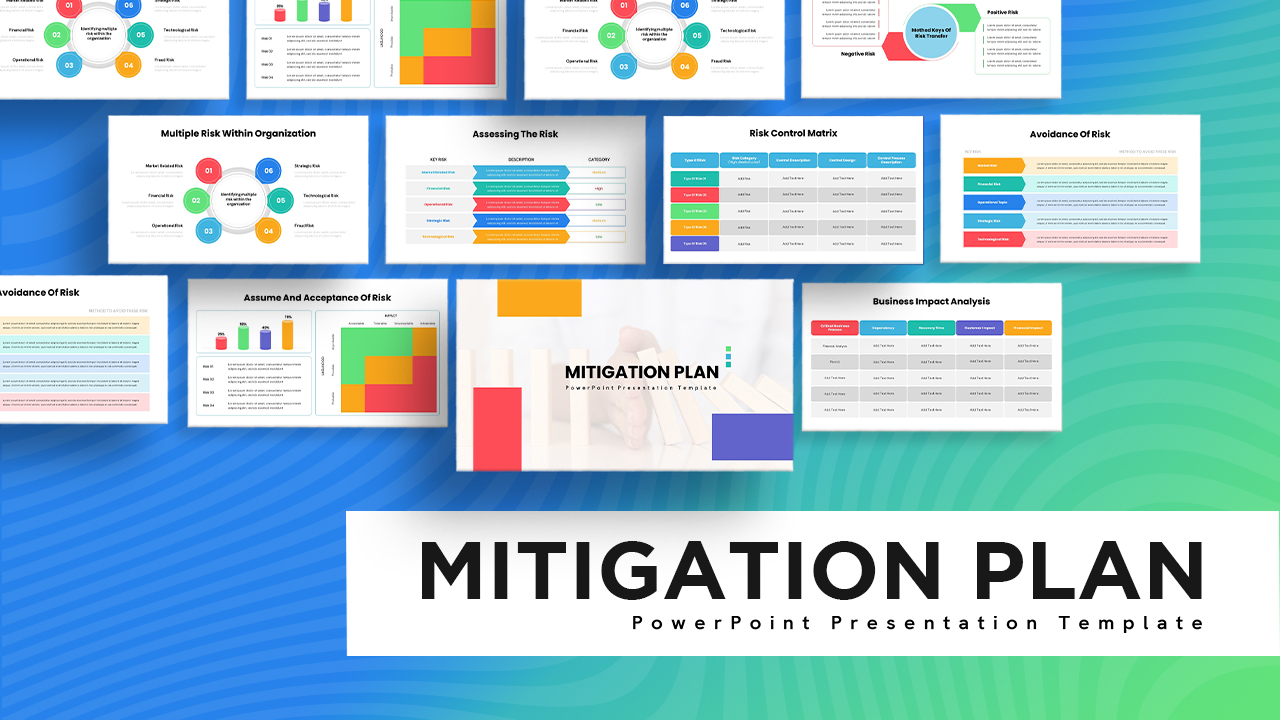
Risk Mitigation Plan Deck Template for PowerPoint & Google Slides
Risk Management
Work Safety Training & Risk Management Template for PowerPoint & Google Slides
Risk Management
Risk Management Consulting Deck Template for PowerPoint & Google Slides
Risk Management
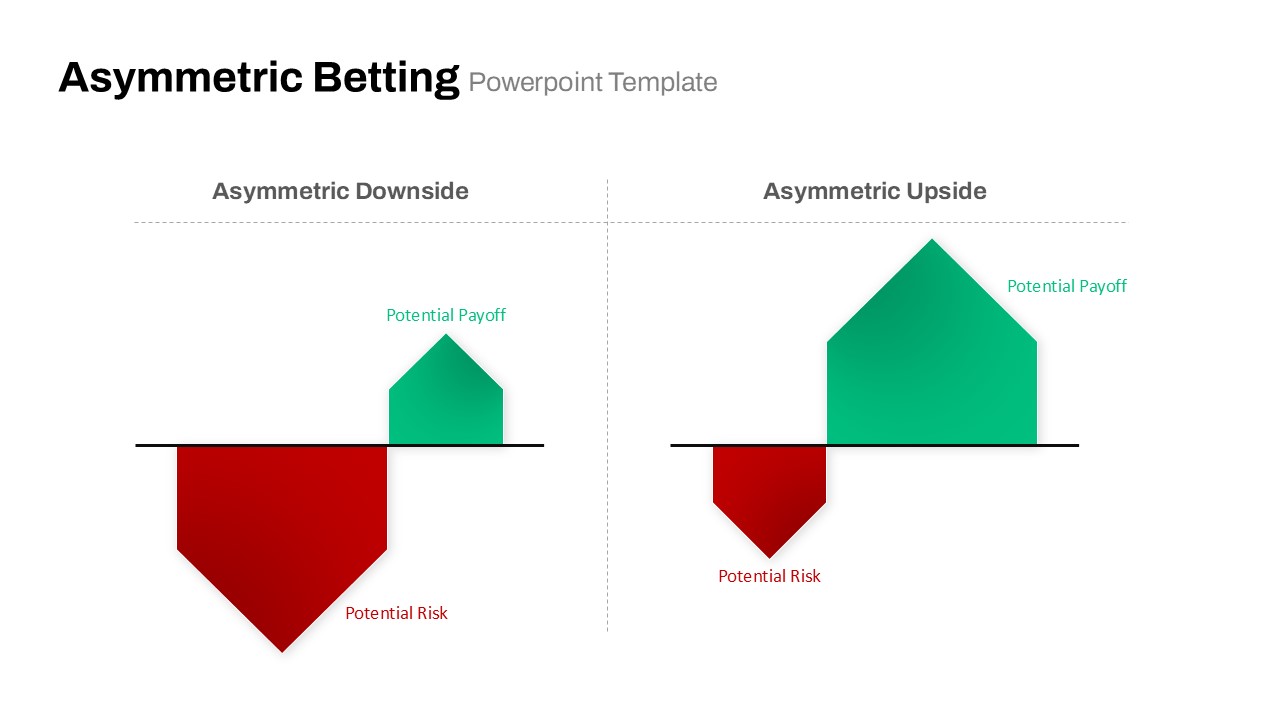
Asymmetric Betting Payoff Risk Diagram Template for PowerPoint & Google Slides
Comparison
Risk Level Gauge Comparison Dashboard Template for PowerPoint & Google Slides
Comparison
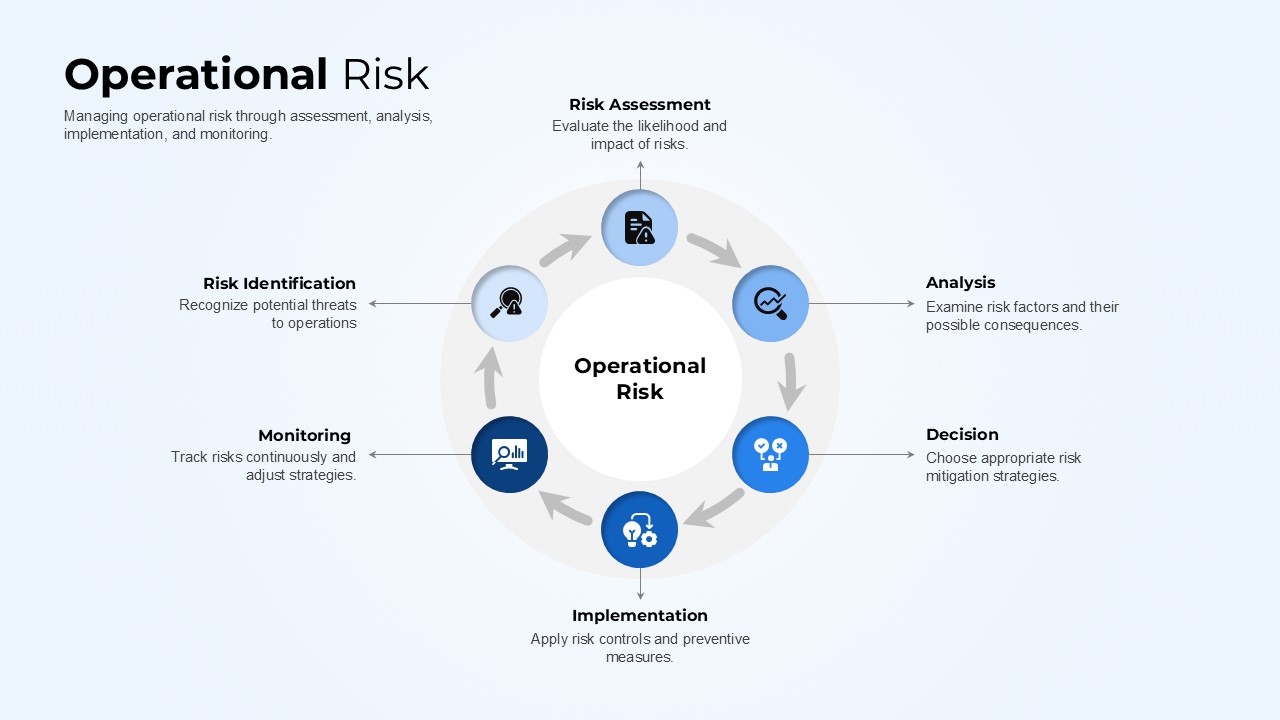
Operational Risk Template for PowerPoint & Google Slides
Risk Management
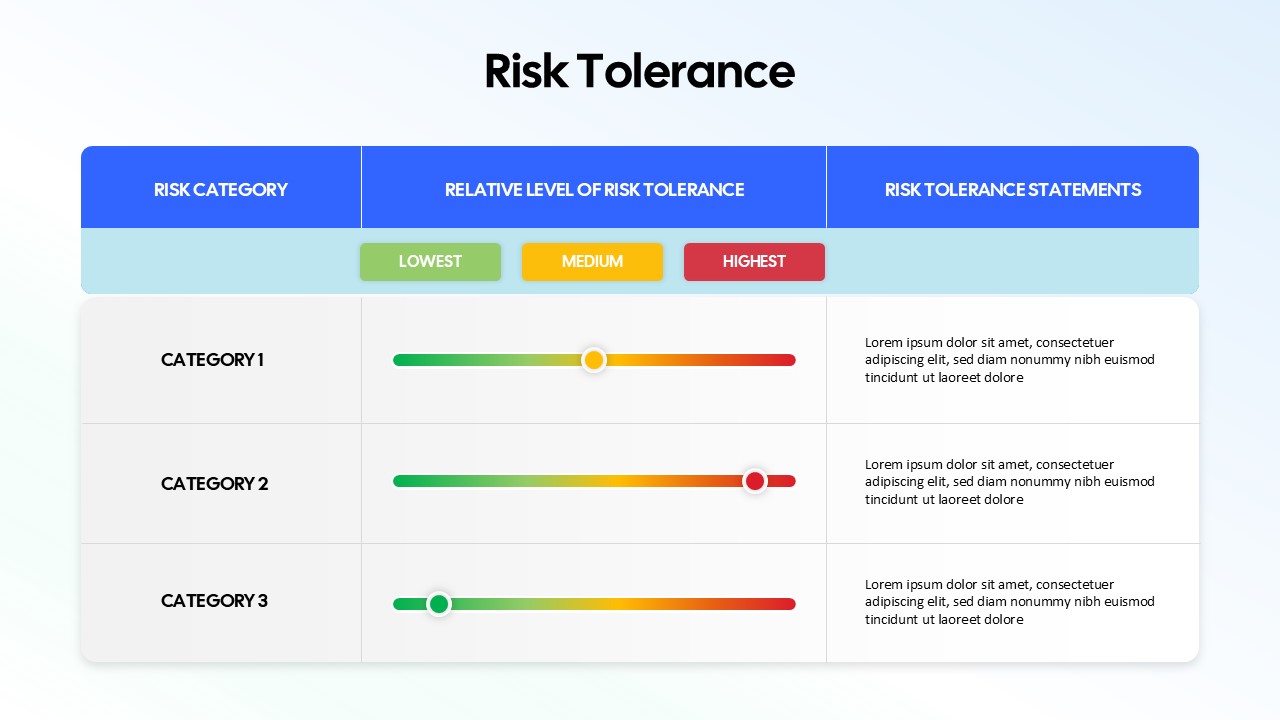
Risk Tolerance Assessment Sliders Template for PowerPoint & Google Slides
Finance
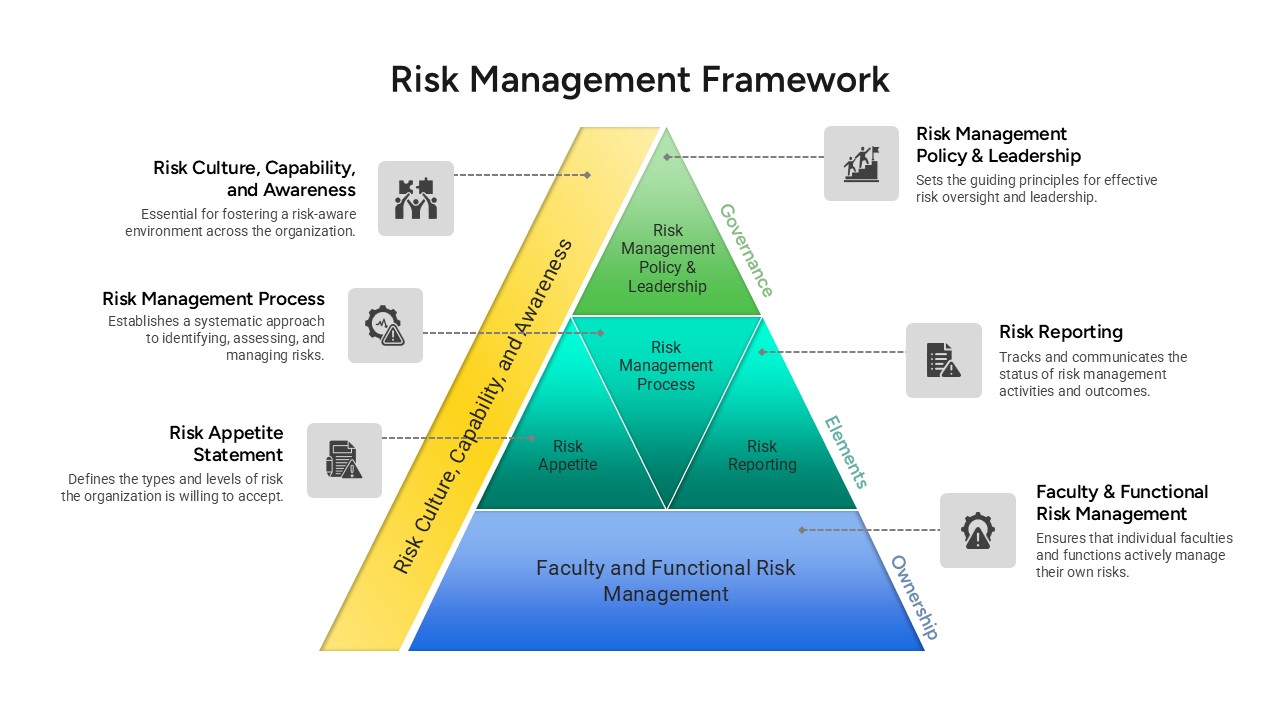
Risk Management Framework Pyramid Template for PowerPoint & Google Slides
Risk Management
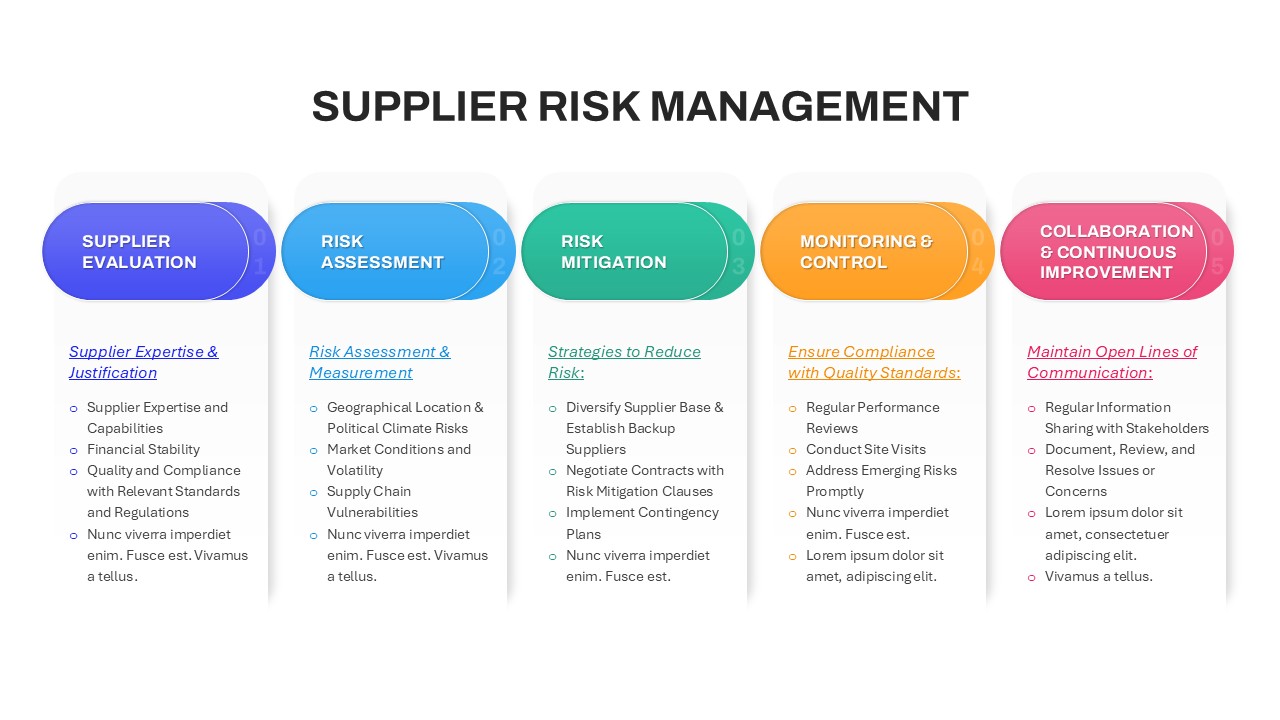
Supplier Risk Management template for PowerPoint & Google Slides
Opportunities Challenges
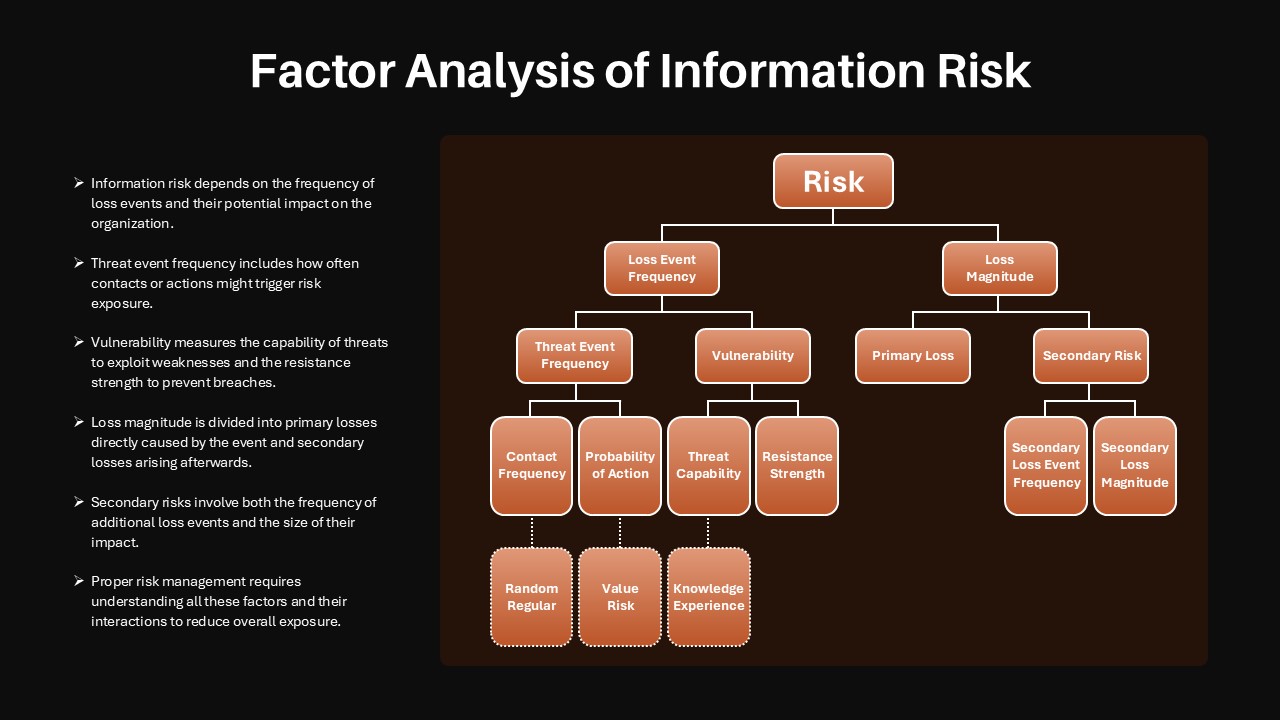
Factor Analysis of Information Risk Template for PowerPoint & Google Slides
Risk Management
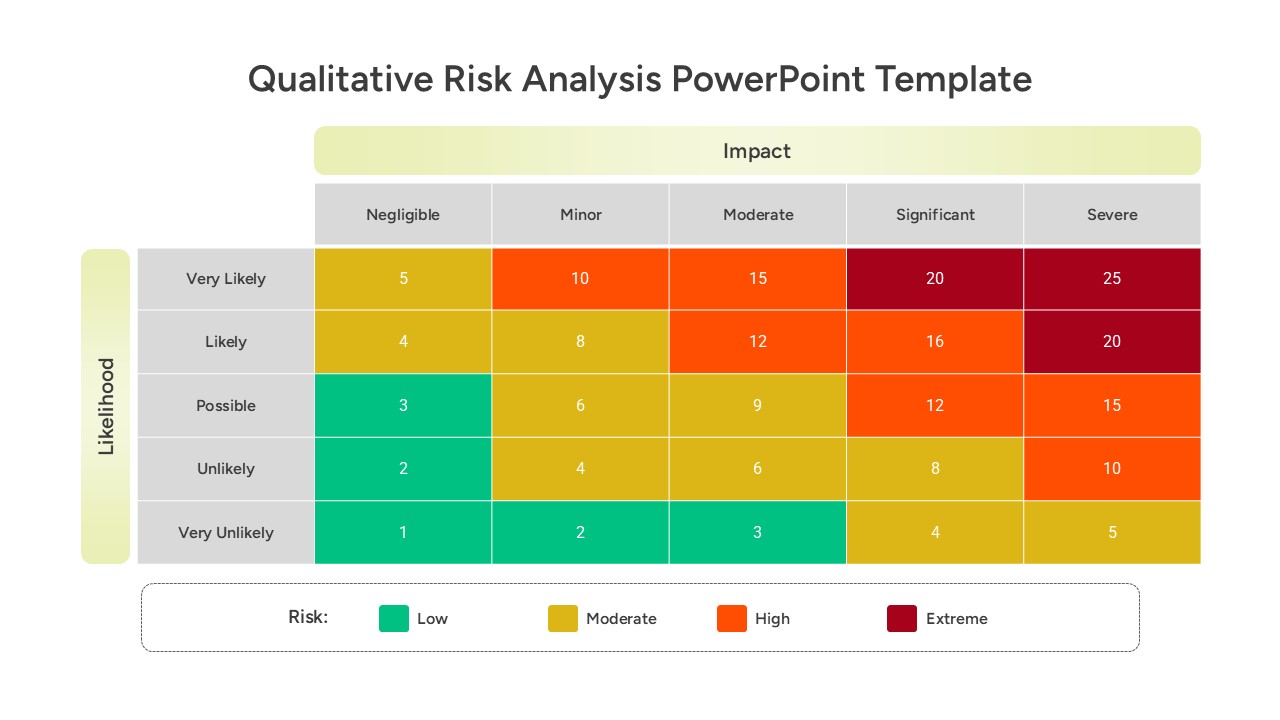
Qualitative Risk Analysis template for PowerPoint & Google Slides
Business
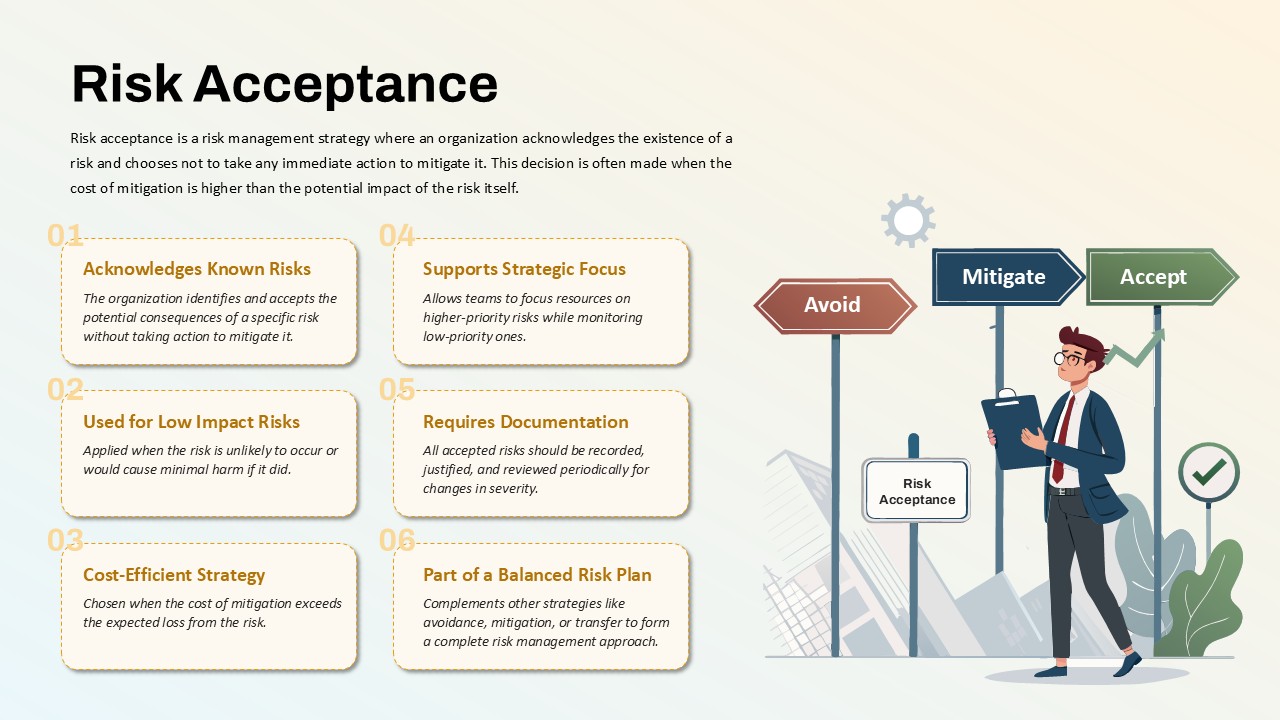
Risk Acceptance Workflow Template for PowerPoint & Google Slides
Risk Management
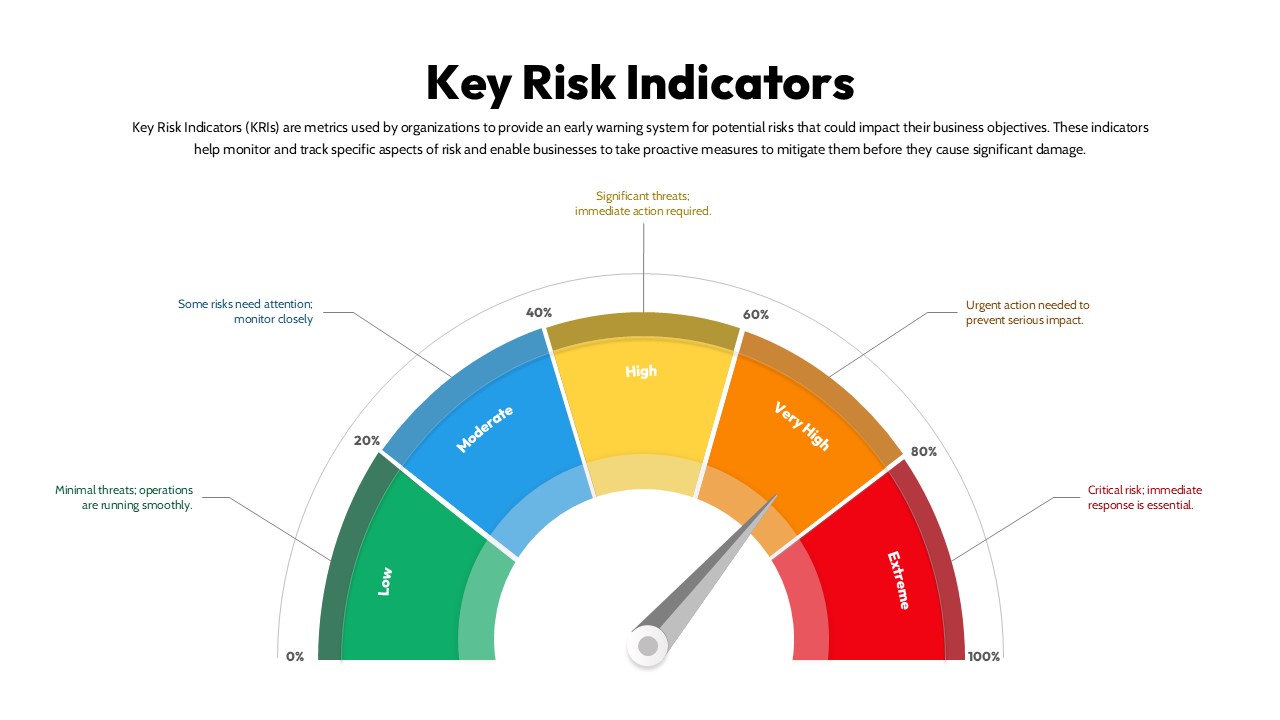
Key Risk Indicators (KRI) Gauge Template for PowerPoint & Google Slides
Risk Management
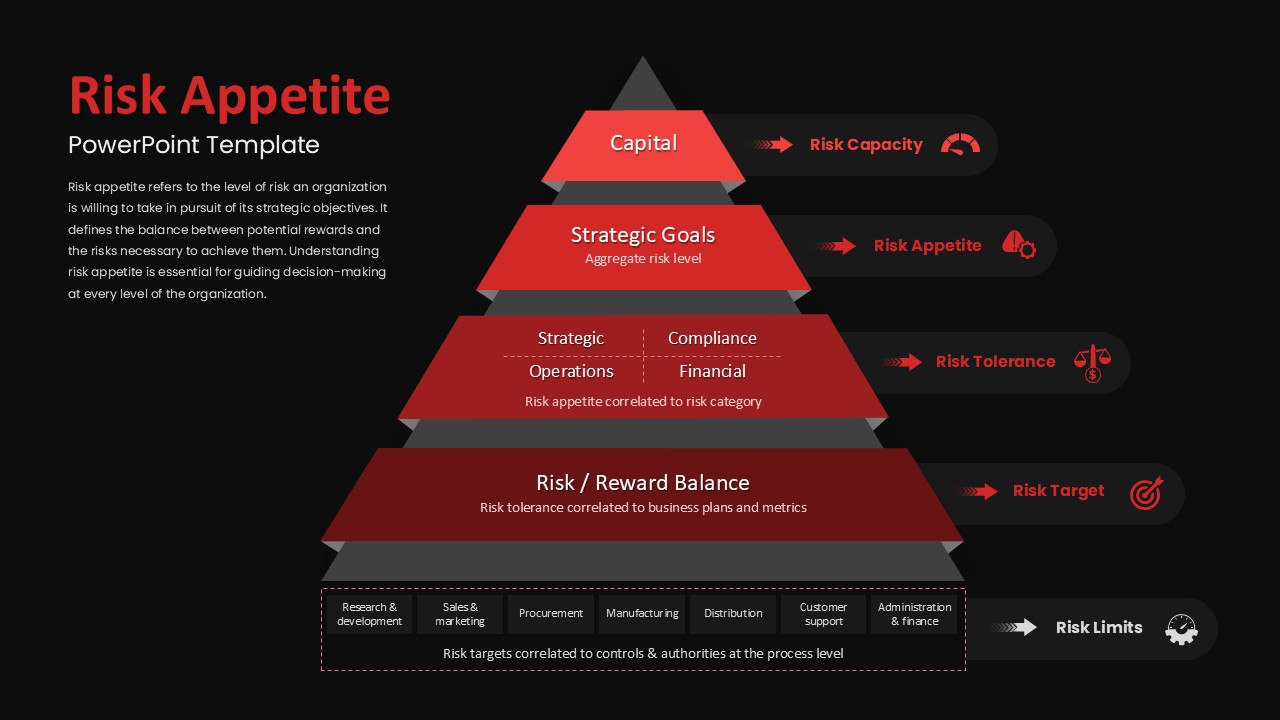
Risk Appetite Pyramid Framework Template for PowerPoint & Google Slides
Pyramid
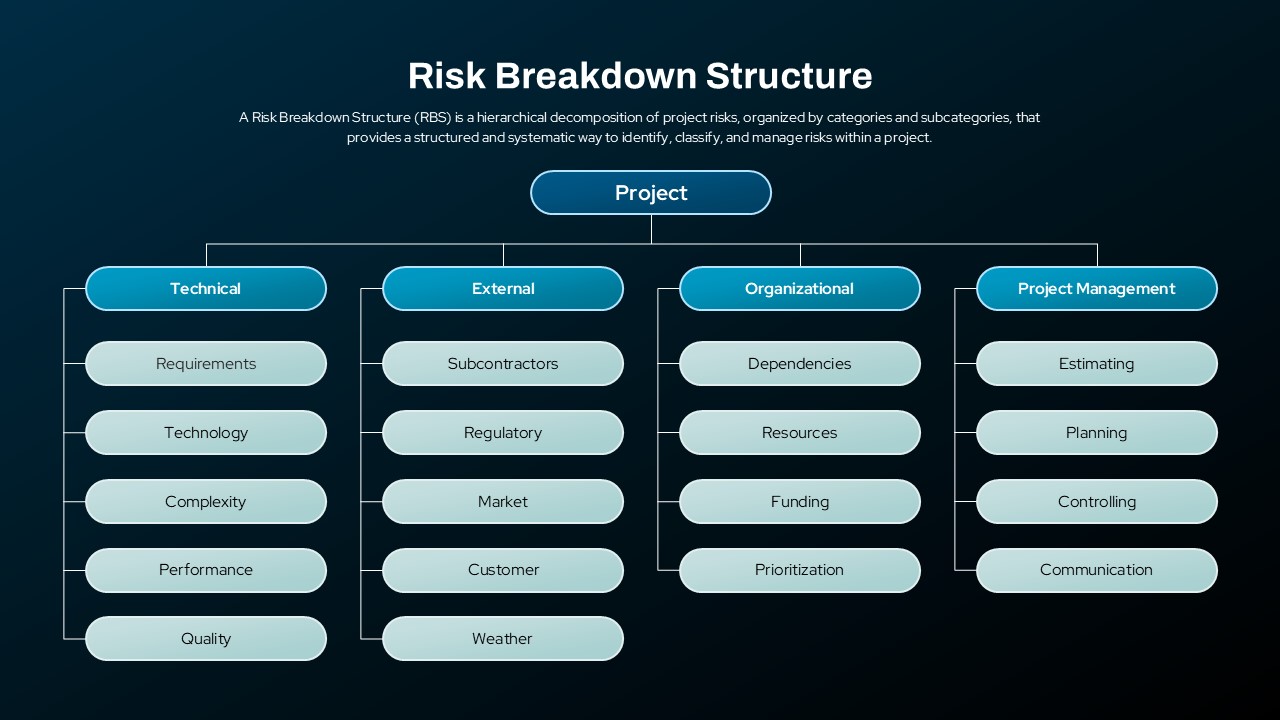
Risk Breakdown Structure Diagram Template for PowerPoint & Google Slides
Org Chart
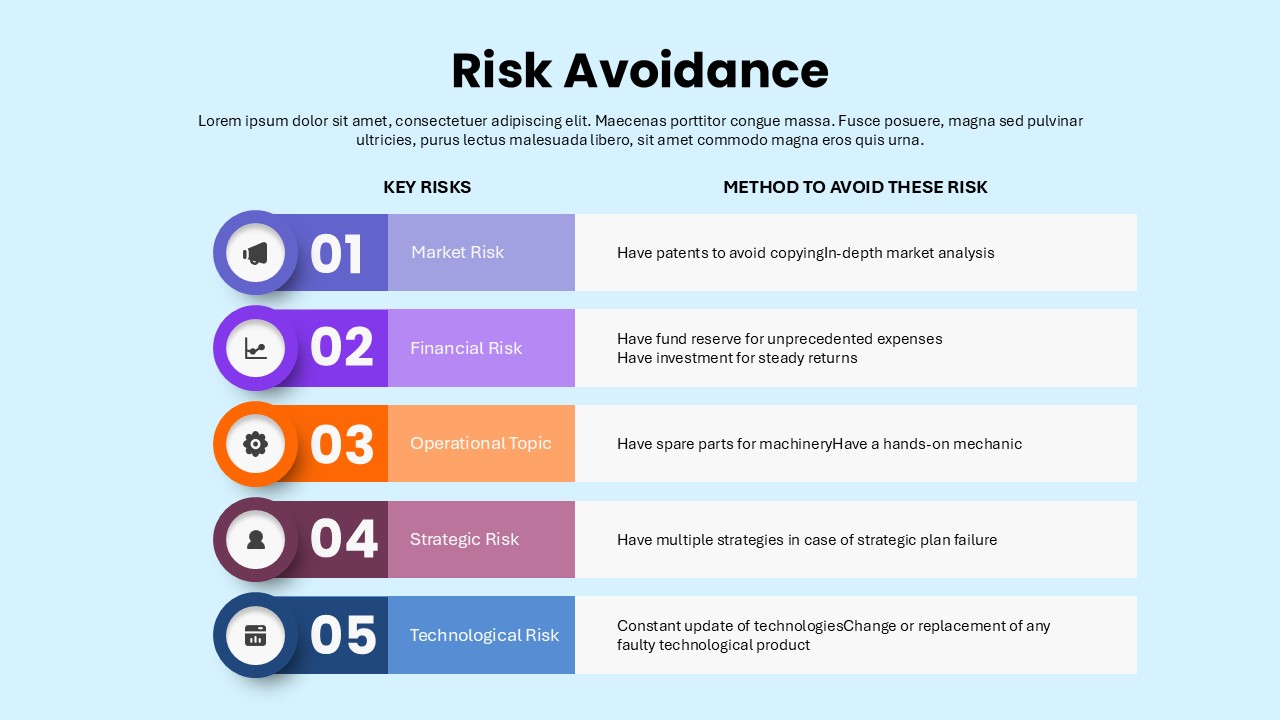
Risk Avoidance: Five Risks & Mitigation Template for PowerPoint & Google Slides
Risk Management
Risk vs Reward Comparison Template for PowerPoint & Google Slides
Opportunities Challenges
Governance, Risk & Compliance Overview Diagrams for PowerPoint & Google Slides
Risk Management
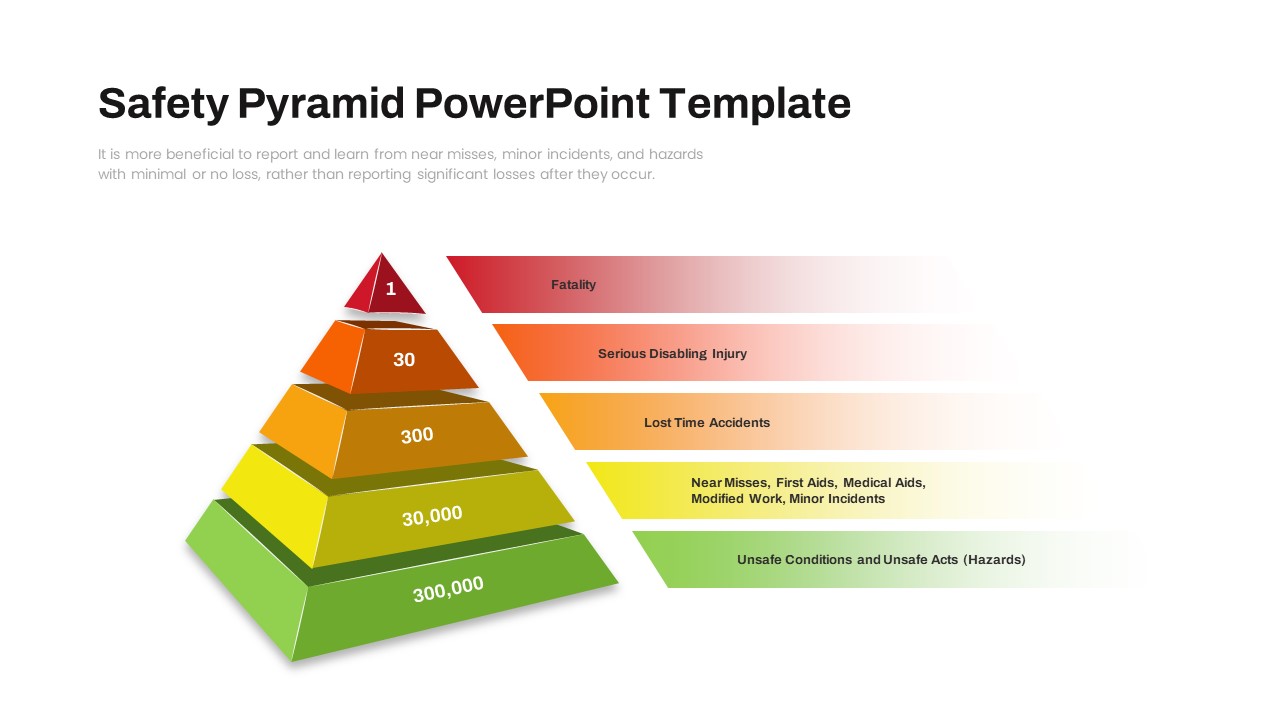
Safety Incident Pyramid Risk Hierarchy Slide for PowerPoint & Google Slides
Risk Management
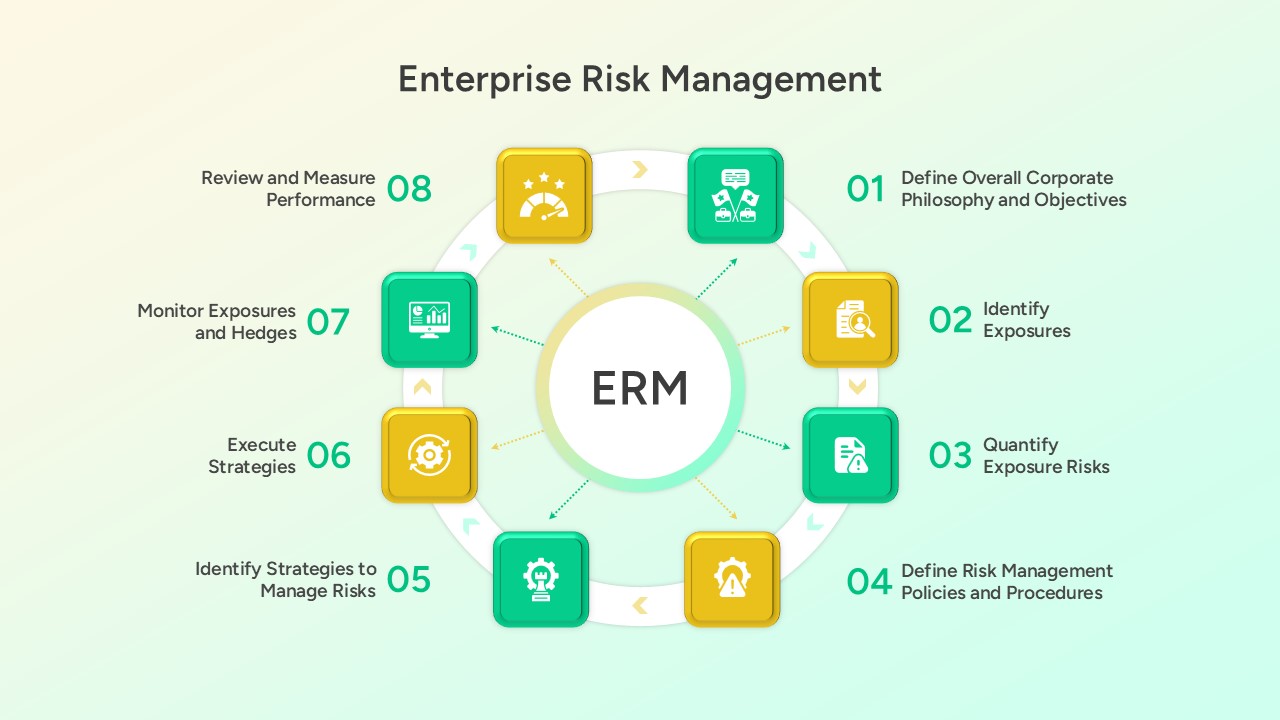
Enterprise Risk Management (ERM) Framework for PowerPoint & Google Slides
Business Plan
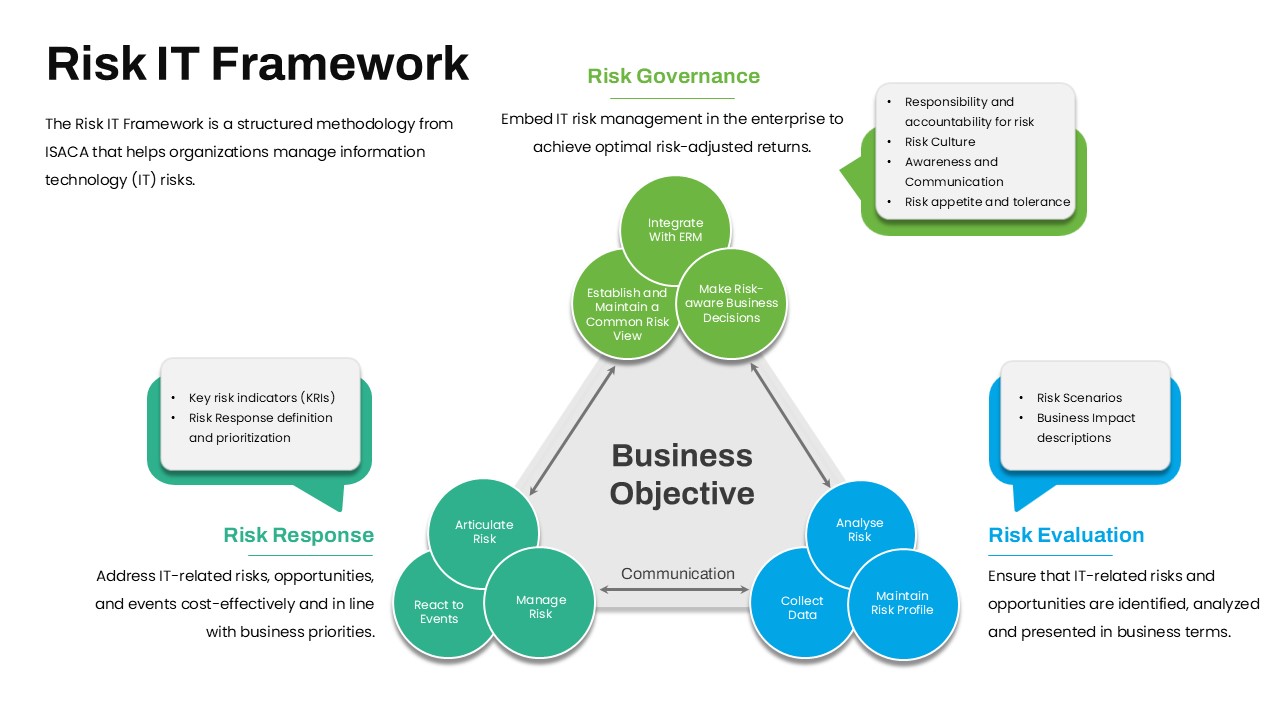
Risk IT Framework Overview for PowerPoint & Google Slides
Business Strategy
Innovation Ambition Matrix & Funnel Strategy Slides for PowerPoint & Google Slides
Process
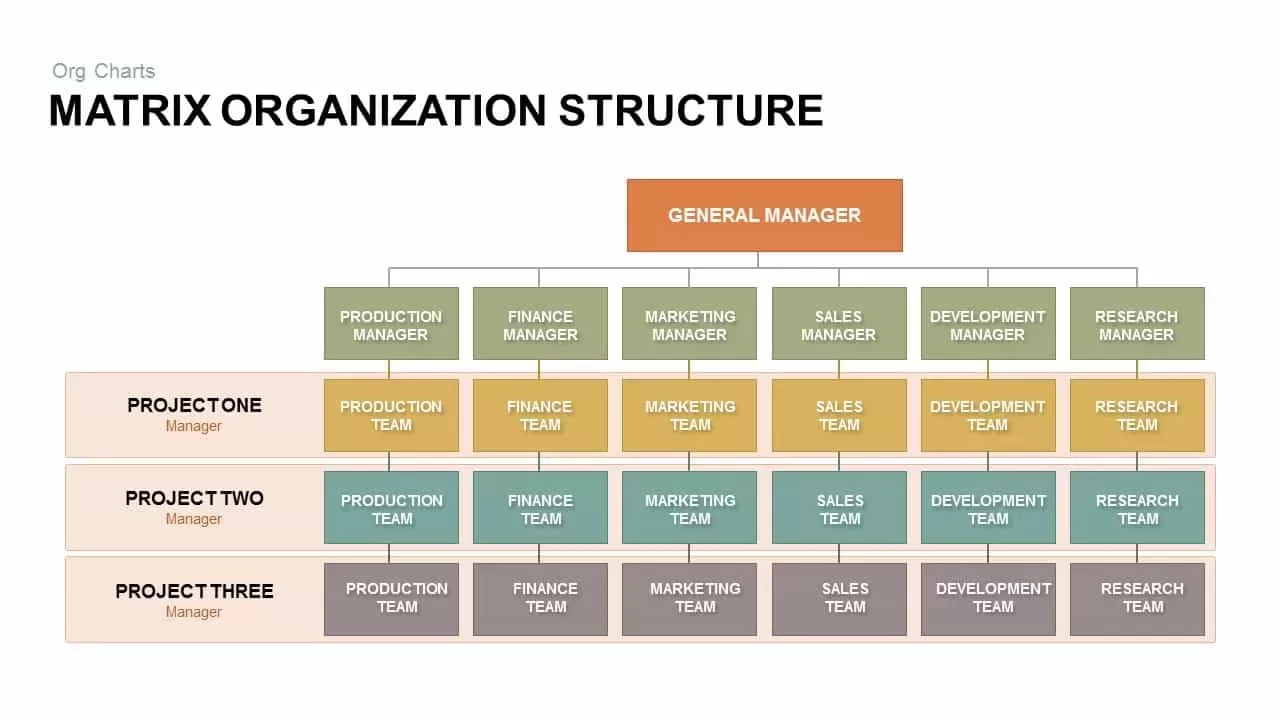
Matrix Organization Structure template for PowerPoint & Google Slides
Org Chart
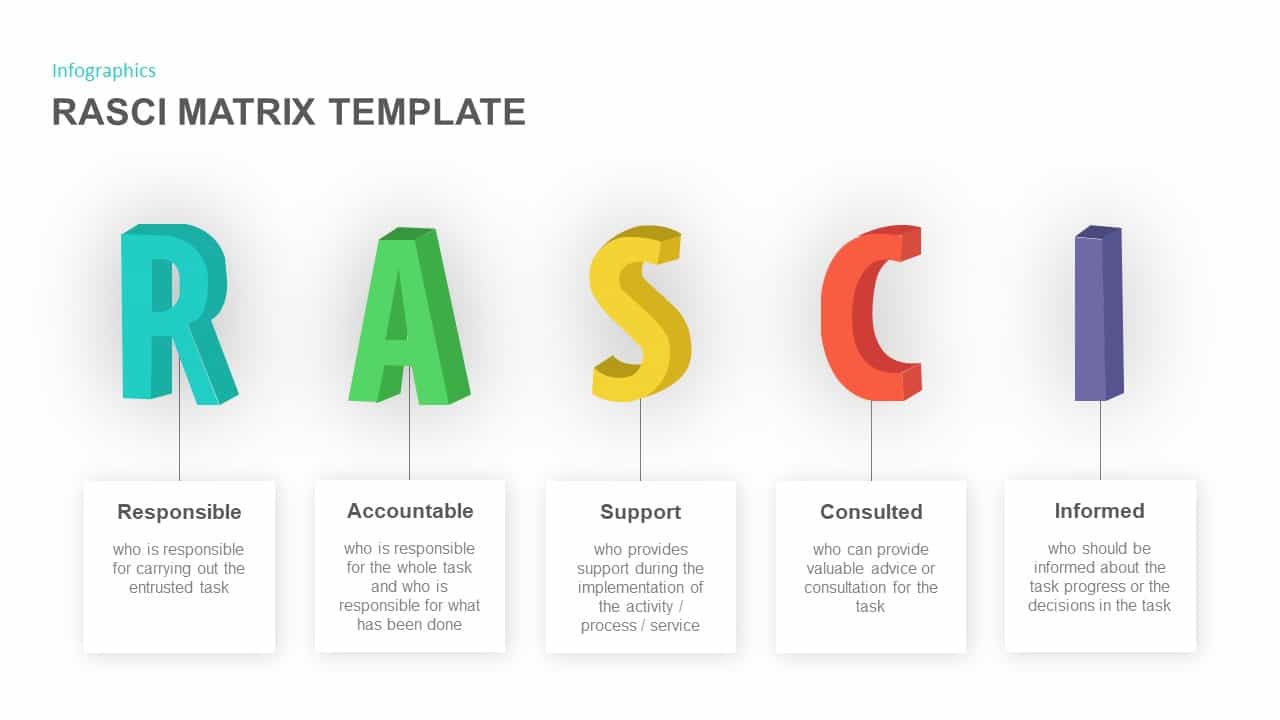
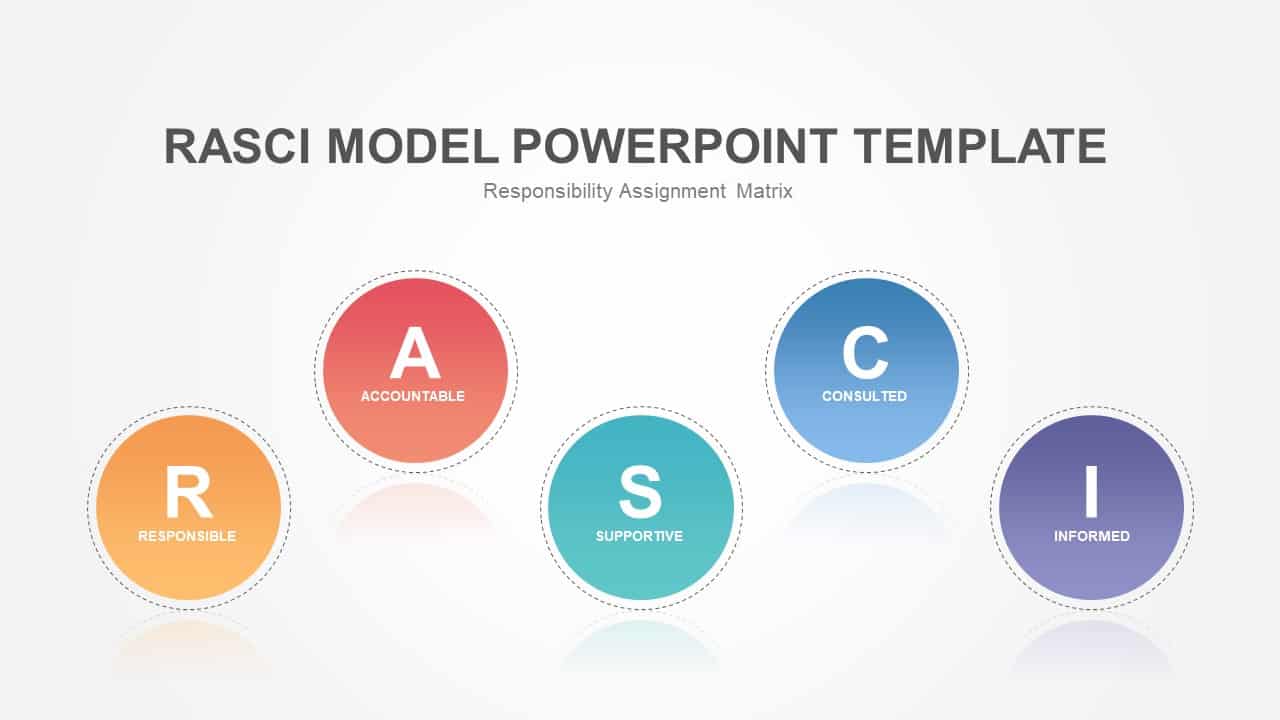
RASCI Assignment Matrix Infographic Template for PowerPoint & Google Slides
Infographics
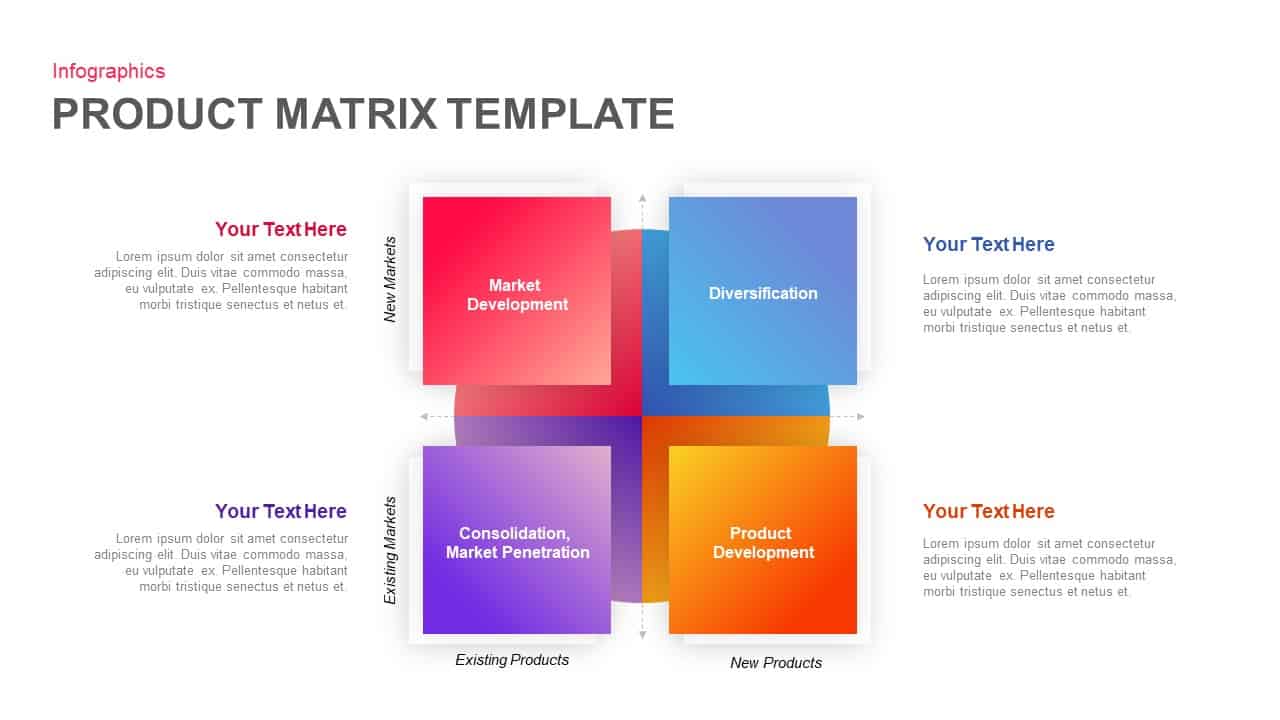
Product Market Expansion Matrix Template for PowerPoint & Google Slides
Business
RASCI Responsibility Matrix Chart Template for PowerPoint & Google Slides
Business
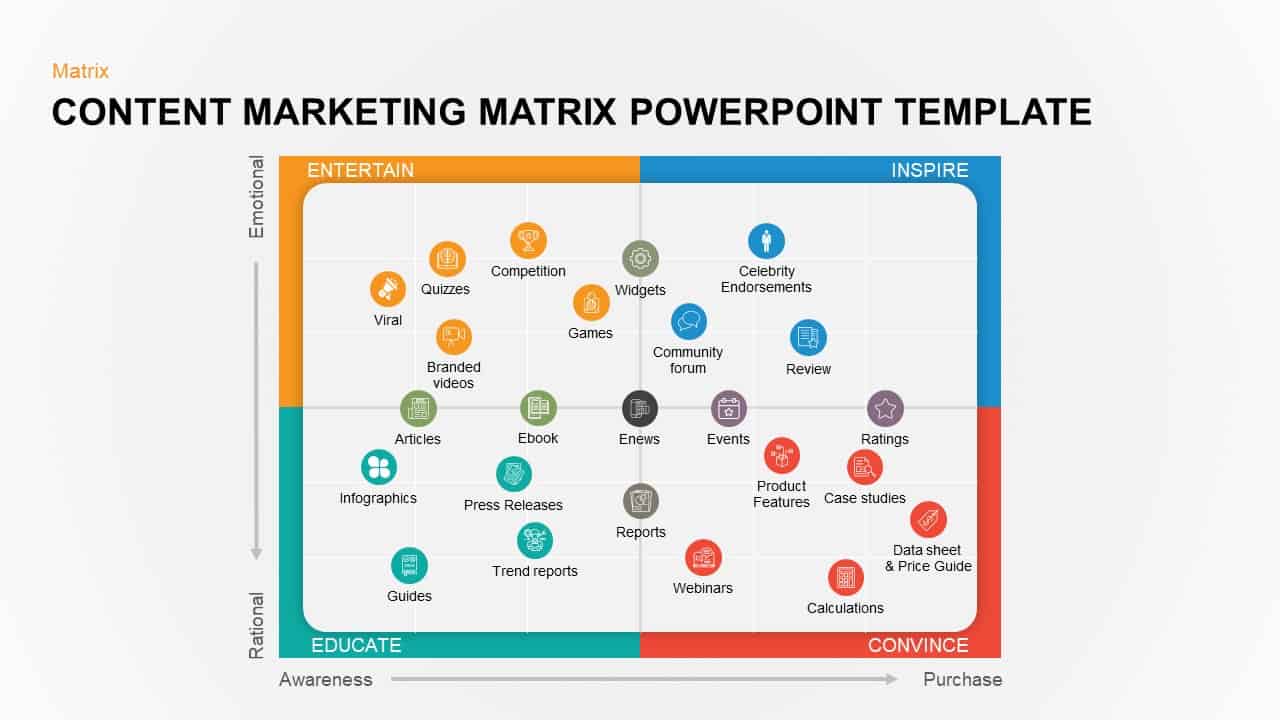
Colorful Content Marketing Matrix Template for PowerPoint & Google Slides
Comparison
Three-Year Strategic Plan Matrix Template for PowerPoint & Google Slides
Timeline
RASCI Responsibility Assignment Matrix Template for PowerPoint & Google Slides
Project
Strategic ADL Matrix by Industry Life Cycle & Position Template for PowerPoint & Google Slides
Business Strategy
Ansoff Growth Matrix Strategy Diagram Template for PowerPoint & Google Slides
Business Strategy
Supply Positioning Model Matrix Template for PowerPoint & Google Slides
Comparison Chart
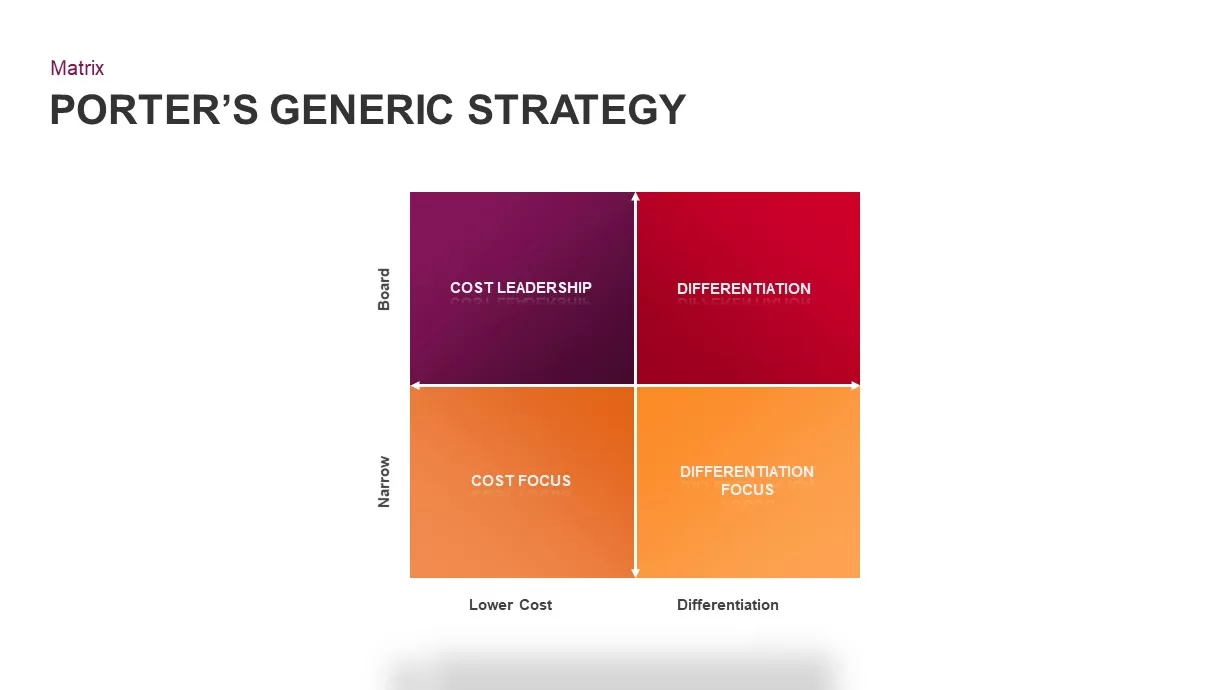
Porter’s Generic Strategy Matrix Diagram Template for PowerPoint & Google Slides
Competitor Analysis
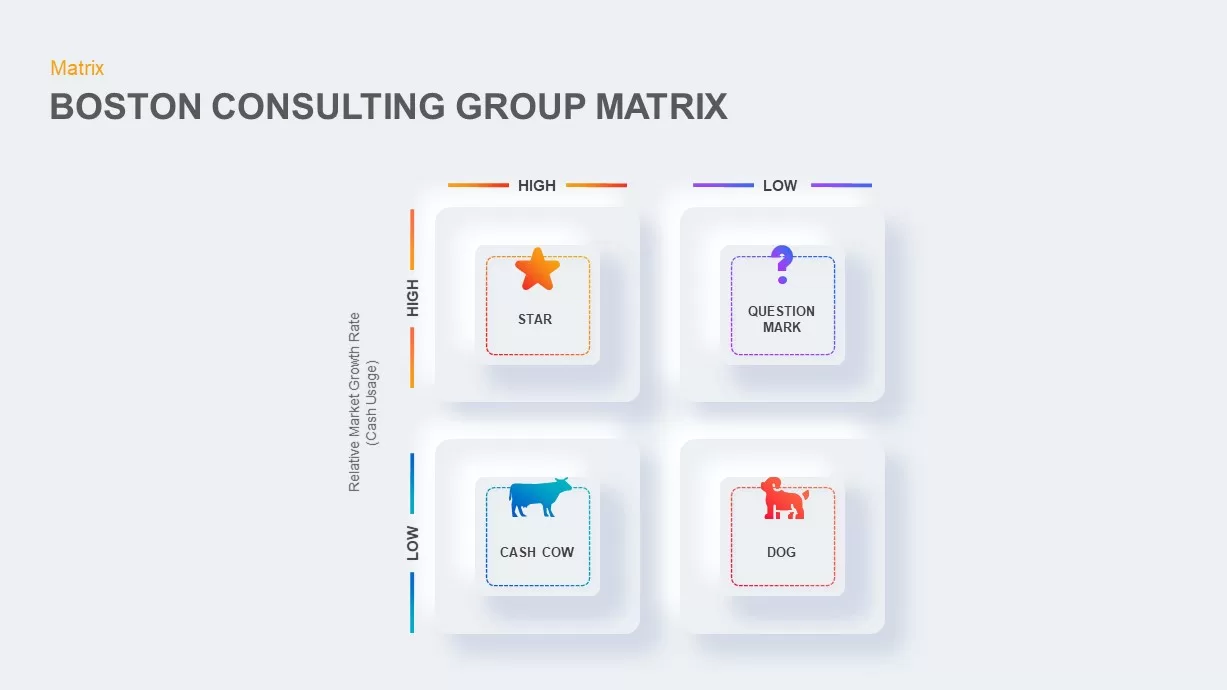
Boston Consulting Group Matrix Diagram Template for PowerPoint & Google Slides
BCG
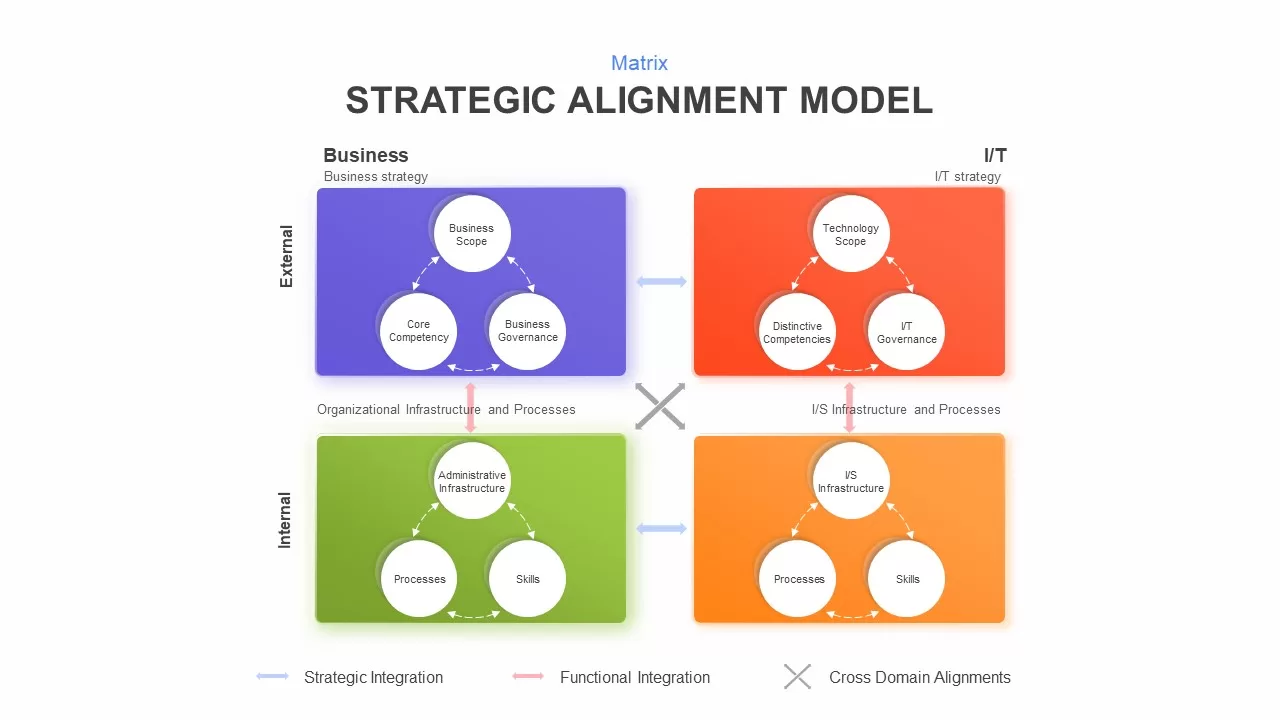
Strategic Alignment Matrix Model Template for PowerPoint & Google Slides
Project
Editable Four-Quadrant TOWS Matrix Template for PowerPoint & Google Slides
Opportunities Challenges
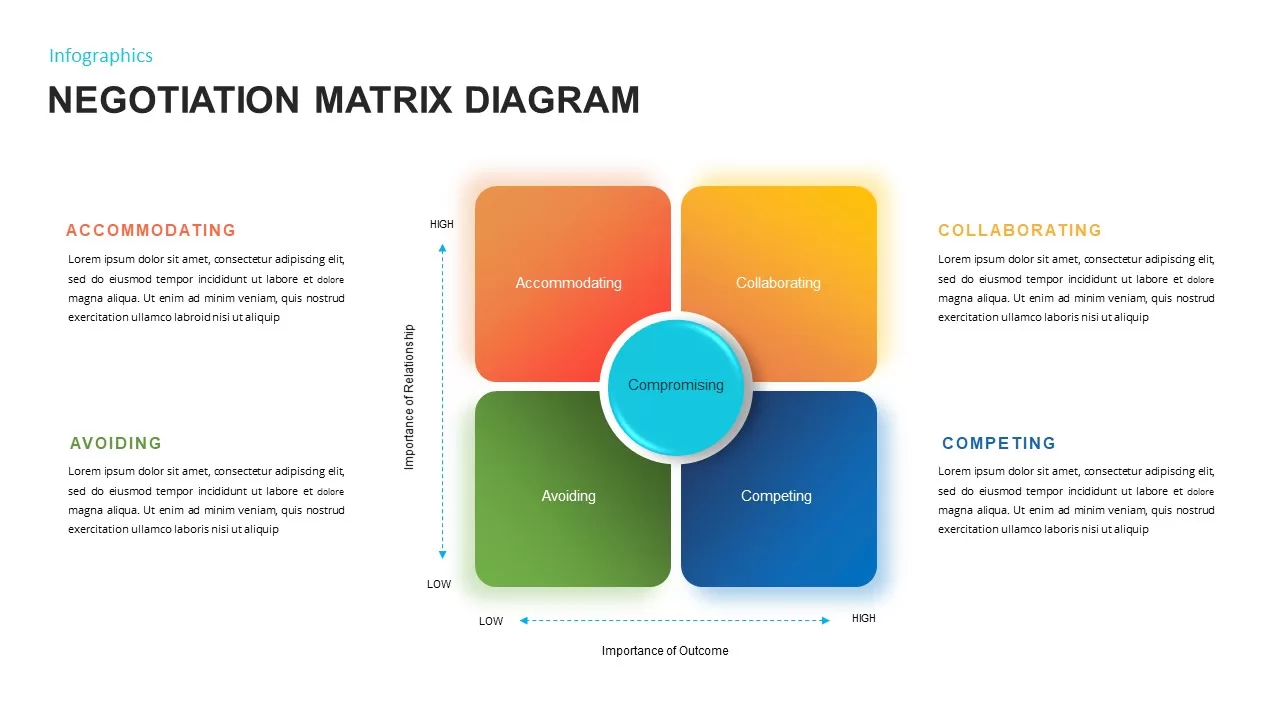
Negotiation Matrix Diagram Template for PowerPoint & Google Slides
Business
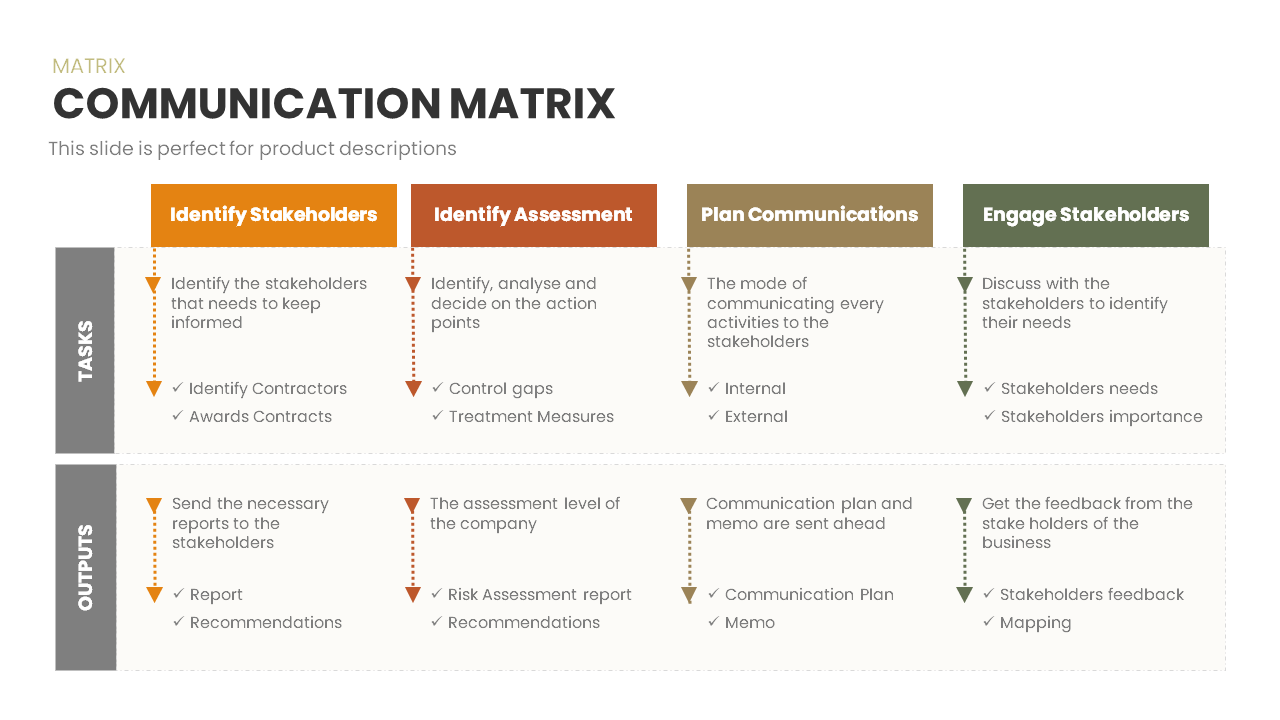
Communication Matrix Overview Template for PowerPoint & Google Slides
Business
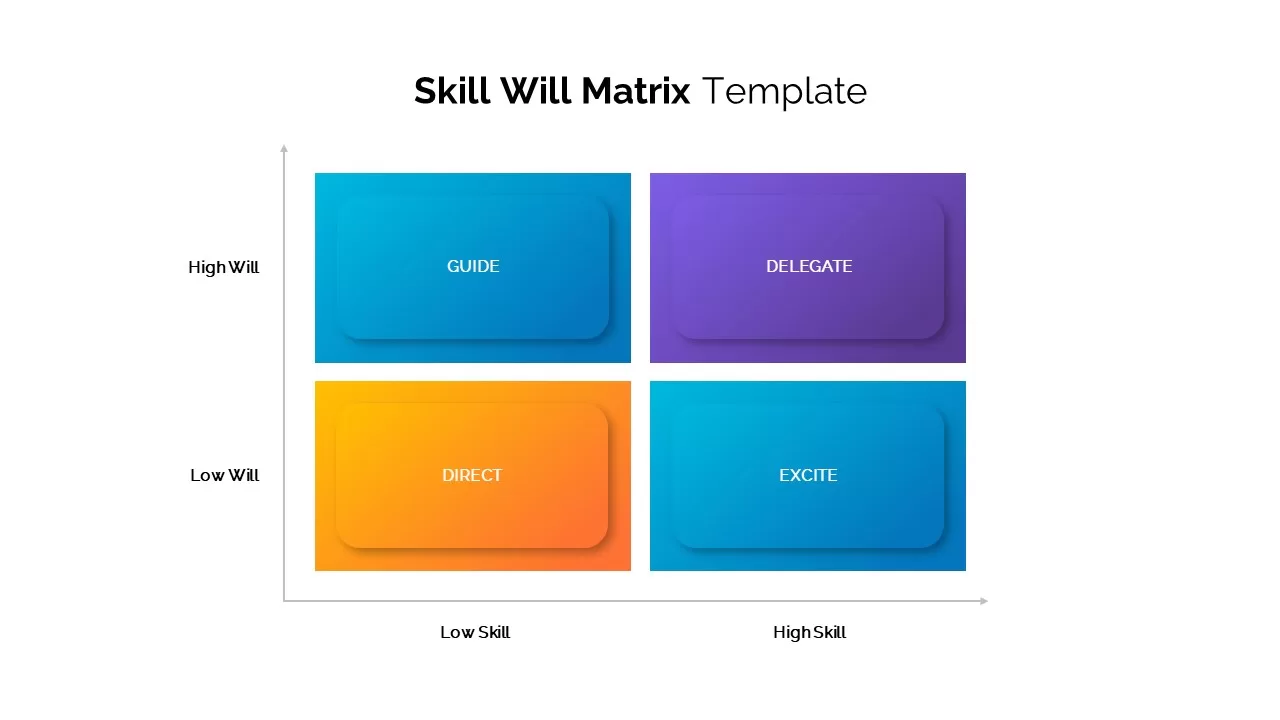
Skill Will Matrix Template for PowerPoint & Google Slides
Infographics
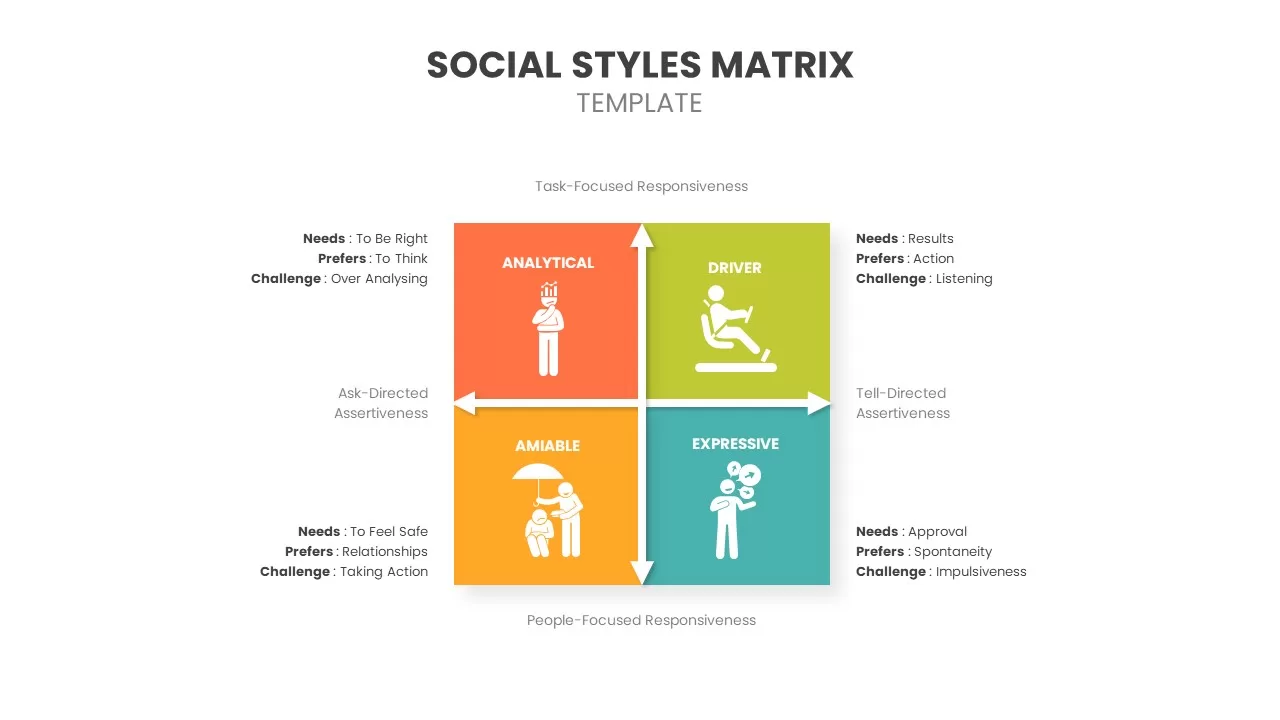
Social Styles Matrix Template for PowerPoint & Google Slides
Business
Pugh Matrix Decision Comparison Chart Template for PowerPoint & Google Slides
Comparison Chart
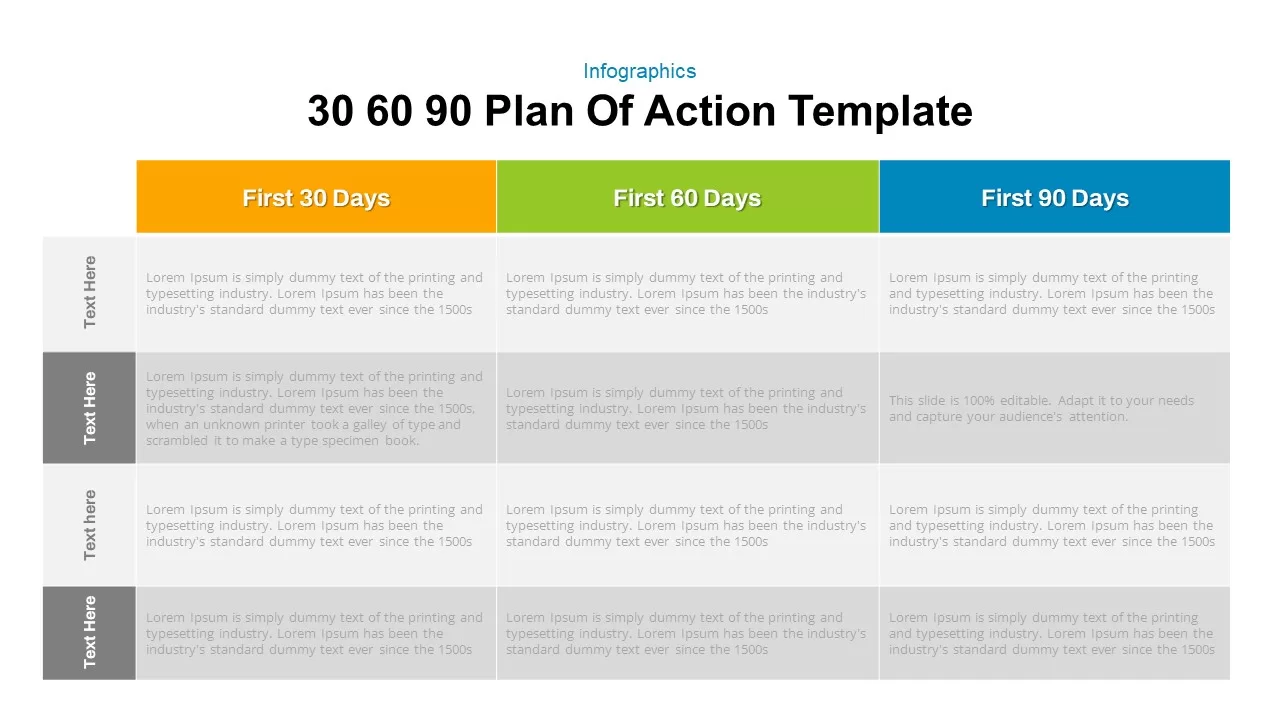
30 60 90 Day Plan Matrix Table Template for PowerPoint & Google Slides
Timeline
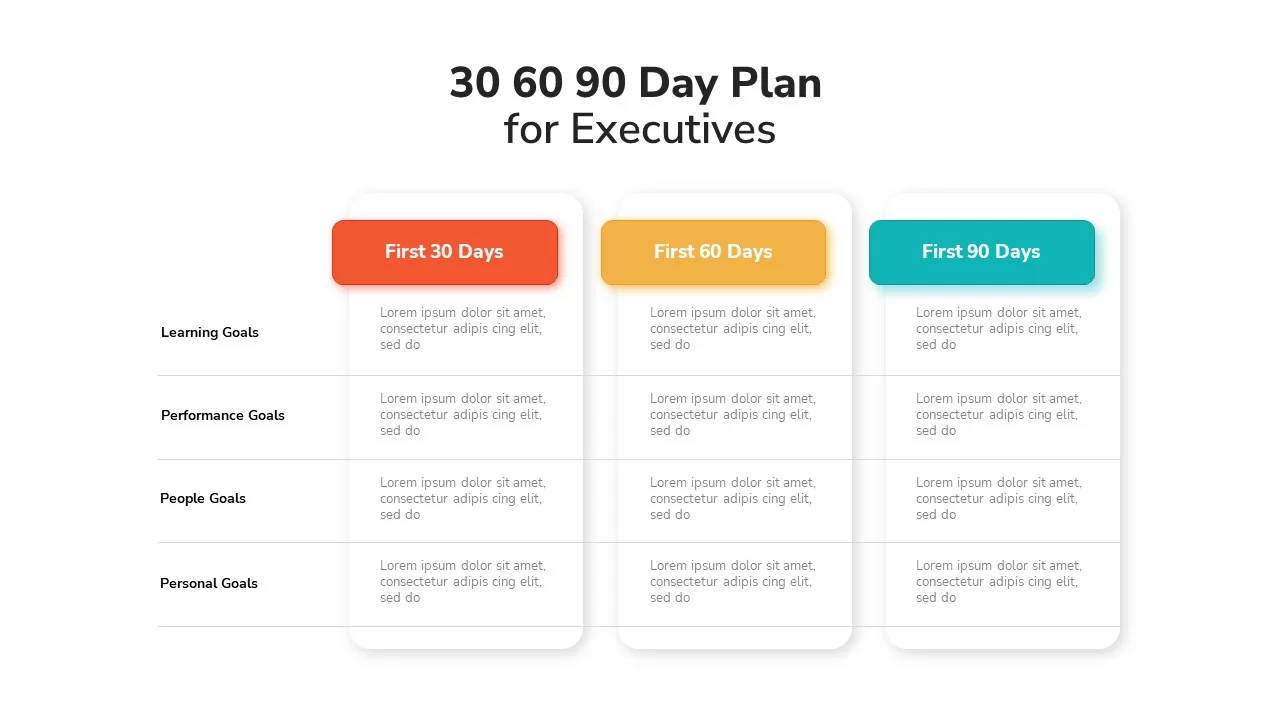
Executive 30-60-90 Day Plan Matrix Template for PowerPoint & Google Slides
Timeline
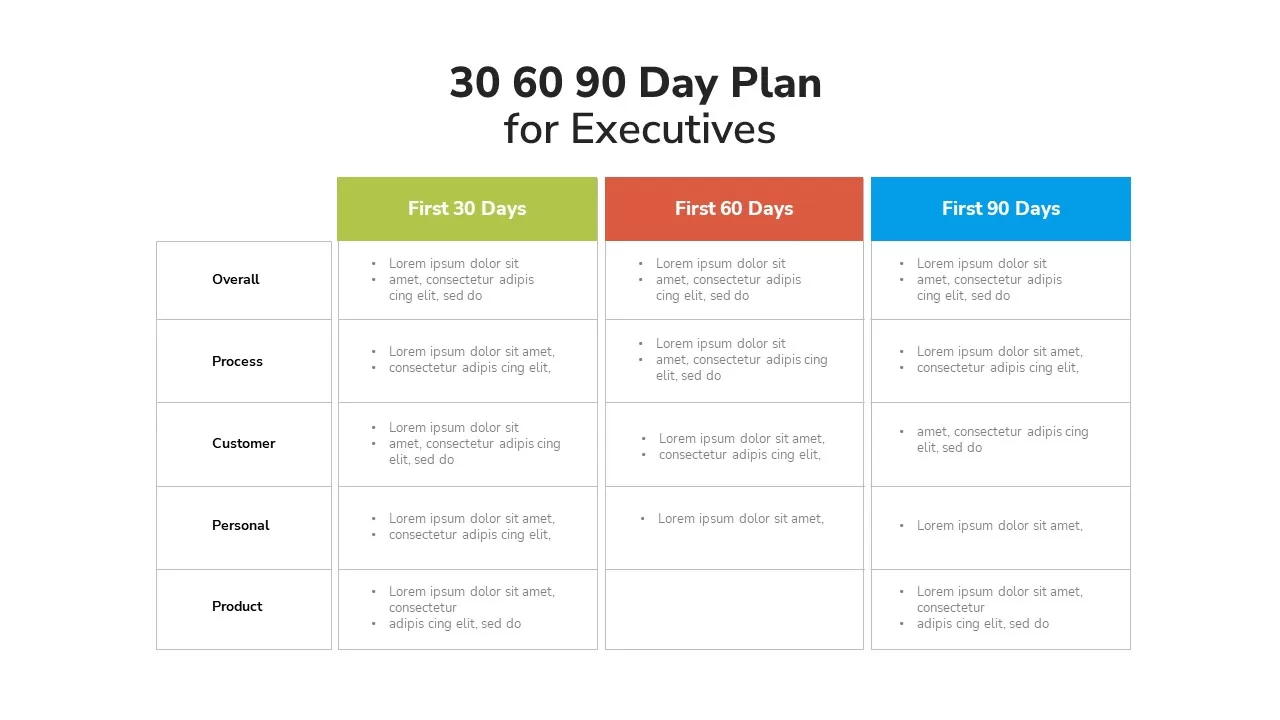
Executive 30-60-90 Day Plan Matrix Template for PowerPoint & Google Slides
Timeline
9-Box Matrix for Performance & Potential Template for PowerPoint & Google Slides
Employee Performance
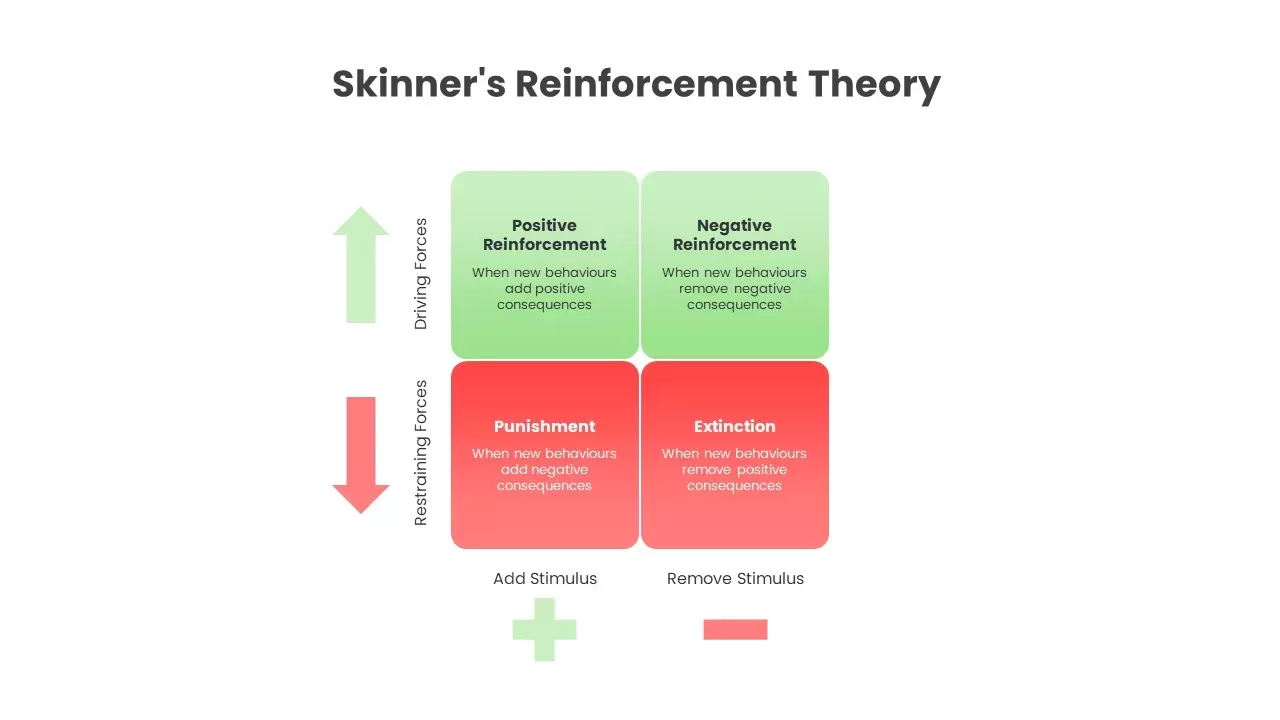
Skinner’s Reinforcement Theory Matrix Template for PowerPoint & Google Slides
Comparison
Heatmap Matrix Template for PowerPoint & Google Slides
Maps
Vendor Comparison Matrix with High-Level Requirements template for PowerPoint & Google Slides
Comparison Chart
MABA Attractiveness Matrix Chart Template for PowerPoint & Google Slides
Comparison Chart
Advantage Matrix 2×2 Framework Template for PowerPoint & Google Slides
Competitor Analysis
Bubble Chart Scatter, Diagram & Matrix Template for PowerPoint & Google Slides
Comparison Chart
Business Growth Strategies Matrix Template for PowerPoint & Google Slides
Comparison
Free Competitor Analysis Matrix Template for PowerPoint & Google Slides
Competitor Analysis
Free
Fixed vs Growth Mindset Matrix Template for PowerPoint & Google Slides
Comparison
Decision Matrix & Prioritization Chart Template for PowerPoint & Google Slides
Comparison Chart
Speed vs Reversibility Decision Matrix Template for PowerPoint & Google Slides
Comparison
Ansoff Growth Matrix Professional Template for PowerPoint & Google Slides
Comparison
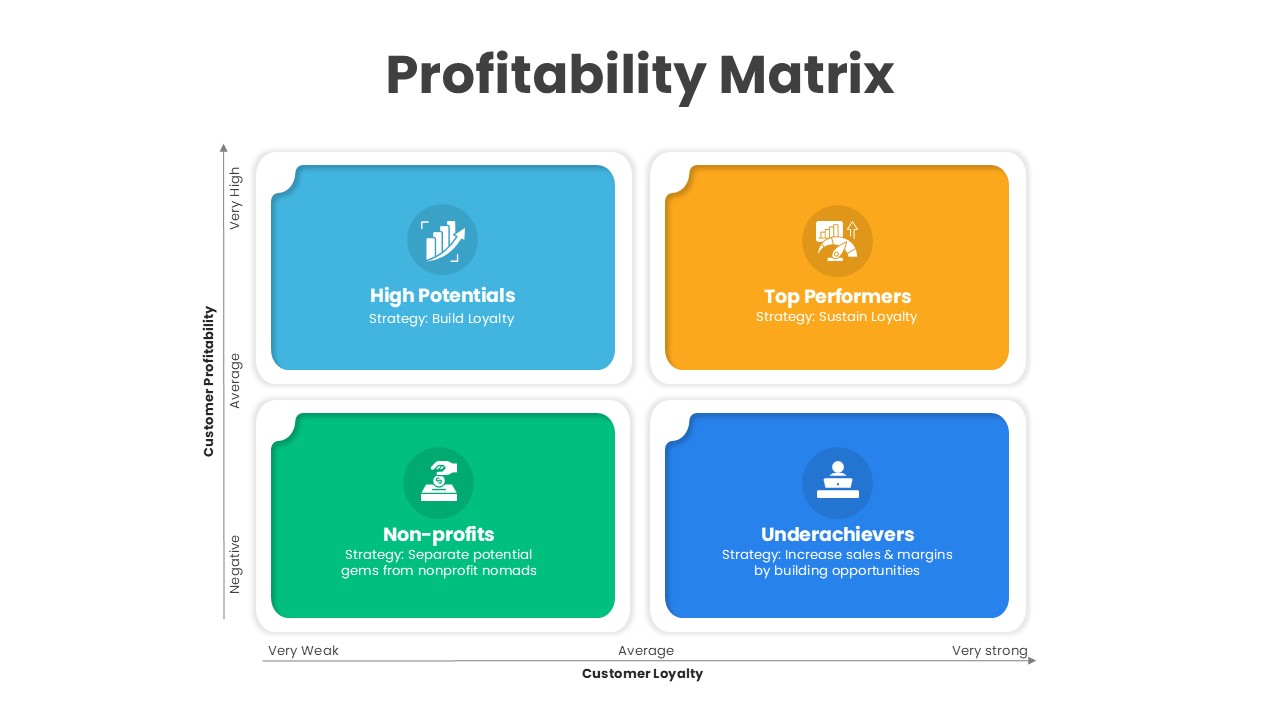
Customer Loyalty & Profitability Matrix Template for PowerPoint & Google Slides
Comparison
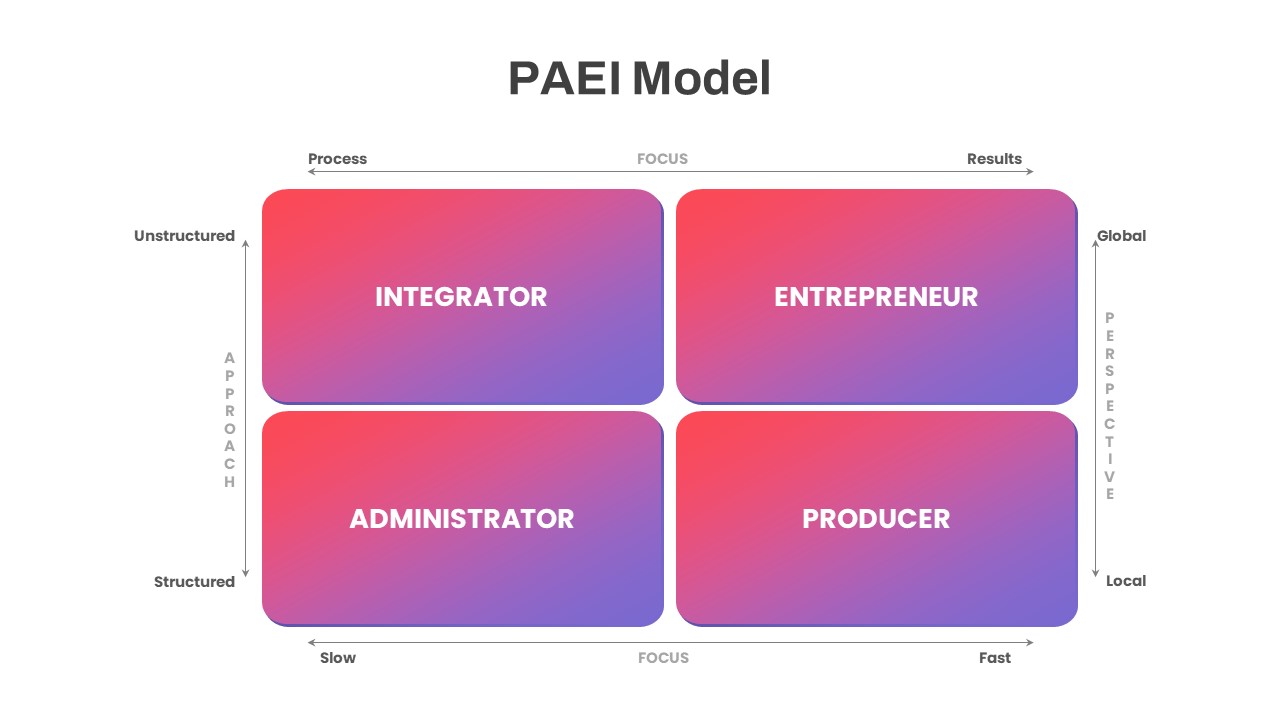
PAEI Leadership Roles 2×2 Matrix Diagram Template for PowerPoint & Google Slides
Business Models
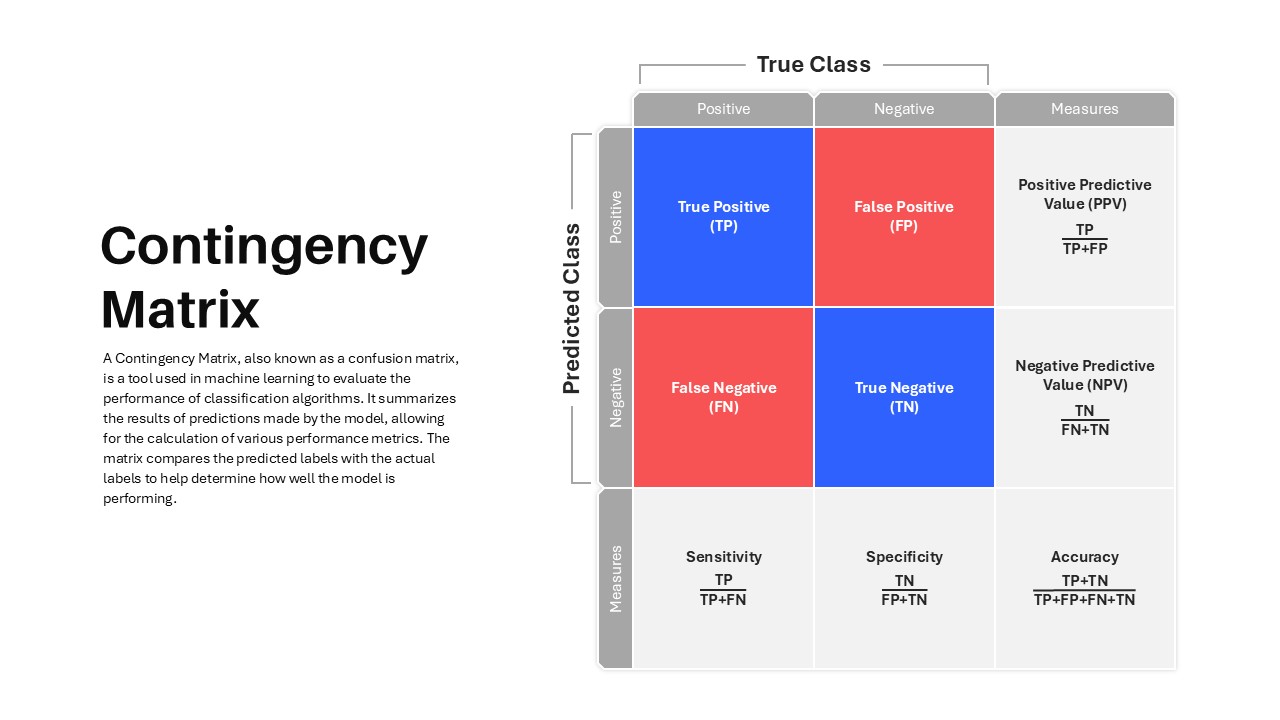
Contingency Matrix in Machine Learning template for PowerPoint & Google Slides
Technology
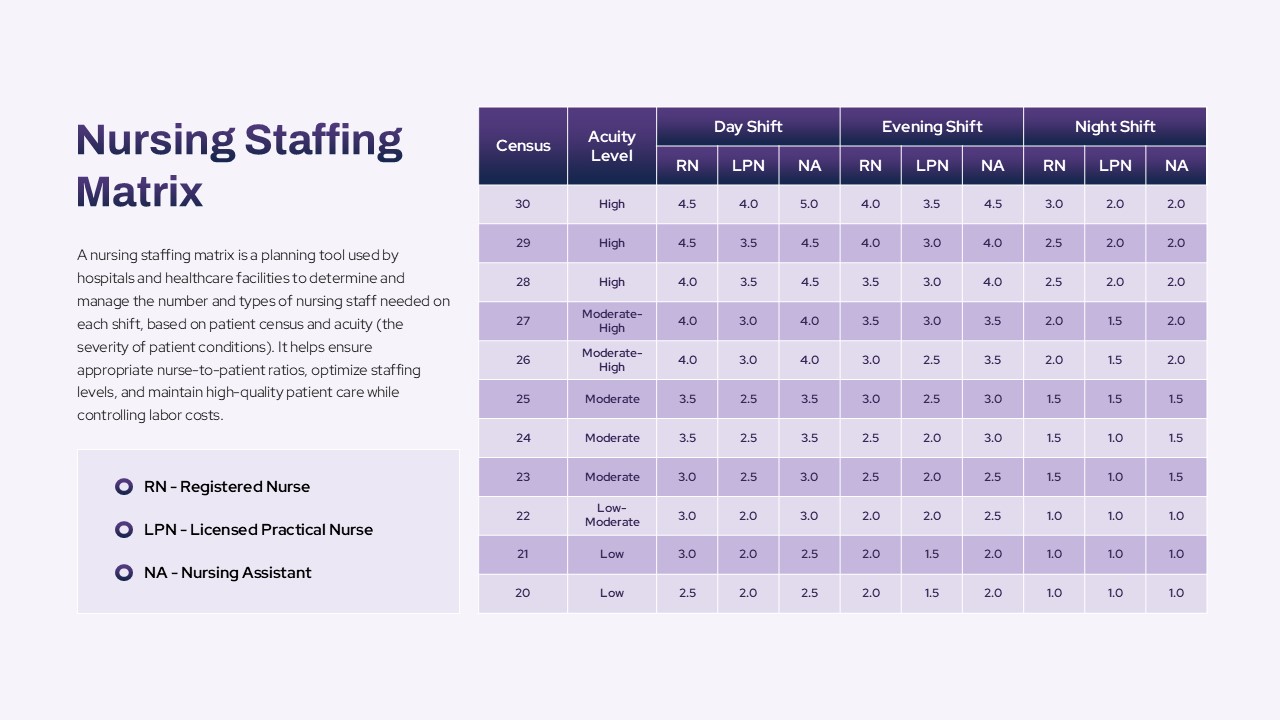
Nursing Staffing Matrix Planning Template for PowerPoint & Google Slides
Nursing
Disaster Response Role Matrix RACI Chart Template for PowerPoint & Google Slides
Project Status
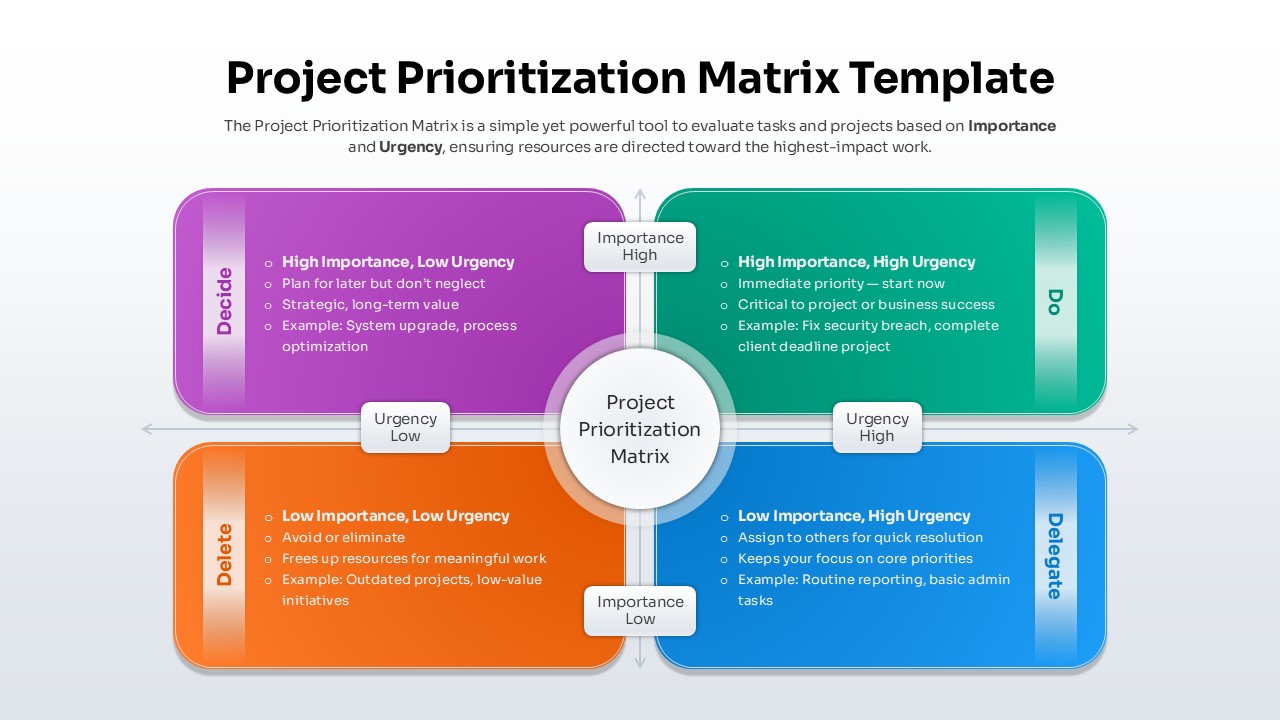
Project Prioritization Matrix Template for PowerPoint & Google Slides
Project
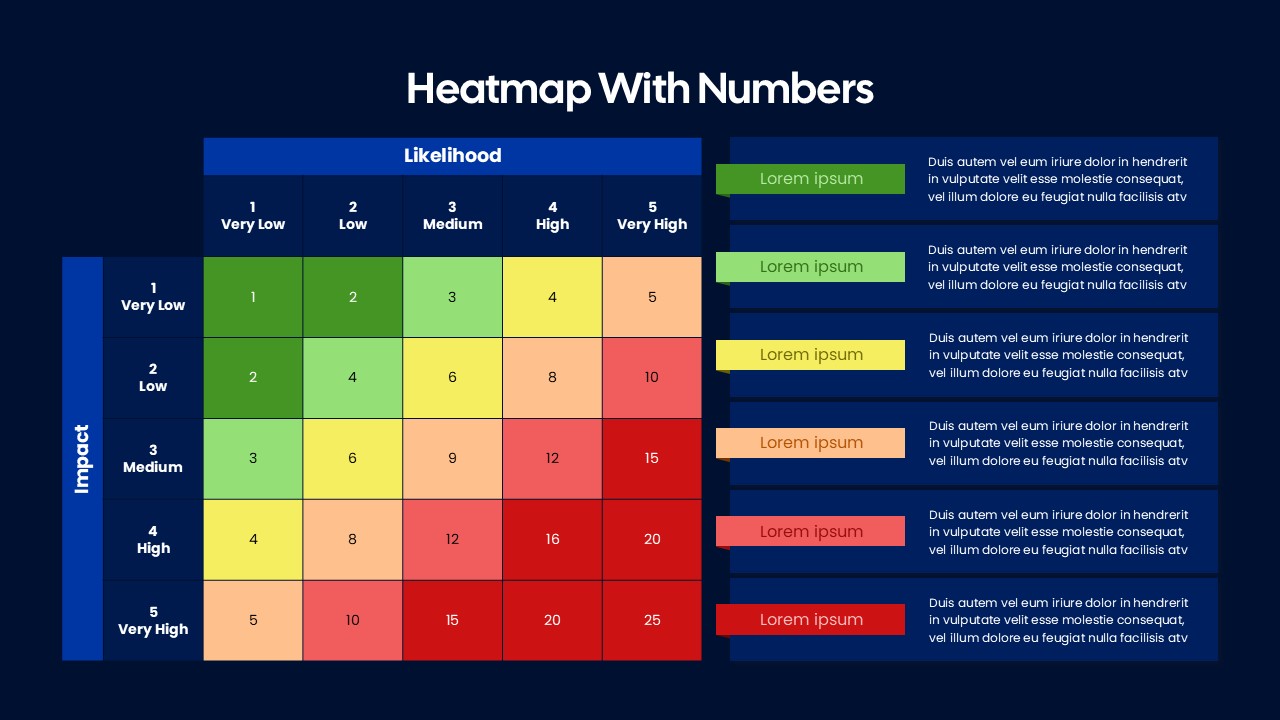
Heatmap Matrix with Numbers Template for PowerPoint & Google Slides
Project
Ansoff Growth Matrix Template for PowerPoint & Google Slides
Business Strategy
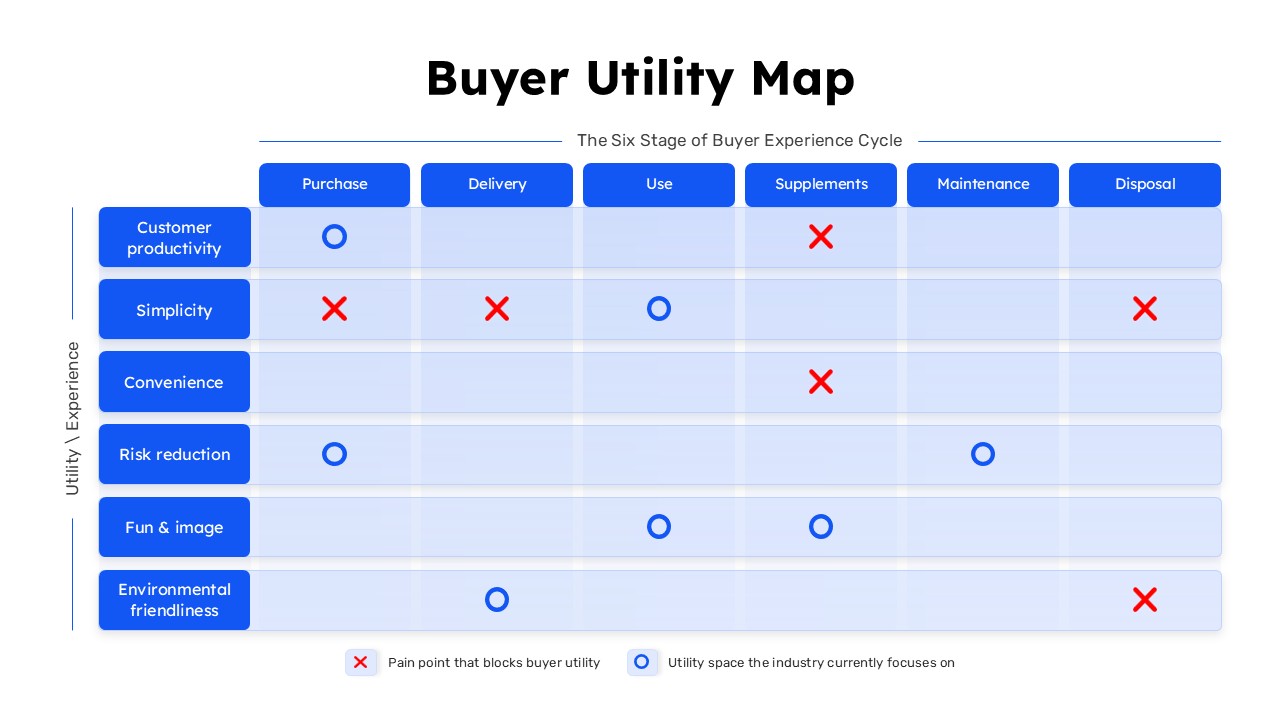
Buyer Utility Map Strategy Matrix Template for PowerPoint & Google Slides
Customer Journey
IT Gap Analysis Assessment Matrix Template for PowerPoint & Google Slides
Information Technology