Return on Investment (ROI) Analysis template for PowerPoint & Google Slides
Description
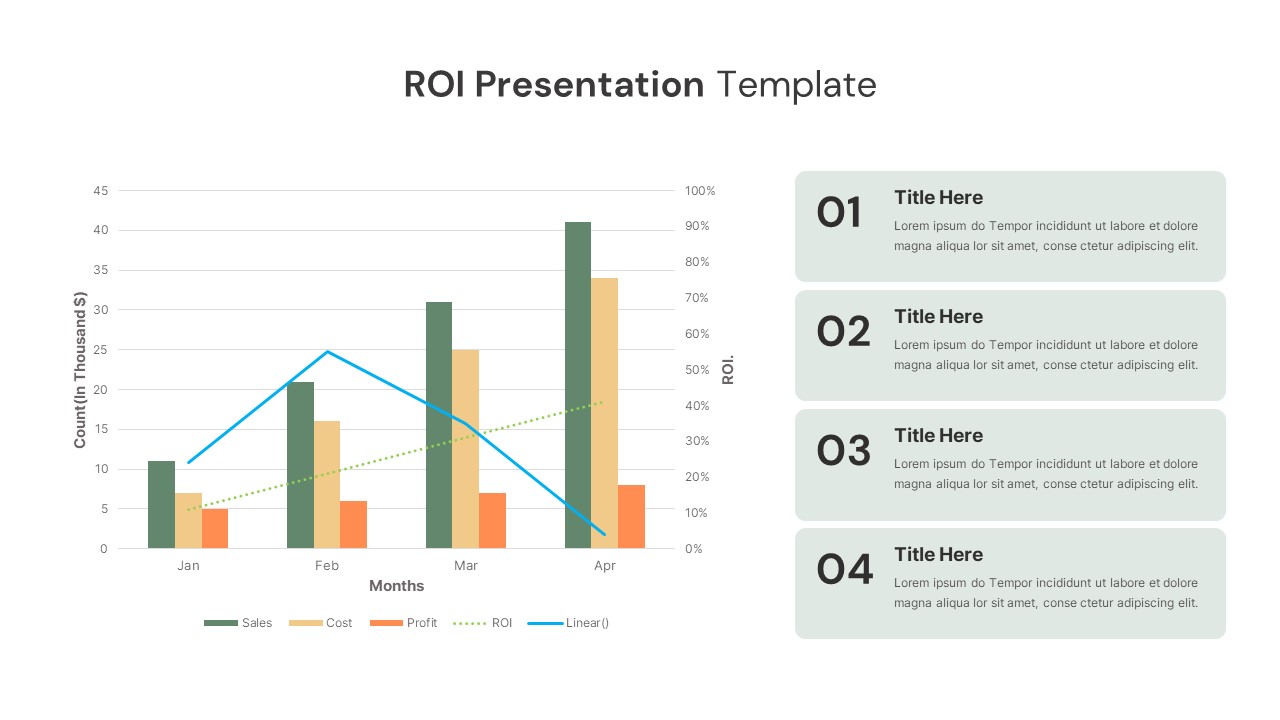
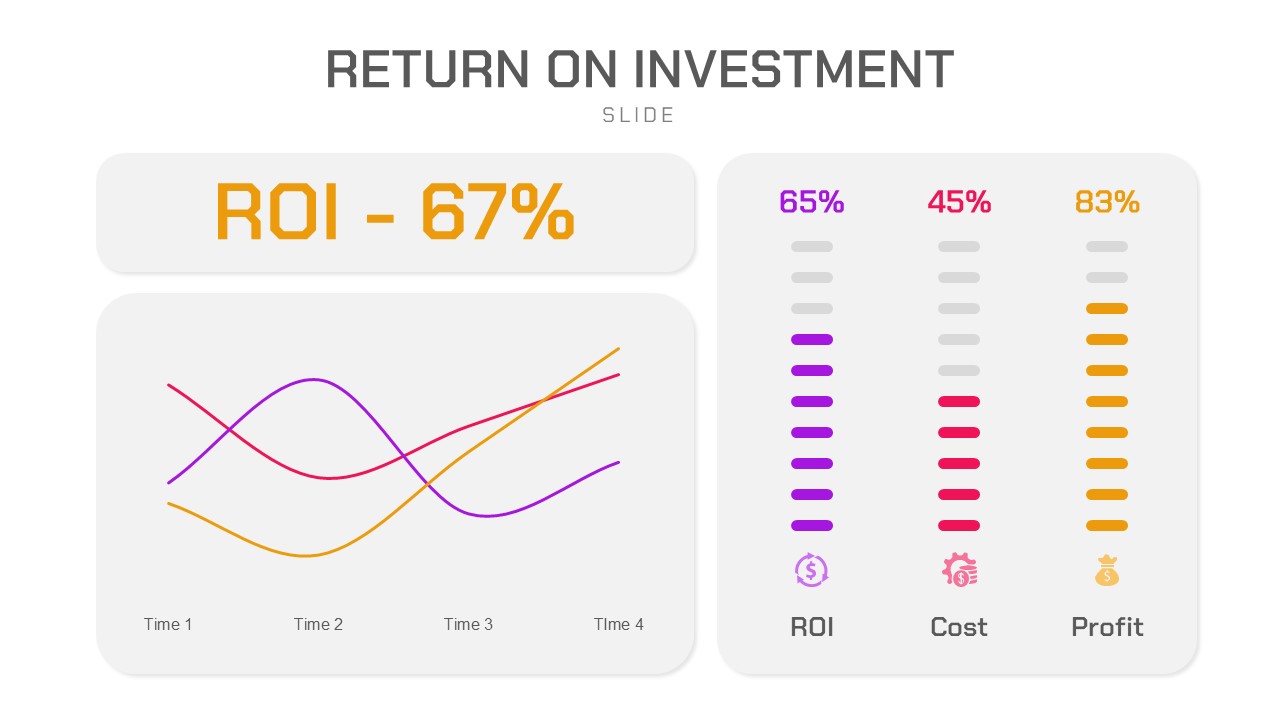
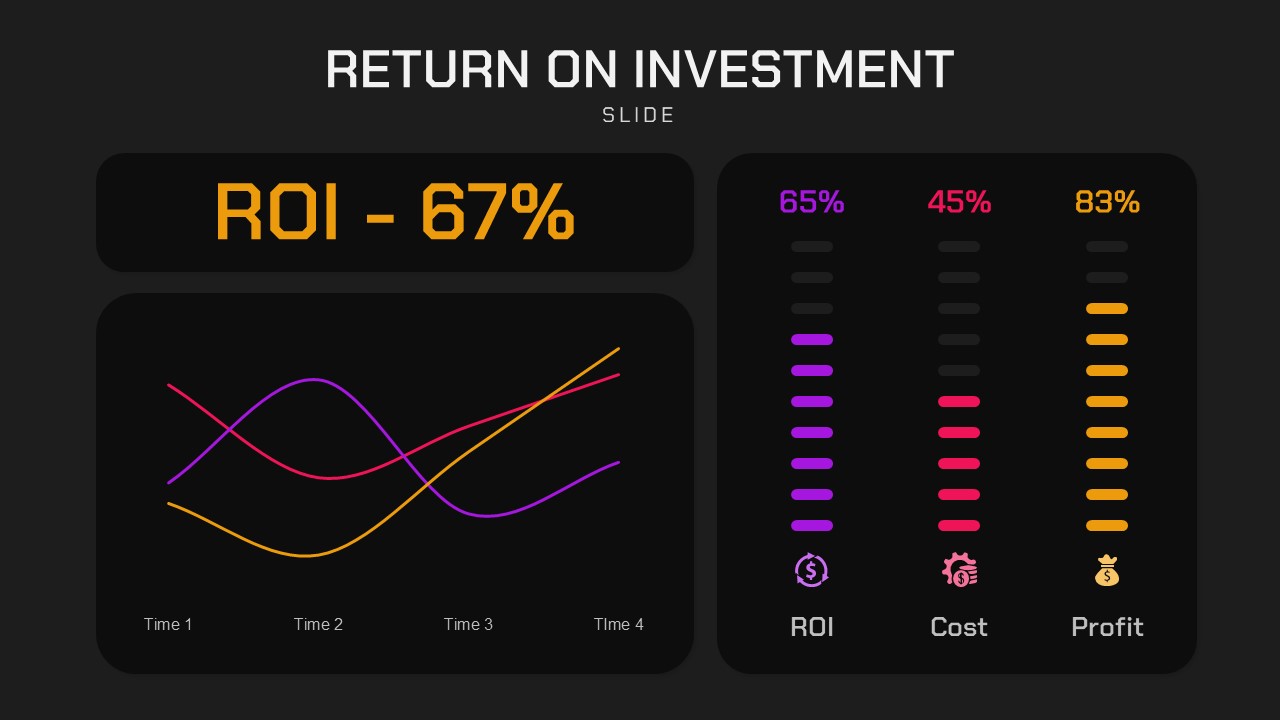
This visually dynamic “Return on Investment (ROI)” slide is designed to present and compare ROI data effectively. It features a combination of a line chart and progress bars, offering an insightful overview of key metrics. The line graph shows ROI trends over time, with different colored lines representing various data points, helping you visualize performance fluctuations (67% ROI).
To the right, a series of progress bars represents ROI, cost, and profit percentages (65%, 45%, and 83%, respectively), accompanied by intuitive icons to represent money, costs, and profits. The clear, colorful progress bars make the data easy to interpret at a glance. The design also includes a large, bold ROI percentage at the top, ensuring the most important number stands out.
This slide is fully customizable, allowing you to update data, modify colors, or change icons to suit your presentation needs. Optimized for both PowerPoint and Google Slides, it is perfect for presenting financial analyses, investment outcomes, and business performance metrics in a sleek, professional manner.
Who is it for
This template is ideal for financial analysts, project managers, business consultants, and executives who need to present ROI, financial performance, or investment results. It’s great for business reviews, investor presentations, or financial reporting.
Other Uses
In addition to ROI analysis, this slide can be adapted for showcasing performance metrics, comparing costs and profits, or evaluating project results over time. It’s also useful for presenting financial forecasts, investment strategies, and budget analysis.
Login to download this file

Item ID
SB03221
Related Templates

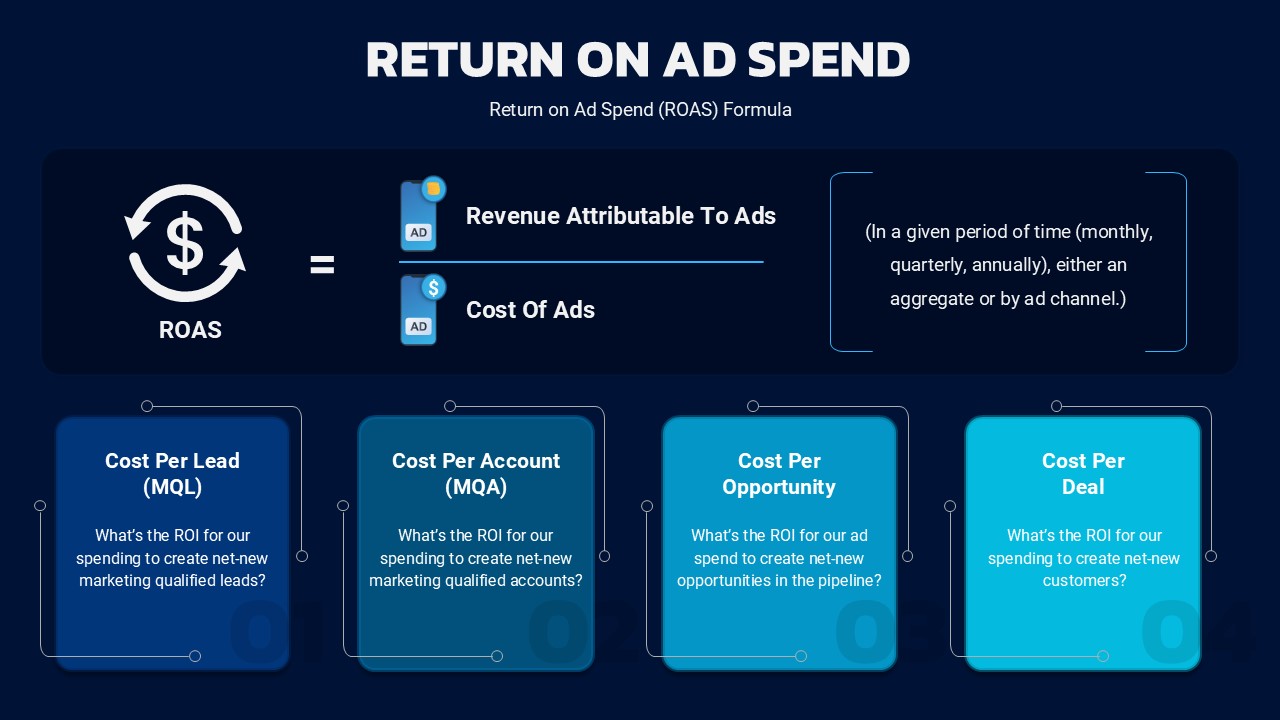
Return on Ad Spend Formula for PowerPoint & Google Slides
Business Strategy
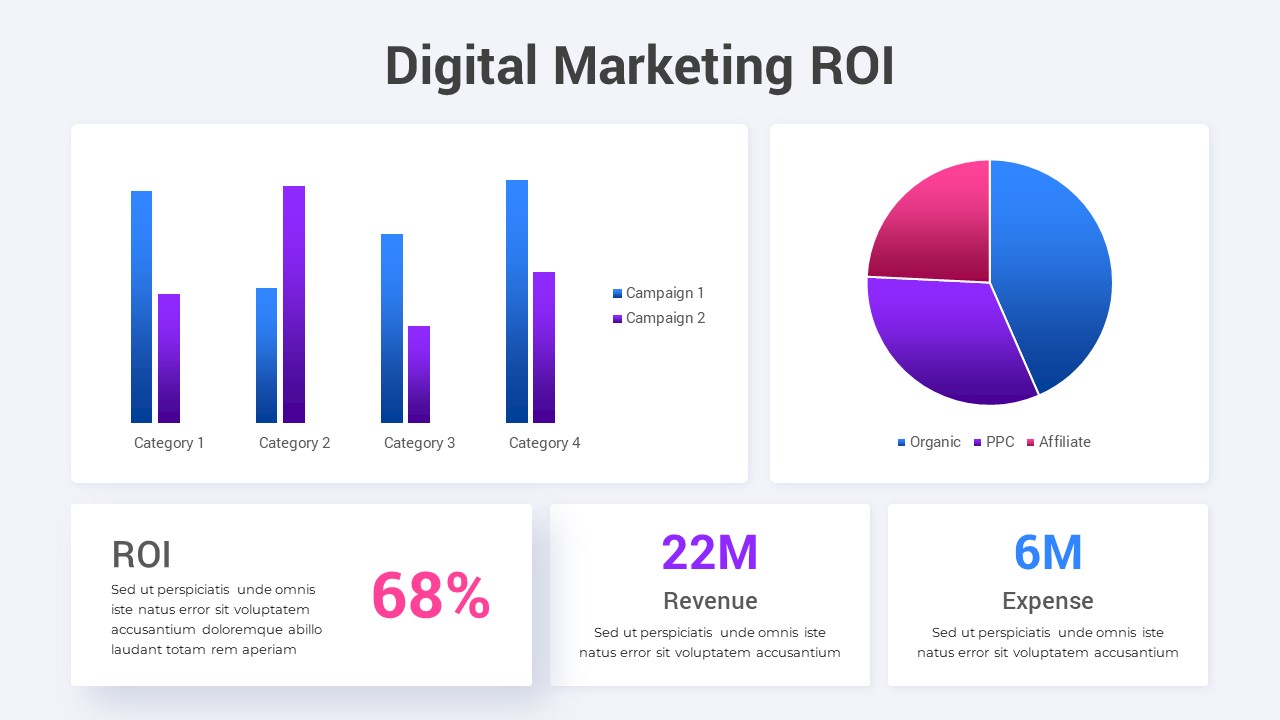
Digital Marketing ROI Analysis template for PowerPoint & Google Slides
Digital Marketing
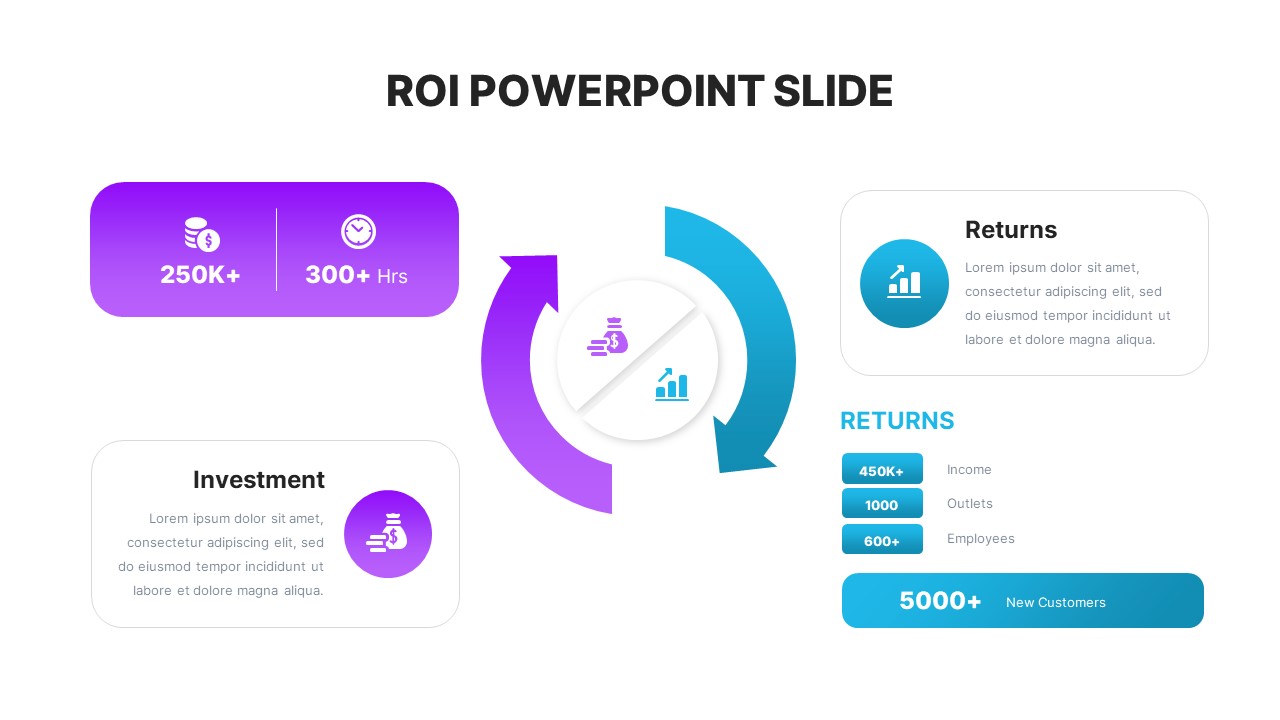
ROI PowerPoint Slide for PowerPoint & Google Slides
Business Strategy
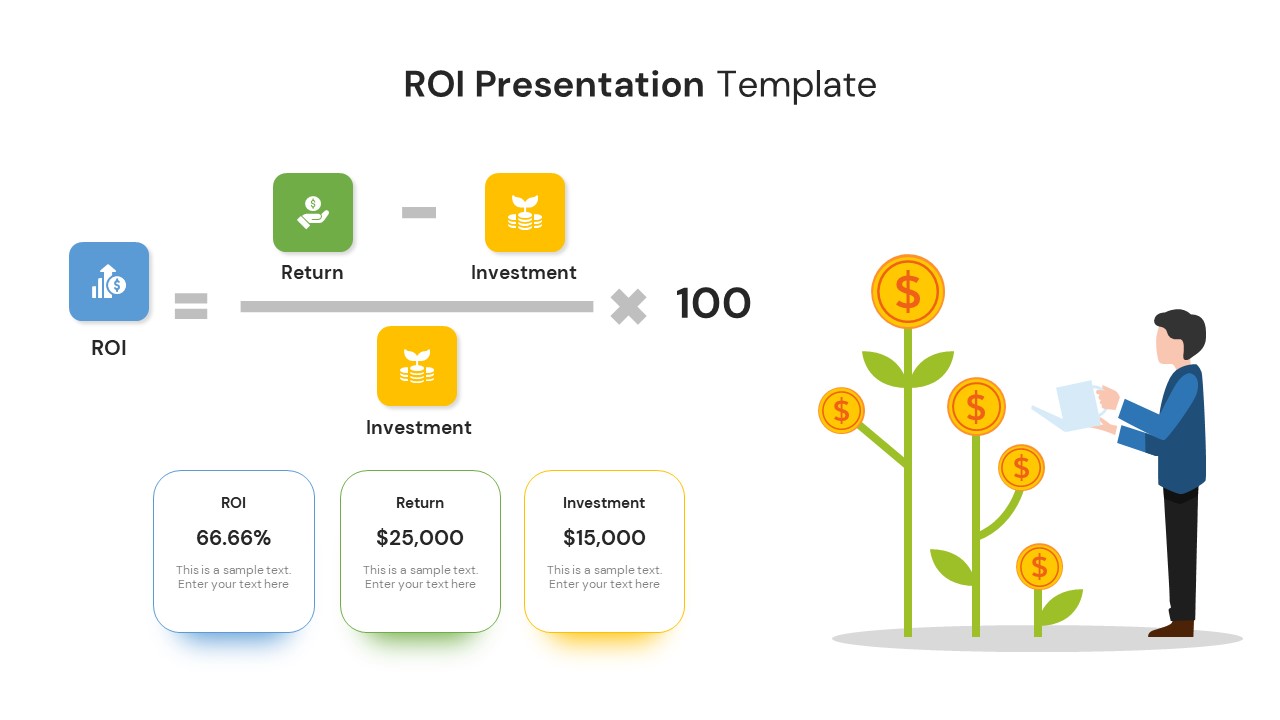
ROI Presentation Slide for PowerPoint & Google Slides
Business Report
ROI Presentation for PowerPoint & Google Slides
Business Proposal
ROI Infographic for PowerPoint & Google Slides
Business Report
Business Investment Features Infographic Template for PowerPoint & Google Slides
Finance
Investment Pitch Deck Template for PowerPoint & Google Slides
Pitch Deck
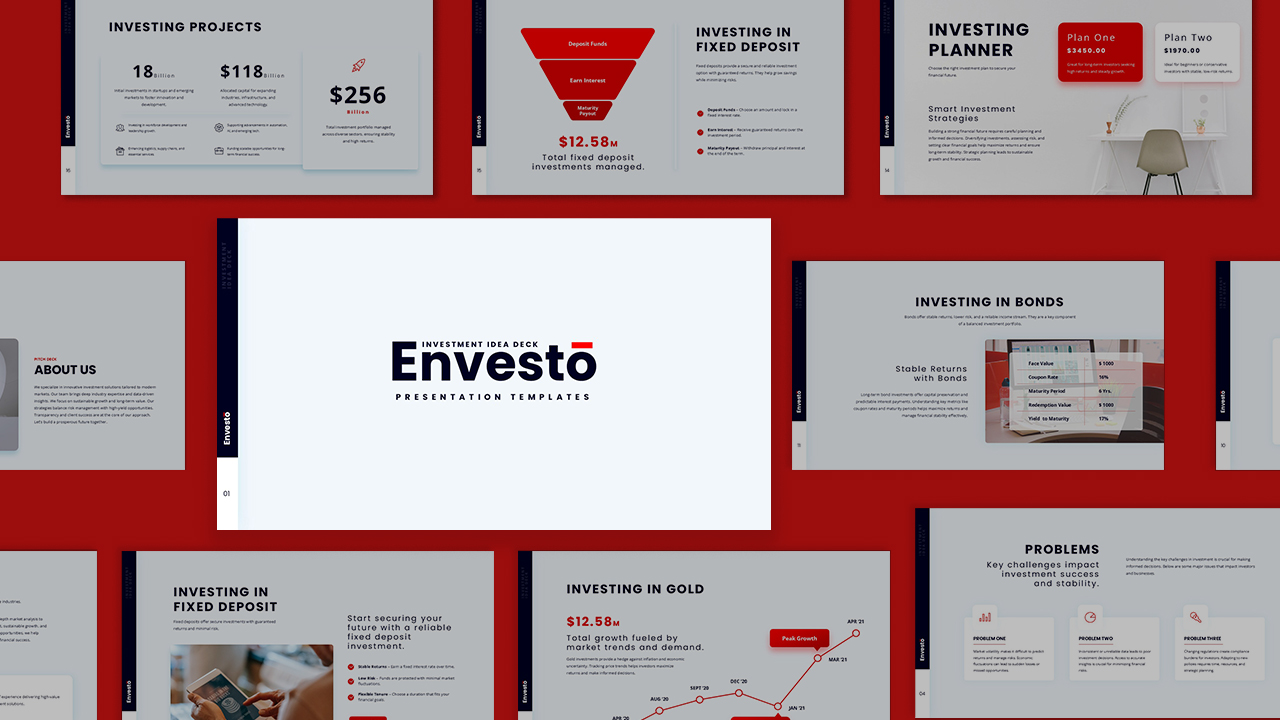
Investment Idea Deck Overview Template for PowerPoint & Google Slides
Decks
Investment Banking template for PowerPoint & Google Slides
Finance
Dynamic Investment & Finance Growth Template for PowerPoint & Google Slides
Finance

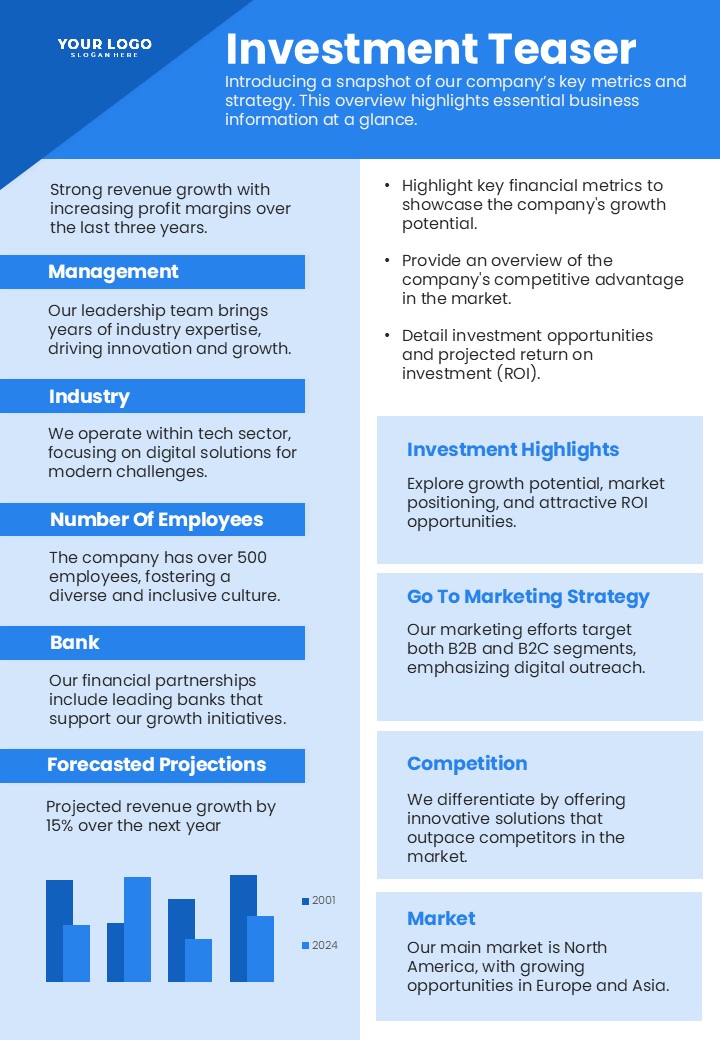
Professional Investment Teaser Slide Template for PowerPoint & Google Slides
Pitch Deck
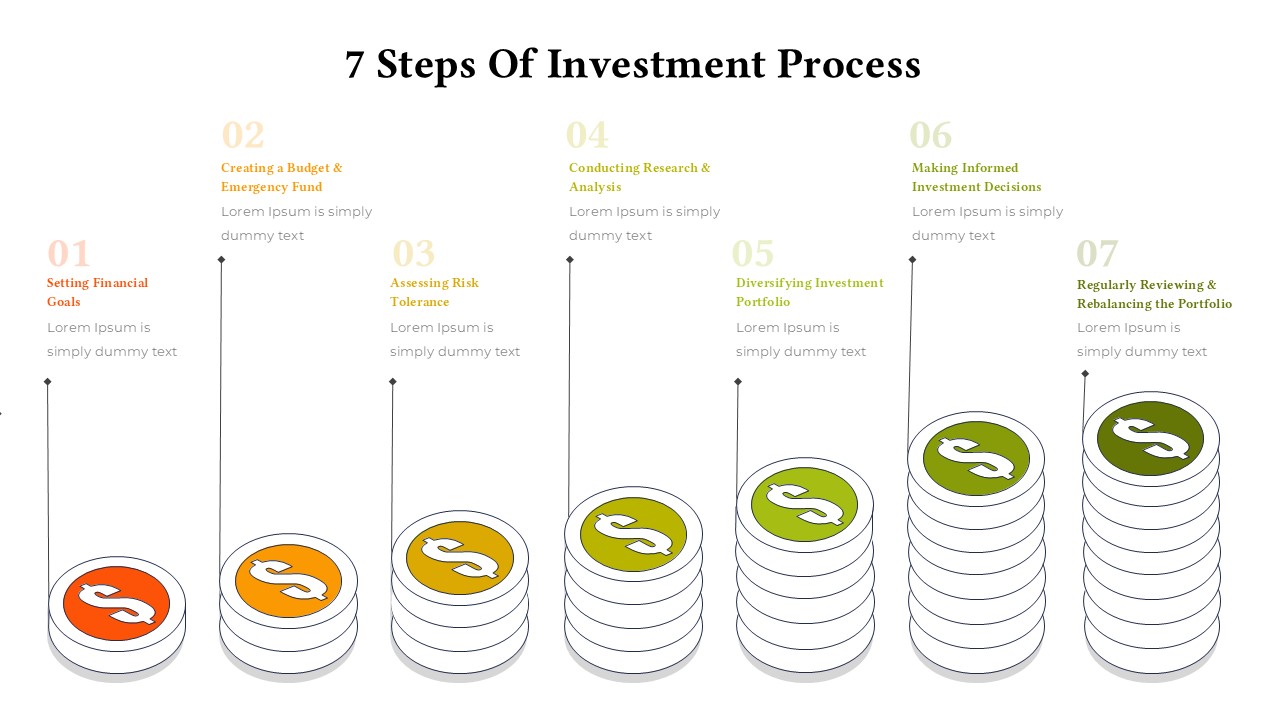
7 Steps of Investment Process Template for PowerPoint & Google Slides
Finance
PEST Analysis PowerPoint Template for PowerPoint & Google Slides
Business Strategy
Mobile Data Analysis Chart template for PowerPoint & Google Slides
Charts
Donut Split Analysis template for PowerPoint & Google Slides
Pie/Donut
Line Graph Analysis template for PowerPoint & Google Slides
Charts

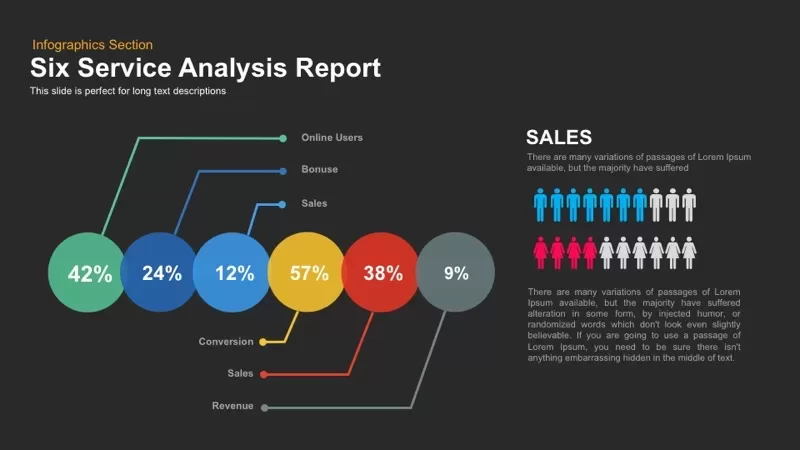
Six Service Analysis Report template for PowerPoint & Google Slides
Infographics
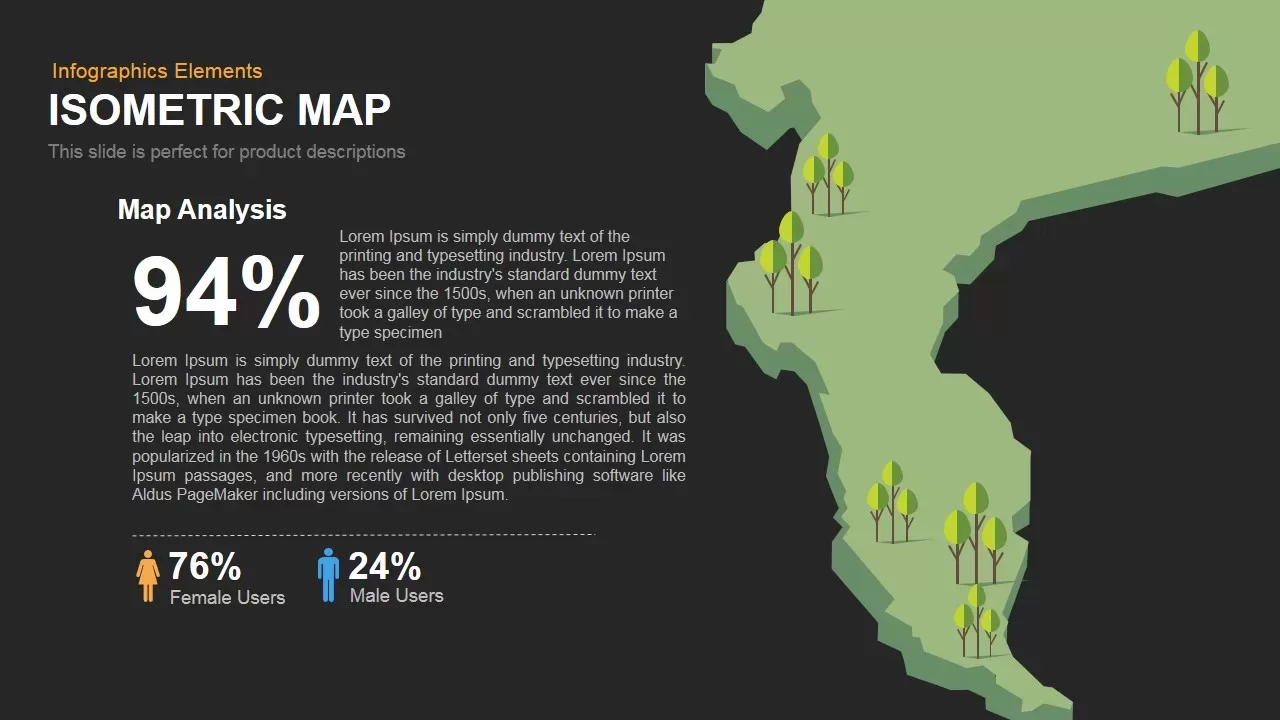
Isometric Map Analysis Slide Template for PowerPoint & Google Slides
World Maps
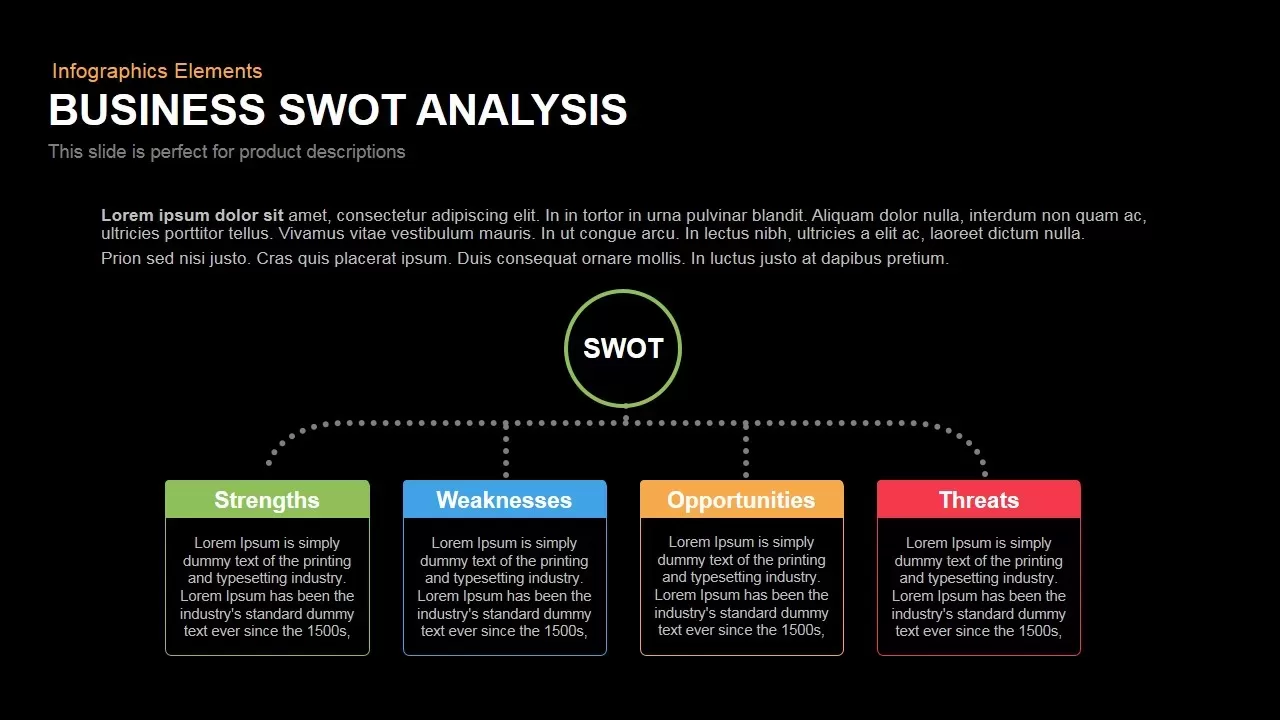
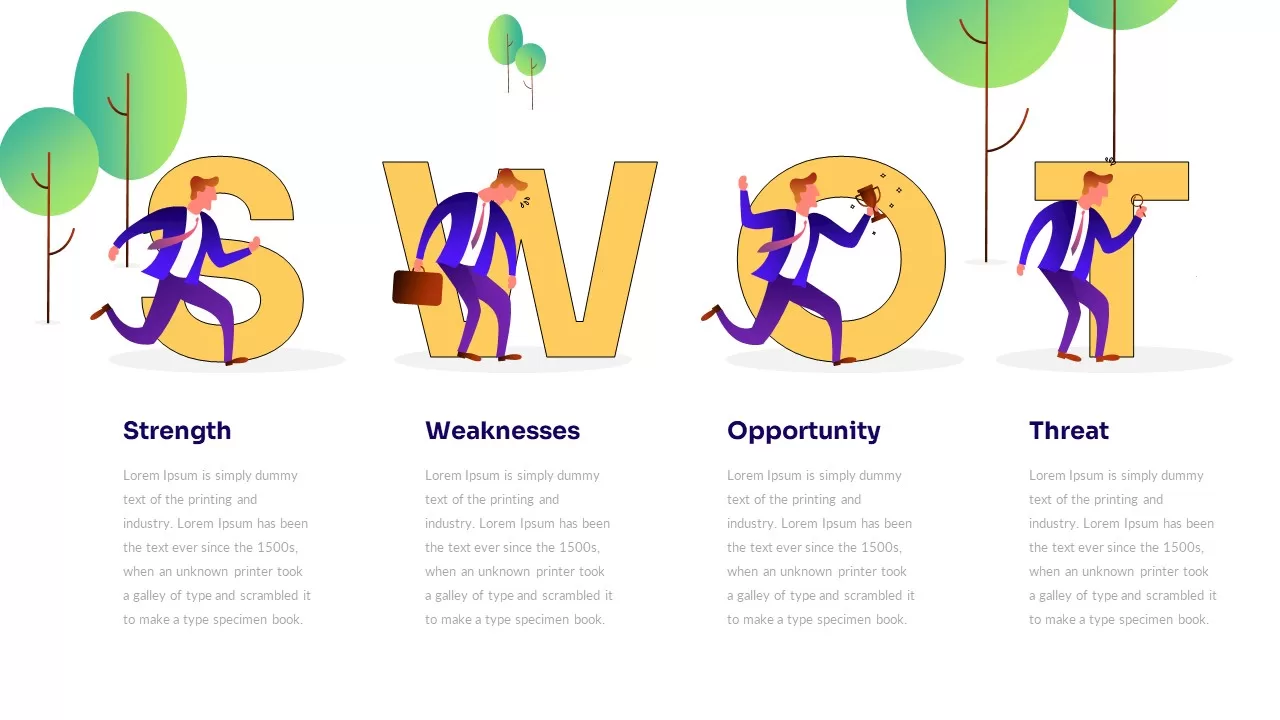
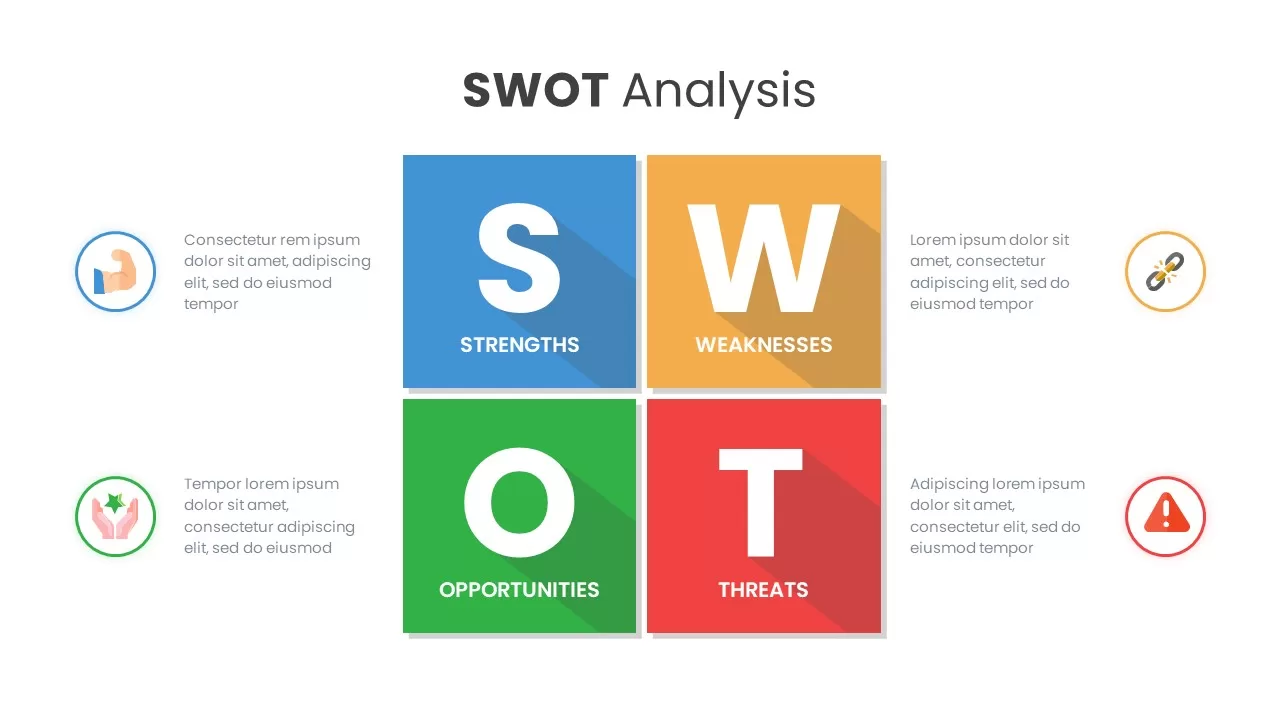
Box Business SWOT Analysis Template for PowerPoint & Google Slides
SWOT
Modern Circle SWOT Analysis Diagram Template for PowerPoint & Google Slides
SWOT
E-Learning Report Analysis Template for PowerPoint & Google Slides
Infographics
Pencil Bar Chart Data Analysis Template for PowerPoint & Google Slides
Bar/Column

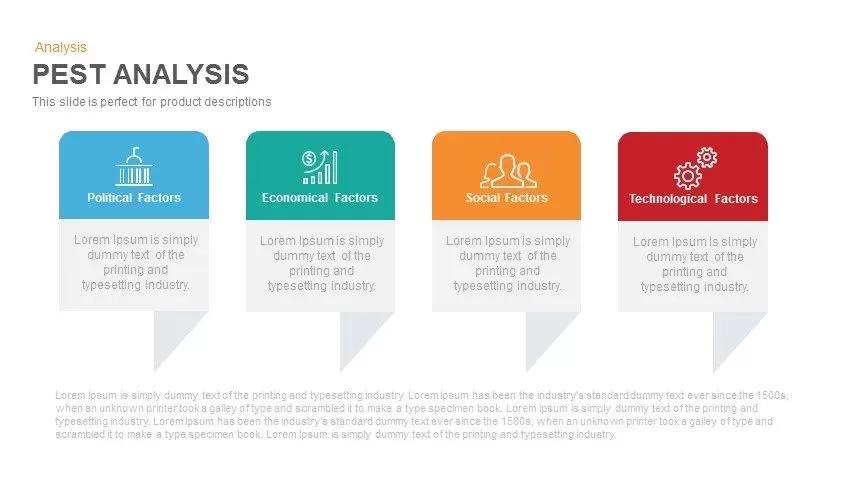
PEST Analysis Template for PowerPoint & Google Slides
PEST
PESTLE Analysis Deck Template for PowerPoint & Google Slides
Decks
Professional PESTEL Analysis Diagram Template for PowerPoint & Google Slides
PEST

Interactive Gap Analysis Puzzle Diagram Template for PowerPoint & Google Slides
Gap
Fishbone Diagram Analysis Template for PowerPoint & Google Slides
Flow Charts
Employee Skill Analysis Dashboard Template for PowerPoint & Google Slides
Employee Performance
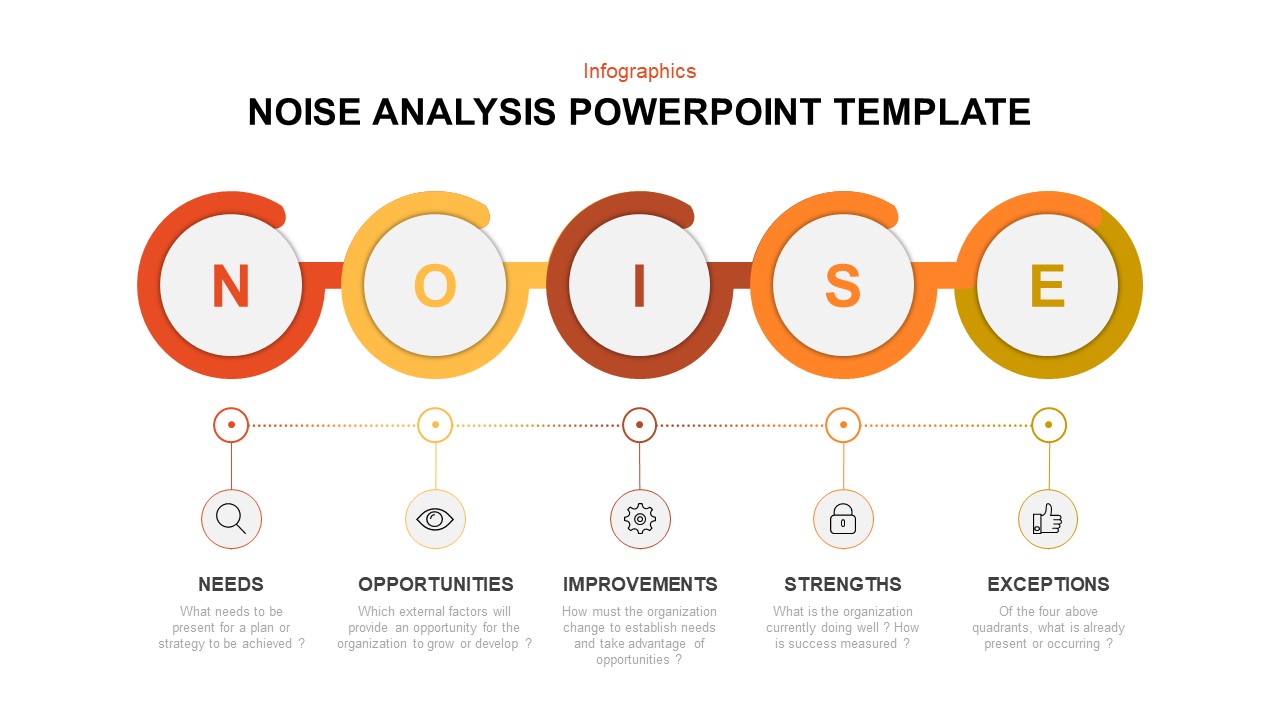
Modern Noise Analysis Infographic Template for PowerPoint & Google Slides
Process
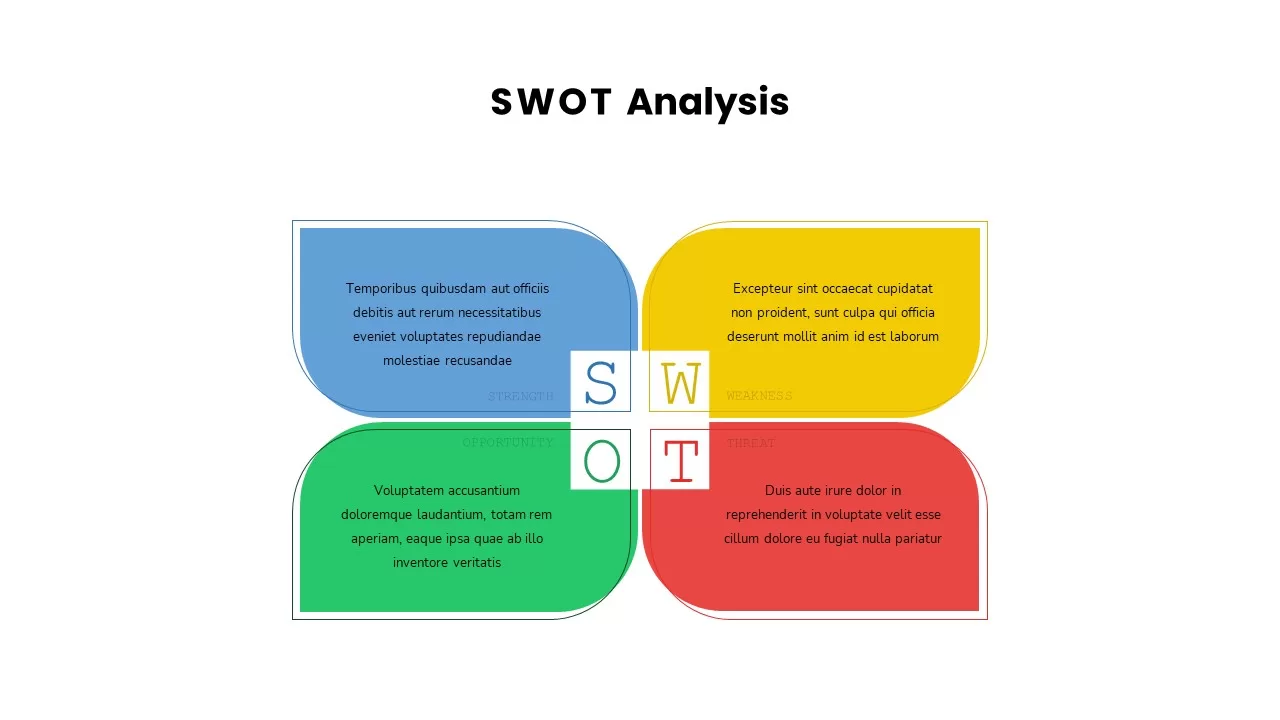
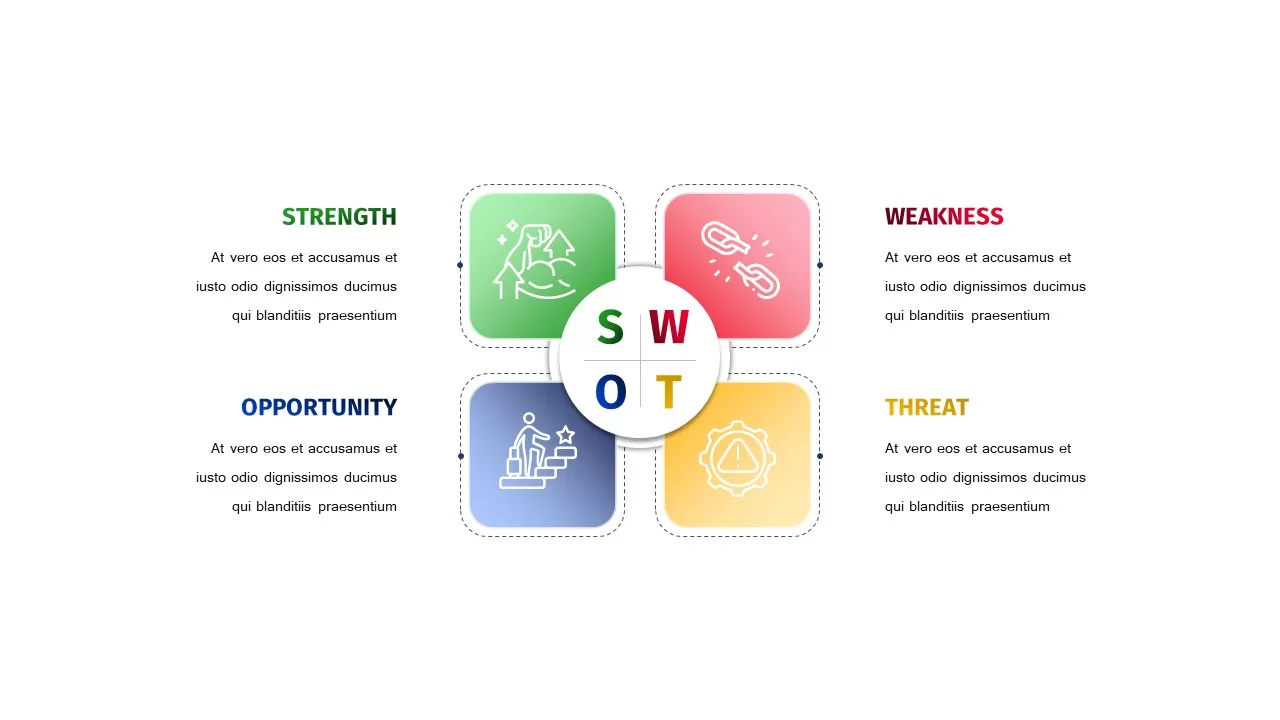
Four-Quadrant SWOT Analysis Diagram Template for PowerPoint & Google Slides
SWOT
Interactive 3D Puzzle SWOT Analysis Slide Template for PowerPoint & Google Slides
SWOT
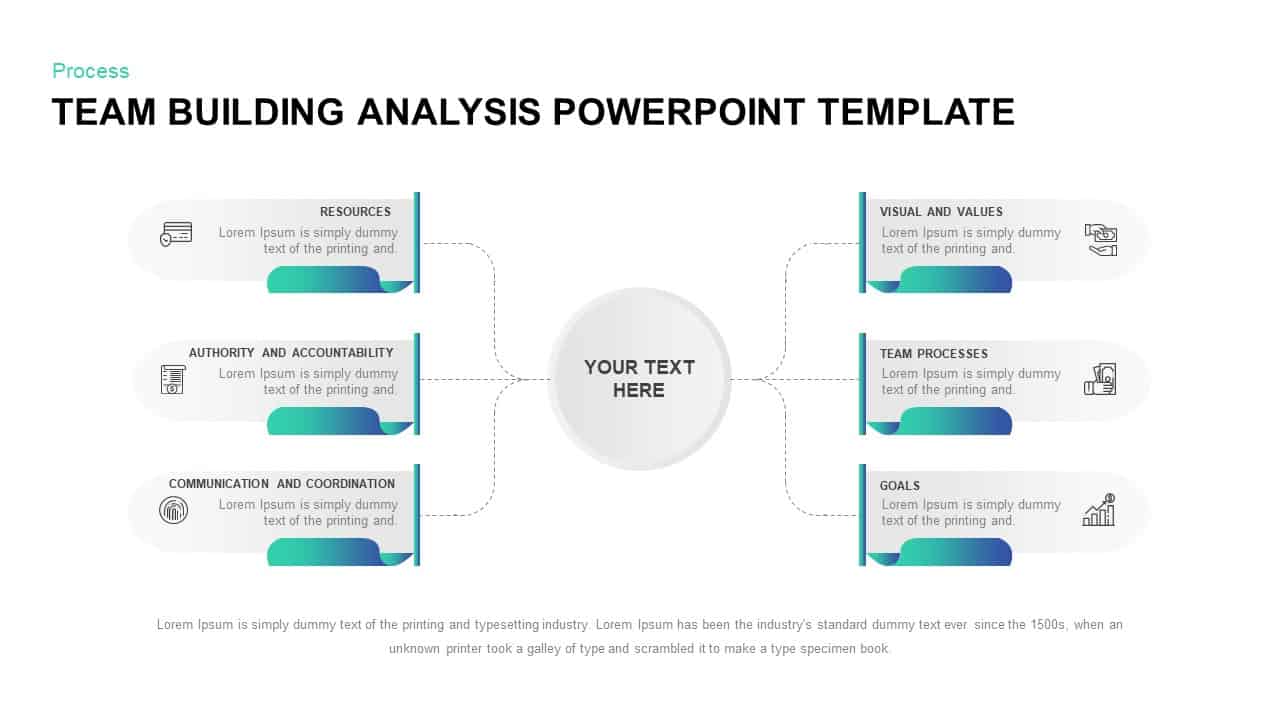
Team Building Hub-and-Spoke Analysis Template for PowerPoint & Google Slides
Process
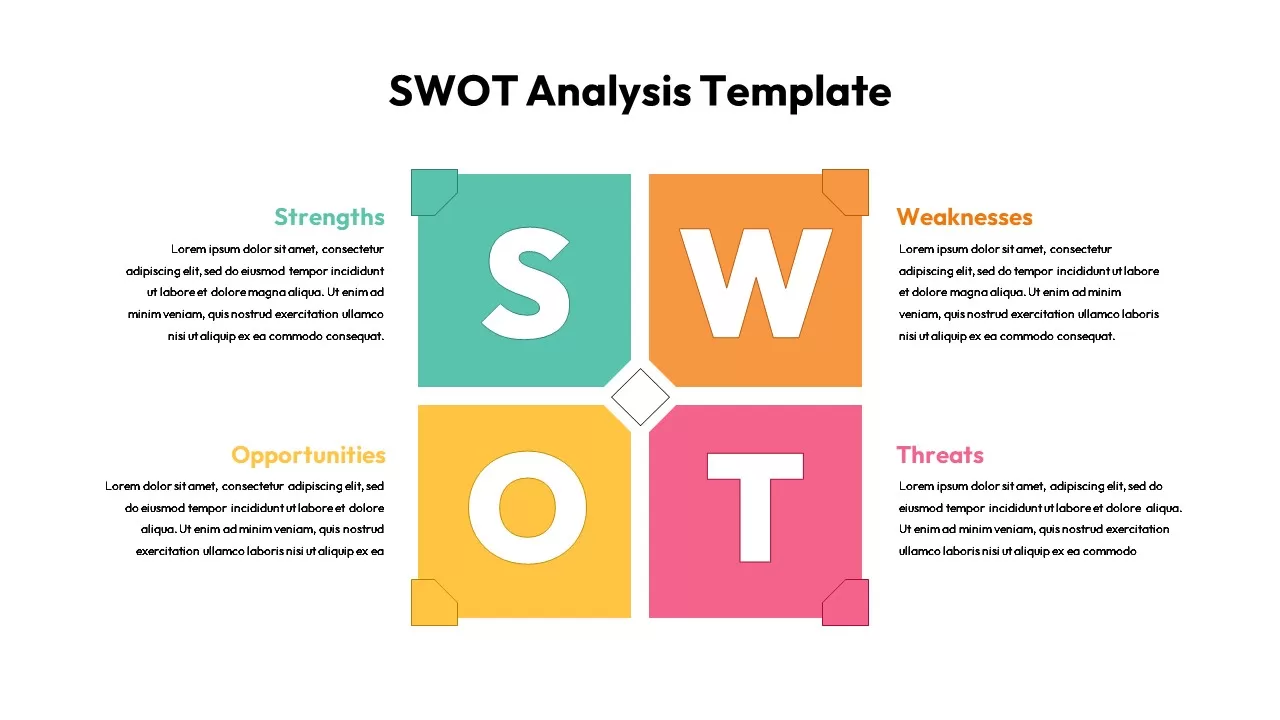
Four-Part SWOT Analysis Diagram Template for PowerPoint & Google Slides
SWOT
Illustrated Business SWOT Analysis Template for PowerPoint & Google Slides
SWOT
Fishbone Cause Analysis Diagram Template for PowerPoint & Google Slides
Process

Break-Even Analysis template for PowerPoint & Google Slides
Process
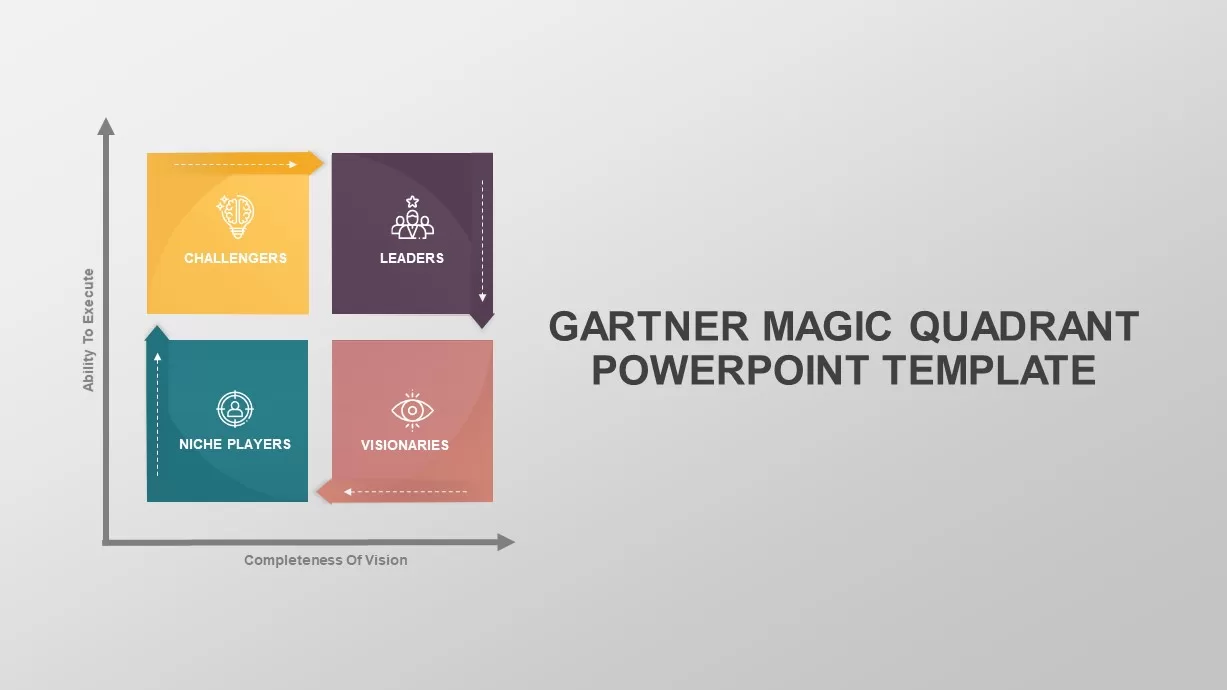
Gartner Magic Quadrant Analysis Template for PowerPoint & Google Slides
Business
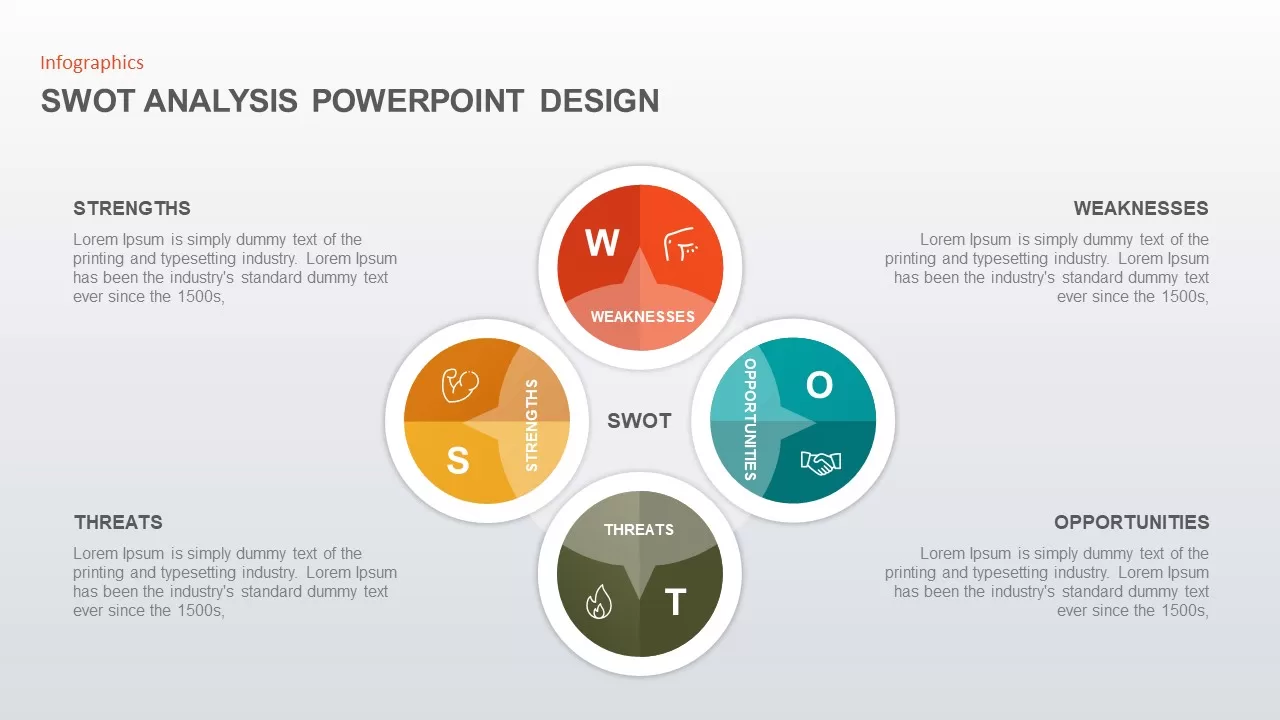
SWOT Analysis Circular Infographic Template for PowerPoint & Google Slides
SWOT
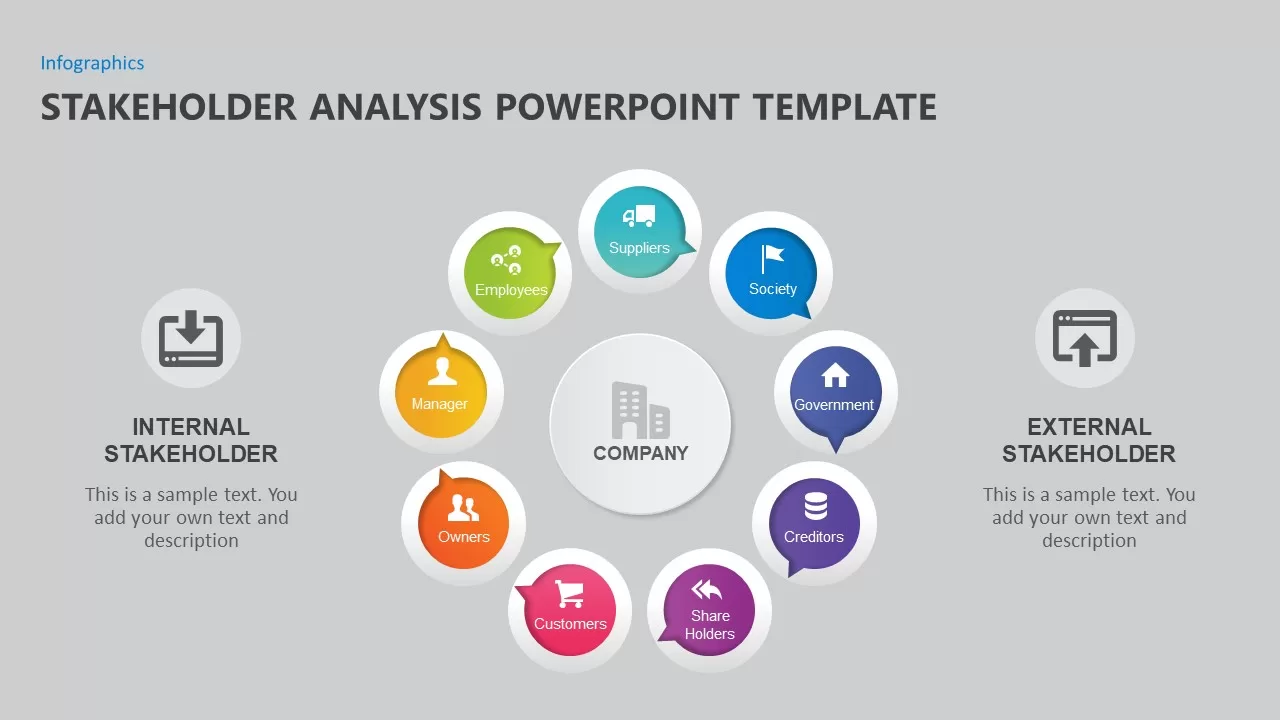
Stakeholder Analysis Template for PowerPoint & Google Slides
Business
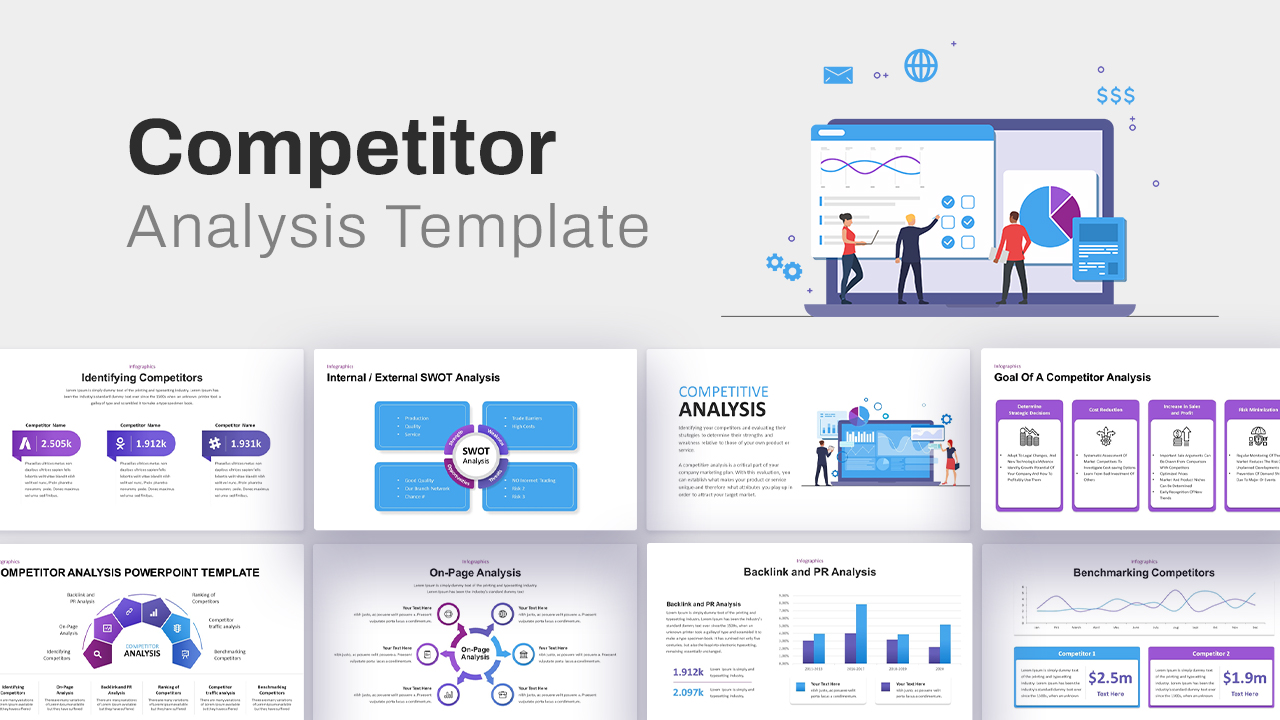
Comprehensive Competitor Analysis Template for PowerPoint & Google Slides
Competitor Analysis
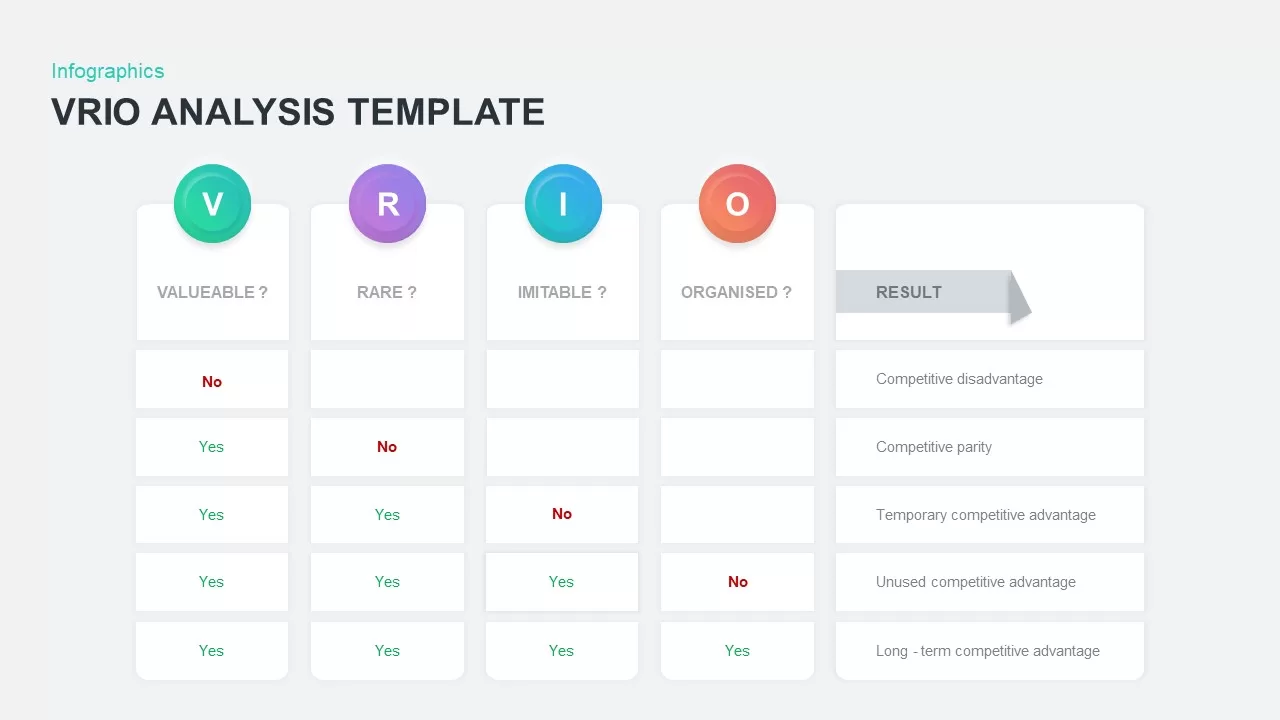
VRIO Analysis Infographic Template for PowerPoint & Google Slides
Business Strategy
IQ Scale Analysis Diagram template for PowerPoint & Google Slides
Employee Performance
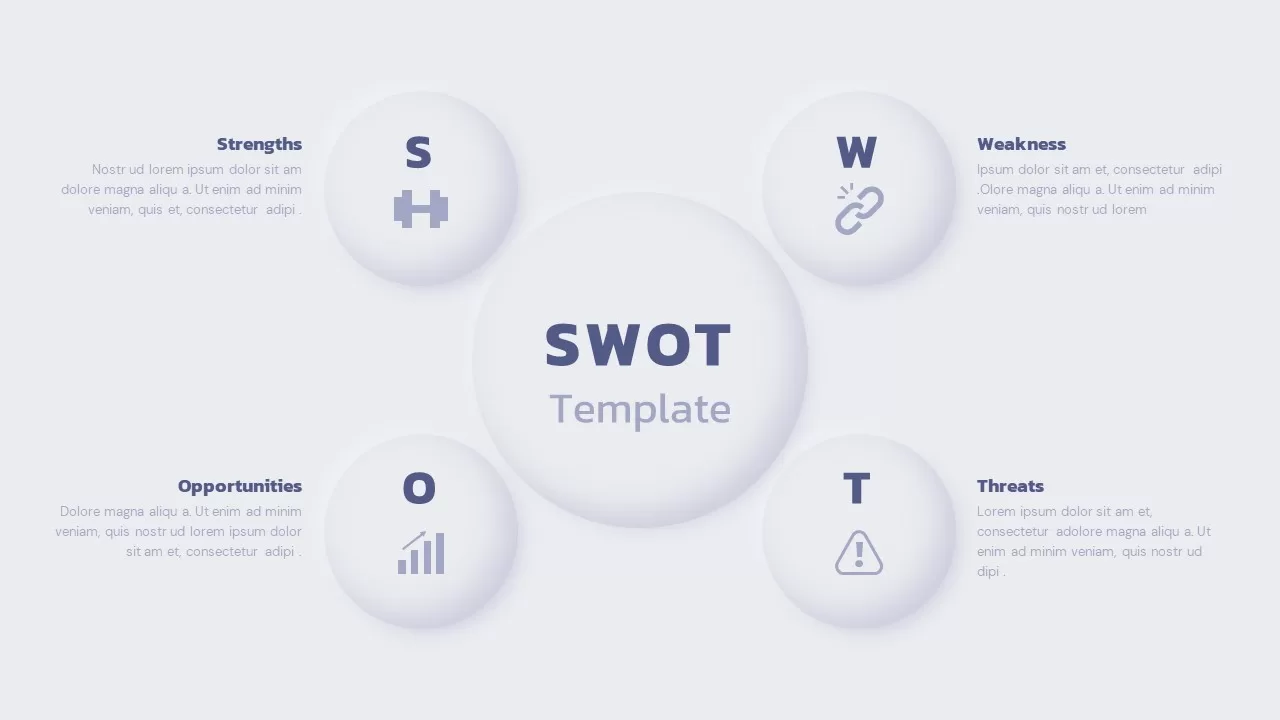
SWOT Analysis Grid Infographic Template for PowerPoint & Google Slides
SWOT
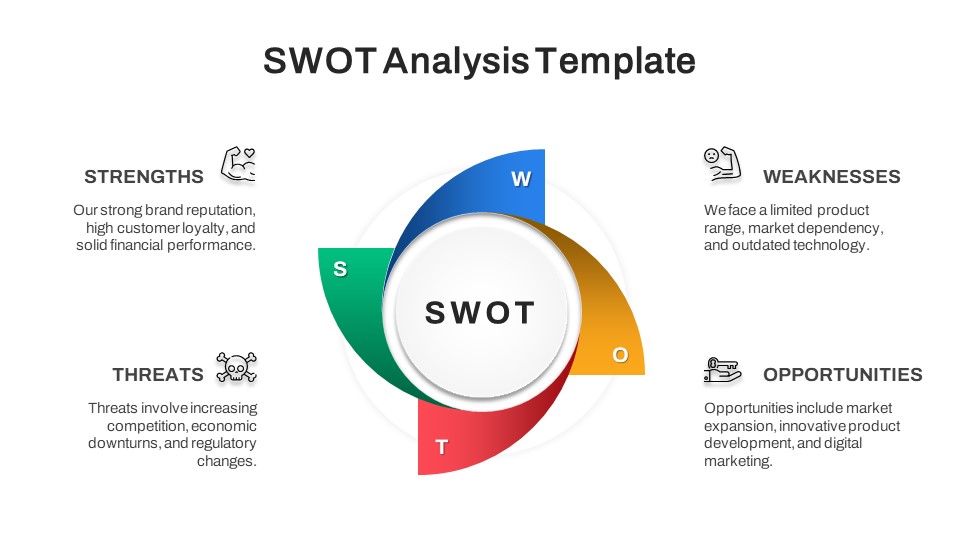
Circular SWOT Analysis Infographic Template for PowerPoint & Google Slides
SWOT
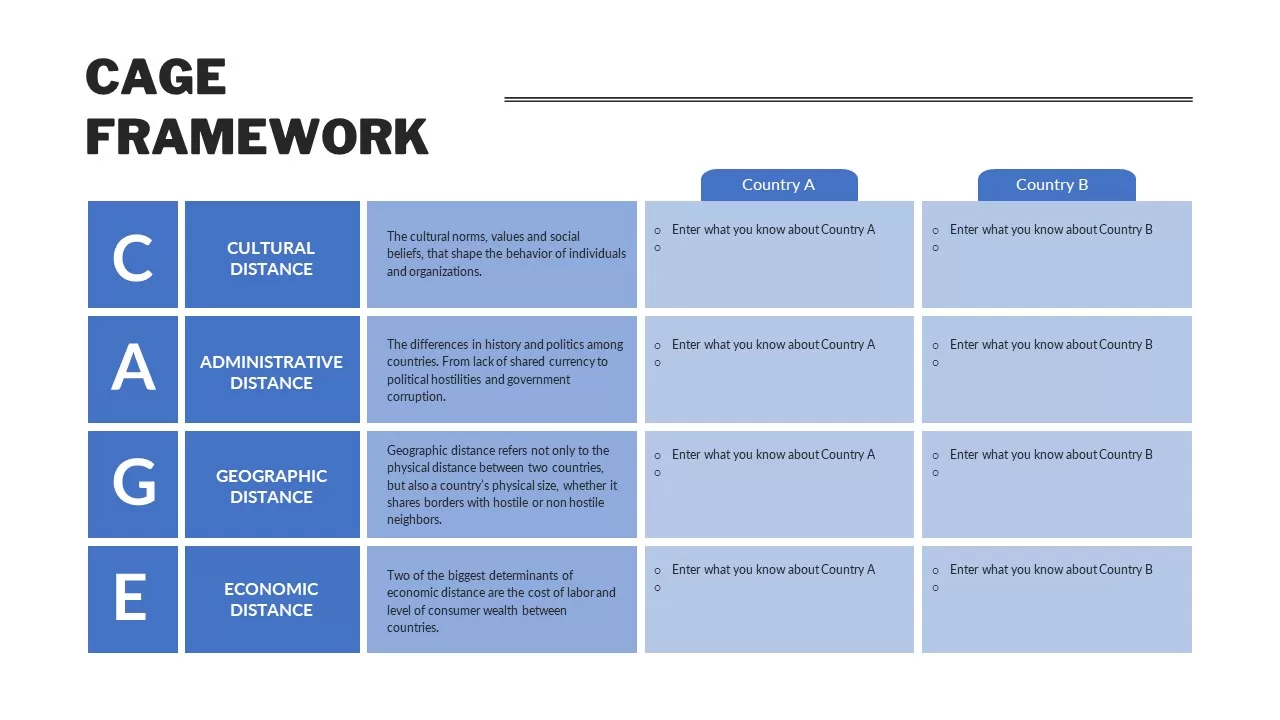
CAGE Distance Analysis Framework Template for PowerPoint & Google Slides
Competitor Analysis
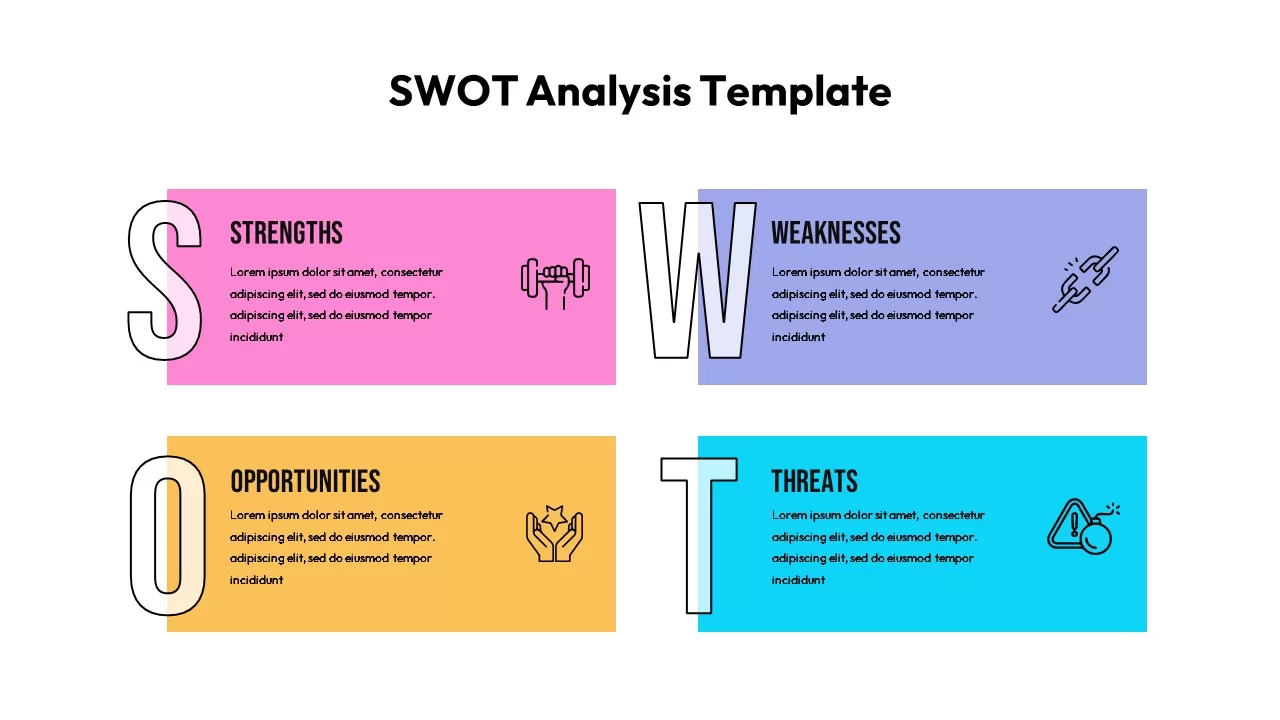
Modern Colorful SWOT Quadrant Analysis Template for PowerPoint & Google Slides
SWOT
Colorful SWOT Analysis Quadrant Template for PowerPoint & Google Slides
SWOT
Colorful Vertical SWOT Analysis Layout Template for PowerPoint & Google Slides
SWOT
Root Cause Analysis Infographic Pack Template for PowerPoint & Google Slides
Process
SWOT Analysis Overview template for PowerPoint & Google Slides
Business
SWOT Analysis Quadrant template for PowerPoint & Google Slides
Business Strategy
SWOT Analysis Blocks template for PowerPoint & Google Slides
Business Strategy
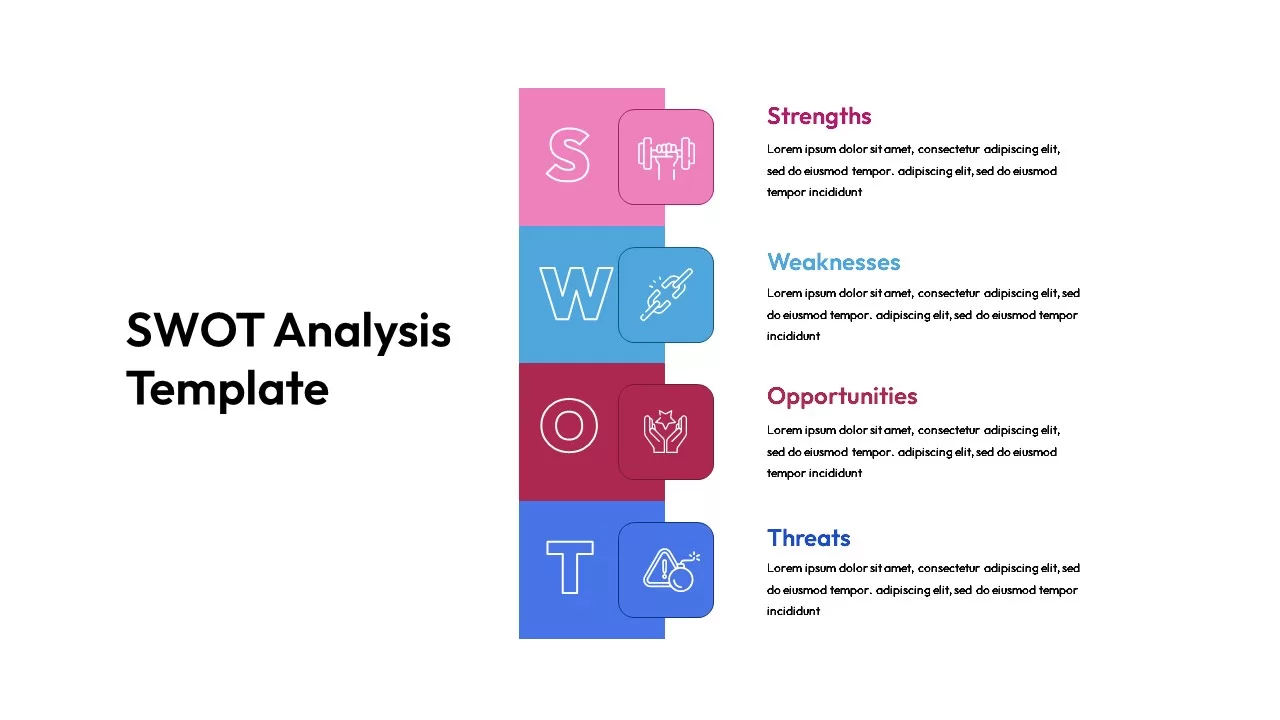
SWOT Analysis Template for PowerPoint & Google Slides
Business Strategy

Free SWOT Analysis Template for PowerPoint & Google Slides
SWOT
Free
SWOT Analysis template for PowerPoint & Google Slides
SWOT
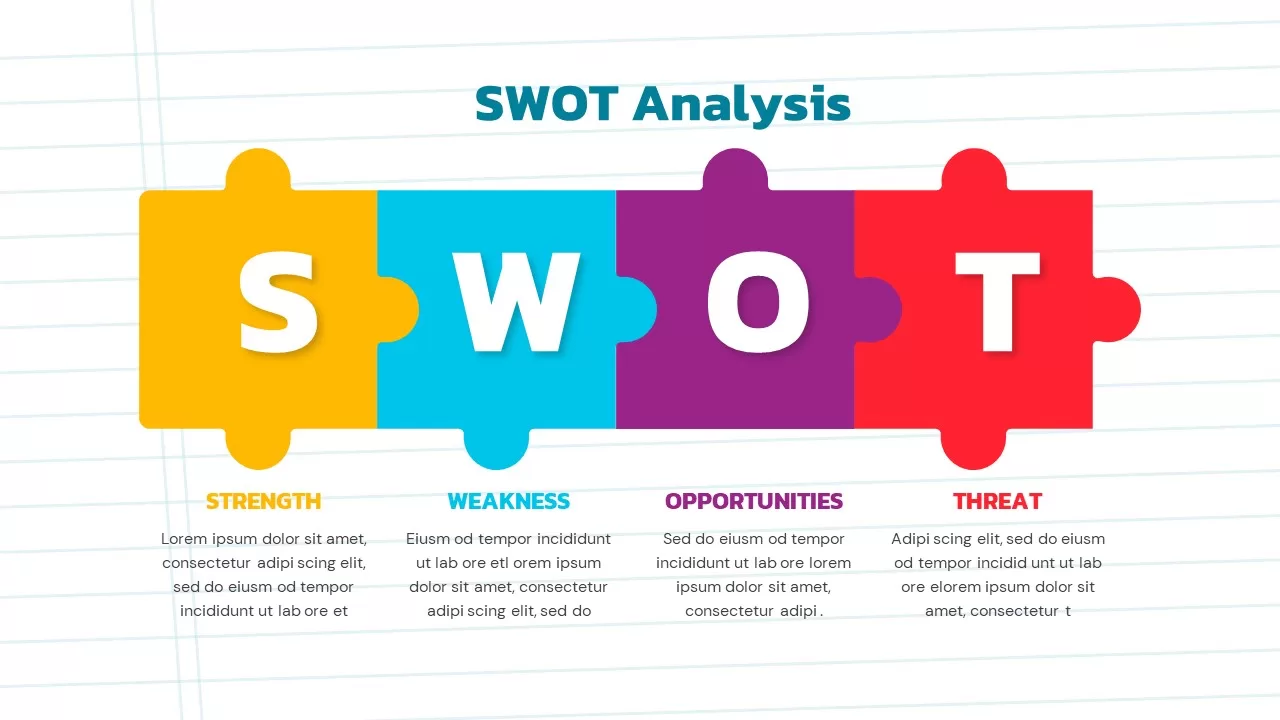
Puzzle Piece SWOT Analysis Diagram Template for PowerPoint & Google Slides
Opportunities Challenges
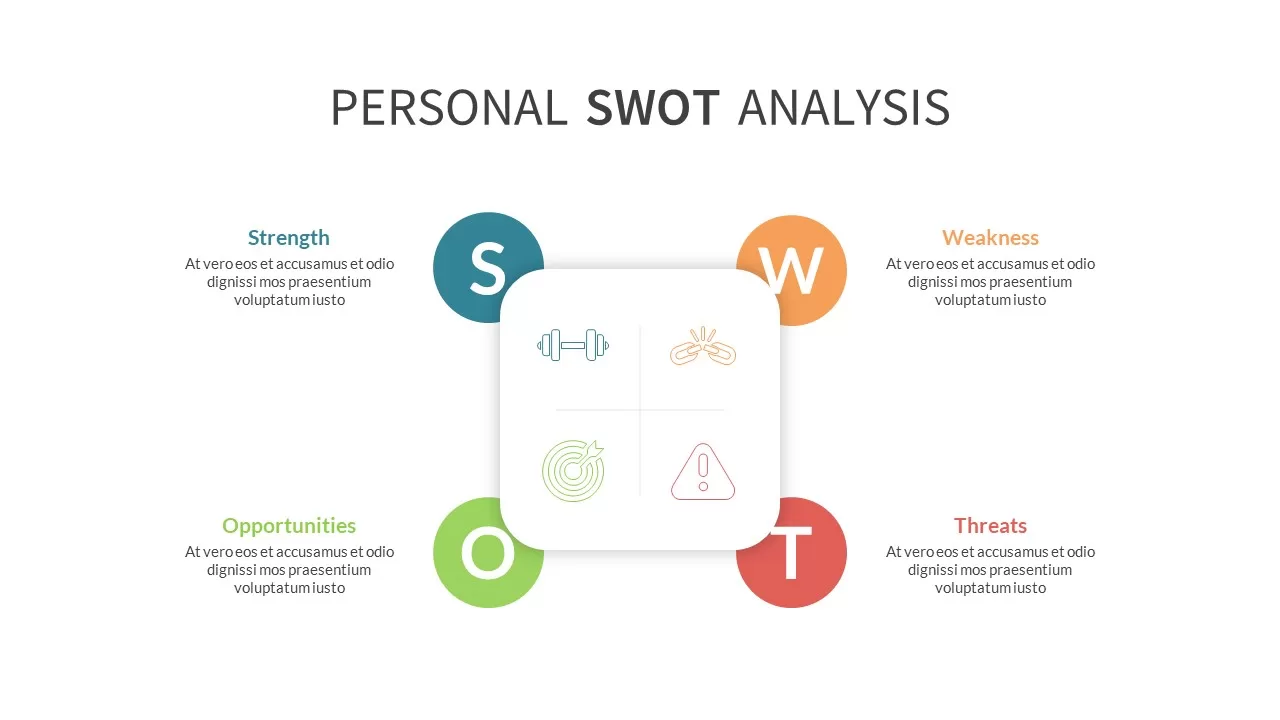
Photo Personal SWOT Analysis Callouts Template for PowerPoint & Google Slides
SWOT
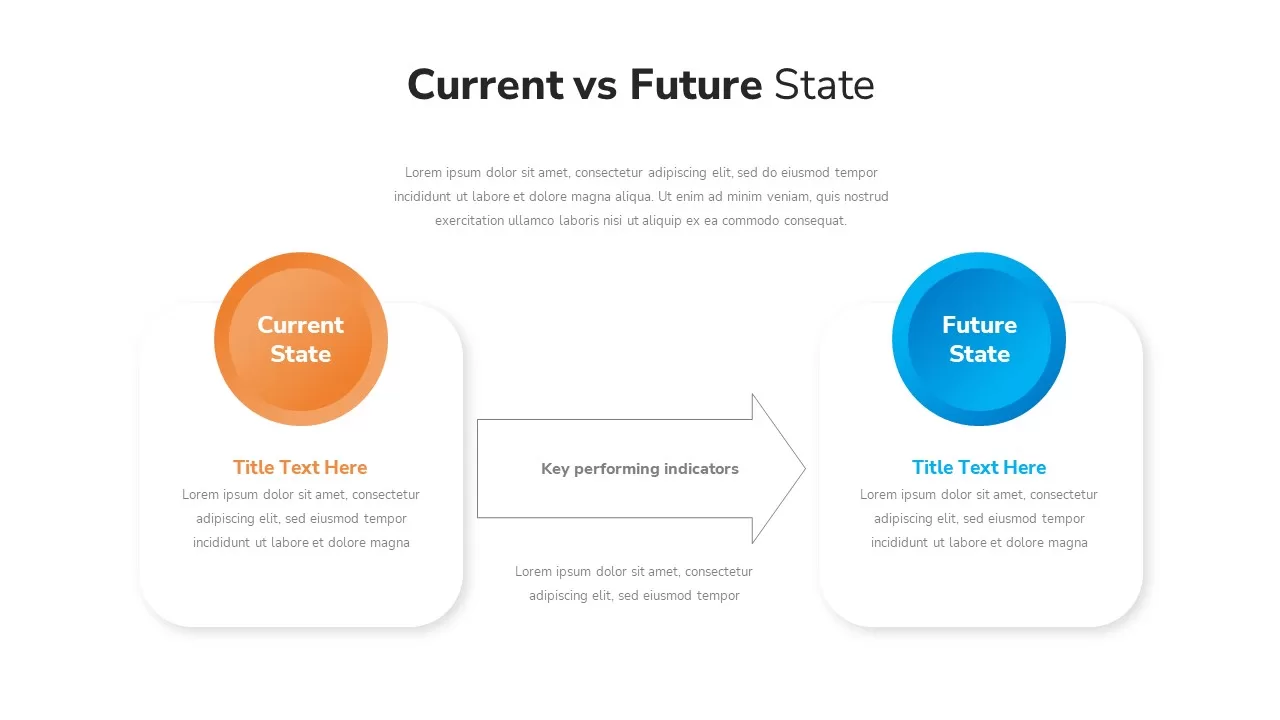
Current vs Future State Analysis template for PowerPoint & Google Slides
Comparison
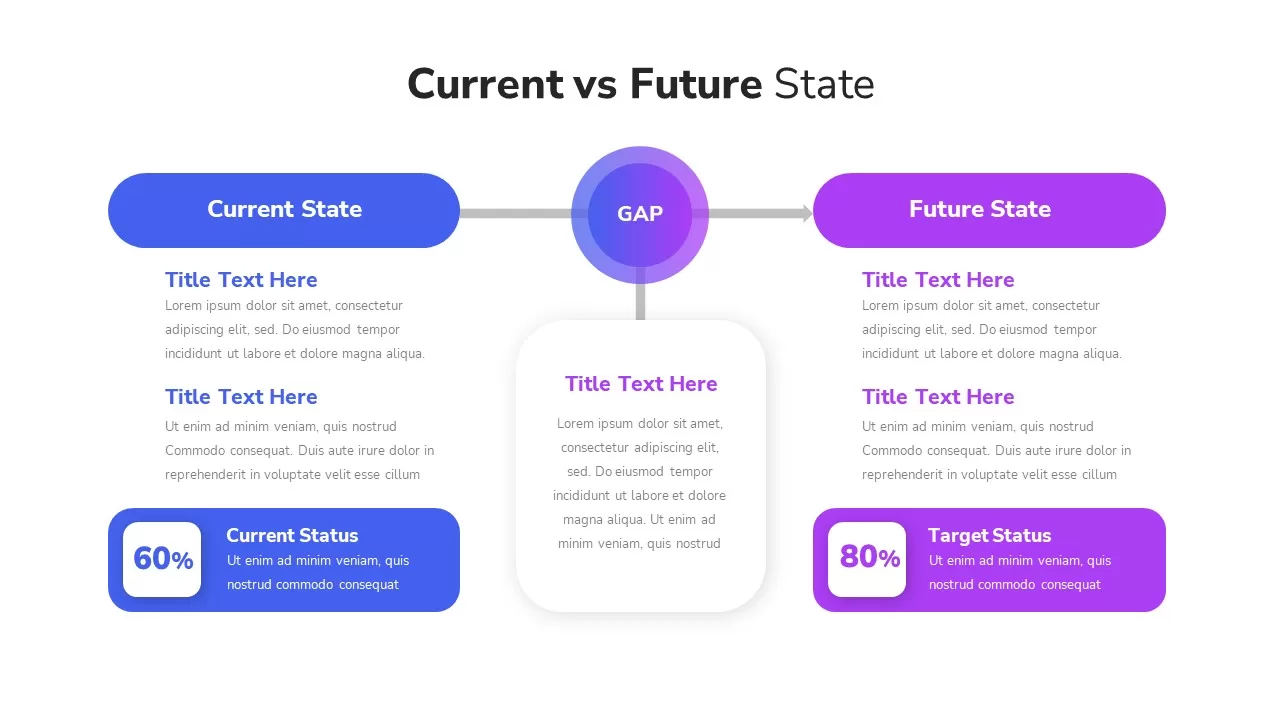
Current vs Future State Gap Analysis template for PowerPoint & Google Slides
Comparison
Dual-Color Cost vs Benefit Analysis Template for PowerPoint & Google Slides
Comparison
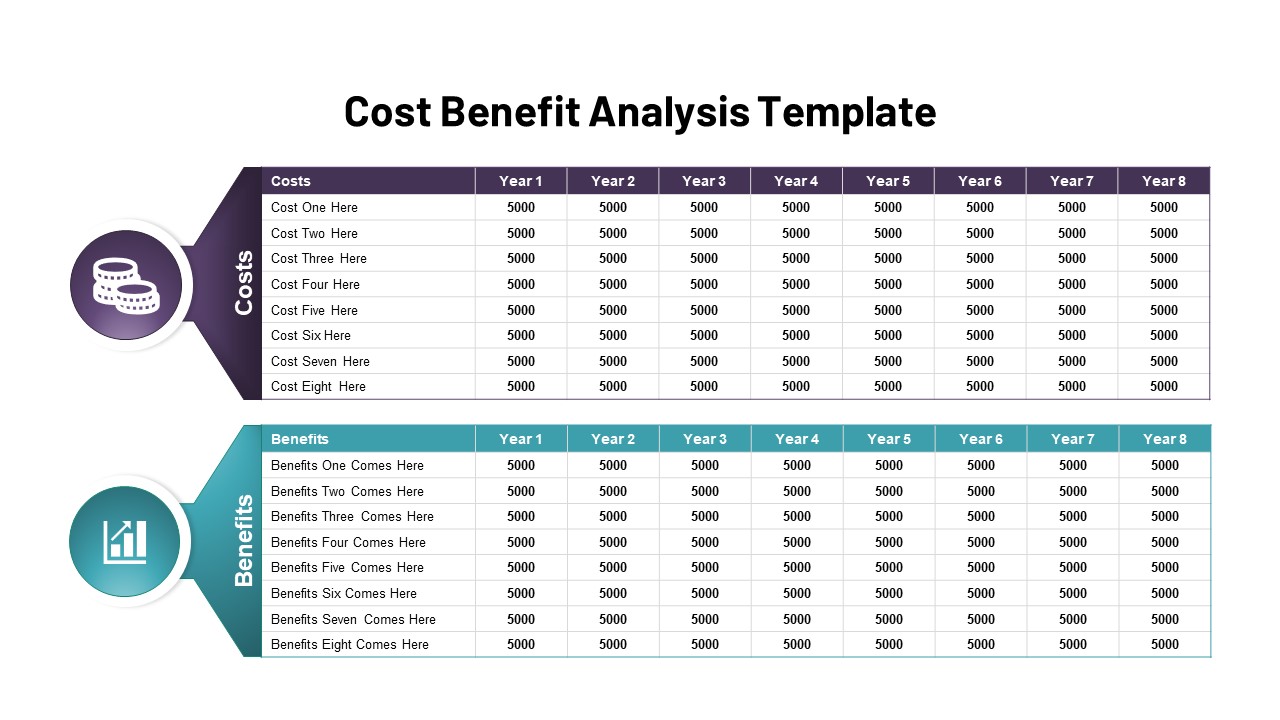
Cost Benefit Analysis Comparison Template for PowerPoint & Google Slides
Comparison
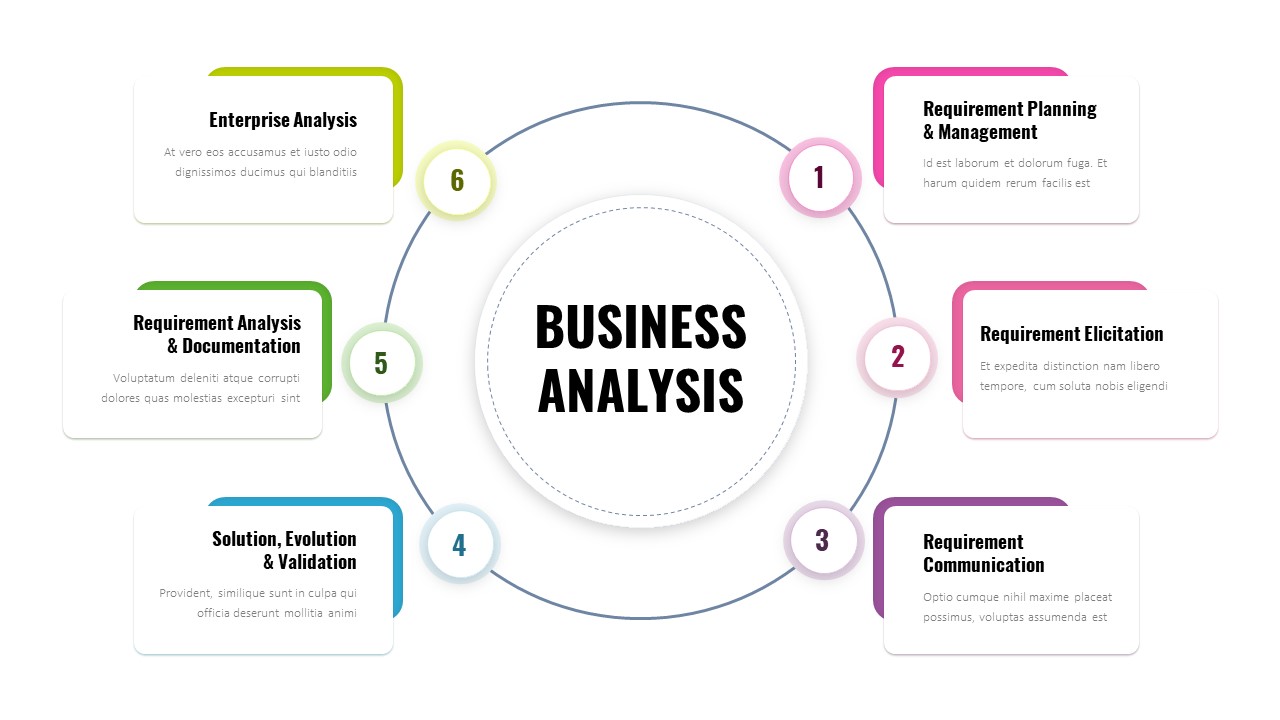
Six-Step Business Analysis Template for PowerPoint & Google Slides
Process
Vendor Comparison Analysis template for PowerPoint & Google Slides
Comparison Chart
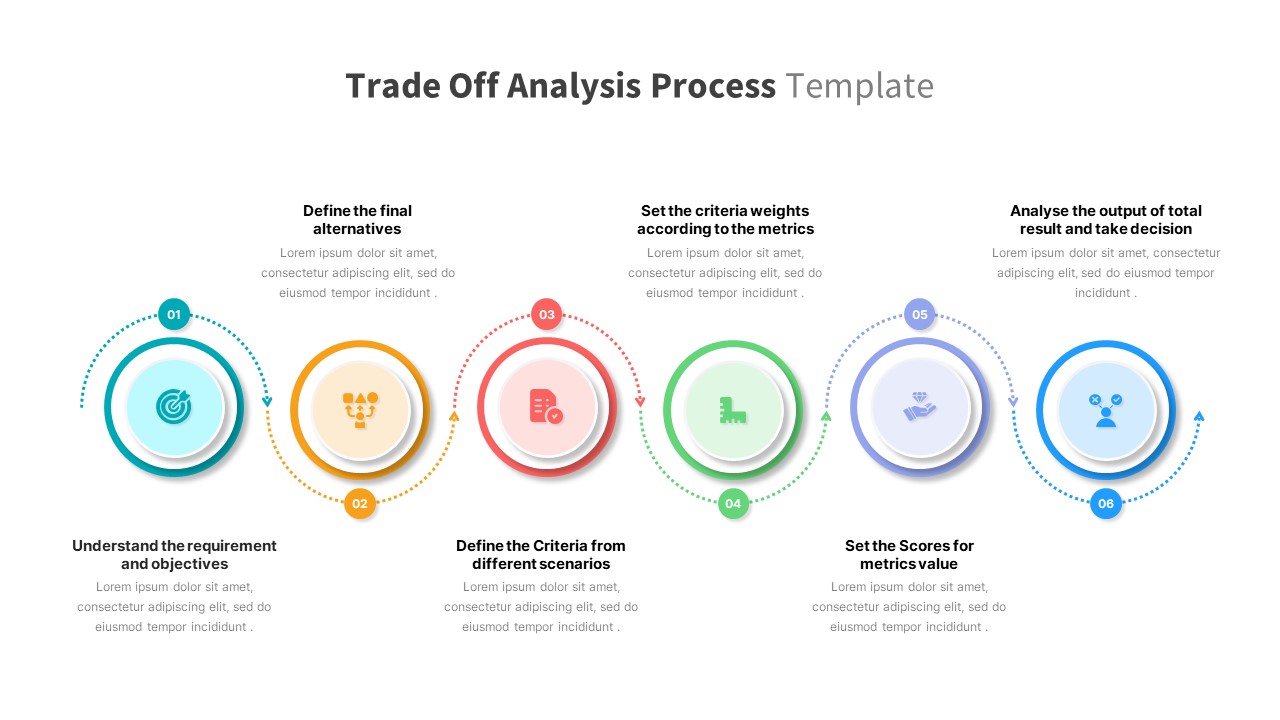
Trade Off Analysis Process template for PowerPoint & Google Slides
Process
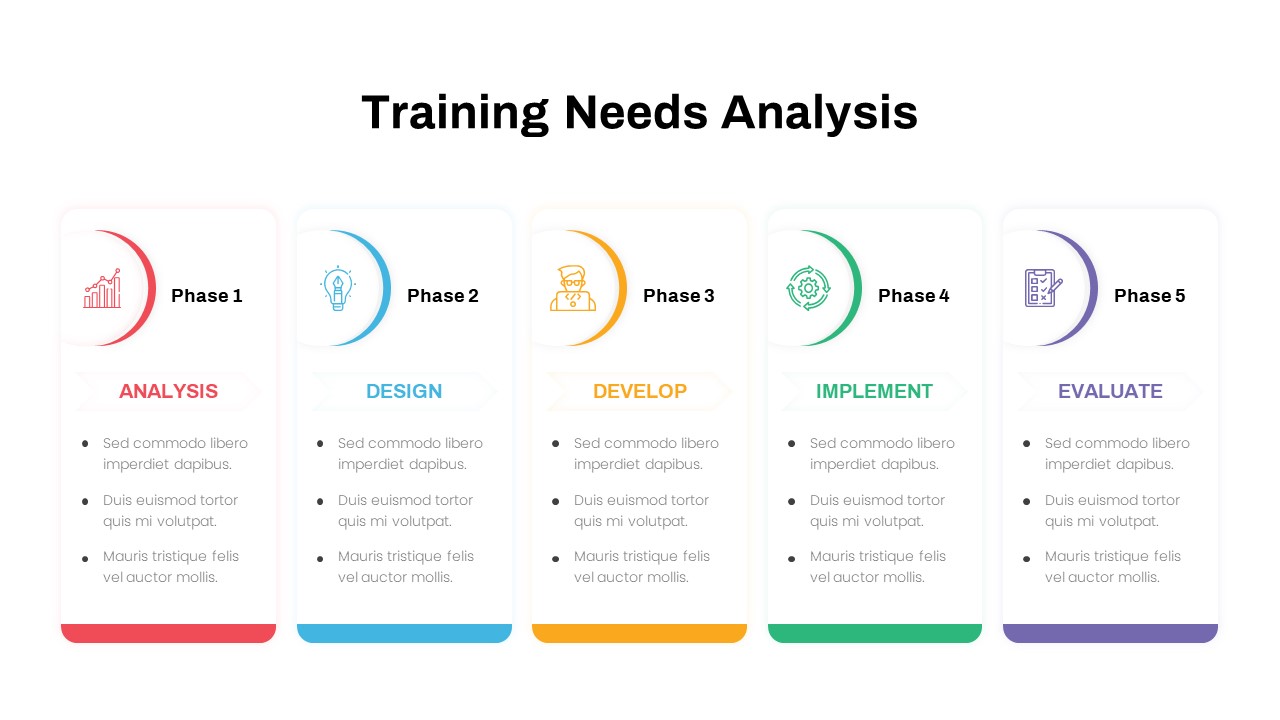
Training Needs Analysis Process Template for PowerPoint & Google Slides
Employee Performance
Business Process Analysis Cycle Diagram Template for PowerPoint & Google Slides
Business Strategy
Simple Area Chart Data Trends Analysis Template for PowerPoint & Google Slides
Comparison Chart
Free Root Cause Analysis Fishbone Diagram Template for PowerPoint & Google Slides
Process
Free
Neon Dark Stock Market Analysis Template for PowerPoint & Google Slides
Pitch Deck
Free
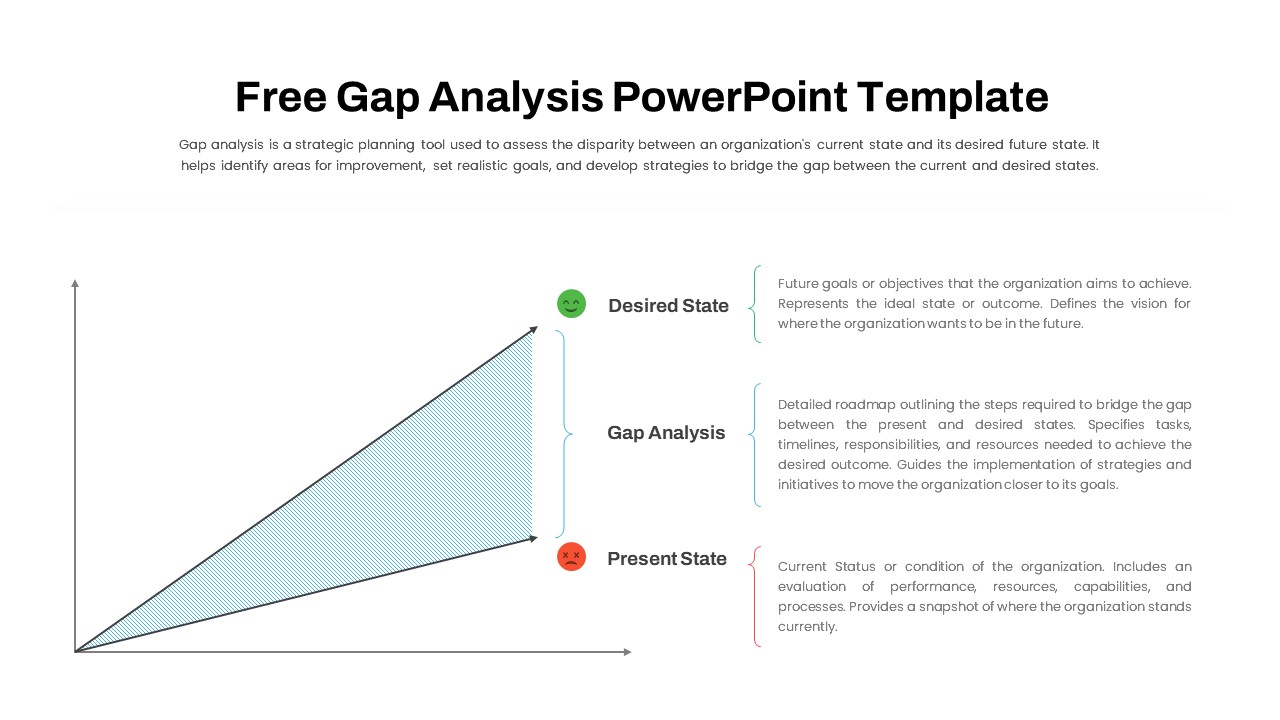
Free Comprehensive Gap Analysis Framework Template for PowerPoint & Google Slides
Opportunities Challenges
Free
Colorful SWOT Analysis Diagram Template for PowerPoint & Google Slides
SWOT
Expanding Margins Analysis Bar Chart Template for PowerPoint & Google Slides
Charts
Annual Growth Trend Analysis Chart template for PowerPoint & Google Slides
Business Report
Dynamic Financial Analysis Line Chart Template for PowerPoint & Google Slides
Finance
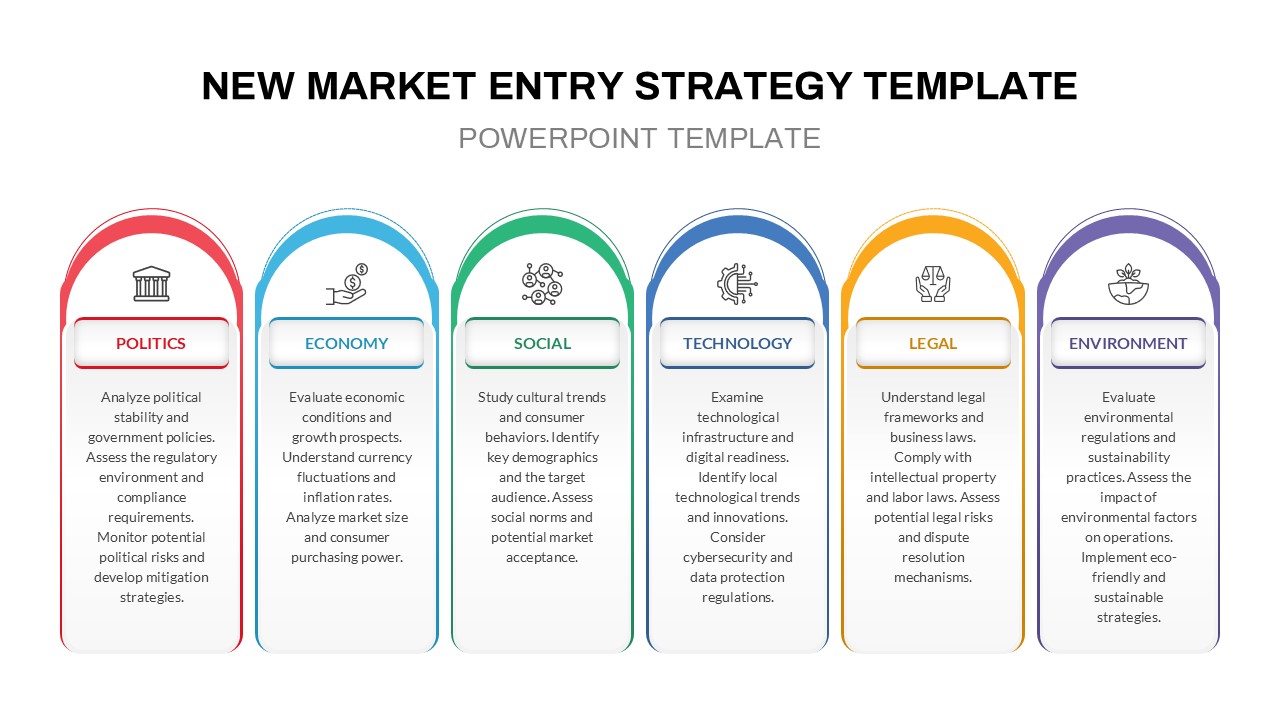
PESTLE Analysis for Market Entry Template for PowerPoint & Google Slides
PEST
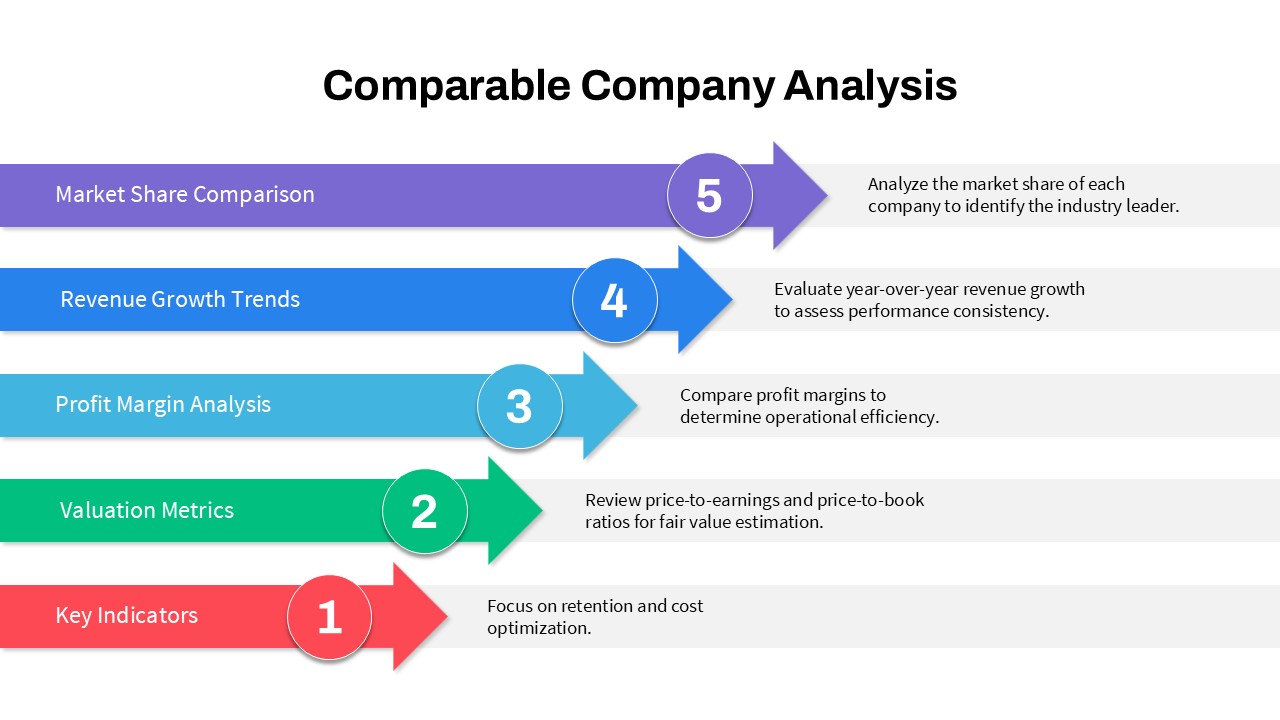
5-Step Comparable Company Analysis Template for PowerPoint & Google Slides
Arrow
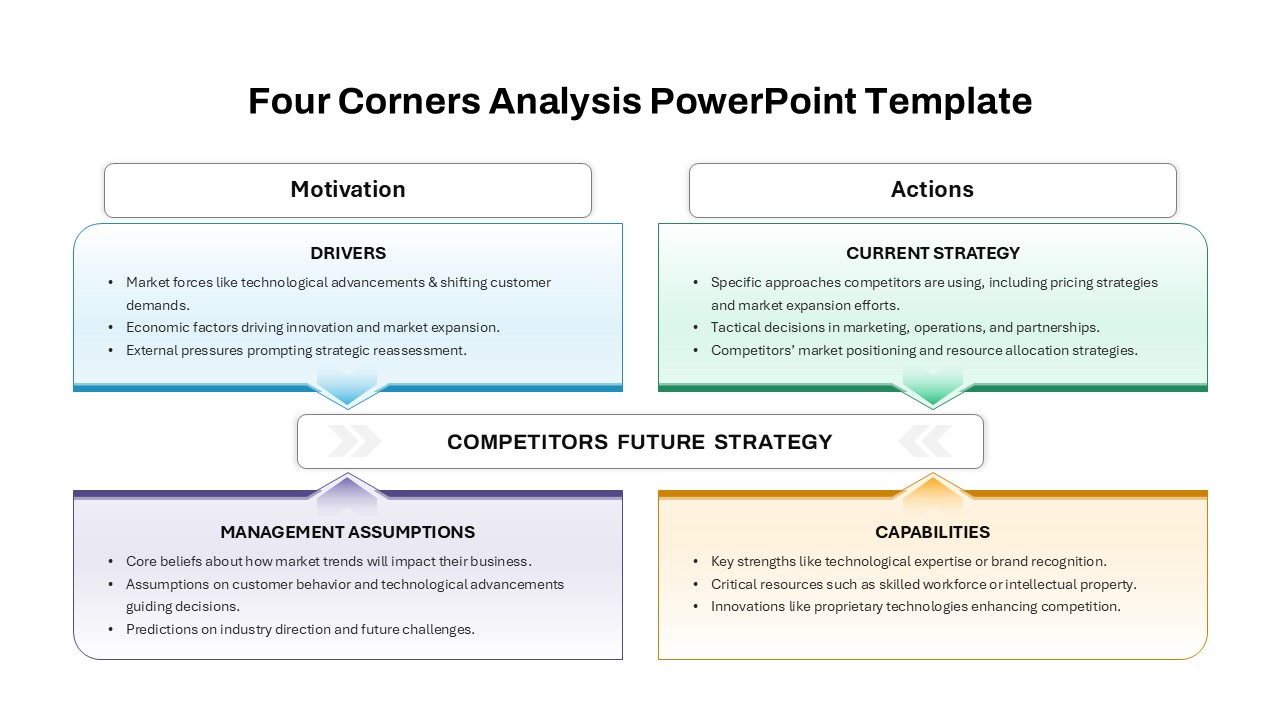
Four-Corners Strategic Analysis Quadrant Template for PowerPoint & Google Slides
SWOT
DESTEP Marketing Analysis Diagram Template for PowerPoint & Google Slides
Circular
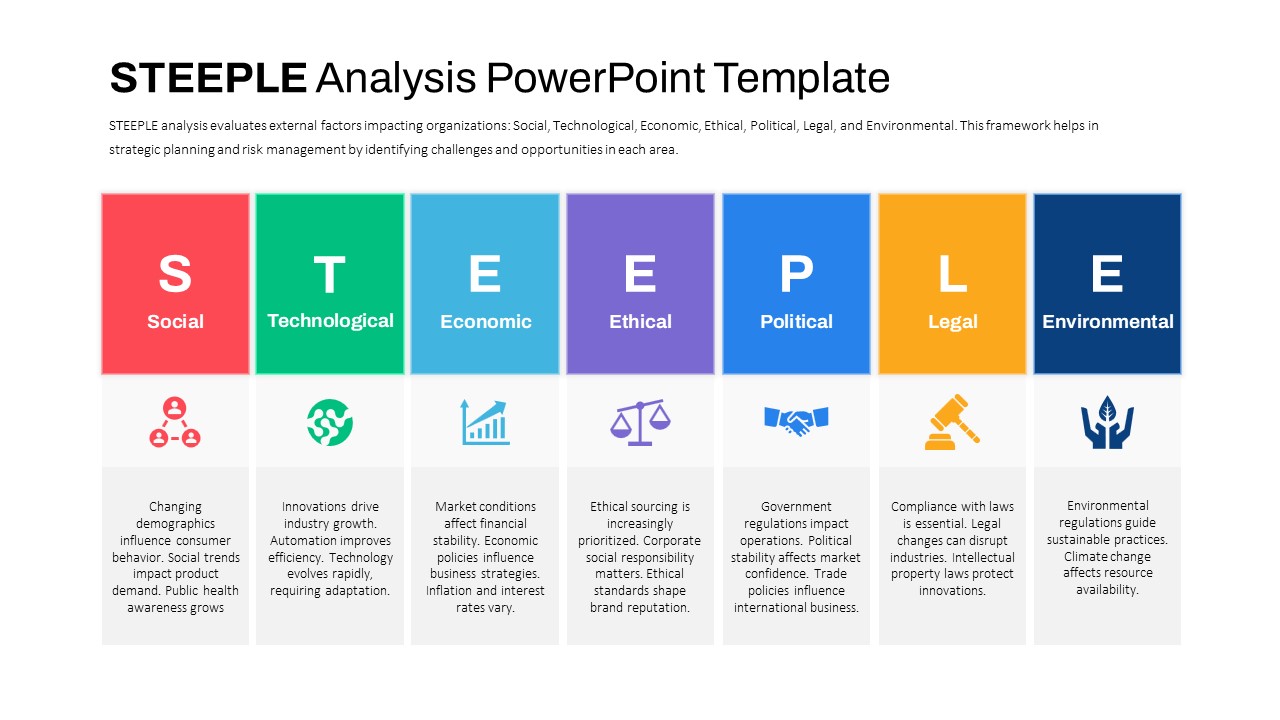
STEEPLE Analysis framework template for PowerPoint & Google Slides
Business Strategy
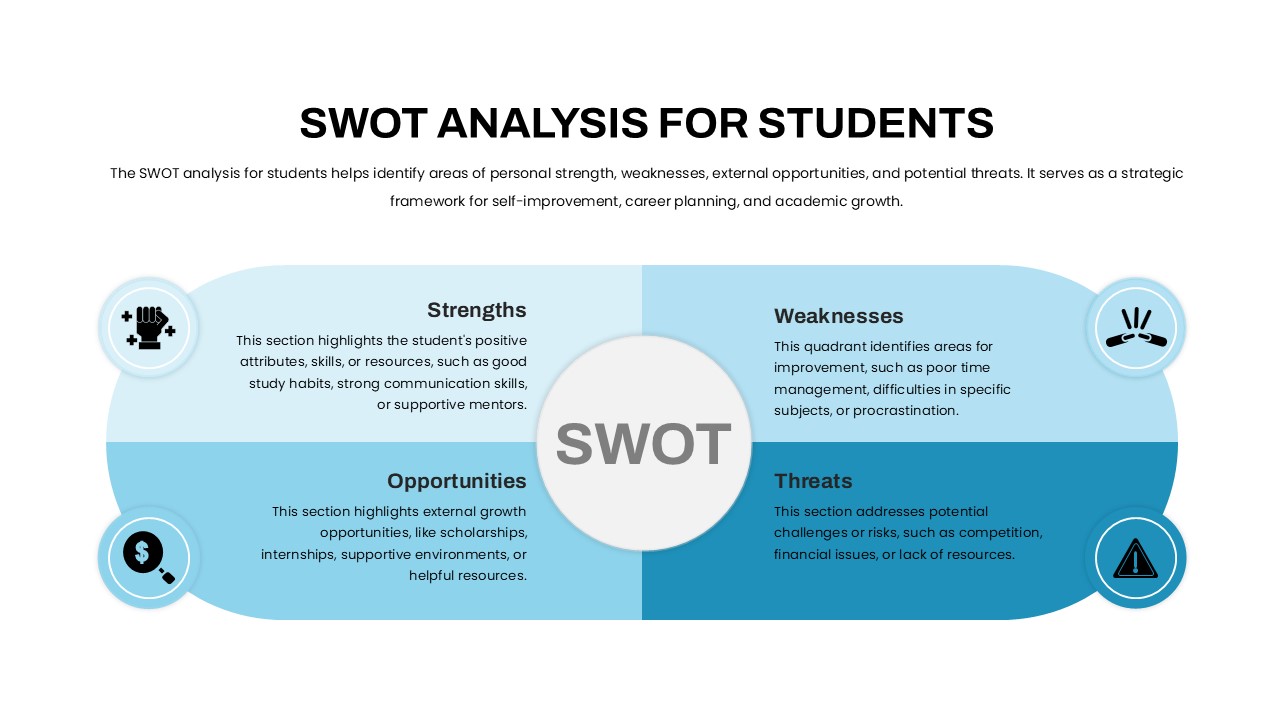
Student SWOT Analysis Framework Template for PowerPoint & Google Slides
SWOT
Two-Box Analysis & Target Comparison Template for PowerPoint & Google Slides
Comparison
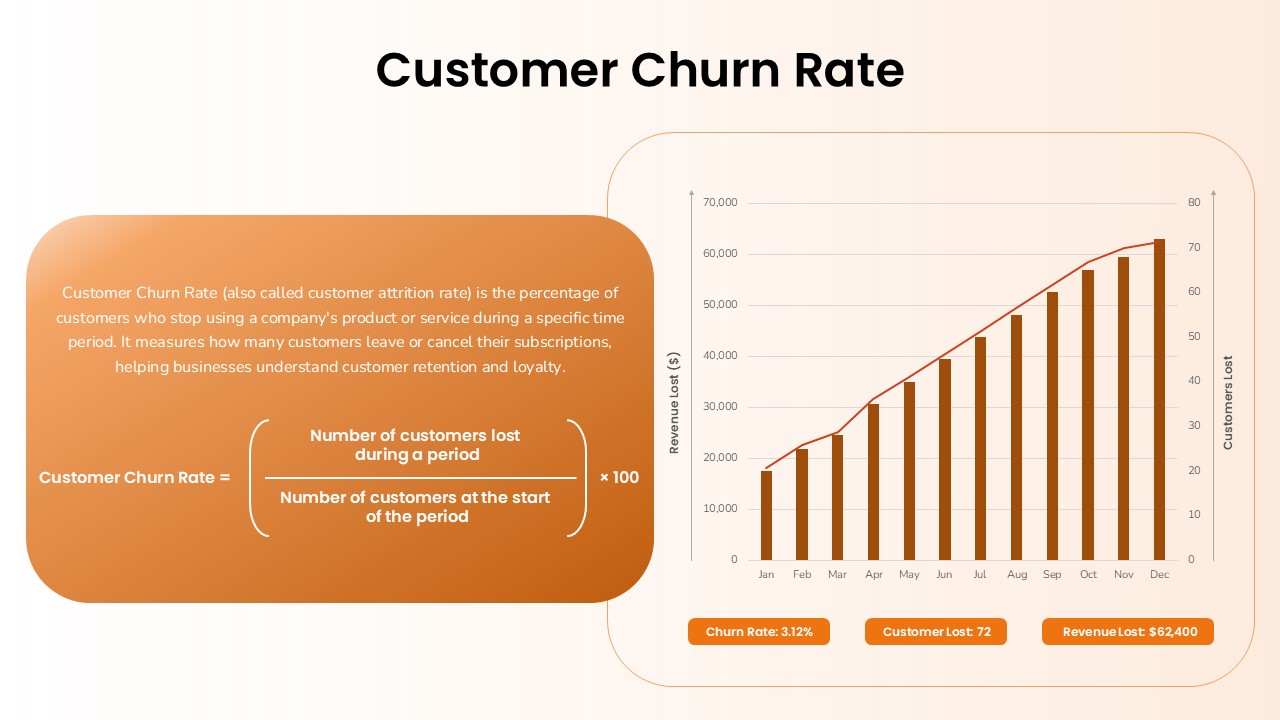
Customer Churn Rate Analysis template for PowerPoint & Google Slides
Business Report
Turnover Analysis Dashboard Template for PowerPoint & Google Slides
Employee Performance
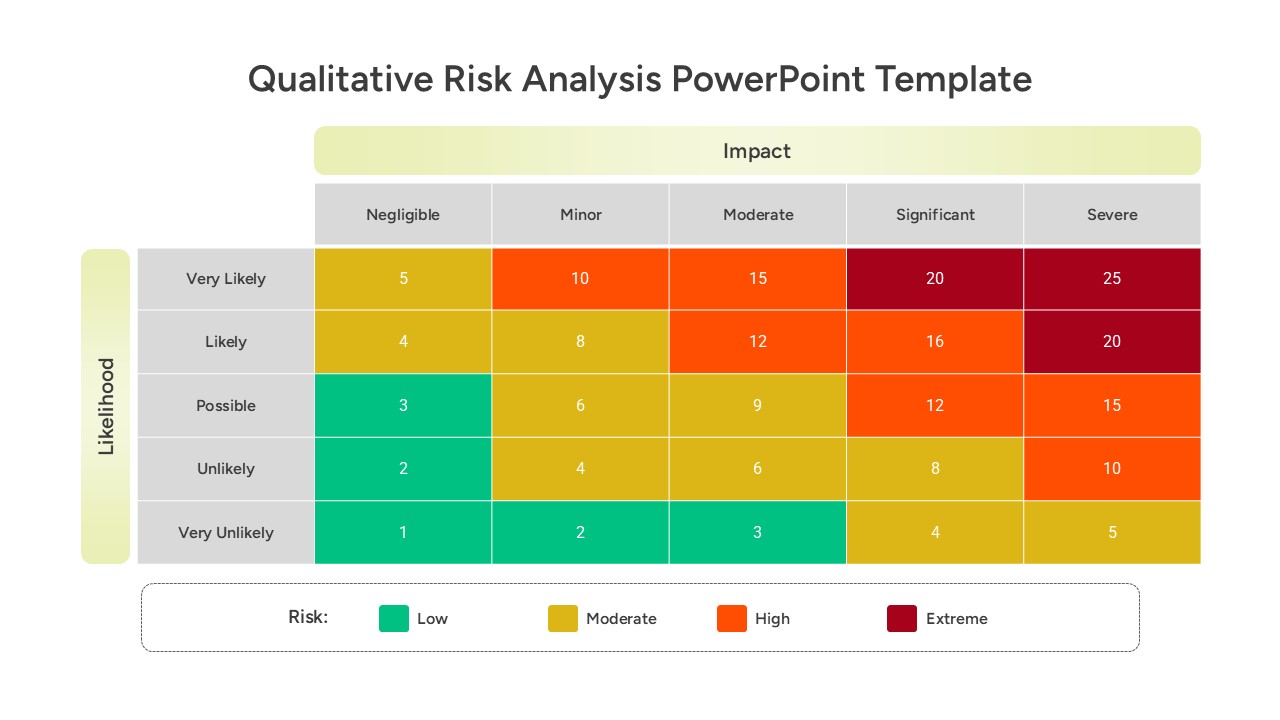
Qualitative Risk Analysis template for PowerPoint & Google Slides
Business
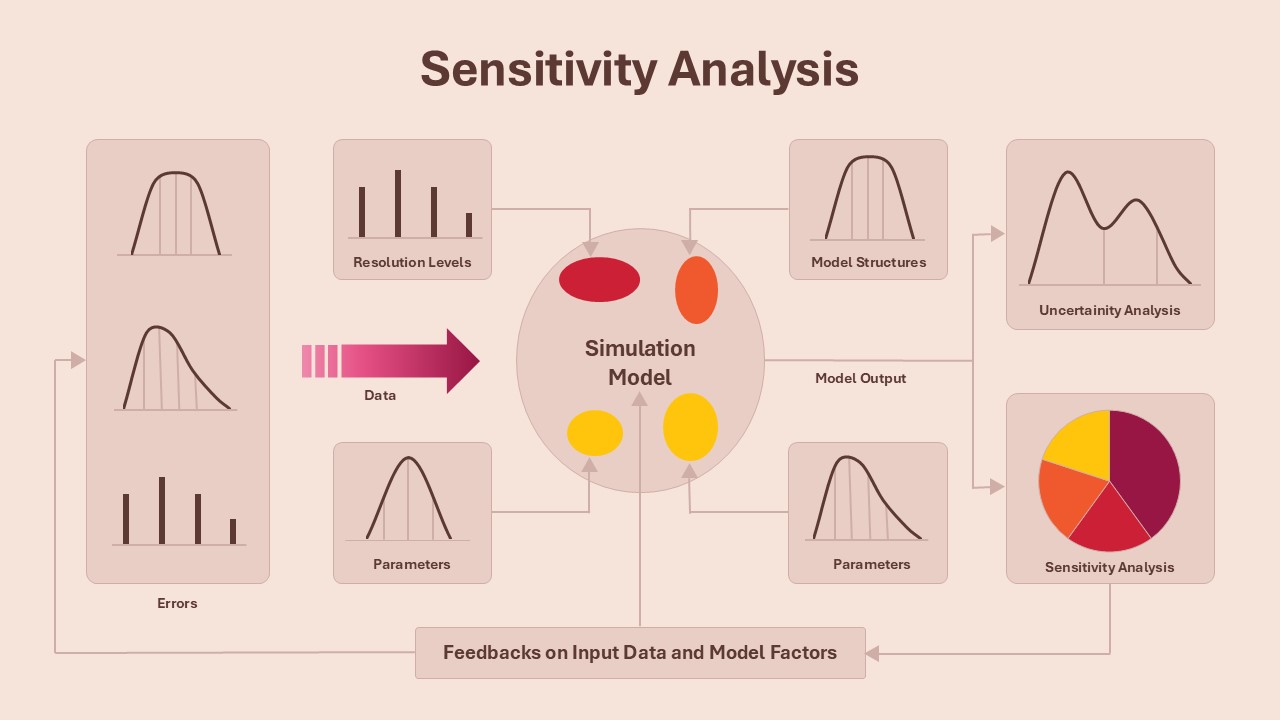
Sensitivity Analysis Framework template for PowerPoint & Google Slides
Business Strategy
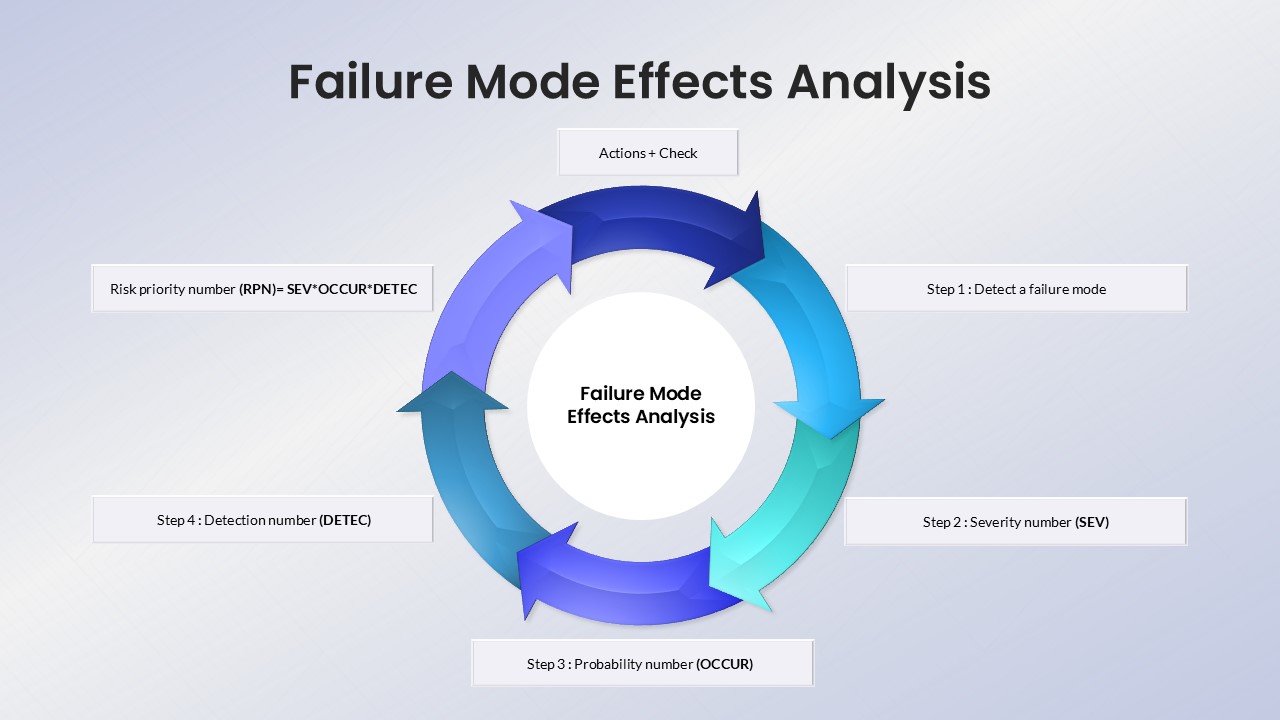
Failure Mode Effects Analysis (FMEA) Slide Template for PowerPoint & Google Slides
Process
Quantitative Risk Analysis Matrix template for PowerPoint & Google Slides
Risk Management
Colorful SWOT Analysis Quadrant Template for PowerPoint & Google Slides
SWOT
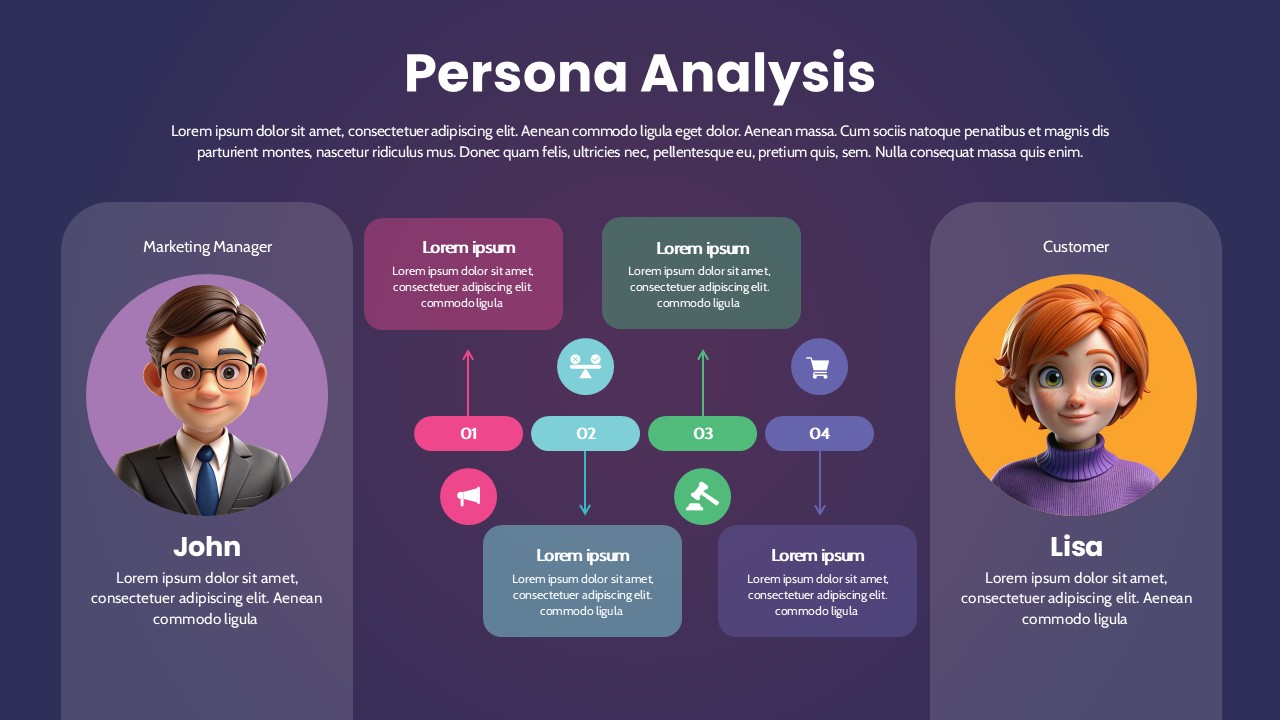
Persona Analysis Template for PowerPoint & Google Slides
Infographics
Blue SWOT Analysis Presentation Template for PowerPoint & Google Slides
SWOT
SWOT Analysis Infographic with Circular Icons Template for PowerPoint & Google Slides
SWOT
Multi Color SWOT Analysis Quadrant Template for PowerPoint & Google Slides
SWOT
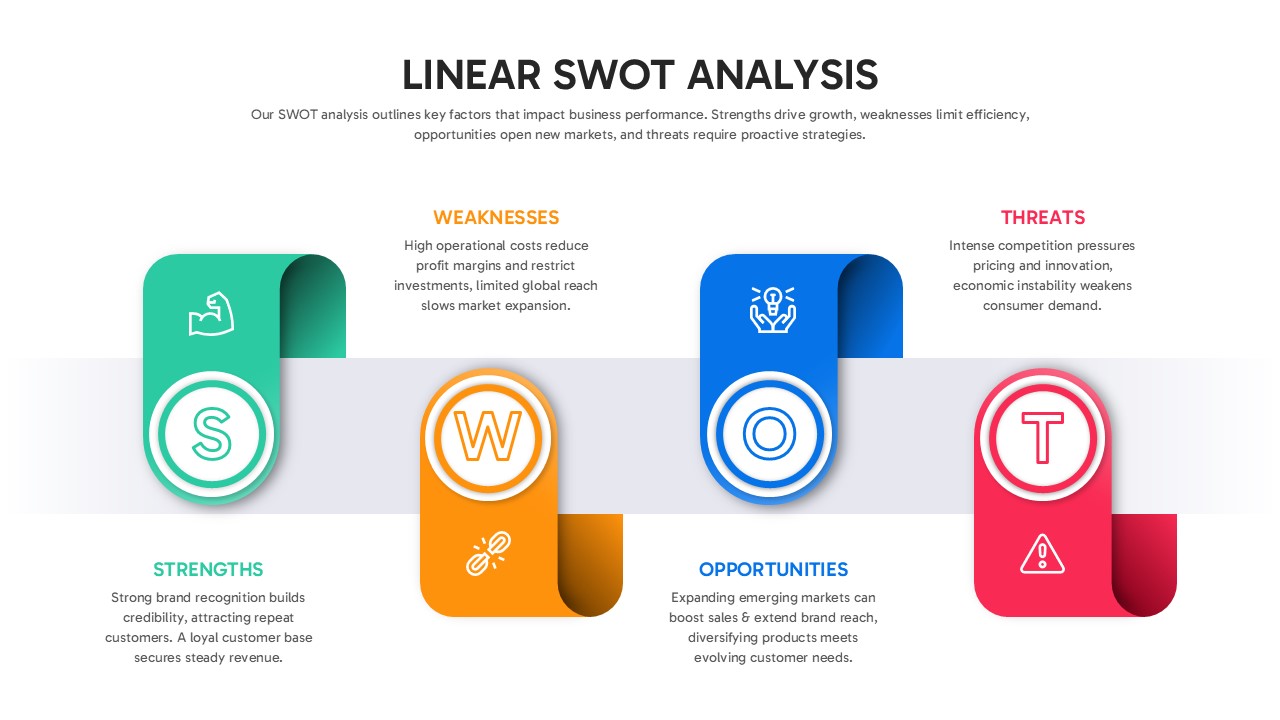
Linear SWOT Analysis Slide Template for PowerPoint & Google Slides
SWOT
Personal SWOT Analysis Matrix Cards Template for PowerPoint & Google Slides
SWOT
Blank SWOT Analysis Template for PowerPoint & Google Slides
SWOT
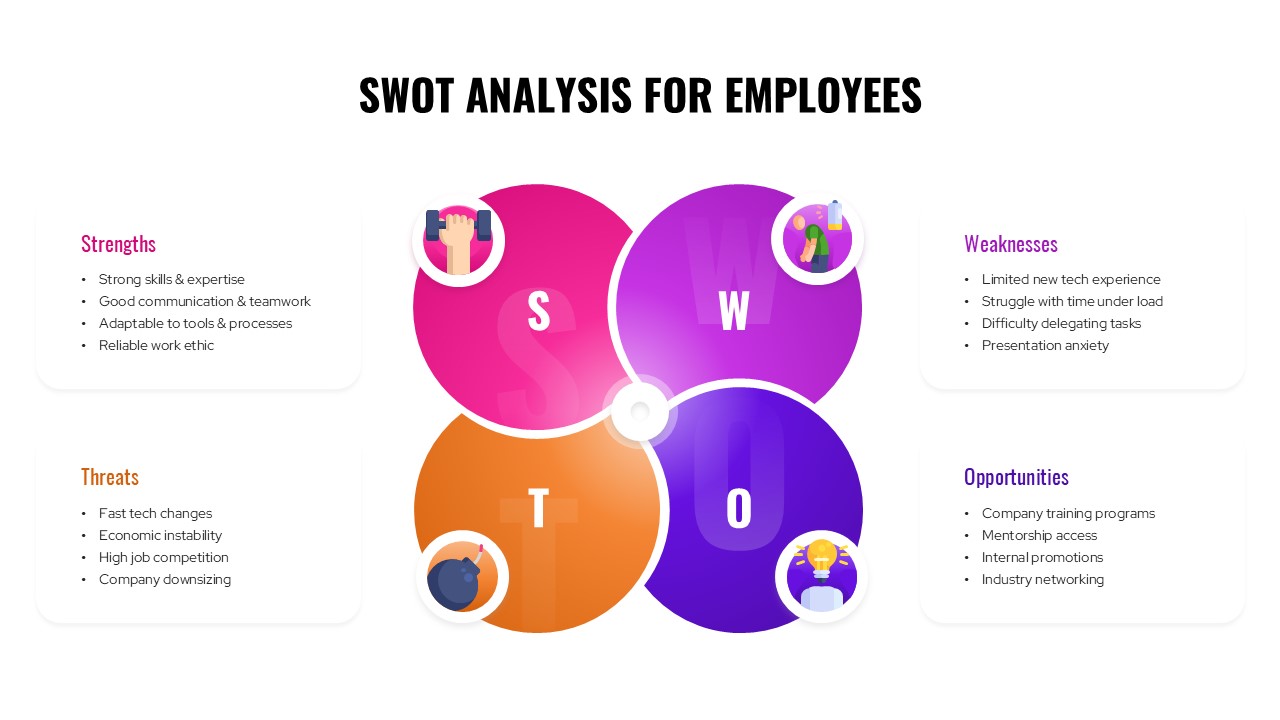
SWOT Analysis For Employees Template for PowerPoint & Google Slides
SWOT
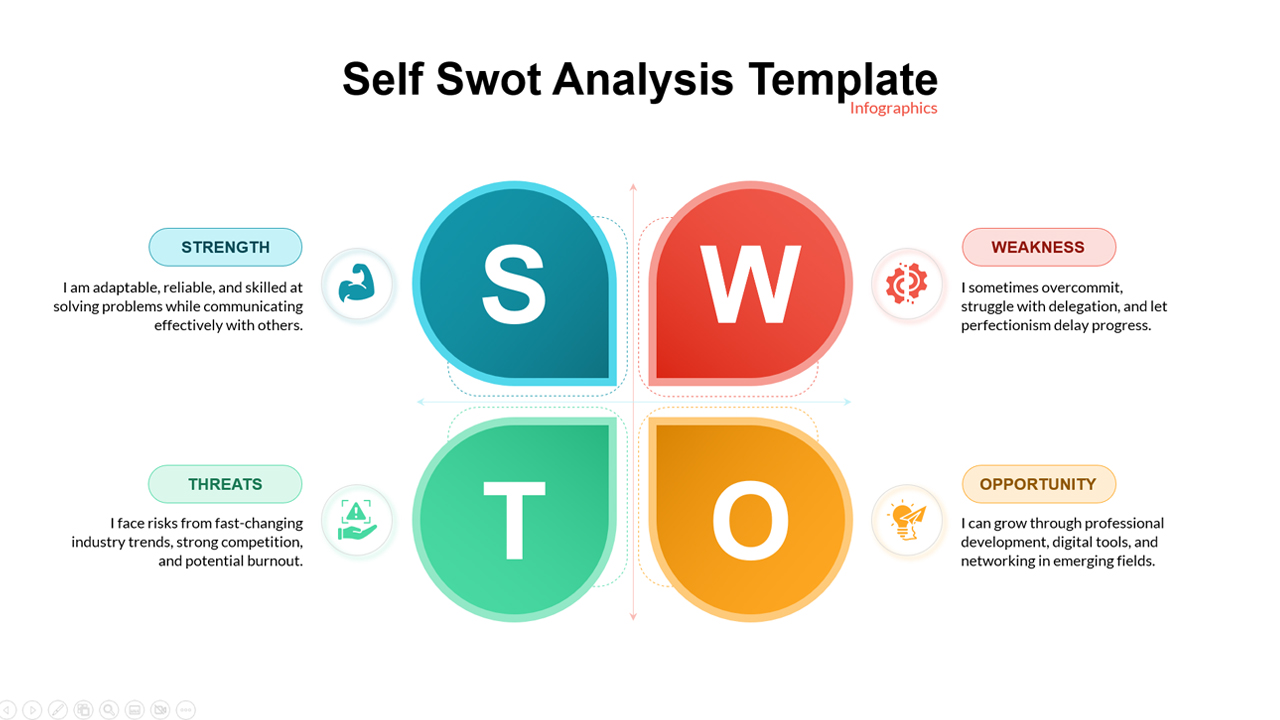
Self SWOT Analysis Template for PowerPoint & Google Slides
SWOT
Data Gap Analysis Template for PowerPoint & Google Slides
Business
Financial Gap Analysis Framework Template for PowerPoint & Google Slides
Finance