Quadruple Venn Diagram Template for PowerPoint & Google Slides


Description
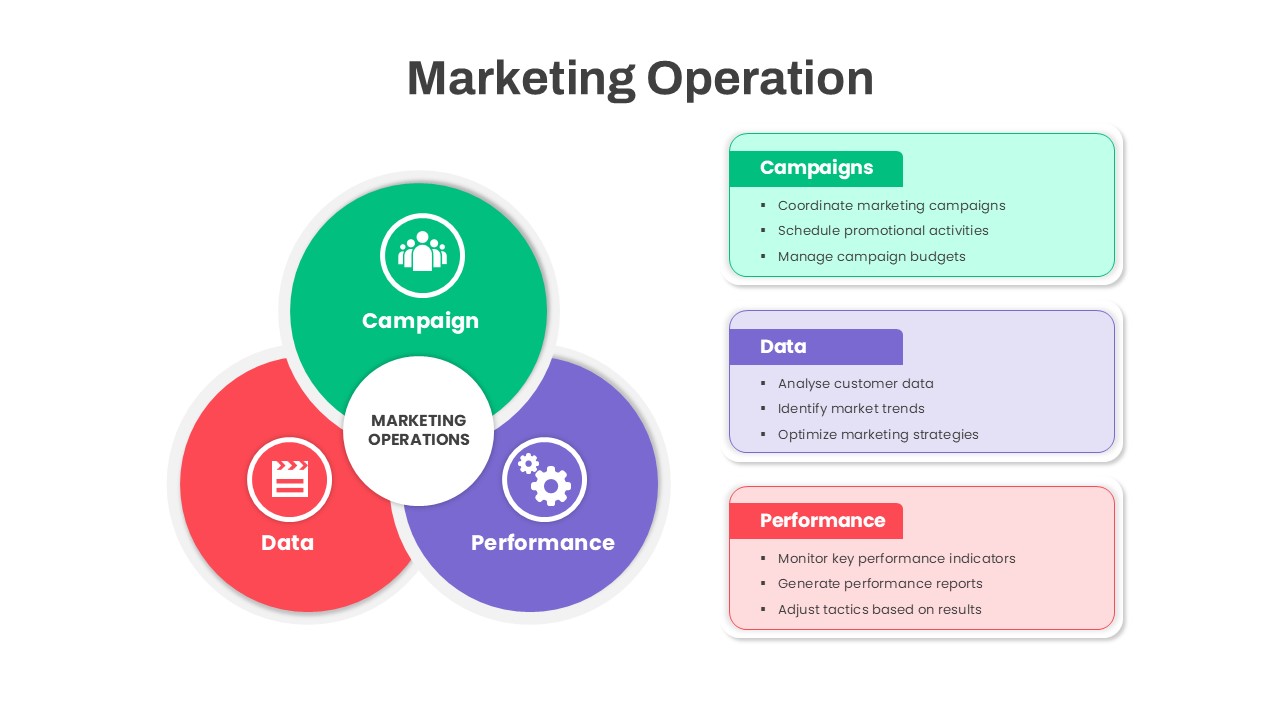
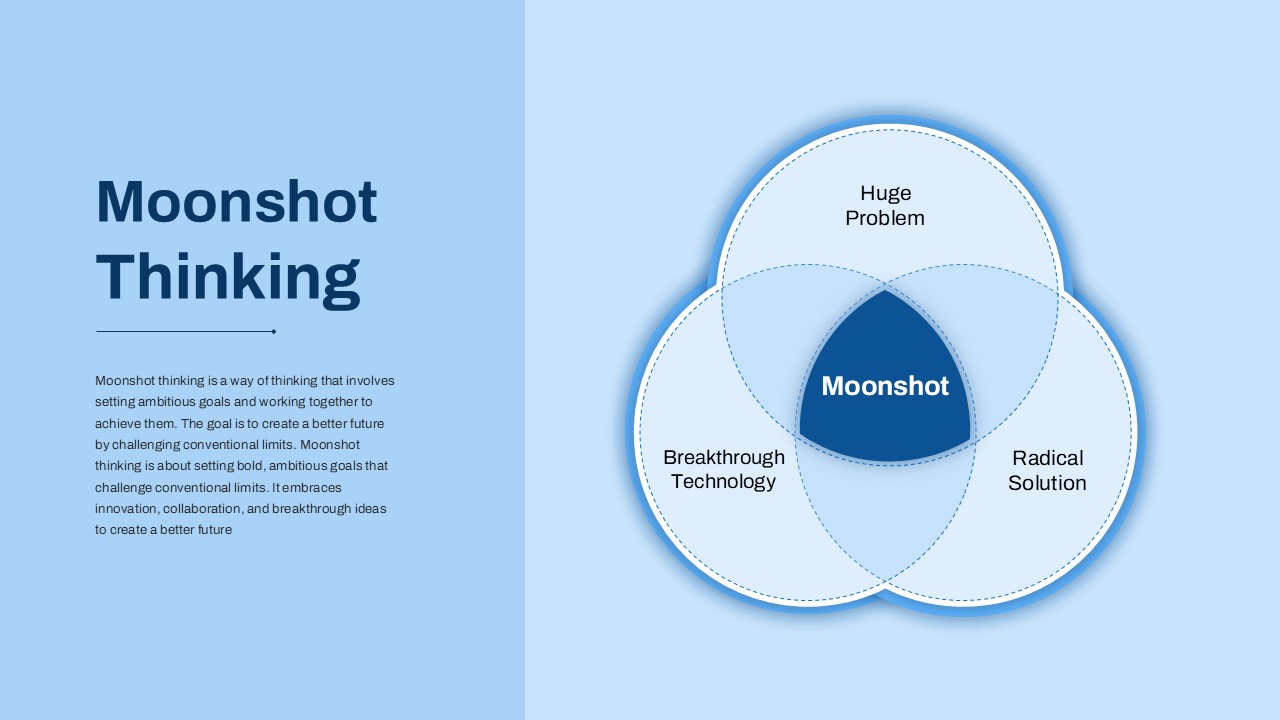
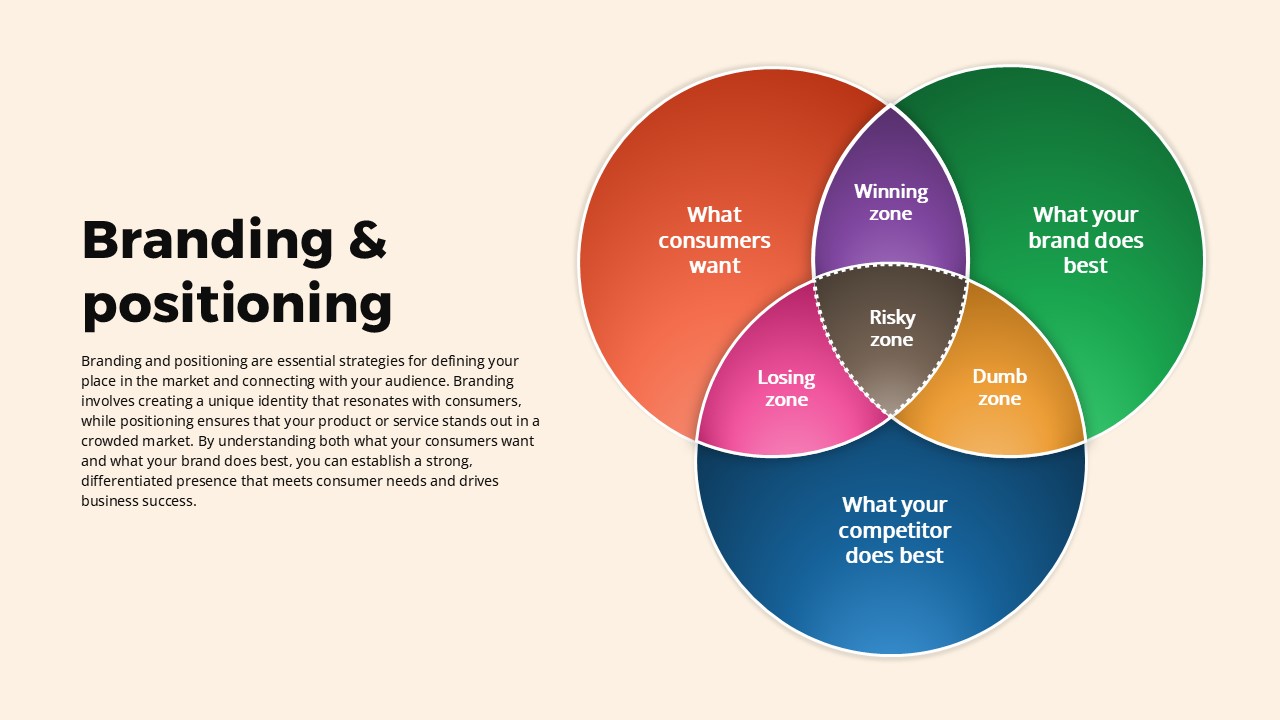
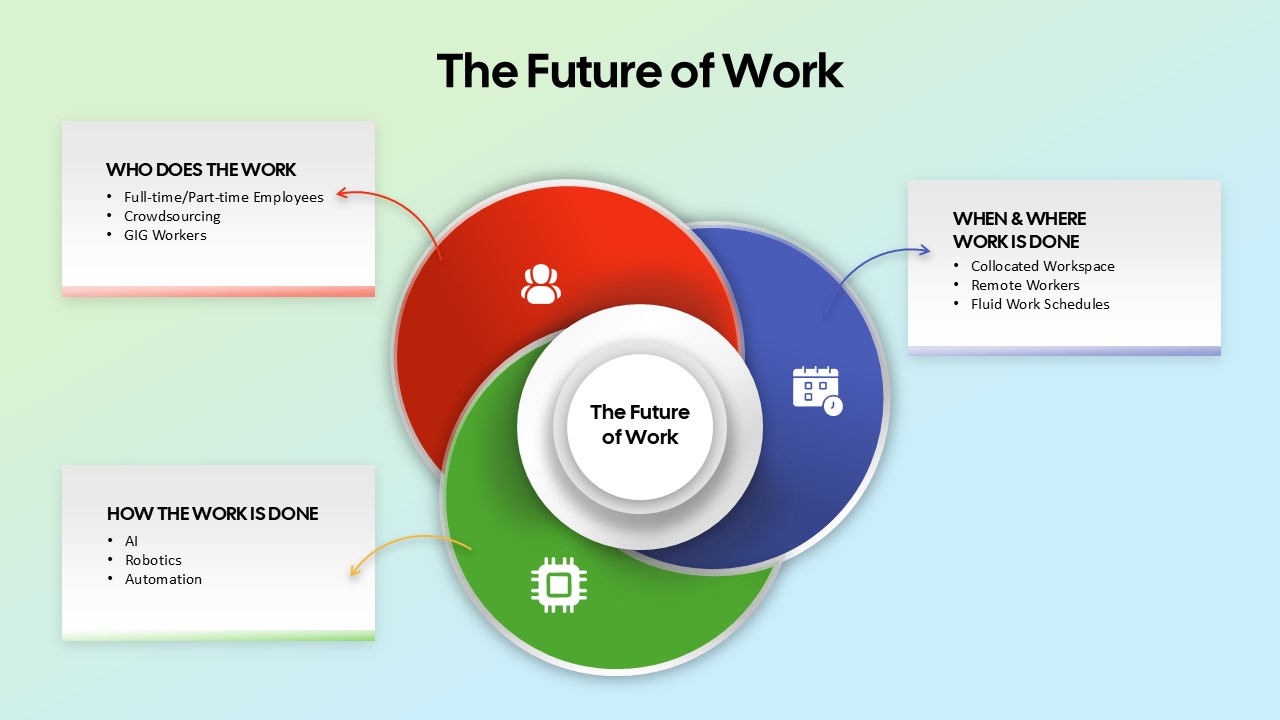
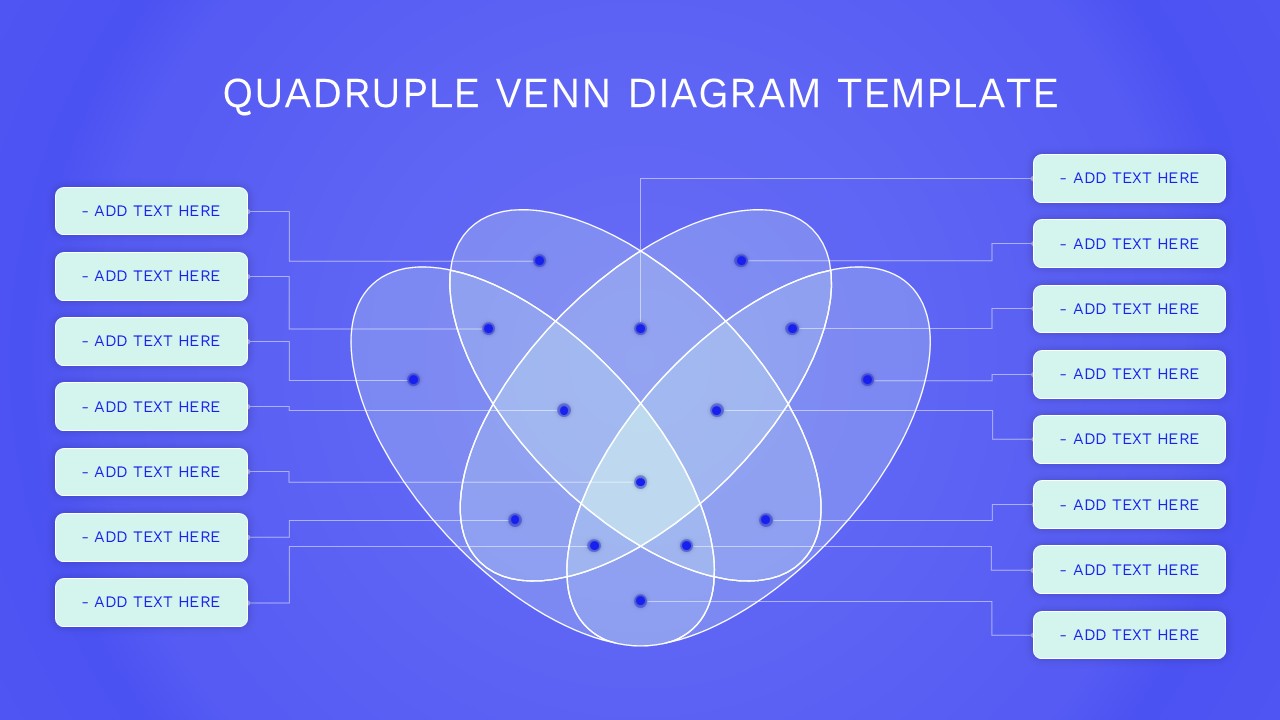
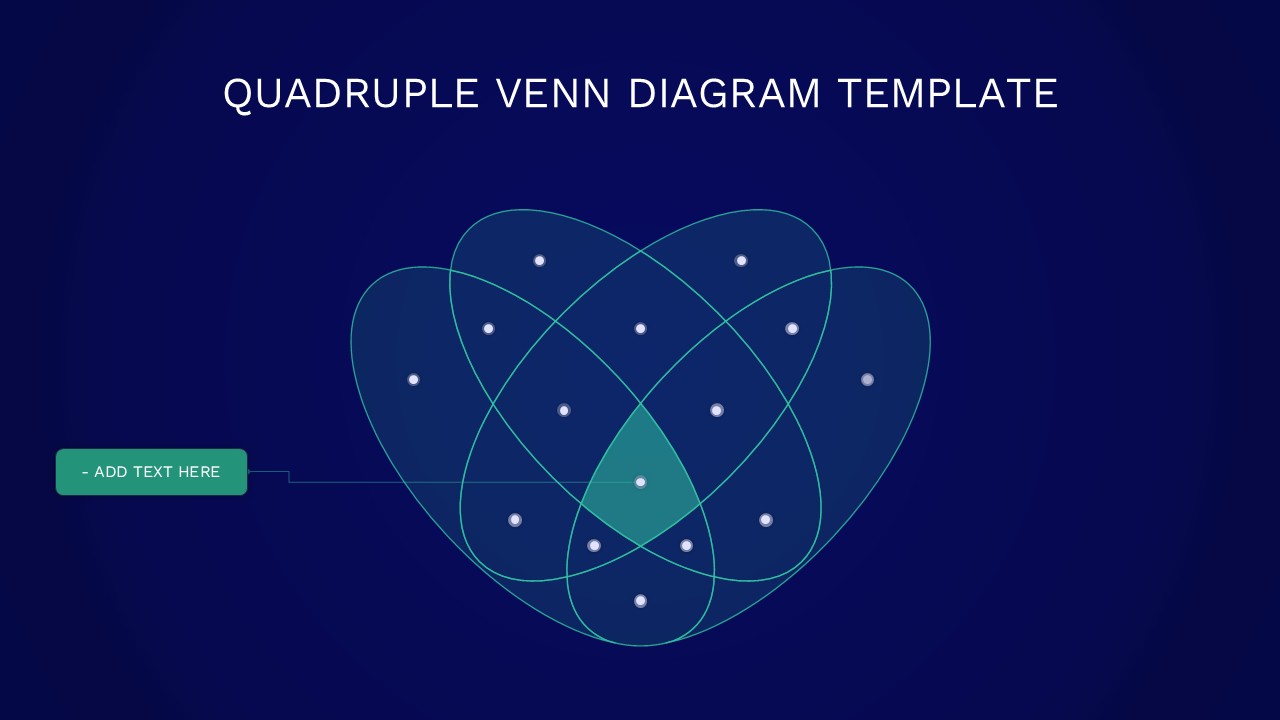
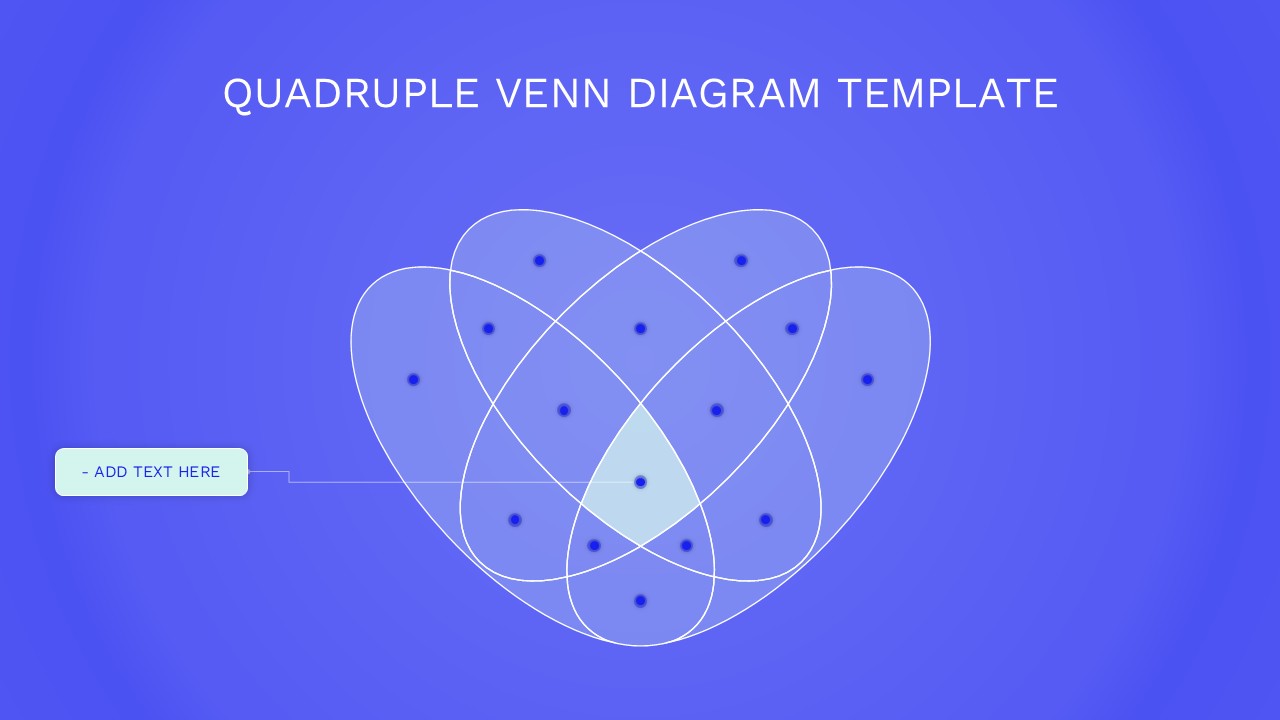
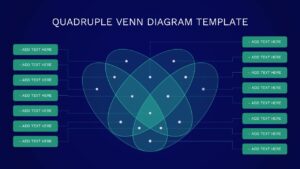
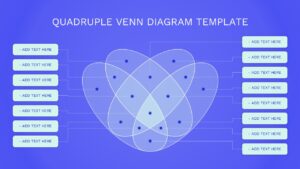
Visualize complex relationships clearly with this quadruple Venn diagram slide designed to compare four related concepts in a single, cohesive layout. The slide features four overlapping oval shapes arranged symmetrically, creating multiple intersection points that help illustrate shared attributes, dependencies, or common outcomes. A dark gradient background paired with translucent shapes enhances contrast and readability, ensuring each overlap area stands out without overwhelming the viewer. Callout text boxes on both sides connect directly to specific regions of the diagram, making it easy to explain individual segments and intersections during presentations.
Built for flexibility, this template allows you to relabel each circle, adjust colors, or resize elements to match your brand or topic. The clean geometry and balanced spacing support logical storytelling, whether you are comparing strategies, features, audiences, or processes. Fully editable in both PowerPoint and Google Slides, the slide preserves alignment, transparency, and visual hierarchy across platforms, helping you present complex comparisons with clarity and confidence.
Who is it for
Business analysts, consultants, educators, product managers, and strategy teams can use this slide to explain overlaps between four variables, ideas, or stakeholder groups. It is especially useful for professionals who need to simplify multi-dimensional comparisons for executive or client-facing presentations.
Other Uses
Beyond classic comparisons, this quadruple Venn diagram can support risk assessments, feature prioritization, brand positioning, academic analysis, or workshop discussions. Repurpose it to map customer segments, evaluate tool capabilities, or highlight shared responsibilities across teams.
Login to download this file

Item ID
SB05703Designed By
Geethu
Related Templates

Four-Circle Venn Process Diagram template for PowerPoint & Google Slides
Process

Venn Diagram Infographics Pack Template for PowerPoint & Google Slides
Circular
Creative Three-Circle Venn Diagram Template for PowerPoint & Google Slides
Comparison
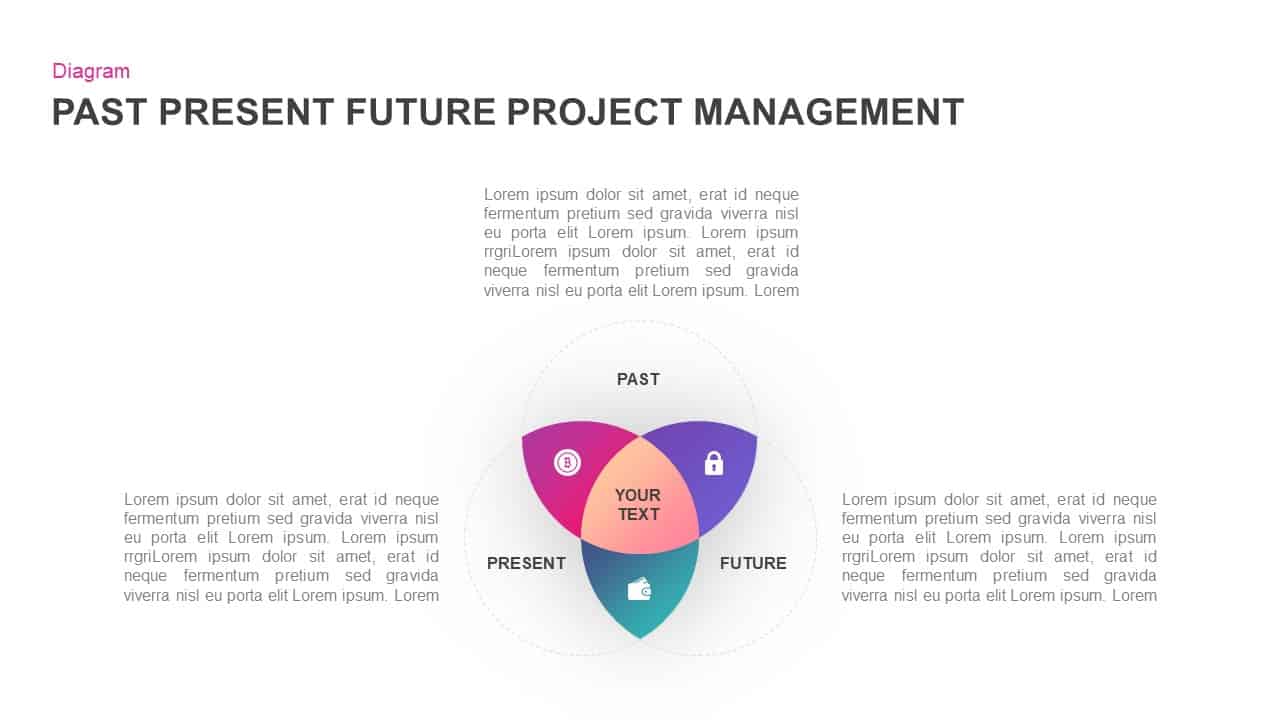
Past, Present & Future Venn Diagram Template for PowerPoint & Google Slides
Comparison
Colorful Venn Diagram Infographics Template for PowerPoint & Google Slides
Circular
Modern Gear Venn Diagram Infographic Template for PowerPoint & Google Slides
Comparison
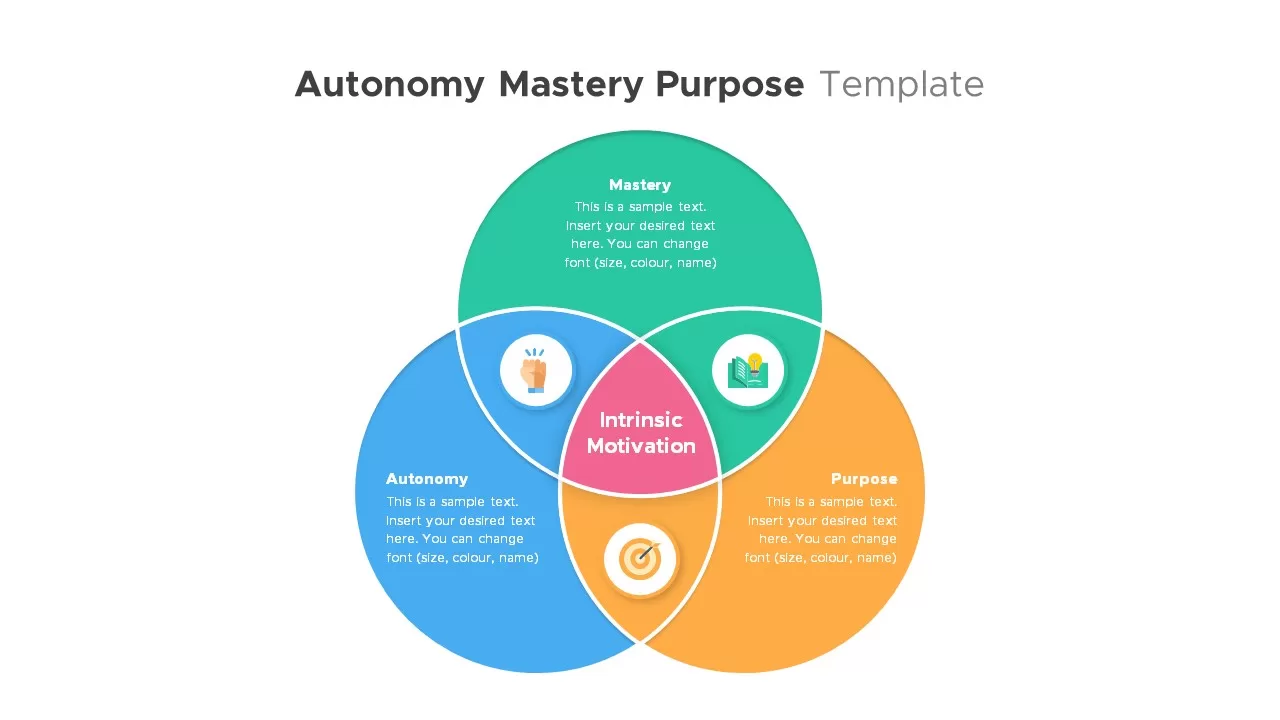
Autonomy, Mastery & Purpose Venn Diagram Template for PowerPoint & Google Slides
Circular
Free Simple Venn Diagram Overview template for PowerPoint & Google Slides
Comparison Chart
Free
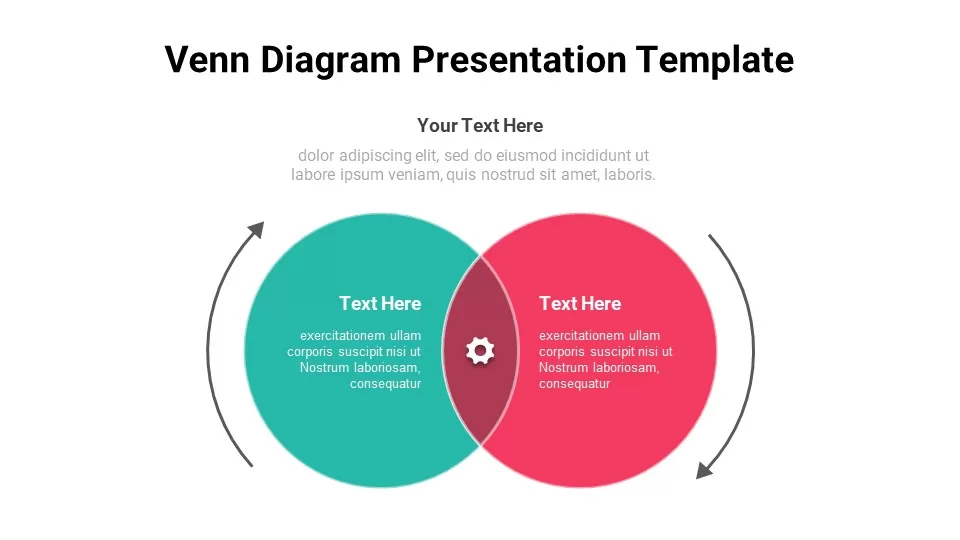
Free Venn Diagram template for PowerPoint & Google Slides
Charts
Free
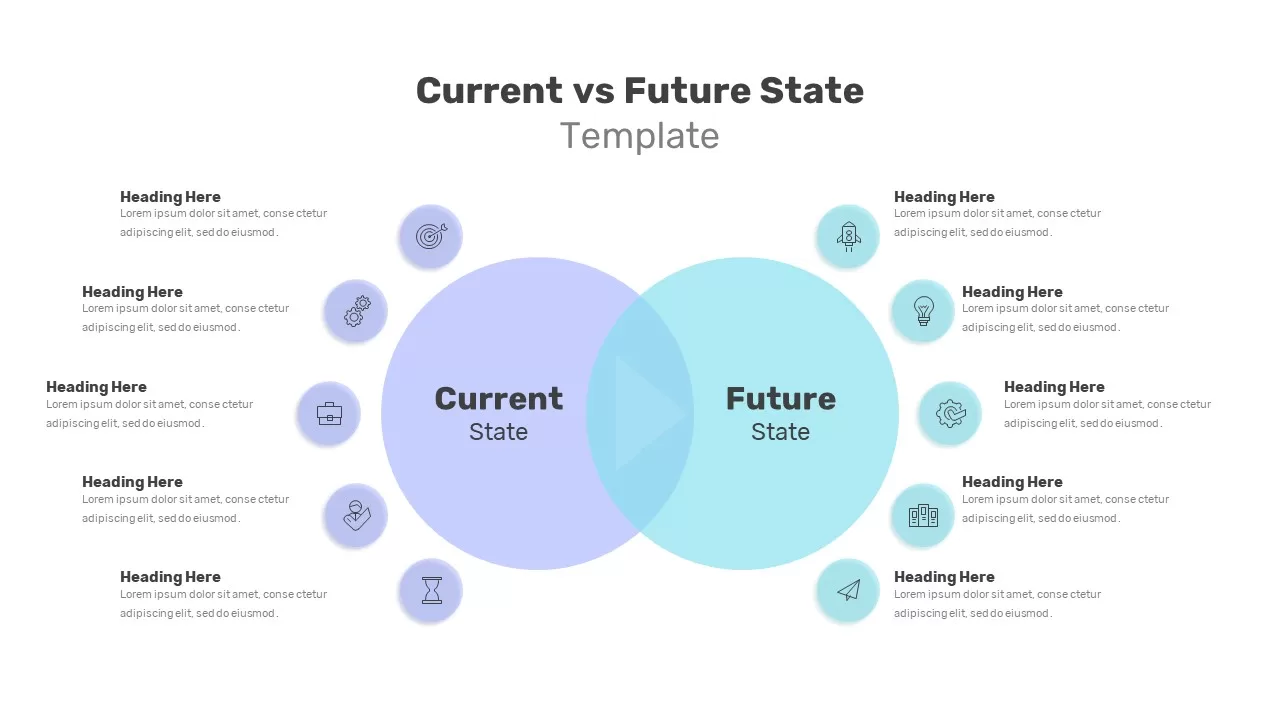
Current vs Future State Venn Diagram Template for PowerPoint & Google Slides
Comparison
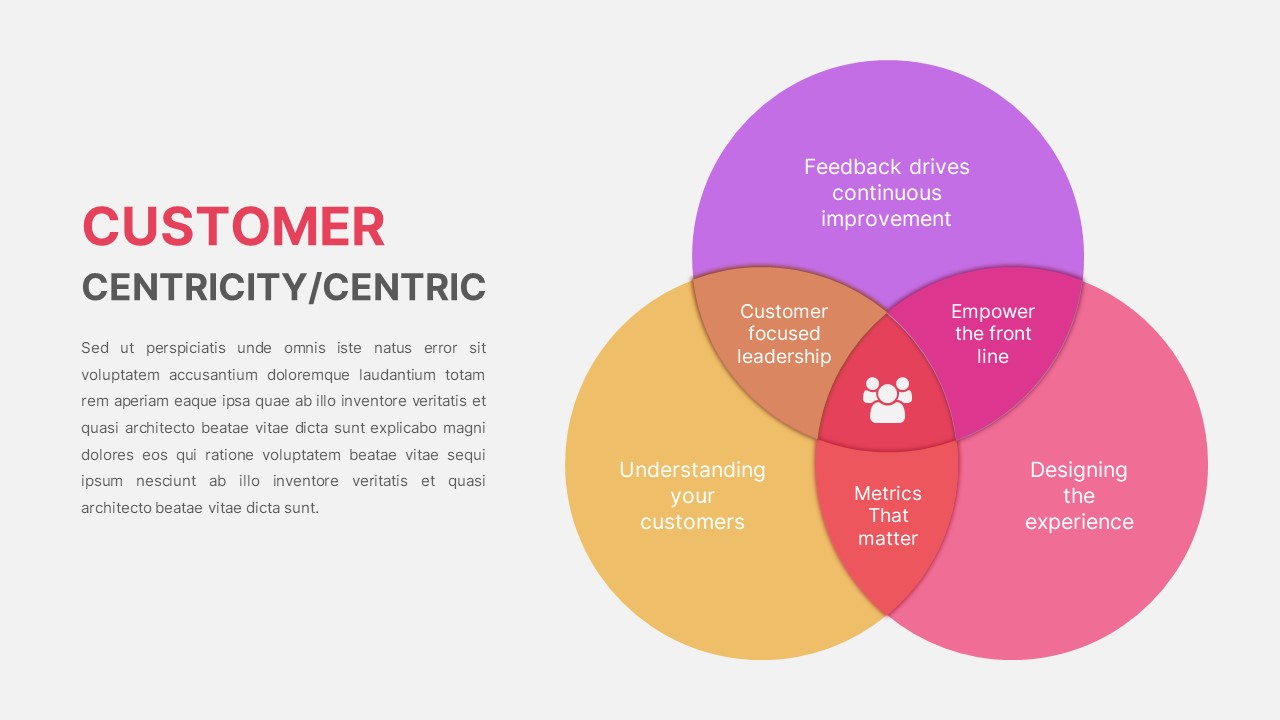
Customer Centricity Venn Diagram template for PowerPoint & Google Slides
Infographics
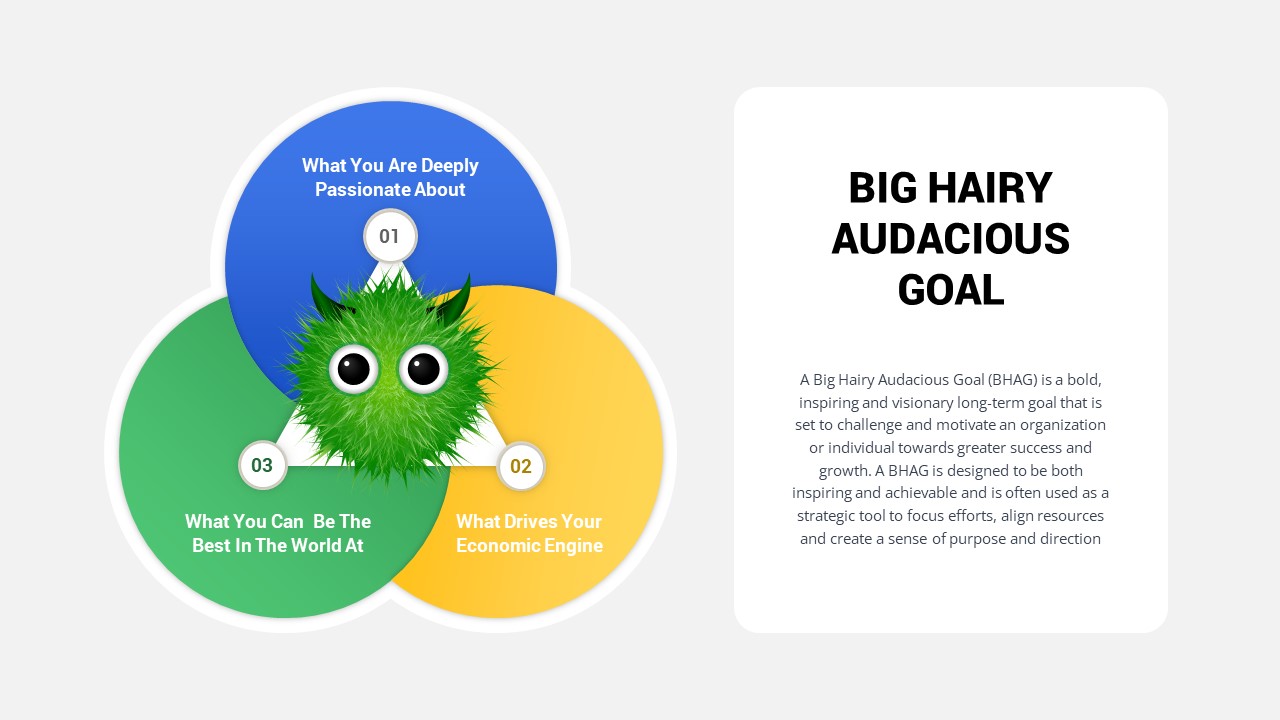
Big Hairy Audacious Goal Venn Diagram Template for PowerPoint & Google Slides
Circular
Five Circle Venn Diagram for Template for PowerPoint & Google Slides
Circular
8 Circle Venn Diagram Infographic Design Template for PowerPoint & Google Slides
Circular
Professional 6 Circle Venn Diagram Template for PowerPoint & Google Slides
Circular
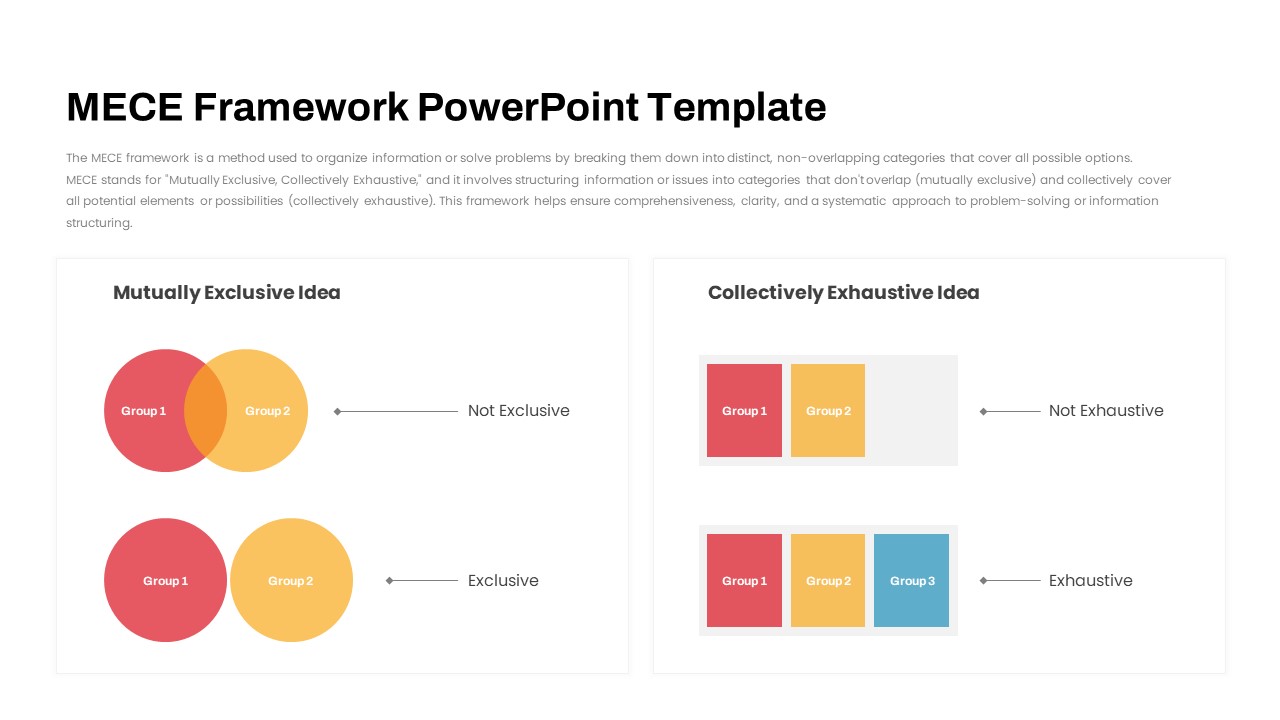
MECE Framework Venn & Block Diagram Template for PowerPoint & Google Slides
Comparison
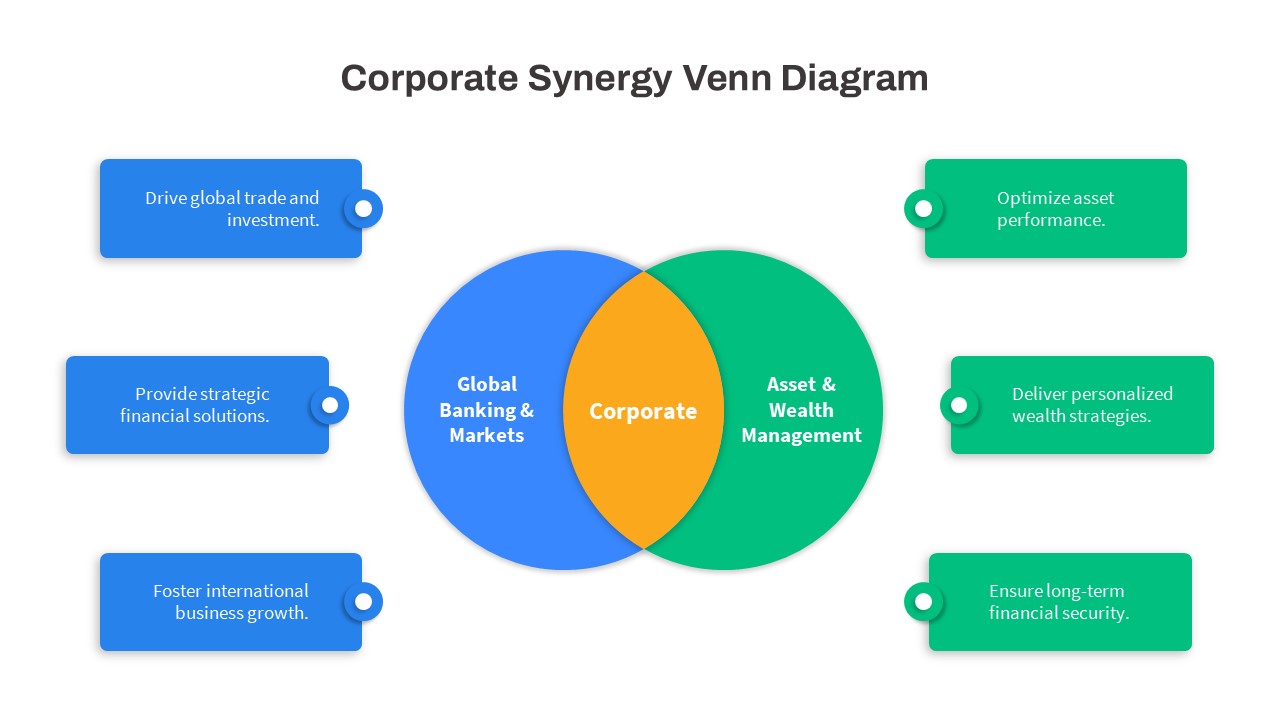
Corporate Synergy Venn Diagram Template for PowerPoint & Google Slides
Comparison
Salience Model Venn Diagram Infographic Template for PowerPoint & Google Slides
Circular
Modern Growth Hacking Venn Diagram Template for PowerPoint & Google Slides
Circular
Marketing Operations Venn Diagram Template for PowerPoint & Google Slides
Circular
3Ps Triple Bottom Line Venn Diagram Template for PowerPoint & Google Slides
Circular
Bold Moonshot Thinking Venn Diagram Template for PowerPoint & Google Slides
Circular
Branding and Positioning Venn Diagram Template for PowerPoint & Google Slides
Comparison
The Future of Work Venn Diagram Template for PowerPoint & Google Slides
Circular
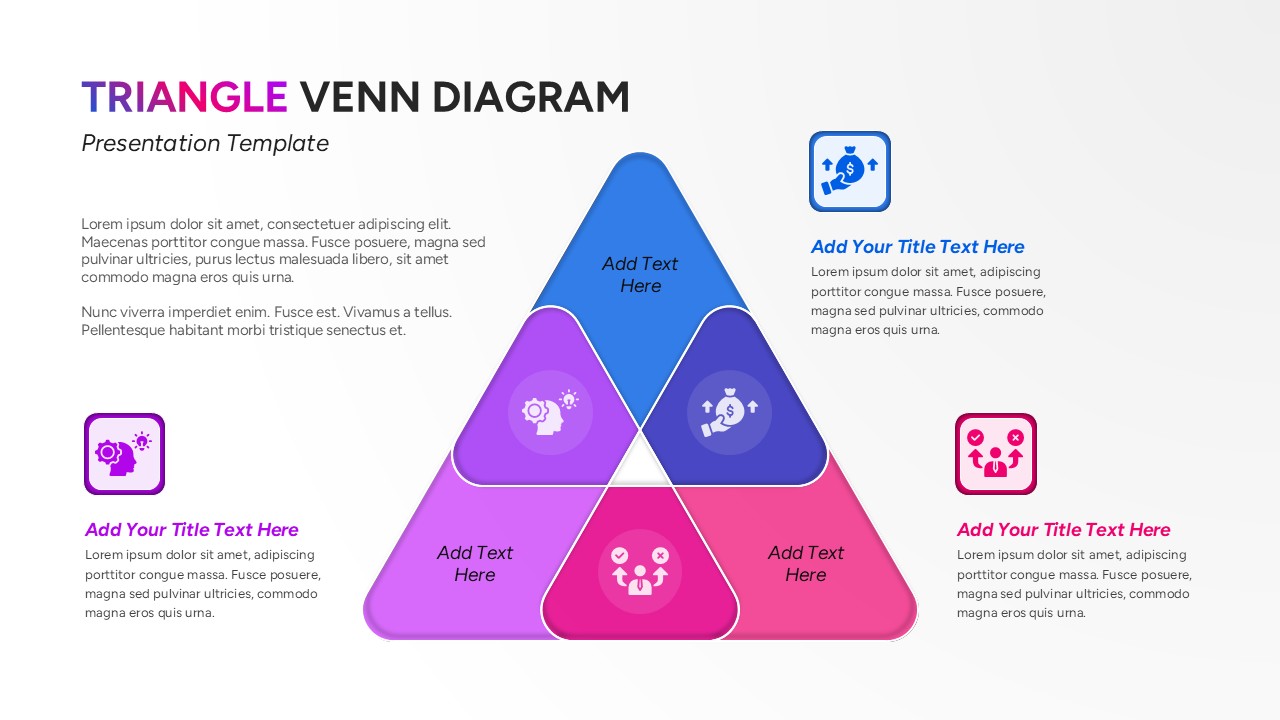
Triangle Venn Diagram Infographic Template for PowerPoint & Google Slides
Comparison
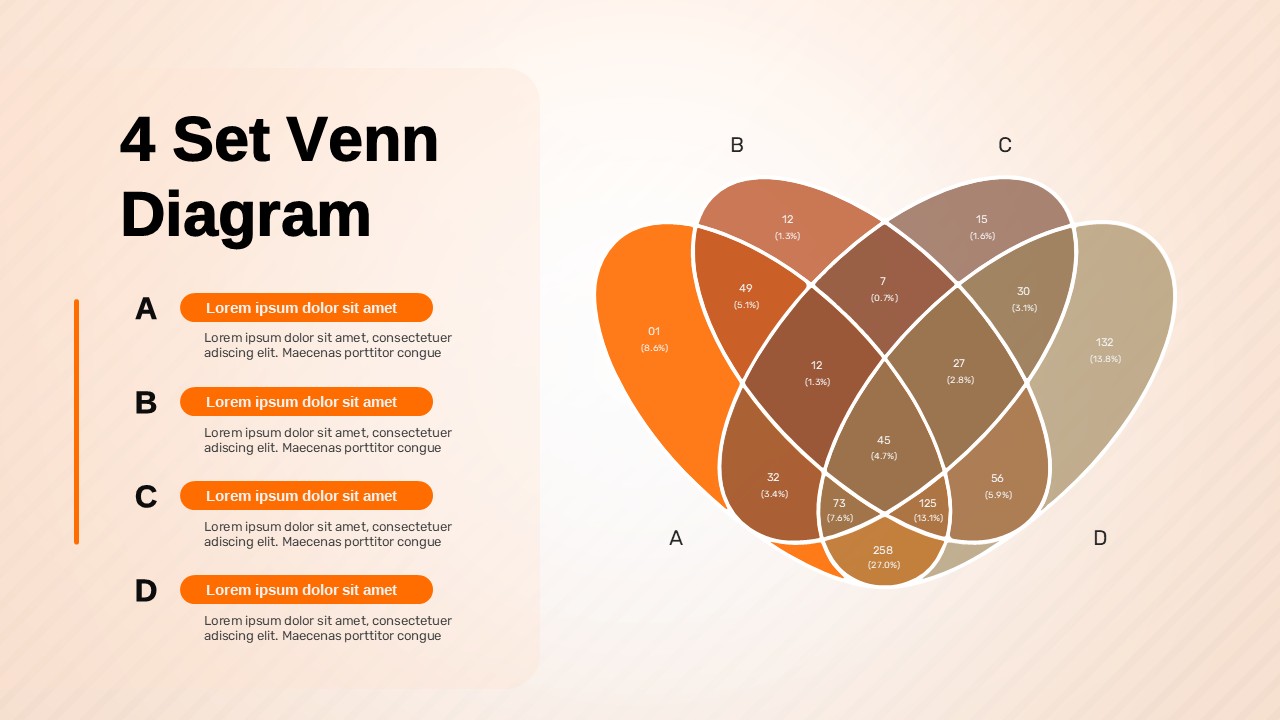
4 Set Venn Diagram Comparison Template for PowerPoint & Google Slides
Comparison
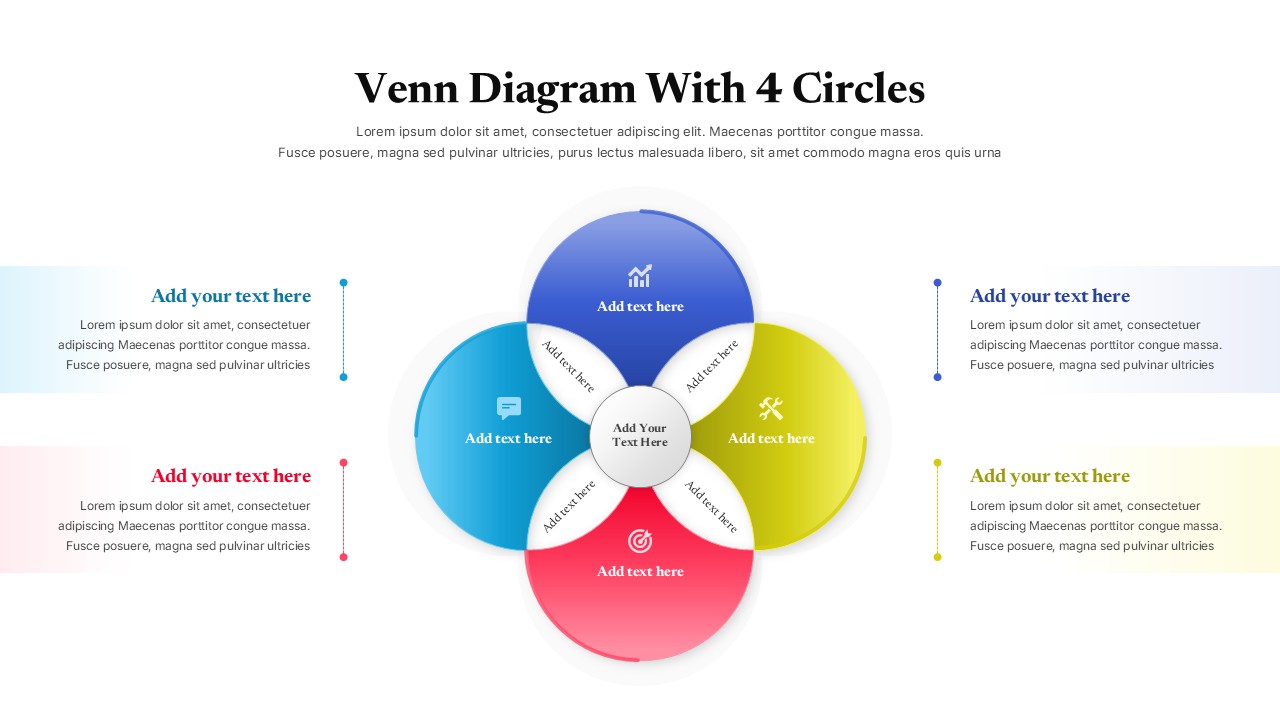
Colorful Venn Diagram with 4 Circle for PowerPoint & Google Slides
Circular
Snake Diagram Pack of 8 Slides template for PowerPoint & Google Slides
Process
Gear Process Diagram PowerPoint Template for PowerPoint & Google Slides
Process
Sales Process Workflow Funnel Diagram PowerPoint Template for PowerPoint & Google Slides
Funnel
Puzzle Diagram PowerPoint Template for PowerPoint & Google Slides
Process
Transportation Logistics PowerPoint Diagram template for PowerPoint & Google Slides
Process
Emoji Scale PowerPoint Diagram for PowerPoint & Google Slides
Infographics
4 Step Problem Solving PowerPoint Diagram for PowerPoint & Google Slides
Process
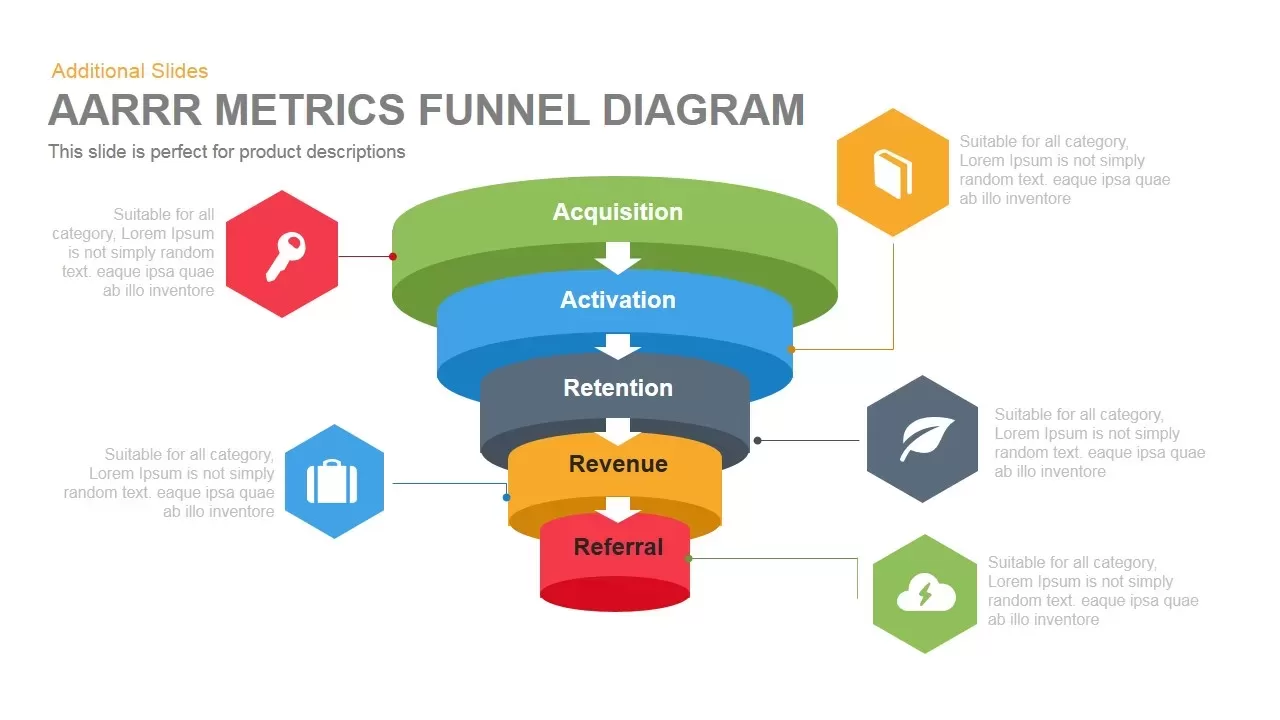
AARRR Funnel Diagram template for PowerPoint & Google Slides
Funnel
Circular Flow Diagram Template for PowerPoint & Google Slides
Infographics
Six Hexagon Stages Process Flow Diagram Template for PowerPoint & Google Slides
Process
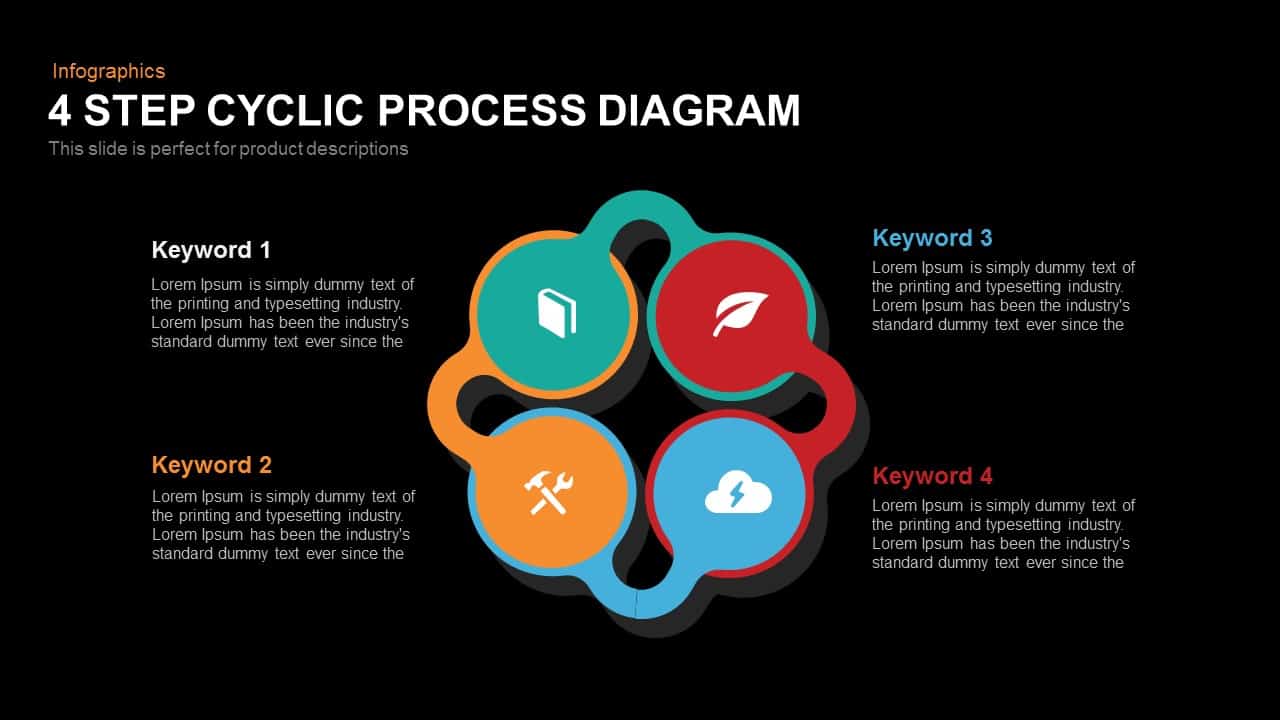
Modern 4-Step Cyclic Process Diagram Template for PowerPoint & Google Slides
Circular

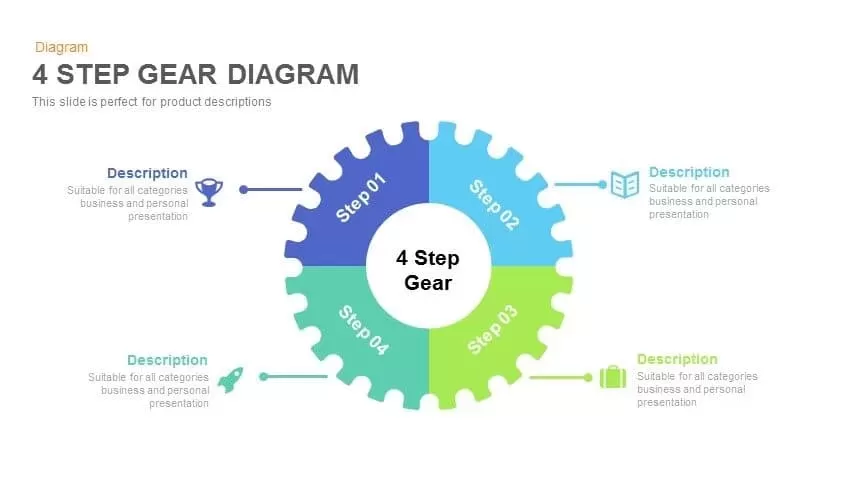
4 Step Gear Diagram Template for PowerPoint & Google Slides
Process
Pie Segment Diagram Four-Step Process Template for PowerPoint & Google Slides
Pie/Donut
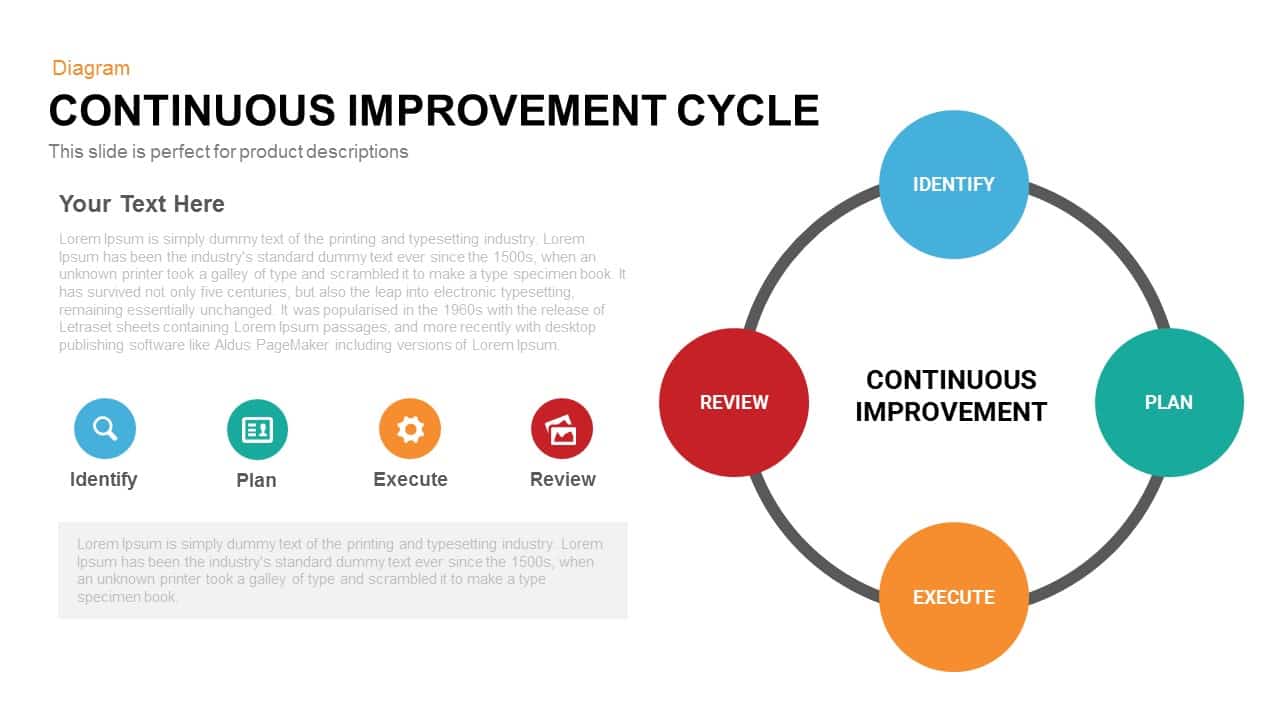
Continuous Improvement Cycle Diagram Template for PowerPoint & Google Slides
Circular
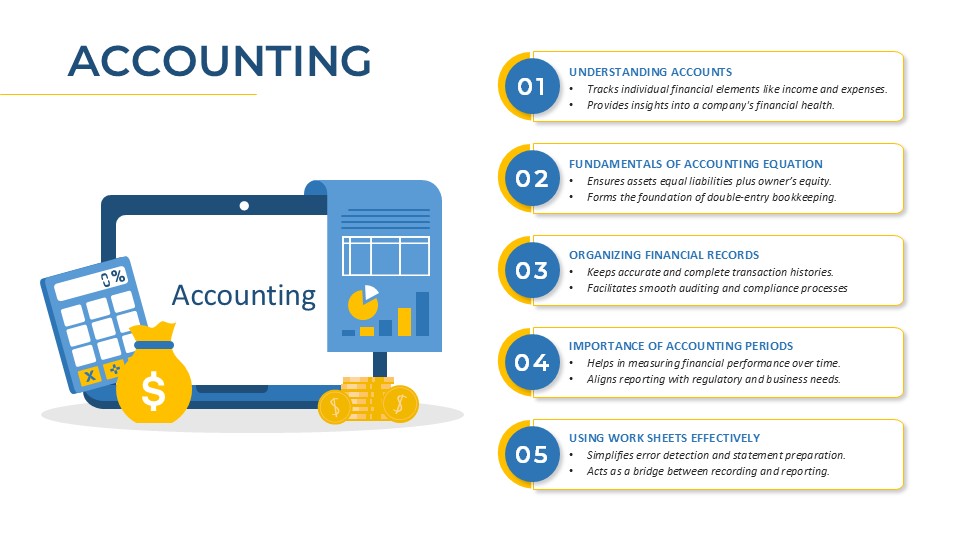
Accounting Process Metaphor Diagram Template for PowerPoint & Google Slides
Accounting
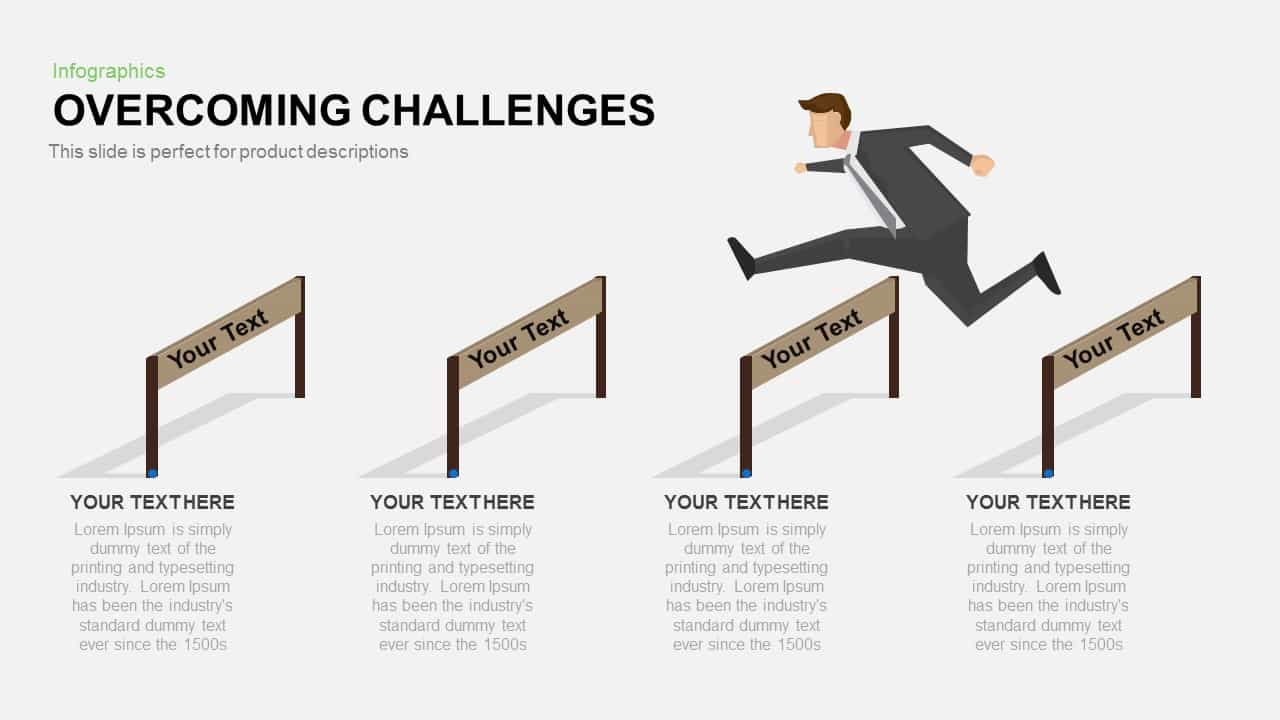
Overcoming Challenges Hurdle Diagram Template for PowerPoint & Google Slides
Process
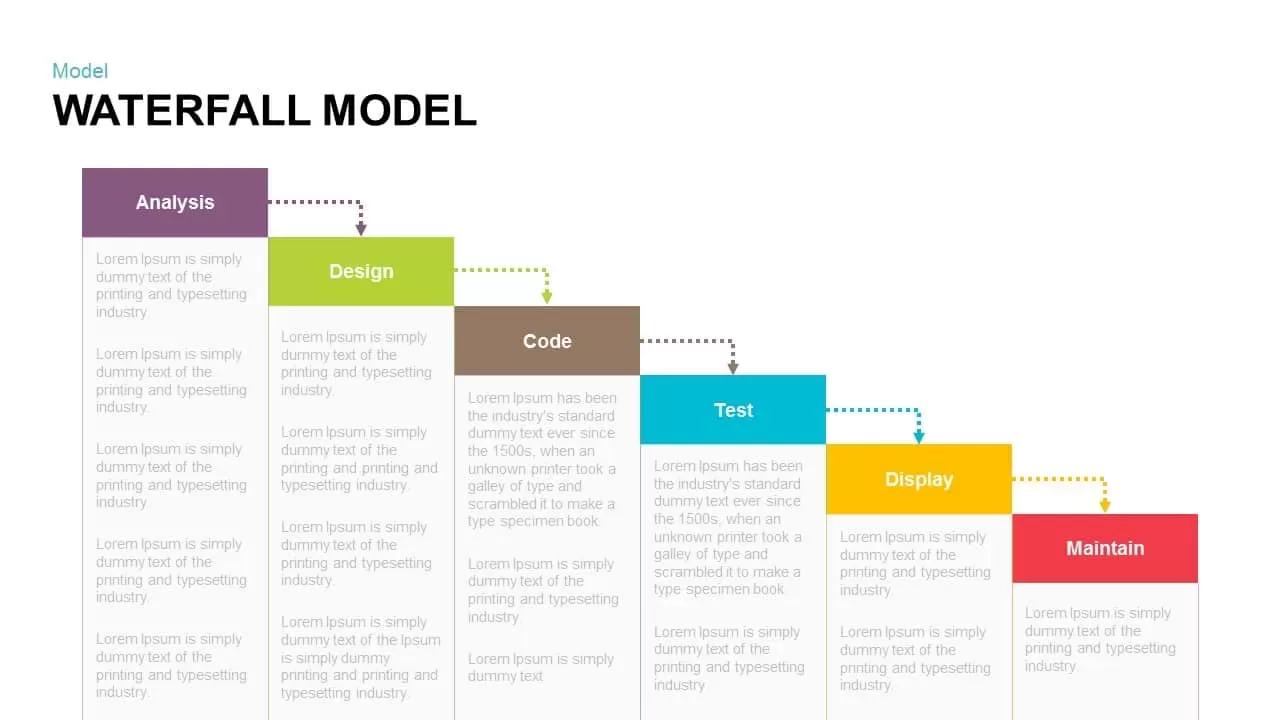
Waterfall Model Diagram Template for PowerPoint & Google Slides
Information Technology
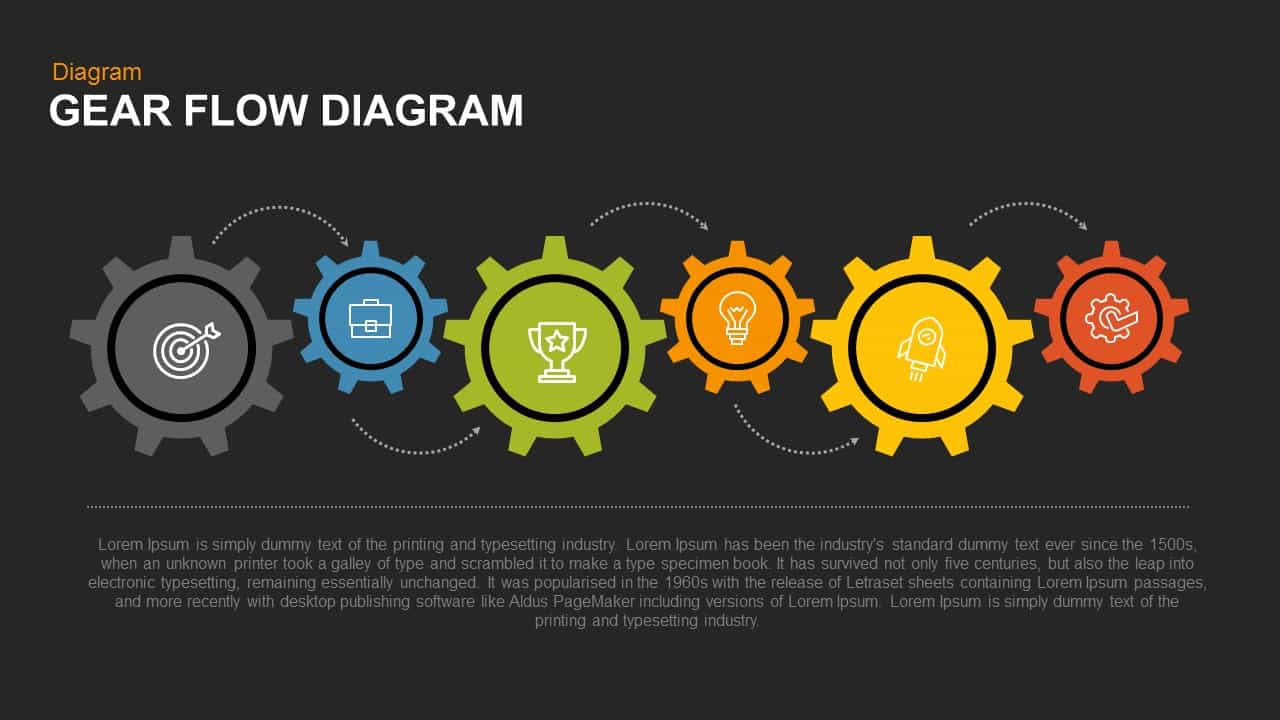
Gear Flow Diagram template for PowerPoint & Google Slides
Process
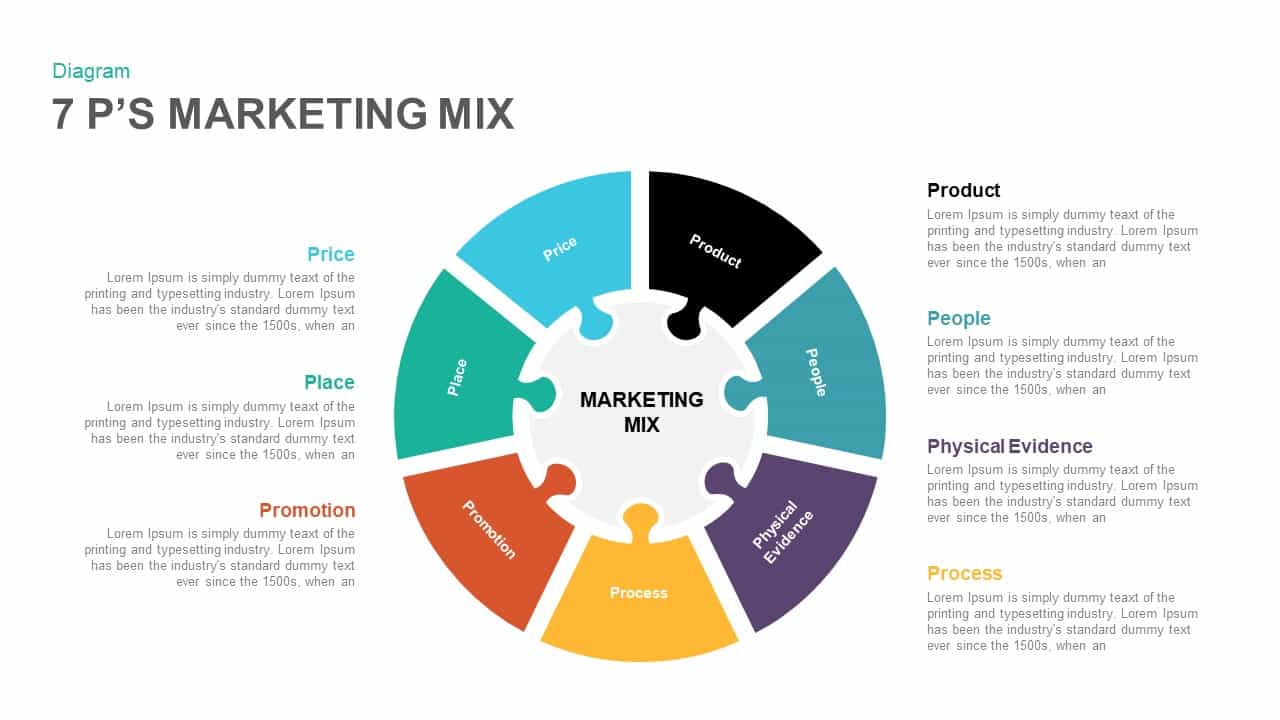
Seven-Part Marketing Mix Diagram Template for PowerPoint & Google Slides
Marketing

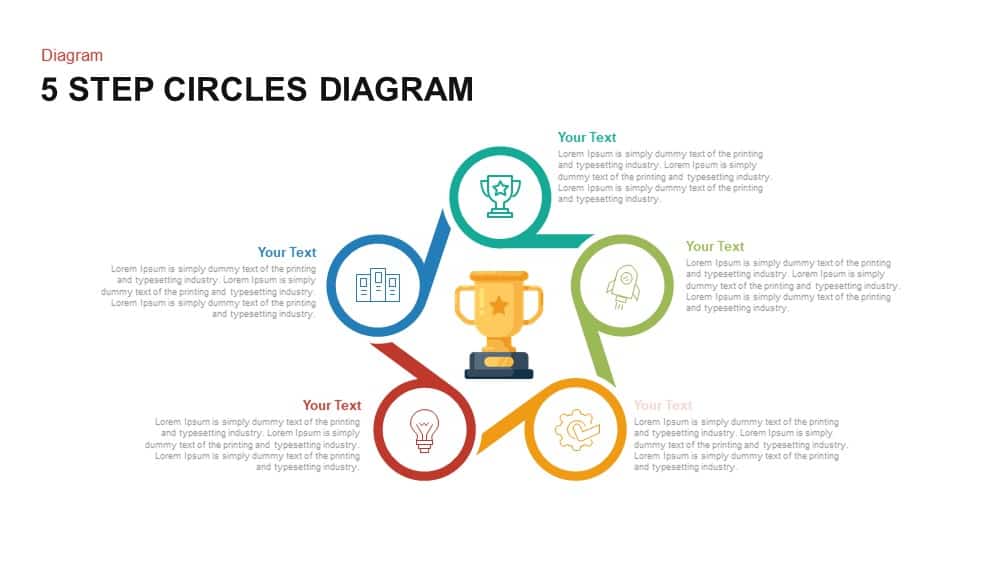
Modern Five-Step Circles Process Diagram Template for PowerPoint & Google Slides
Circular
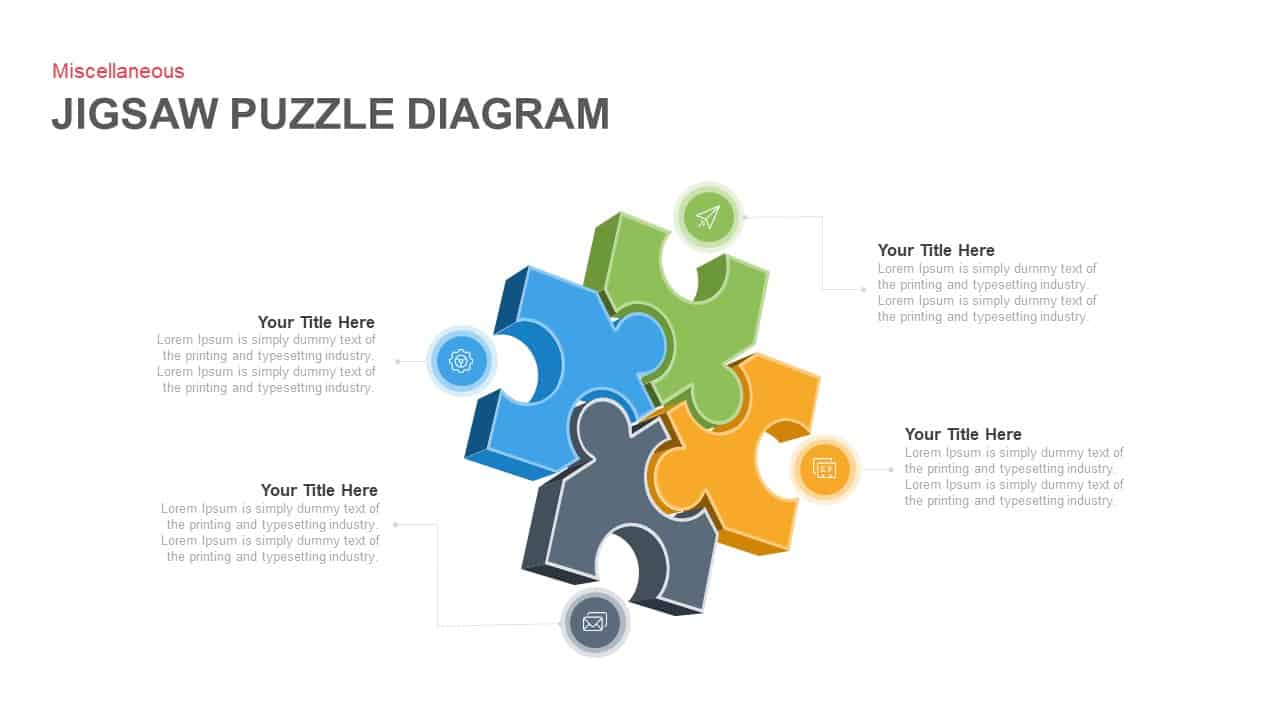
Four-Piece Jigsaw Puzzle Diagram Template for PowerPoint & Google Slides
Process
Fishbone Diagram Cause-and-Effect Template for PowerPoint & Google Slides
Process
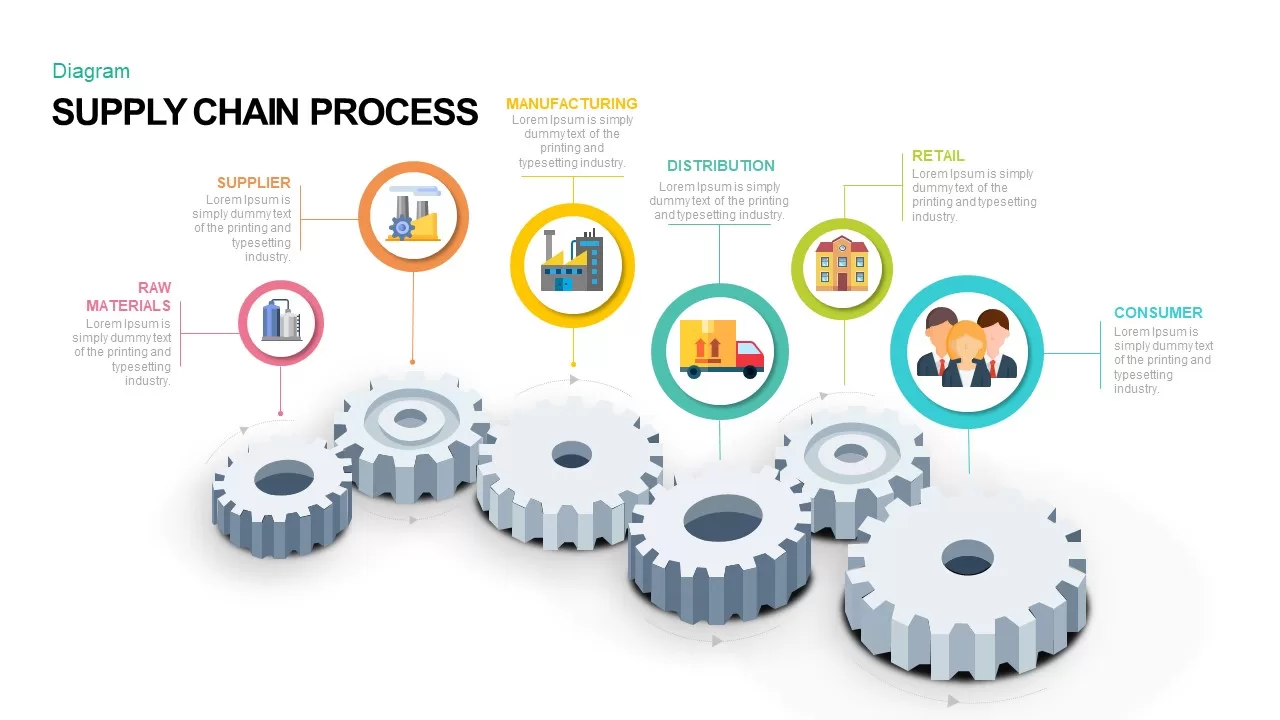
Supply Chain Process Gear Diagram Template for PowerPoint & Google Slides
Process
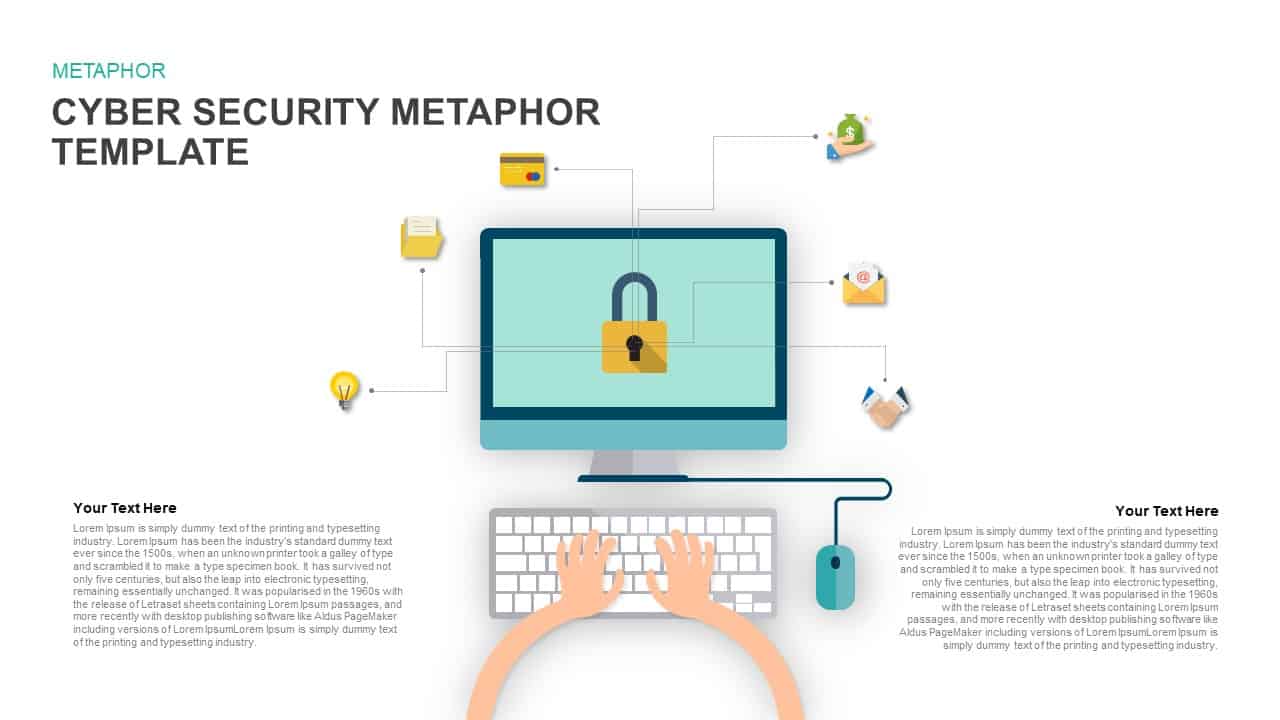
Cyber Security Metaphor Diagram Template for PowerPoint & Google Slides
Risk Management

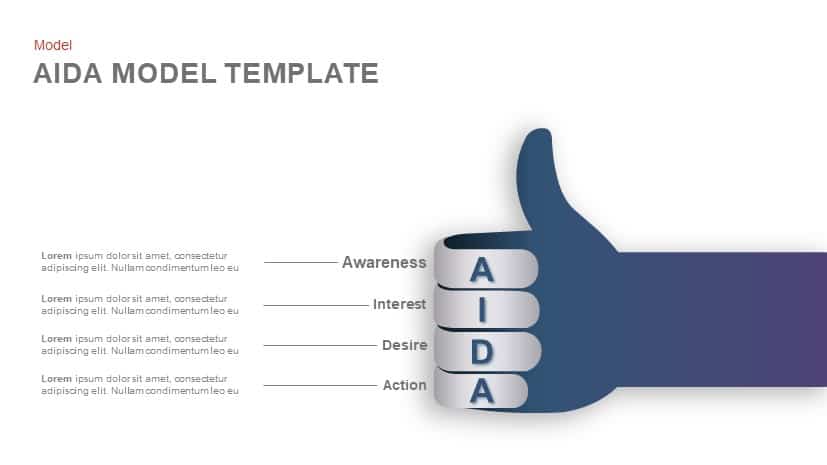
AIDA Model Funnel Thumb Diagram Template for PowerPoint & Google Slides
Process
4 Staged Circular Business Process Diagram template for PowerPoint & Google Slides
Process
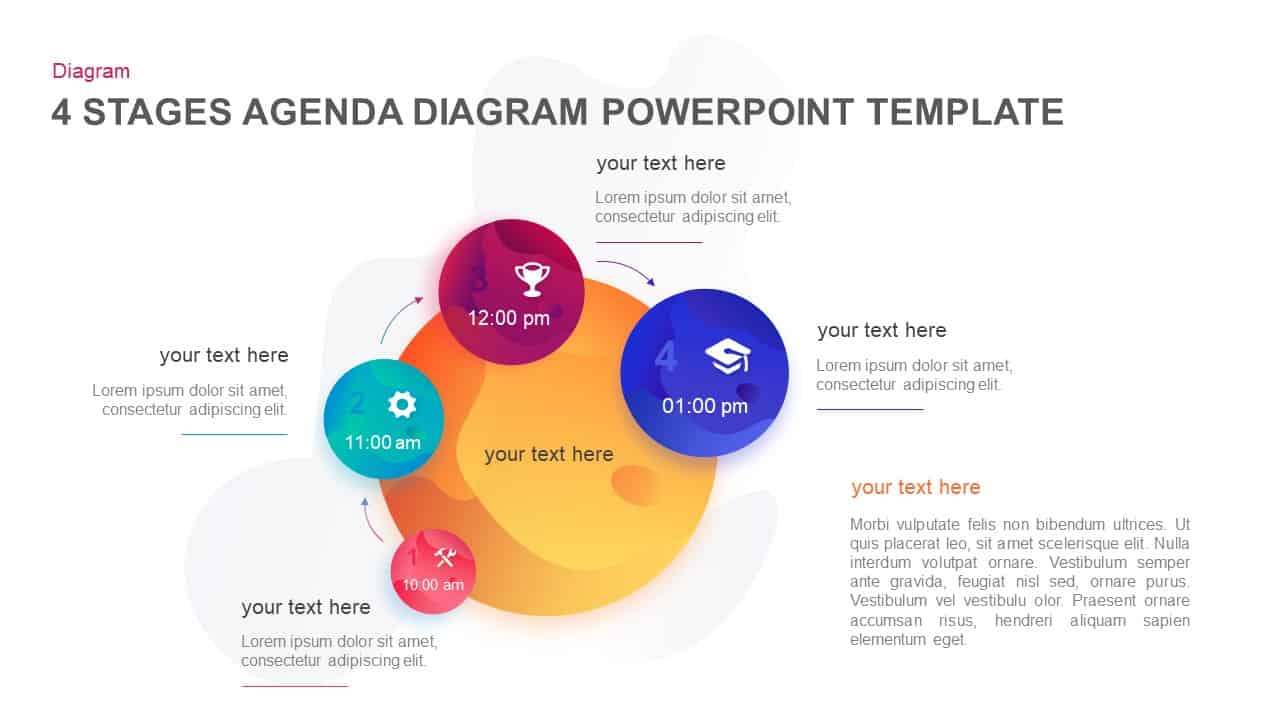
Four-Stage Agenda Circle Diagram Slide Template for PowerPoint & Google Slides
Agenda
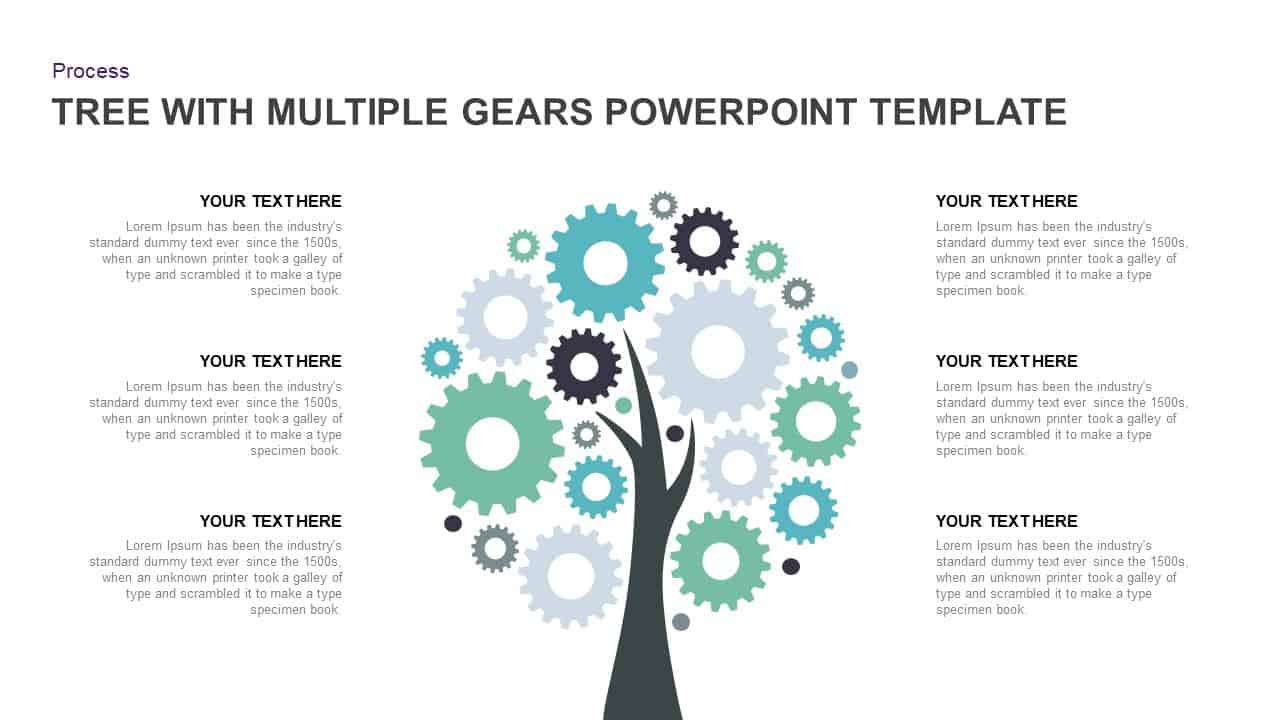
Tree Diagram with Gears Process Template for PowerPoint & Google Slides
Process
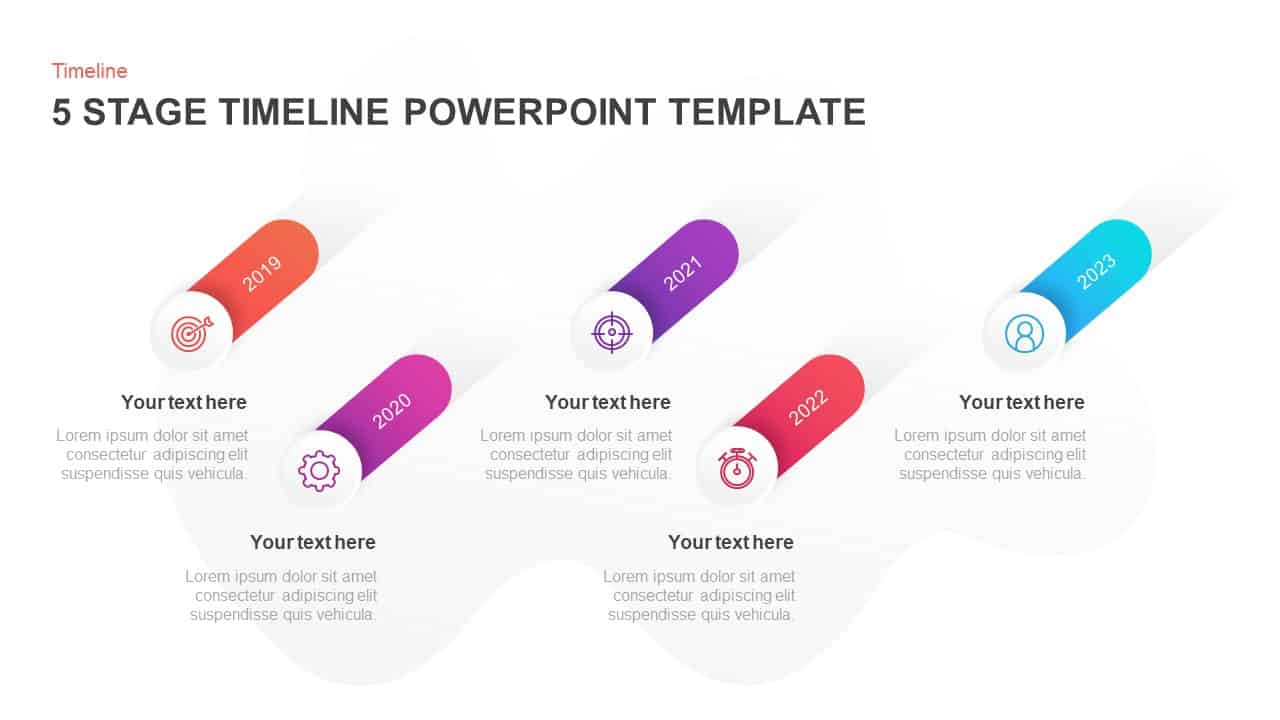
Five-Stage Slanted Timeline Diagram Template for PowerPoint & Google Slides
Timeline
Concentric Four-Layer Core Diagram Template for PowerPoint & Google Slides
Circular
Five-Step Gradient Blue Funnel Diagram Template for PowerPoint & Google Slides
Funnel
Hand-Held Four-Step Process Diagram Template for PowerPoint & Google Slides
Process
8-Stage Brand Evaluation Process Diagram Template for PowerPoint & Google Slides
Process
8 Step Circular Process Flow Diagram Template for PowerPoint & Google Slides
Process
Knight Puzzle Strategy Diagram Template for PowerPoint & Google Slides
Process
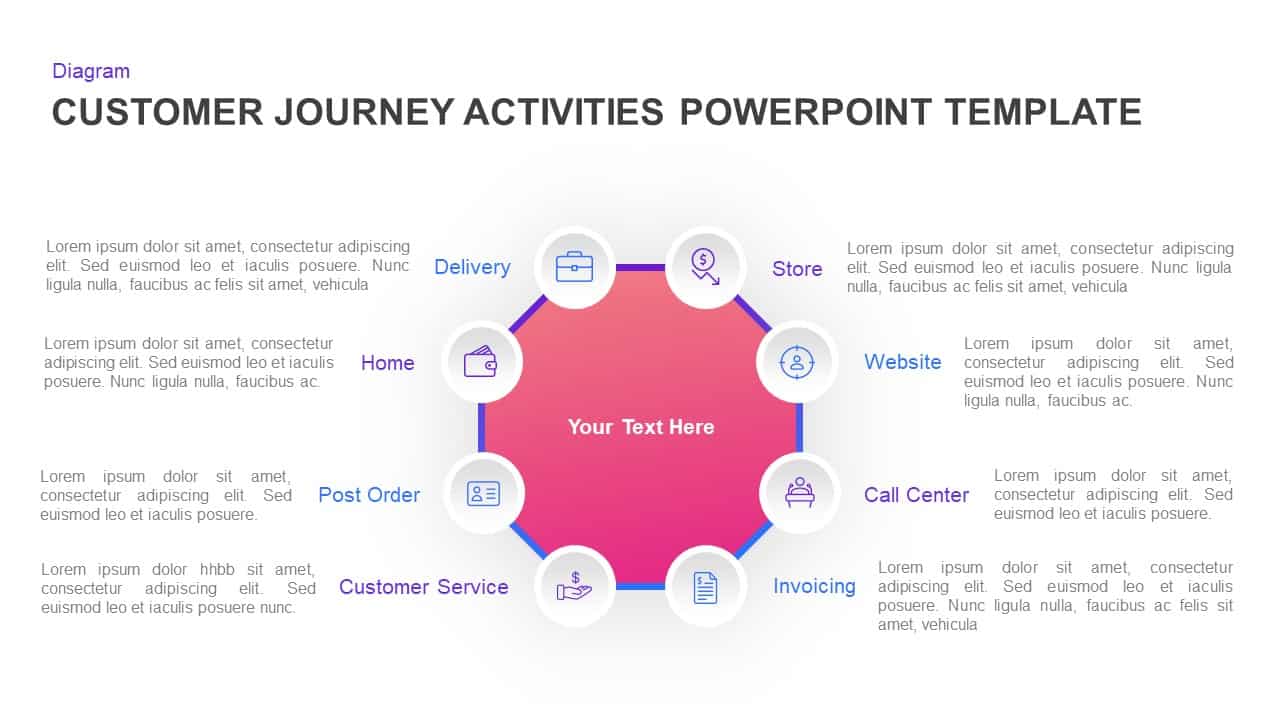
Customer Journey Activities Diagram Template for PowerPoint & Google Slides
Customer Journey
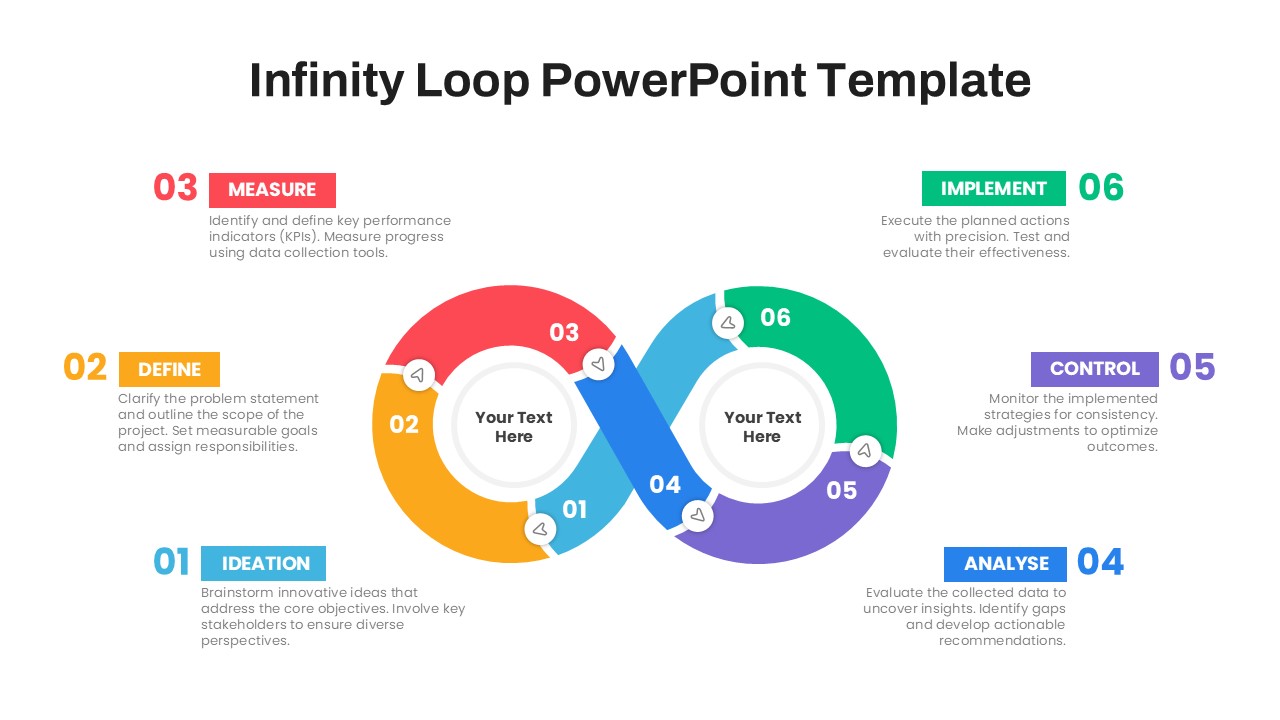
Six-Step Infinity Loop Process Diagram Template for PowerPoint & Google Slides
Process
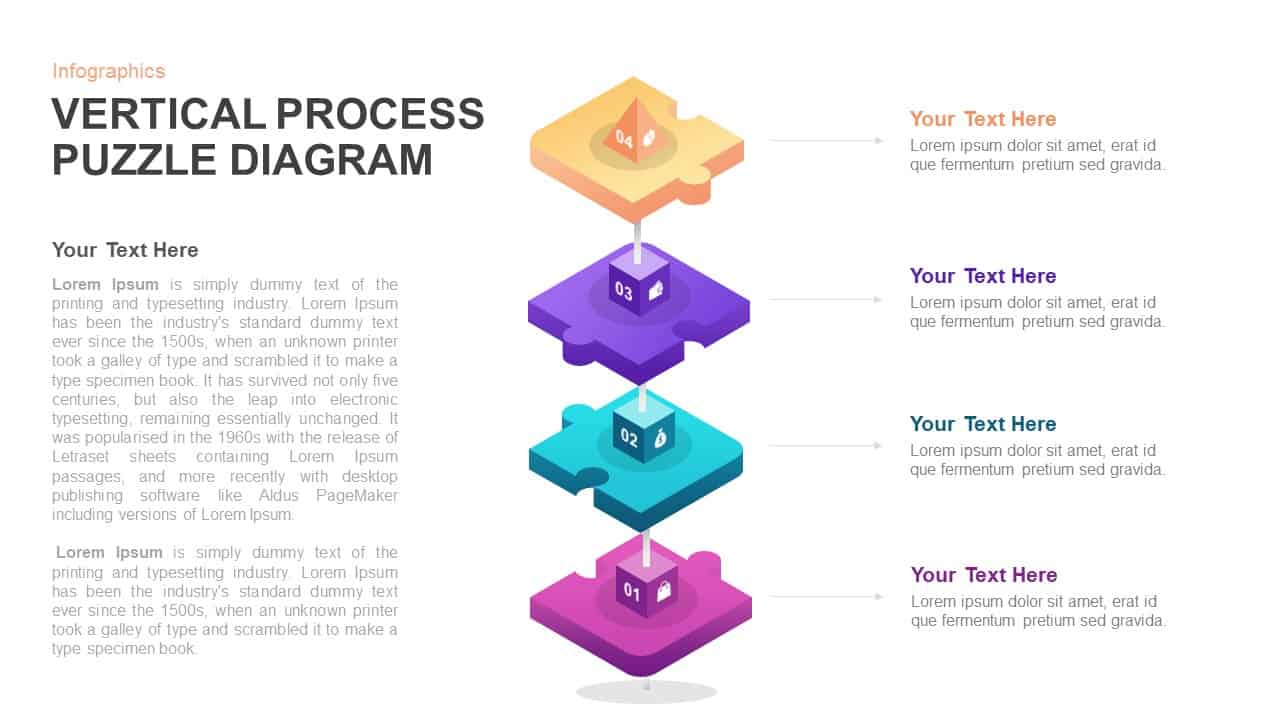
Vertical 4-Step Puzzle Process Diagram Template for PowerPoint & Google Slides
Process
6-Part Circular Gear Infographic Diagram Template for PowerPoint & Google Slides
Process

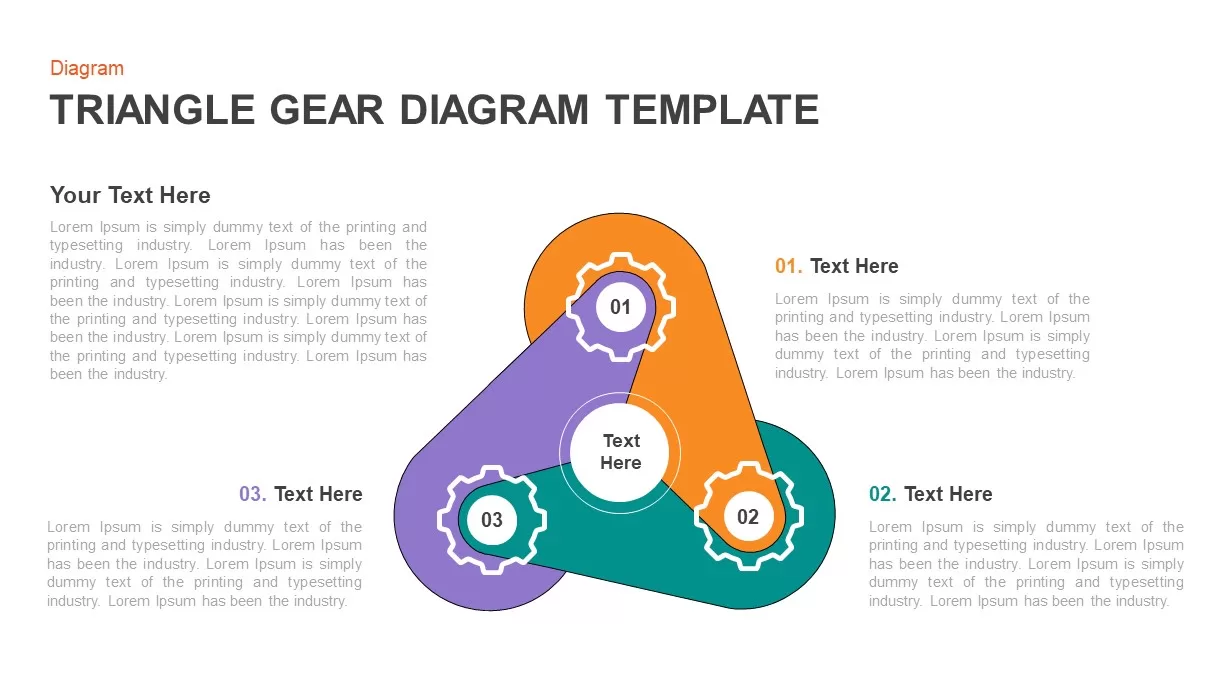
Three-Step Triangular Gear Diagram Template for PowerPoint & Google Slides
Process
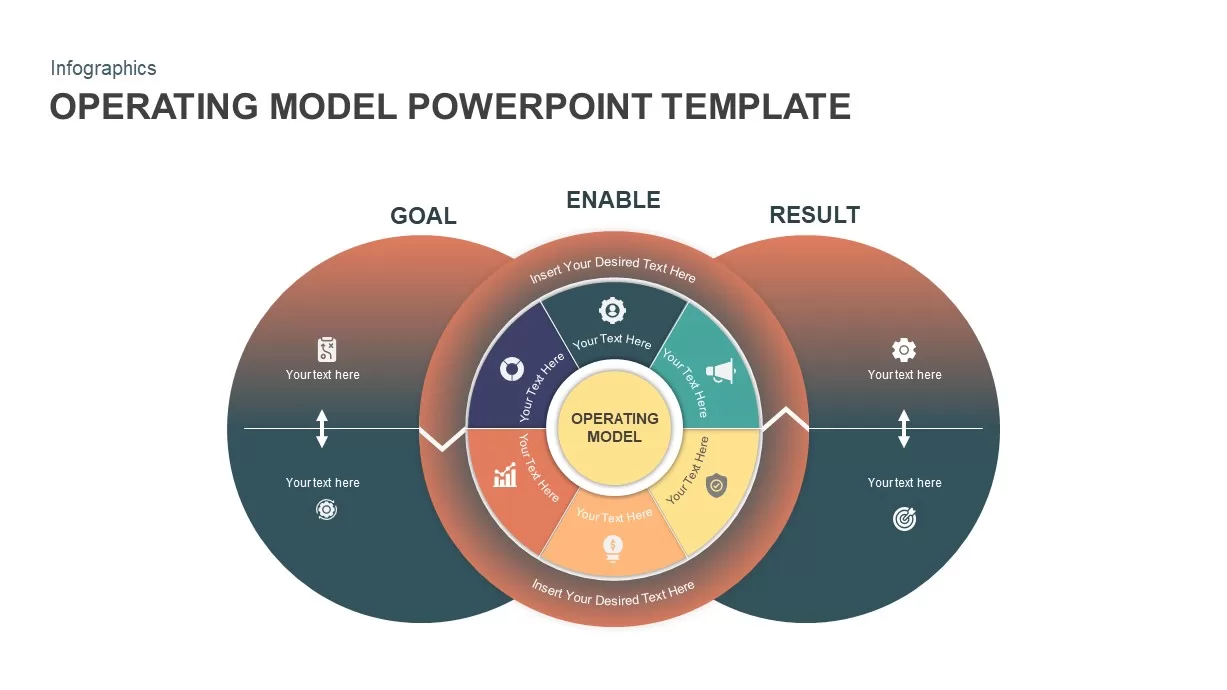
Operating Model Hub-and-Spoke Diagram Template for PowerPoint & Google Slides
Business Models
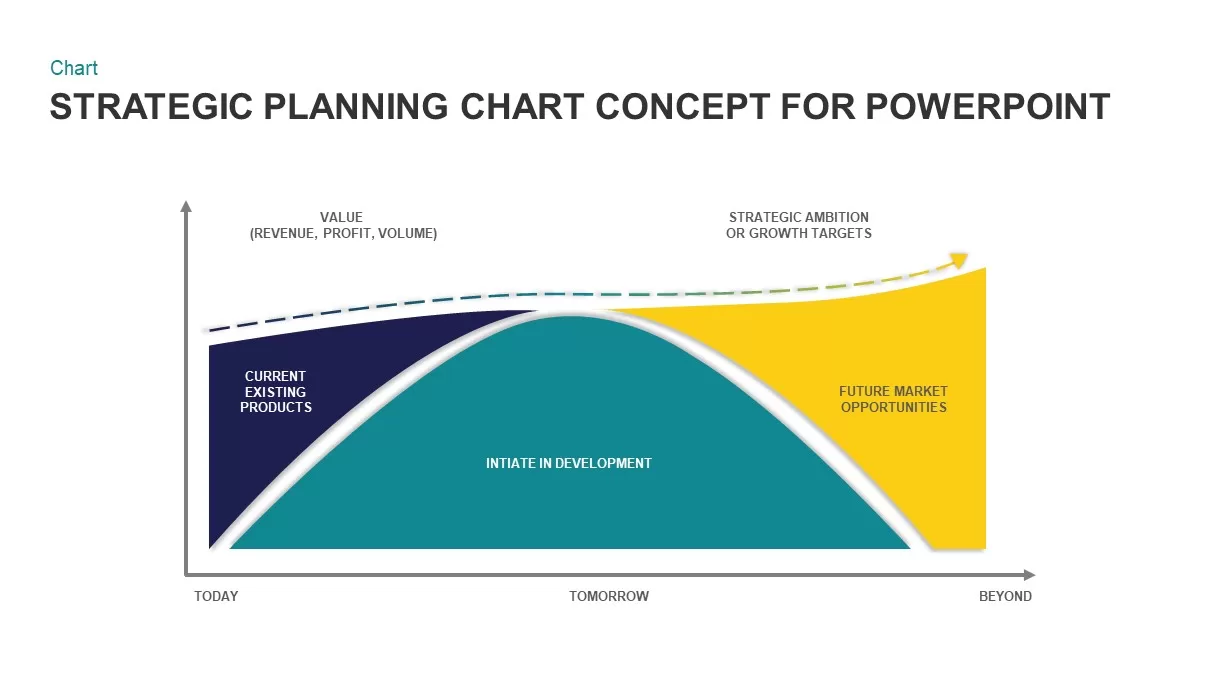
Strategic Planning Curve Diagram Template for PowerPoint & Google Slides
Charts
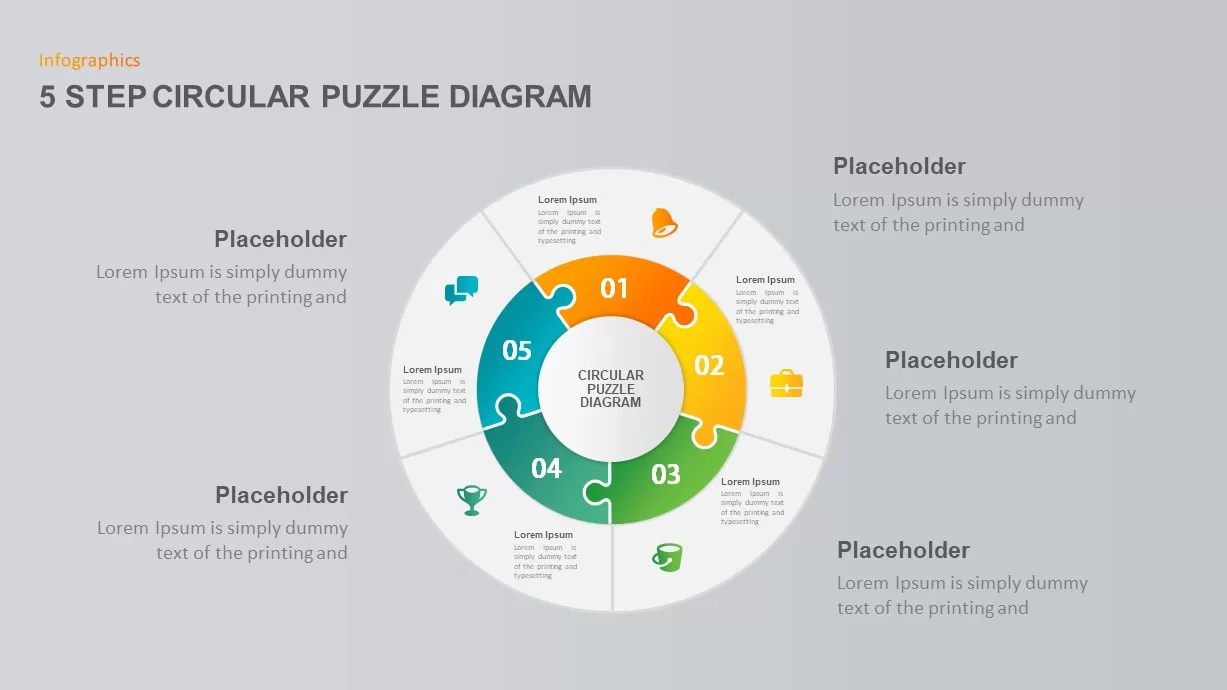
5-Step Circular Puzzle Diagram Template for PowerPoint & Google Slides
Circular
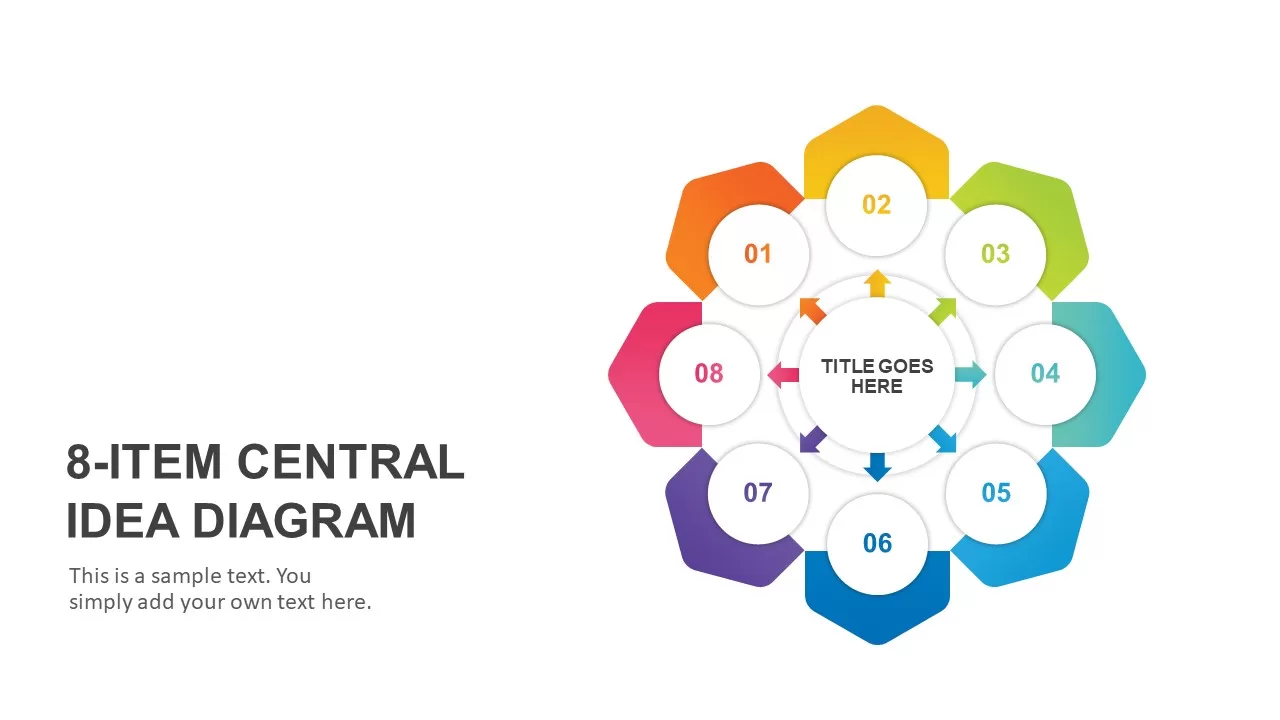
Eight-Item Central Idea Diagram Template for PowerPoint & Google Slides
Circular
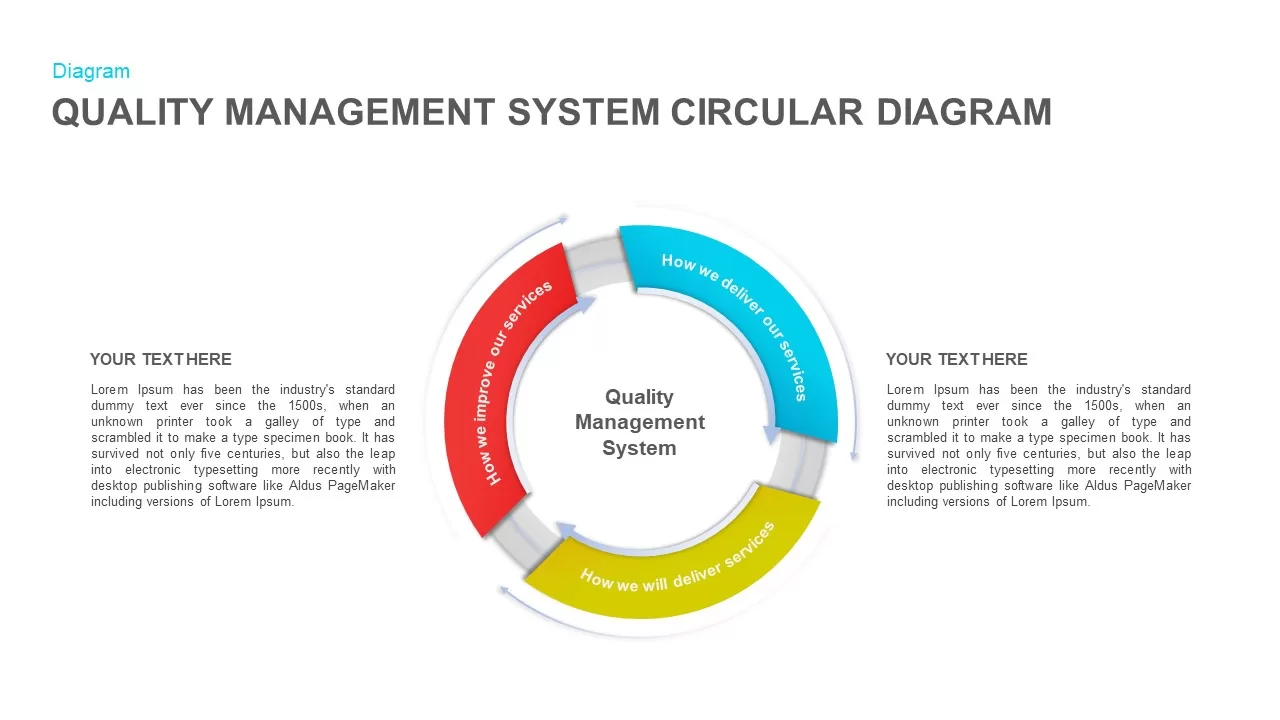
Quality Management System Circular Diagram template for PowerPoint & Google Slides
Process
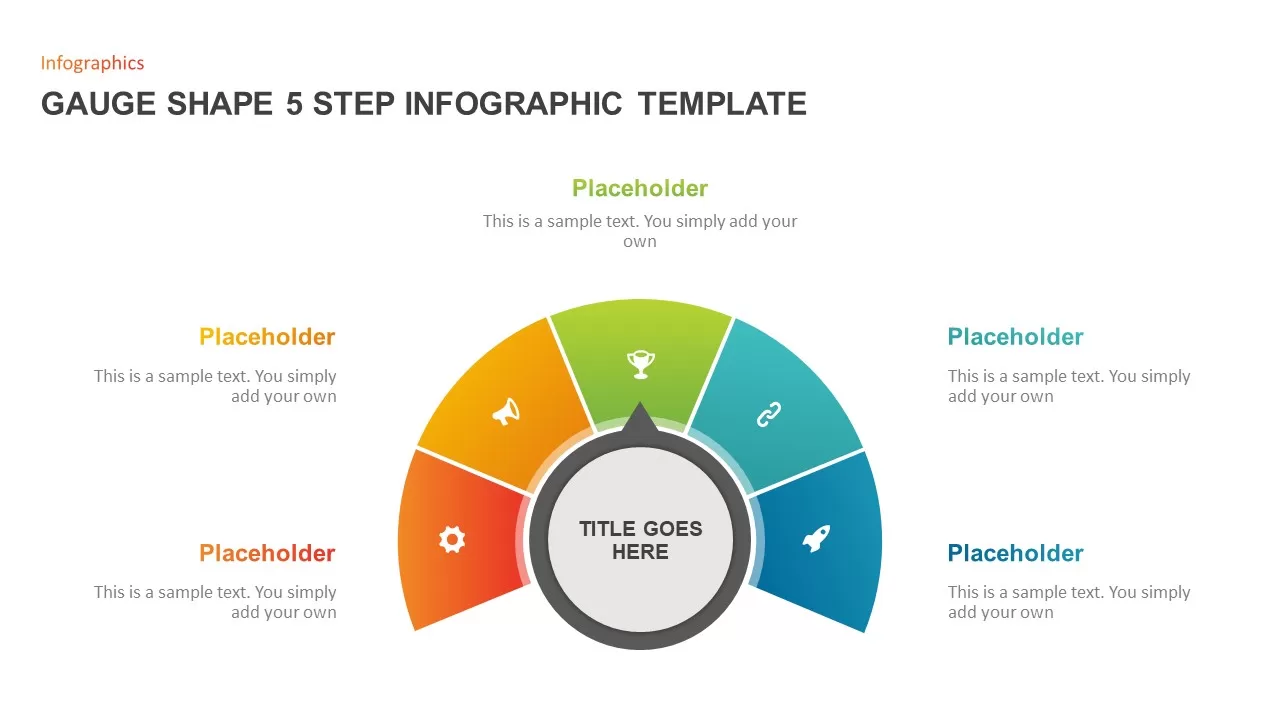
Gauge Shape 5-Step Infographic Diagram Template for PowerPoint & Google Slides
Process
Six-Step Circular Diagram Infographics Template for PowerPoint & Google Slides
Circular
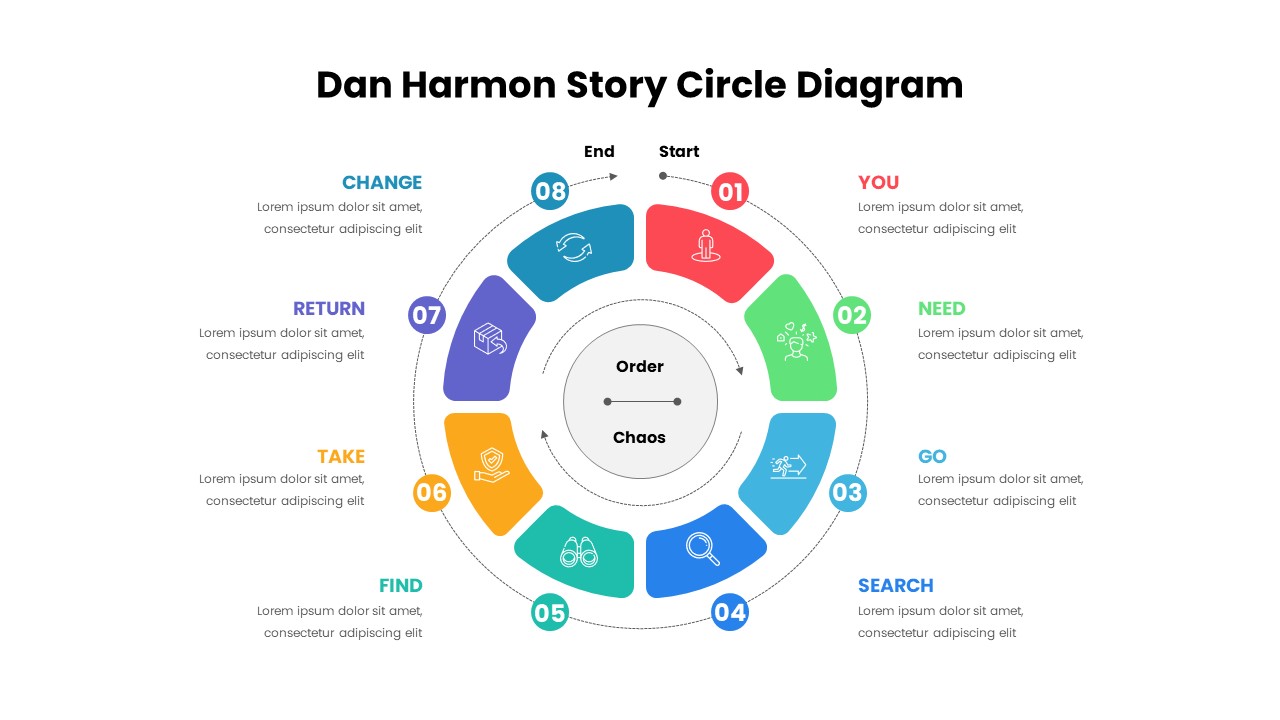
Dan Harmon Story Circle Diagram Template for PowerPoint & Google Slides
Circular
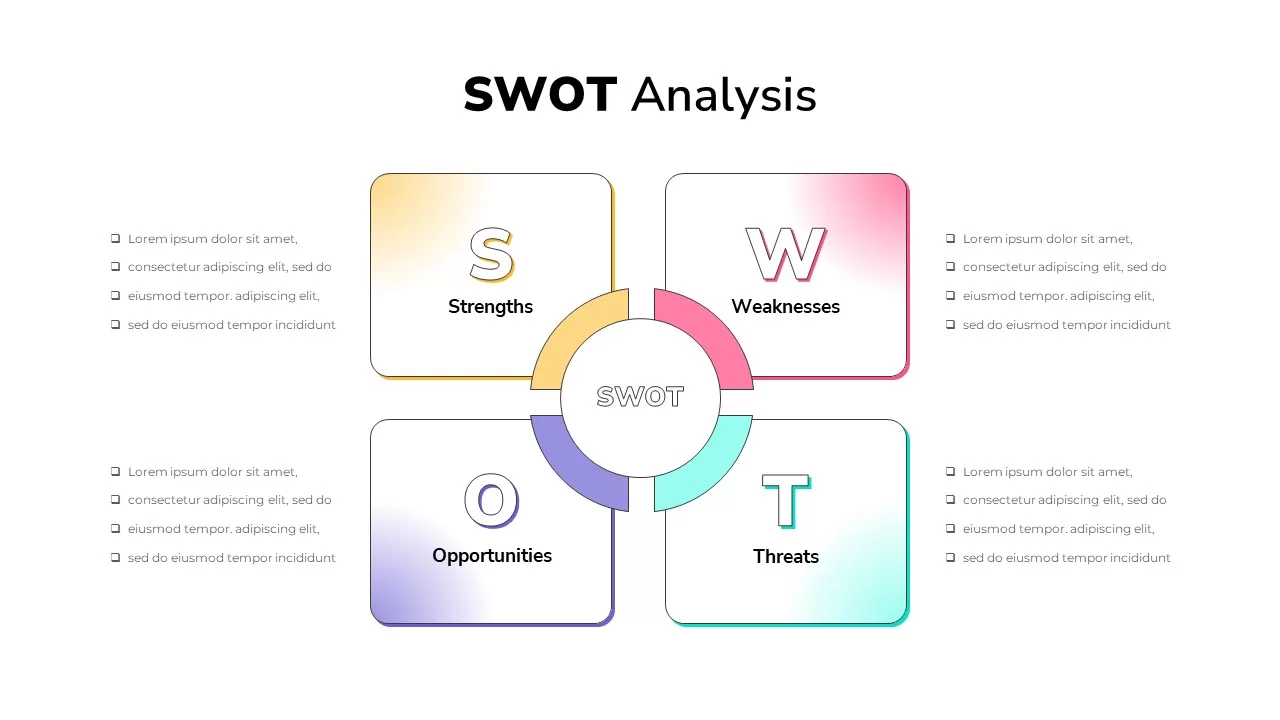
Gradient SWOT Quadrant Diagram Template for PowerPoint & Google Slides
SWOT
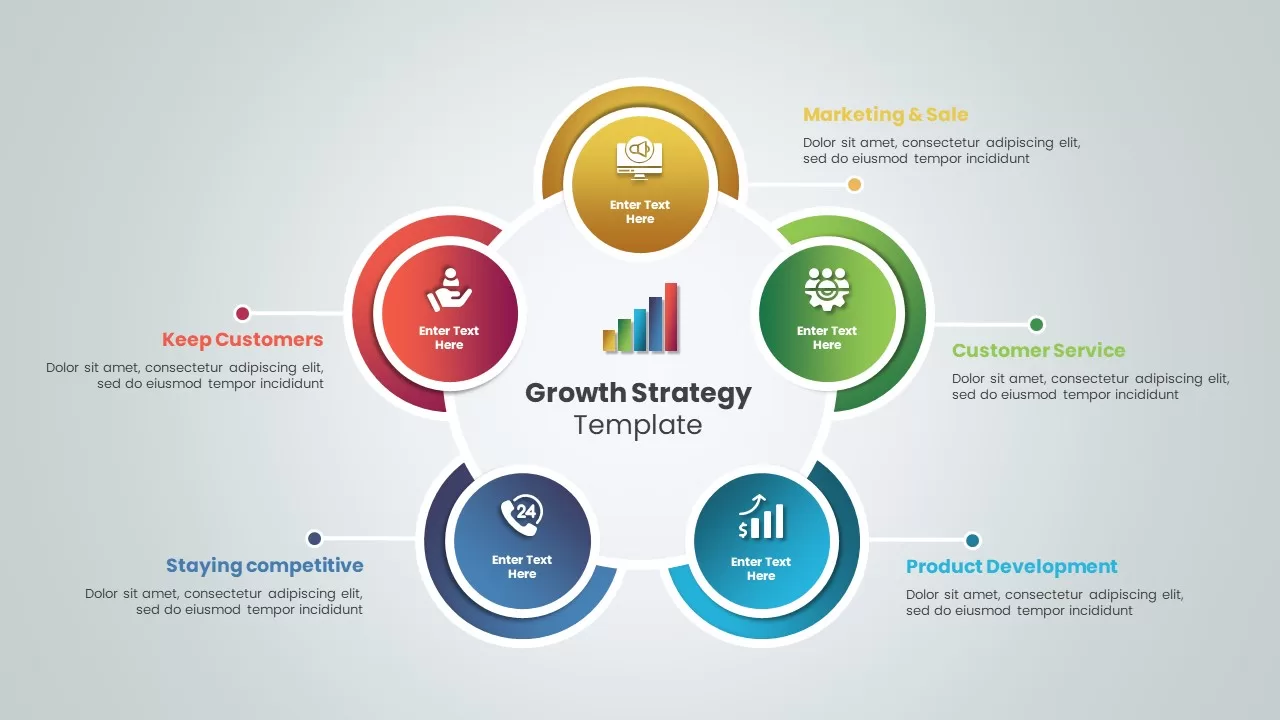
Growth Strategy Circular Diagram Template for PowerPoint & Google Slides
Circular
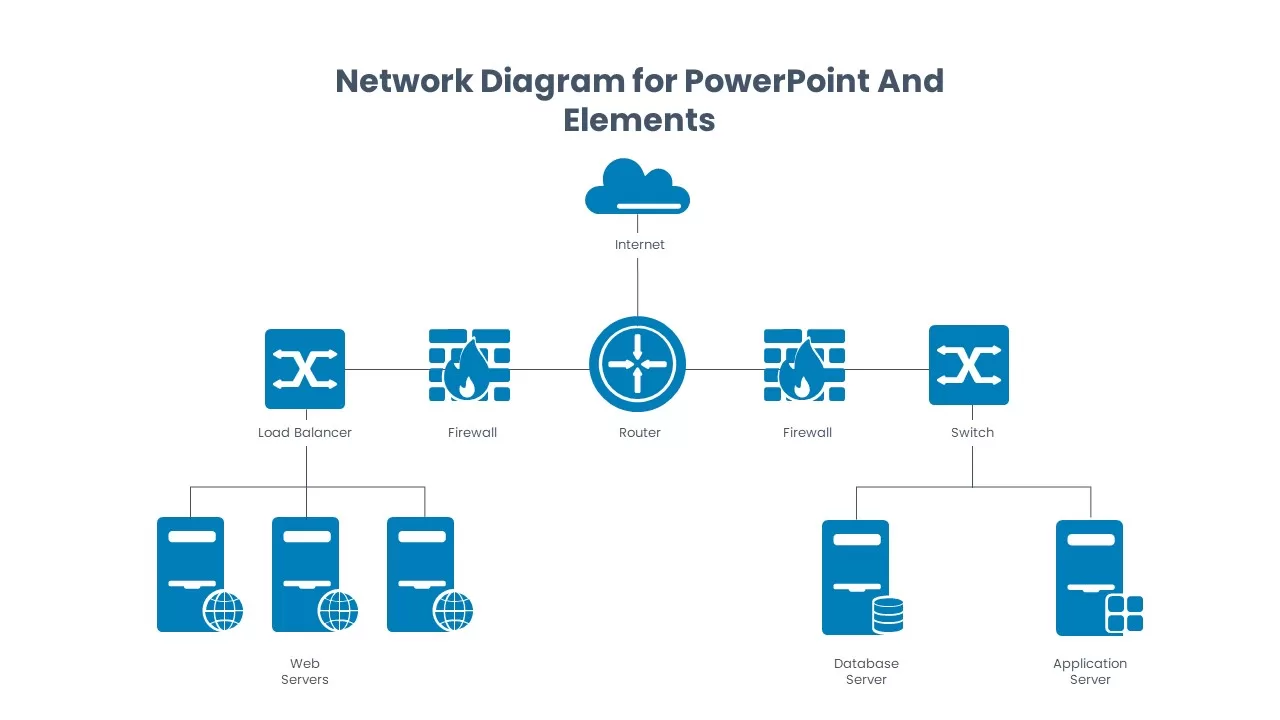
Network Diagram Elements and Icons Pack Template for PowerPoint & Google Slides
Information Technology
Curved Arrow Process Flow Diagram Template for PowerPoint & Google Slides
Process
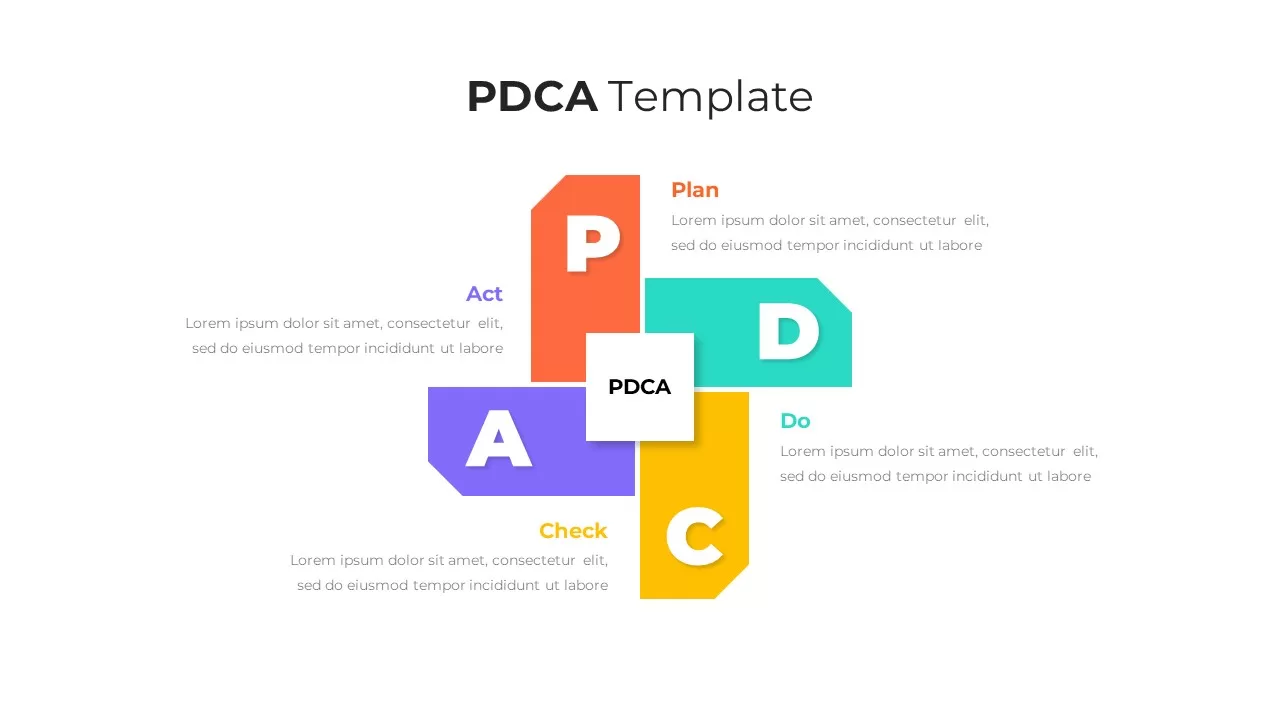
Elegant PDCA Four-Step Process Diagram Template for PowerPoint & Google Slides
Process
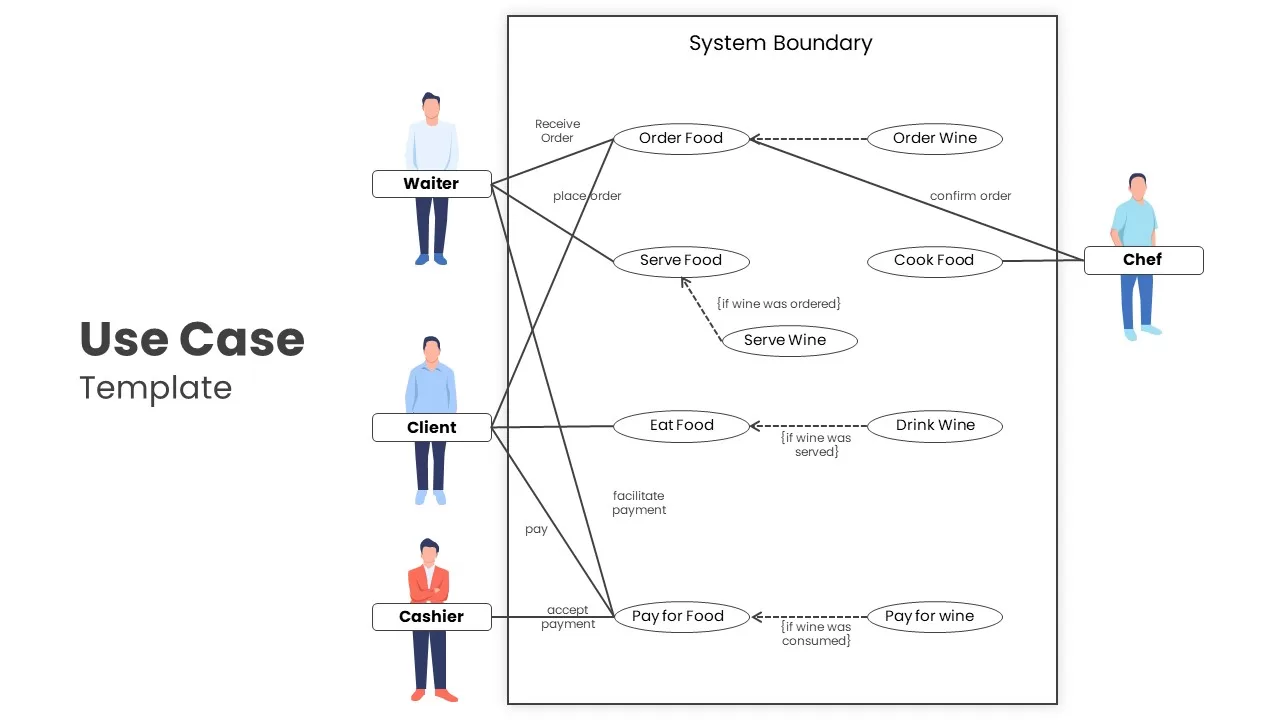
Restaurant Ordering Use Case Diagram Template for PowerPoint & Google Slides
Software Development
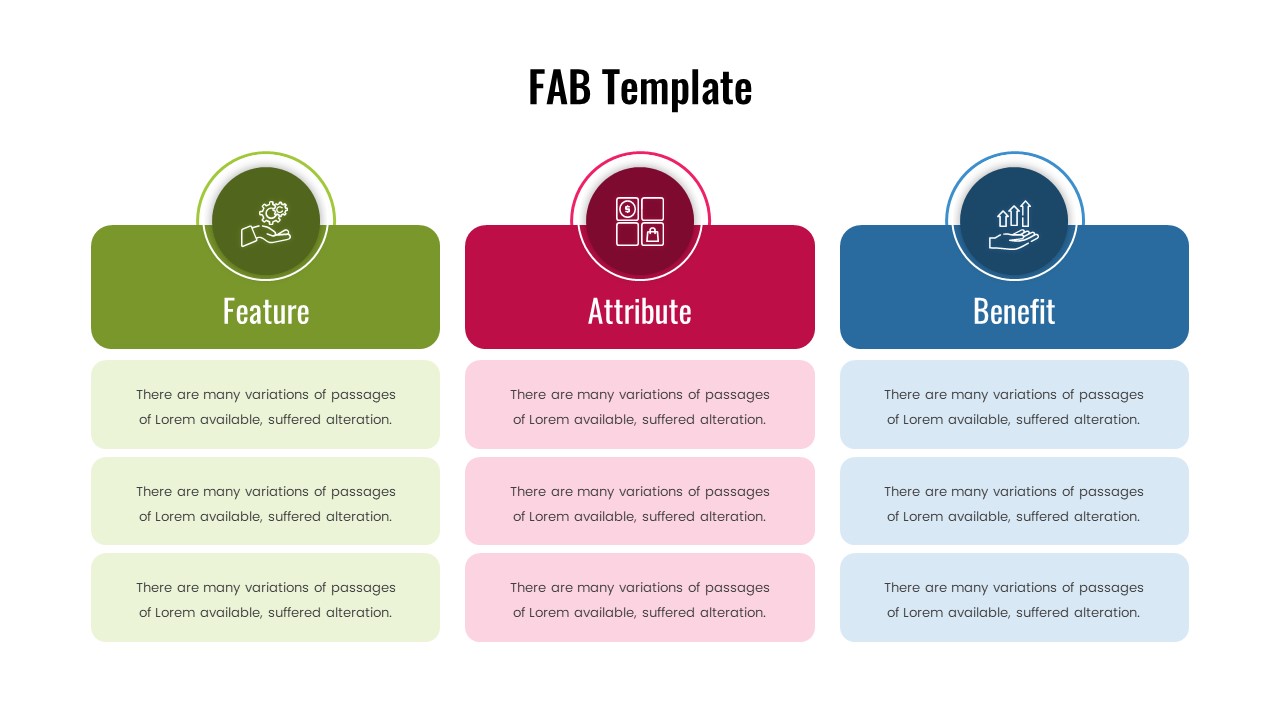
Feature-Attribute-Benefit (FAB) Diagram Template for PowerPoint & Google Slides
Comparison
E-Waste Management Process Flow Diagram Template for PowerPoint & Google Slides
Process
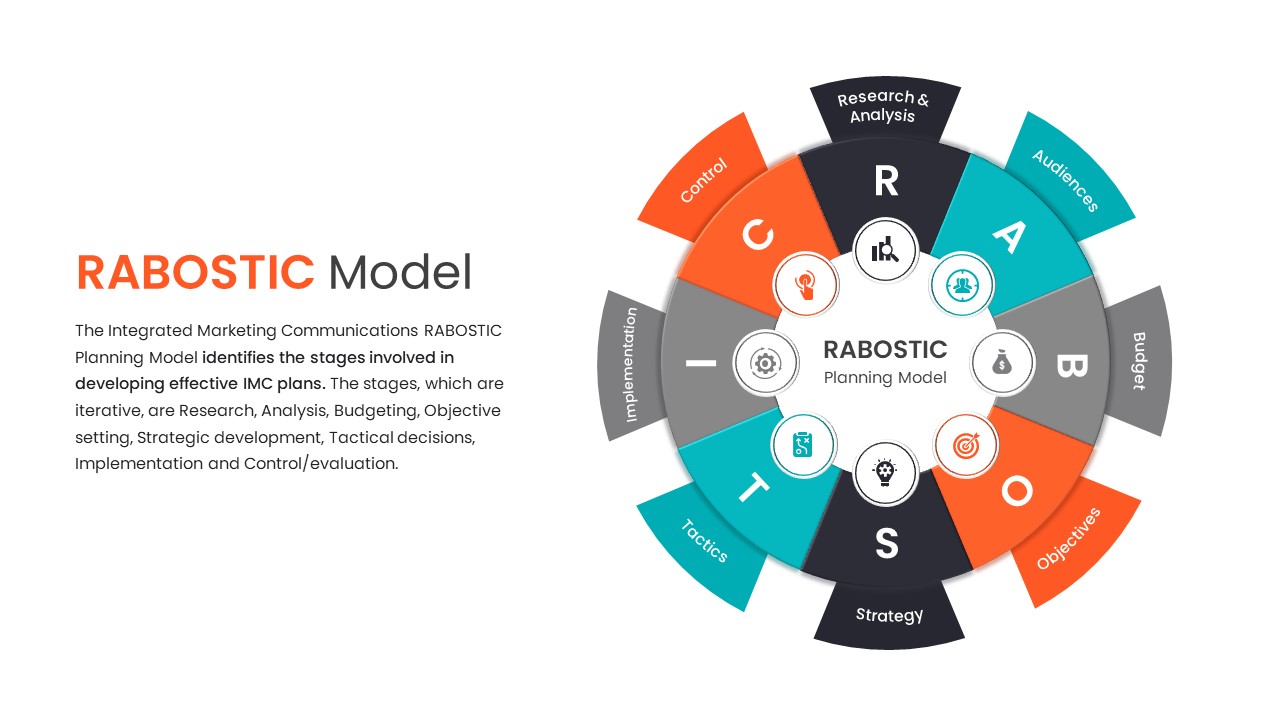
RABOSTIC IMC Planning Model Diagram Template for PowerPoint & Google Slides
Process
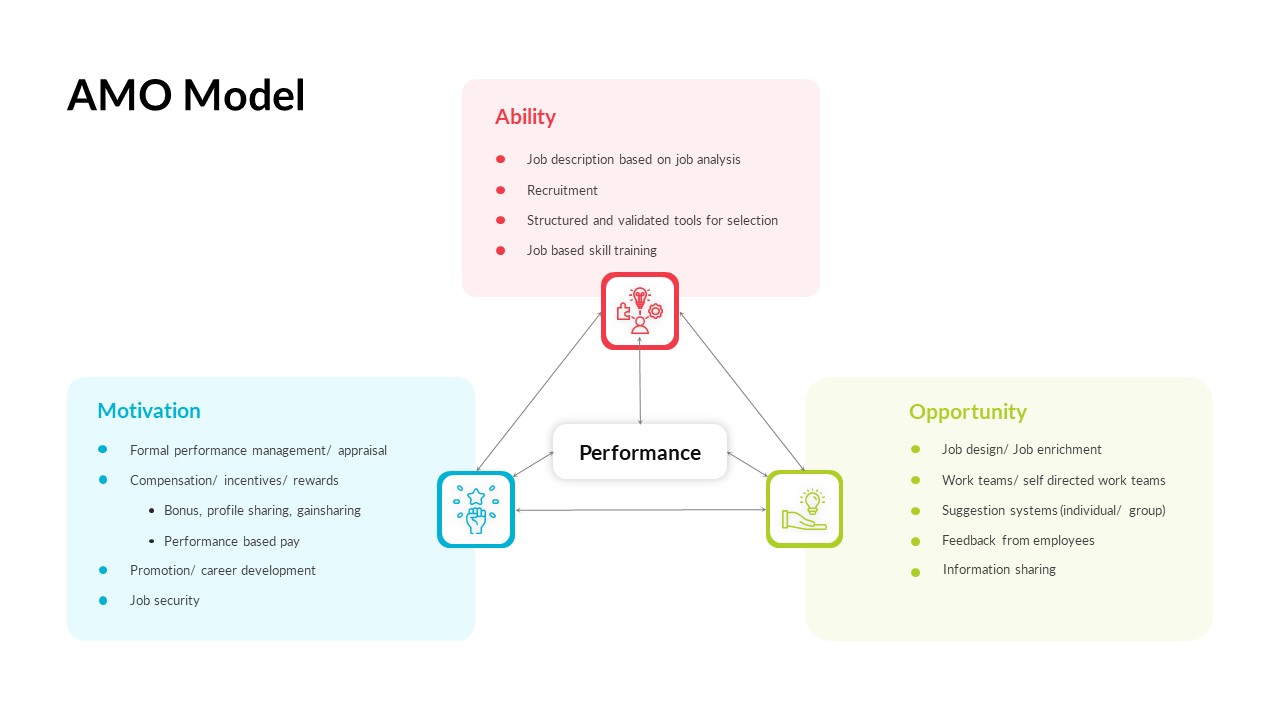
AMO Performance Model Feedback Diagram Template for PowerPoint & Google Slides
Employee Performance
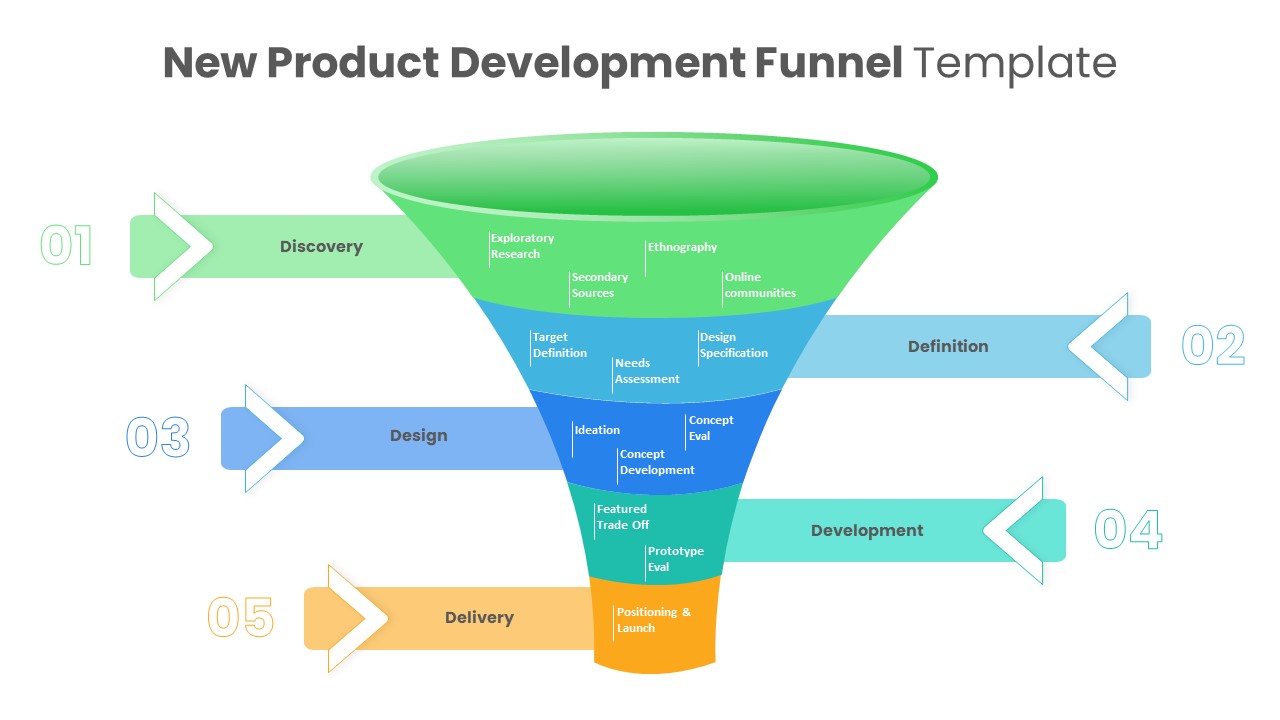
New Product Development Funnel Diagram Template for PowerPoint & Google Slides
Funnel
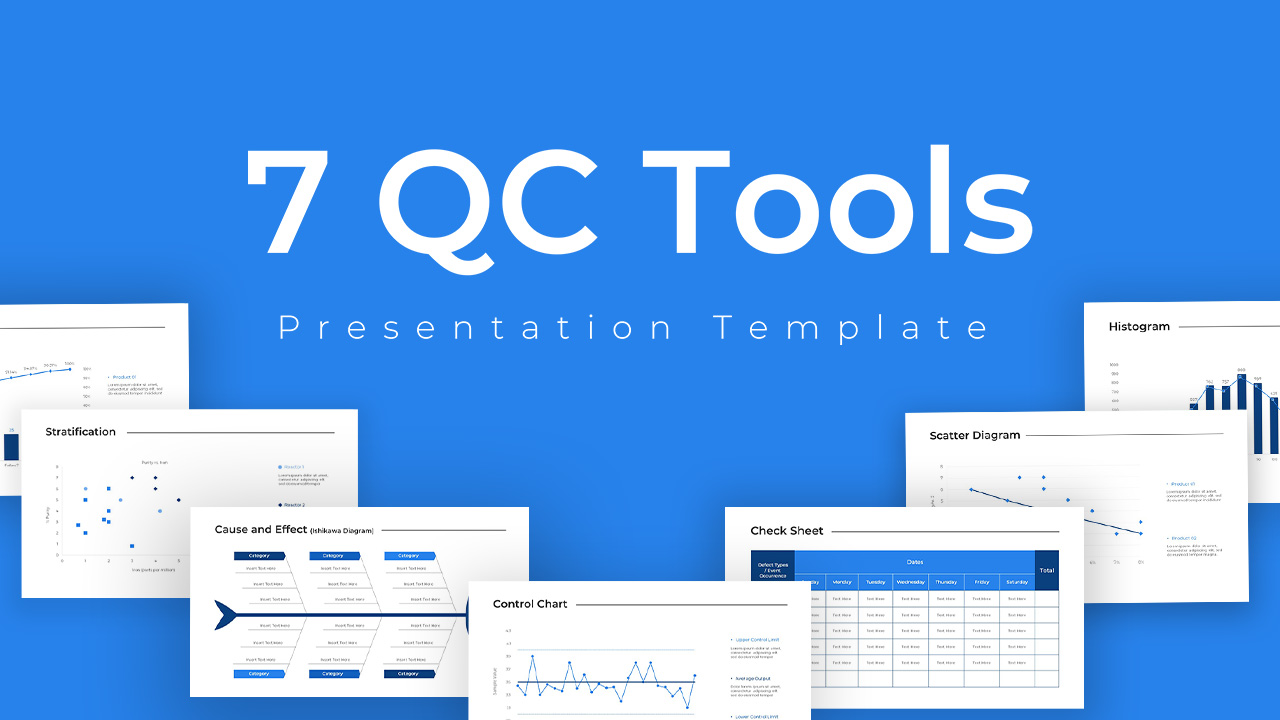
Seven Quality Control Tools Diagram Template for PowerPoint & Google Slides
Decks
Multi-Variation Circular Chart Diagram Template for PowerPoint & Google Slides
Circular
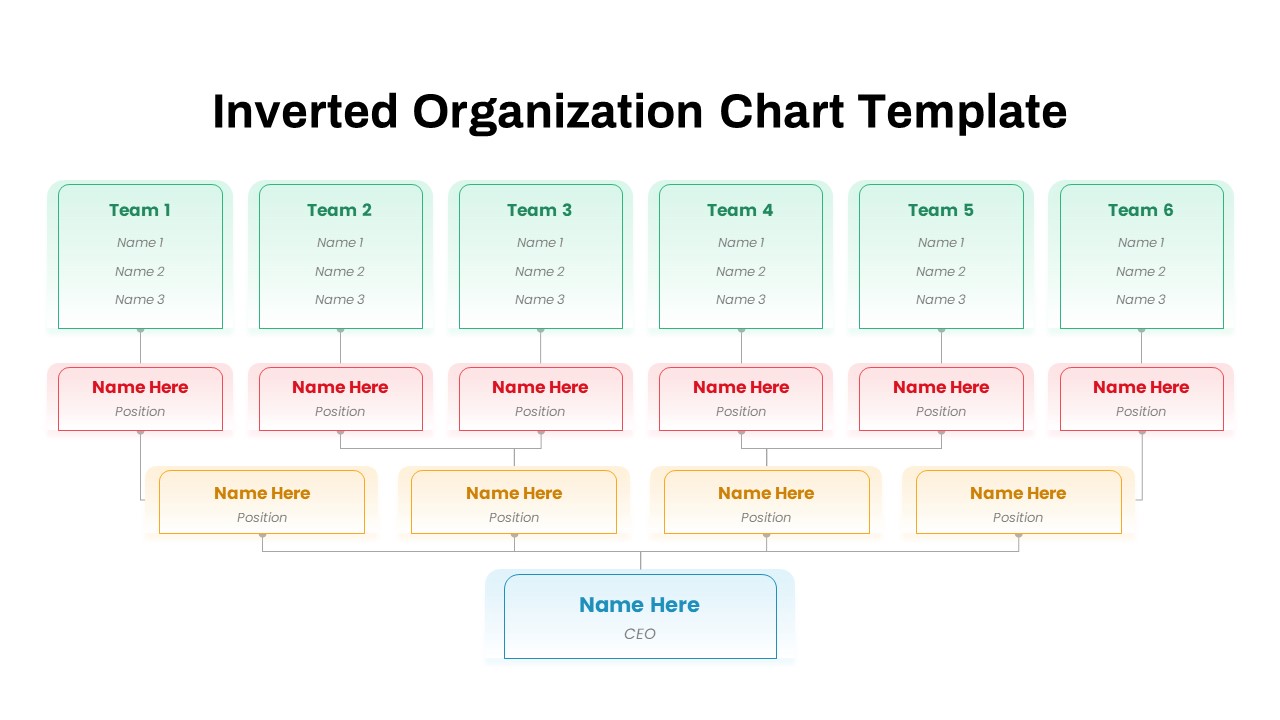
Inverted Organization Chart Diagram Template for PowerPoint & Google Slides
Org Chart
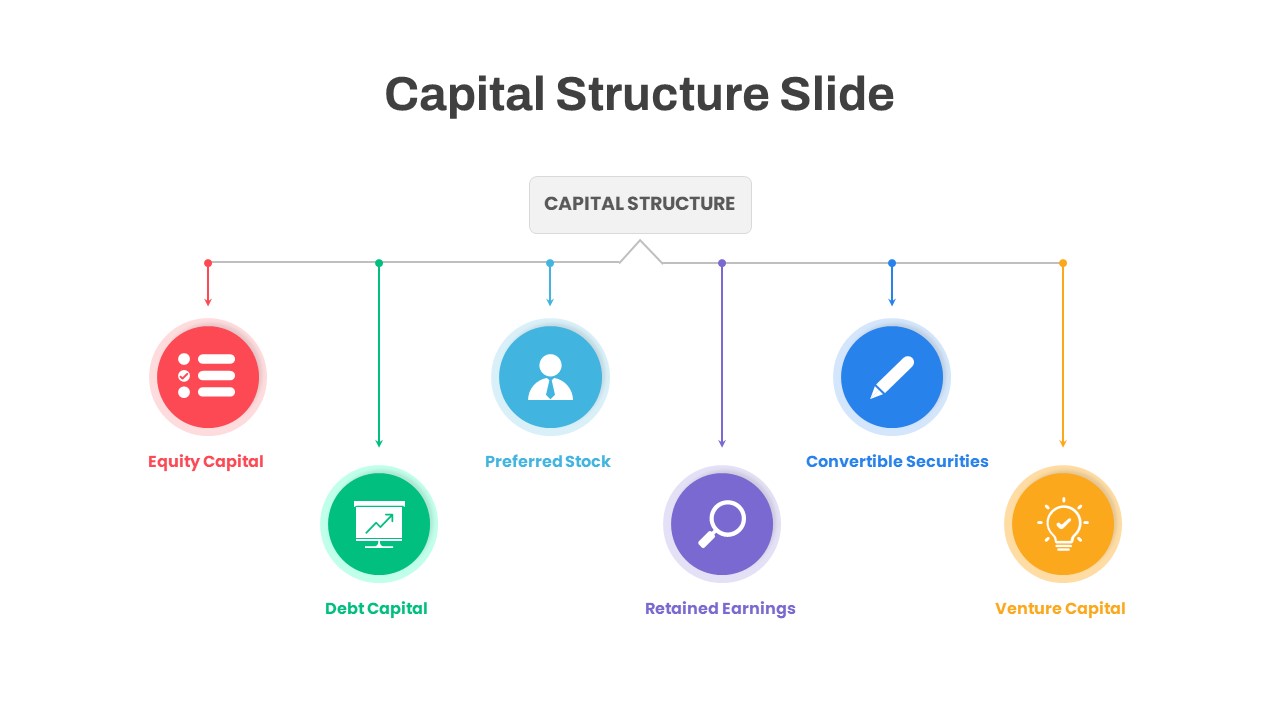
Capital Structure Hub & Spoke Diagram Template for PowerPoint & Google Slides
Process
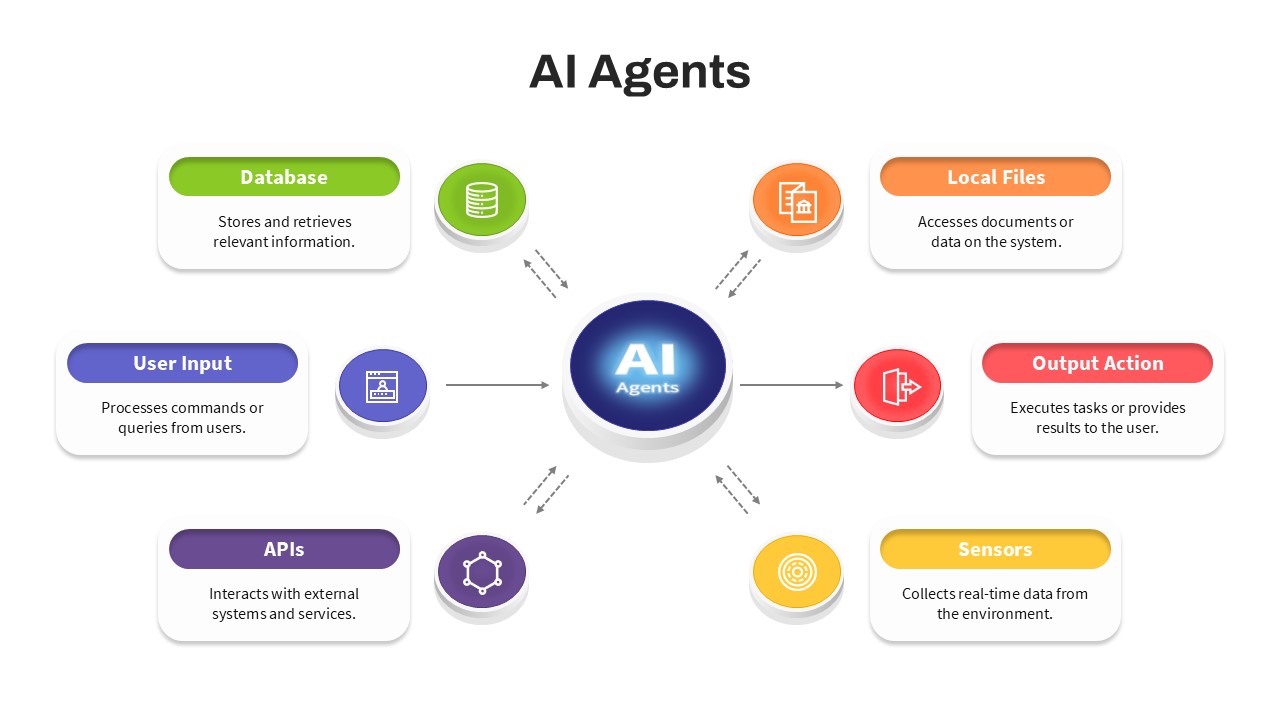
AI Agents Hub and Spoke Diagram Template for PowerPoint & Google Slides
AI
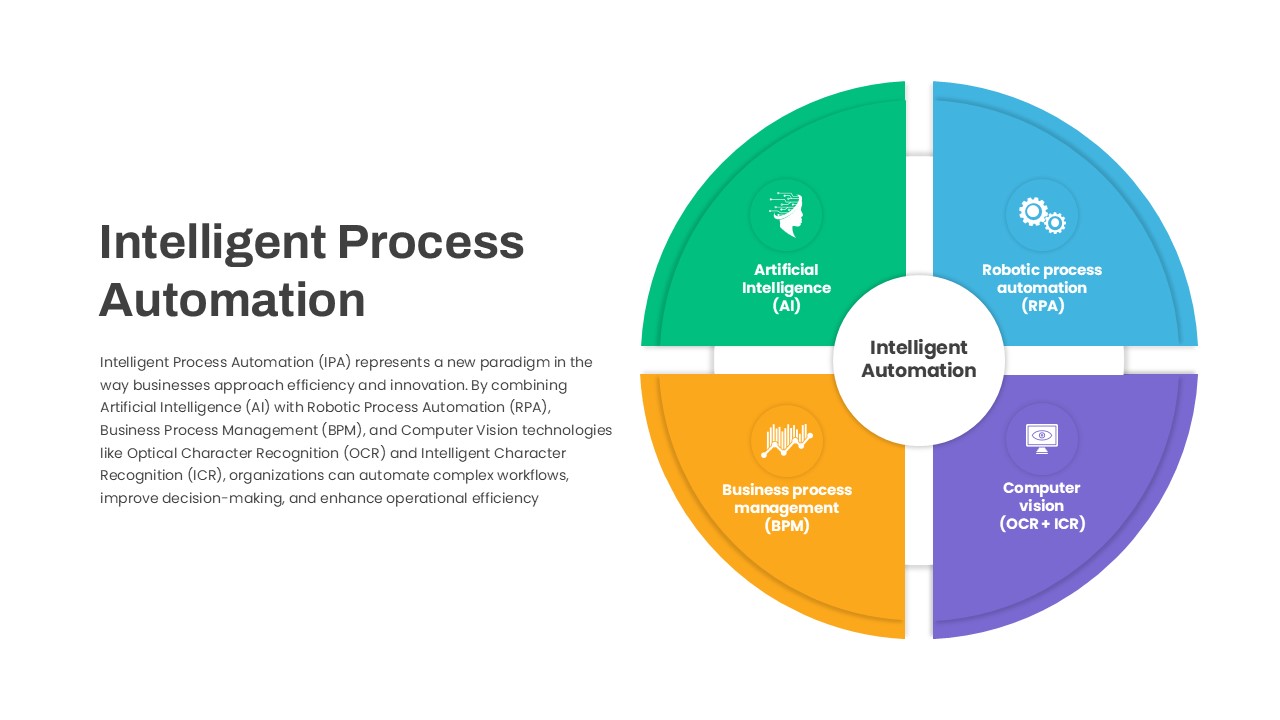
Intelligent Process Automation Diagram Template for PowerPoint & Google Slides
Circular
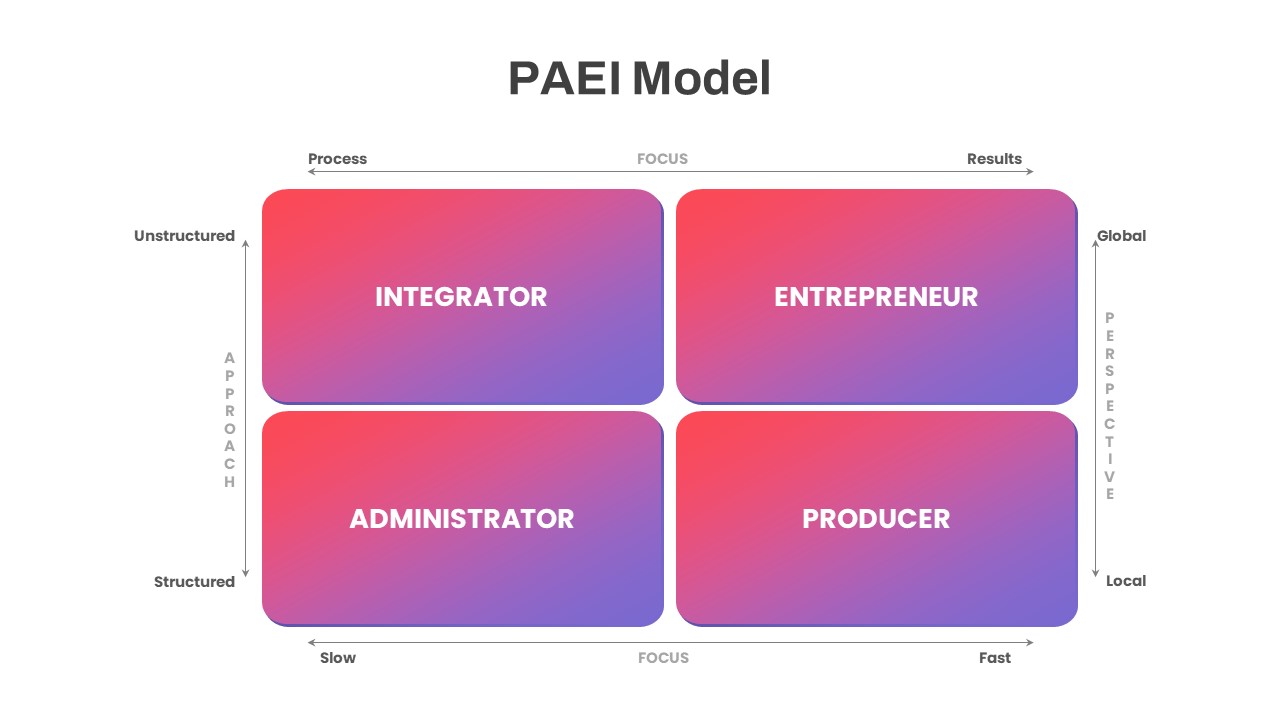
PAEI Leadership Roles 2×2 Matrix Diagram Template for PowerPoint & Google Slides
Business Models
Two-Sided Coin Comparison Diagram Template for PowerPoint & Google Slides
Comparison
Change Management Process Cycle Diagram Template for PowerPoint & Google Slides
Process
Data-Driven Marketing Lifecycle Diagram Template for PowerPoint & Google Slides
Process
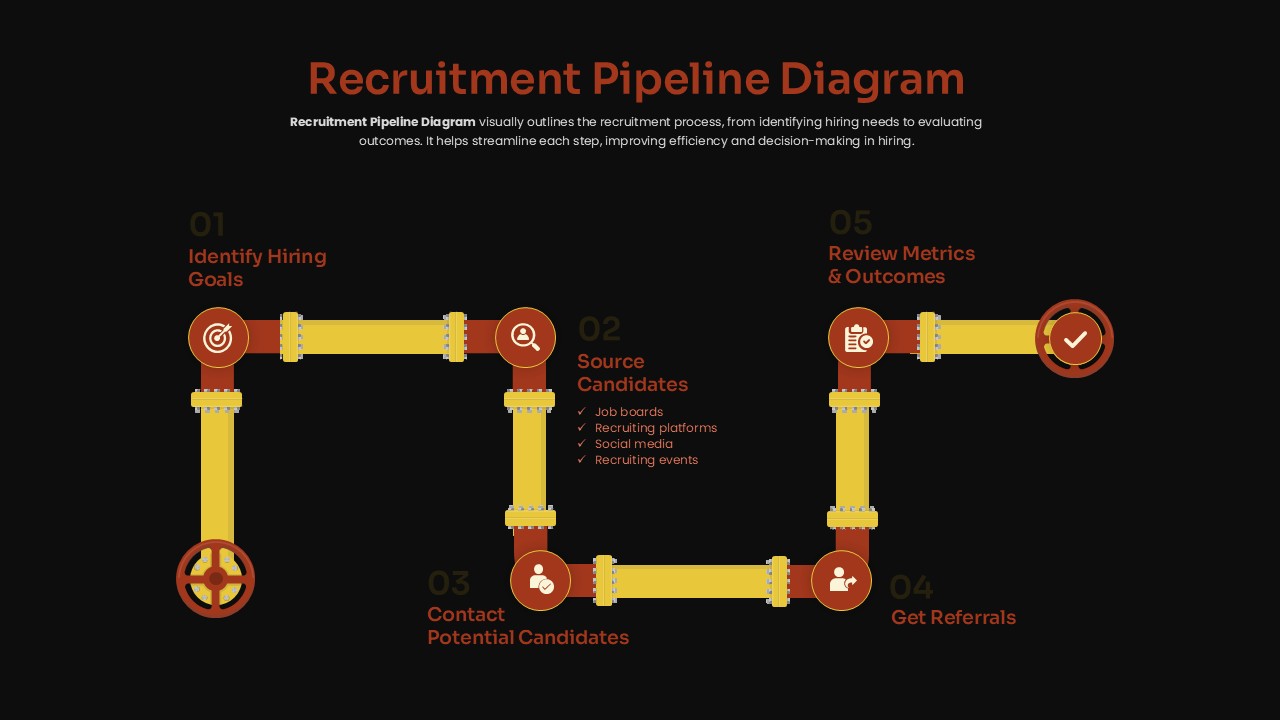
Recruitment Pipeline Flowchart Diagram Template for PowerPoint & Google Slides
Process
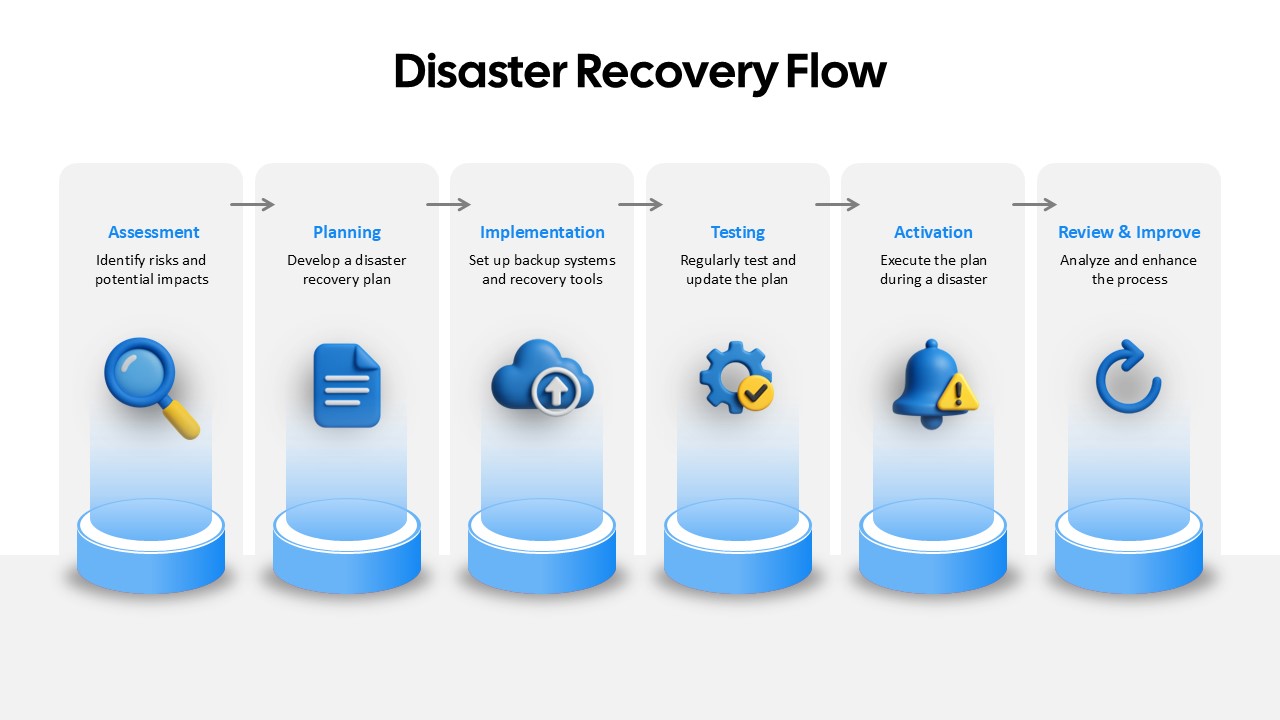
Disaster Recovery Flow Diagram Template for PowerPoint & Google Slides
Process
Customer Experience Journey Diagram Template for PowerPoint & Google Slides
Customer Journey
Tech Stack Diagram Template for PowerPoint & Google Slides
Information Technology