Pyramid infographic template for PowerPoint & Google Slides
Description
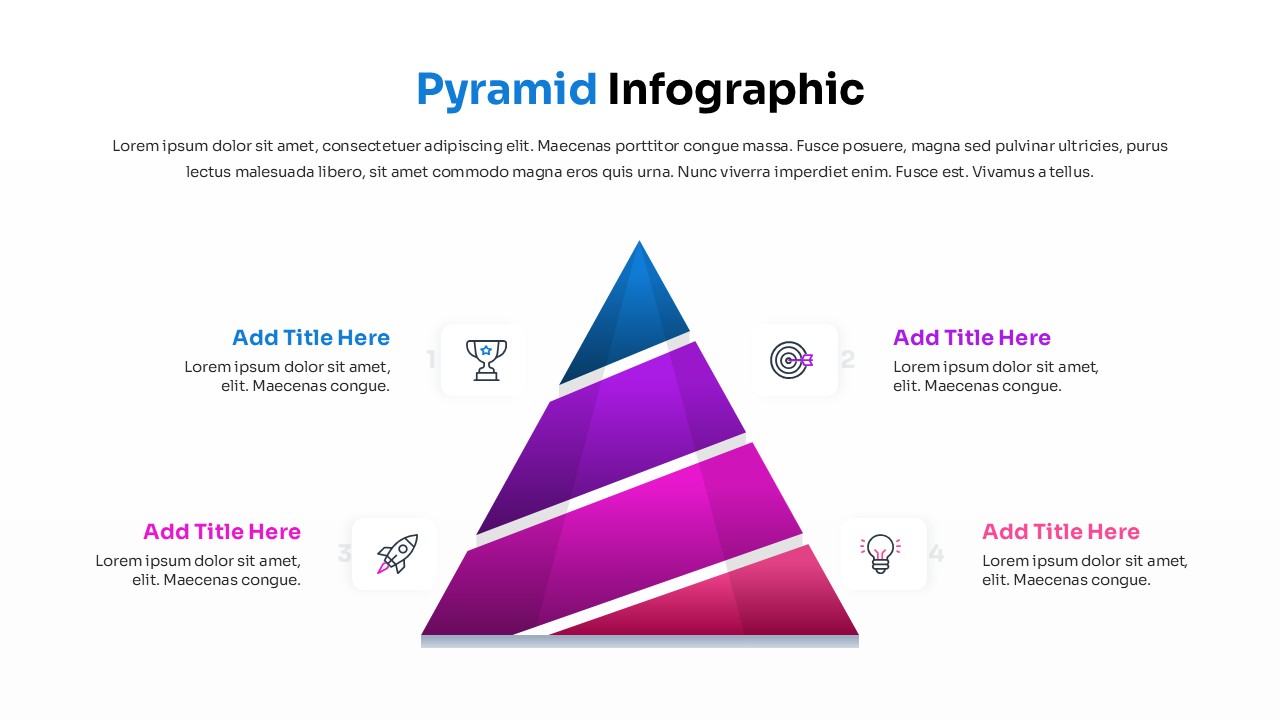
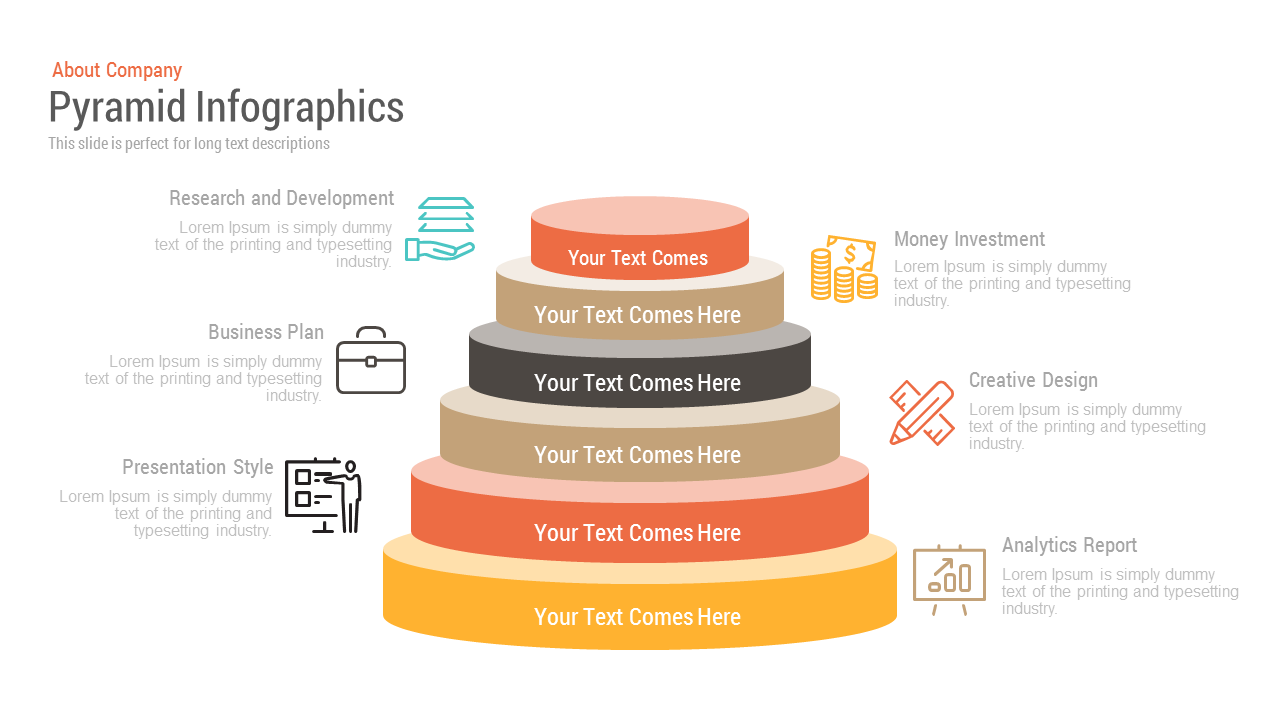
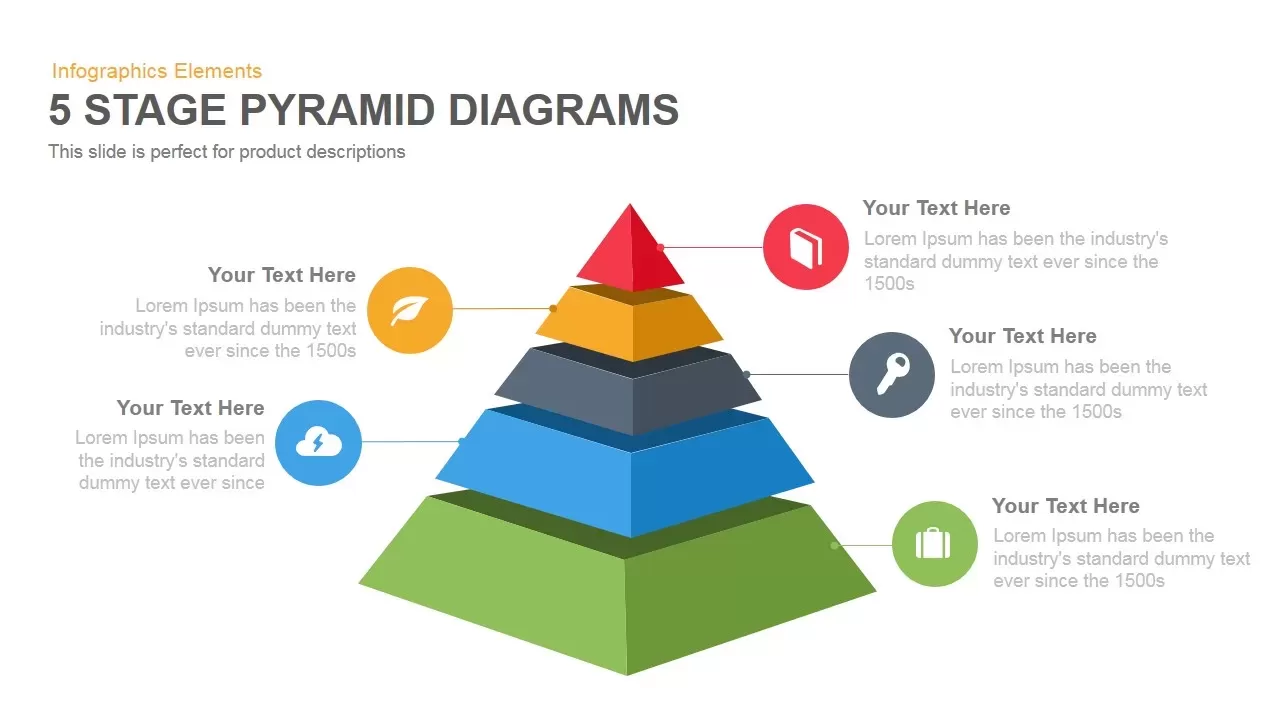
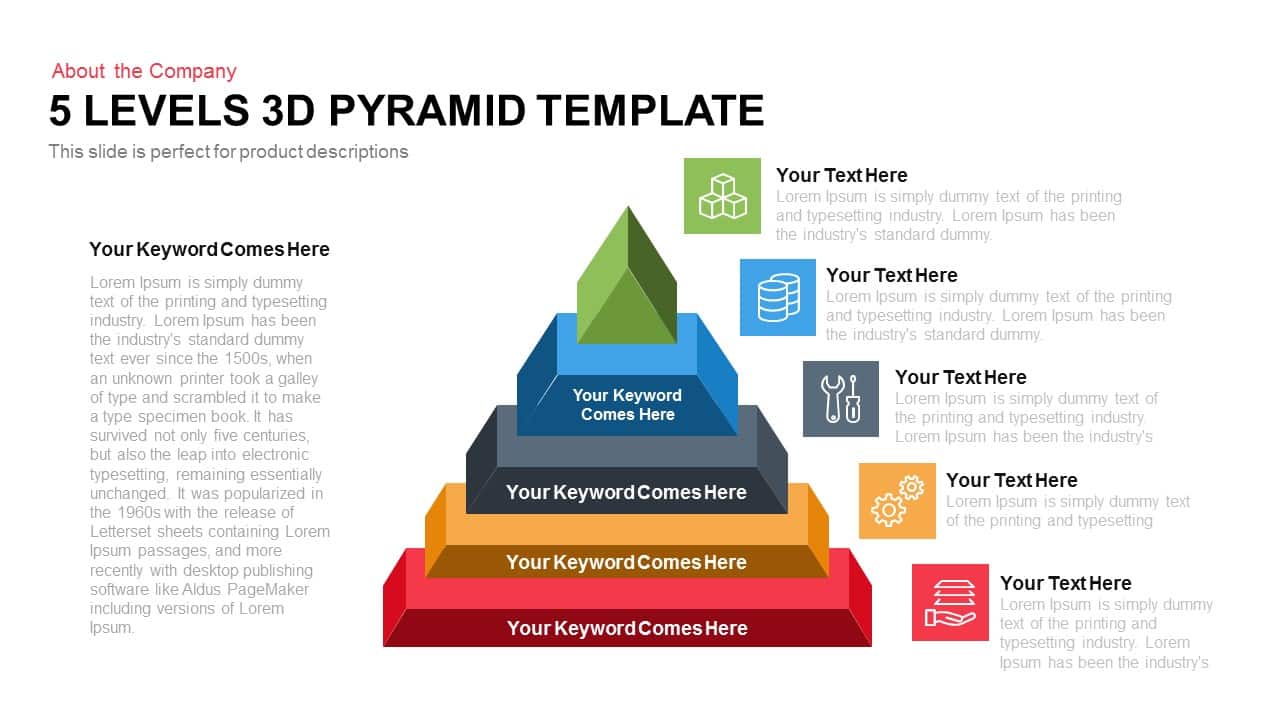
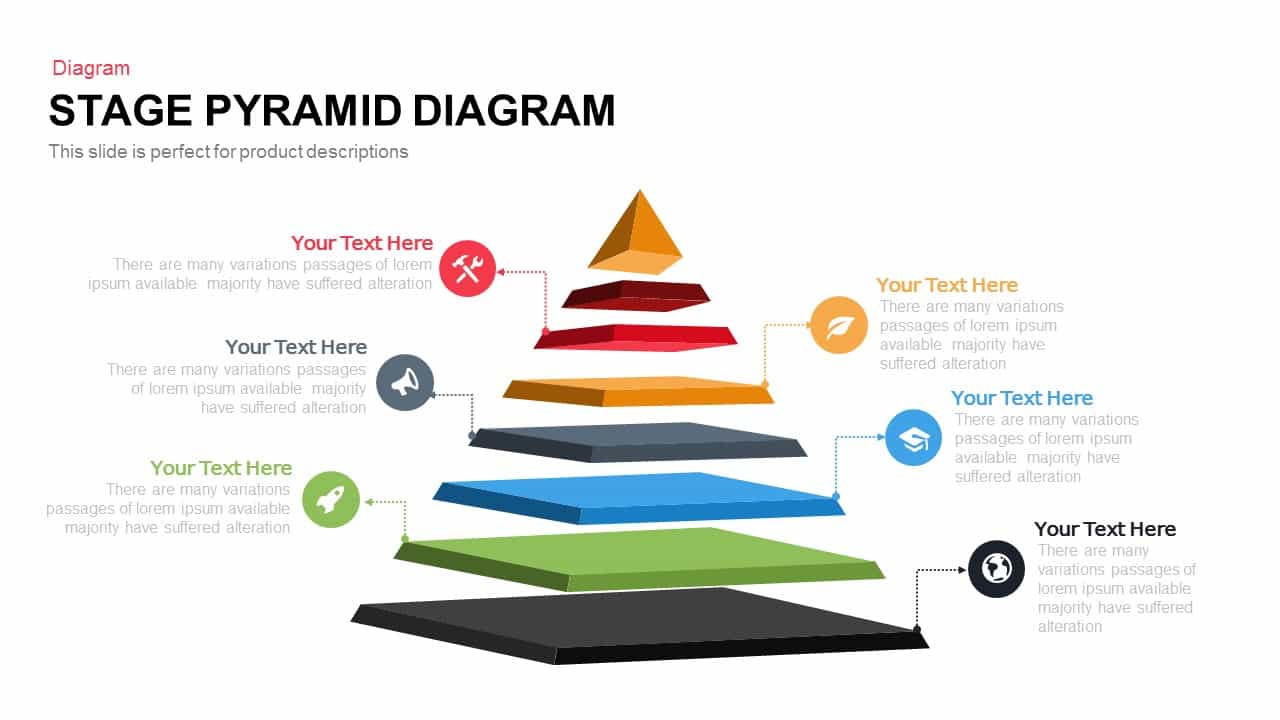
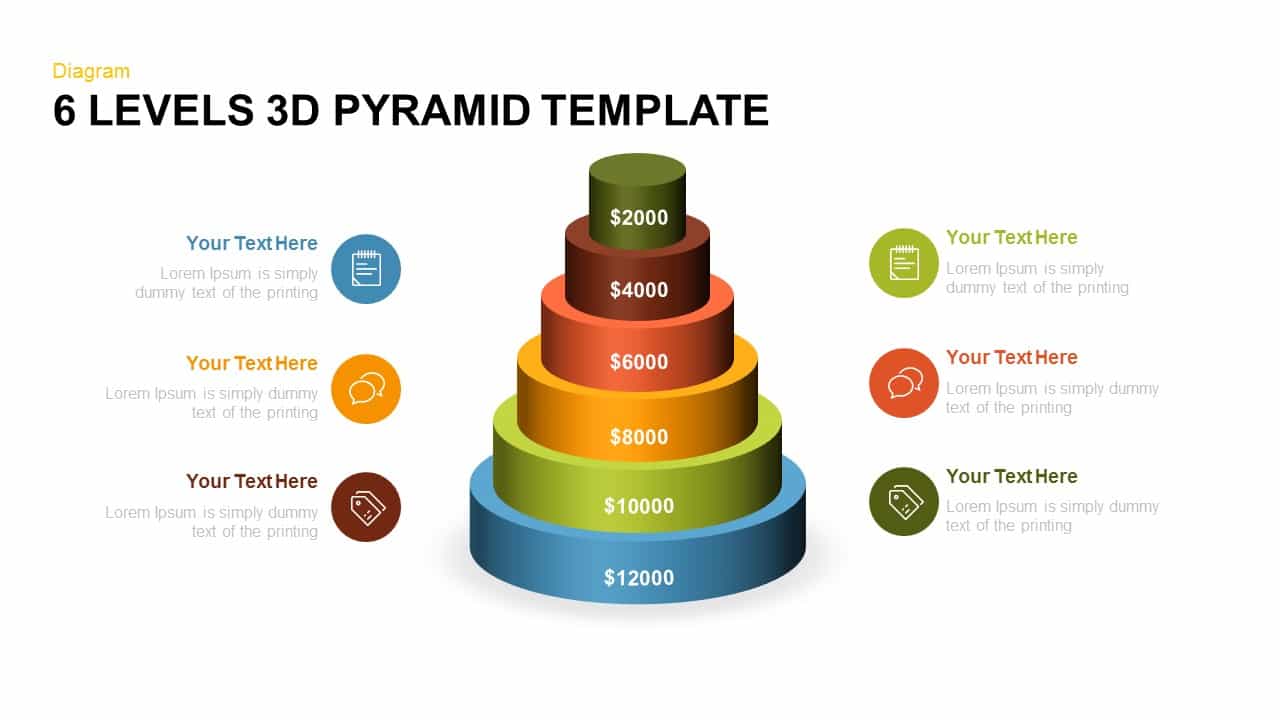
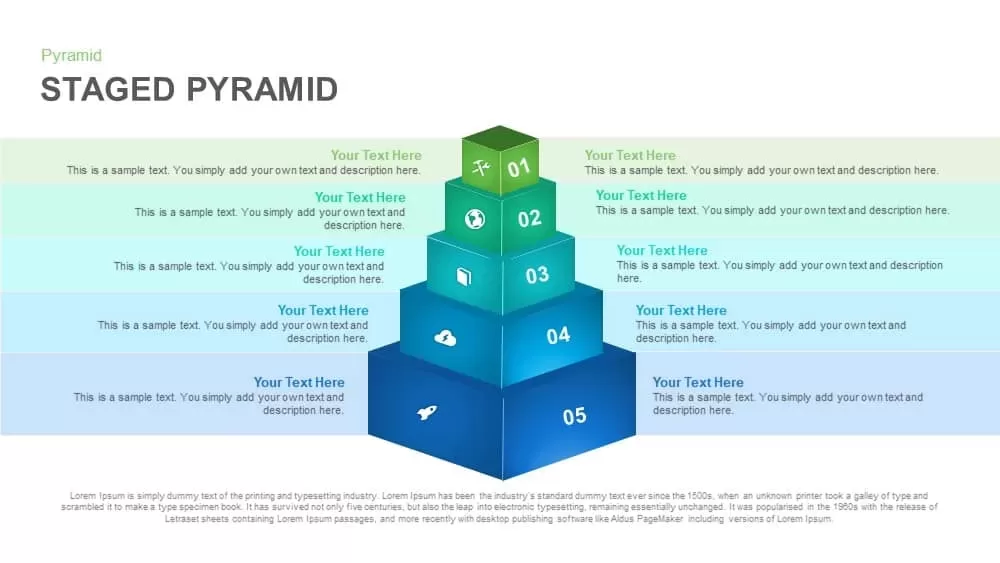
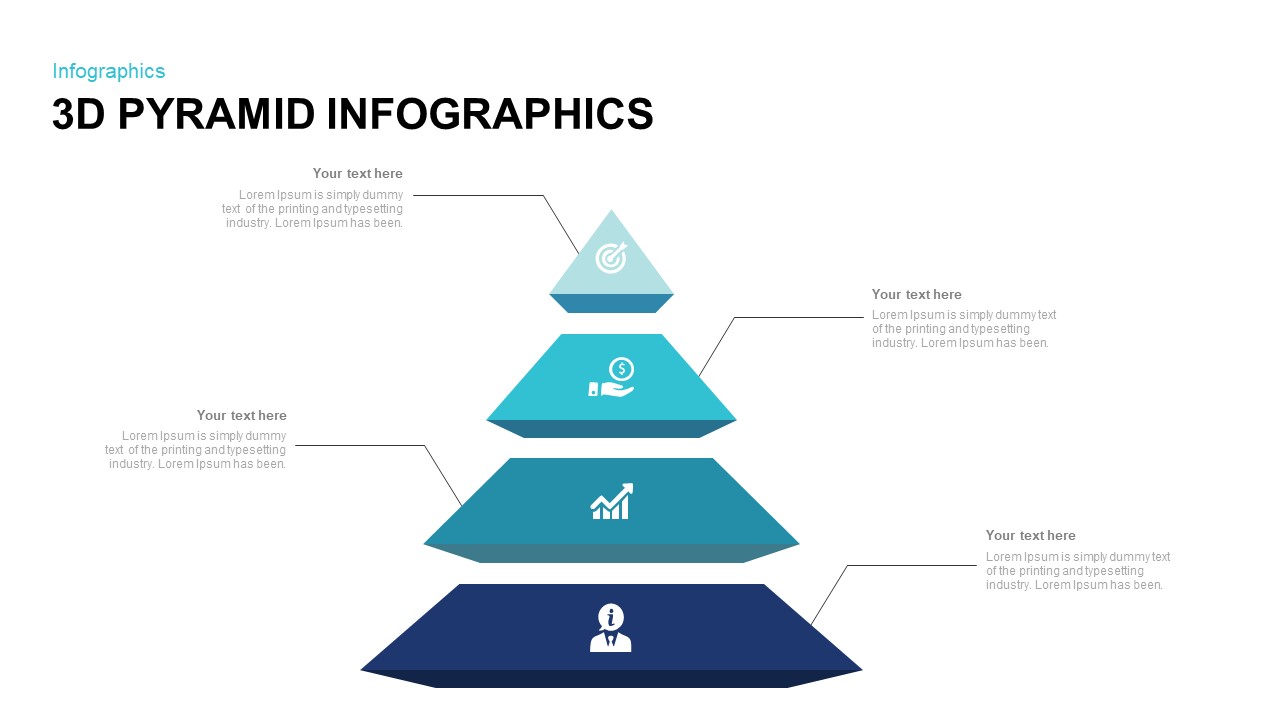
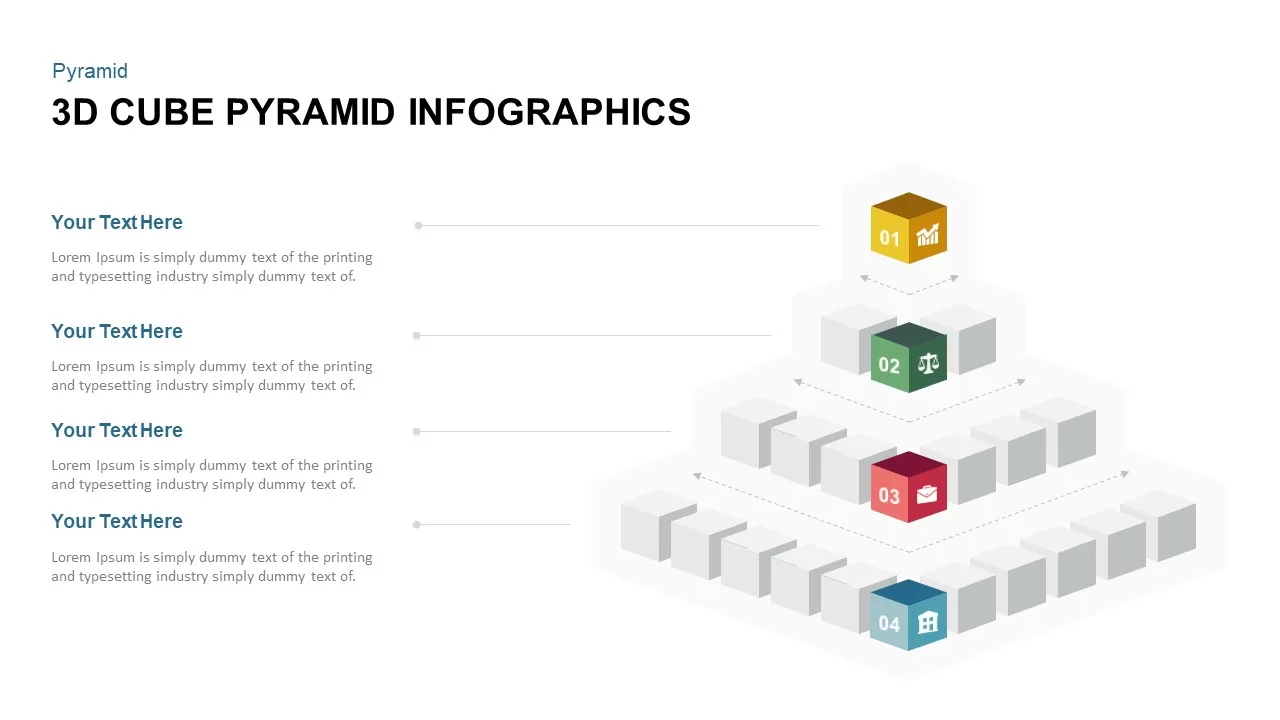
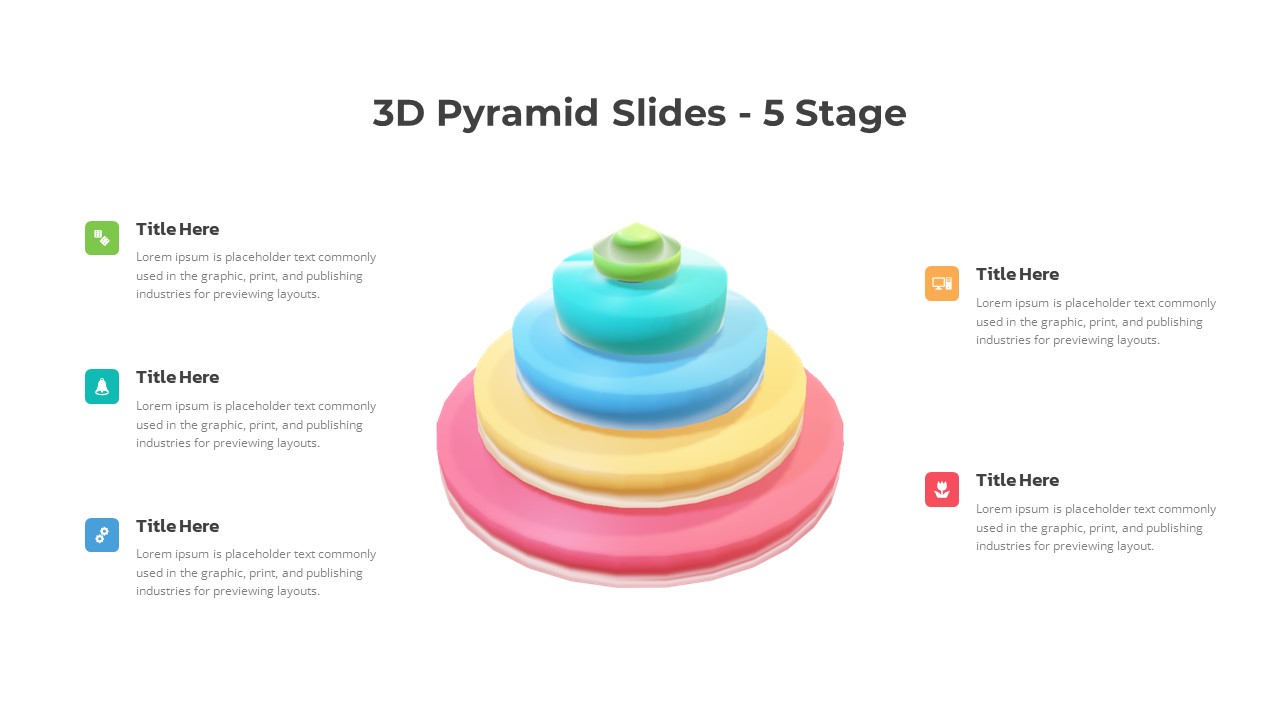
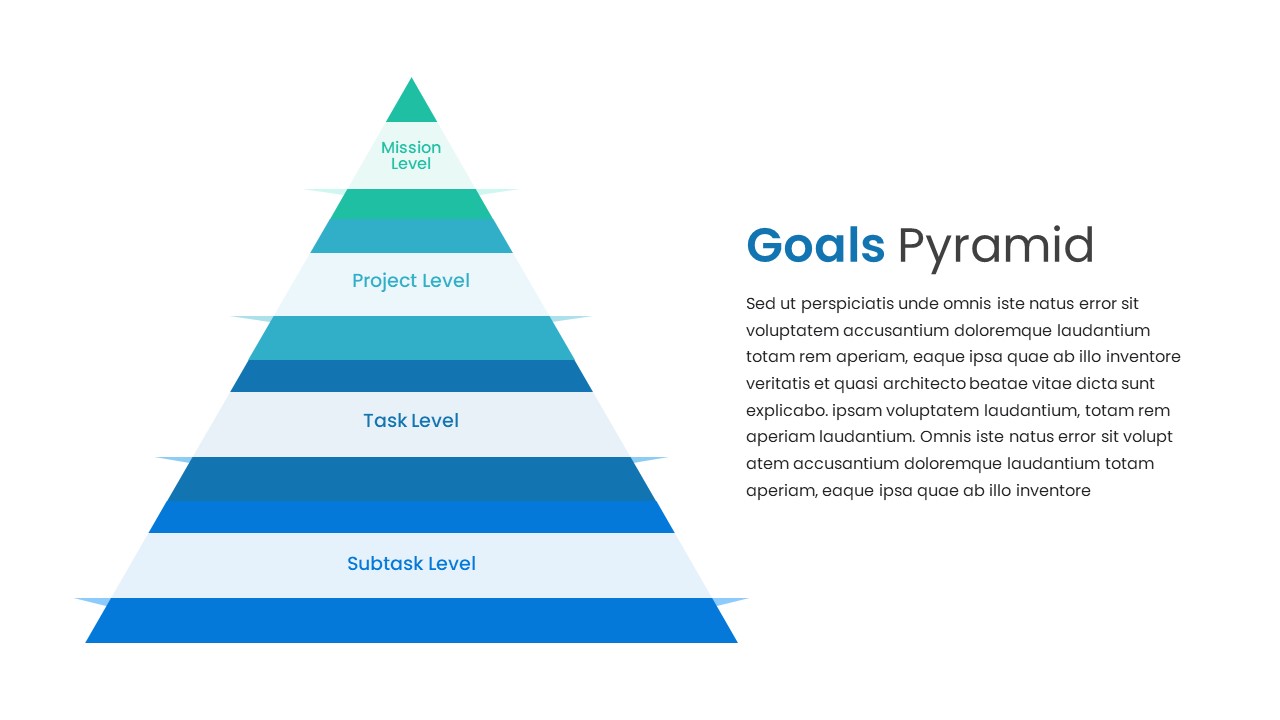
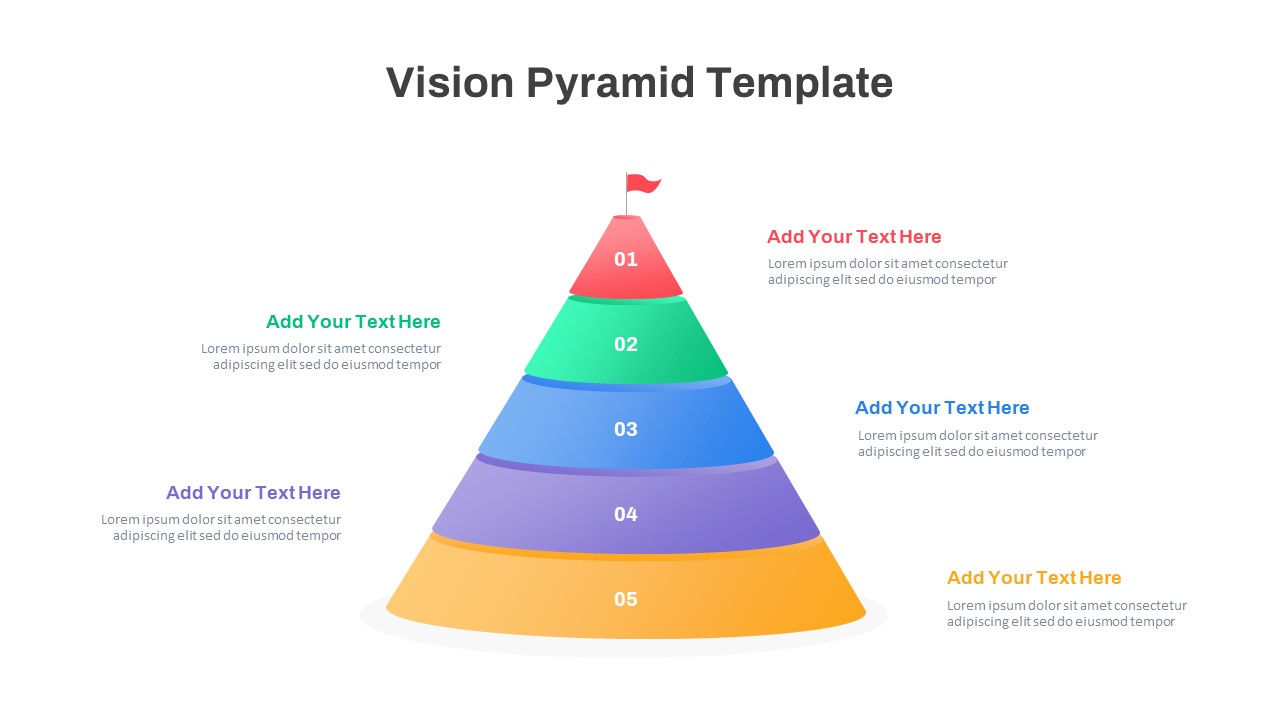
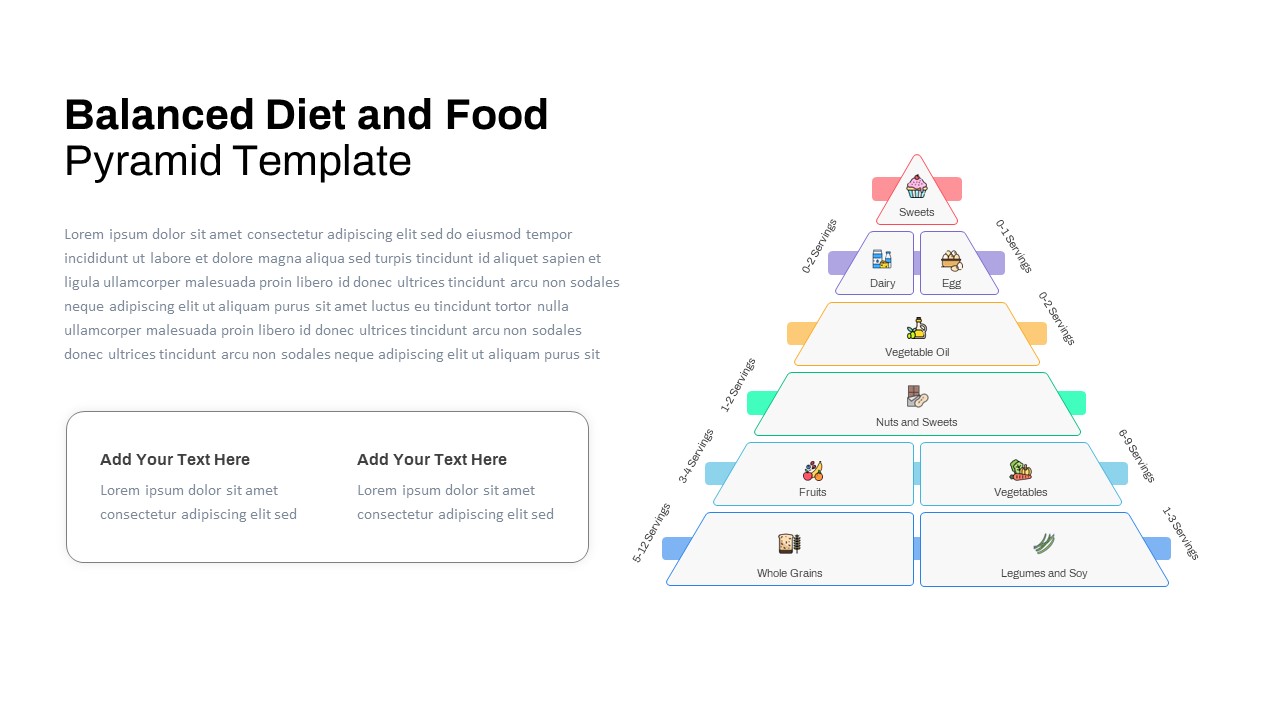
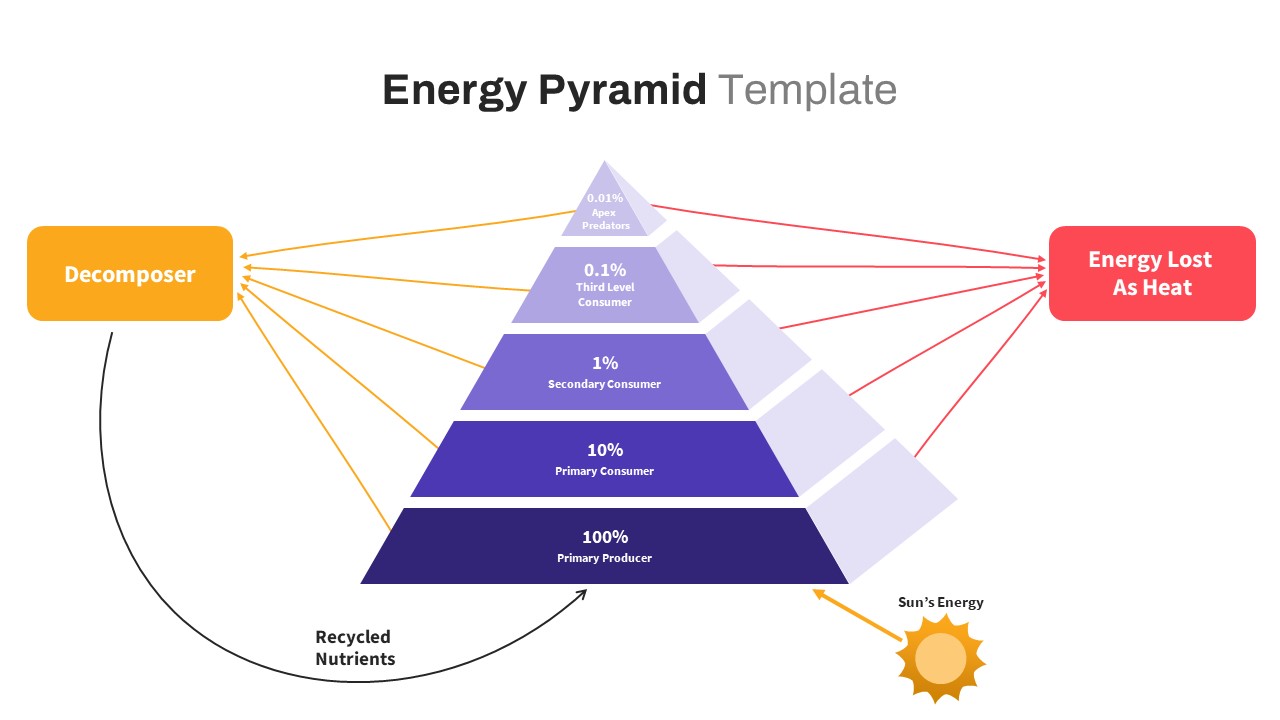
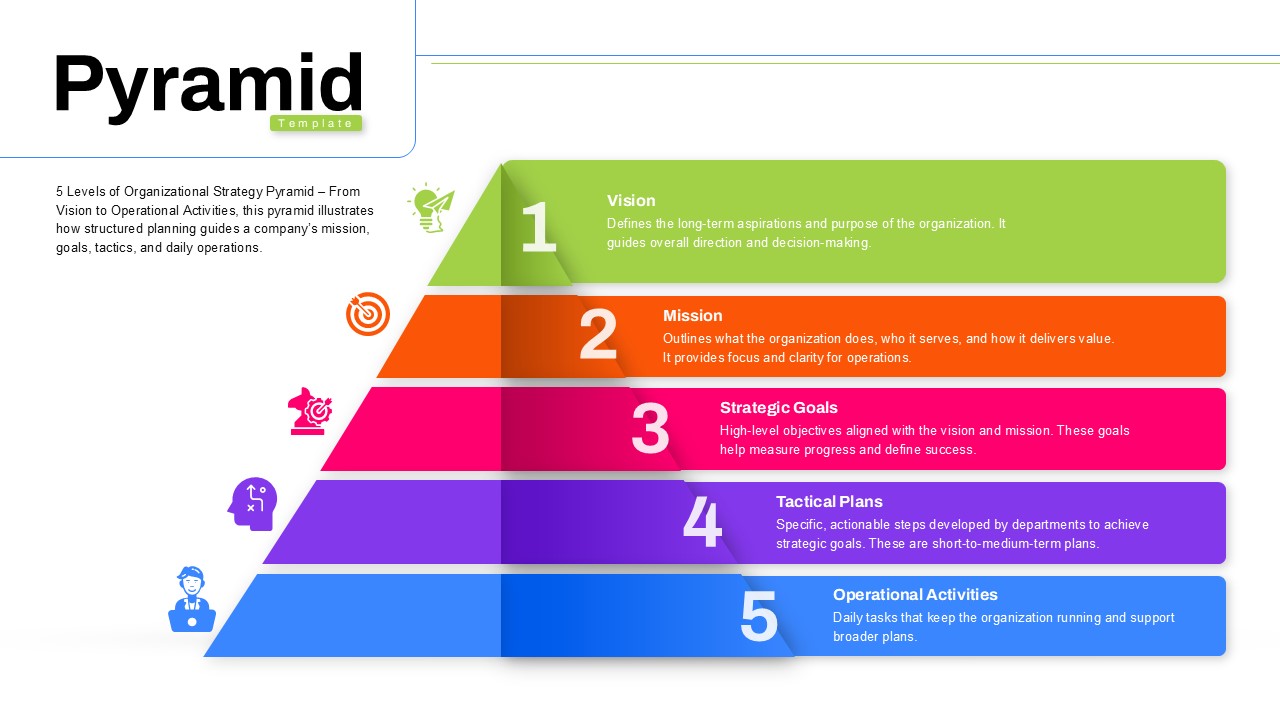
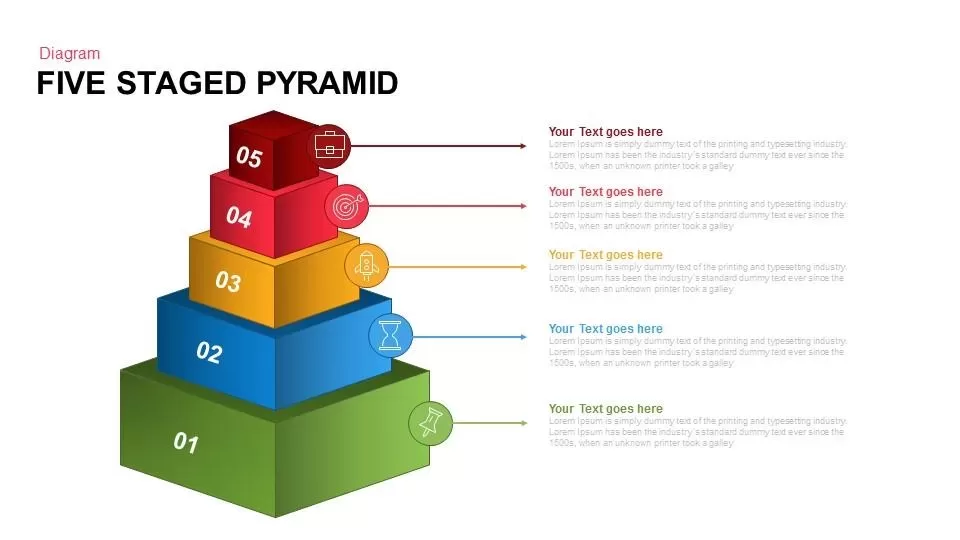
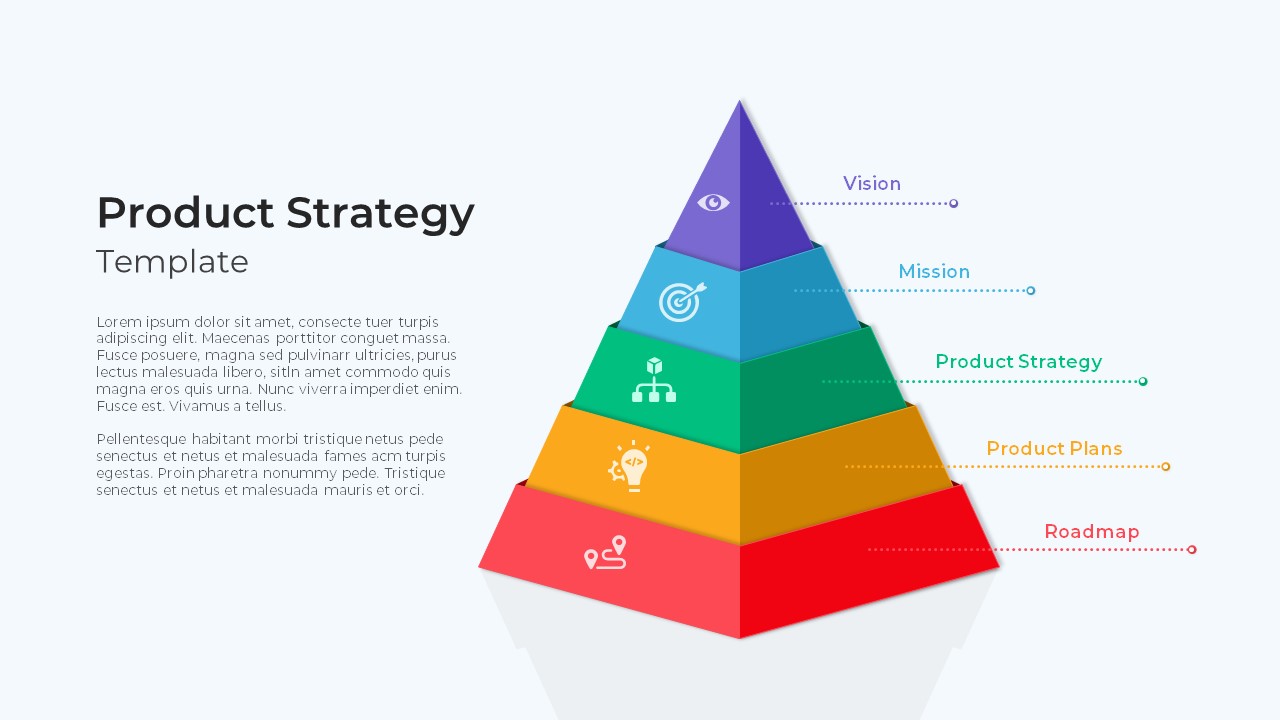
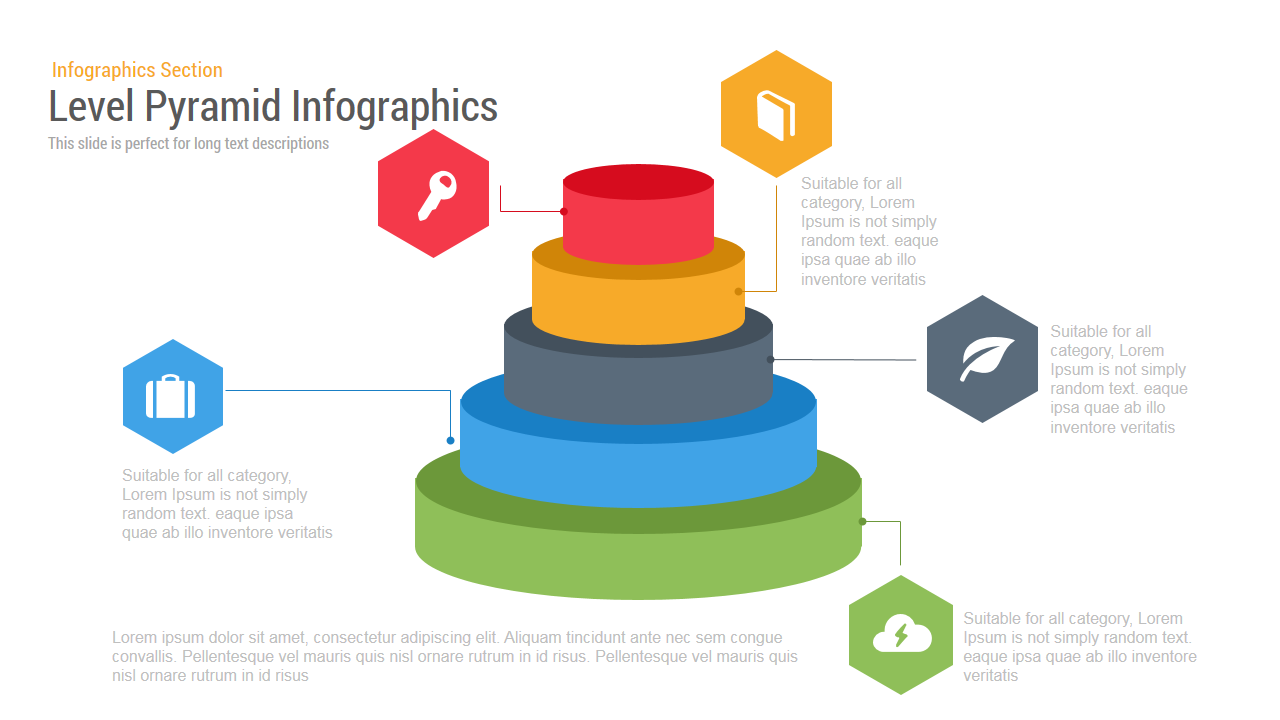
This Pyramid Infographics template showcases a five-tiered 3D cylinder pyramid on a clean white background, perfect for depicting hierarchical data, milestone levels, or layered processes. Each ring—rendered in green, blue, gray, yellow, and red—rises from a broad base to a focused apex, emphasizing progressive value or priority. Crisp vector shapes and hidden master slides allow you to adjust ring heights, recolor sections via theme palettes, swap in custom icons, and update typography globally with free web fonts.
Callout hexagons flank each pyramid level, connected by fine lines to editable text blocks for detailed descriptions. The balanced radial layout preserves ample white space, ensuring clarity even with long-form narrative or numeric data. Subtle drop shadows beneath each ring add depth without distracting from your message, while alignment guides maintain precise spacing and consistency across slides.
Designed for both 16:9 widescreen and 4:3 aspect ratios, this slide renders crisply on HD projectors, retina displays, and virtual meeting platforms. Drag-and-drop functionality simplifies icon and text updates, and hidden variation slides offer alternate color schemes, fewer or additional pyramid levels, and inverted layouts for rapid customization. Pre-configured entrance animations and morph transitions guide audience focus from foundational tiers to peak insights, reinforcing your storytelling flow.
Whether you’re mapping strategic priorities, product adoption stages, training benchmarks, or investment tiers, this Pyramid Infographics template streamlines professional slide creation with zero design headaches. Explore more variations like this in our pyramid templates collection.
Who is it for
Business analysts, product managers, consultants, and educators who need to present layered data, tiered roadmaps, or sequential frameworks. Marketing strategists and training professionals will also appreciate its clear hierarchy for workshop modules, certification levels, or customer journey stages.
Other Uses
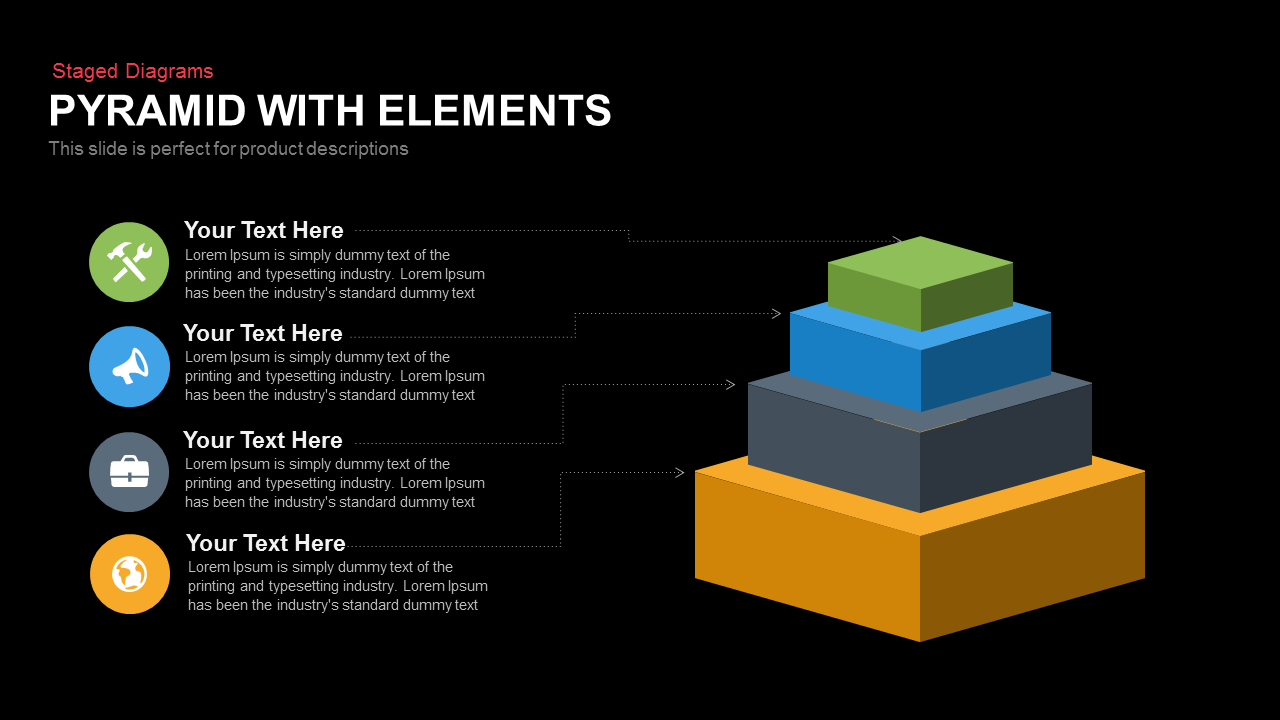
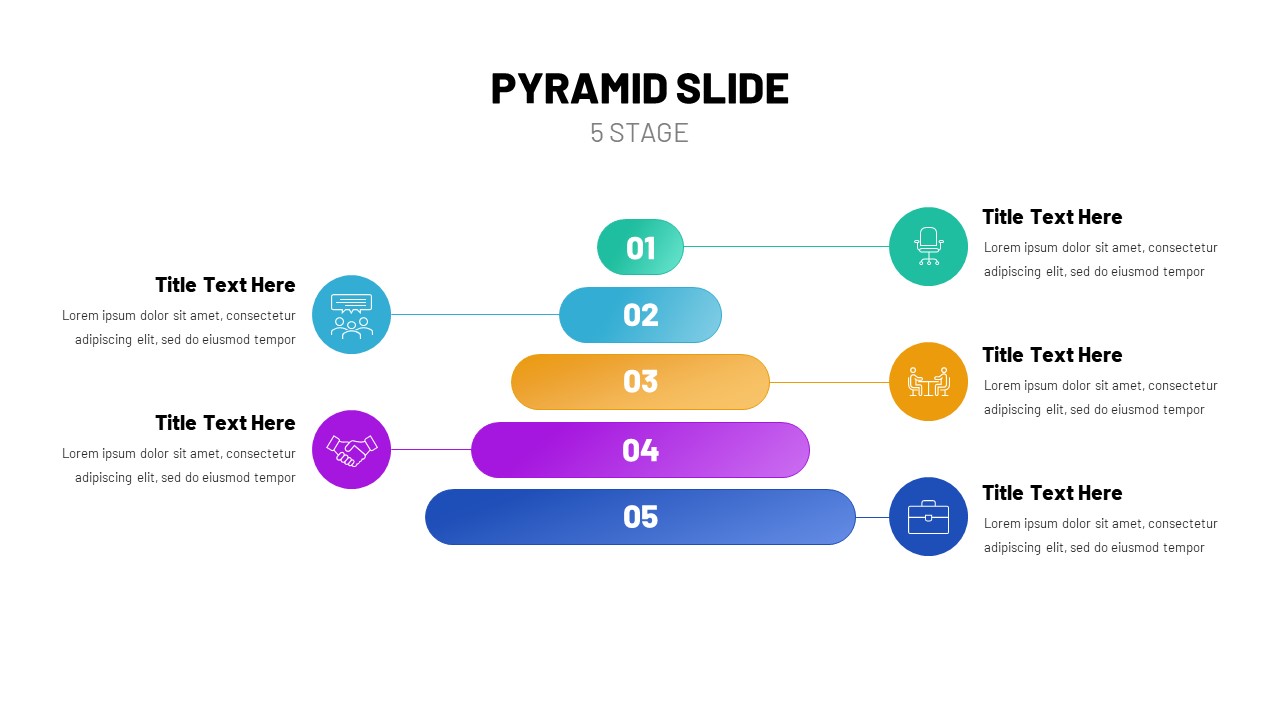
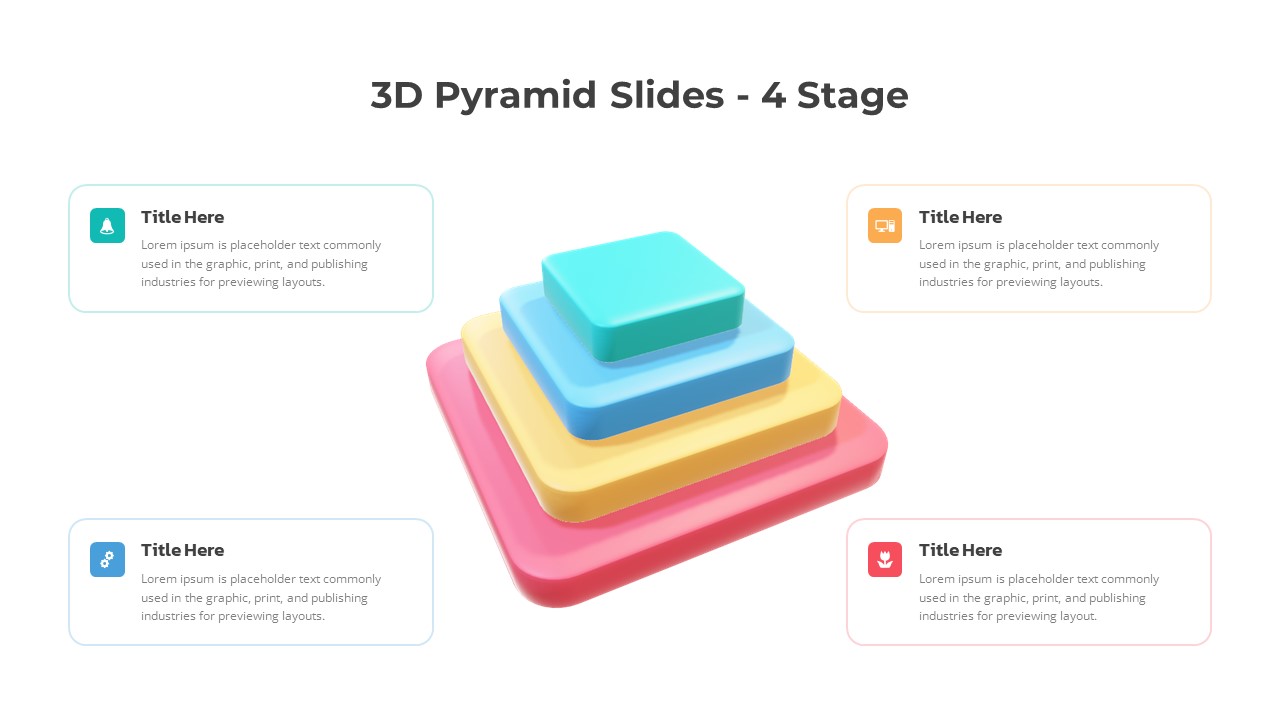
Repurpose this layout to compare subscription plans, illustrate organizational structures, or visualize risk-assessment matrices. For instance, a 3d style pyramid infographic works perfectly for process breakdowns with dimensional depth, while a 5 stage pyramid template is ideal for structured roadmaps and milestone-driven presentations.
Login to download this file

Item ID
SB00031
Related Templates

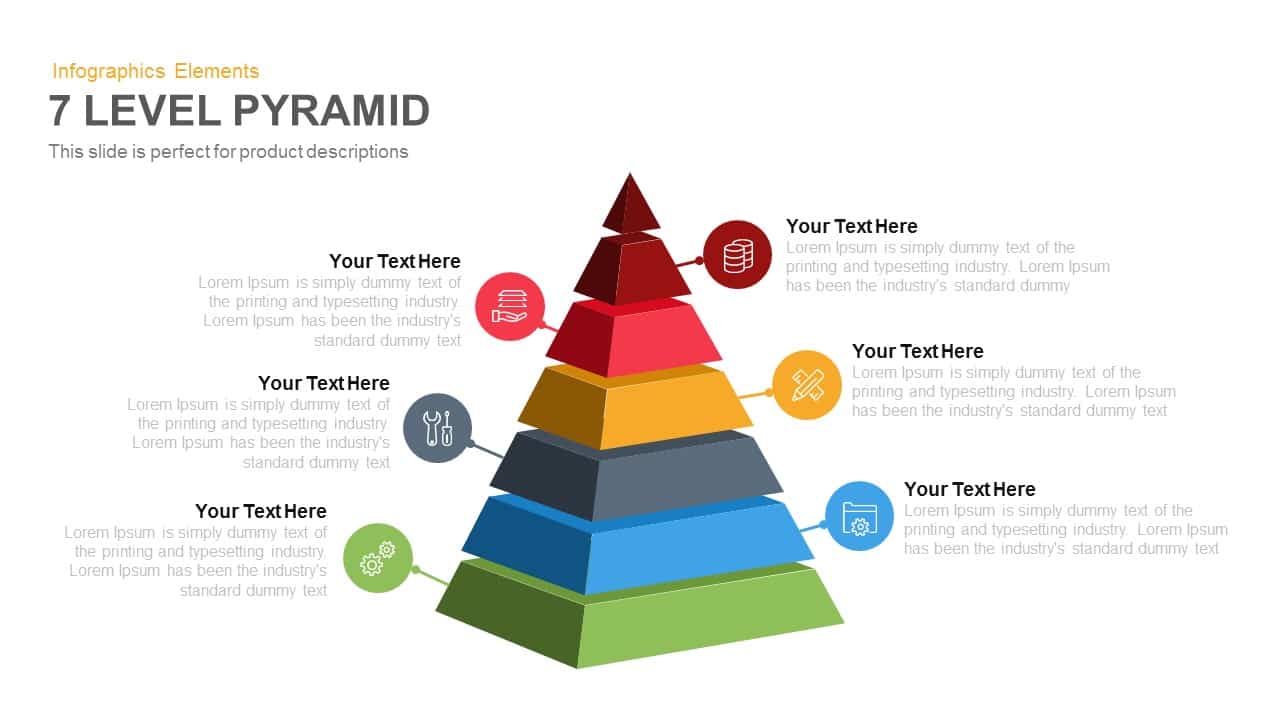
7-Level 3D Pyramid Infographic Diagram Template for PowerPoint & Google Slides
Pyramid
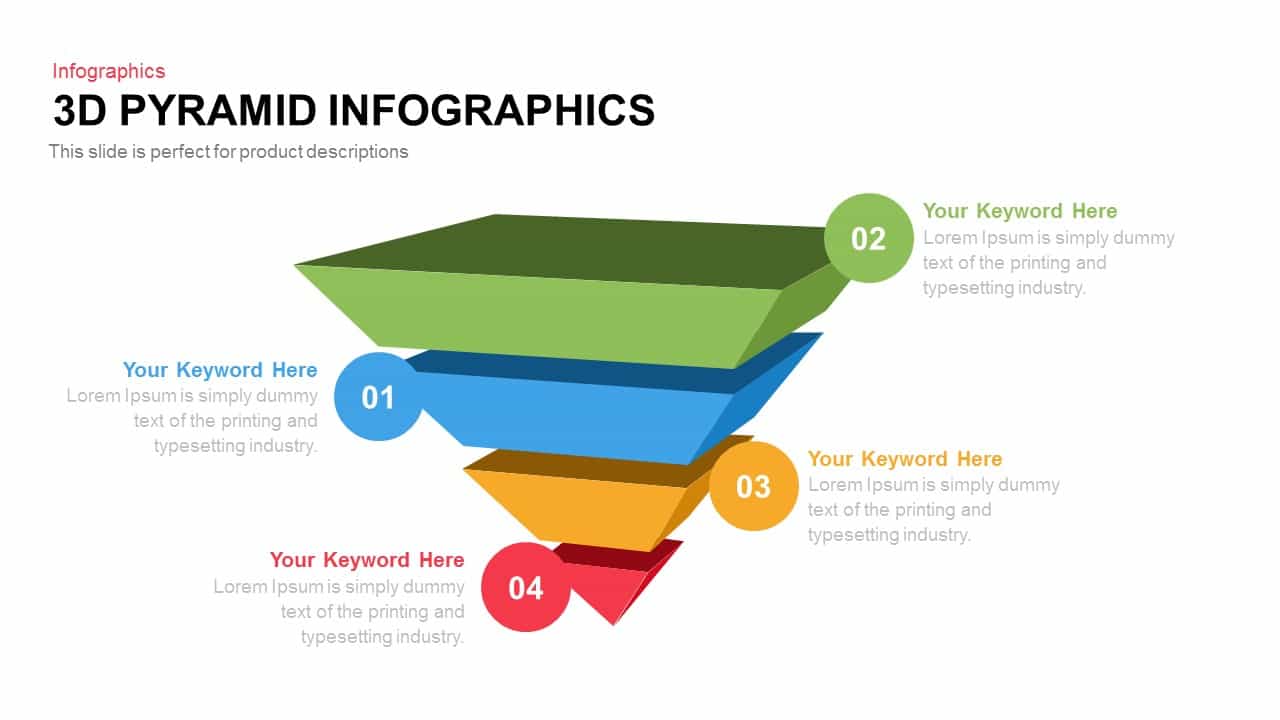
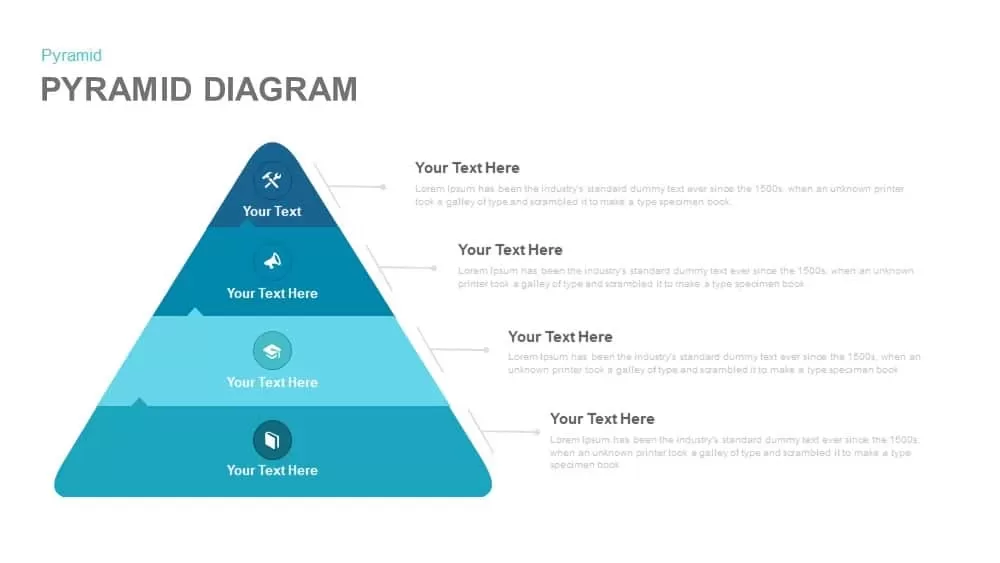
Four-Level 3D Pyramid Infographic Template for PowerPoint & Google Slides
Pyramid
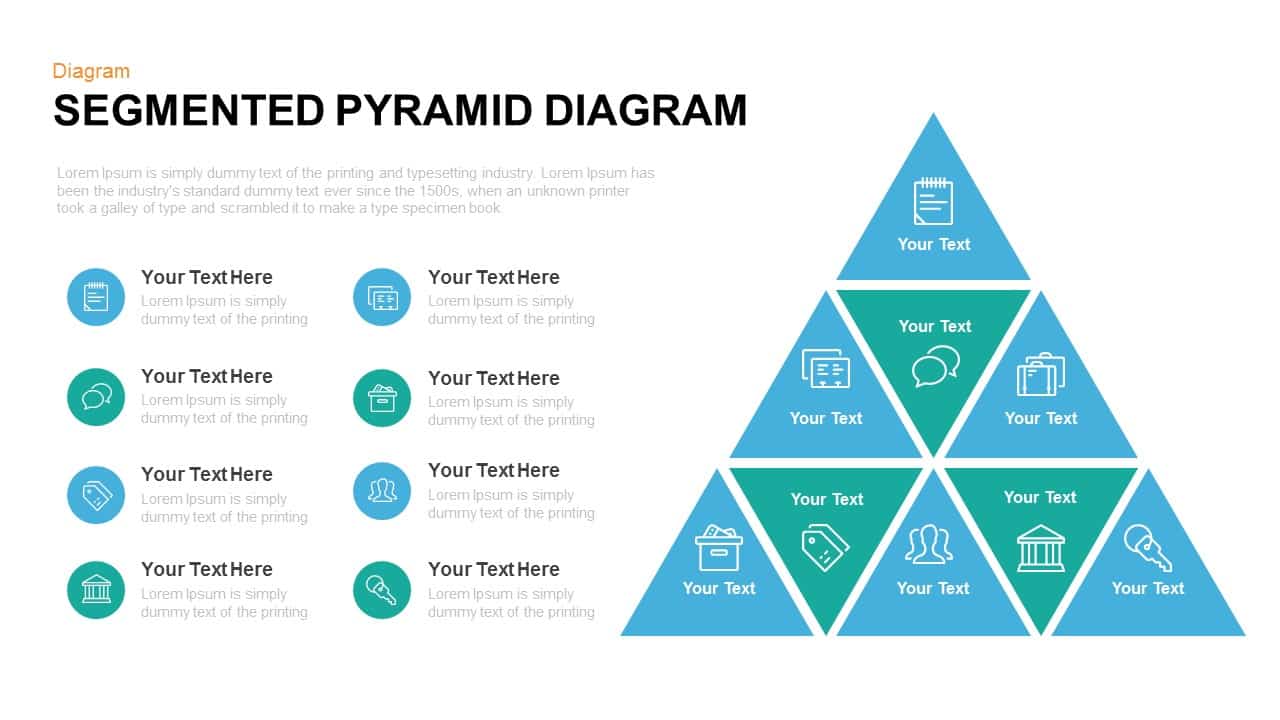
Segmented Pyramid Diagram Infographic Template for PowerPoint & Google Slides
Pyramid

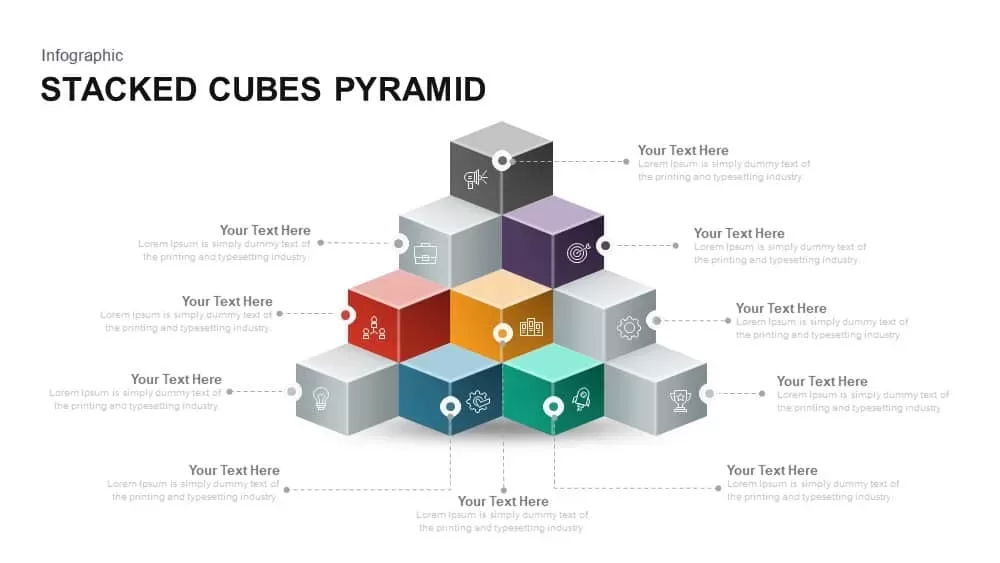
Stacked Cubes Pyramid Infographic Template for PowerPoint & Google Slides
Pyramid
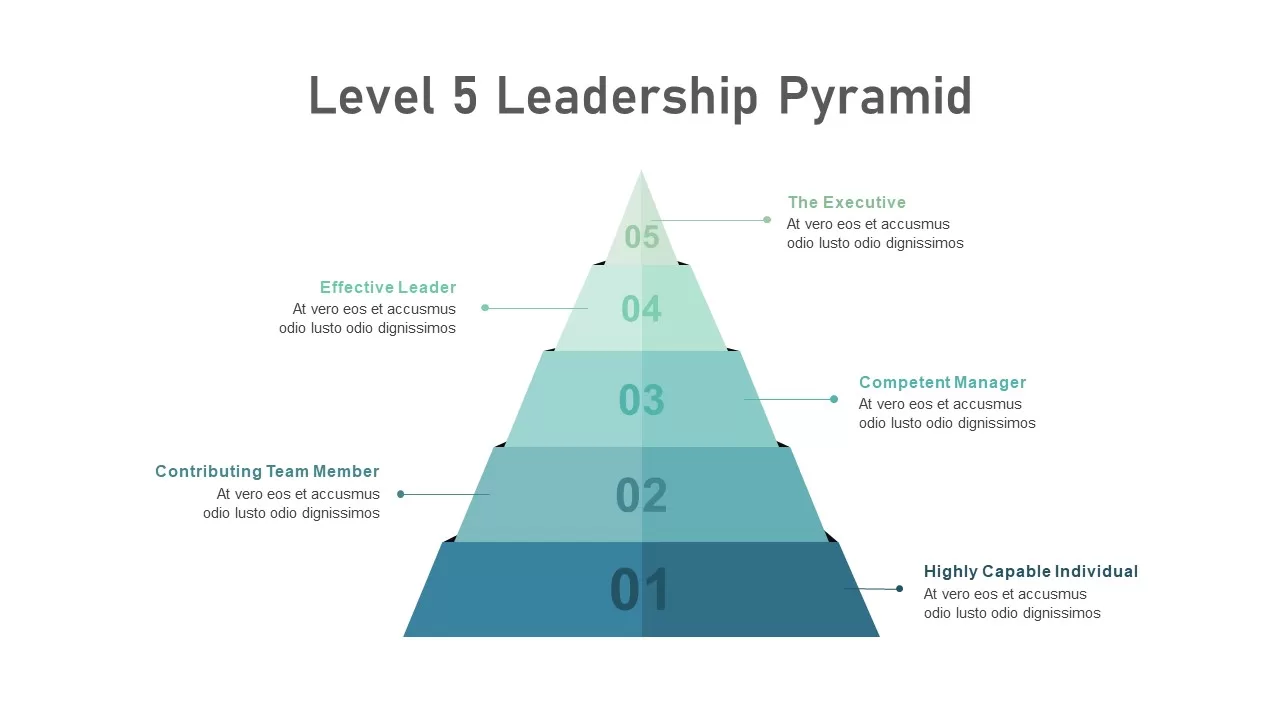
Level 5 Leadership Pyramid Infographic Template for PowerPoint & Google Slides
Pyramid
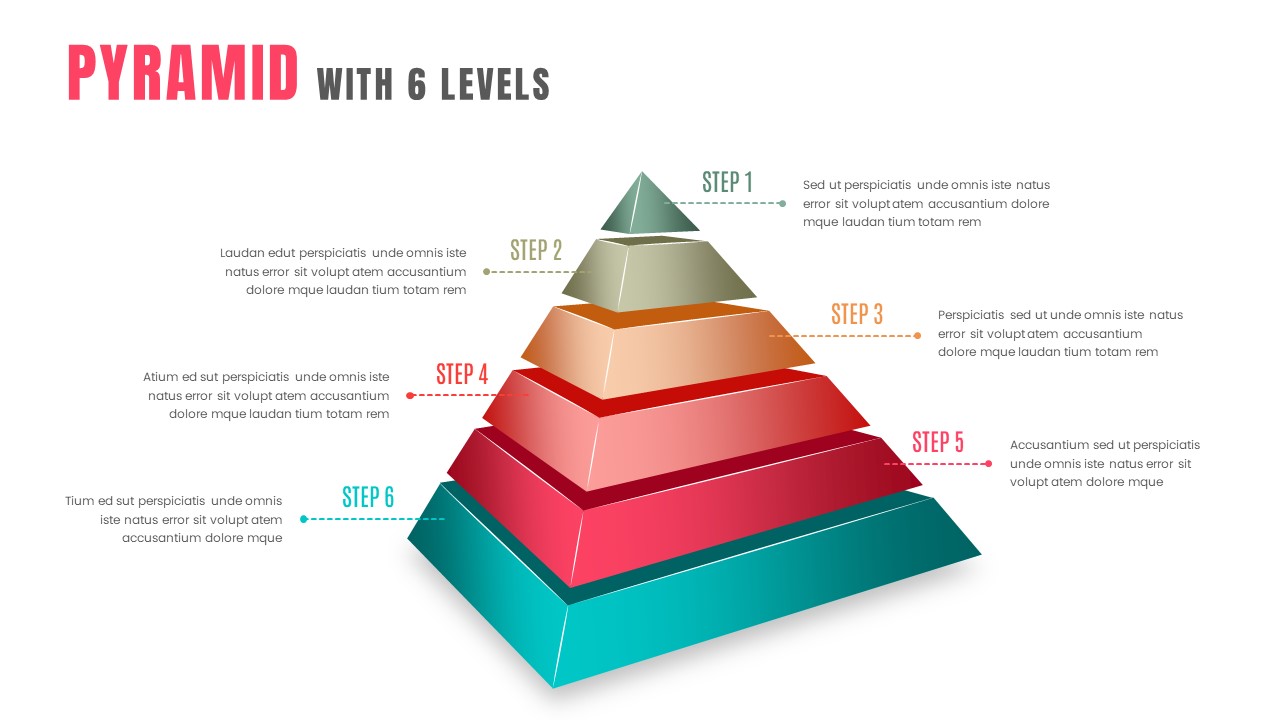
3D Six-Level Pyramid Diagram Infographic Template for PowerPoint & Google Slides
Pyramid
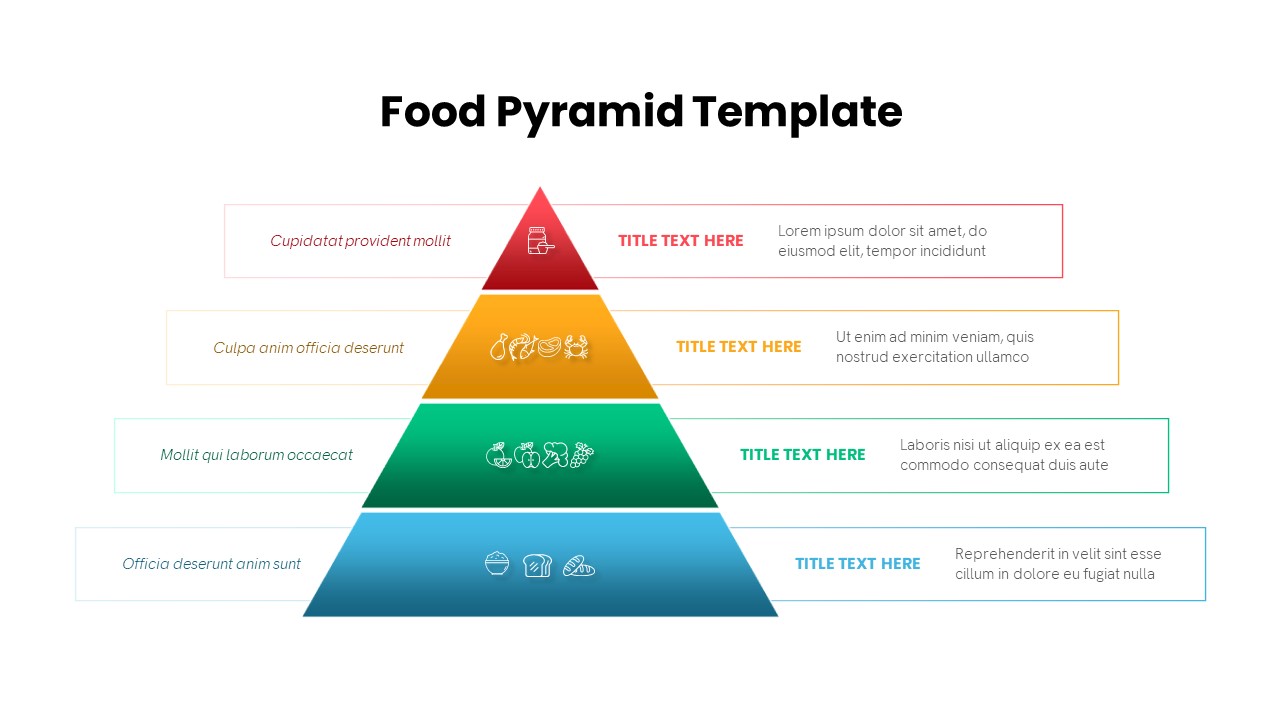
Four-Level Food Pyramid Infographic Template for PowerPoint & Google Slides
Pyramid
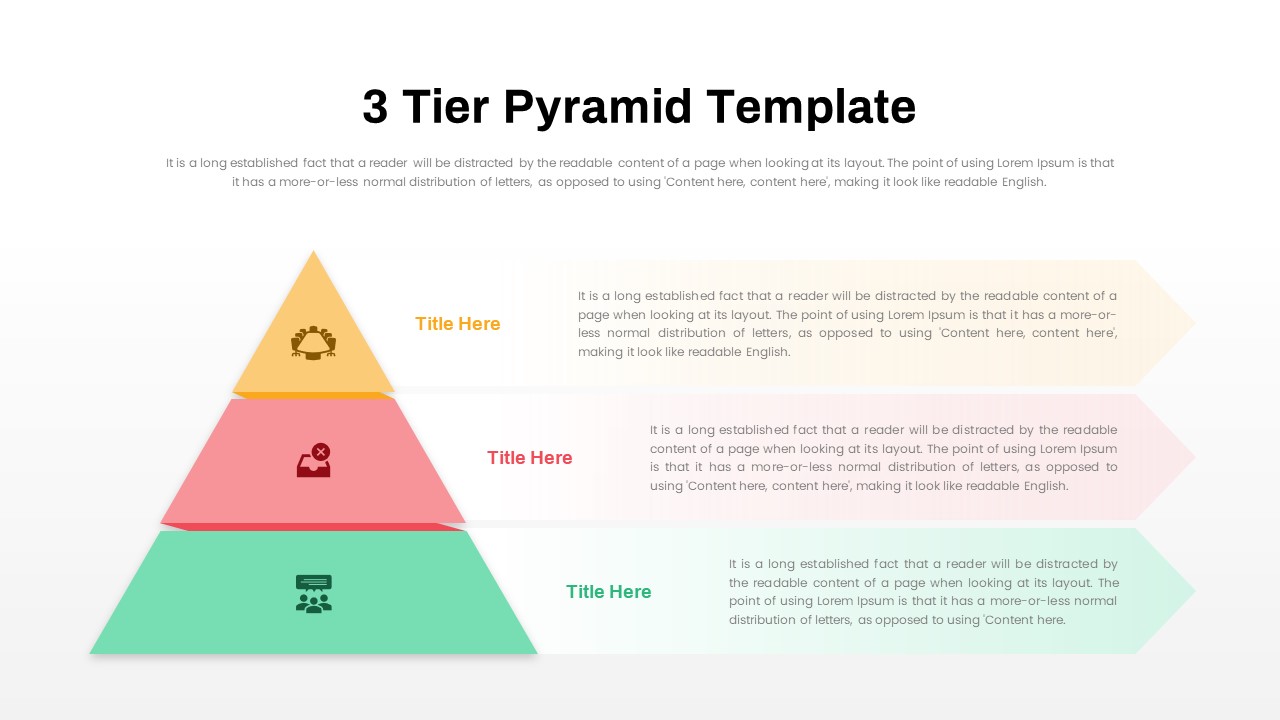
Three-Tier Pyramid Infographic Template for PowerPoint & Google Slides
Pyramid
3D Pyramid Column Chart Infographic Template for PowerPoint & Google Slides
Bar/Column
Four Level Pyramid Infographic Template for PowerPoint & Google Slides
Pyramid
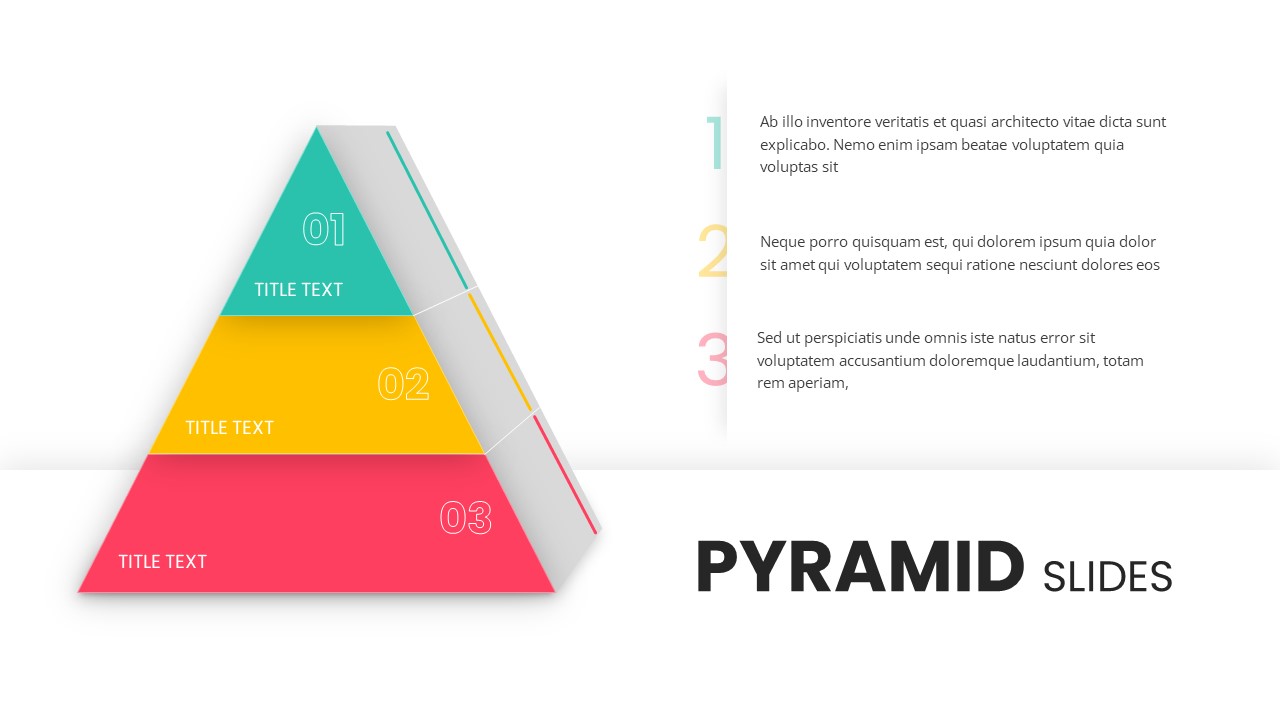
3 Stage Pyramid Slides for PowerPoint & Google Slides
Pyramid
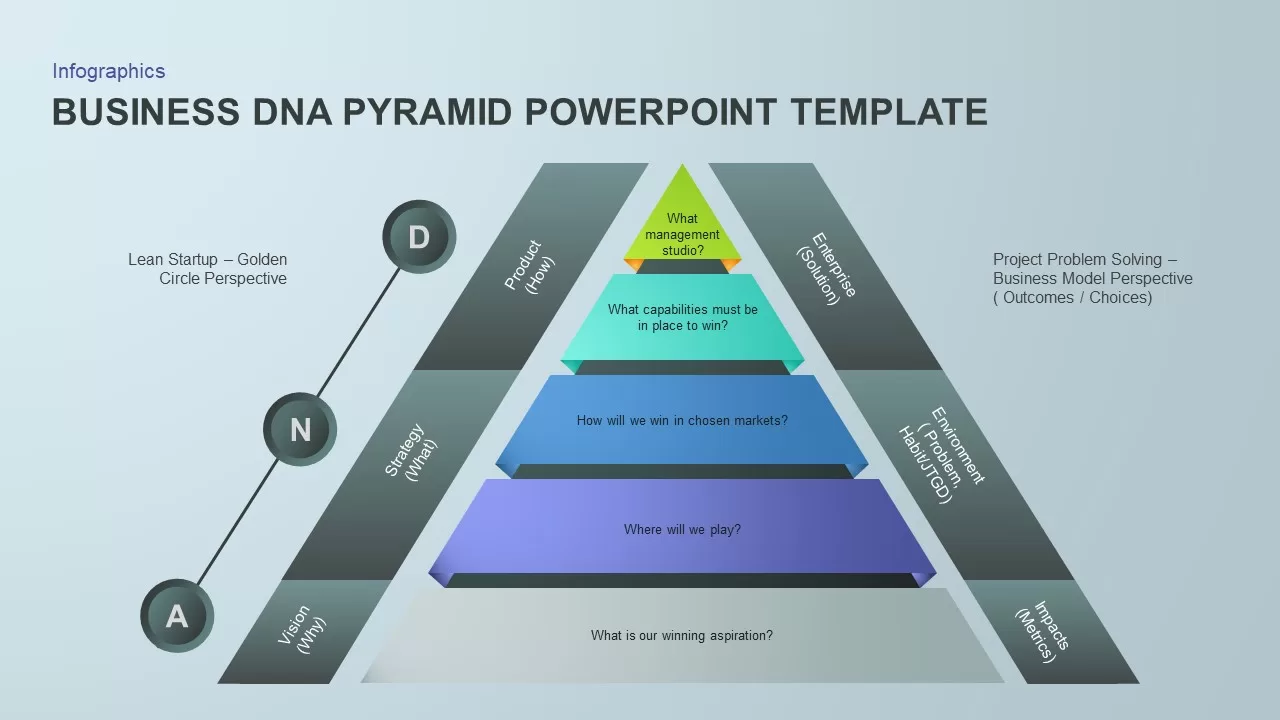
Business DNA Pyramid PowerPoint Template for PowerPoint & Google Slides
Pyramid
Free Pyramid Infographics template for PowerPoint & Google Slides
Pyramid
Free
5 Stage Pyramid template for PowerPoint & Google Slides
Pyramid
Five-Level 3D Pyramid Hierarchy Template for PowerPoint & Google Slides
Pyramid
4-Step 3D Pyramid Diagram with Callouts template for PowerPoint & Google Slides
Pyramid
Professional 5-Stage Pyramid Diagram Template for PowerPoint & Google Slides
Pyramid
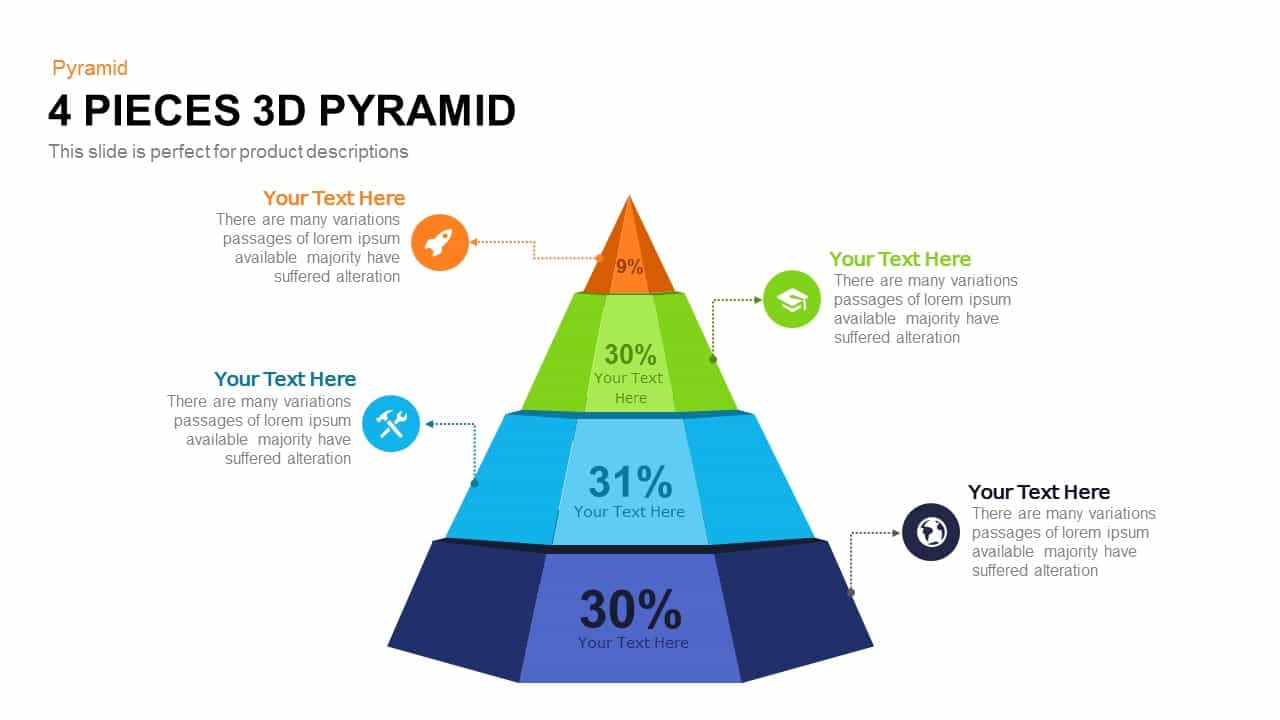
Professional 4-Piece 3D Pyramid Diagram Template for PowerPoint & Google Slides
Pyramid
Five-Stage Pyramid Infographics Diagram Template for PowerPoint & Google Slides
Pyramid
Editable Six-Level 3D Pyramid Diagram Template for PowerPoint & Google Slides
Pyramid

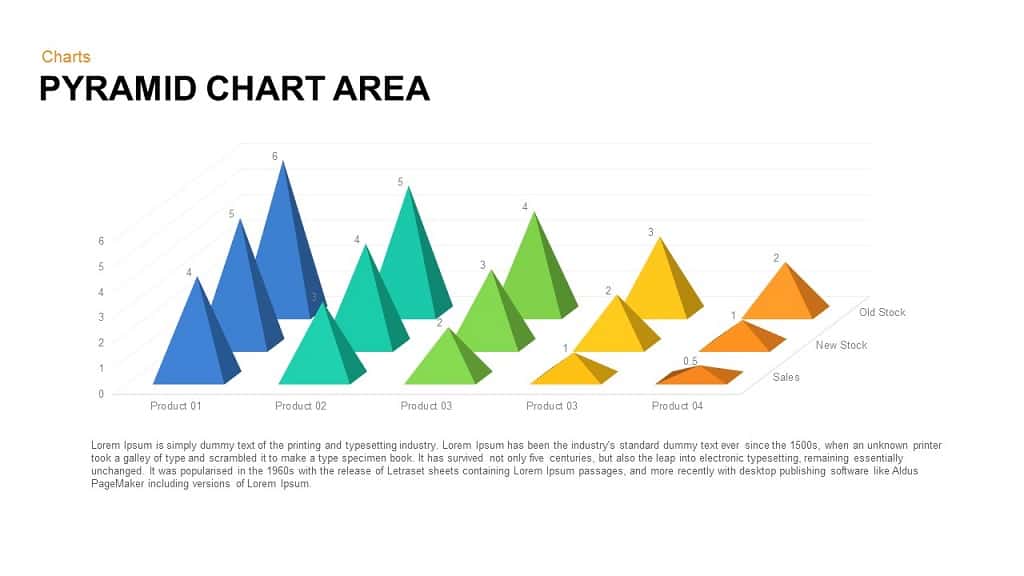
Pyramid Chart Area template for PowerPoint & Google Slides
Pyramid
Four-Level Business Pyramid Diagram Template for PowerPoint & Google Slides
Pyramid
Five-Level Staged Pyramid Diagram Template for PowerPoint & Google Slides
Pyramid
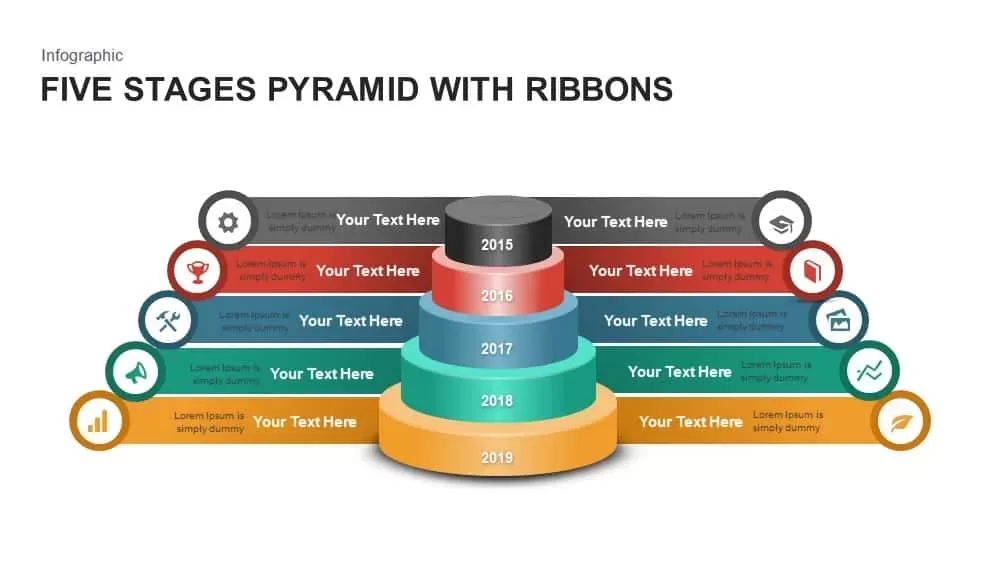
Five Stages Pyramid with Ribbons Diagram Template for PowerPoint & Google Slides
Pyramid
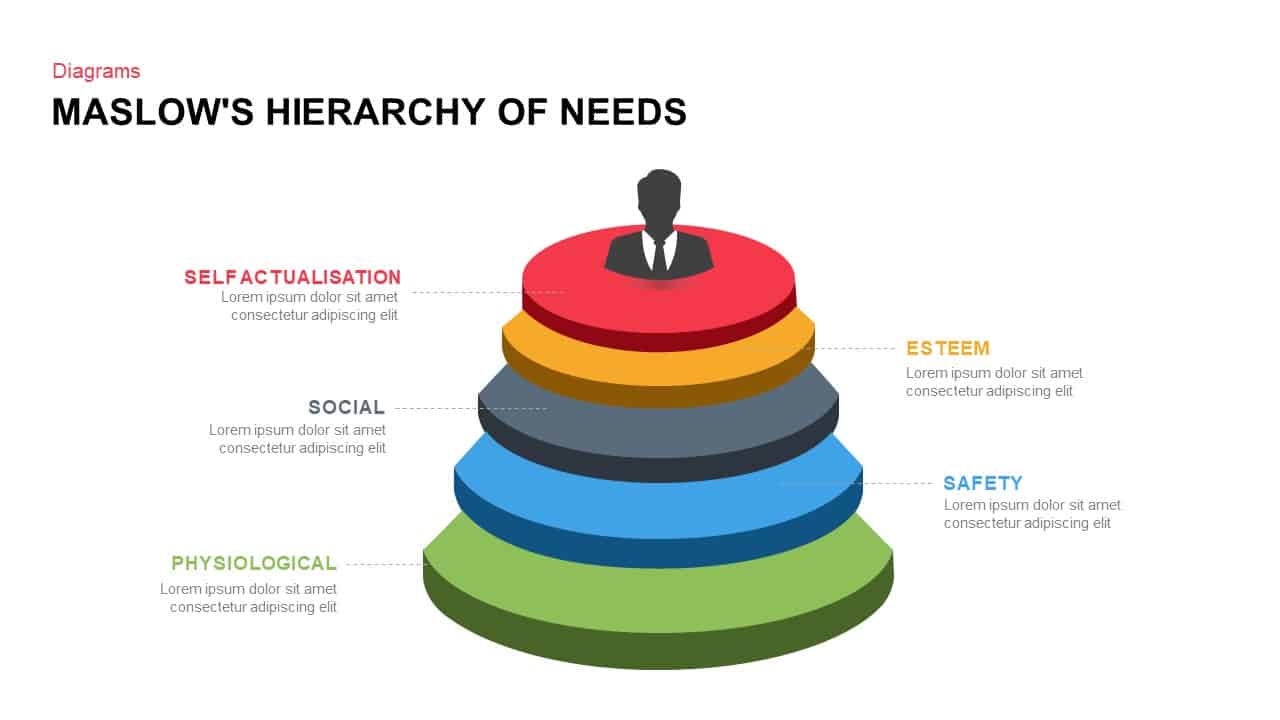
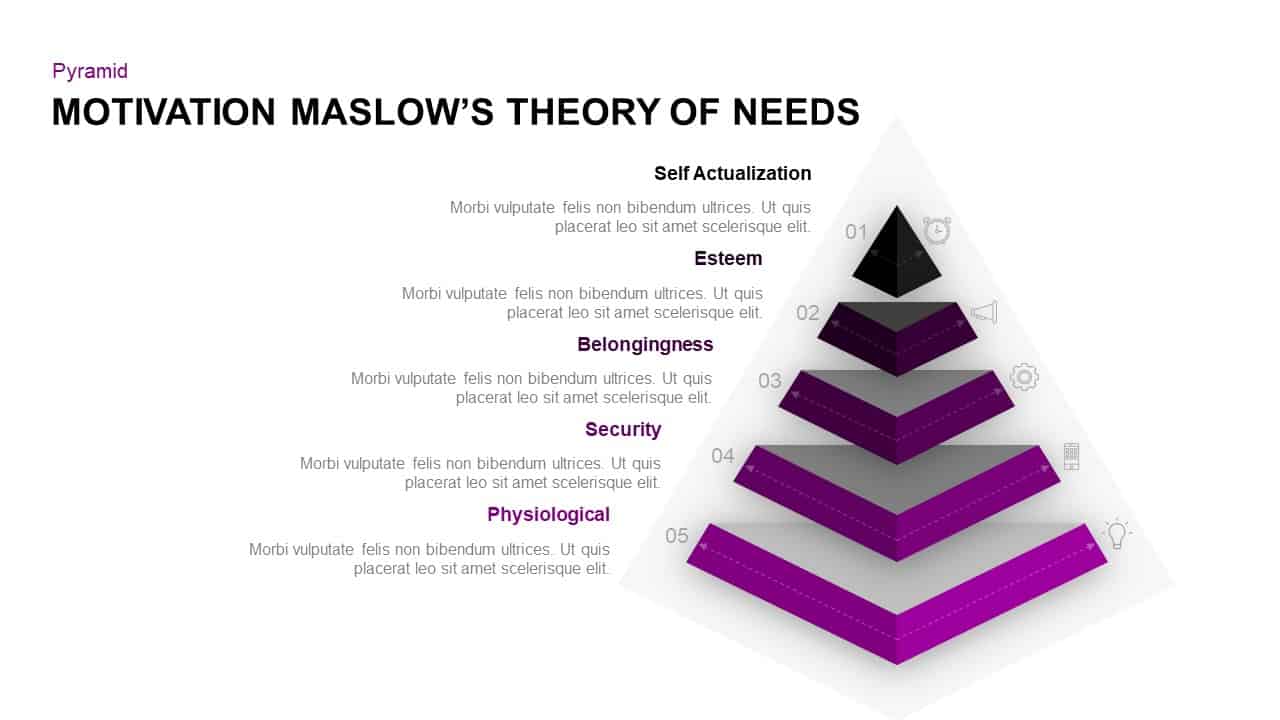
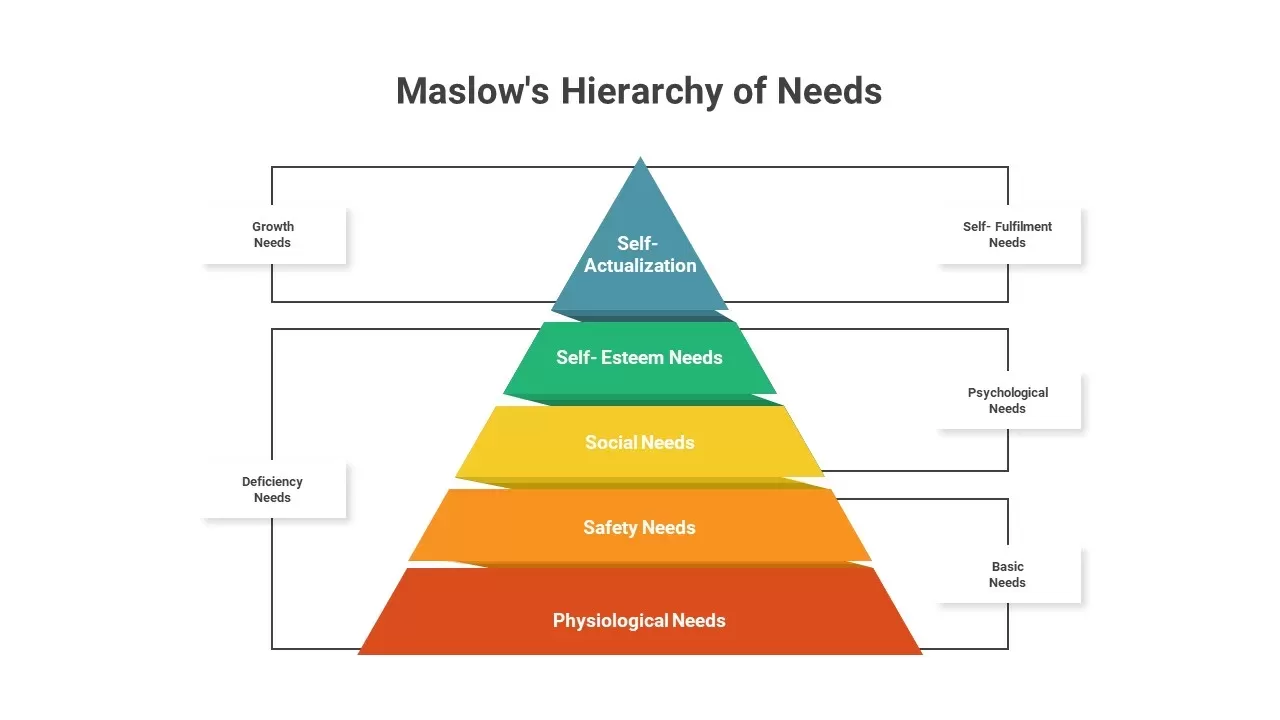
Maslow’s Hierarchy of Needs Pyramid Template for PowerPoint & Google Slides
Pyramid
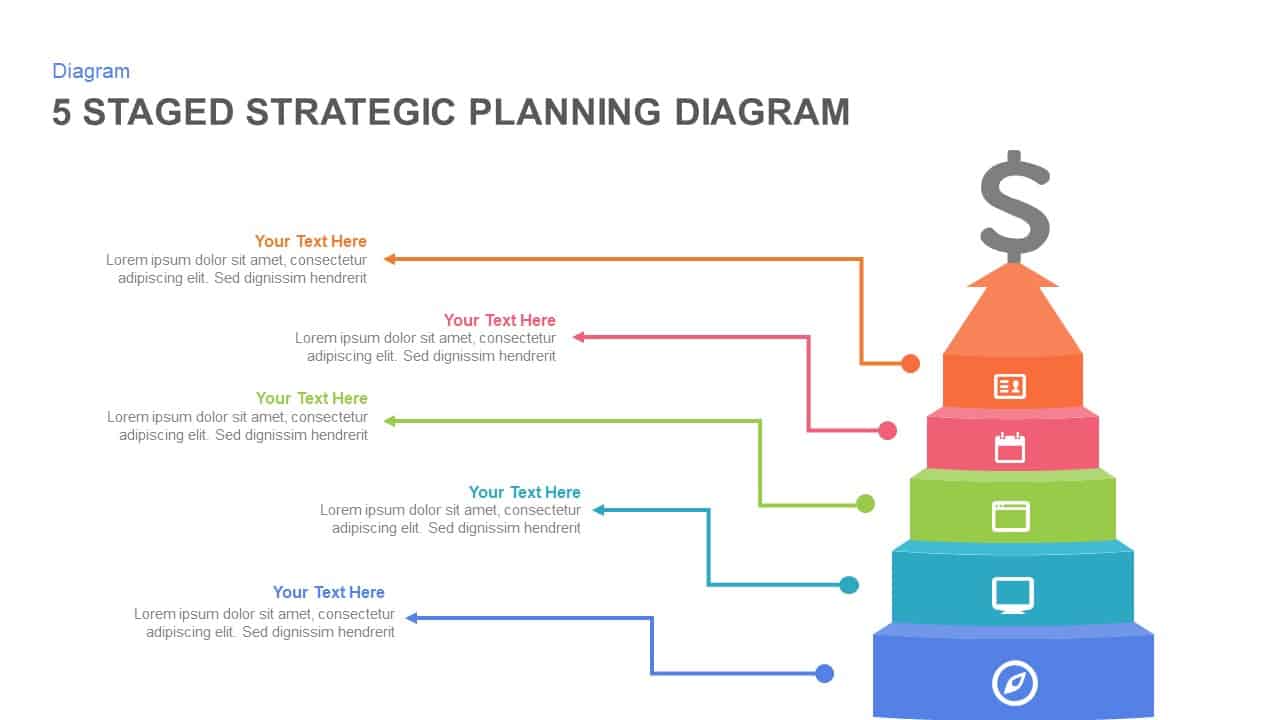
5-Stage Strategic Planning Pyramid Template for PowerPoint & Google Slides
Business Strategy
Five-Stage Pyramid Infographics Process Template for PowerPoint & Google Slides
Pyramid
Maslow’s Hierarchy of Needs Pyramid template for PowerPoint & Google Slides
Pyramid
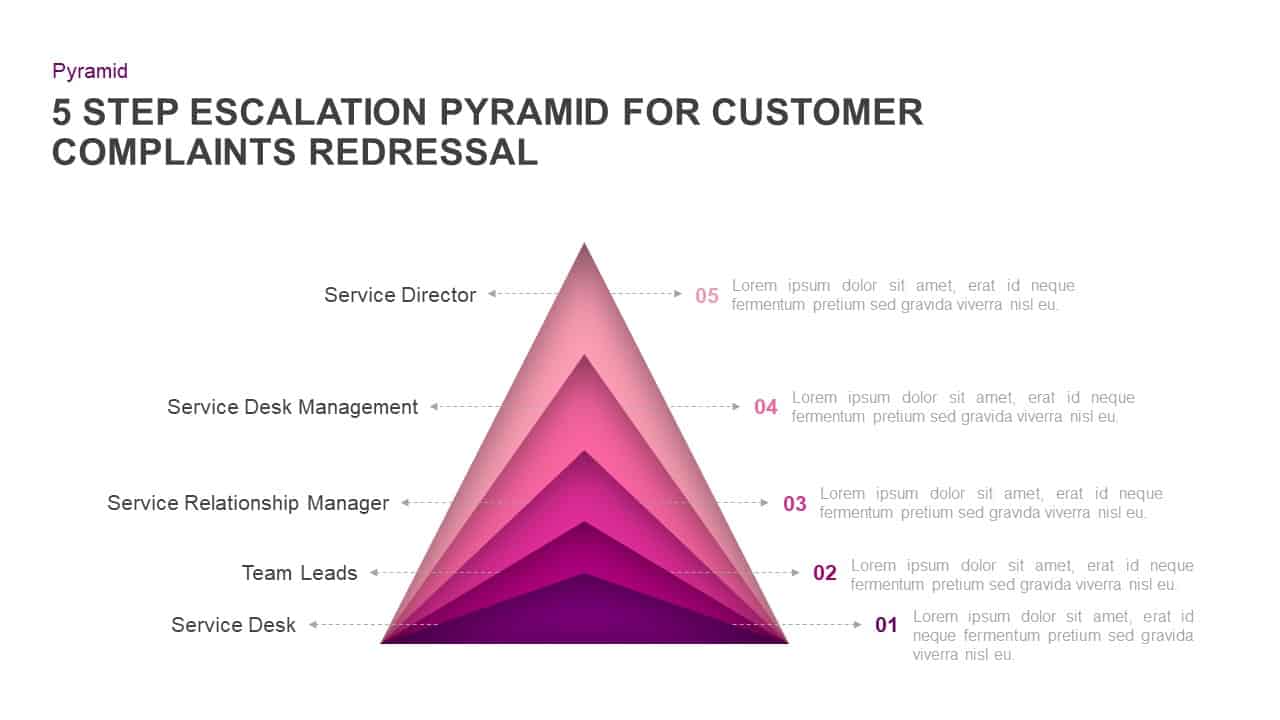
Customer Complaints Escalation Pyramid Template for PowerPoint & Google Slides
Infographics
3D Pyramid Infographics Slide Template for PowerPoint & Google Slides
Pyramid
3D Cube Pyramid Infographics Slide Template for PowerPoint & Google Slides
Pyramid
Stacked Cubes Pyramid Six-Option Diagram Template for PowerPoint & Google Slides
Pyramid
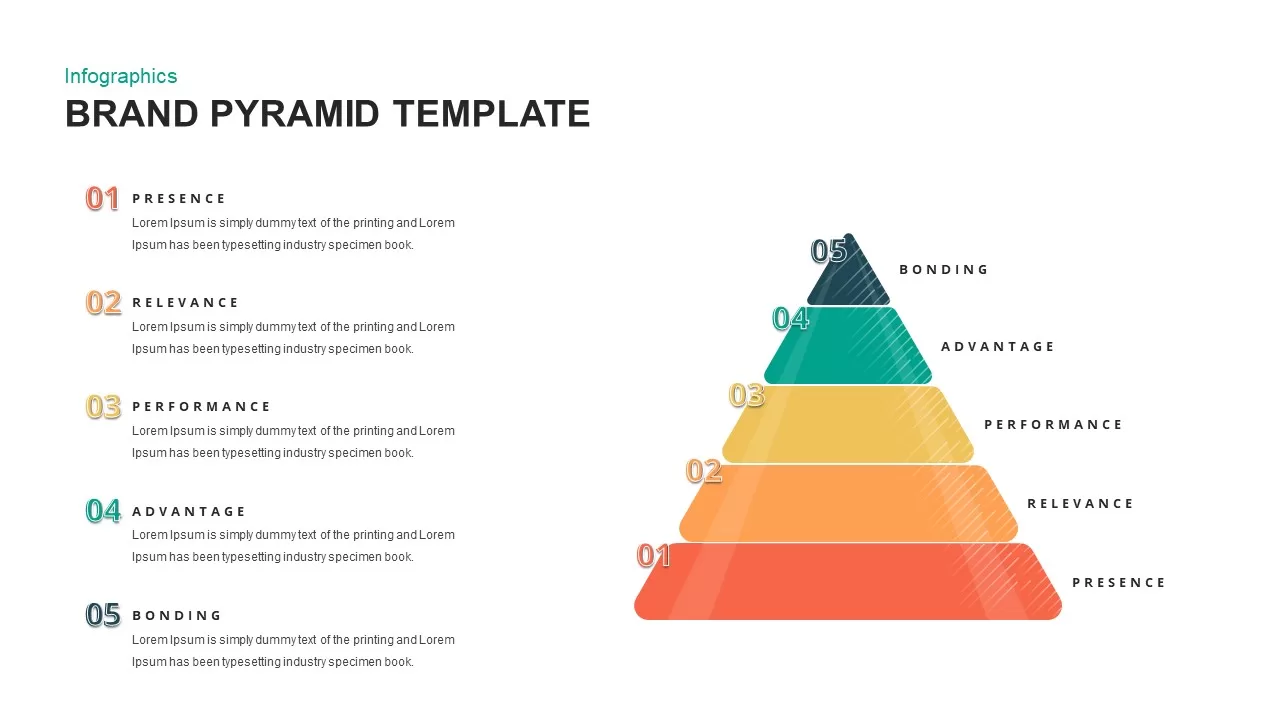
Brand Pyramid Framework template for PowerPoint & Google Slides
Pyramid
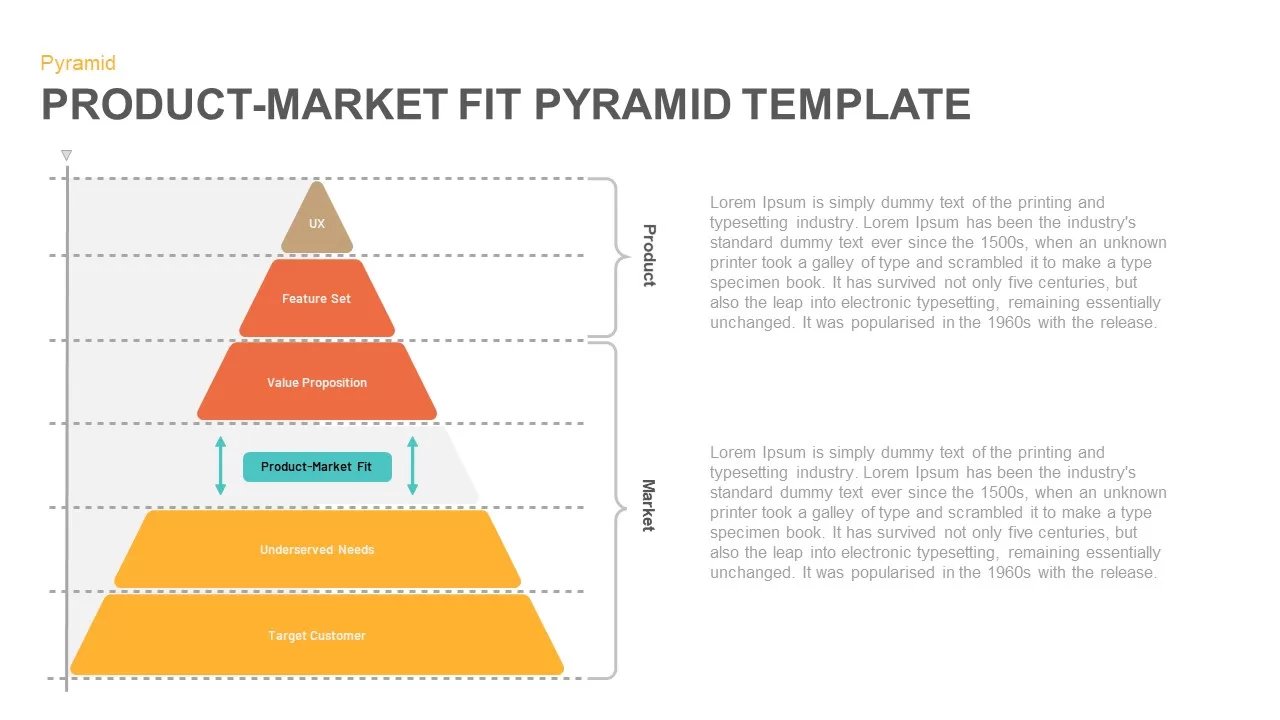
Product-Market Fit Pyramid template for PowerPoint & Google Slides
Pyramid
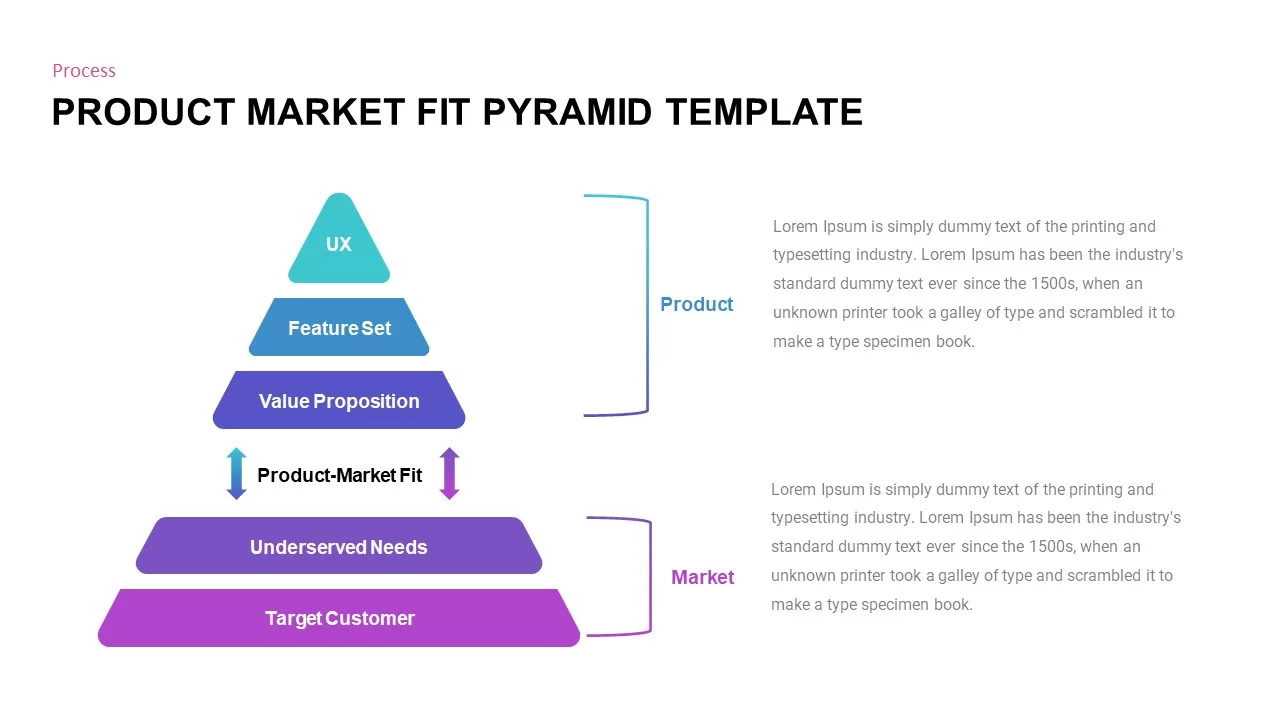
Professional Product Market Fit Pyramid Template for PowerPoint & Google Slides
Pyramid
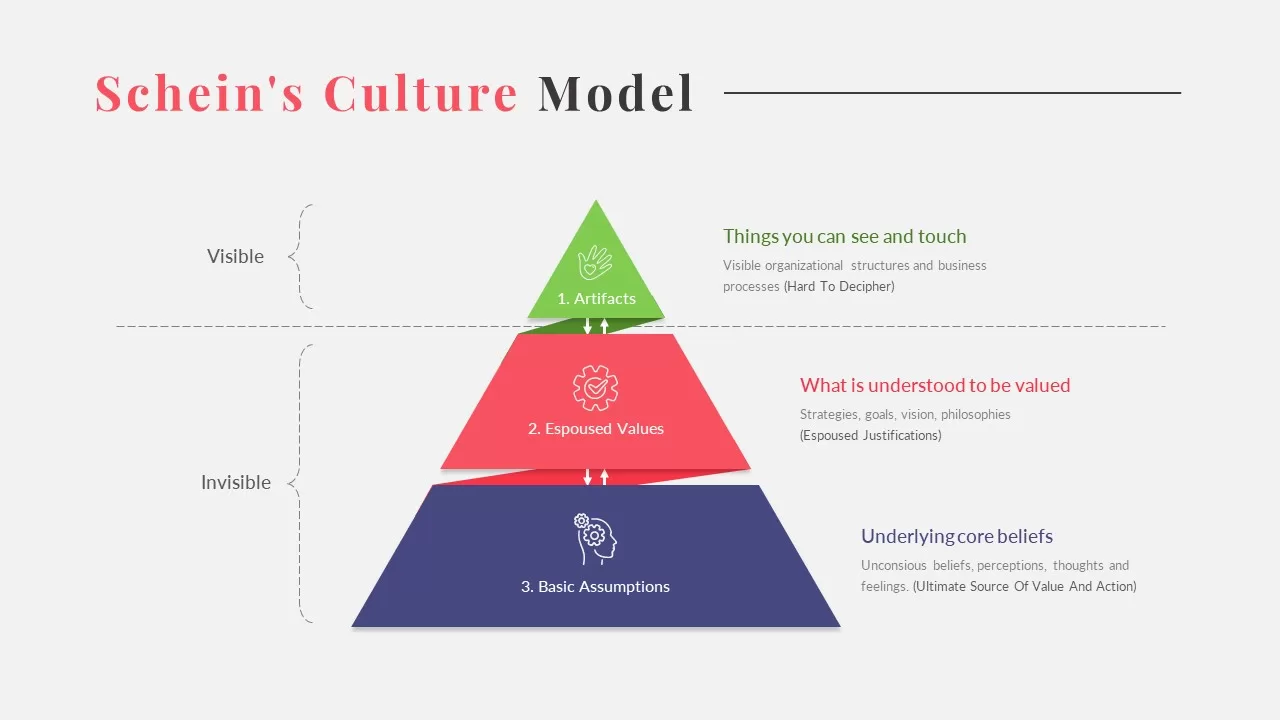
Schein’s Culture Pyramid Model Template for PowerPoint & Google Slides
Pyramid
DIKW Data to Wisdom Pyramid Model Template for PowerPoint & Google Slides
Pyramid
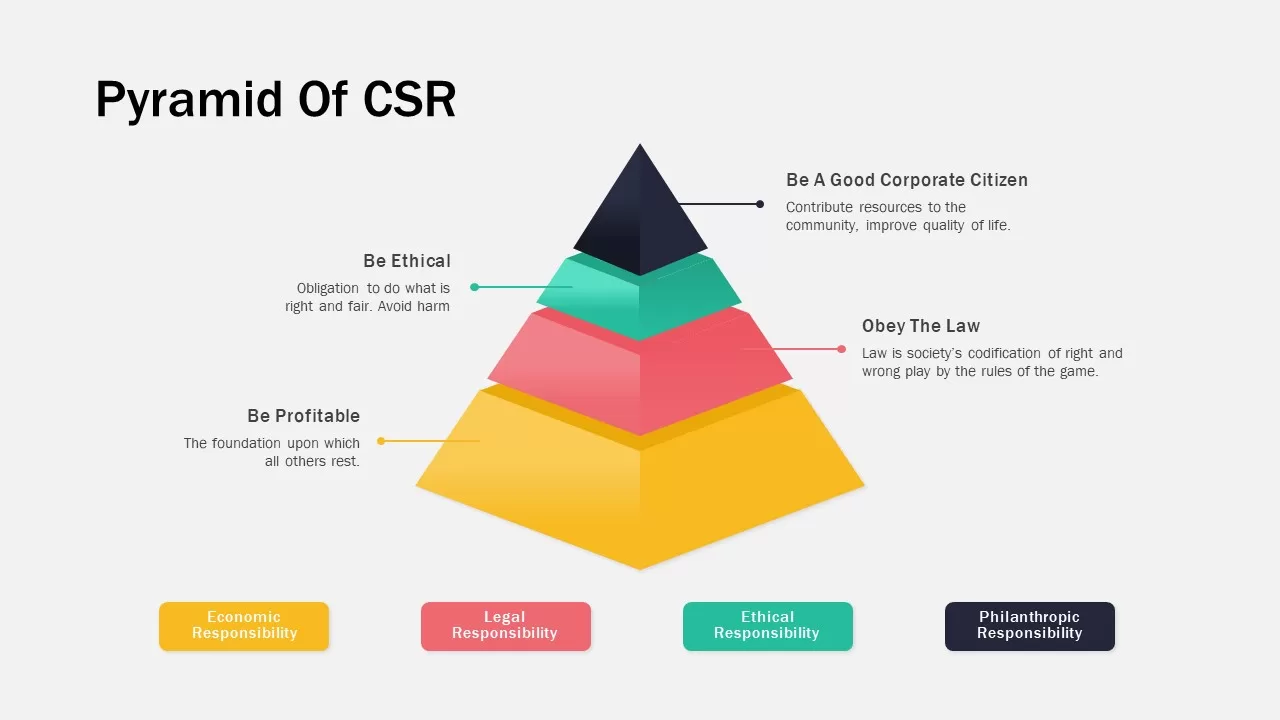
Corporate Social Responsibility Pyramid Template for PowerPoint & Google Slides
Pyramid
Maslow’s Colorful Pyramid of Needs Template for PowerPoint & Google Slides
Pyramid
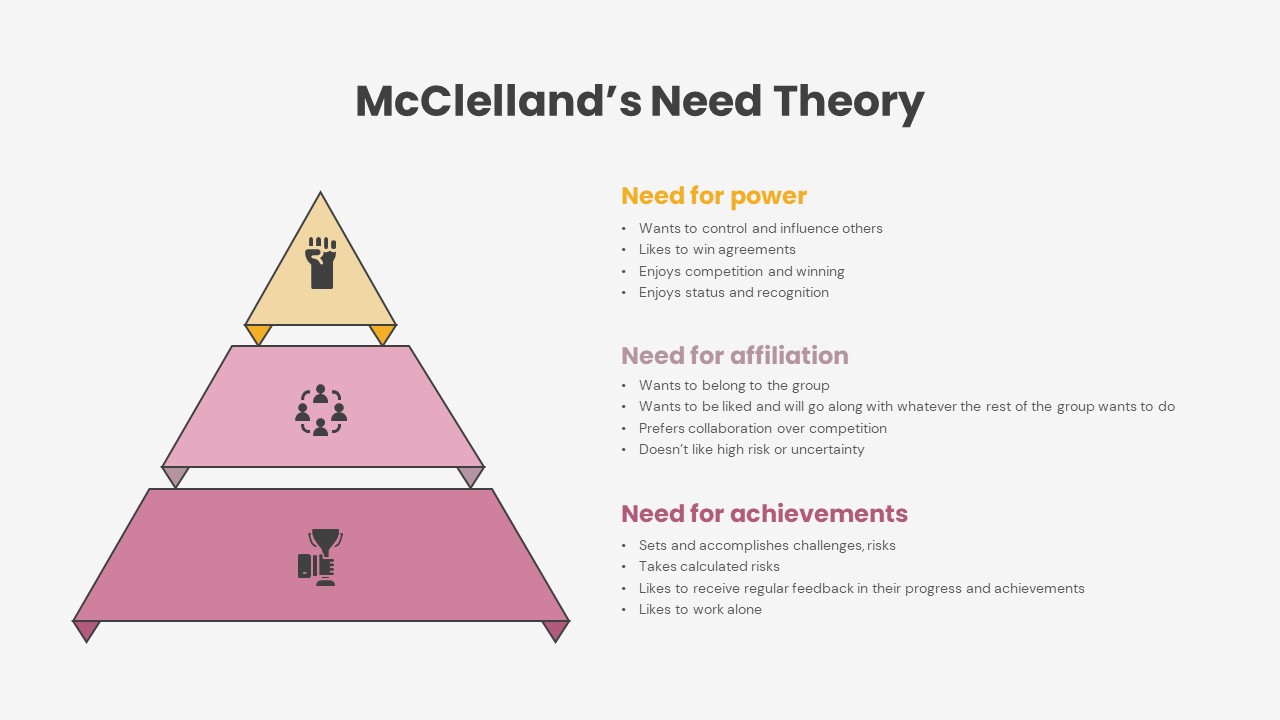
McClelland’s Need Theory Pyramid Template for PowerPoint & Google Slides
Pyramid
Five-Stage Pyramid Process Slide Template for PowerPoint & Google Slides
Pyramid
Six-Stage Pyramid Process Slide Template for PowerPoint & Google Slides
Pyramid
3D Four-Stage Pyramid Diagram Template for PowerPoint & Google Slides
Pyramid
Four-Level Colorful Pyramid Diagram Template for PowerPoint & Google Slides
Pyramid
3D Five-Stage Pyramid Diagram Slide Template for PowerPoint & Google Slides
Pyramid
Modern Four-Level Pyramid Diagram Template for PowerPoint & Google Slides
Pyramid
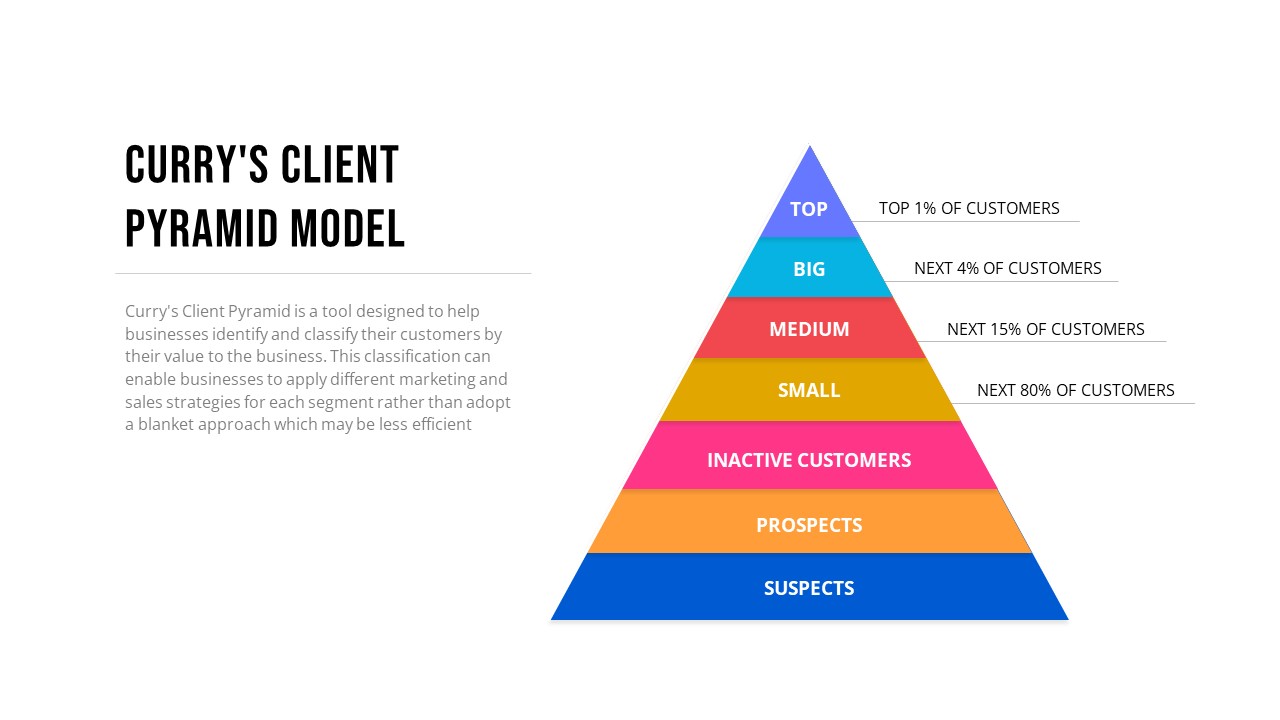
Curry’s Client Segmentation Pyramid Model Template for PowerPoint & Google Slides
Pyramid
Goals Pyramid Hierarchy Slide Design Template for PowerPoint & Google Slides
Pyramid
Risk Pyramid Hierarchy Analysis Template for PowerPoint & Google Slides
Pyramid
Population Pyramid Chart Analysis Template for PowerPoint & Google Slides
Bar/Column
Five-Level Vision Pyramid Diagram Template for PowerPoint & Google Slides
Pyramid
Free Balanced Diet and Food Pyramid Template for PowerPoint & Google Slides
Pyramid
Free
Free Ecological Energy Flow Pyramid Template for PowerPoint & Google Slides
Pyramid
Free
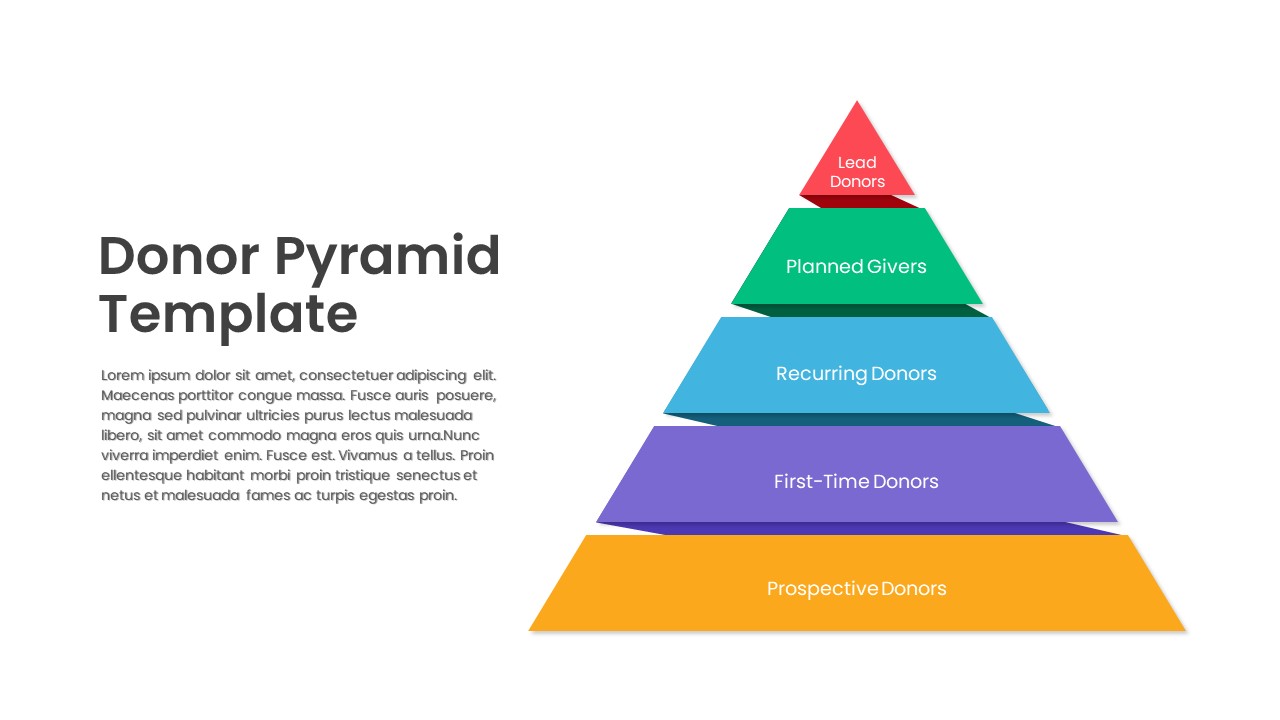
Five-Level Donor Pyramid Philanthropy Template for PowerPoint & Google Slides
Pyramid
Population Age Distribution Pyramid Chart Template for PowerPoint & Google Slides
Pyramid
Free Learning Retention Pyramid Chart Template for PowerPoint & Google Slides
Pyramid
Free
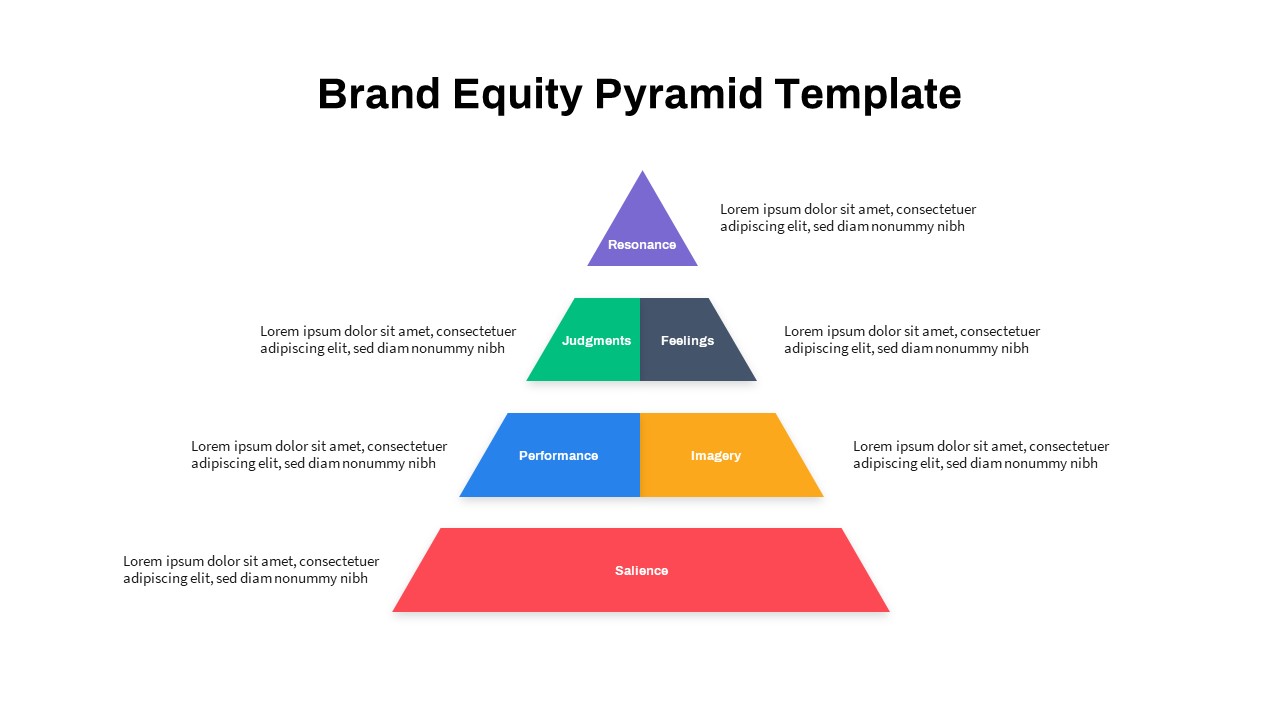
Strategic Brand Equity Pyramid Diagram Template for PowerPoint & Google Slides
Pyramid
Multi-Level Colorful Pyramid Chart Template for PowerPoint & Google Slides
Pyramid
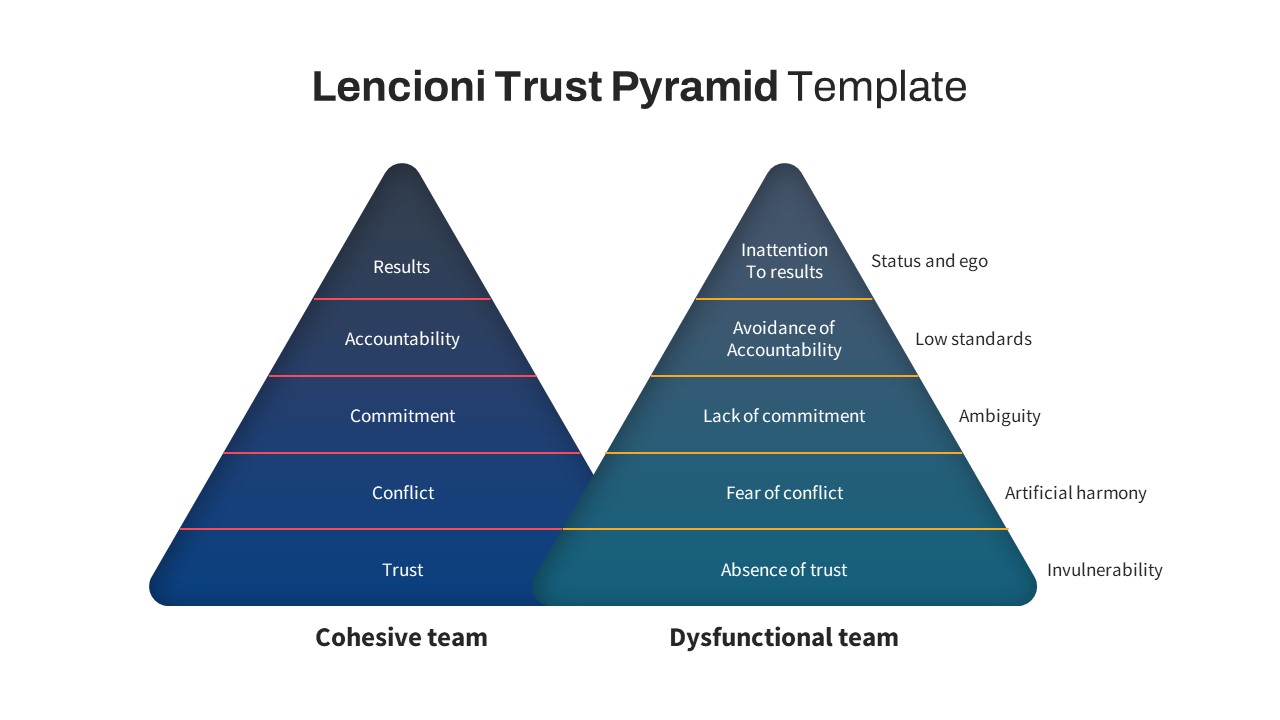
Lencioni Trust Pyramid Diagram Template for PowerPoint & Google Slides
Pyramid
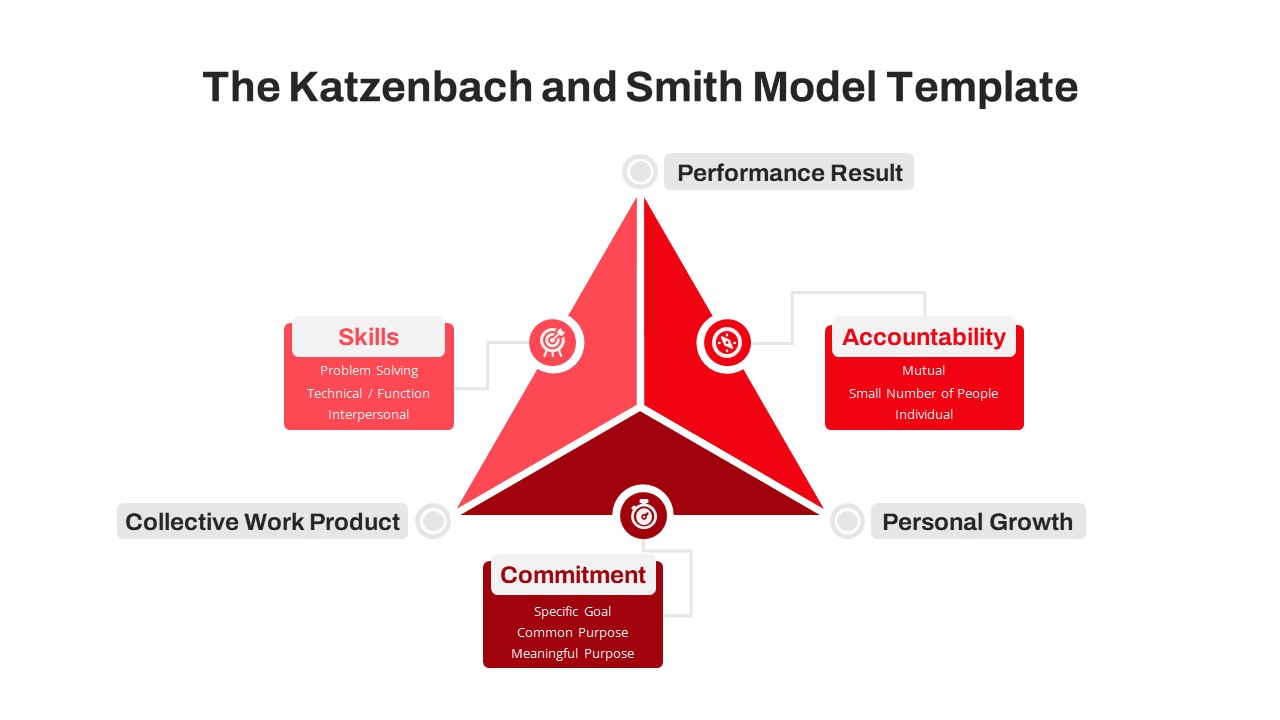
Katzenbach & Smith Model Pyramid Template for PowerPoint & Google Slides
Pyramid
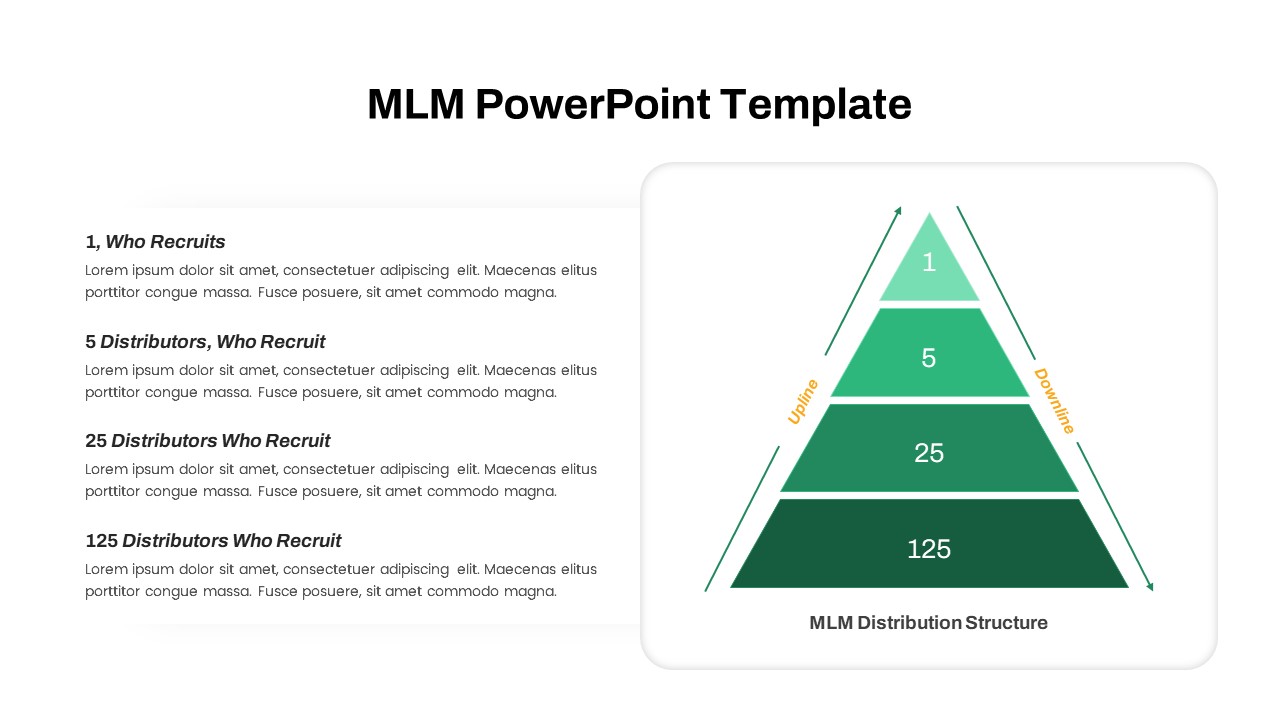
MLM Distribution Pyramid Diagram Template for PowerPoint & Google Slides
Business Models
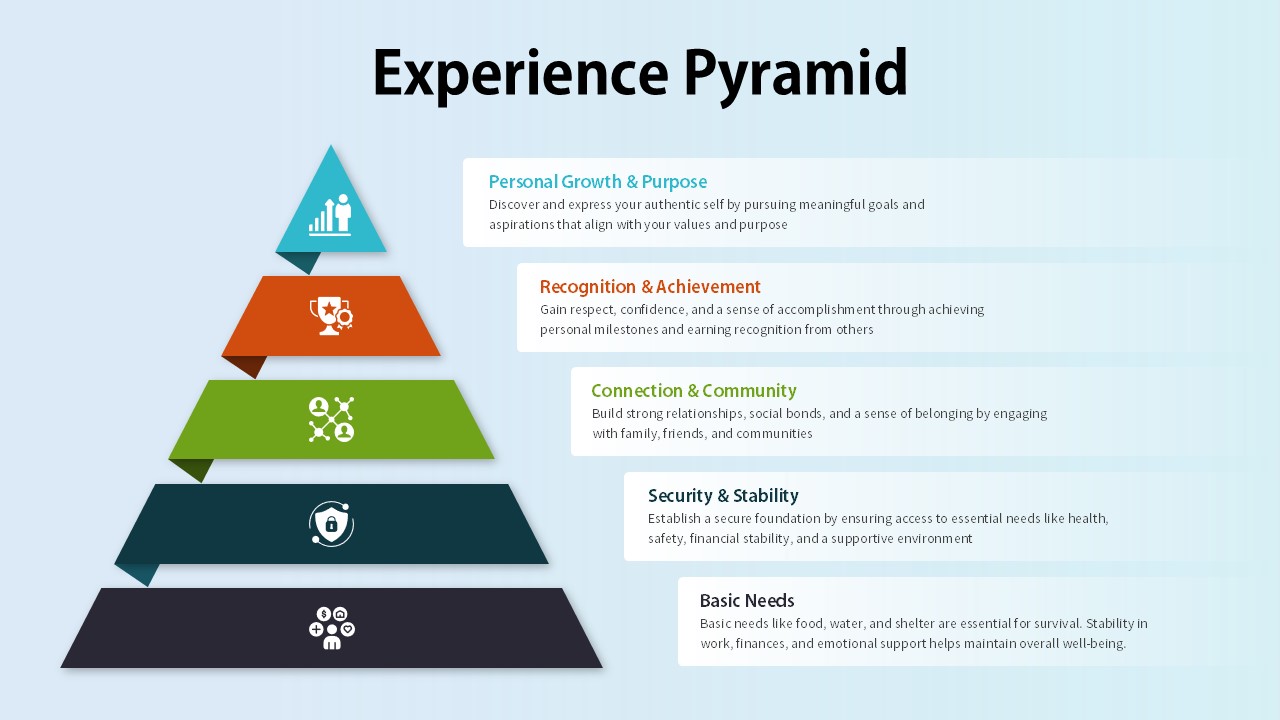
Experience Pyramid Hierarchy Diagram Template for PowerPoint & Google Slides
Pyramid
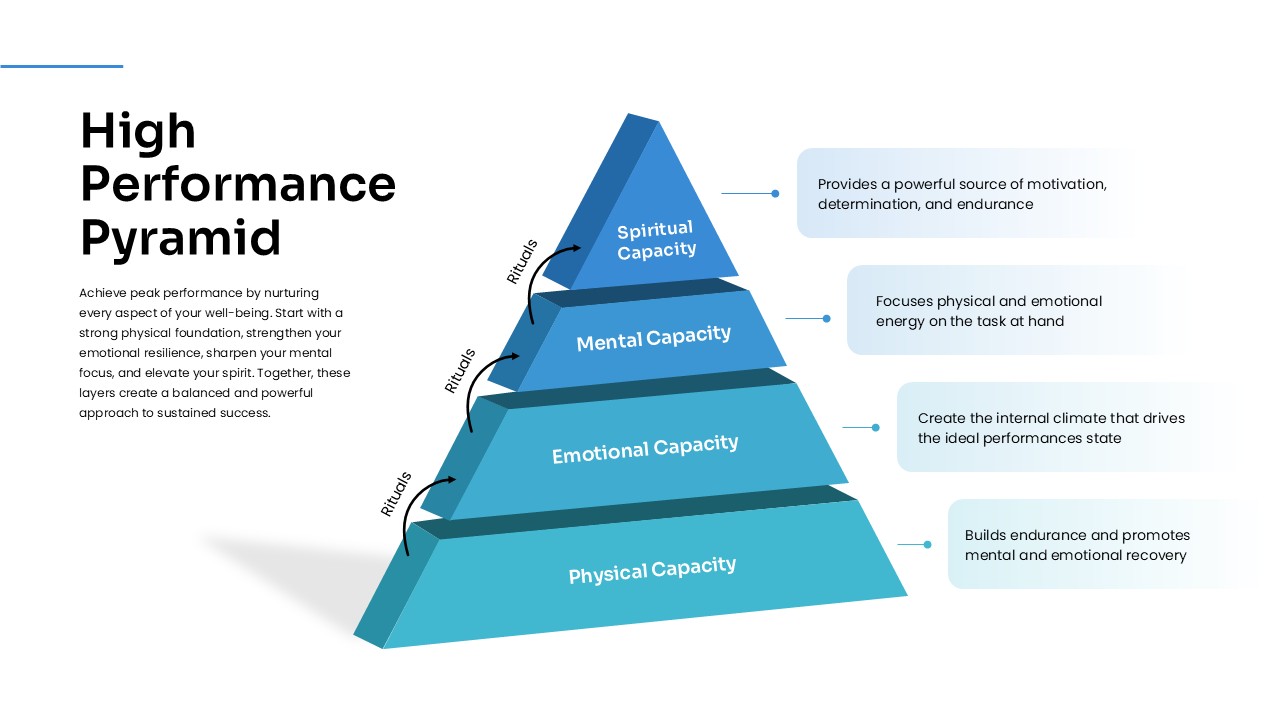
High Performance Pyramid Diagram Template for PowerPoint & Google Slides
Pyramid
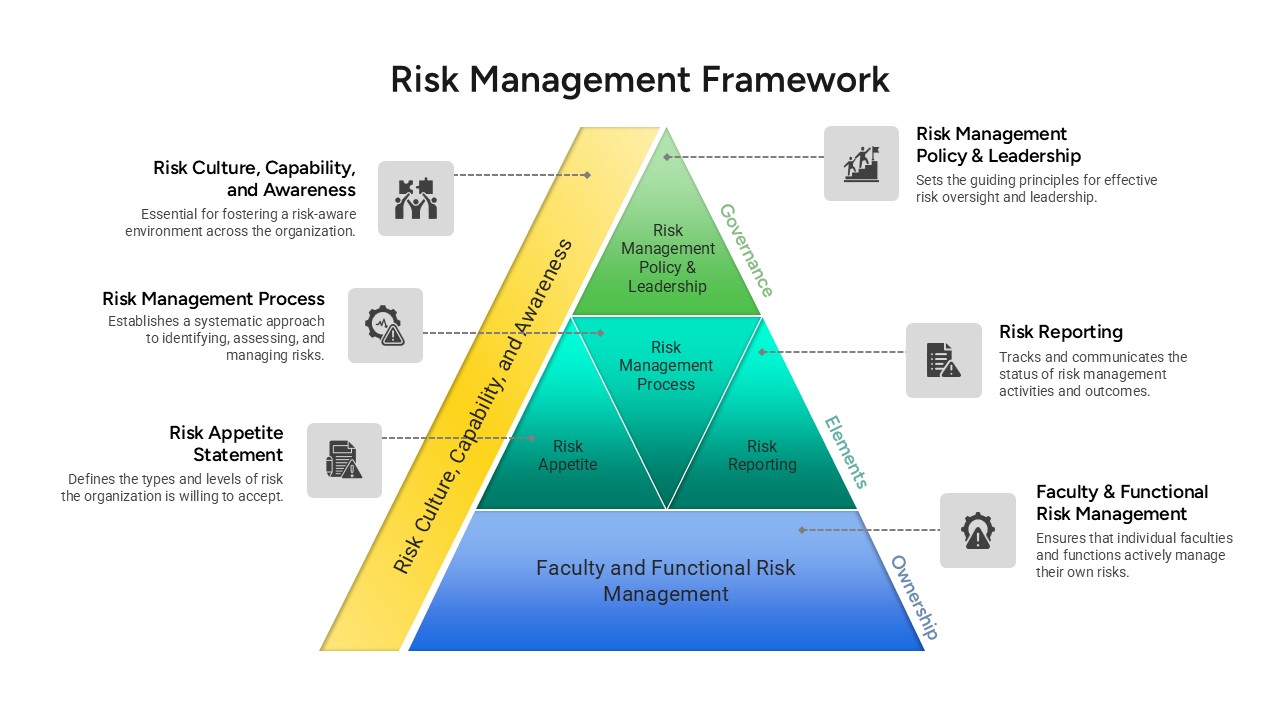
Risk Management Framework Pyramid Template for PowerPoint & Google Slides
Risk Management
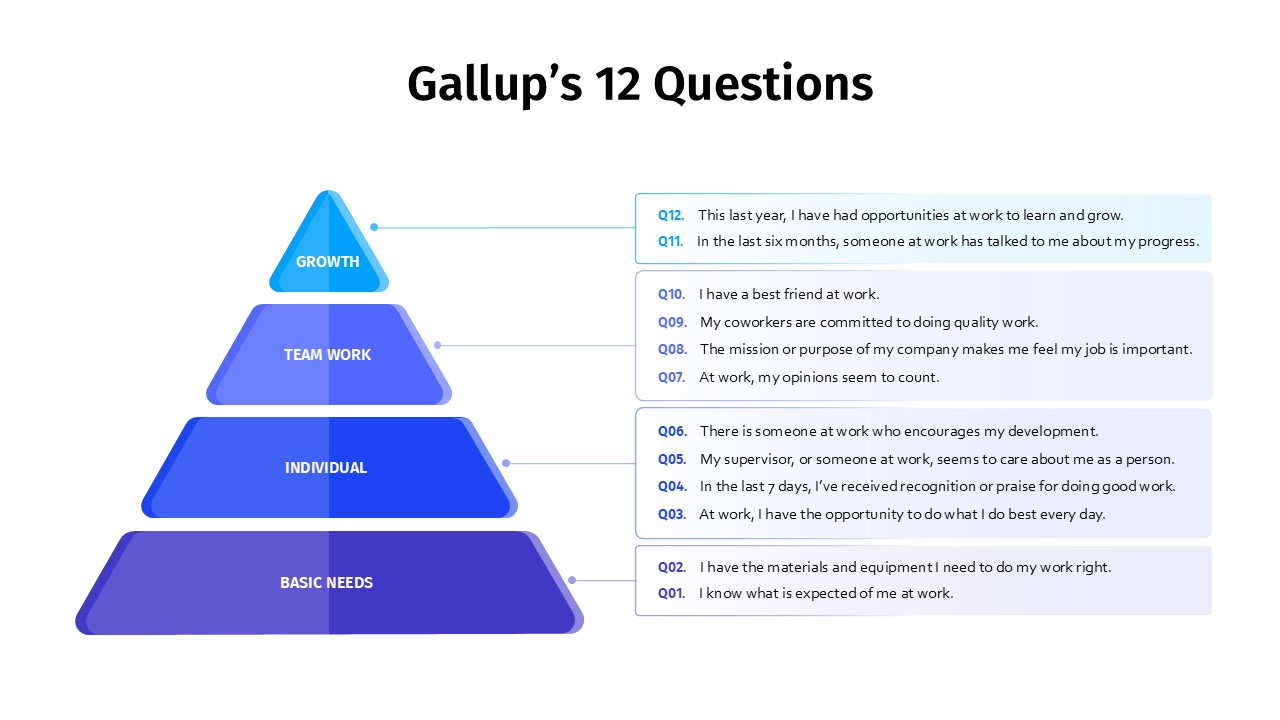
Gallup’s 12 Questions Engagement Pyramid Template for PowerPoint & Google Slides
Pyramid
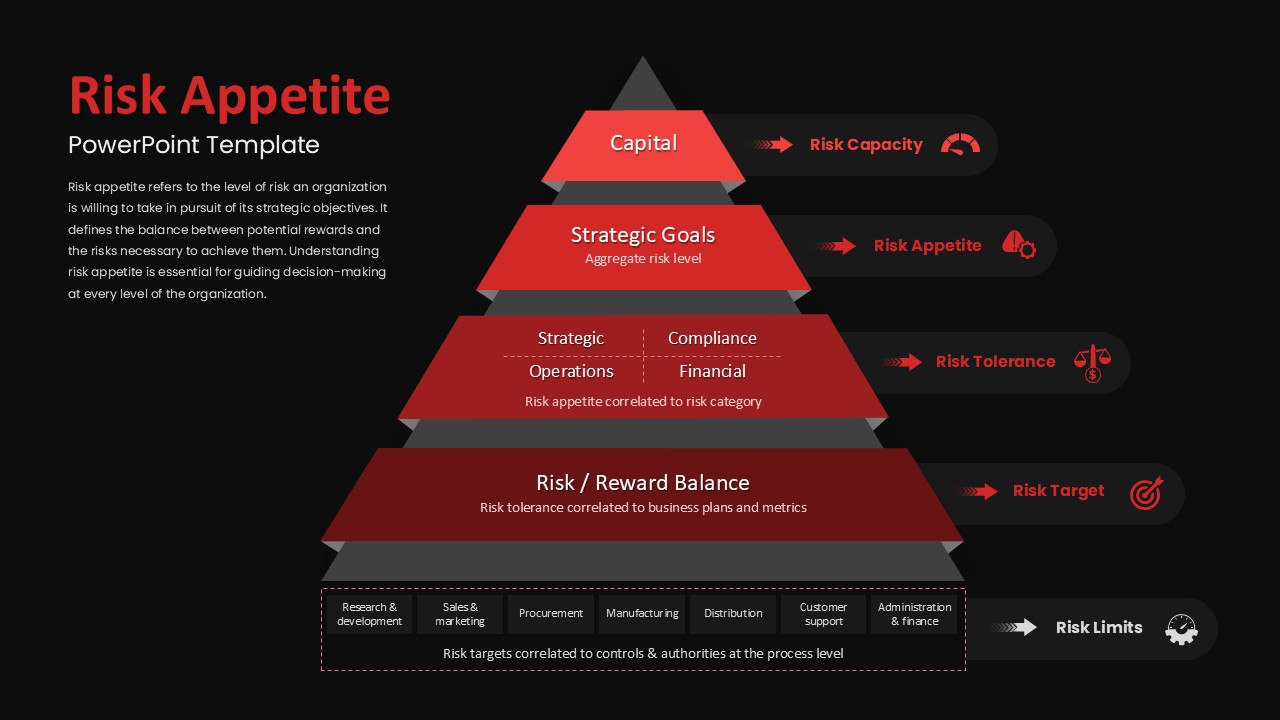
Risk Appetite Pyramid Framework Template for PowerPoint & Google Slides
Pyramid
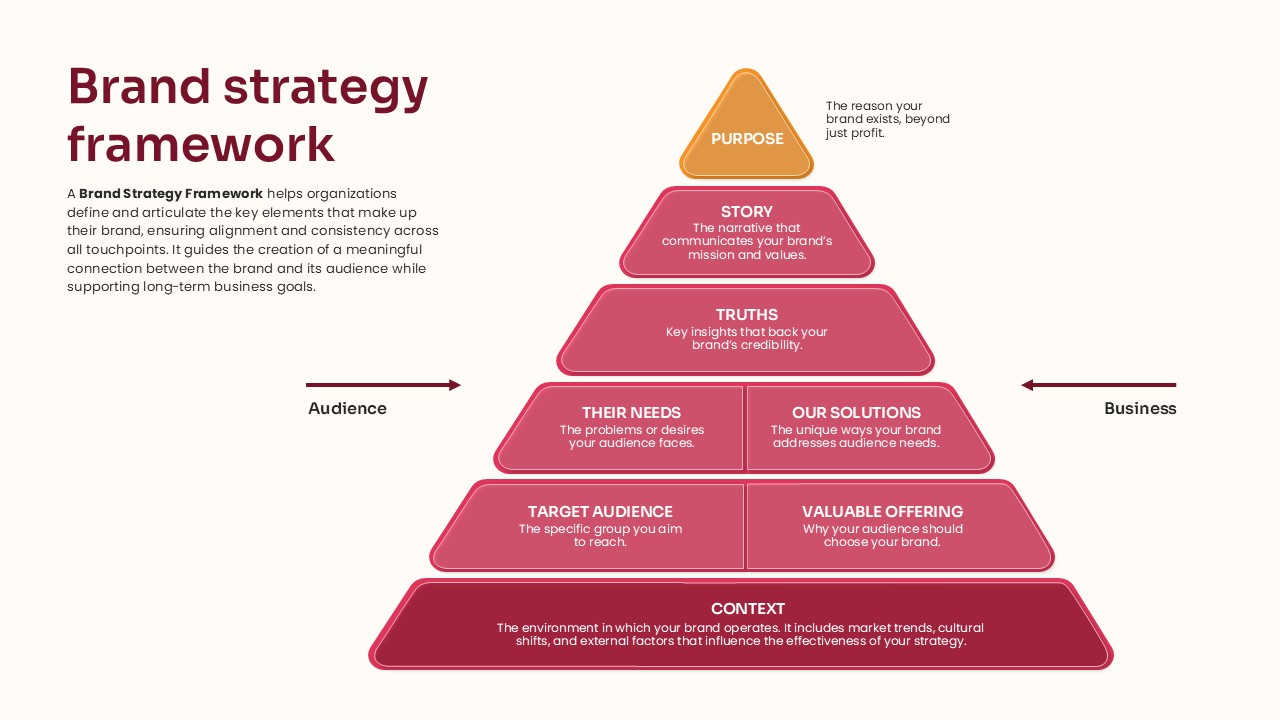
Pyramid Brand Strategy Framework Template for PowerPoint & Google Slides
Business Strategy
Data Governance Roles Pyramid Diagram Template for PowerPoint & Google Slides
Pyramid
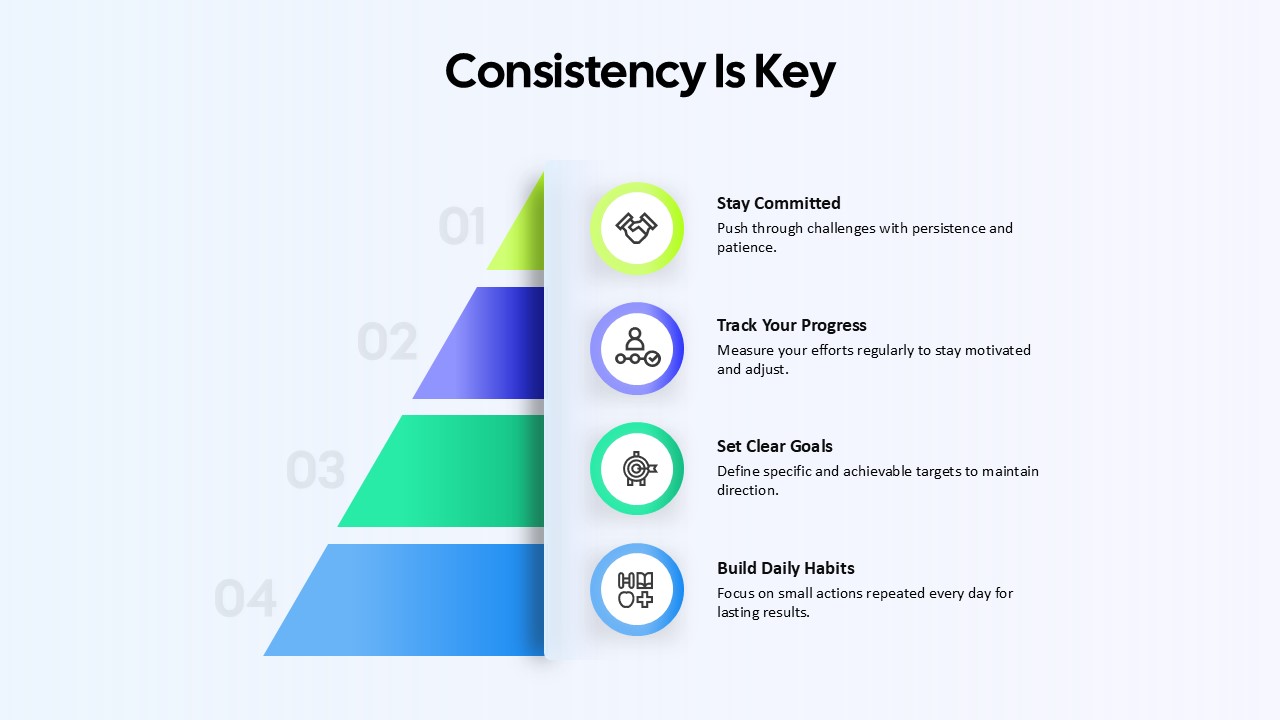
Consistency Is Key Four-Step Pyramid Template for PowerPoint & Google Slides
Process
Five-Stage Pyramid Template for PowerPoint & Google Slides
Pyramid
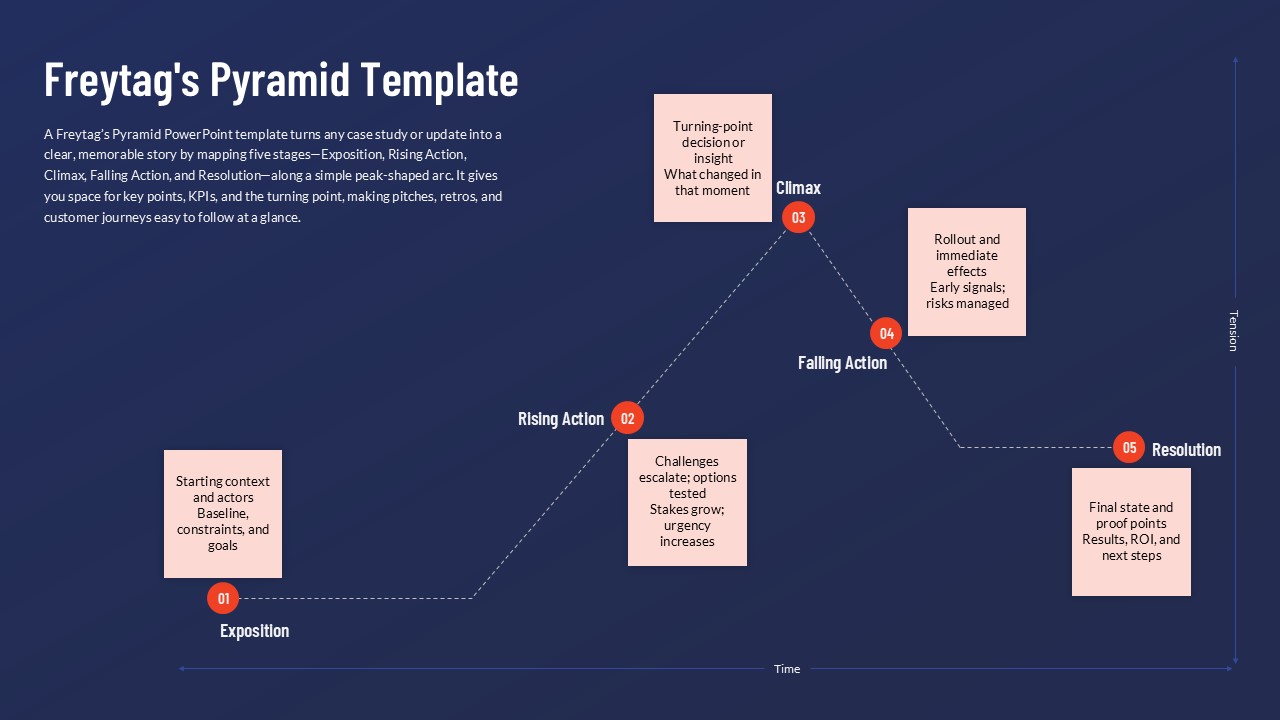
Freytag’s Pyramid Template for PowerPoint & Google Slides
Process
Four-Level Colorful Pyramid Diagram Template for PowerPoint & Google Slides
Pyramid
5 Level Hierarchy Pyramid Template for PowerPoint & Google Slides
Pyramid

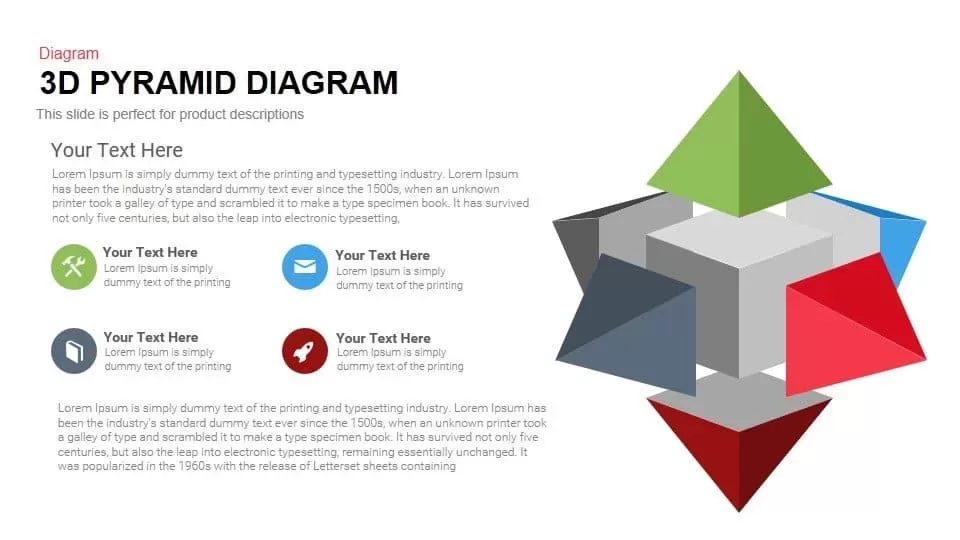
3D Pyramid Diagram for PowerPoint & Google Slides
Pyramid
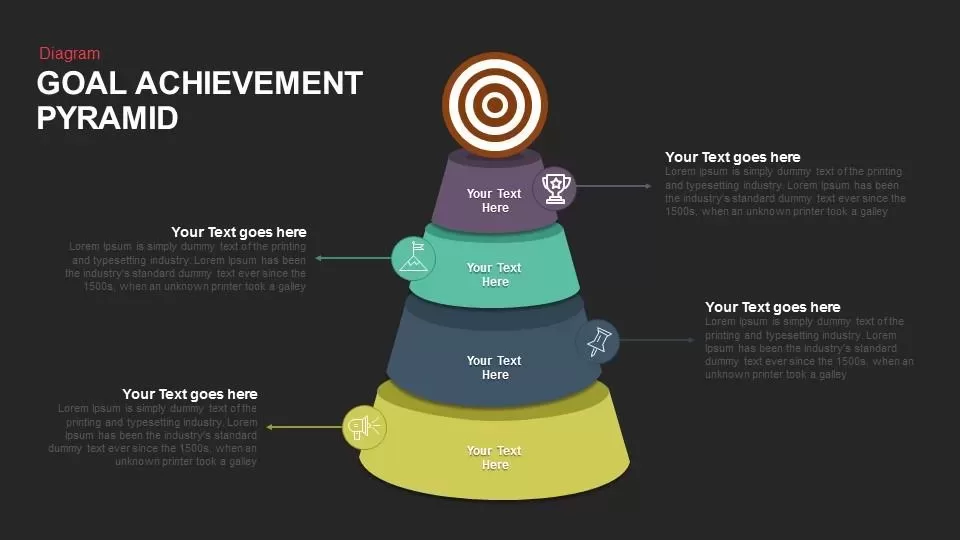
Goal Achievement Pyramid Diagram for PowerPoint & Google Slides
Pyramid
Five Staged Pyramid Diagram for PowerPoint & Google Slides
Pyramid
5 Stage Pyramid Slide for PowerPoint & Google Slides
Pyramid
Real-Time Strategic Planning Pyramid Slide for PowerPoint & Google Slides
Business Strategy
Safety Incident Pyramid Risk Hierarchy Slide for PowerPoint & Google Slides
Risk Management
True vs. Incomplete MVP Pyramid Slide for PowerPoint & Google Slides
Pyramid
Product Strategy Pyramid Diagram for PowerPoint & Google Slides
Business Strategy
Heinrich Safety Pyramid Analysis Slide for PowerPoint & Google Slides
Pyramid
Business Strategy Pyramid with Goals and Tactics for PowerPoint & Google Slides
Pyramid
Inverted Pyramid for PowerPoint & Google Slides
Funnel
Google Ads Optimization & Performance Infographic Template for PowerPoint & Google Slides
Digital Marketing
SQ3R Study Strategy Infographic Slides Template for PowerPoint & Google Slides
Business Strategy
Six Double Diamond Infographic Slides Template for PowerPoint & Google Slides
Process

Sales Process Infographic Slides Pack Template for PowerPoint & Google Slides
Process
Casino/Poker Chips Infographic Slides template for PowerPoint & Google Slides
Business Strategy
Agenda Infographic Pack of 2 Slides Template for PowerPoint & Google Slides
Agenda
Quad Chart Infographic Pack of 8 Slides Template for PowerPoint & Google Slides
Comparison Chart
Four Options Infographic Slides Template for PowerPoint & Google Slides
Comparison
Game Plan Infographic Slides Pack Template for PowerPoint & Google Slides
Infographics
Teamwork PowerPoint Infographic Template for PowerPoint & Google Slides
Leadership
Kite Infographic PowerPoint Template for PowerPoint & Google Slides
Process
Cladogram Infographic Di Template for PowerPoint & Google Slides Template
Decision Tree
Workflow PowerPoint Process infographic for PowerPoint & Google Slides
Process
Free Infographic Deck PowerPoint Pack for PowerPoint & Google Slides
Infographics
Free
Six-Circle Process Infographic Diagram Template for PowerPoint & Google Slides
Circular

Circular CRM Process Infographic Diagram Template for PowerPoint & Google Slides
Circular