Accuracy Vs Precision Comparison Template for PowerPoint & Google Slides

Description
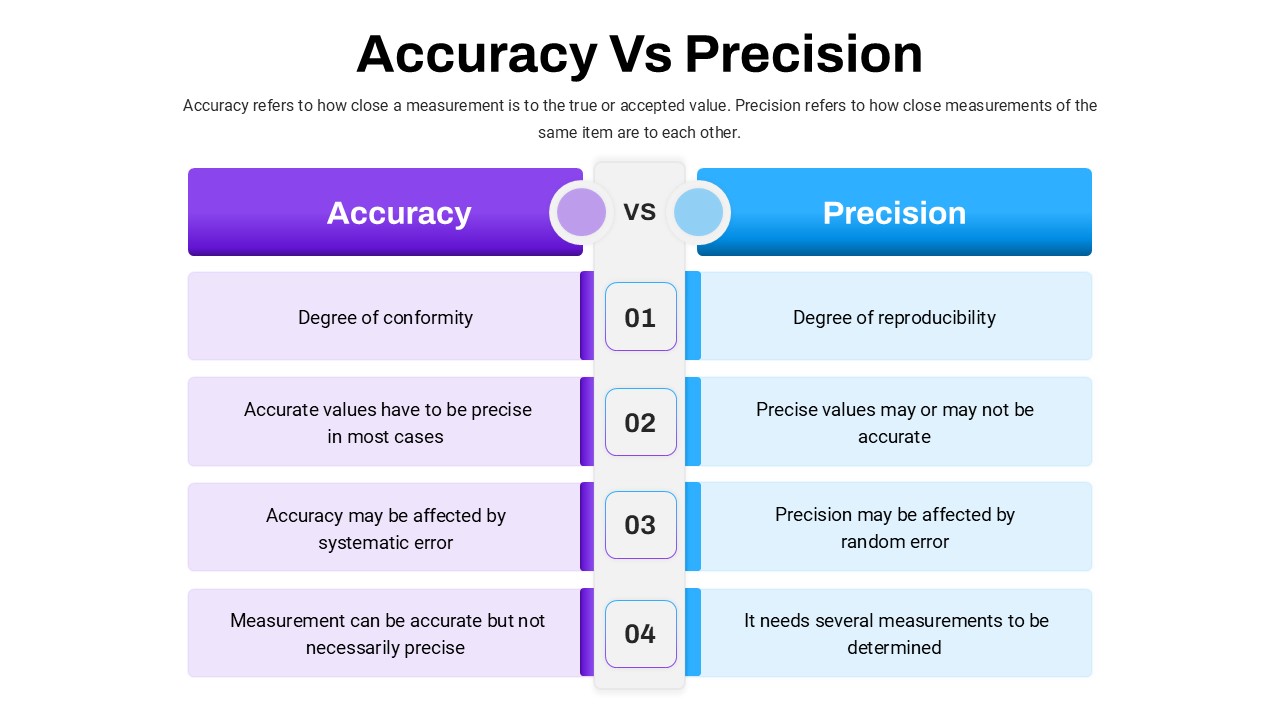
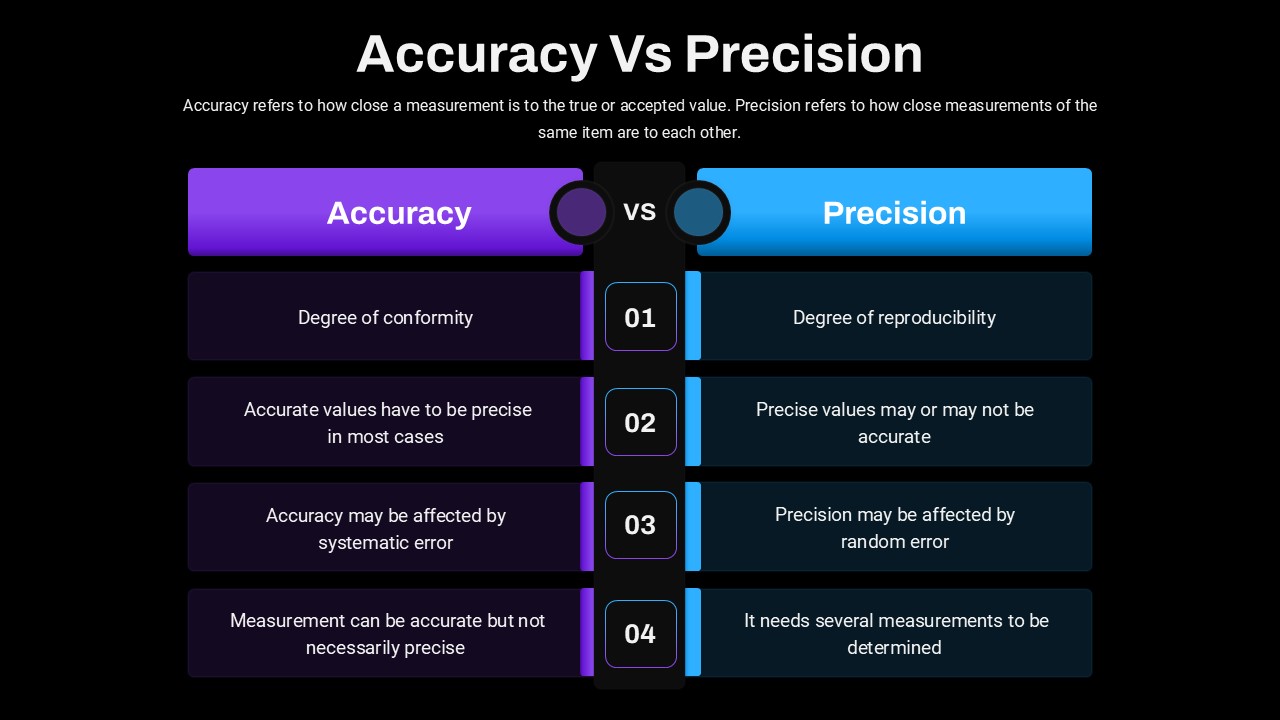
This slide presents a clear side-by-side comparison of accuracy and precision, helping audiences grasp these fundamental measurement concepts at a glance. The design features two gradient-filled panels—purple for accuracy and blue for precision—anchored by a central vertical column with numbered steps. Each panel pairs a bold heading with concise definitions and four corresponding statements: conformity versus reproducibility, the relationship between accuracy and precision, effects of systematic versus random error, and the role of sample size in reliable measurement. The modern layout uses subtle drop shadows, rounded corners, and crisp typography to create visual hierarchy, while editable placeholders and master slides ensure you can customize text, colors, and icons in seconds. Fully compatible with PowerPoint and Google Slides, this asset preserves formatting and resolution across devices, streamlining version control and collaboration.
Who is it for
Quality engineers, data analysts, laboratory researchers, and statistics instructors will benefit from this comparison slide when explaining measurement concepts, highlighting error sources, or training teams in experimental methods. Project managers and consultants can also leverage it to illustrate performance metrics and data validation processes.
Other Uses
Beyond measurement theory, repurpose this template for any concept comparison—such as risk versus reward analyses, cost versus benefit evaluations, or feature A versus feature B breakdowns. Use the numbered format to sequence stages, steps, or criteria, adapting the color panels to your branding or topic requirements.
Login to download this file

Item ID
SB05057
Related Templates

Service Zoom Feature Slides Comparison template for PowerPoint & Google Slides
Process
Simple Comparison Table Template for PowerPoint & Google Slides
Comparison
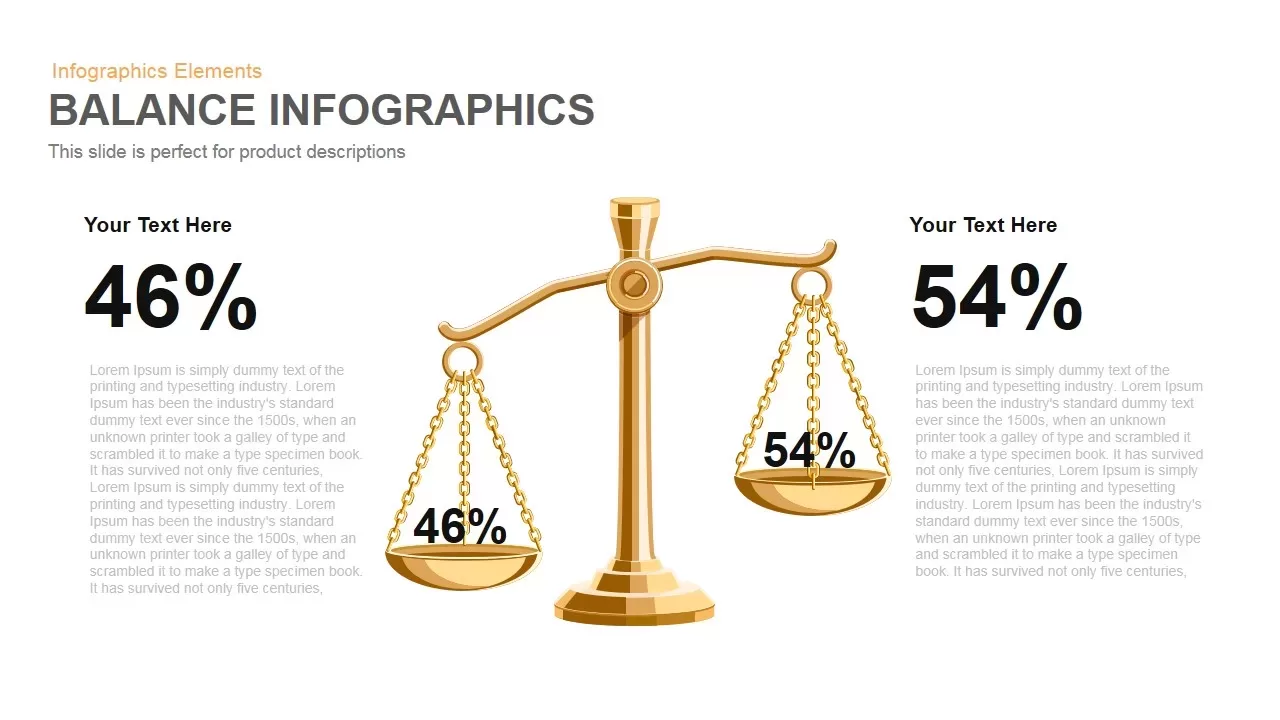
Gold Scales Balance Comparison Template for PowerPoint & Google Slides
Comparison
Four-Tier Pricing Comparison Table Template for PowerPoint & Google Slides
Comparison
Comparison Bar Chart template for PowerPoint & Google Slides
Comparison Chart
3-Column Comparison template for PowerPoint & Google Slides
Comparison

A/B Testing Comparison Infographic template for PowerPoint & Google Slides
Comparison

Scale Metaphor Metrics Comparison Template for PowerPoint & Google Slides
Charts
Four-Plan Pricing Table Comparison Template for PowerPoint & Google Slides
Comparison
Interactive Product Comparison Bar Chart Template for PowerPoint & Google Slides
Bar/Column
Gender Comparison People Infographic Template for PowerPoint & Google Slides
Comparison
Comparison Chart Overview template for PowerPoint & Google Slides
Comparison Chart
Dynamic Multicolor Comparison Table Template for PowerPoint & Google Slides
Comparison

Comparison Pricing Table Infographic Template for PowerPoint & Google Slides
Comparison Chart
Interactive Pricing Plan Comparison Template for PowerPoint & Google Slides
Comparison
Tornado Chart Data Comparison Slide Template for PowerPoint & Google Slides
Bar/Column
Radar Chart Product Comparison Template for PowerPoint & Google Slides
Comparison Chart
Six-Metric Green Product Comparison Template for PowerPoint & Google Slides
Comparison
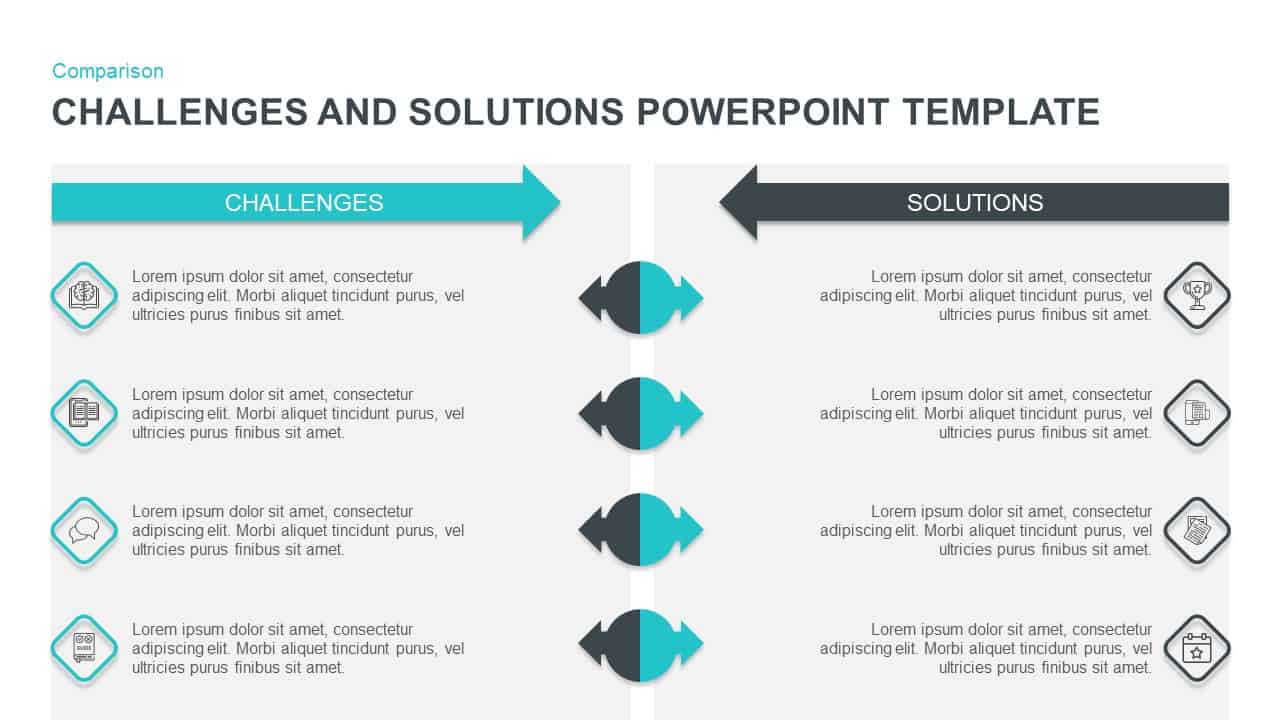
Challenges vs Solutions Comparison Template for PowerPoint & Google Slides
Comparison
Two-Column Comparison Infographic Slide Template for PowerPoint & Google Slides
Comparison
Fact and Figures Comparison Slide Template for PowerPoint & Google Slides
Business Report

BMI Category Comparison Chart Template for PowerPoint & Google Slides
Comparison
Isometric 3D Block Comparison Diagram Template for PowerPoint & Google Slides
Comparison
Generations Comparison Infographic Template for PowerPoint & Google Slides
Timeline
Circular Product Comparison Chart Template for PowerPoint & Google Slides
Comparison Chart
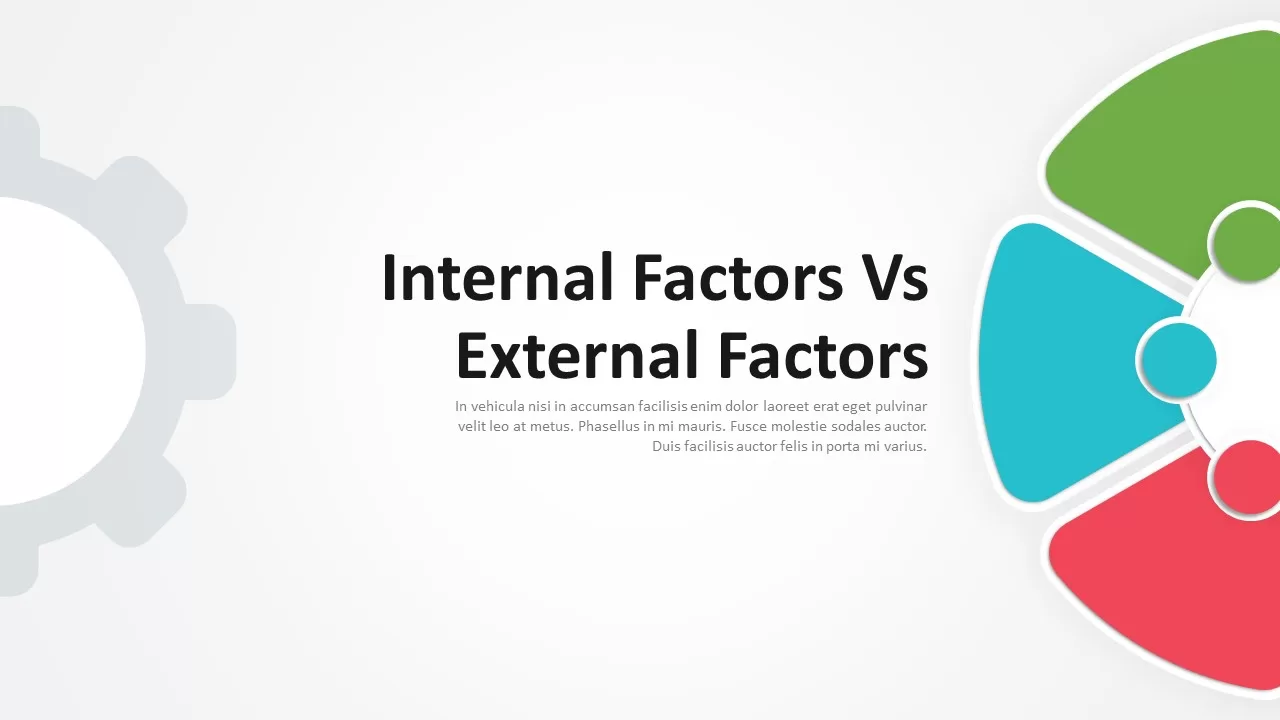
Internal vs External Factors Comparison Template for PowerPoint & Google Slides
Comparison
Theory X and Theory Y Comparison Template for PowerPoint & Google Slides
Comparison
Pugh Matrix Decision Comparison Chart Template for PowerPoint & Google Slides
Comparison Chart
Competitive Landscape Comparison Template Pack for PowerPoint & Google Slides
Comparison
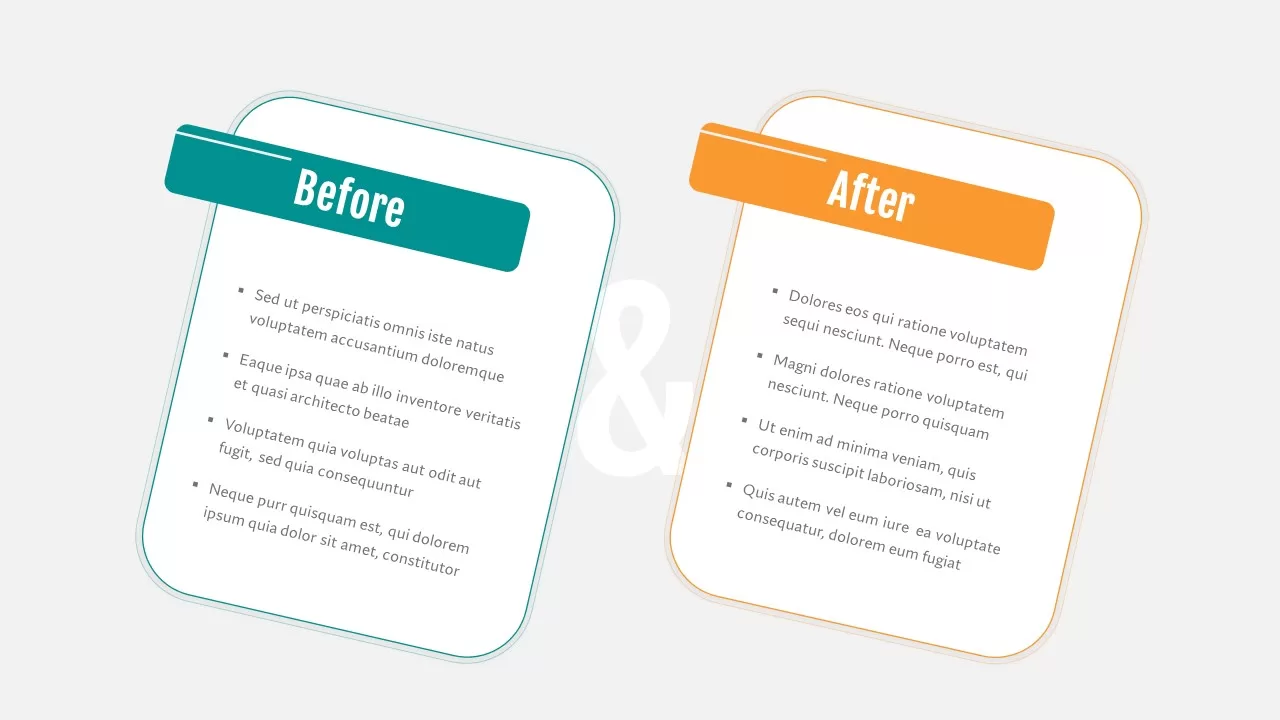
Before and After Comparison Infographics Template for PowerPoint & Google Slides
Comparison
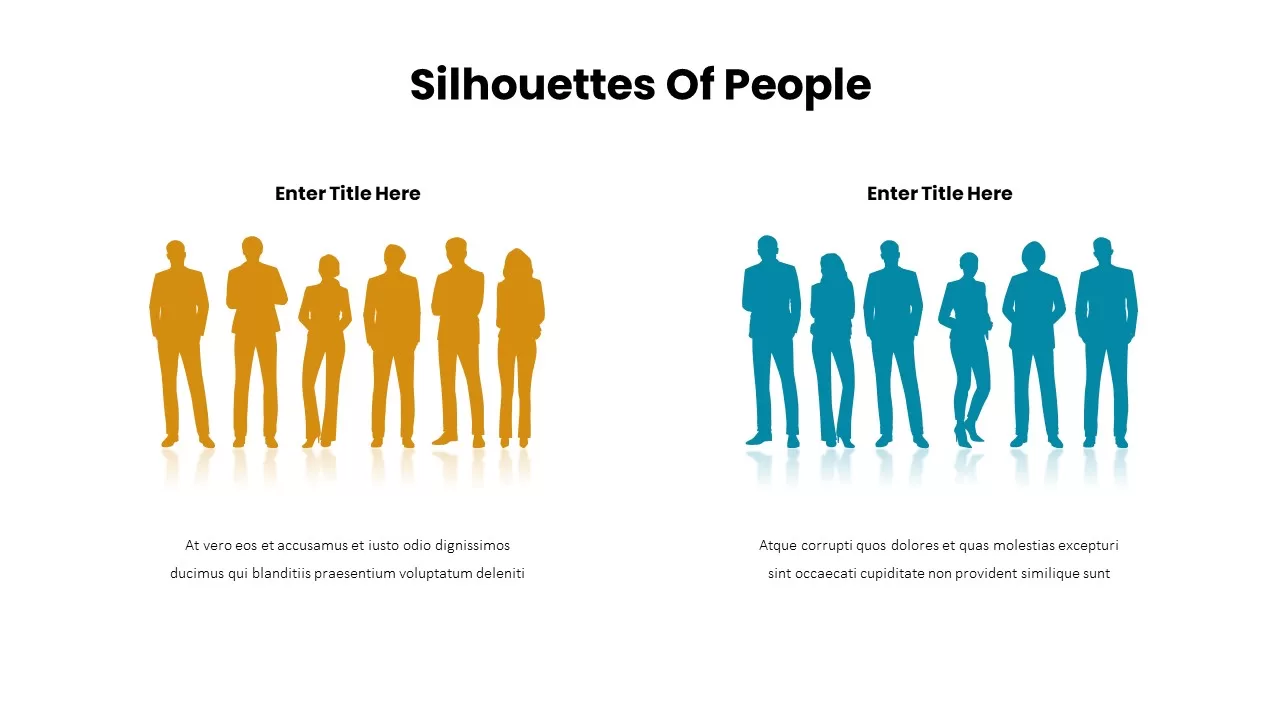
Business Silhouettes Comparison Slide Template for PowerPoint & Google Slides
HR
Current vs Future State Comparison Slide Template for PowerPoint & Google Slides
Comparison Chart
Before and After Comparison Infographic Template for PowerPoint & Google Slides
Comparison
Free
Before and After Comparison Slide Template for PowerPoint & Google Slides
Comparison
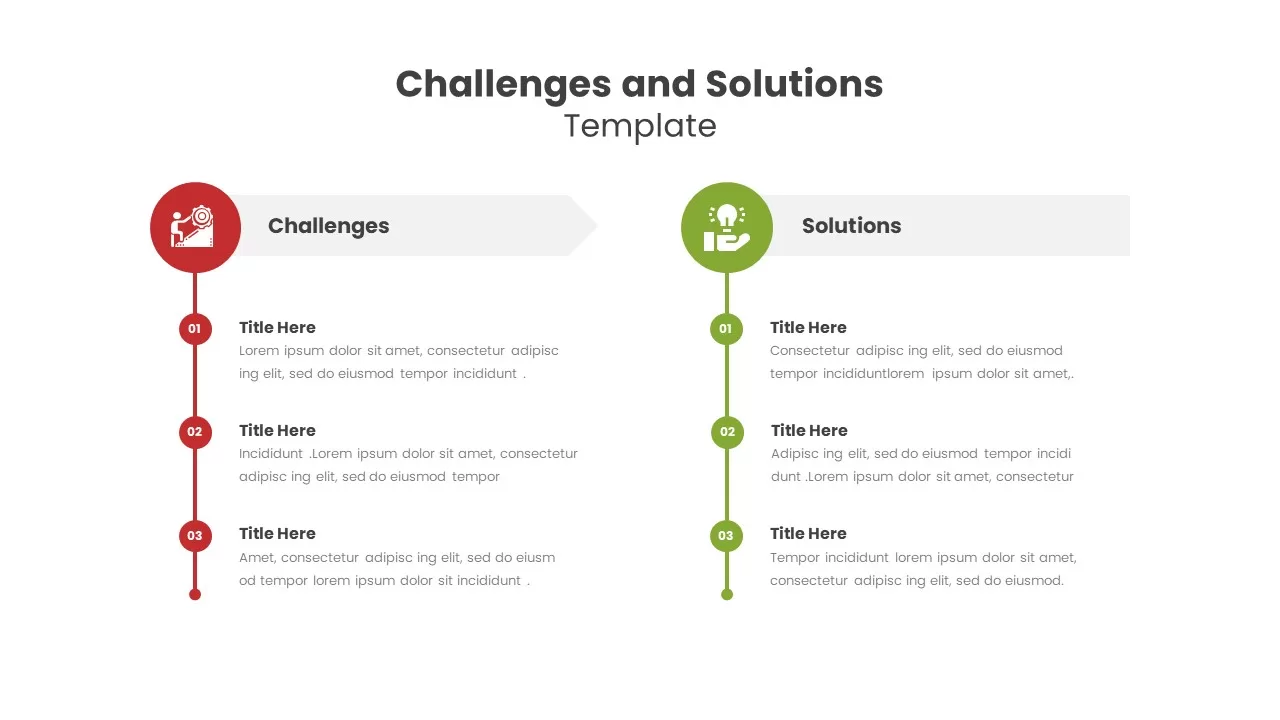
Challenges and Solutions Comparison Template for PowerPoint & Google Slides
Opportunities Challenges
Benchmarking Metrics Comparison Slide Template for PowerPoint & Google Slides
Pie/Donut
Dynamic Benchmarking Comparison Chart Template for PowerPoint & Google Slides
Comparison Chart
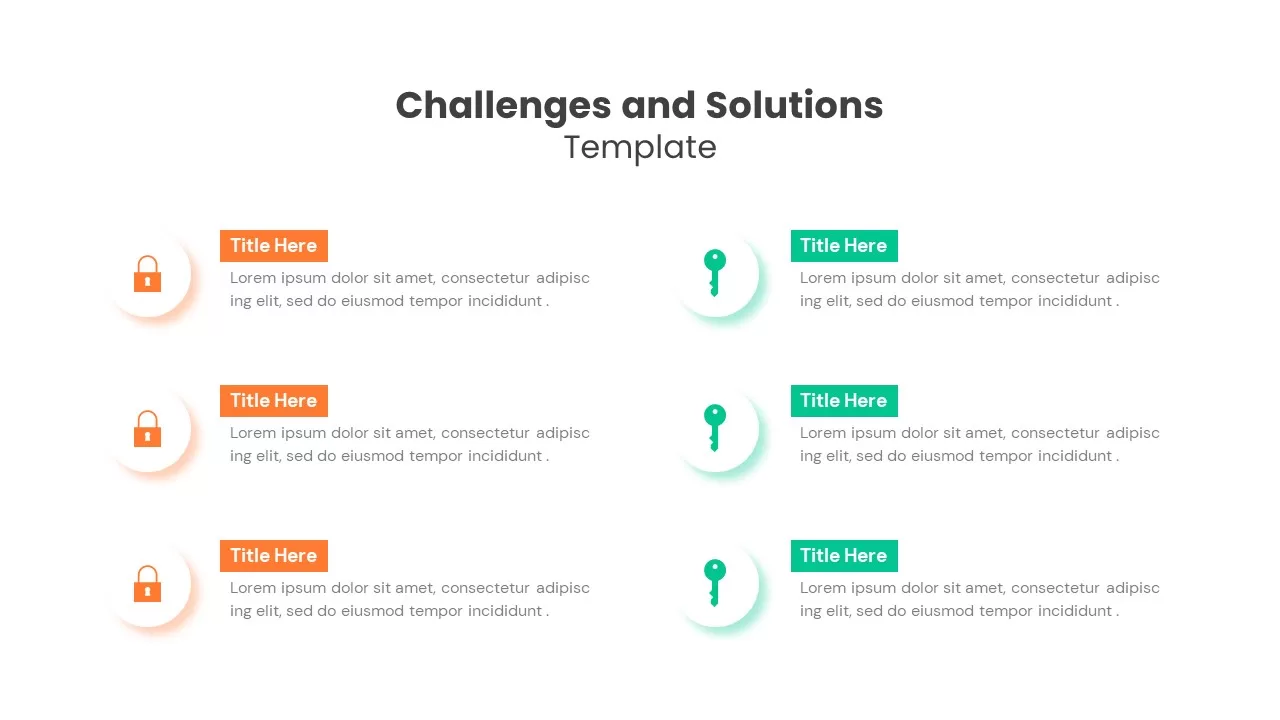
Challenges & Solutions Comparison Template for PowerPoint & Google Slides
Opportunities Challenges
Cost Benefit Analysis Comparison Template for PowerPoint & Google Slides
Comparison
Adam’s Equity Theory Scale Comparison Template for PowerPoint & Google Slides
Comparison
Risk Heatmap Comparison Template for PowerPoint & Google Slides
Maps
Heatmap Comparison Template for PowerPoint & Google Slides
Maps
Vendor Comparison Analysis template for PowerPoint & Google Slides
Comparison Chart
Vendor Comparison Matrix with High-Level Requirements template for PowerPoint & Google Slides
Comparison Chart
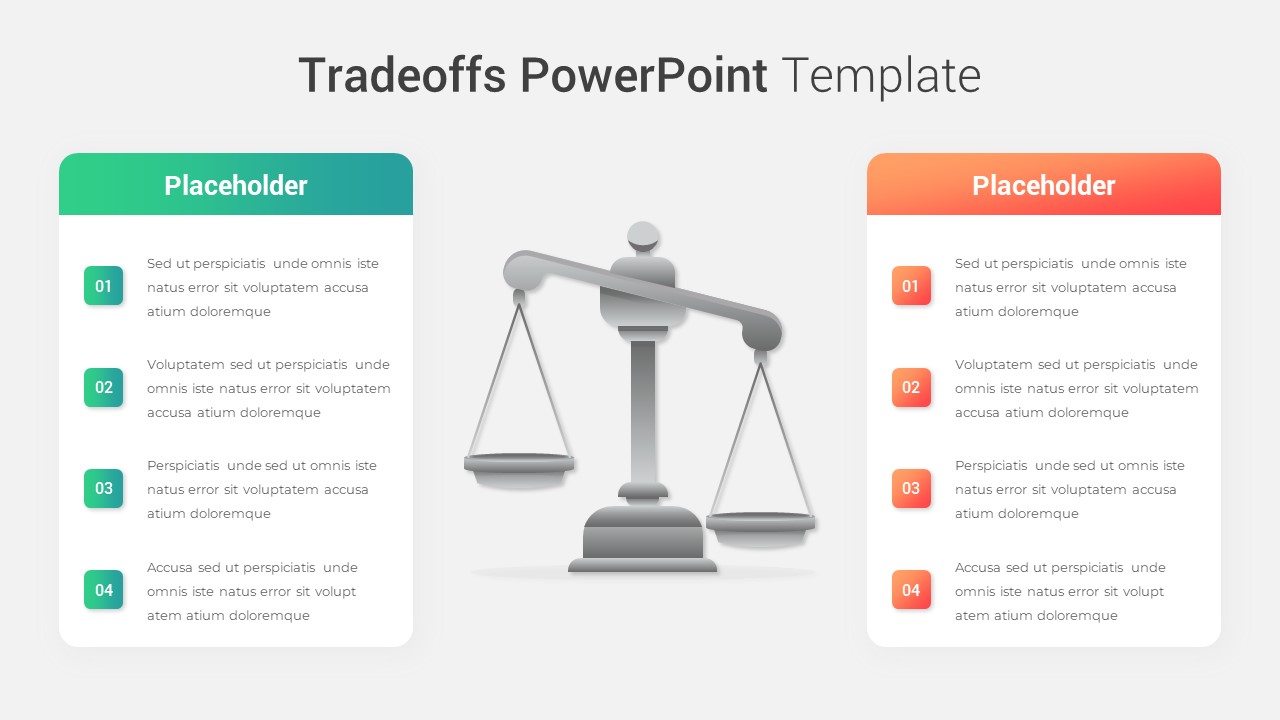
Modern Tradeoffs Comparison Slide Template for PowerPoint & Google Slides
Comparison
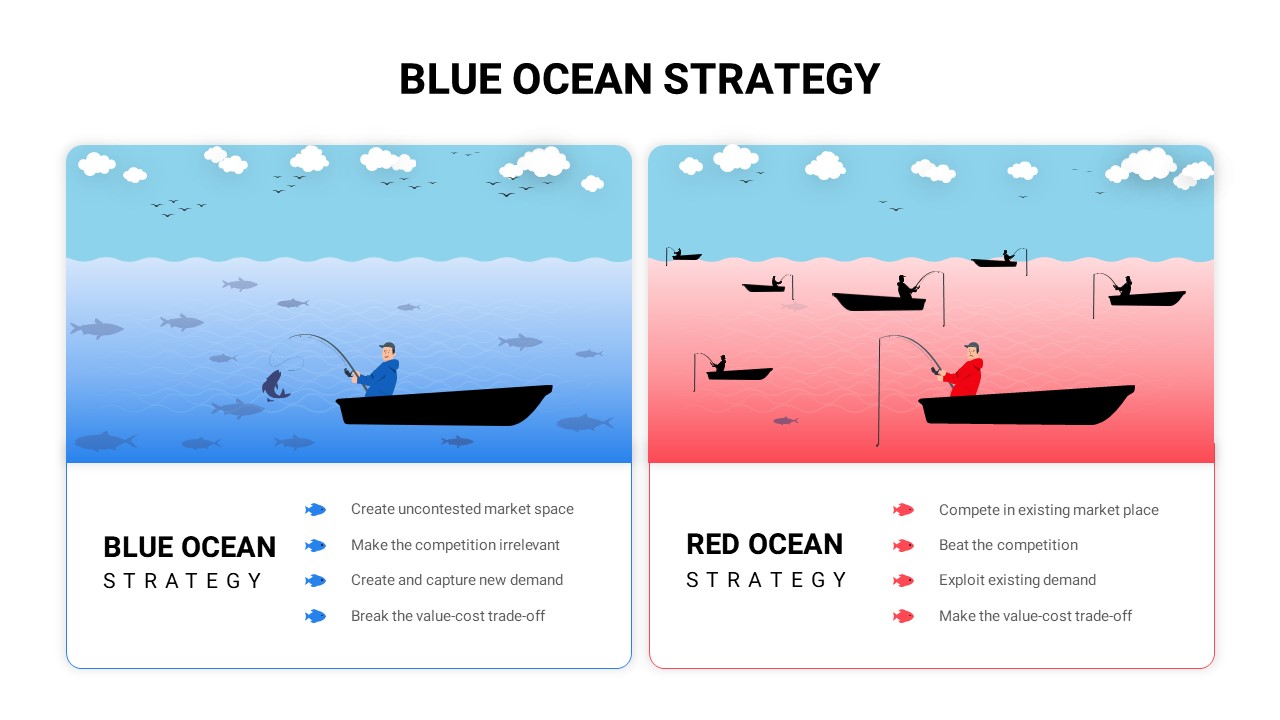
Blue vs Red Ocean Strategy Comparison Template for PowerPoint & Google Slides
Business Strategy
Hits and Misses Performance Comparison Template for PowerPoint & Google Slides
Comparison
People Demographic Comparison Chart Template for PowerPoint & Google Slides
Comparison
Conflict Infographics Comparison Template for PowerPoint & Google Slides
Infographics
Clustered Bar Chart Comparison Template for PowerPoint & Google Slides
Bar/Column
Business Timeline Comparison Bar Chart Template for PowerPoint & Google Slides
Comparison Chart
Grouped Column Chart Comparison Template for PowerPoint & Google Slides
Bar/Column
Multiple Line Chart Comparison Template for PowerPoint & Google Slides
Comparison Chart
Mirror Bar Chart Comparison Template for PowerPoint & Google Slides
Bar/Column
Interactive Multi-Use Cost Comparison Template for PowerPoint & Google Slides
Comparison
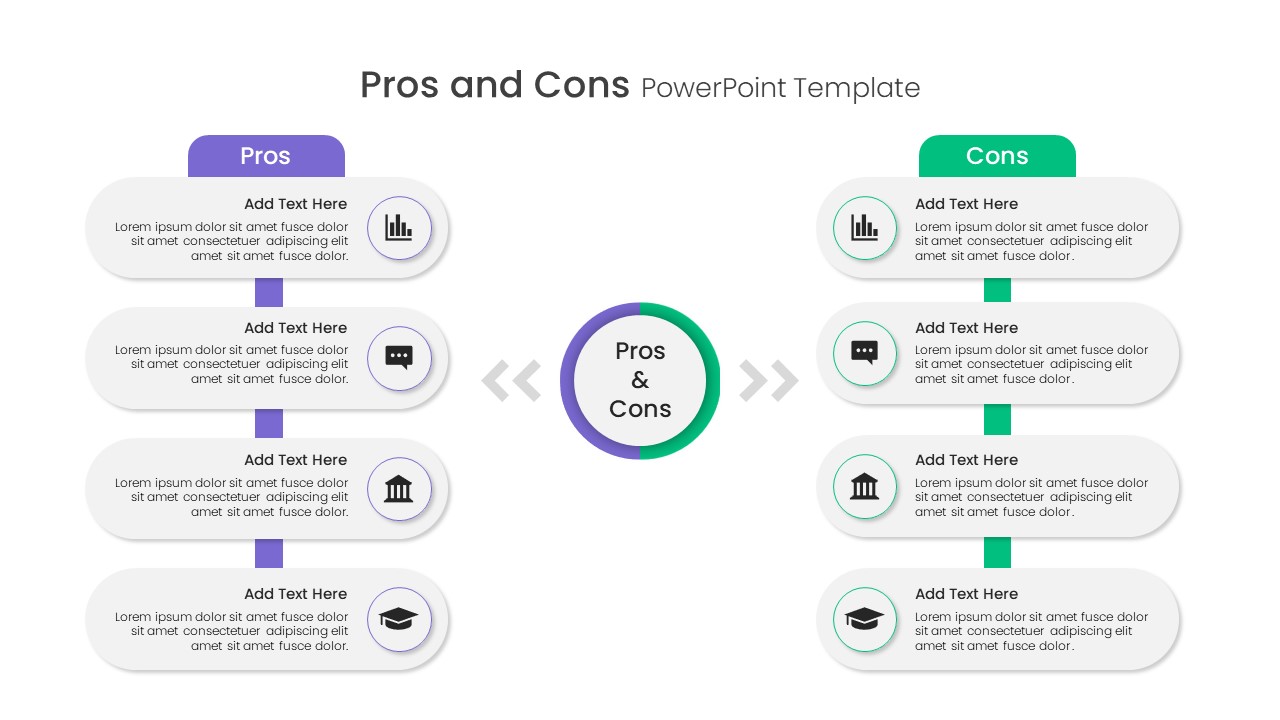
Free Pros and Cons Comparison Template for PowerPoint & Google Slides
Comparison
Free
Free Versatile Product Comparison Chart Template for PowerPoint & Google Slides
Charts
Free
Free Global Warming Infographic Comparison Template for PowerPoint & Google Slides
Comparison Chart
Free
Dynamic Bar-of-Pie Chart Comparison Template for PowerPoint & Google Slides
Pie/Donut
Types of AI Comparison Infographic Template for PowerPoint & Google Slides
AI
AI vs. Human Intelligence Comparison Template for PowerPoint & Google Slides
Comparison
ESG Initiatives Comparison Chart Template for PowerPoint & Google Slides
Business
Economies of Scale Cost Curve Comparison Template for PowerPoint & Google Slides
Comparison Chart
Regional Revenue Comparison Overview Template for PowerPoint & Google Slides
Comparison
Pricing Model Types Comparison Infographic Template for PowerPoint & Google Slides
Pitch Deck
Project Comparison Timeline Roadmap Template for PowerPoint & Google Slides
Comparison
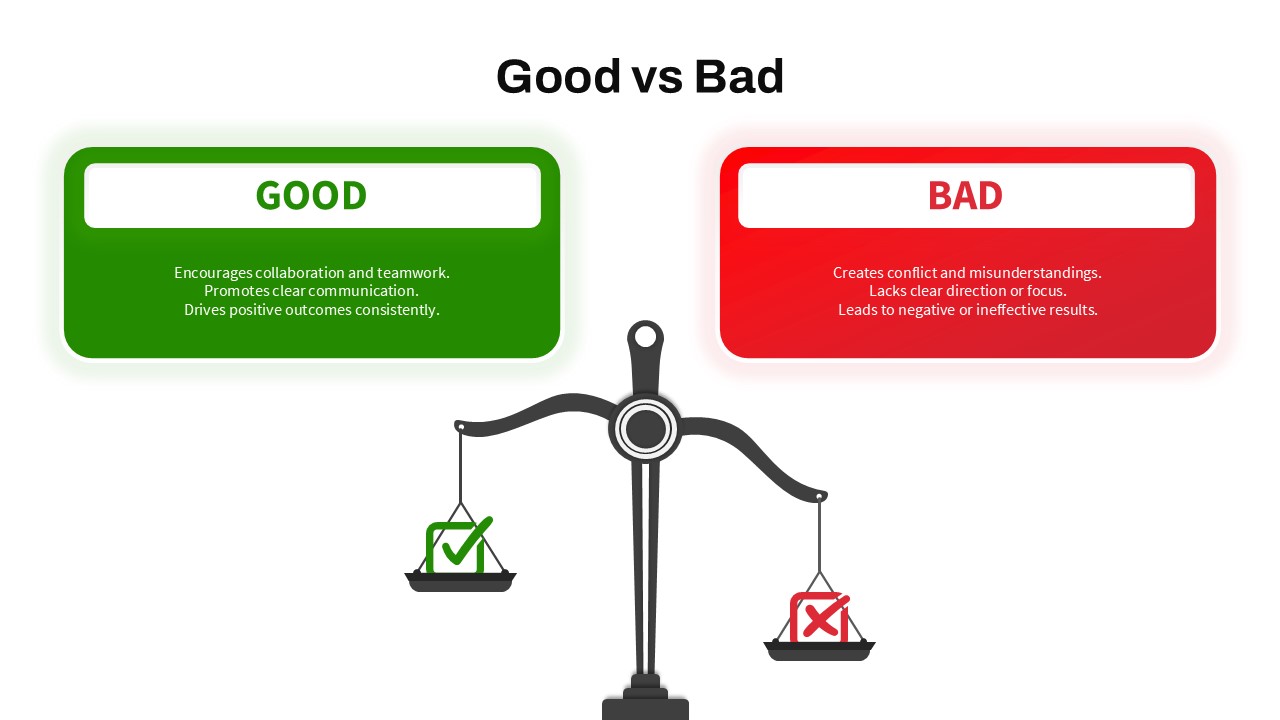
Good vs Bad Comparison with Scale Template for PowerPoint & Google Slides
Comparison
Risk Level Gauge Comparison Dashboard Template for PowerPoint & Google Slides
Comparison
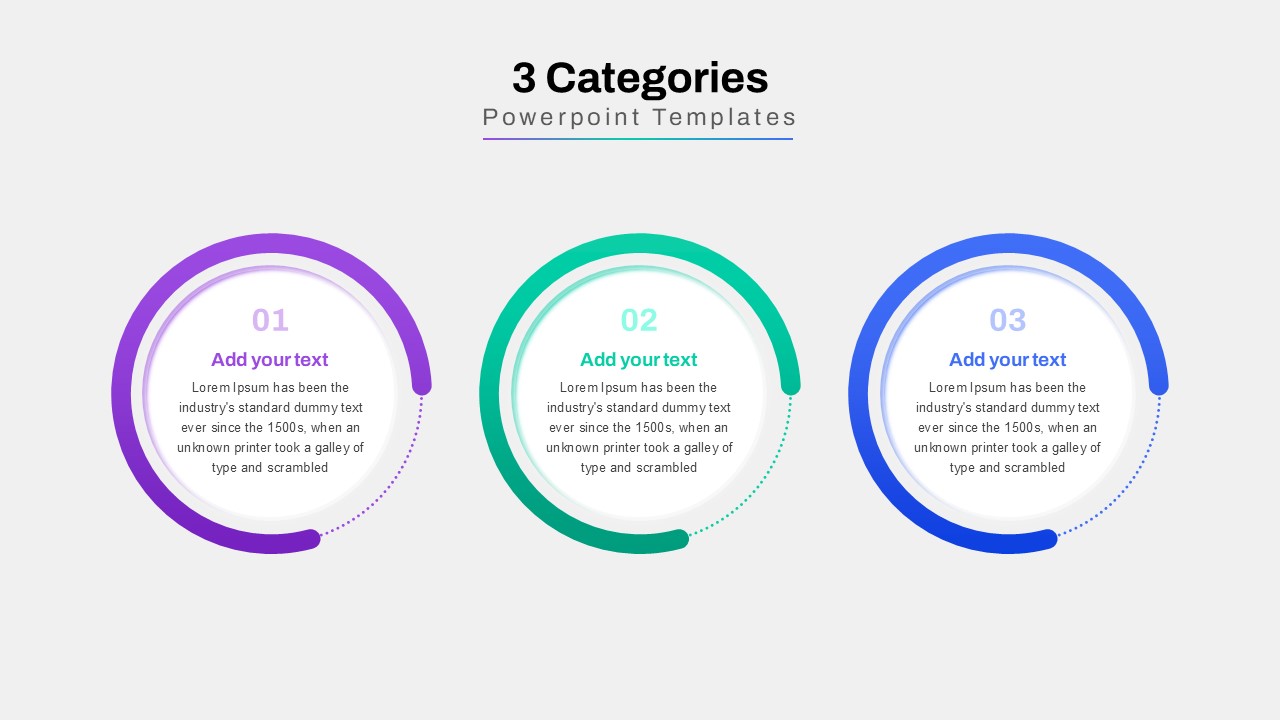
Three-Category Comparison Template for PowerPoint & Google Slides
Comparison
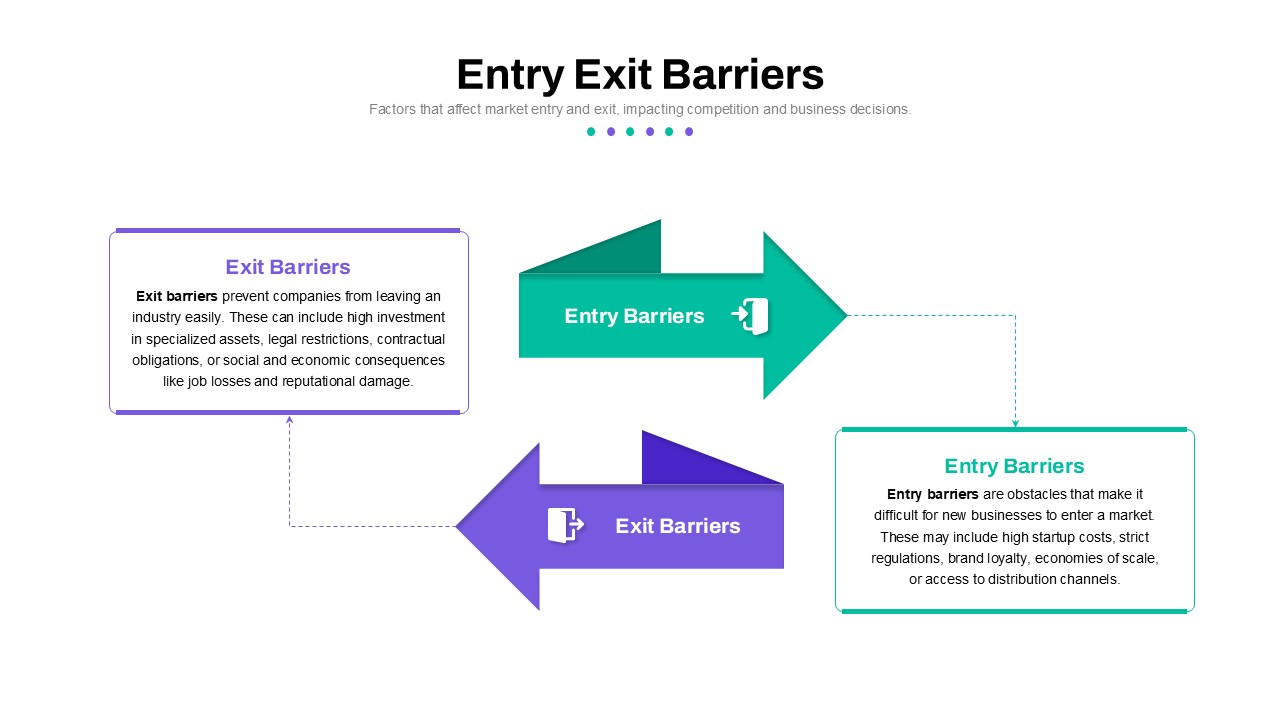
Entry and Exit Barriers Comparison Template for PowerPoint & Google Slides
Comparison
Competitor Comparison Chart Design Template for PowerPoint & Google Slides
Comparison
Two-Option Bar Chart Comparison Table Template for PowerPoint & Google Slides
Comparison
Profile Comparison Chart template for PowerPoint & Google Slides
Comparison Chart
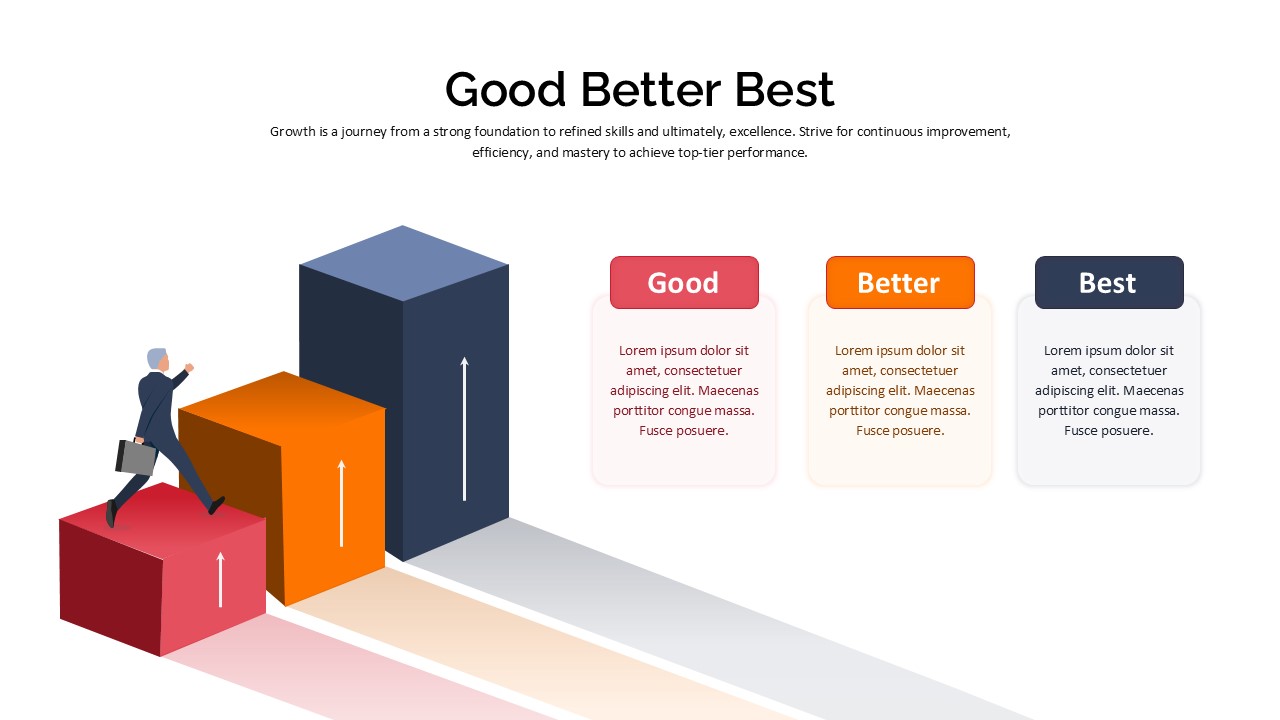
Good Better Best Comparison template for PowerPoint & Google Slides
Comparison
Integrative Thinking Comparison Diagram Template for PowerPoint & Google Slides
Comparison
Product Feature Comparison Table Template for PowerPoint & Google Slides
Comparison Chart
Market Share Comparison Diagram Template for PowerPoint & Google Slides
Comparison Chart
Competitor Profile Matrix Comparison Template for PowerPoint & Google Slides
Comparison Chart
Two-Sided Coin Comparison Diagram Template for PowerPoint & Google Slides
Comparison
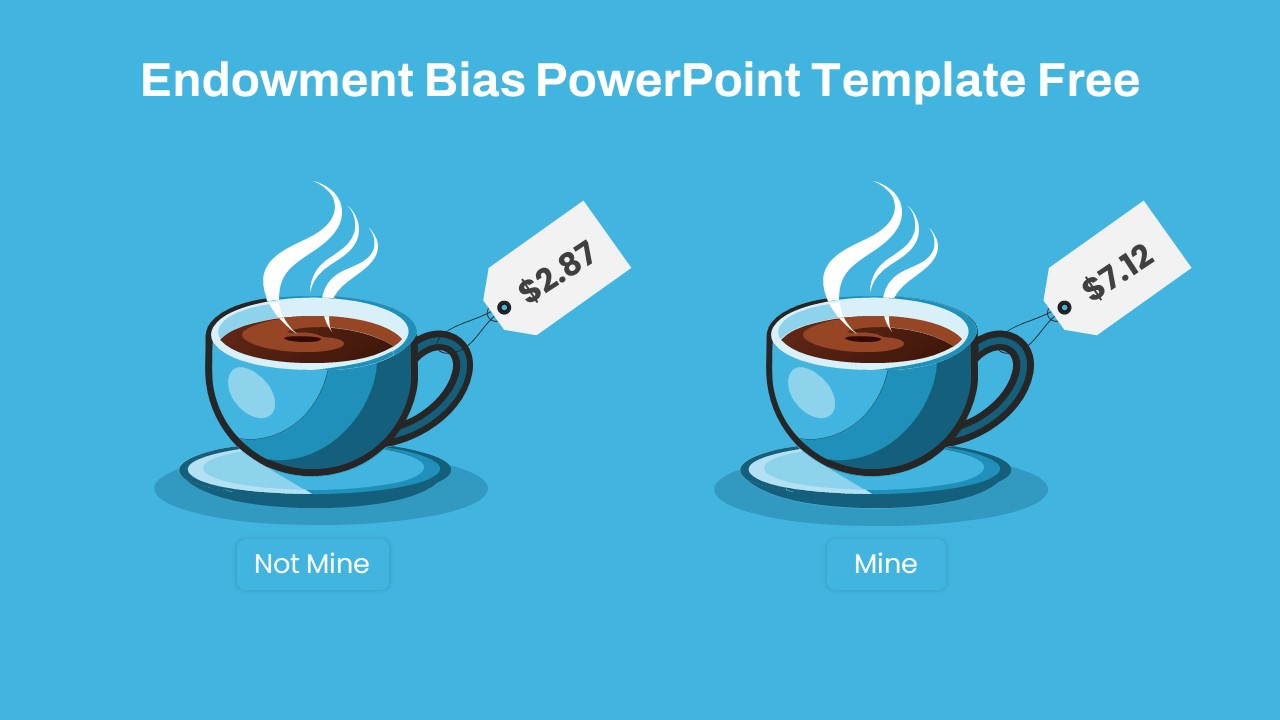
Endowment Bias Coffee Price Comparison Template for PowerPoint & Google Slides
Comparison
Free
Sales Growth Comparison Chart & Table Template for PowerPoint & Google Slides
Bar/Column
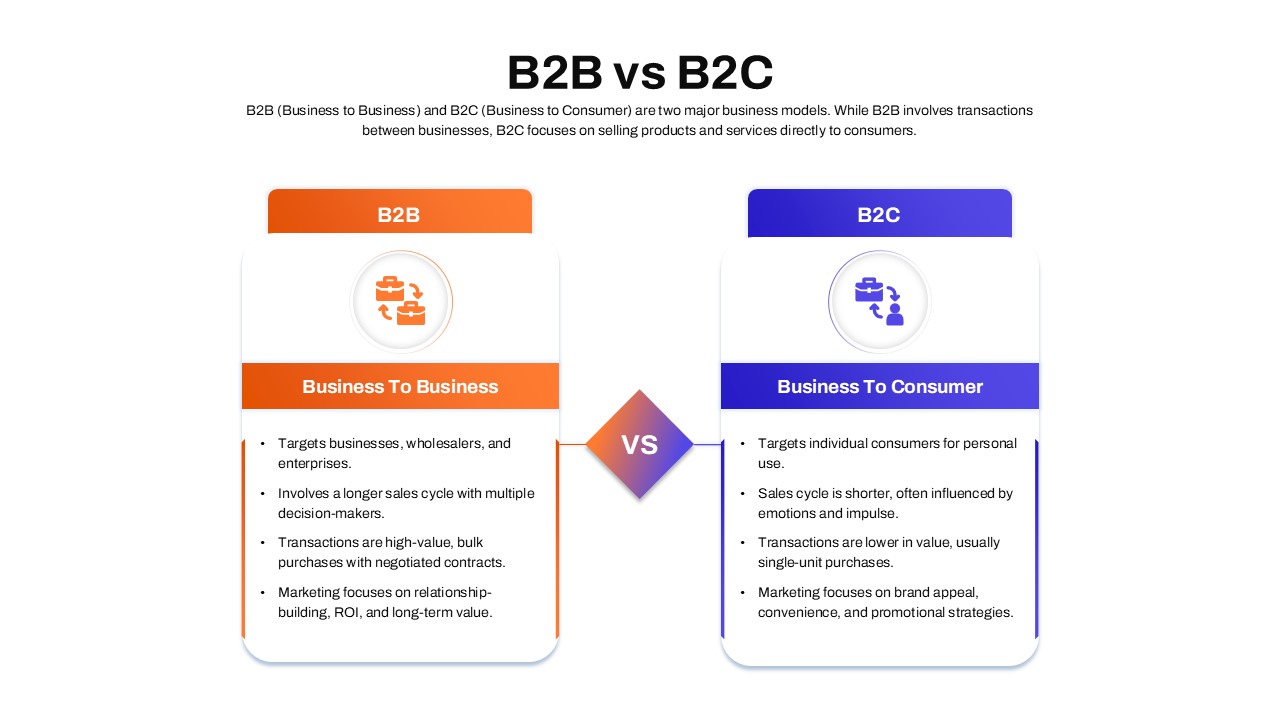
B2B vs B2C Comparison template for PowerPoint & Google Slides
Business Models
VUCA vs BANI Comparison Infographic Template for PowerPoint & Google Slides
Comparison
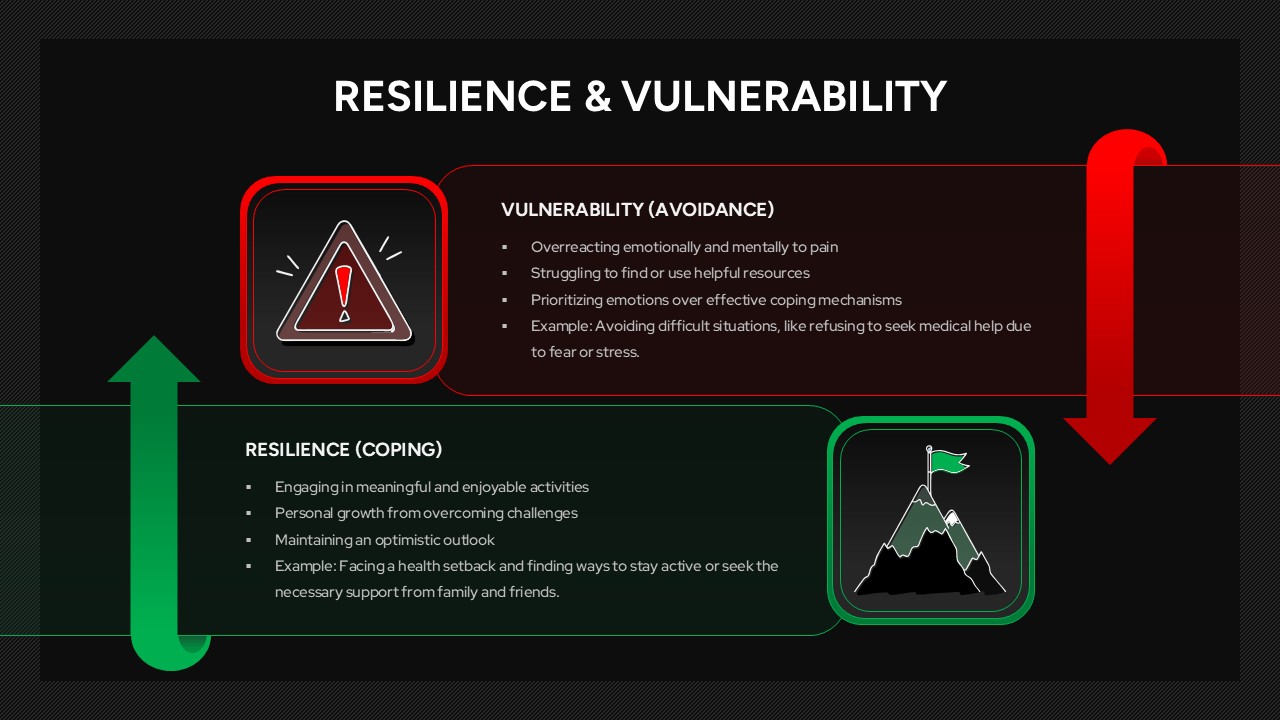
Resilience & Vulnerability Comparison Template for PowerPoint & Google Slides
Comparison
Skills Gap Analysis Comparison Chart Template for PowerPoint & Google Slides
Gap
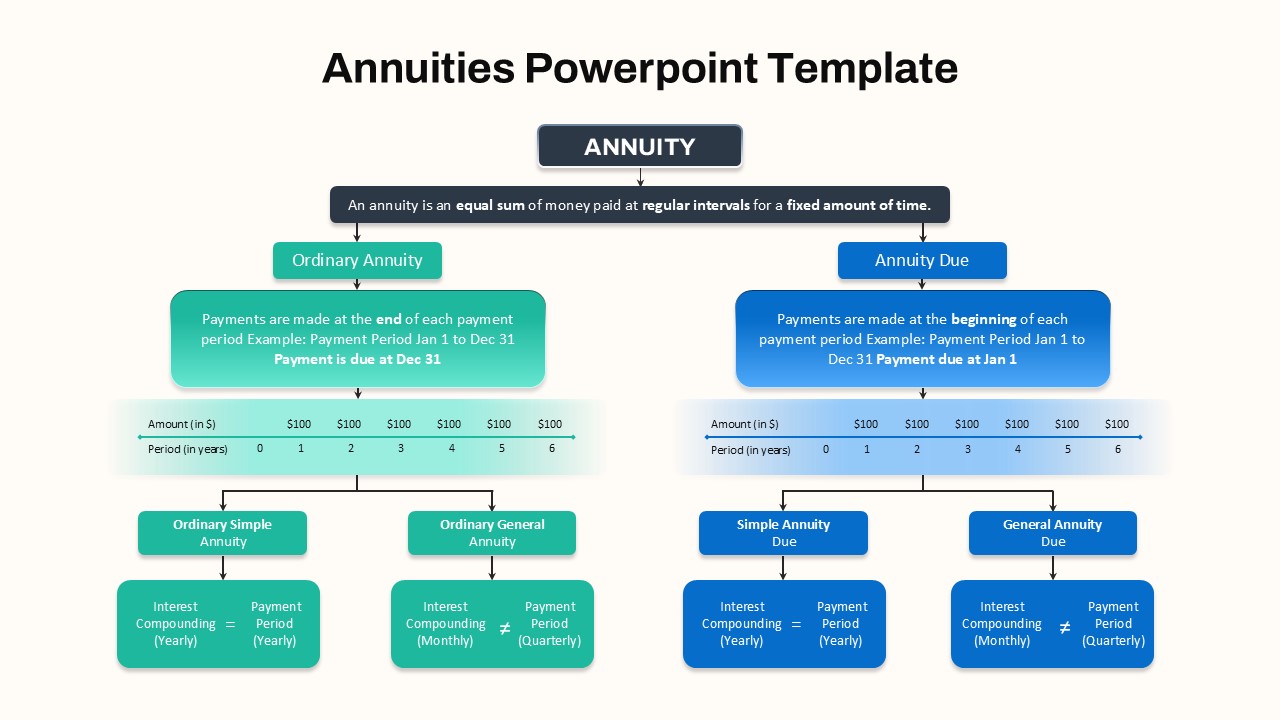
Hierarchical Annuity Comparison Flowchart Template for PowerPoint & Google Slides
Business Report
Feasibility Matrix Comparison Chart Template for PowerPoint & Google Slides
Comparison Chart
Attribution Models Comparison Diagram Template for PowerPoint & Google Slides
Comparison
Funnel and Flywheel Thinking Comparison template for PowerPoint & Google Slides
Infographics
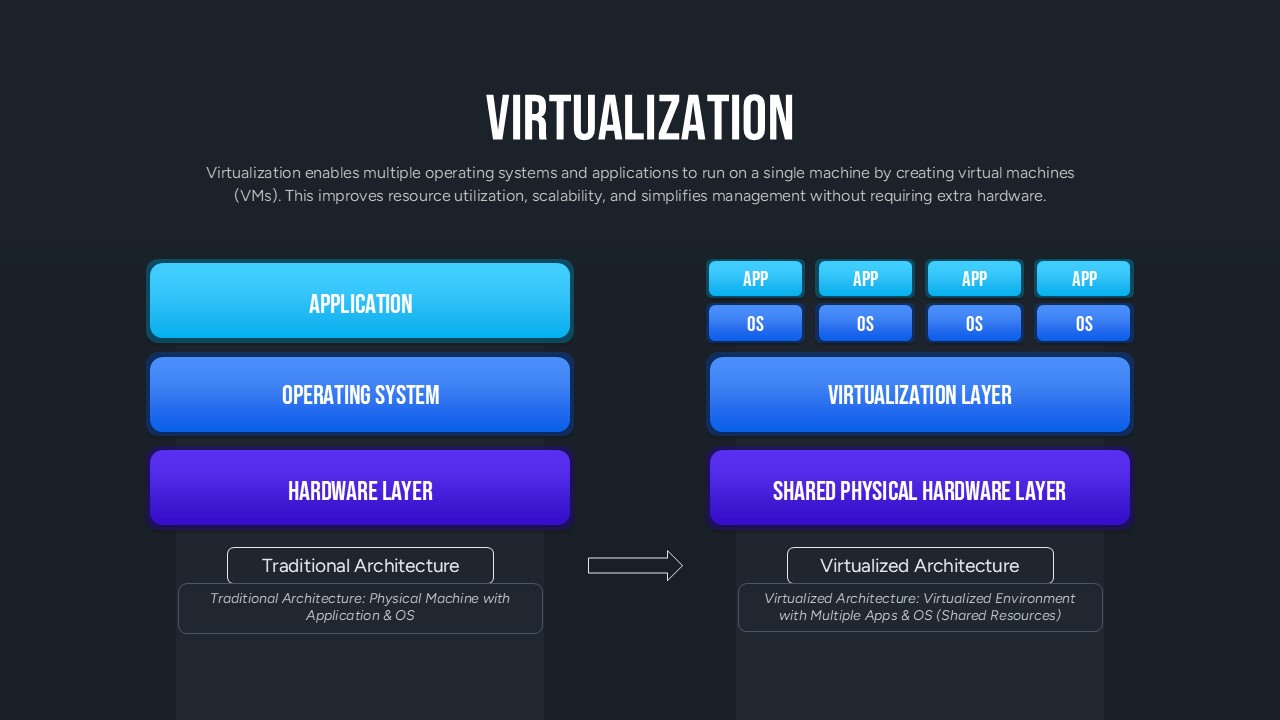
Virtualization Architecture Comparison Template for PowerPoint & Google Slides
Comparison Chart
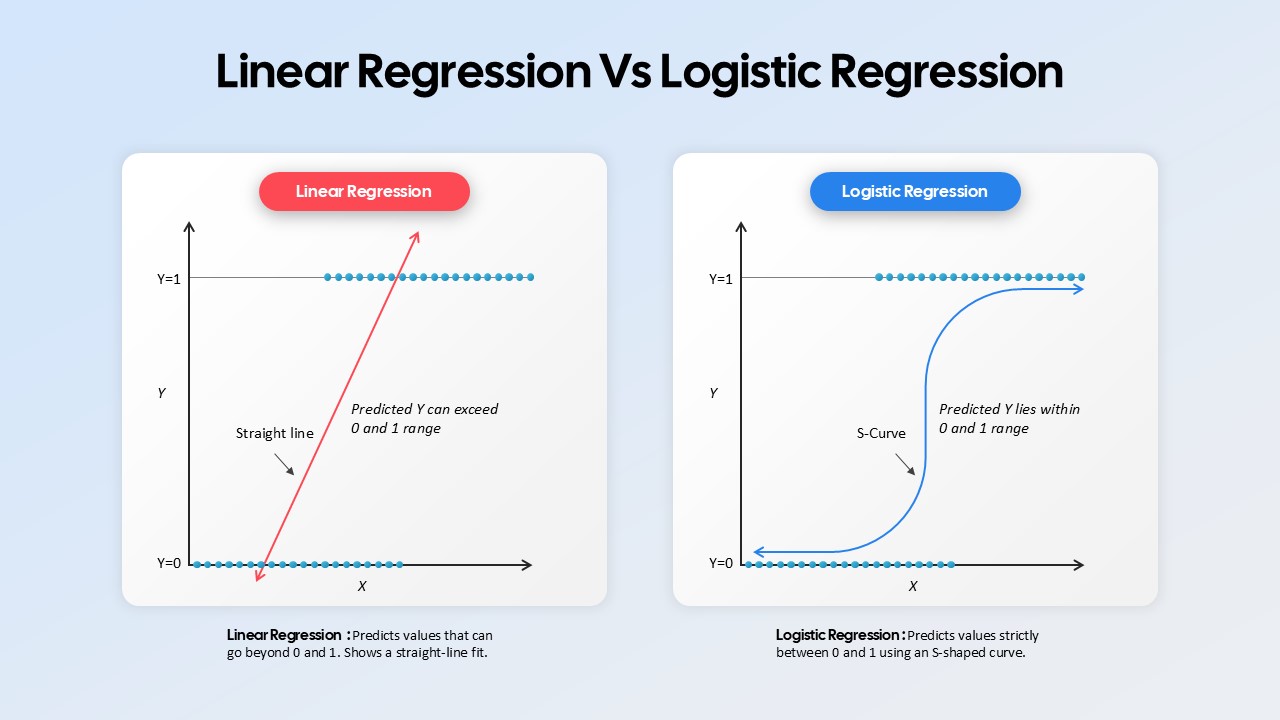
Linear Regression vs Logistic Regression Comparison template for PowerPoint & Google Slides
Comparison
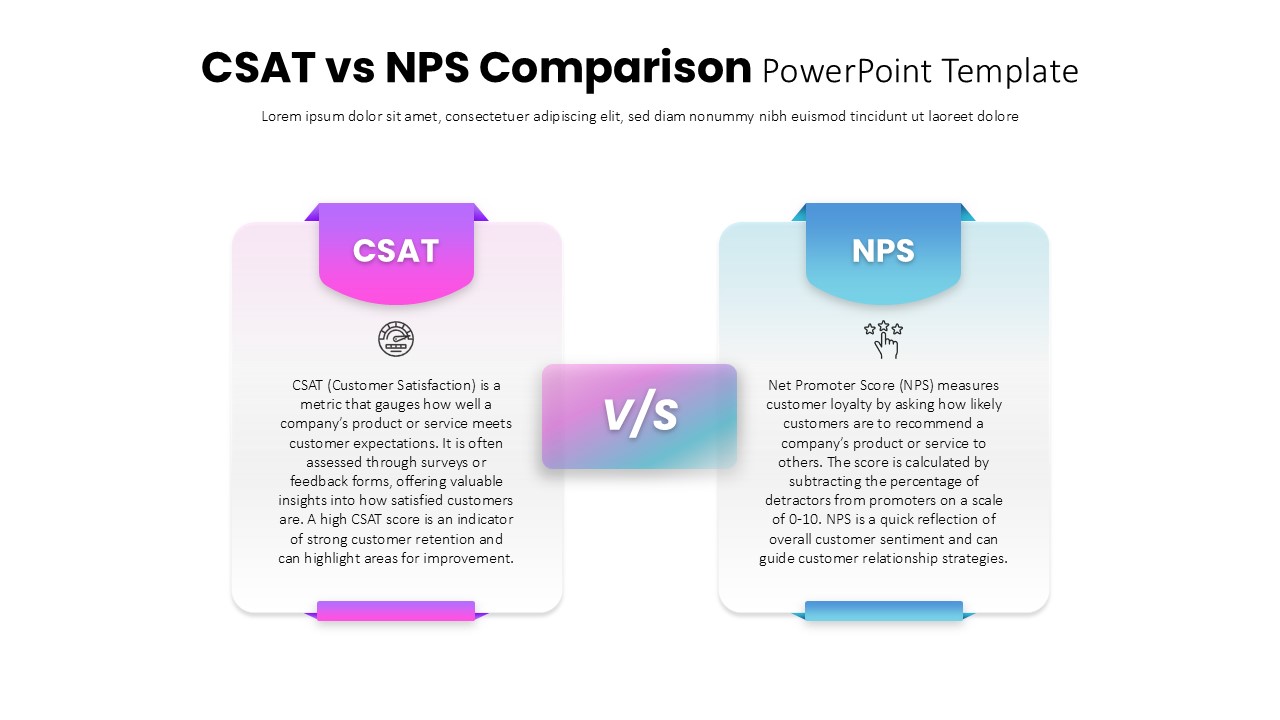
CSAT vs NPS Comparison template for PowerPoint & Google Slides
Business Strategy
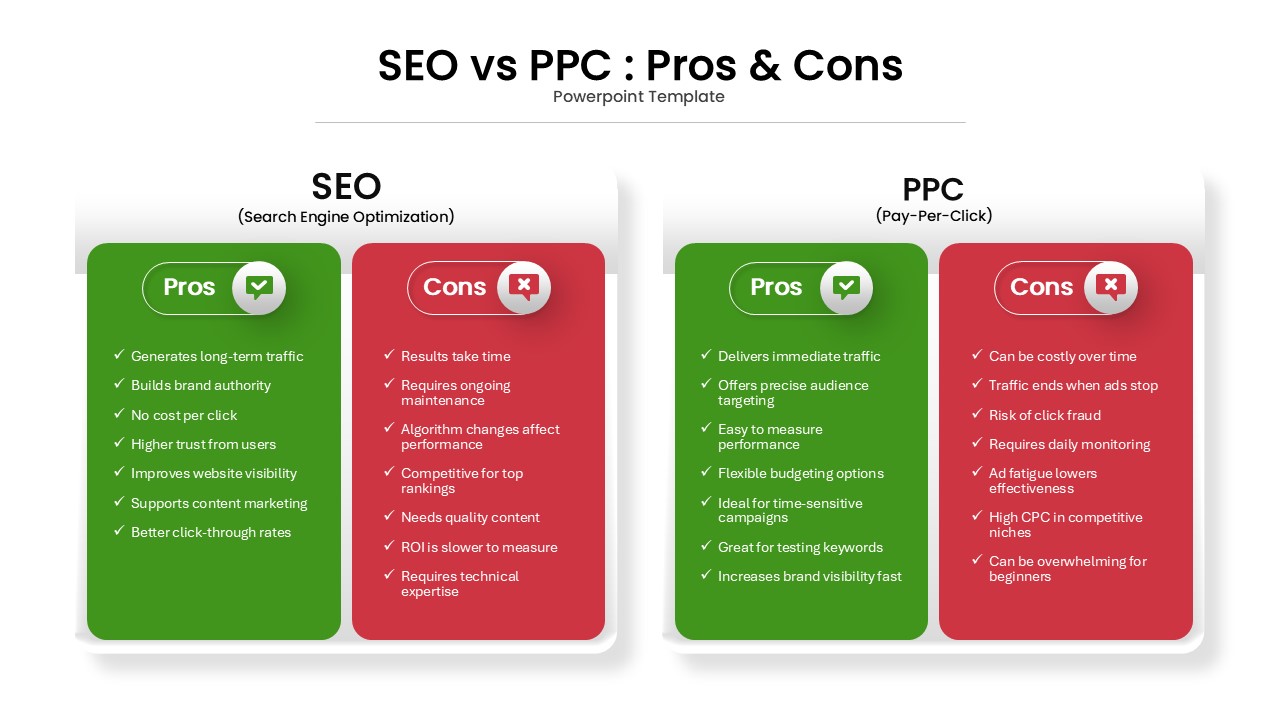
SEO vs PPC: Pros & Cons Comparison Template for PowerPoint & Google Slides
Comparison
Risk vs Reward Comparison Template for PowerPoint & Google Slides
Opportunities Challenges
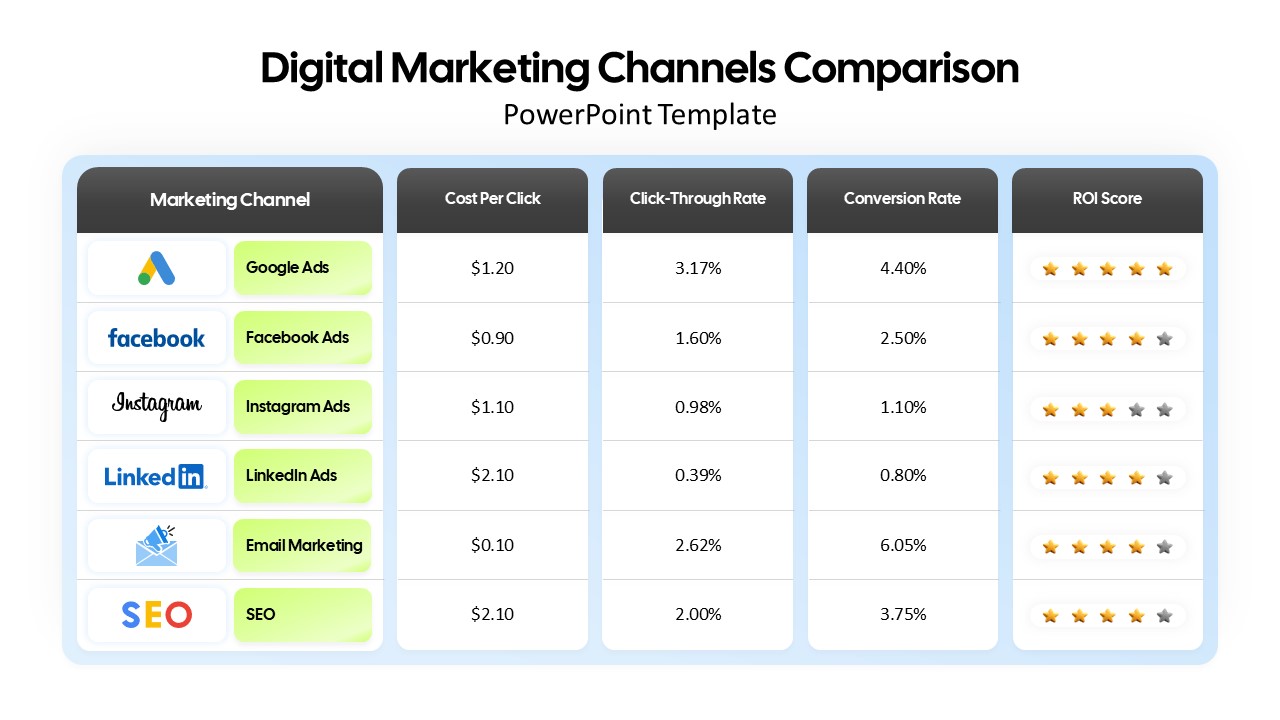
Digital Marketing Channels Comparison template for PowerPoint & Google Slides
Business
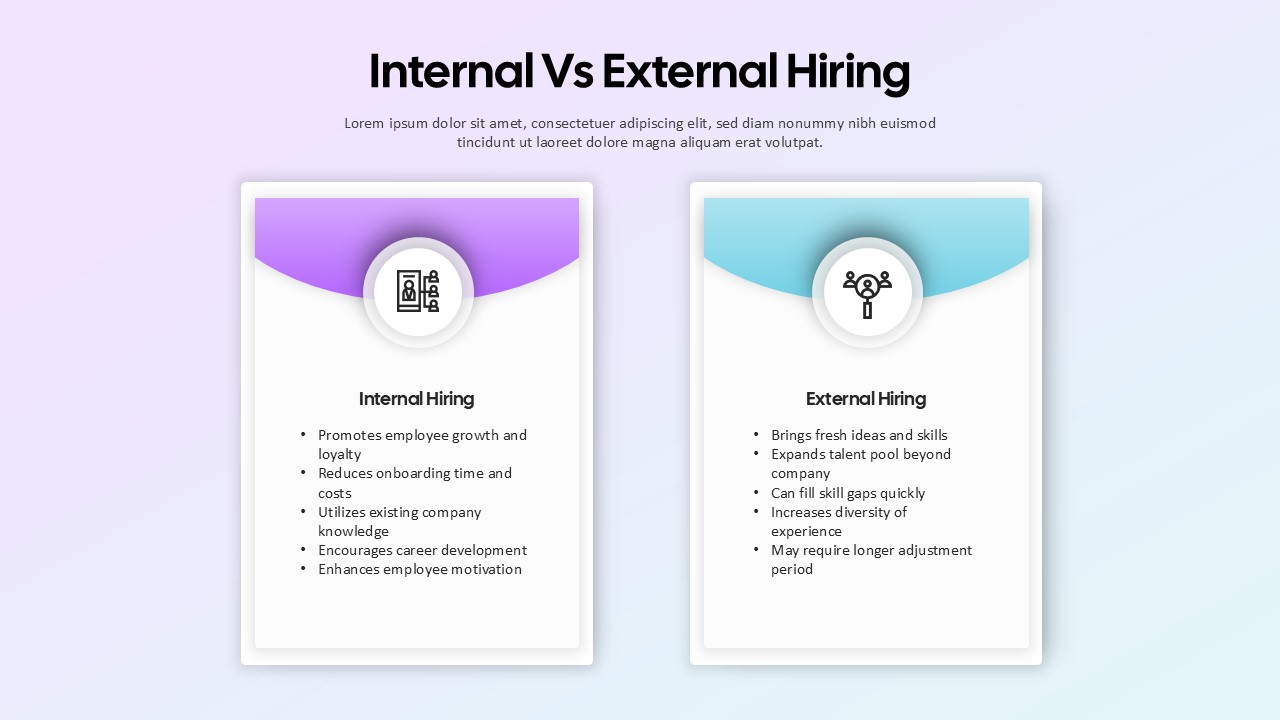
Internal vs External Hiring Comparison Template for PowerPoint & Google Slides
Comparison
Colorful Business Data Comparison Table Template for PowerPoint & Google Slides
Table
Pros and Cons Comparison Table Template for PowerPoint & Google Slides
Comparison Chart
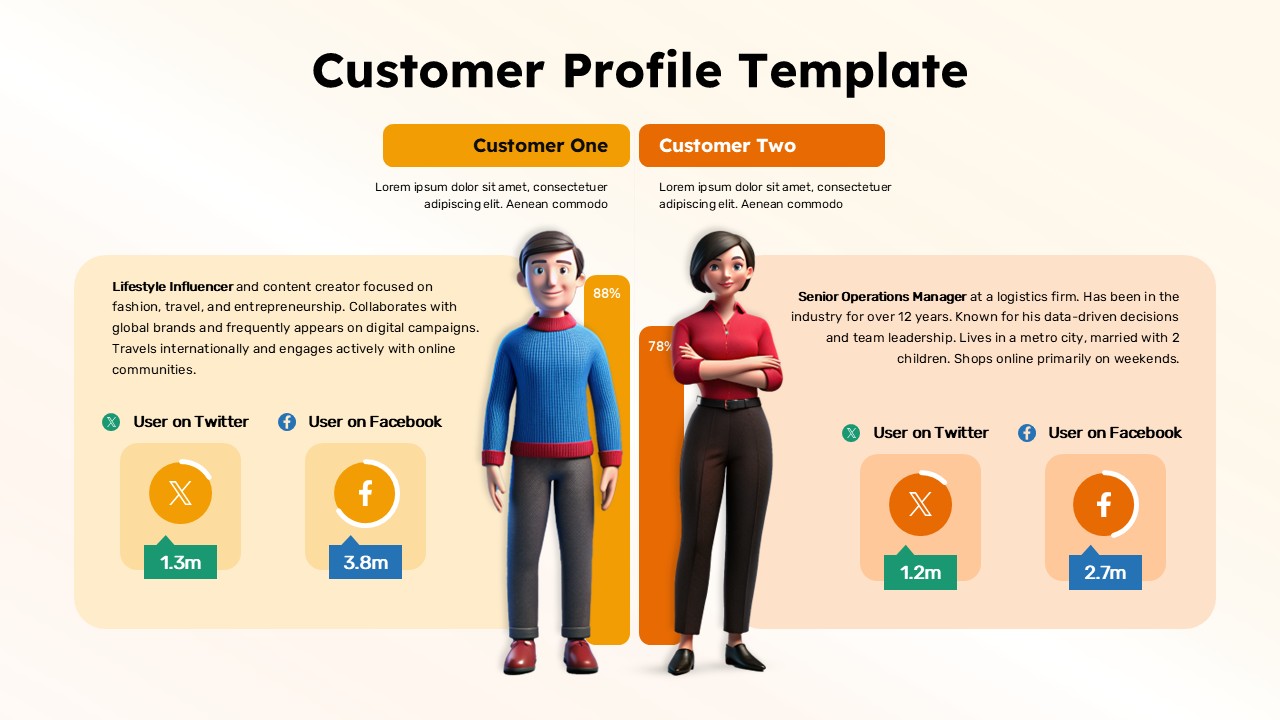
Customer Persona Comparison Profile Template for PowerPoint & Google Slides
Business
Operating Channels Comparison Diagram Template for PowerPoint & Google Slides
Business Models