Purchasing KPI Metrics Dashboard Template for PowerPoint & Google Slides


Description
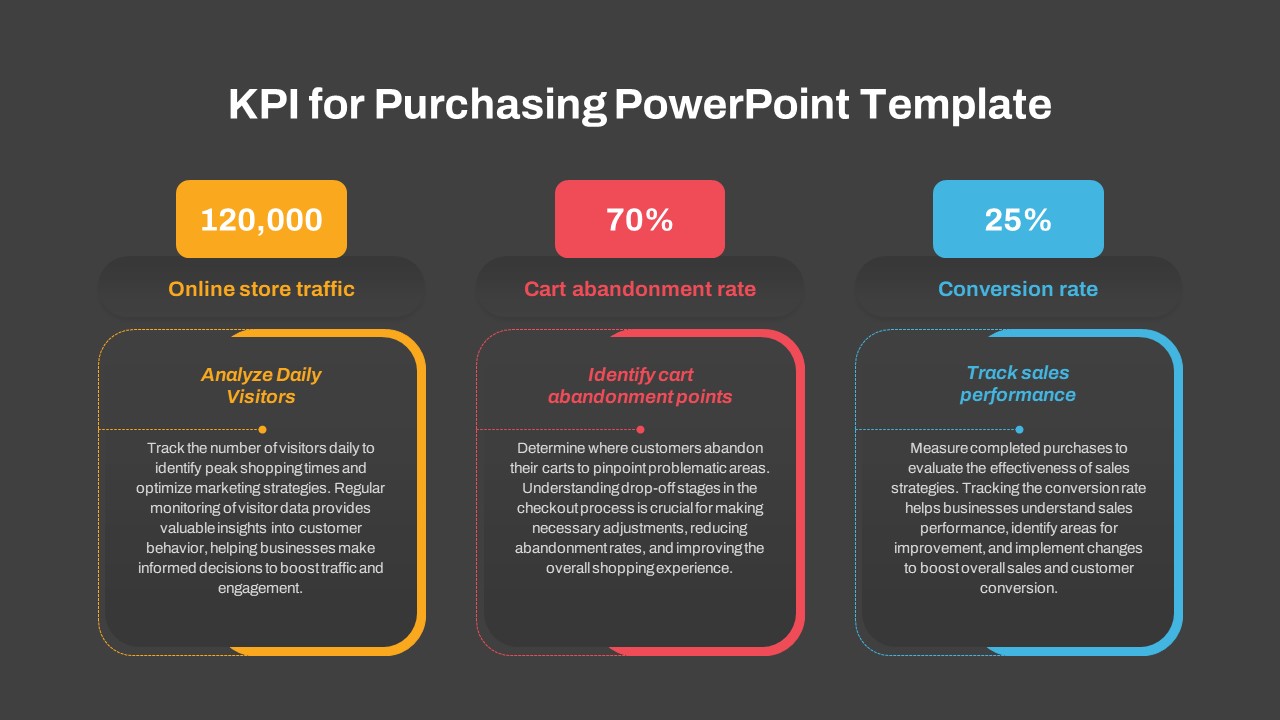
Elevate your procurement and e-commerce reporting with this versatile KPI template slide. Featuring three distinct metric cards, each highlighted by a colored header—orange for online store traffic, red for cart abandonment rate, and blue for conversion rate—this infographic delivers clarity at a glance. Each card includes a bold numeric value in a rounded rectangle, a descriptive label beneath, and a content pane with contrasting dashed and solid borders for emphasis. The clean flat design leverages crisp typography, subtle drop shadows, and intuitive placeholders to ensure seamless editing. Simply replace the sample values, customize labels, and adjust colors to align with brand guidelines.
Crafted for both PowerPoint and Google Slides, this fully editable asset uses vector shapes and master slides to maintain perfect resolution across devices. Typography and layout are preconfigured for readability, yet every element is movable and scalable. Whether you need to highlight daily visitor counts, pinpoint checkout drop-off stages, or track purchase conversions, this slide streamlines your workflow and enhances audience engagement. Use it in executive dashboards, quarterly business reviews, or marketing performance summaries to present complex data in an accessible format.
The balanced three-column layout fosters side-by-side comparisons and supports rapid insights. Reorder cards, duplicate segments, or repurpose the structure for additional KPIs—such as average order value or lifetime customer value—with minimal effort. The modular design also accommodates icon swaps, text edits, and shape resizing in seconds.
Its versatile framework supports not only purchasing analytics but also sales pipelines, finance reports, or operational dashboards across industries. Optimized for collaborative editing, this KPI slide removes formatting headaches and accelerates decision-making, making it an indispensable tool for analysts, managers, and stakeholders.
Who is it for
Business analysts, e-commerce managers, procurement specialists, and digital marketers will find this KPI template essential for tracking performance metrics. CFOs, sales directors, and marketing teams can leverage the clear layout to communicate key indicators during stakeholder updates and strategic planning sessions.
Other Uses
Beyond purchasing analytics, repurpose this slide for sales performance dashboards, finance report overviews, operational metrics tracking, or project status snapshots. Use the modular cards for KPIs like average order value, customer lifetime value, churn rate, or inventory turnover in quarterly reviews and board presentations.
Login to download this file

Item ID
SB04354
Related Templates

DevOps KPI Dashboard Performance Metrics Template for PowerPoint & Google Slides
Software Development
Procurement KPI Dashboard & Metrics Template for PowerPoint & Google Slides
Business Report
Asia Map with KPI Metrics and Legend Template for PowerPoint & Google Slides
World Maps
Circular Image Gallery & KPI Metrics Template for PowerPoint & Google Slides
Pie/Donut
Project Status Dashboard with Metrics Template for PowerPoint & Google Slides
Project Status
Mastodon Metrics Infographic Dashboard Template for PowerPoint & Google Slides
Business Report
Employee Performance Metrics Dashboard Template for PowerPoint & Google Slides
Employee Performance
Free KPI Dashboard PowerPoint Template for PowerPoint & Google Slides
Charts
Free

Efficiency KPI Dashboard Metaphor Template for PowerPoint & Google Slides
Infographics
Sales Growth Dashboard: KPI Gauge & Line Template for PowerPoint & Google Slides
Revenue
Performance KPI Dashboard Slide Template for PowerPoint & Google Slides
Business Report
KPI Dashboard template for PowerPoint & Google Slides
Business Report
KPI Dashboard Overview template for PowerPoint & Google Slides
Finance
KPI Dashboard Data Visualization Template for PowerPoint & Google Slides
Bar/Column
KPI Dashboard Data Overview Slide Template for PowerPoint & Google Slides
Bar/Column
Customer Satisfaction KPI Dashboard Template for PowerPoint & Google Slides
Customer Experience
Michigan County Map with KPI Dashboard Template for PowerPoint & Google Slides
World Maps
4DX Scoreboard KPI Gauge Dashboard Template for PowerPoint & Google Slides
Business Strategy
Patient-Satisfaction KPI Dashboard for PowerPoint & Google Slides
Business
iPad App Mockup with Progress Metrics Template for PowerPoint & Google Slides
Bar/Column
Bubble Head Metrics Infographic Template for PowerPoint & Google Slides
Circular
Circle Segment Sales Metrics Infographic Template for PowerPoint & Google Slides
Circular
Social Media Metrics template for PowerPoint & Google Slides
Comparison Chart
Mobile Usage Metrics template for PowerPoint & Google Slides
Comparison Chart

Scale Metaphor Metrics Comparison Template for PowerPoint & Google Slides
Charts
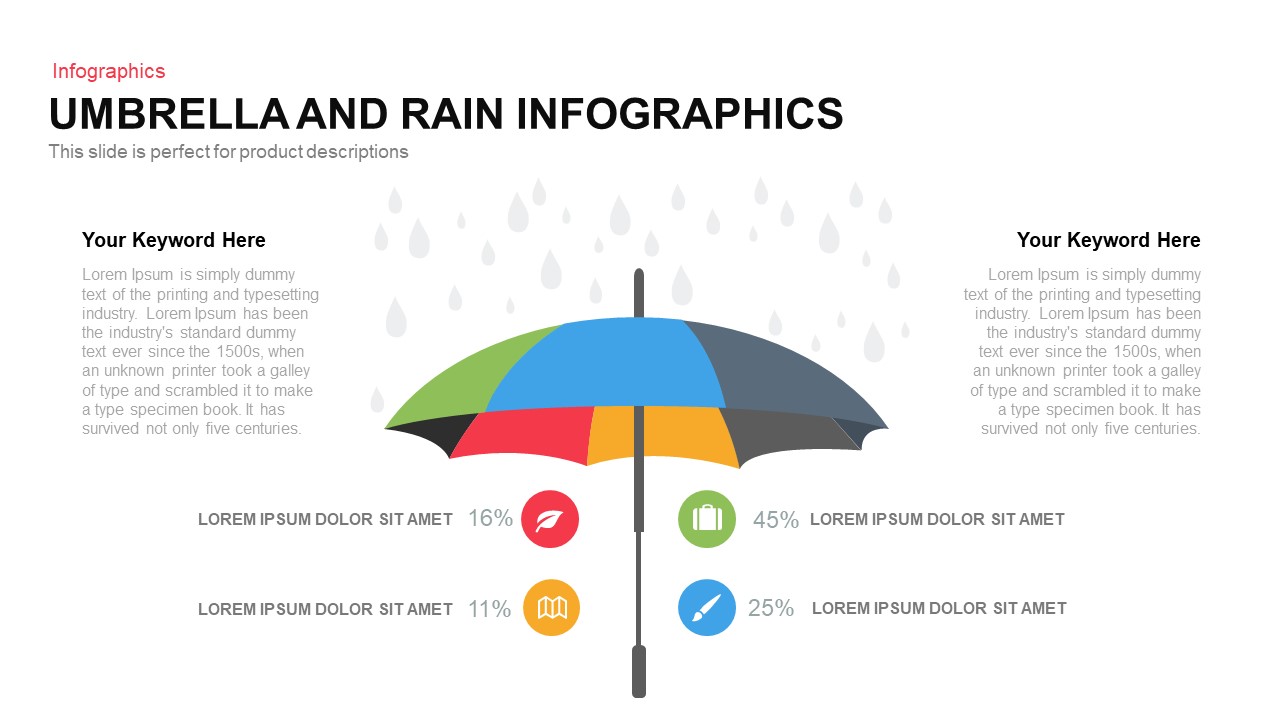
Umbrella and Rain Infographic Metrics Template for PowerPoint & Google Slides
Comparison
Comprehensive Recruitment Metrics Report Template for PowerPoint & Google Slides
Recruitment
Colorful Block Infographic Metrics Slide Template for PowerPoint & Google Slides
Infographics
Benchmarking Metrics Comparison Slide Template for PowerPoint & Google Slides
Pie/Donut
Statistics & Global Metrics Infographic Template for PowerPoint & Google Slides
Bar/Column
Agriculture Infographics Slide with Progress Rings & Metrics Template for PowerPoint & Google Slides
Pie/Donut
Annual Recurring Revenue Metrics Template for PowerPoint & Google Slides
Bar/Column
Social Media Analysis Metrics Slide Deck Template for PowerPoint & Google Slides
Digital Marketing
LinkedIn Metrics Infographic Slide Template for PowerPoint & Google Slides
Digital Marketing
Facebook Social Metrics Infographic Template for PowerPoint & Google Slides
Graphics
Instagram Infographic Metrics Slide Template for PowerPoint & Google Slides
Marketing
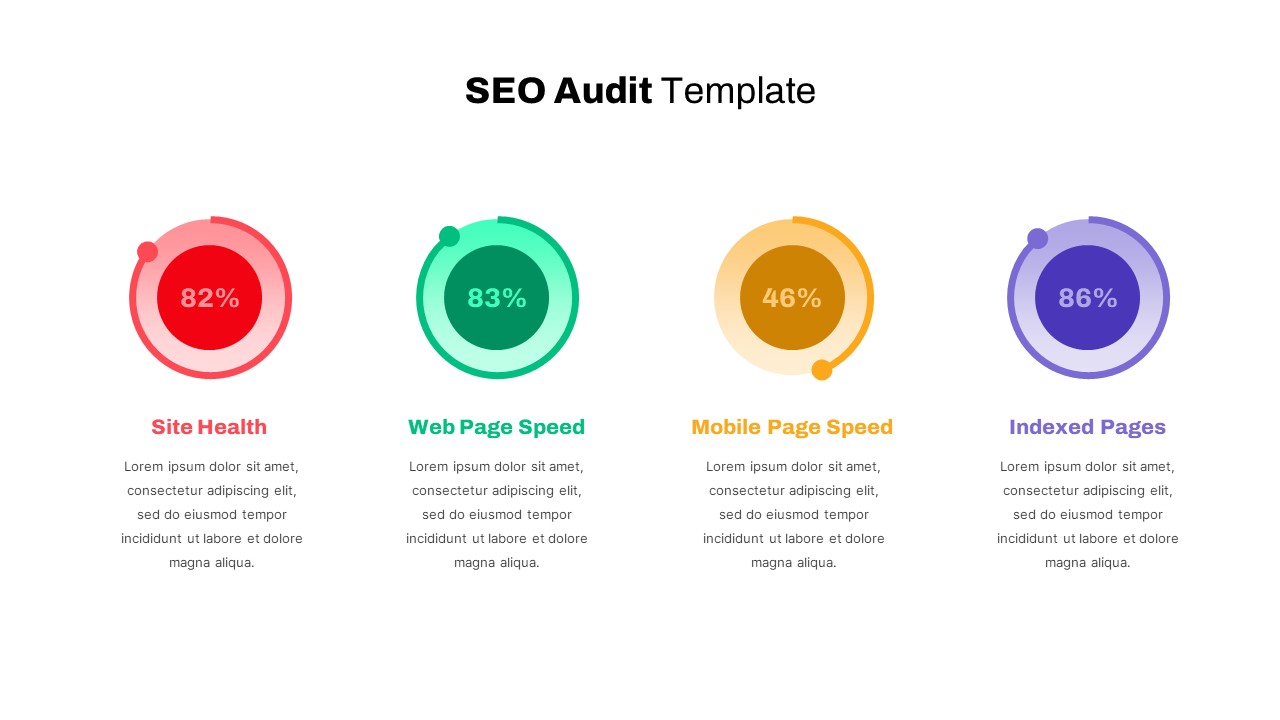
Detailed SEO Audit Metrics Overview Template for PowerPoint & Google Slides
Circular
Free Editable U.S. Map with Regional Metrics Template for PowerPoint & Google Slides
World Maps
Free
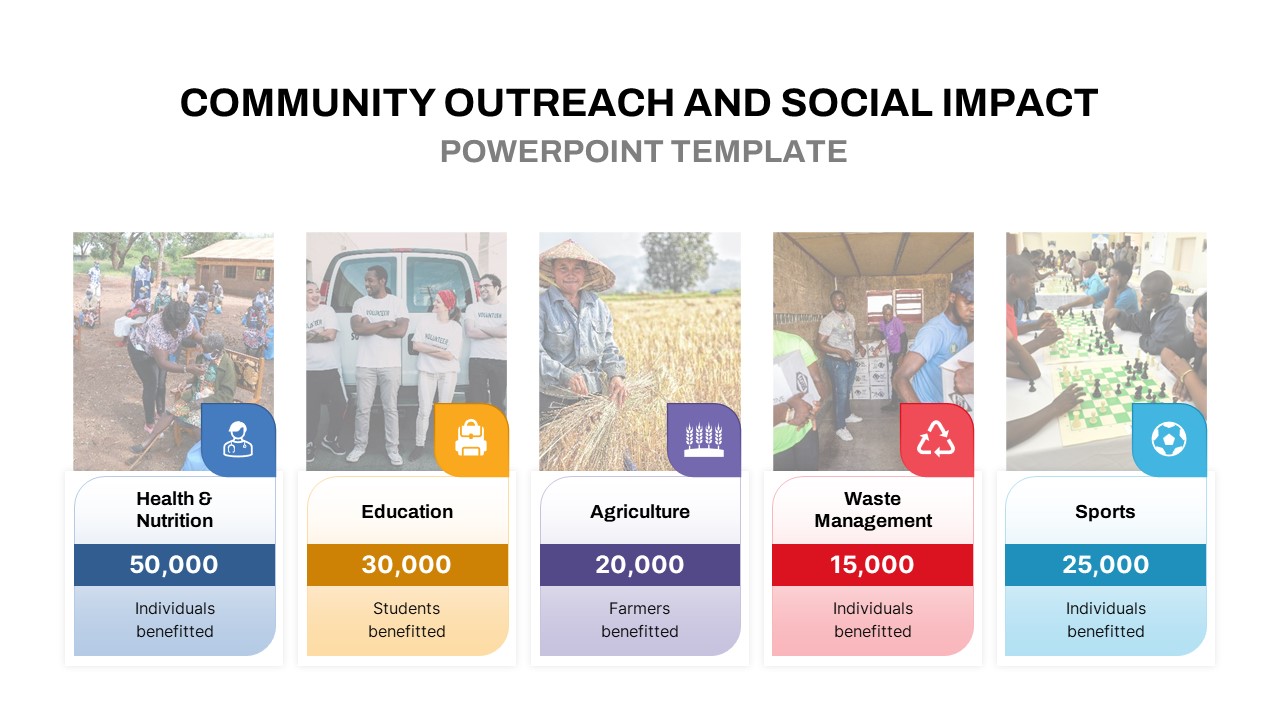
Community Outreach Impact Metrics Template for PowerPoint & Google Slides
Accomplishment
Financial Snapshot & Metrics Overview Template for PowerPoint & Google Slides
Finance
Market Validation Metrics Overview Template for PowerPoint & Google Slides
Business
Pirate Metrics AARRR Funnel Framework Template for PowerPoint & Google Slides
Funnel
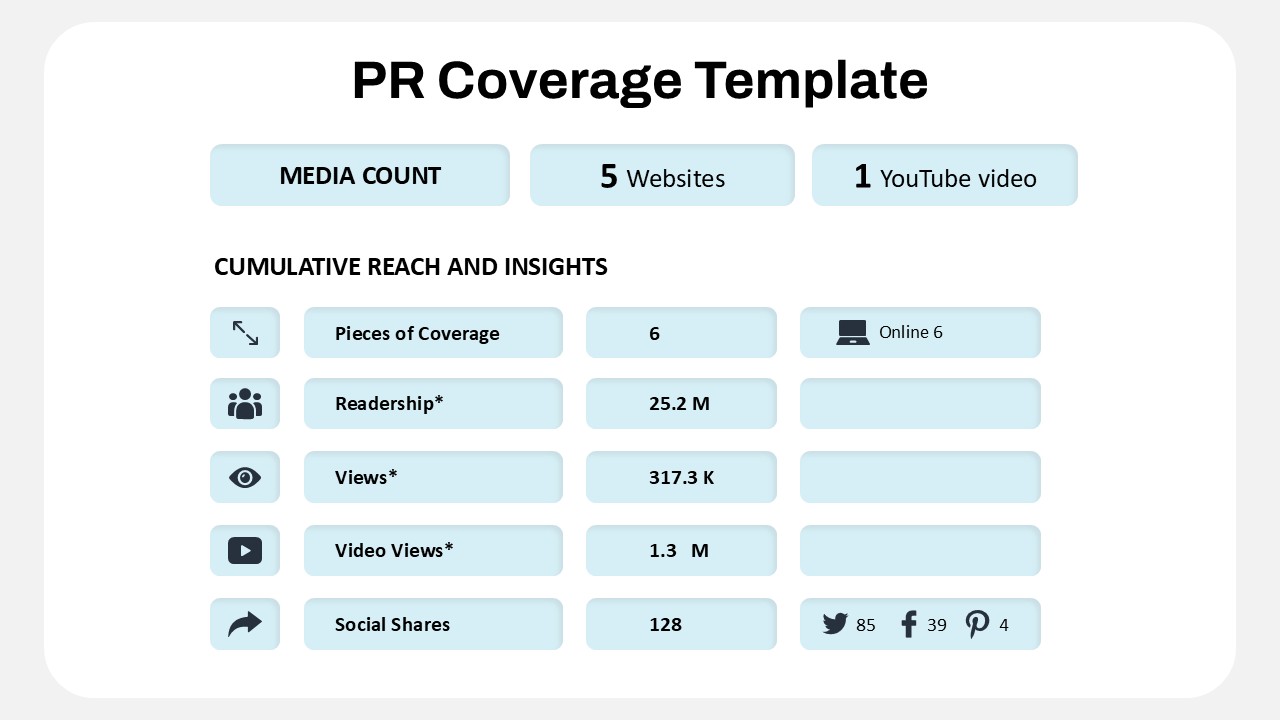
Public Relations Coverage Metrics Template for PowerPoint & Google Slides
Business Report
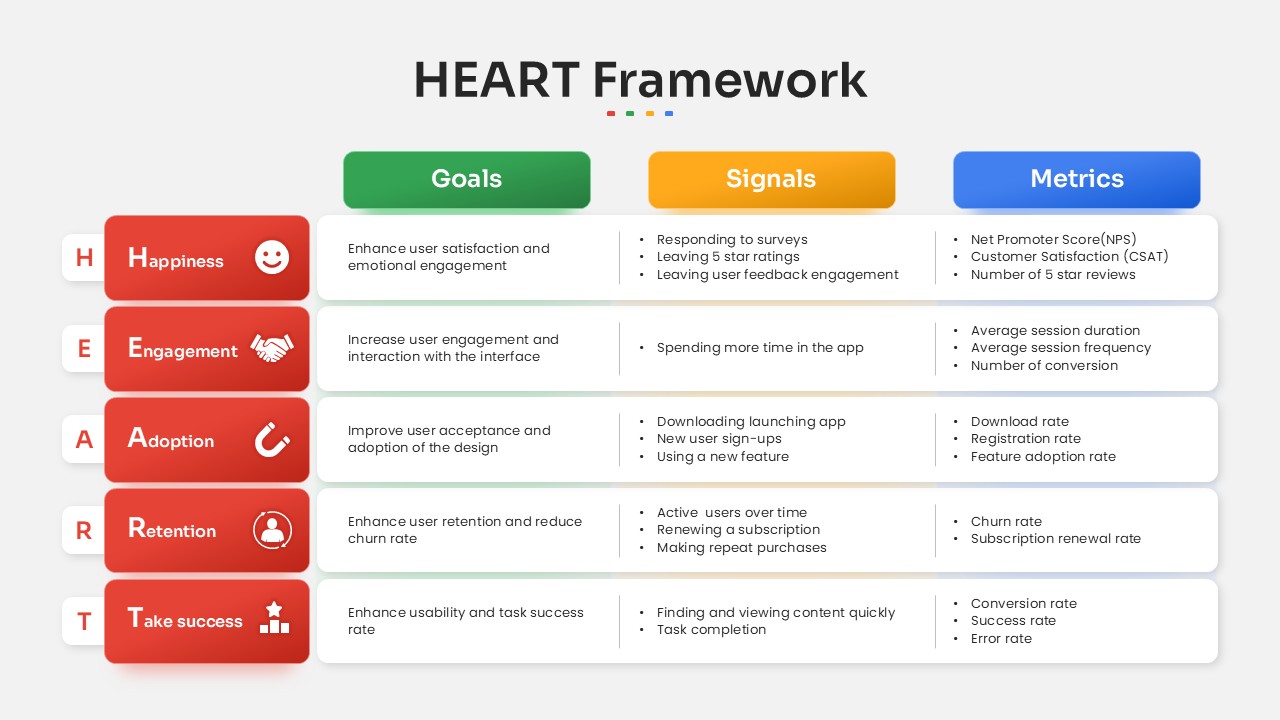
HEART Framework Goals, Signals & Metrics Template for PowerPoint & Google Slides
Process

Application Revenue Line Chart KPI Template for PowerPoint & Google Slides
Revenue
Professional Team Collage & KPI Slide Template for PowerPoint & Google Slides
Business
Statistics Infographic & KPI Bar Chart Template for PowerPoint & Google Slides
Bar/Column
Monthly Recurring Revenue KPI Bar Chart Template for PowerPoint & Google Slides
Bar/Column
Free Balanced Scorecard Quadrant KPI Layout Template for PowerPoint & Google Slides
Employee Performance
Free
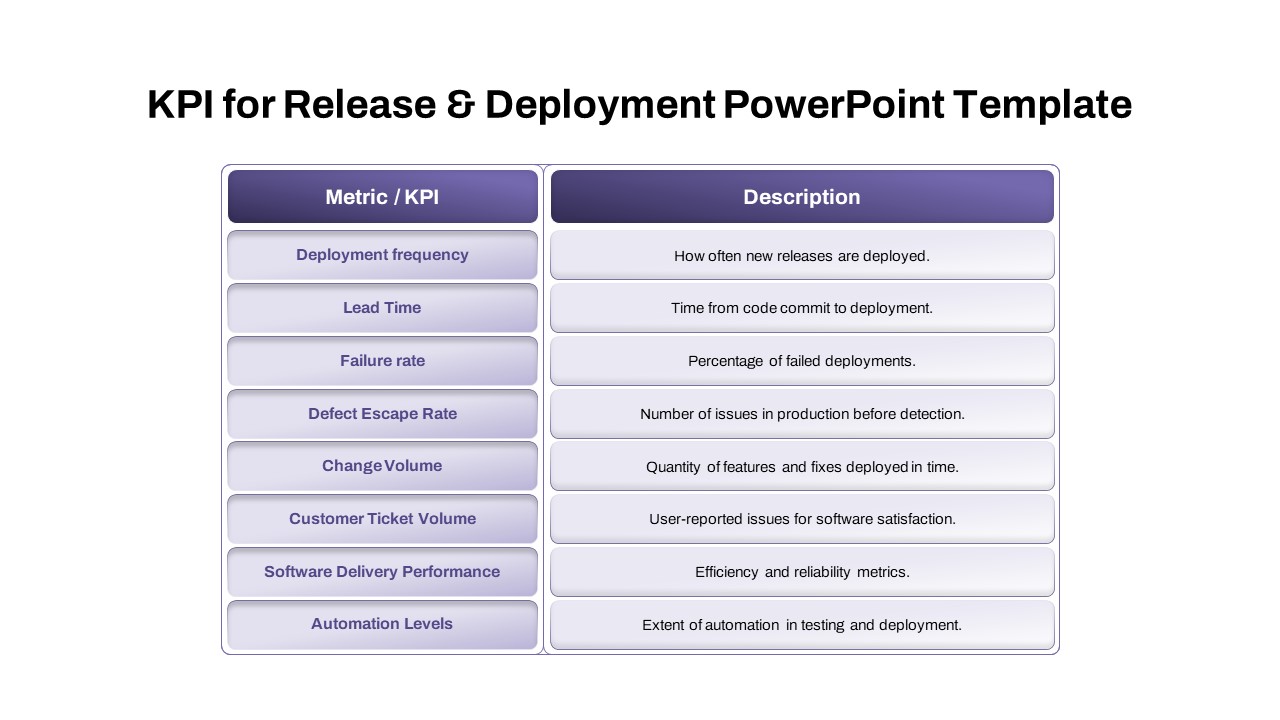
Comprehensive Release & Deployment KPI Template for PowerPoint & Google Slides
Software Development
Three Segment Donut Chart KPI Infographic Template for PowerPoint & Google Slides
Pie/Donut
Year in Review KPI Highlights Slide for PowerPoint & Google Slides
Business Report
E-commerce Analytics Dashboard Template for PowerPoint & Google Slides
Bar/Column

Dynamic Data Dashboard Infographic Template for PowerPoint & Google Slides
Bar/Column
Product Usage Analytics Dashboard Chart Template for PowerPoint & Google Slides
Bar/Column
Business Dashboard Analytics & KPIs Template for PowerPoint & Google Slides
Bar/Column
Professional Team Efficiency Dashboard Template for PowerPoint & Google Slides
Business Report
Project Management Dashboard Template for PowerPoint & Google Slides
Project
Immigration Data Dashboard Template for PowerPoint & Google Slides
Bar/Column
Social Media Performance Dashboard Template for PowerPoint & Google Slides
Bar/Column
Bull and Bear Stock Market Dashboard Template for PowerPoint & Google Slides
Infographics
Professional Nurse Infographic Dashboard Template for PowerPoint & Google Slides
Nursing
Interactive Benchmarking Gauge Dashboard Template for PowerPoint & Google Slides
Pie/Donut
Colorful Project Status Dashboard Template for PowerPoint & Google Slides
Project Status
Weekly Update Schedule Dashboard Template for PowerPoint & Google Slides
Agenda
Project Status Dashboard Template for PowerPoint & Google Slides
Project Status
Weekly Status Report Dashboard Template for PowerPoint & Google Slides
HR
Free Metro UI Dashboard Infographic Template for PowerPoint & Google Slides
Business Report
Free
Website Performance Monitoring Dashboard Template for PowerPoint & Google Slides
Business Report
One Pager Annual Report Dashboard Template for PowerPoint & Google Slides
Business Report
Soccer Match Stats Dashboard Slide Template for PowerPoint & Google Slides
Graphics
Employee Satisfaction Survey Dashboard Template for PowerPoint & Google Slides
Employee Performance
Weekly Project Status Dashboard Template for PowerPoint & Google Slides
Project Status
Freight Logistics Dashboard Infographic Template for PowerPoint & Google Slides
Comparison Chart
Free Quarterly Business Review Dashboard Template for PowerPoint & Google Slides
Business
Free
Cost Cutting Savings Dashboard Template for PowerPoint & Google Slides
Pie/Donut
Macroeconomic Indicators Dashboard Template for PowerPoint & Google Slides
PEST
Free Monthly Report PowerPoint Template for PowerPoint & Google Slides
Business Report
Free
Quarterly Financial Summary Dashboard Template for PowerPoint & Google Slides
Business Report
Banking Financial Overview Dashboard Template for PowerPoint & Google Slides
Finance
Quarterly Business Review Dashboard Template for PowerPoint & Google Slides
Pitch Deck
Monthly Business Review Dashboard Deck Template for PowerPoint & Google Slides
Business Report
Project Progress Dashboard Pie Charts Template for PowerPoint & Google Slides
Project
Monthly Sales Performance Dashboard Template for PowerPoint & Google Slides
Charts
HR Report Dashboard Template for PowerPoint & Google Slides
Employee Performance
Budget Forecast Dashboard & Donut Charts Template for PowerPoint & Google Slides
Pie/Donut
Risk Level Gauge Comparison Dashboard Template for PowerPoint & Google Slides
Comparison
Digital Marketing KPIs Dashboard Dark Template for PowerPoint & Google Slides
Business Report
Turnover Analysis Dashboard Template for PowerPoint & Google Slides
Employee Performance
Project Tracking Dashboard Table Template for PowerPoint & Google Slides
Project Status
Action Items Management Dashboard Table Template for PowerPoint & Google Slides
Project Status
Electronic Health Records Dashboard template for PowerPoint & Google Slides
Health
Project Status Update Dashboard Table Template for PowerPoint & Google Slides
Project Status
Cohort Analysis Retention Dashboard Template for PowerPoint & Google Slides
Comparison Chart
Project Status Dashboard Template for PowerPoint & Google Slides
Project Status
Project Status Template Dashboard with Gauge for PowerPoint & Google Slides
Project Status
Task Completion Rate Dashboard Template for PowerPoint & Google Slides
Business
End of Year Review Dashboard Template for PowerPoint & Google Slides
Business Report
Construction Project Dashboard Template for PowerPoint & Google Slides
Project

Employee Headcount Dashboard Report Template for PowerPoint & Google Slides
Employee Performance