Product Adoption Curve Template for PowerPoint & Google Slides


Description
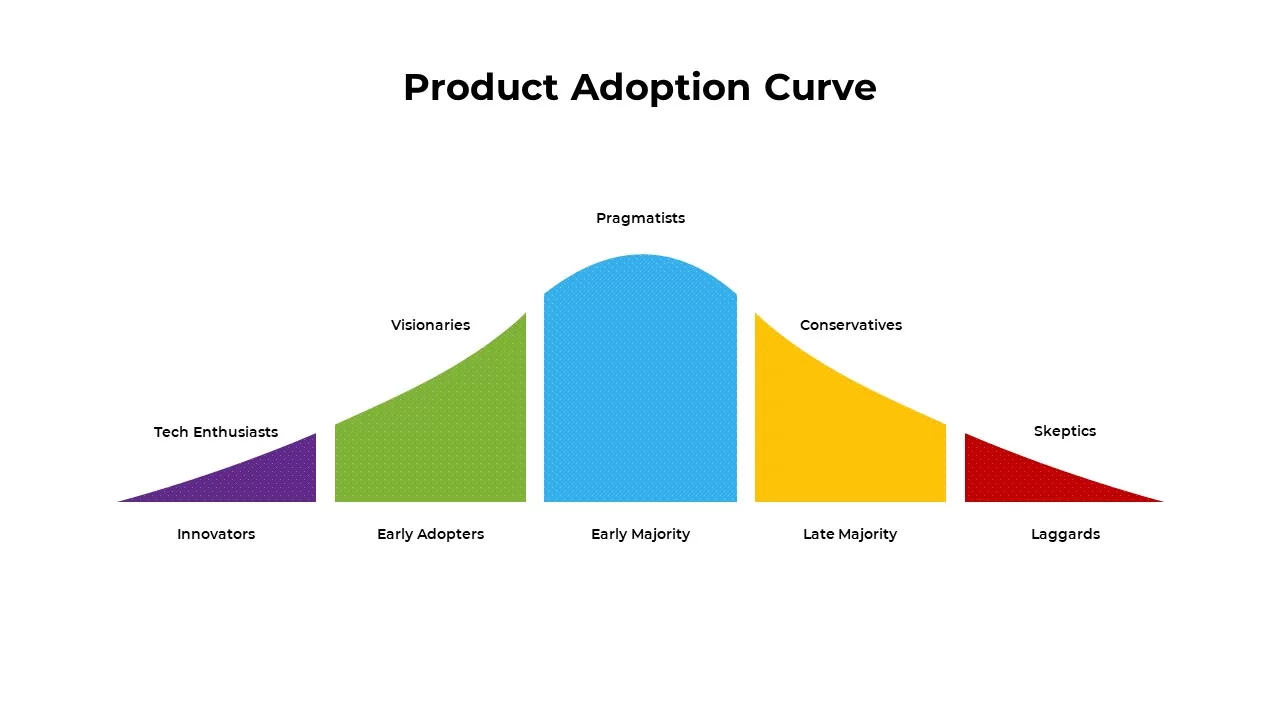
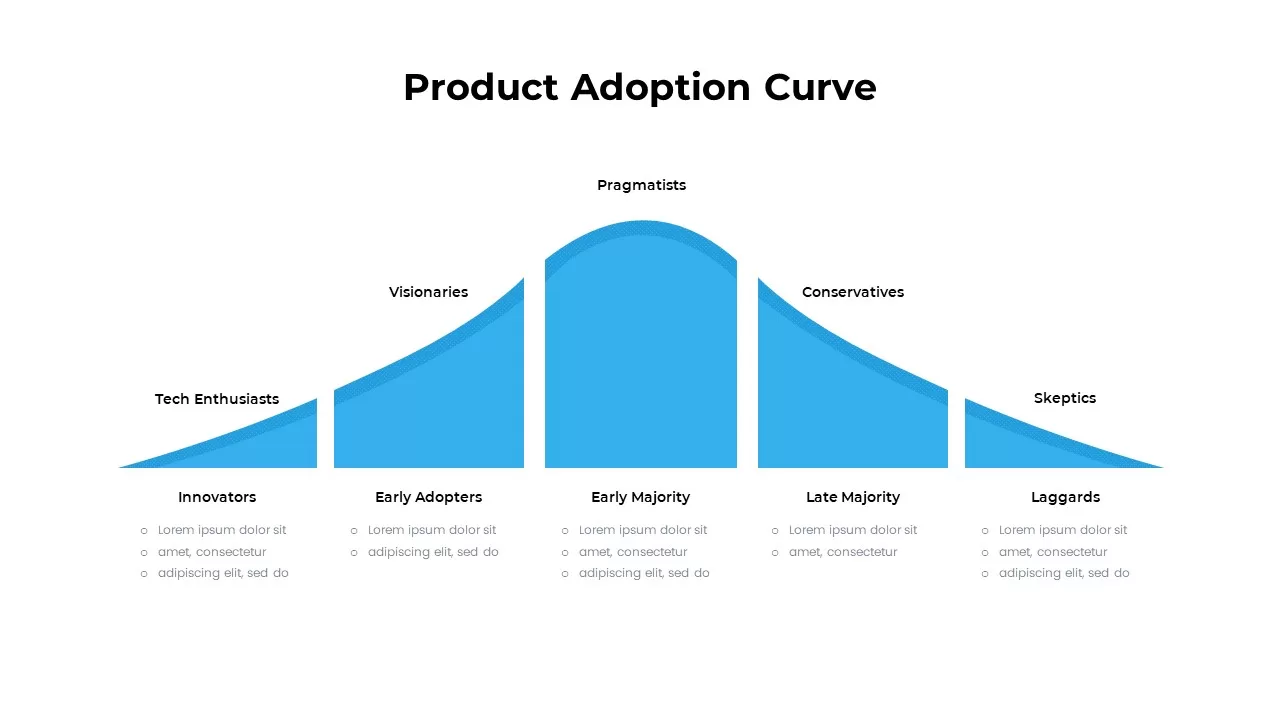
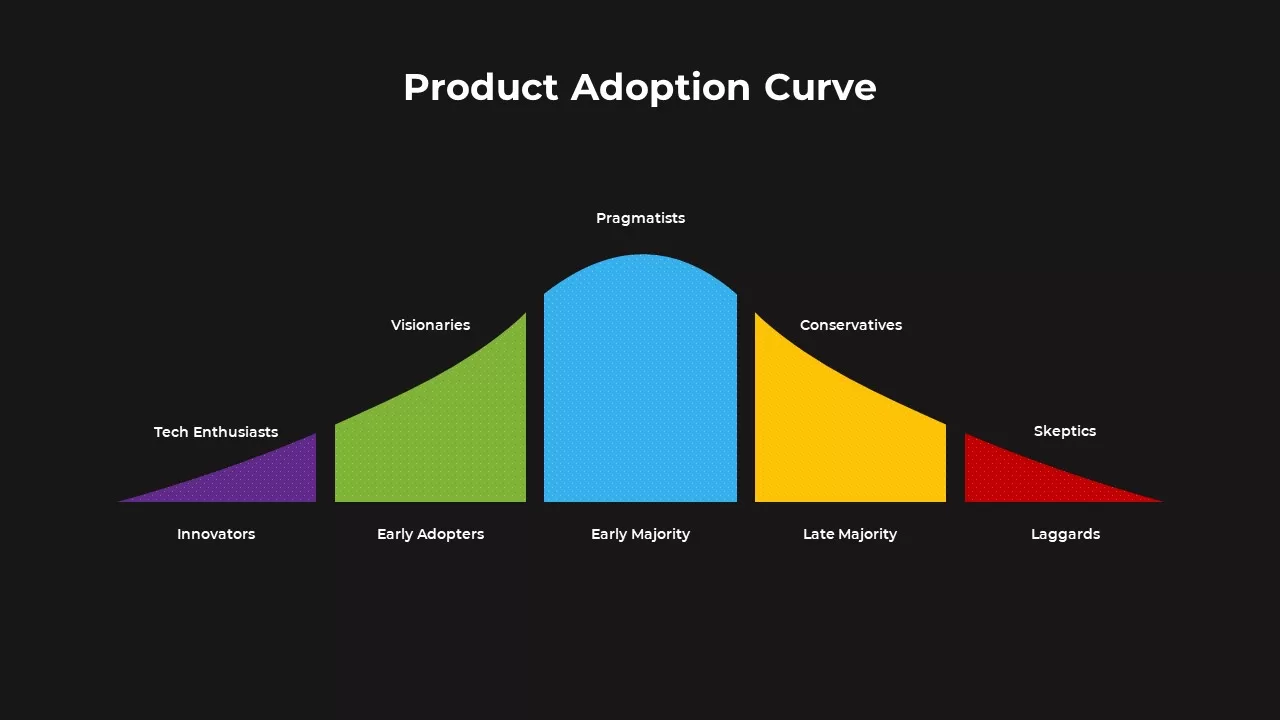
This Product Adoption Curve infographic template is designed to help illustrate the process through which new products or innovations are adopted by different segments of the market. The curve features five key categories: Innovators, Early Adopters, Early Majority, Late Majority, and Laggards. This model is essential for understanding customer behavior and strategically planning product launches or marketing campaigns.
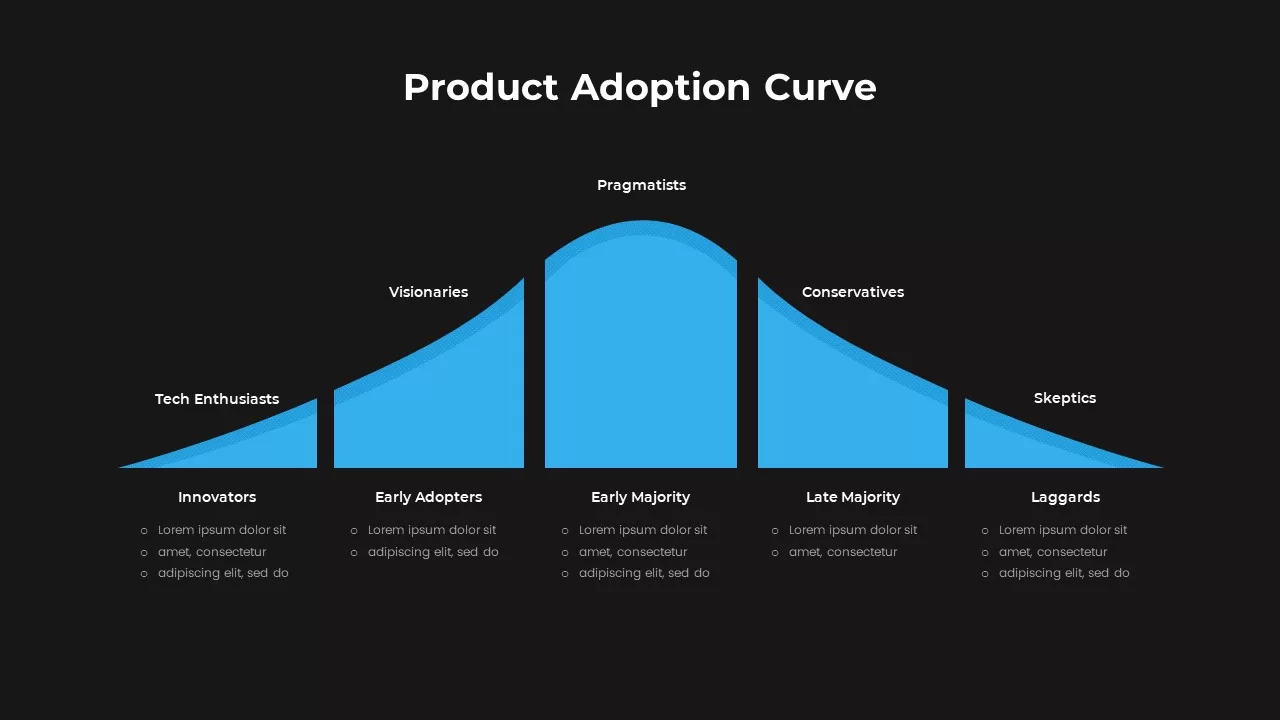
The template uses vibrant colors to distinguish each group in the adoption cycle, from the purple Innovators to the red Laggards. Each slide offers flexibility in presenting the adoption stages, with some featuring the full product adoption curve and others breaking down each stage with specific descriptions or bullet points. These infographics are ideal for business presentations, product strategy meetings, or educational content on market dynamics and consumer behavior.
Customizable to suit various industries, this template helps you explain how a product moves from niche adoption to mass acceptance, making it perfect for marketing teams, project managers, product designers, and educators.
Who is it for
This template is perfect for marketers, business owners, project managers, and educators who want to present the stages of product adoption clearly and effectively. It is especially beneficial for teams working on product development, strategic planning, or market research who need to communicate how products are introduced and accepted by various market segments.
Other Uses
Beyond traditional product adoption analysis, this template can also be used for understanding customer journey mapping, marketing funnel strategies, or any situation where understanding adoption cycles, trends, or behavior is critical. It’s adaptable for product roadmaps, technology adoption, and innovation presentations.
Login to download this file

Item ID
SB02317
Related Templates

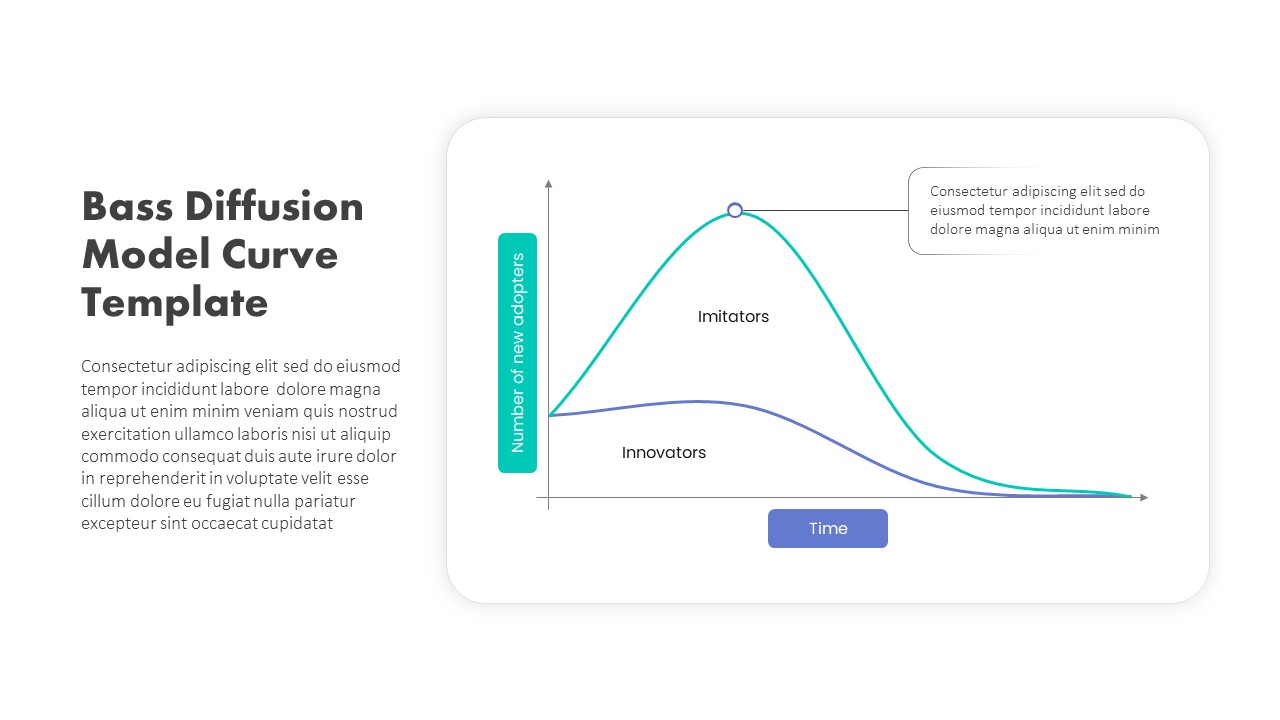
Bass Diffusion Model Curve for Adoption Template for PowerPoint & Google Slides
Comparison Chart
Gartner Hype Cycle Adoption Curve Diagram Template for PowerPoint & Google Slides
Infographics
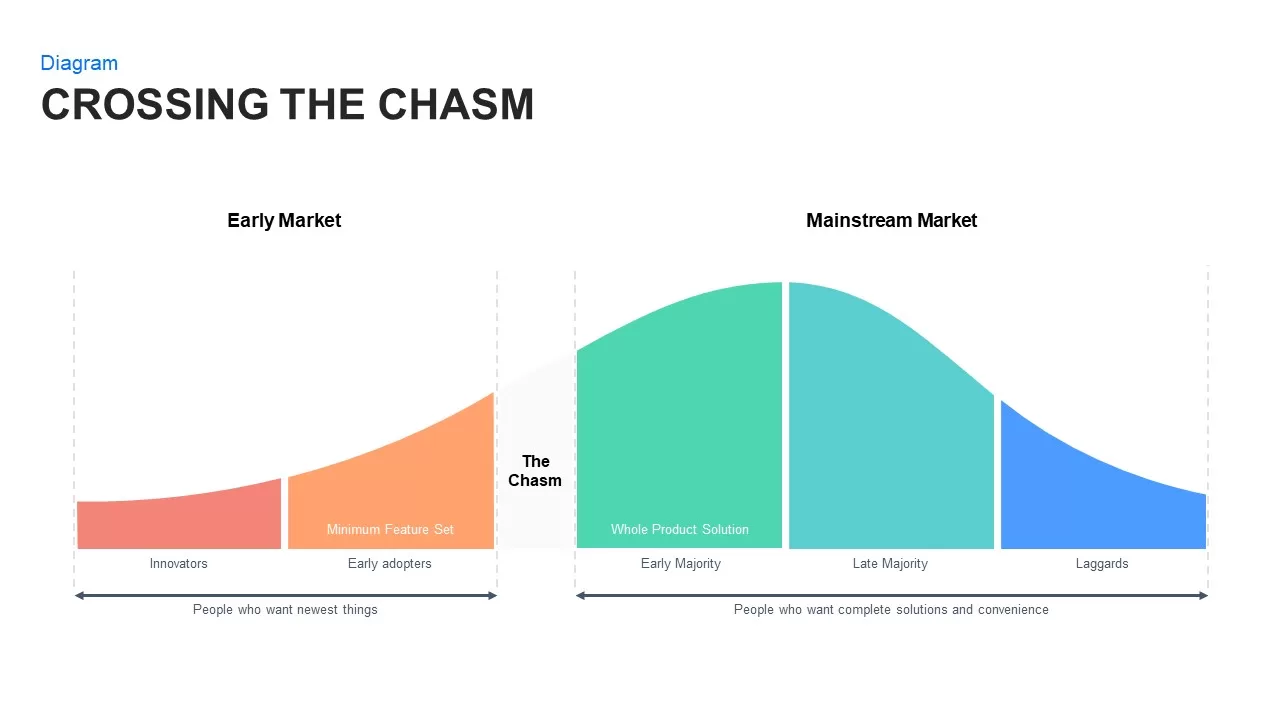
Crossing the Chasm: Technology Adoption Lifecycle template for PowerPoint & Google Slides
Business Strategy
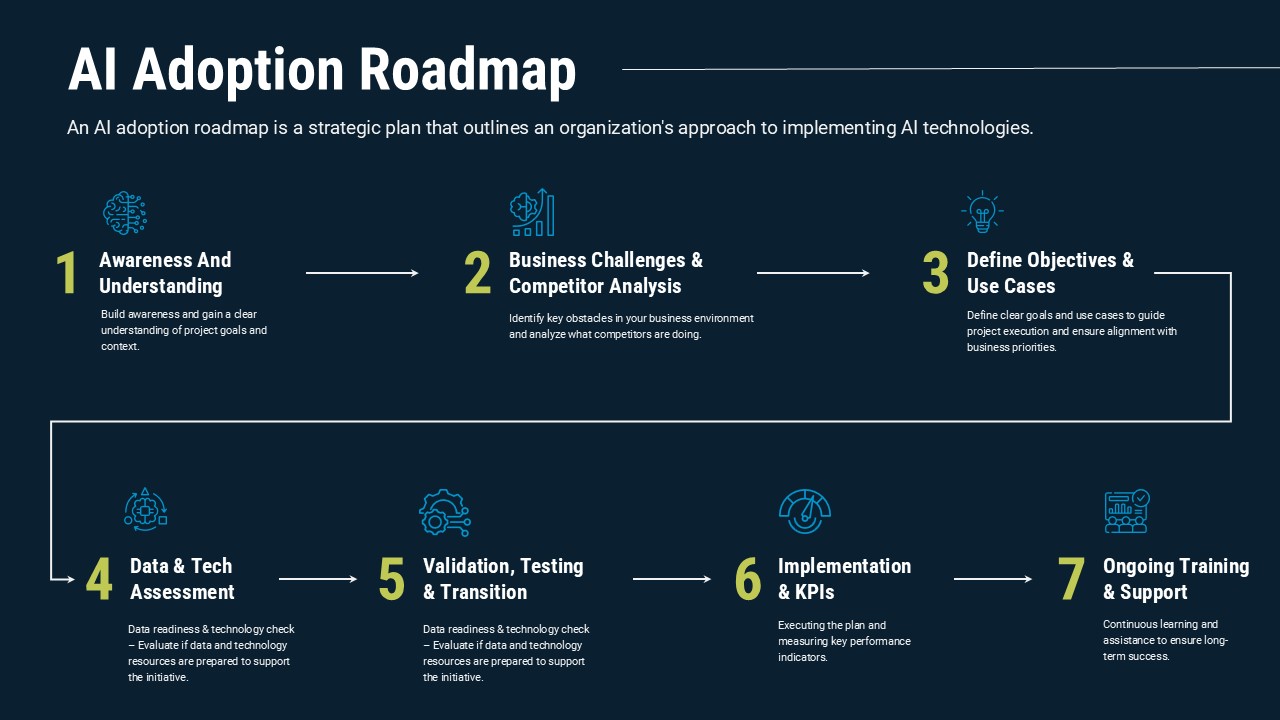
AI Adoption Roadmap template for PowerPoint & Google Slides
Technology
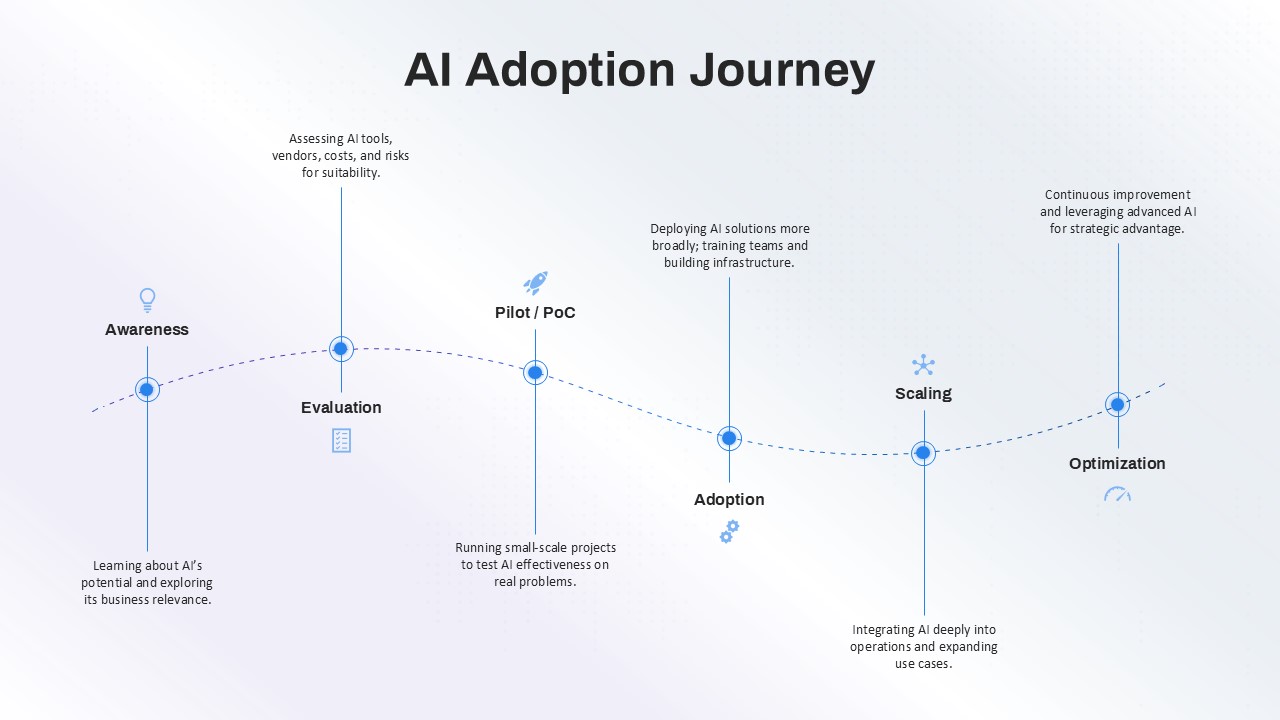
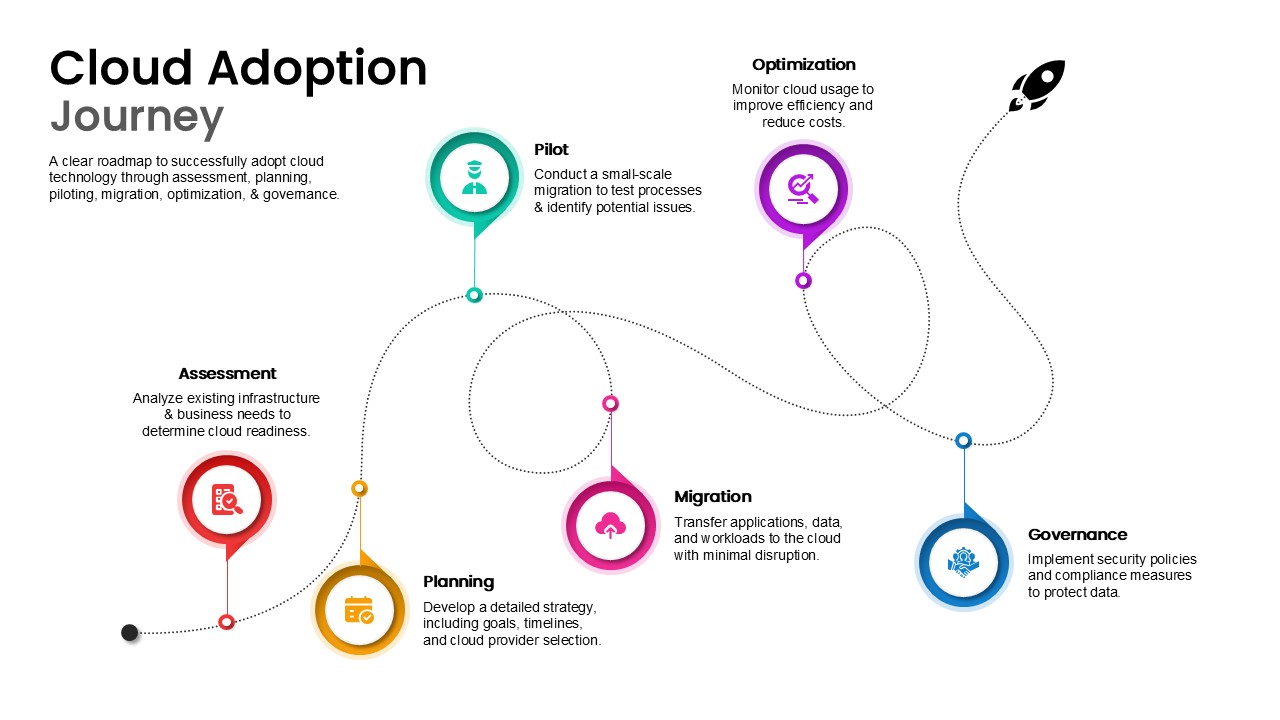
AI Adoption Journey template for PowerPoint & Google Slides
AI
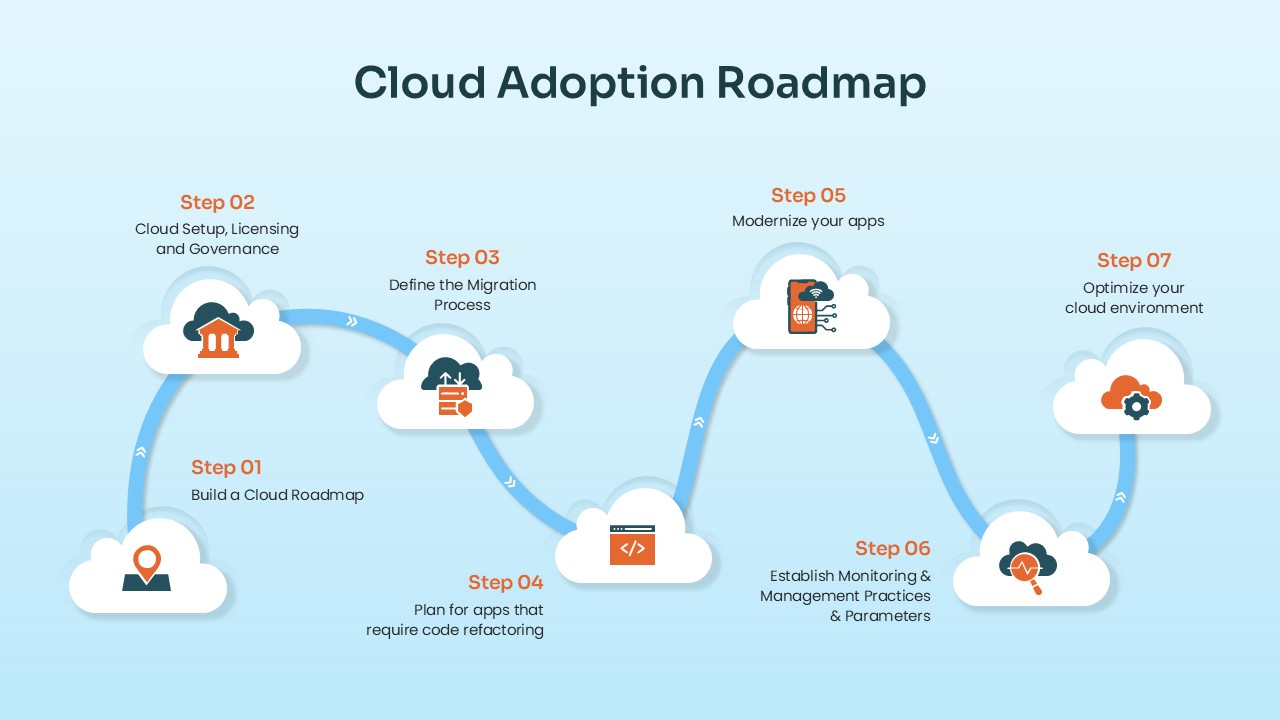
Cloud Adoption Roadmap Steps template for PowerPoint & Google Slides
Cloud Computing
Cloud Adoption Journey Roadmap Template for PowerPoint & Google Slides
Cloud Computing
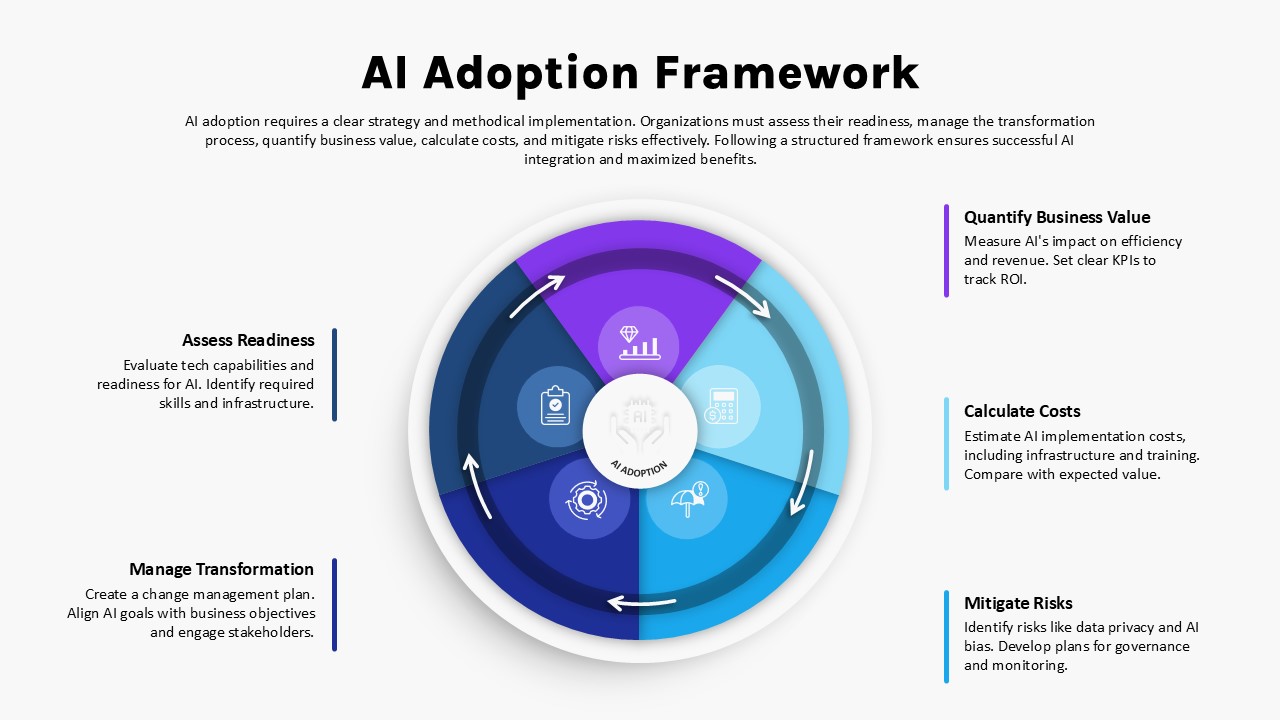
AI Adoption Framework Circular Diagram Template for PowerPoint & Google Slides
AI
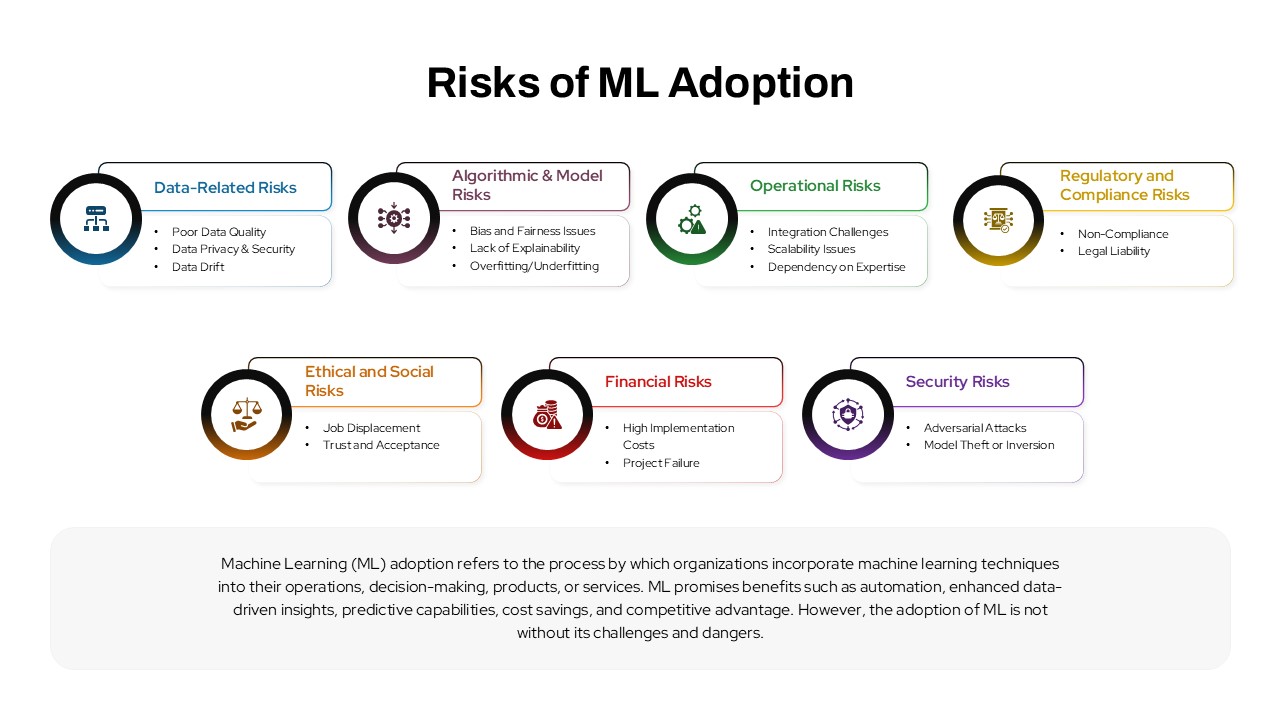
Risks of ML Adoption template for PowerPoint & Google Slides
Information Technology
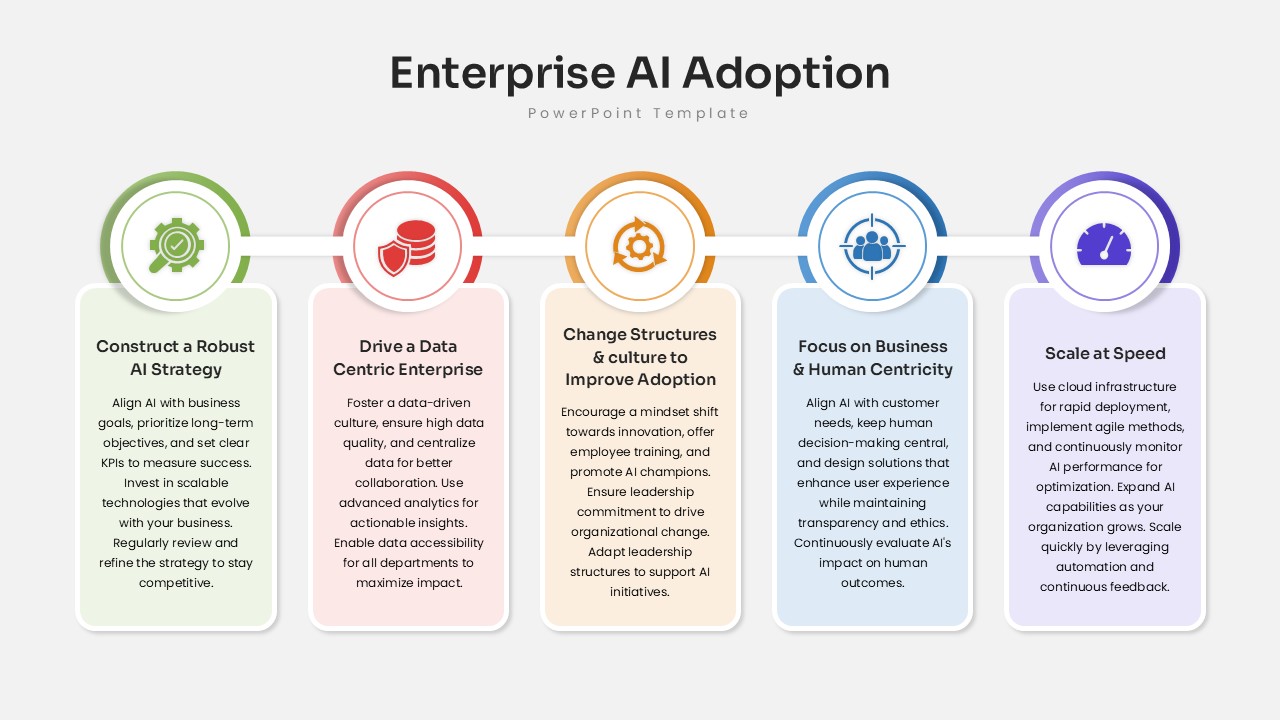
Enterprise AI Adoption Framework Template for PowerPoint & Google Slides
AI
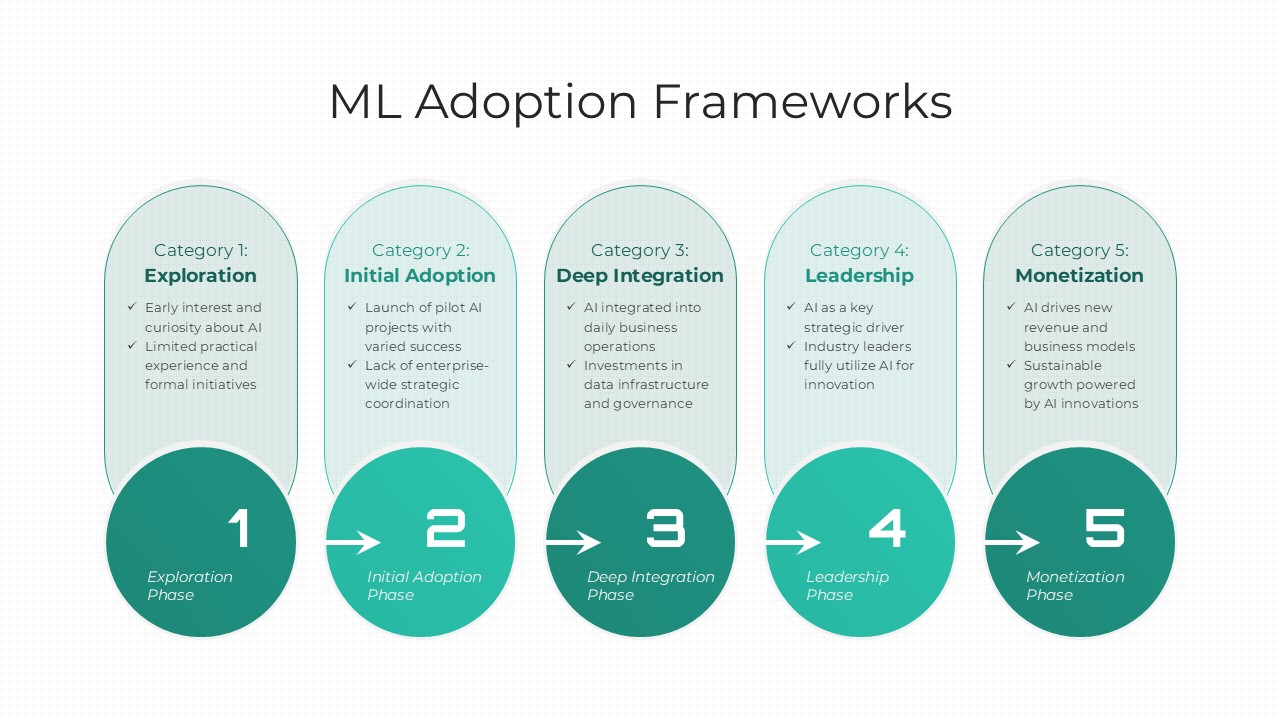
ML Adoption Framework template for PowerPoint & Google Slides
Technology
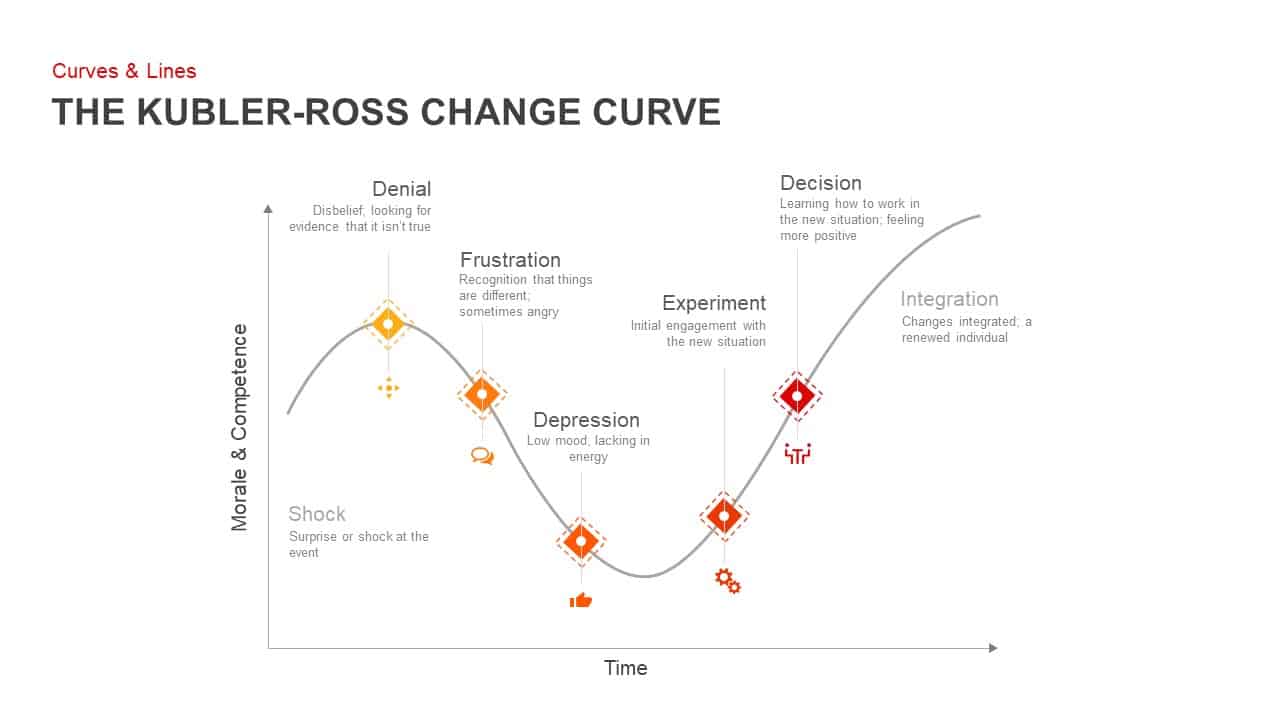
Kubler-Ross Change Curve Diagram Template for PowerPoint & Google Slides
Timeline
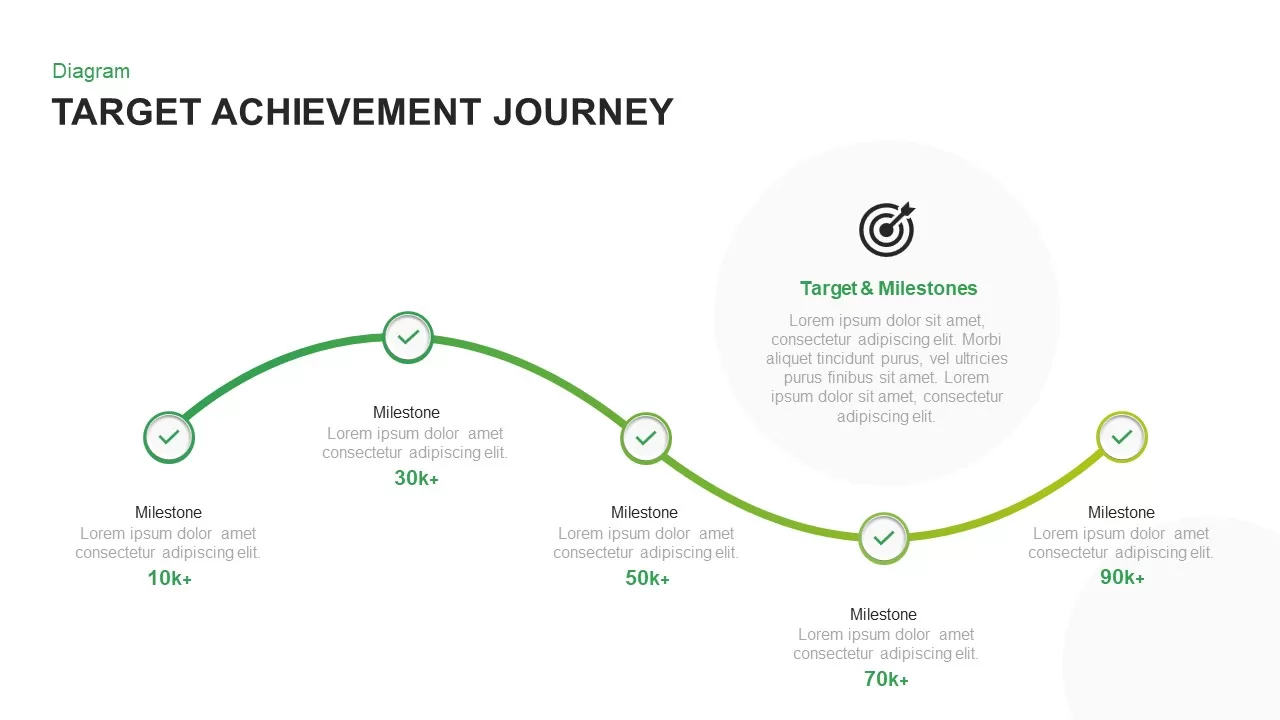
Target Achievement Milestone Curve Template for PowerPoint & Google Slides
Roadmap

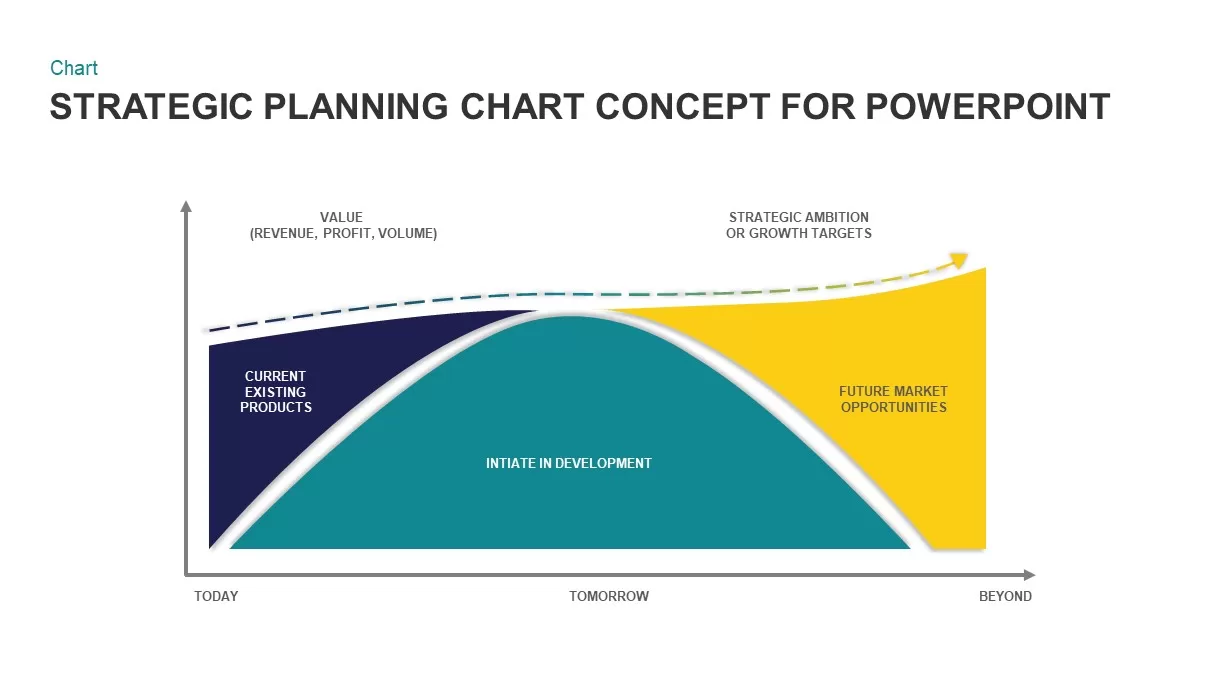
Strategic Planning Curve Diagram Template for PowerPoint & Google Slides
Charts
Greiner’s Growth Model Curve template for PowerPoint & Google Slides
Infographics
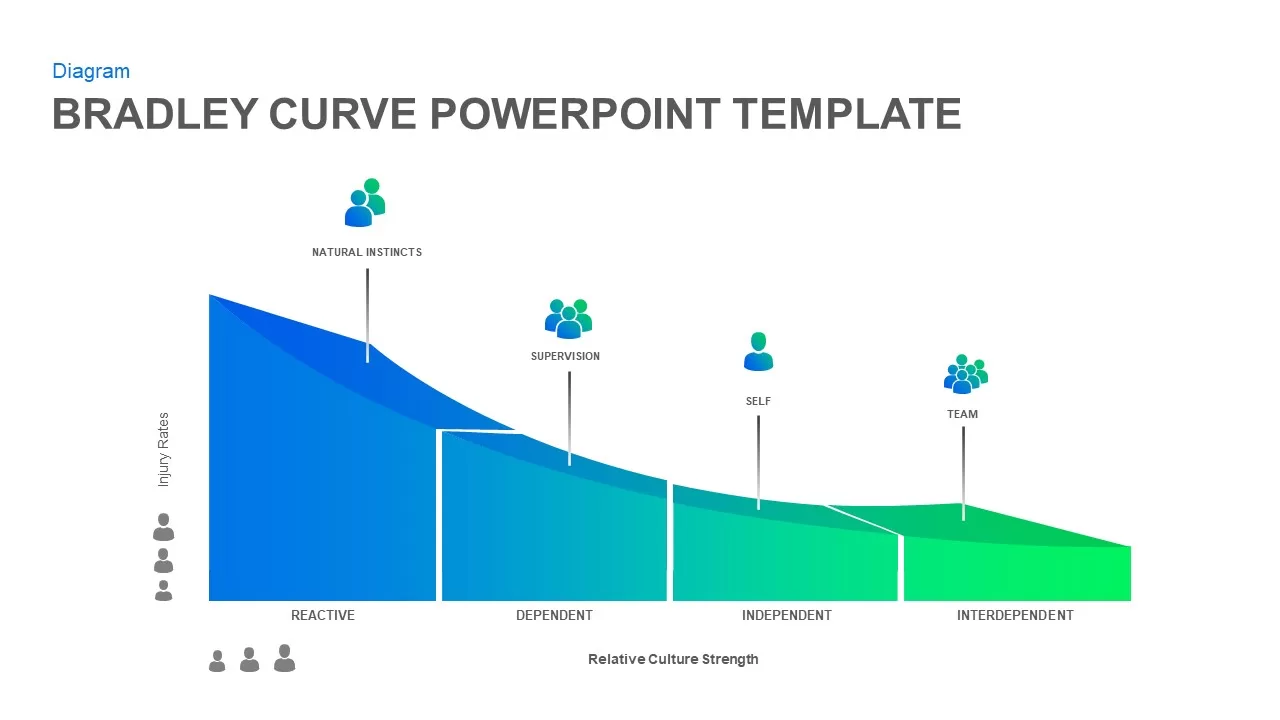
Bradley Curve Infographic Template for PowerPoint & Google Slides
Infographics
Snake Shaped Curve Diagram template for PowerPoint & Google Slides
Business
8-Bell Curve Infographic Slide Template for PowerPoint & Google Slides
Comparison Chart
S-Curve Progression Framework Diagram Template for PowerPoint & Google Slides
Charts
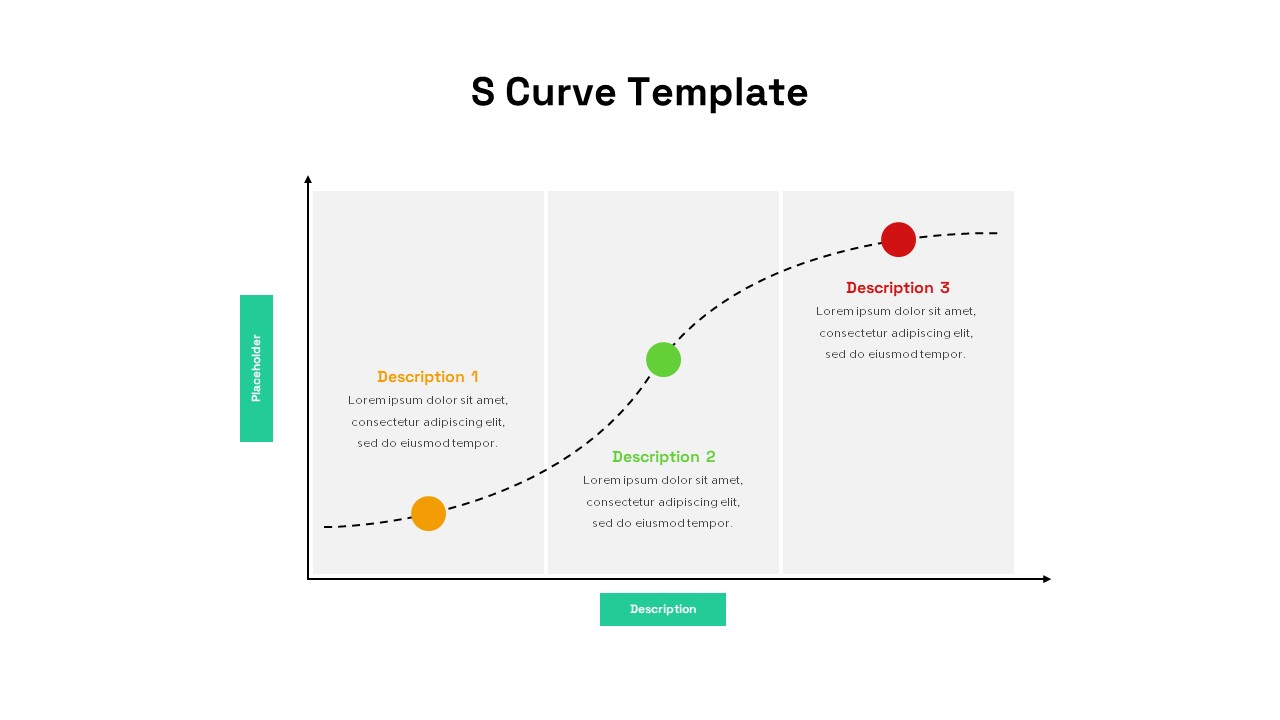
Three-Stage S Curve Growth Diagram Template for PowerPoint & Google Slides
Process
Growth Curve Line Chart Visualization Template for PowerPoint & Google Slides
Charts
Experience Curve Analysis Diagram Template for PowerPoint & Google Slides
Business Strategy
Economies of Scale Cost Curve Comparison Template for PowerPoint & Google Slides
Comparison Chart
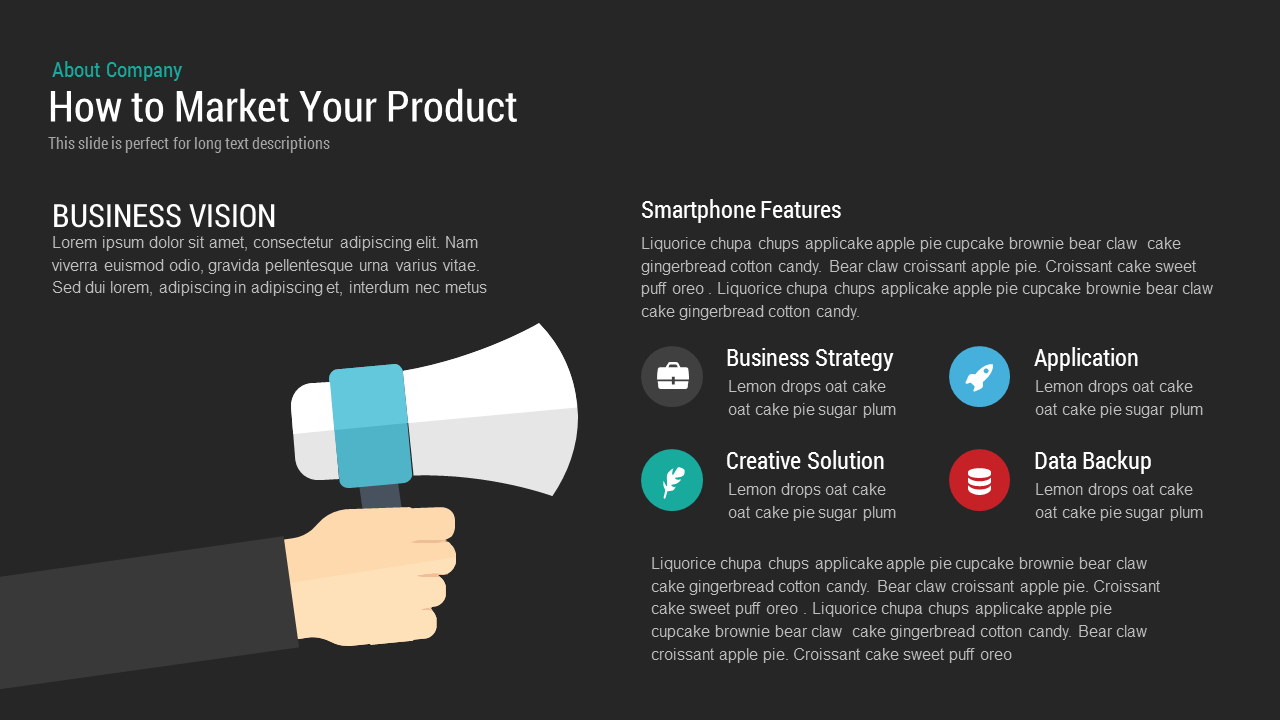
How to Market Your Product template for PowerPoint & Google Slides
Business Strategy
Free
Puzzle DNA Diagram for Product Features Template for PowerPoint & Google Slides
Process
Rubix Cube Product Description Template for PowerPoint & Google Slides
Business
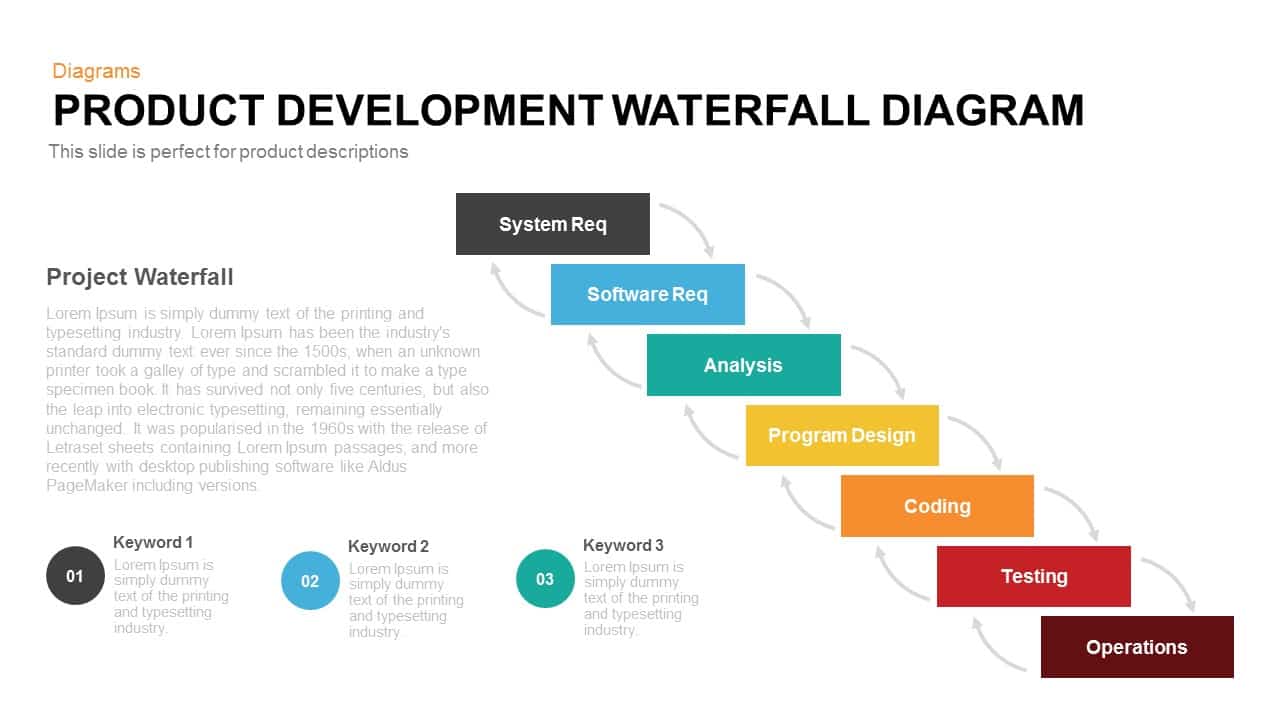
Product Development Waterfall Diagram Template for PowerPoint & Google Slides
Process
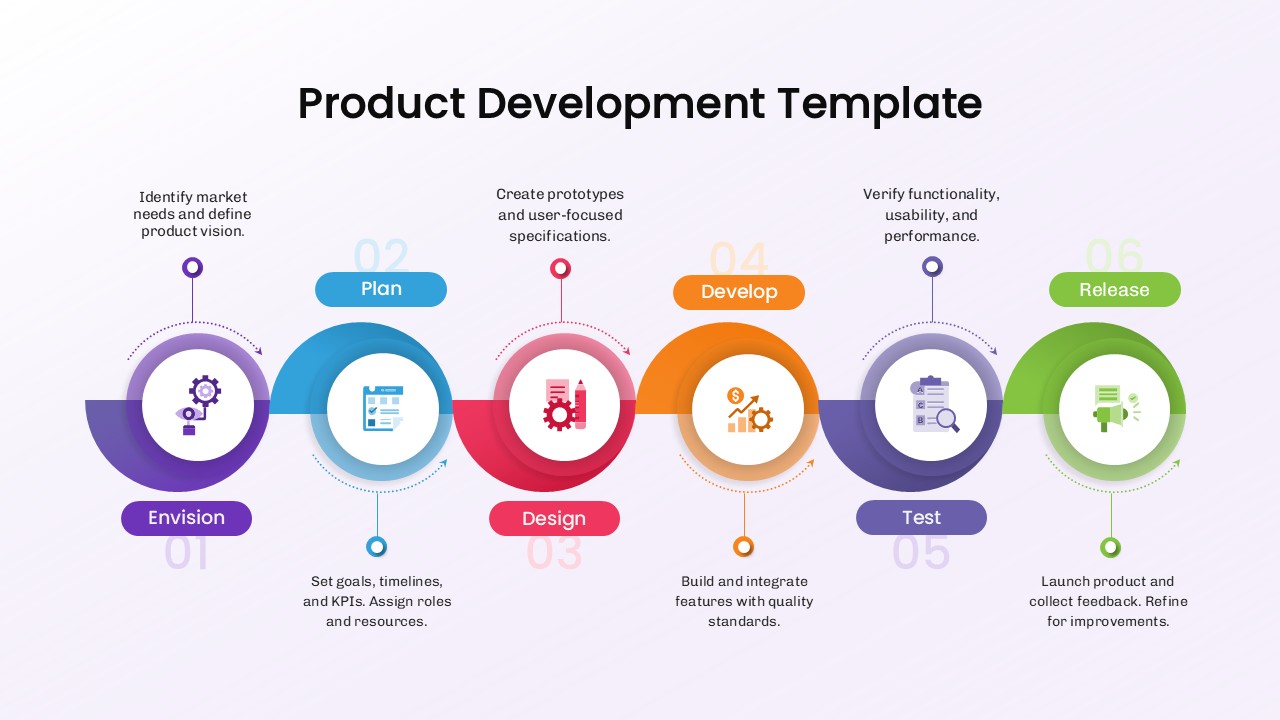
Product Development template for PowerPoint & Google Slides
Process

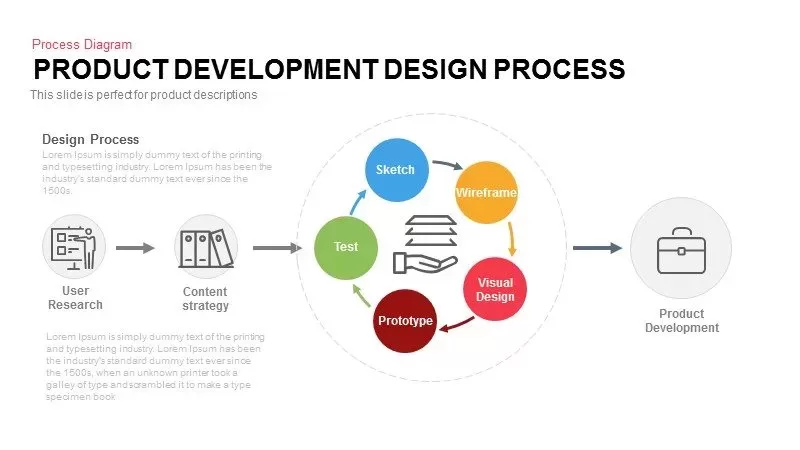
Product Development Design Process template for PowerPoint & Google Slides
Process
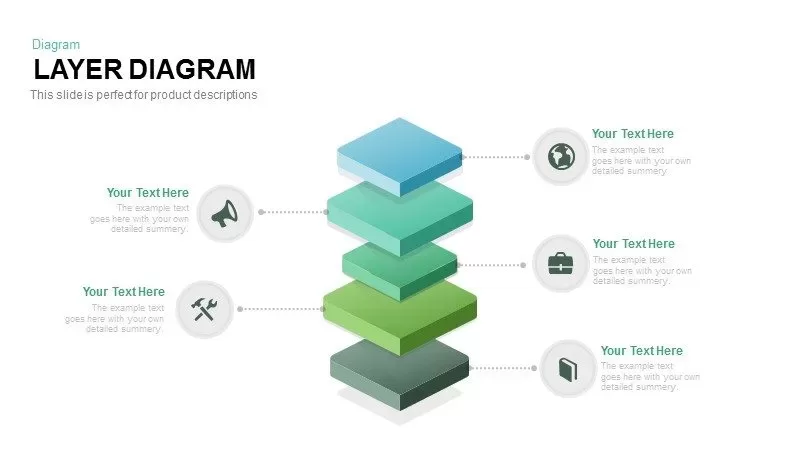
Five Layer Product Architecture Diagram Template for PowerPoint & Google Slides
Process

Product Roadmap Gantt Chart Timeline template for PowerPoint & Google Slides
Gantt Chart
Sleek Product Launch Presentation Deck Template for PowerPoint & Google Slides
Pitch Deck
Product Usage Analytics Dashboard Chart Template for PowerPoint & Google Slides
Bar/Column

Product Design Process Diagram Template for PowerPoint & Google Slides
Timeline
Product Development Stage Diagram Template for PowerPoint & Google Slides
Process
Product Shipping Metaphor Diagram Template for PowerPoint & Google Slides
Process
Interactive Product Comparison Bar Chart Template for PowerPoint & Google Slides
Bar/Column
Product Launch Roadmap Timeline Template for PowerPoint & Google Slides
Timeline
Product Development Roadmap template for PowerPoint & Google Slides
Roadmap
Eight-Step New Product Survey Process Template for PowerPoint & Google Slides
Process
Product Life Cycle Infographics template for PowerPoint & Google Slides
Business
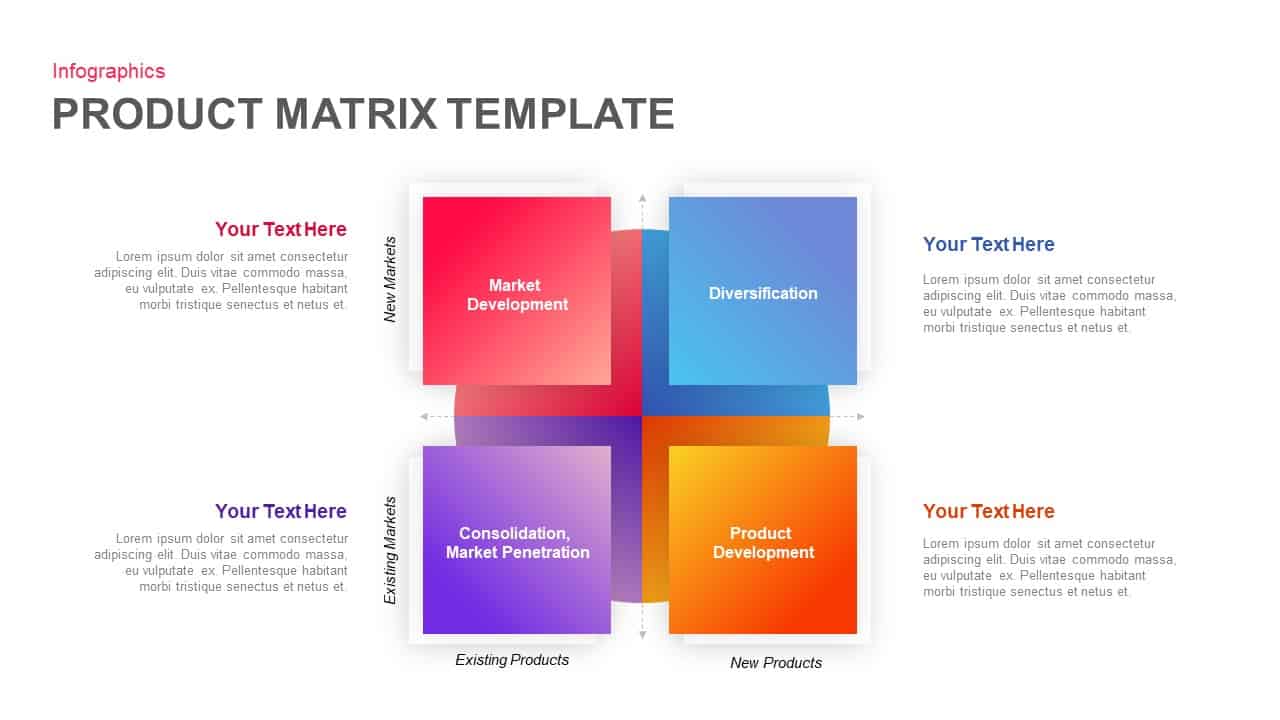
Product Market Expansion Matrix Template for PowerPoint & Google Slides
Business
Radar Chart Product Comparison Template for PowerPoint & Google Slides
Comparison Chart
Six-Metric Green Product Comparison Template for PowerPoint & Google Slides
Comparison
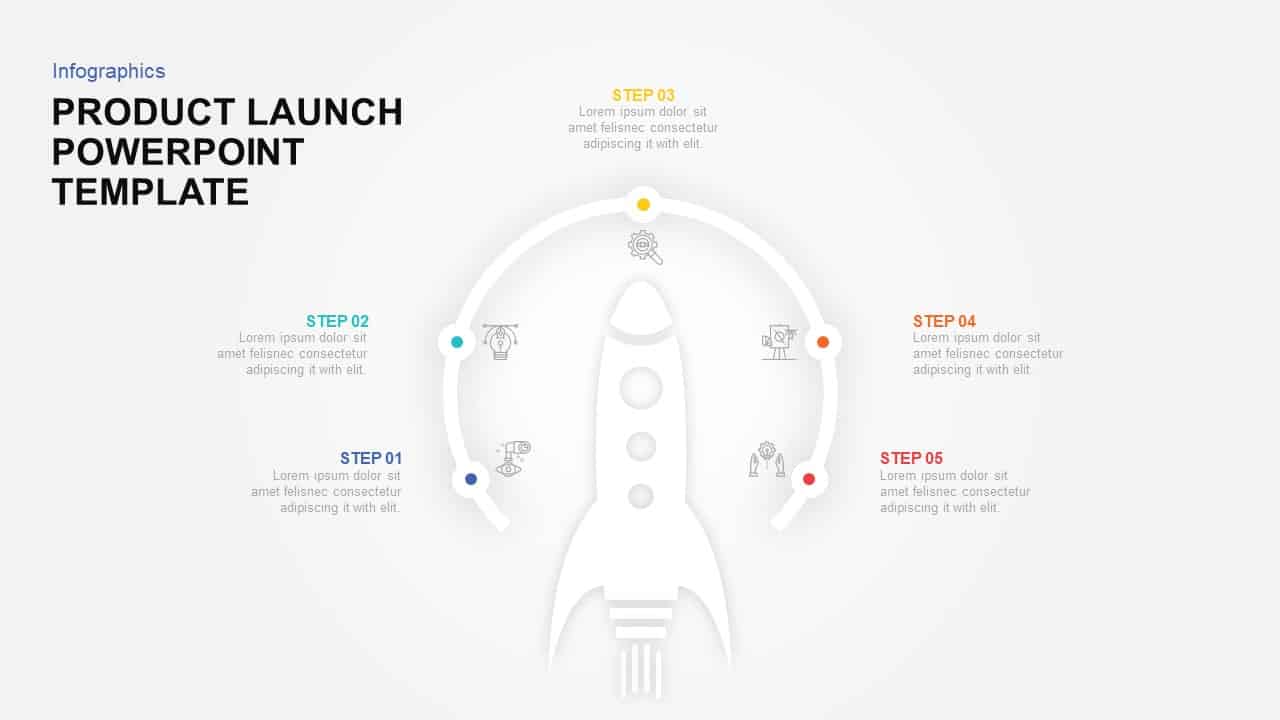
Product Launch 5-Step Rocket Infographic Template for PowerPoint & Google Slides
Process
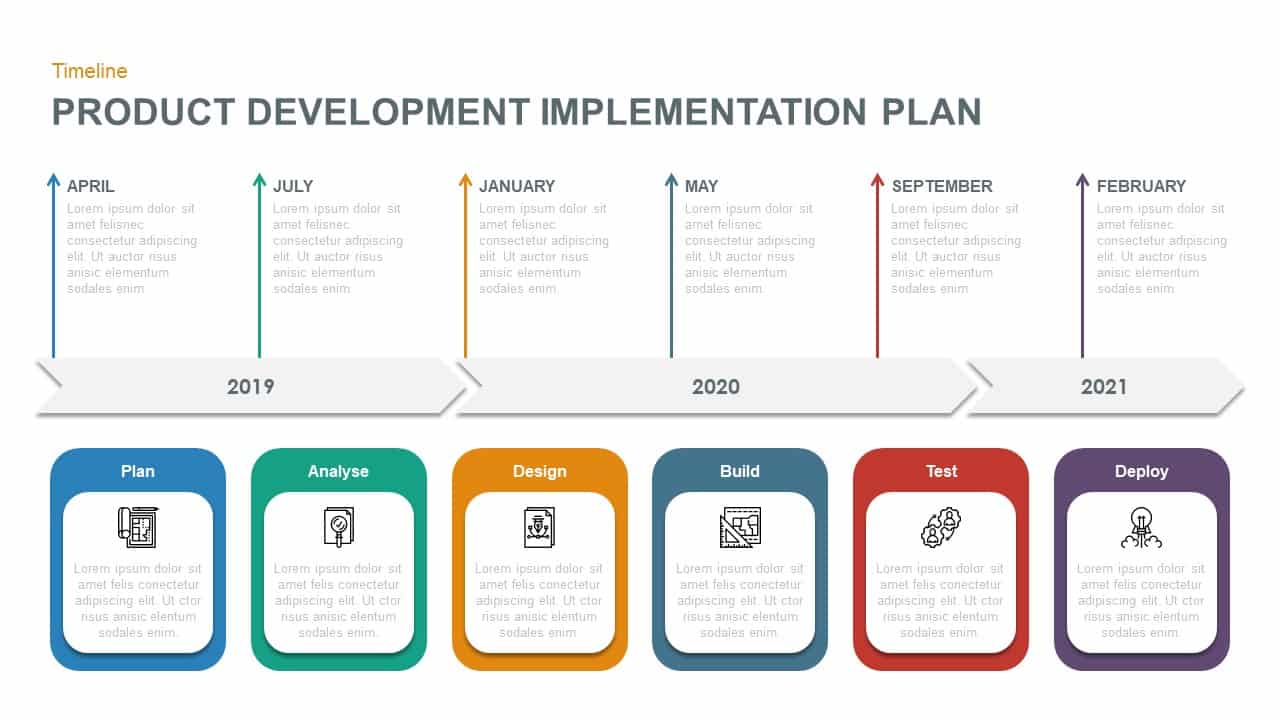
Product Development Plan Timeline Template for PowerPoint & Google Slides
Timeline
Ultimate Product Launch Checklist Cover Template for PowerPoint & Google Slides
Process
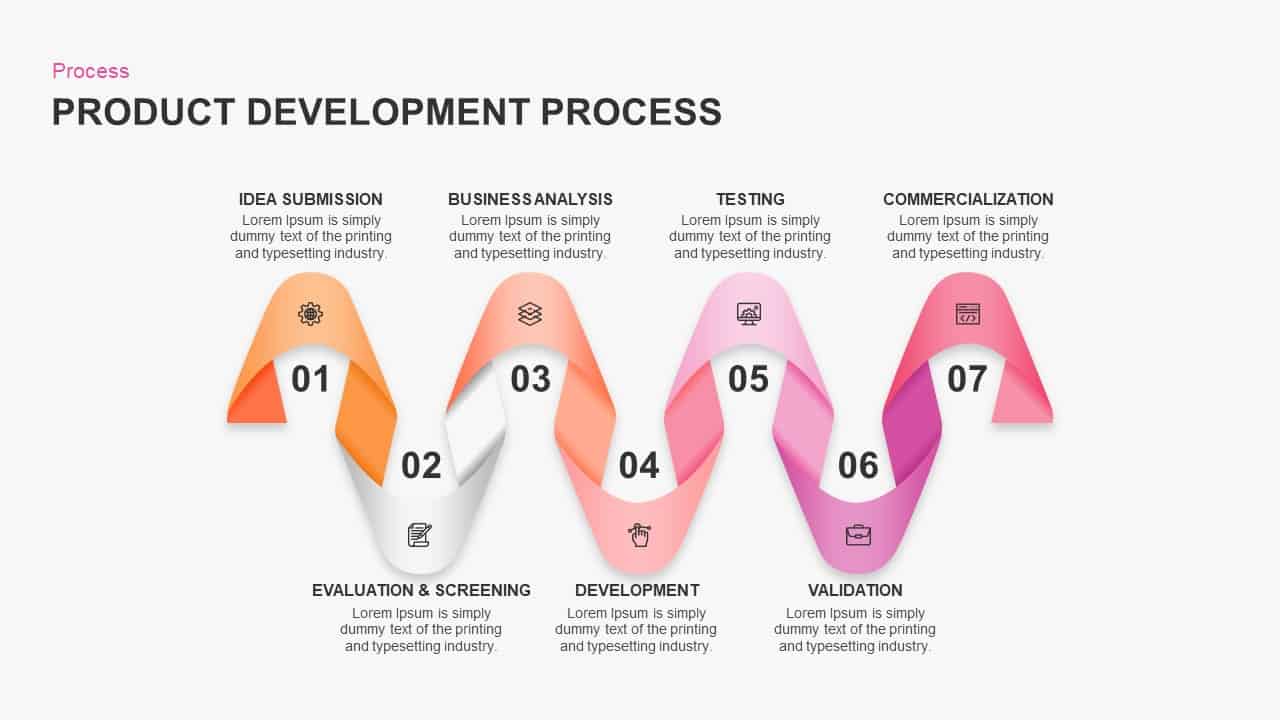
Product Development Process Overview template for PowerPoint & Google Slides
Process
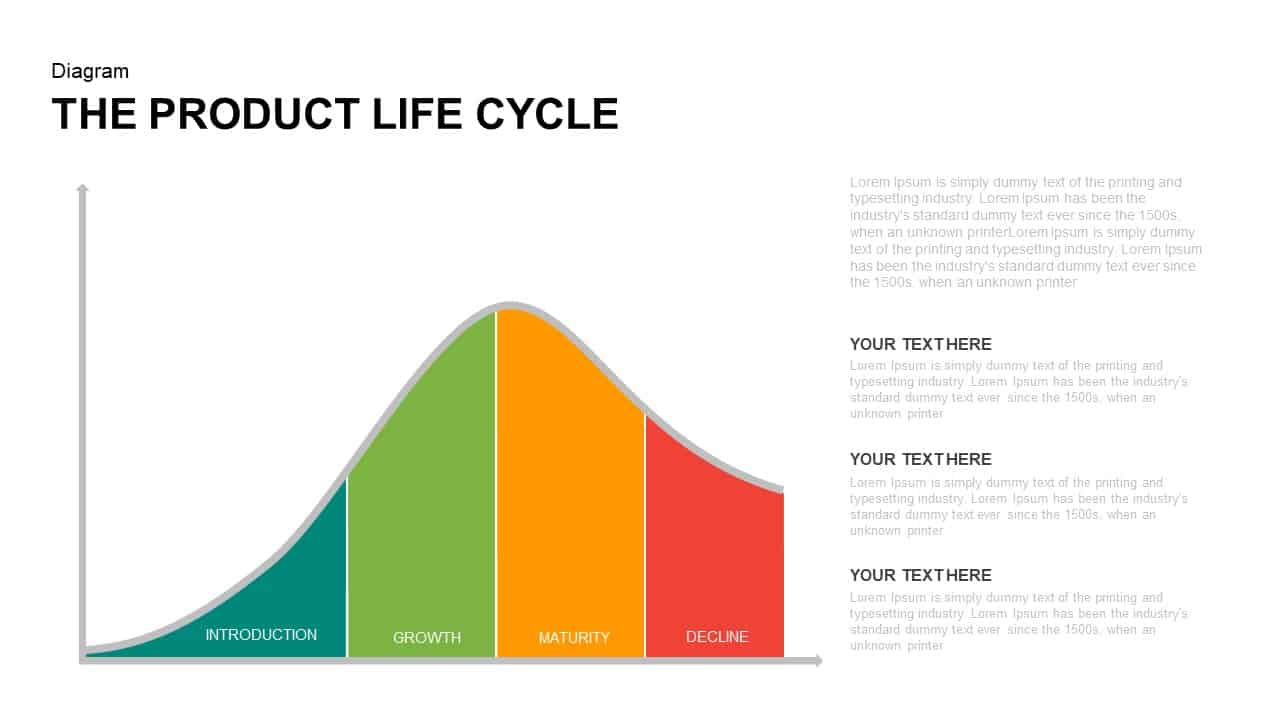
Corporate Product Life Cycle Diagram Template for PowerPoint & Google Slides
Process
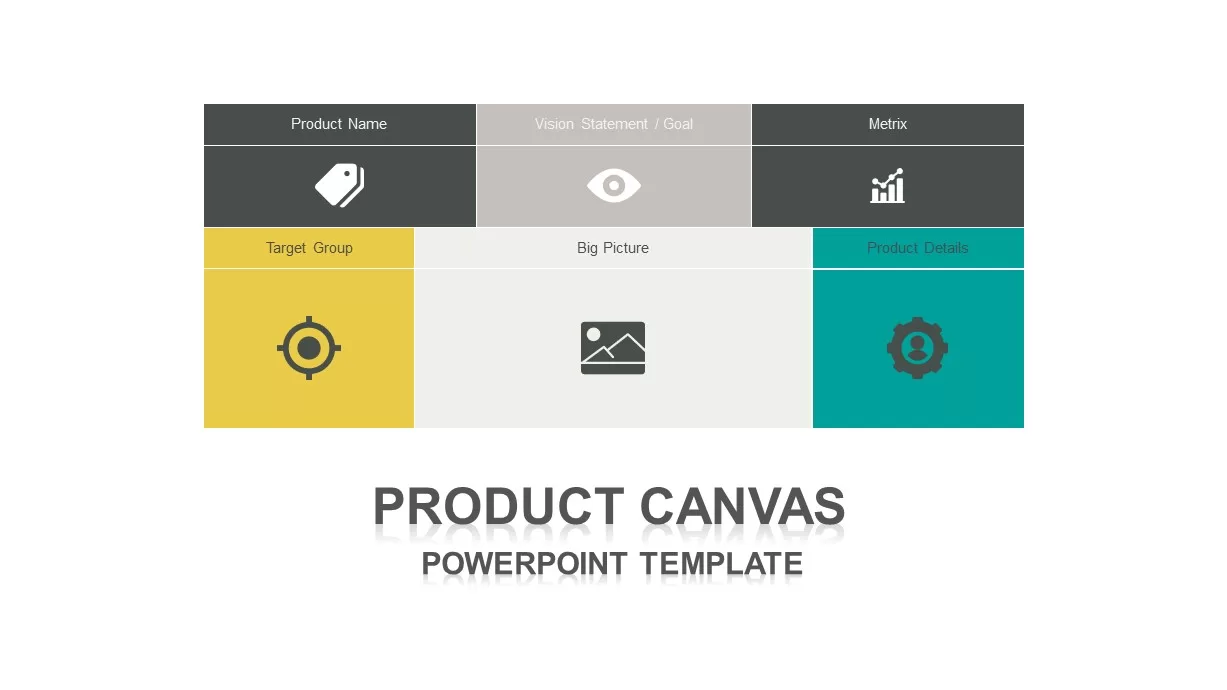
Product Canvas Template for PowerPoint & Google Slides
Business
Circular Product Comparison Chart Template for PowerPoint & Google Slides
Comparison Chart
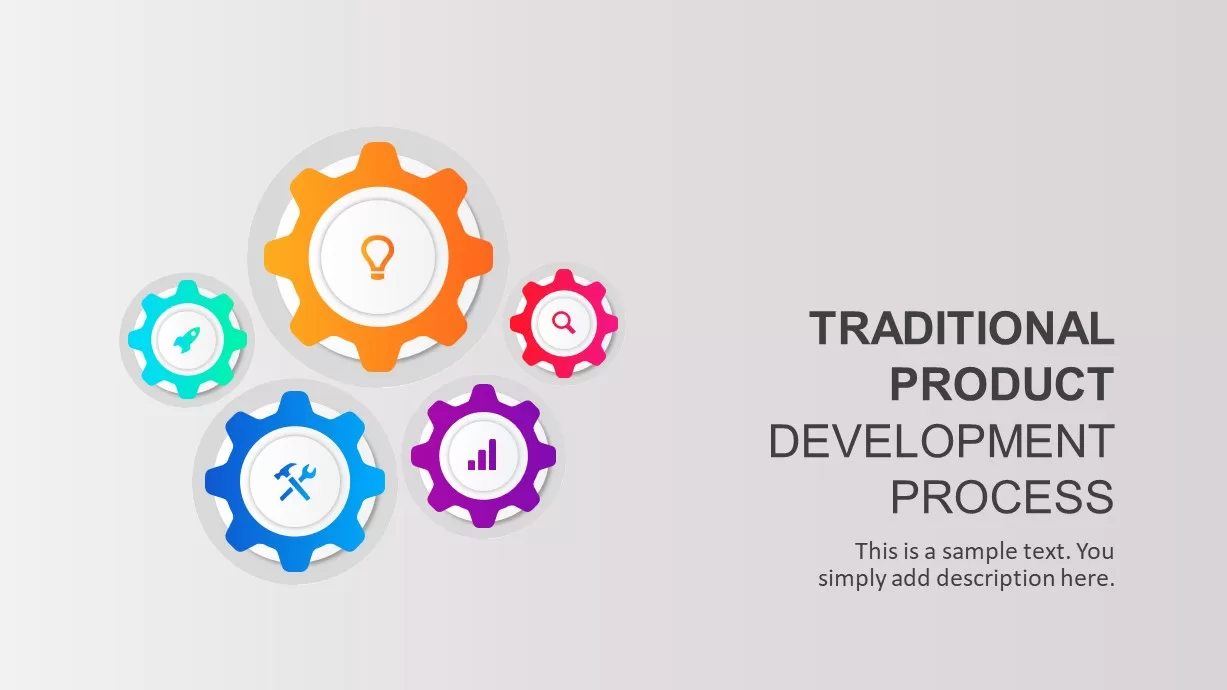
Traditional Product Development Process Template for PowerPoint & Google Slides
Process
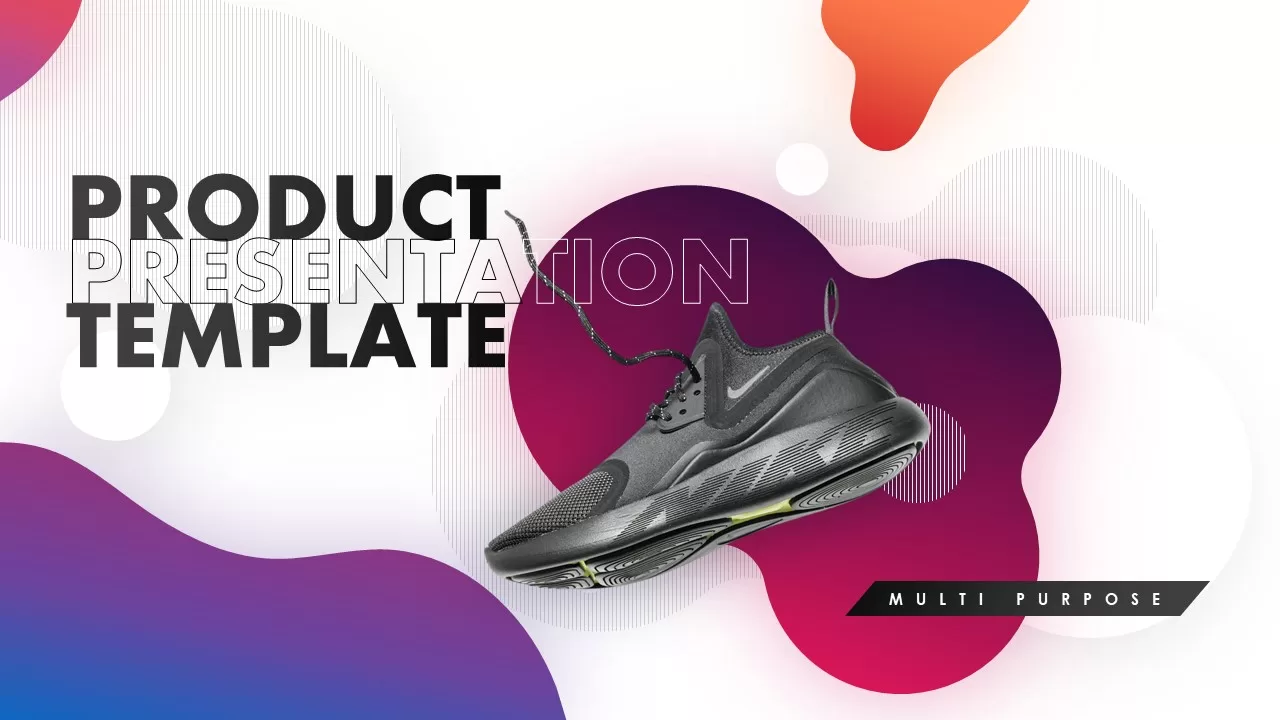
Product Presentation Template for PowerPoint & Google Slides
Advertising
Exclusive Product Banner Marketing Template for PowerPoint & Google Slides
Advertising
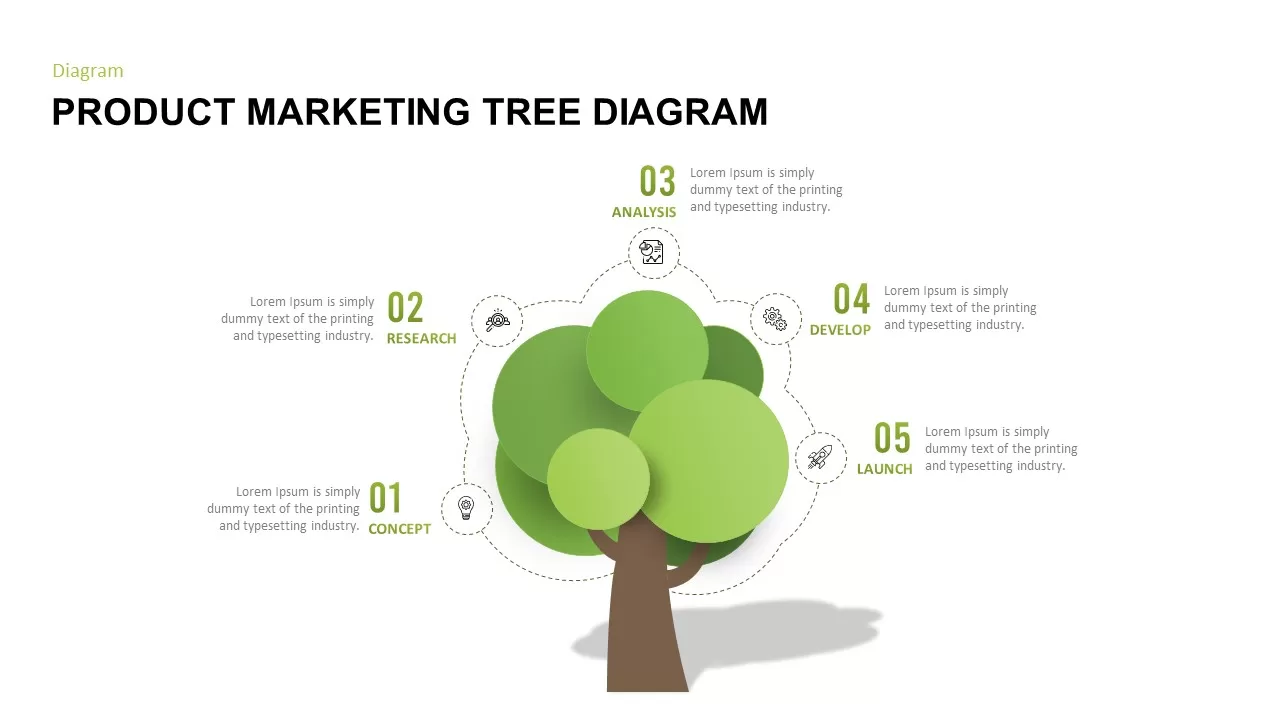
Product Marketing Tree Diagram Template for PowerPoint & Google Slides
Marketing
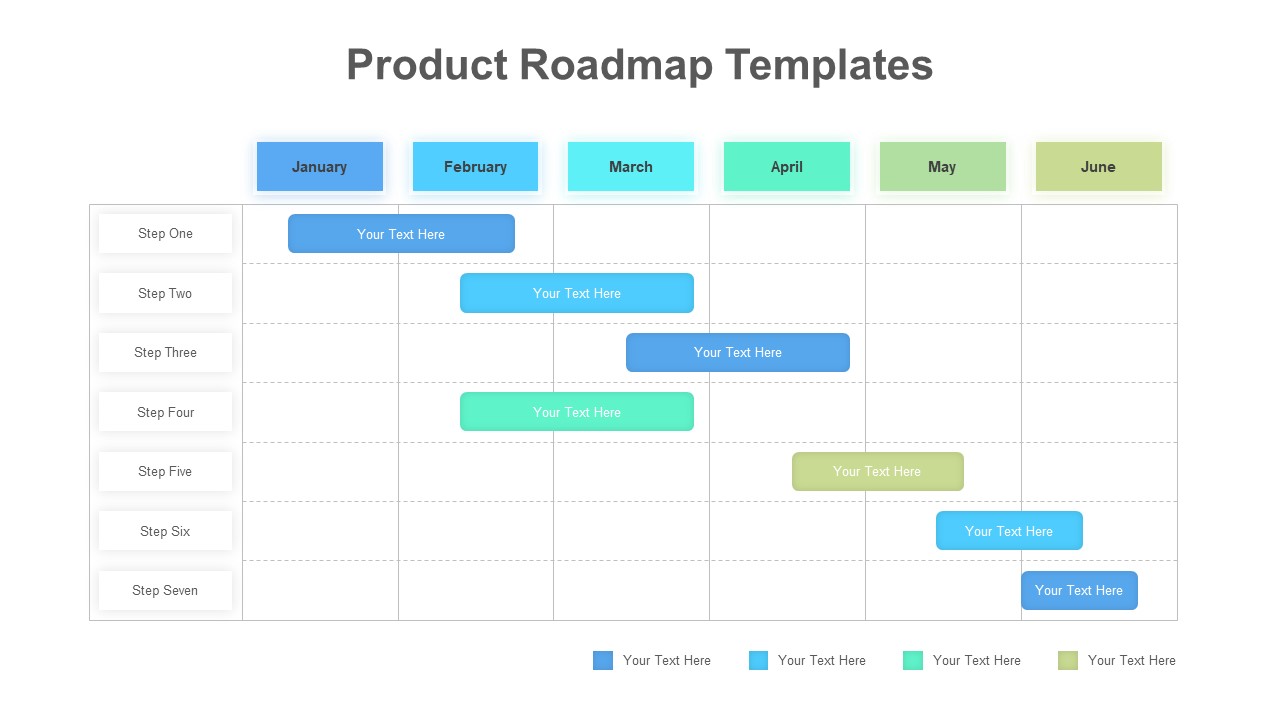
Product Roadmap Timeline template for PowerPoint & Google Slides
Project Status
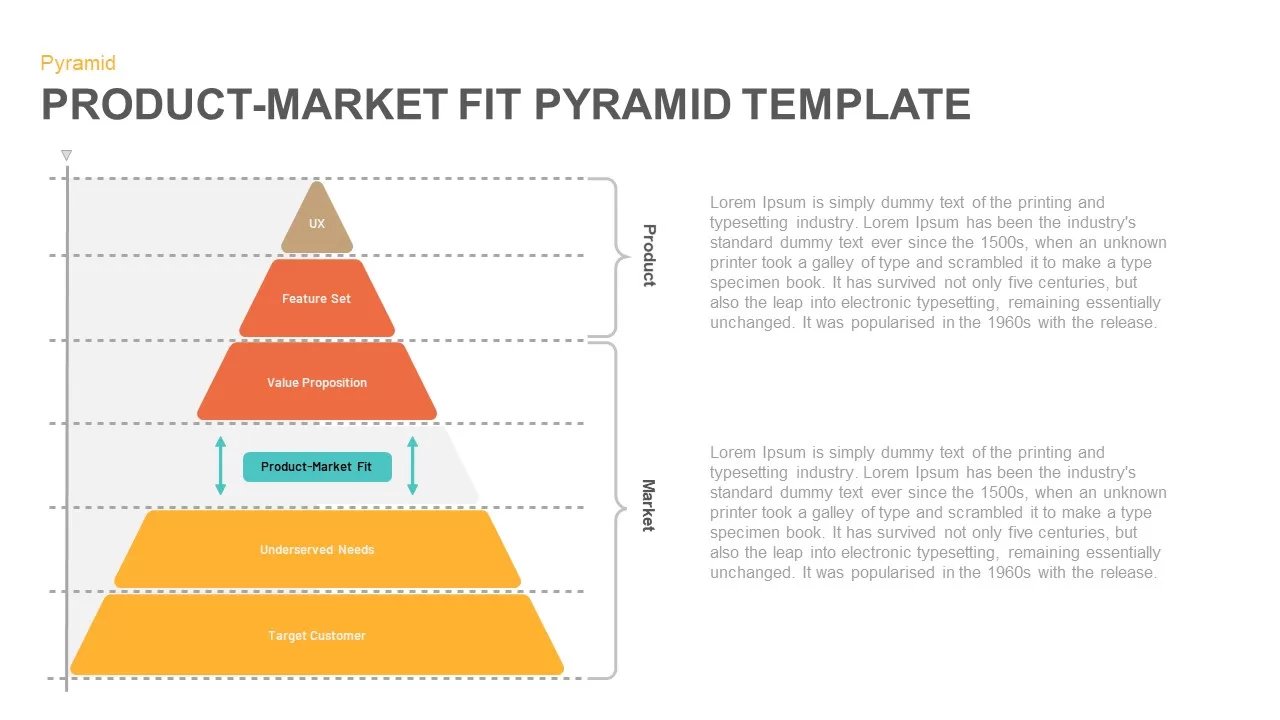
Product-Market Fit Pyramid template for PowerPoint & Google Slides
Pyramid
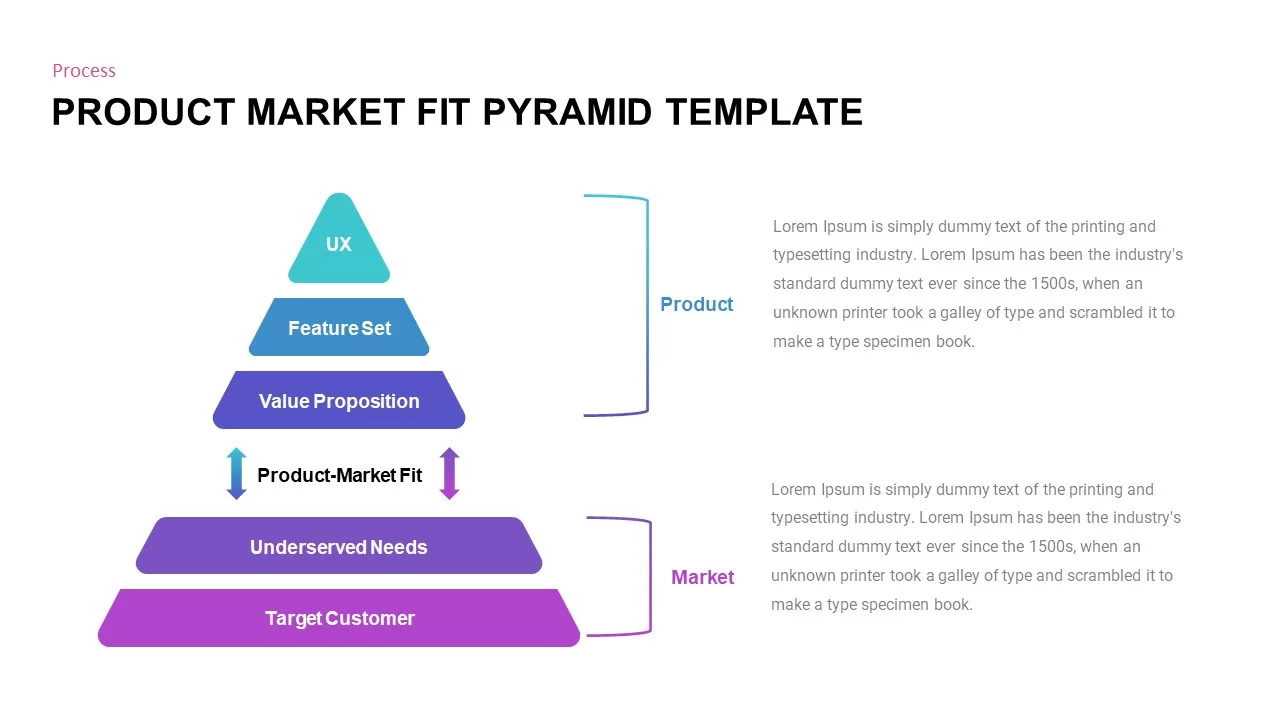
Professional Product Market Fit Pyramid Template for PowerPoint & Google Slides
Pyramid
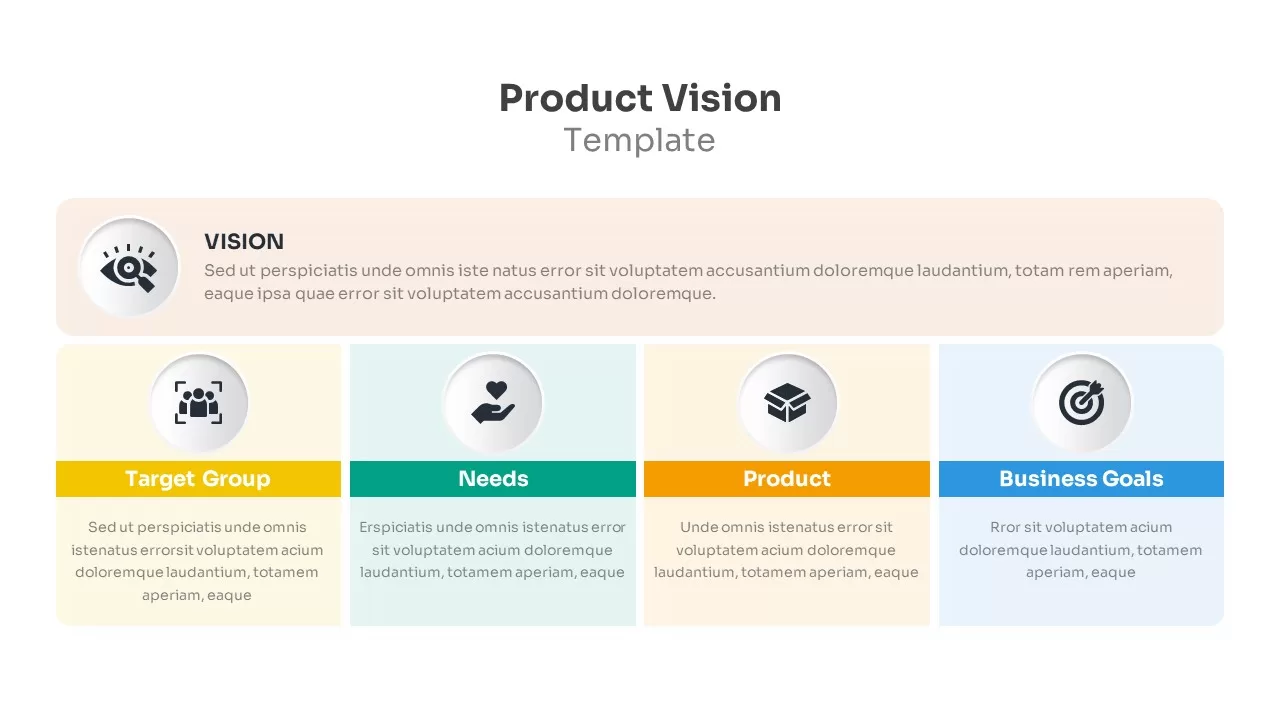
Product Vision & Strategy template for PowerPoint & Google Slides
Business Plan

Product Landing Page Template for PowerPoint & Google Slides
Advertising
3D Product Spotlight Stage Design Template for PowerPoint & Google Slides
Graphics
Dark Blue Product Spotlight Presentation Template for PowerPoint & Google Slides
Graphics
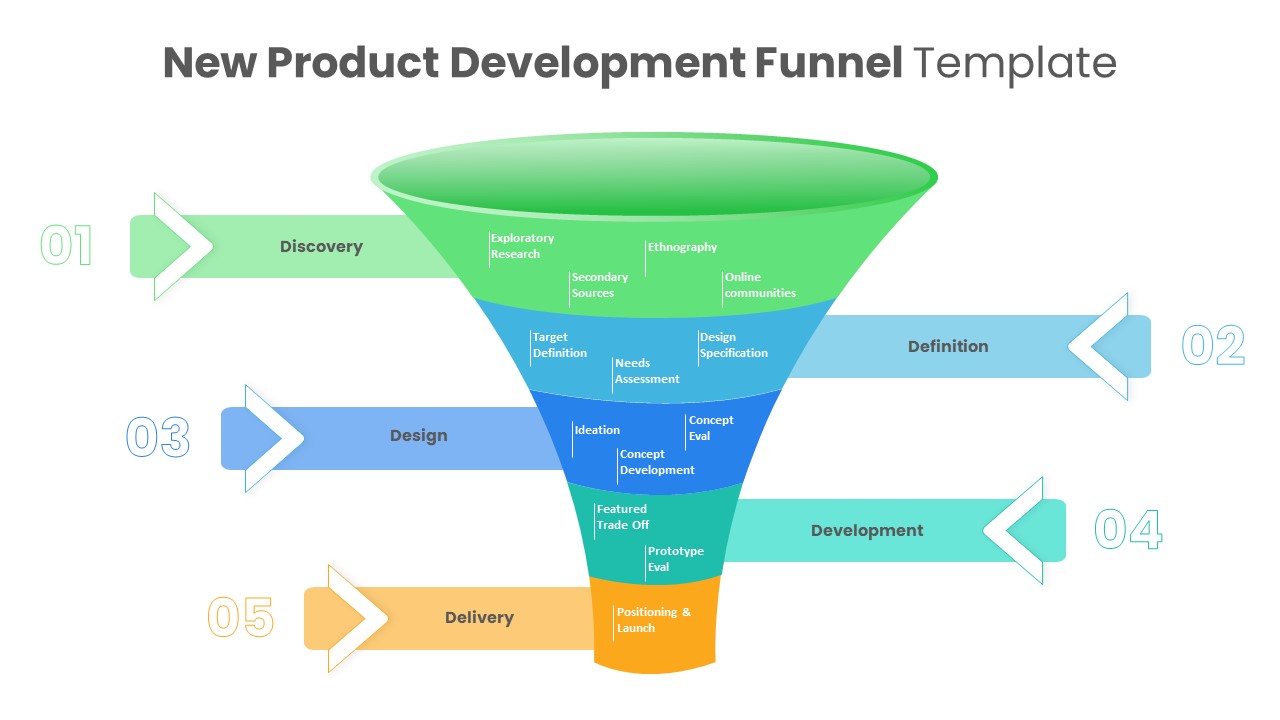
New Product Development Funnel Diagram Template for PowerPoint & Google Slides
Funnel
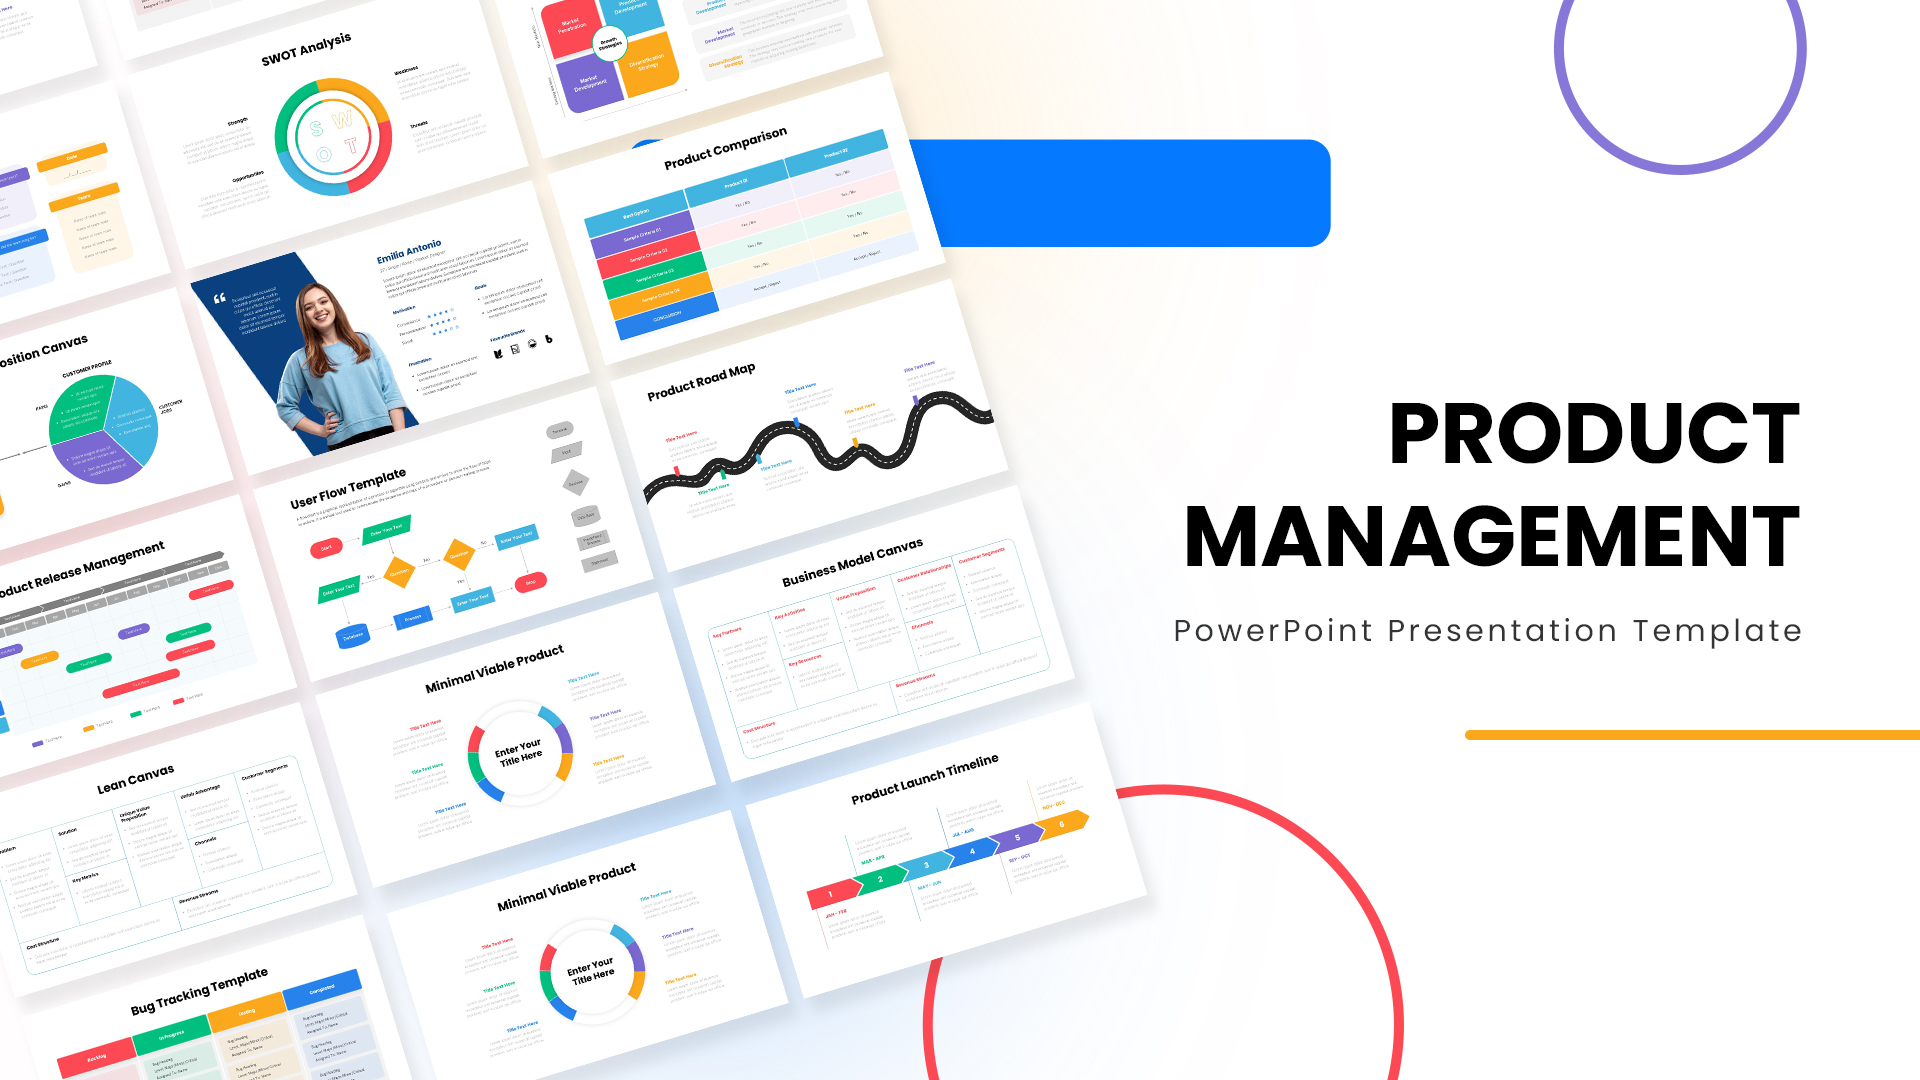
Product Management Presentation Template for PowerPoint & Google Slides
Project Status
Stylish Product Description Slide Template for PowerPoint & Google Slides
Marketing
Dark Drone Product Description Slide Template for PowerPoint & Google Slides
Business Proposal
Modern Teal Product Demo Pitch Deck Template for PowerPoint & Google Slides
Business
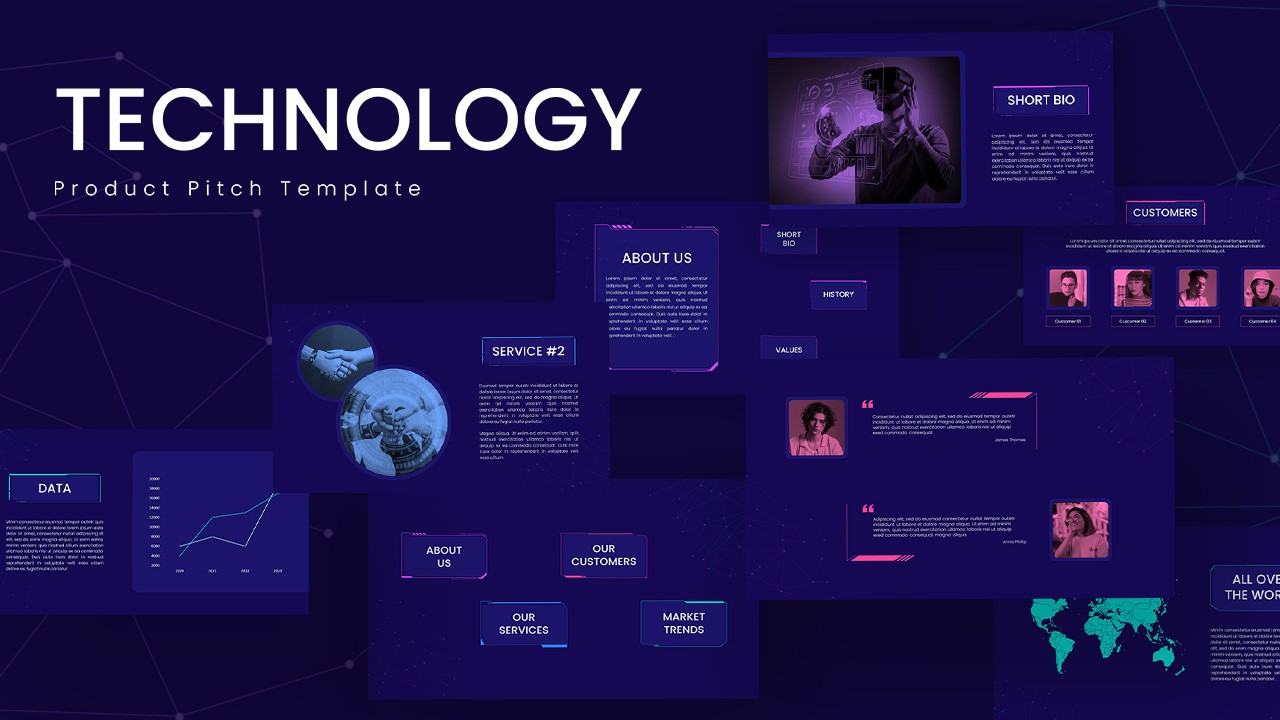
Prezi Style Technology Product Pitch Template for PowerPoint & Google Slides
Pitch Deck
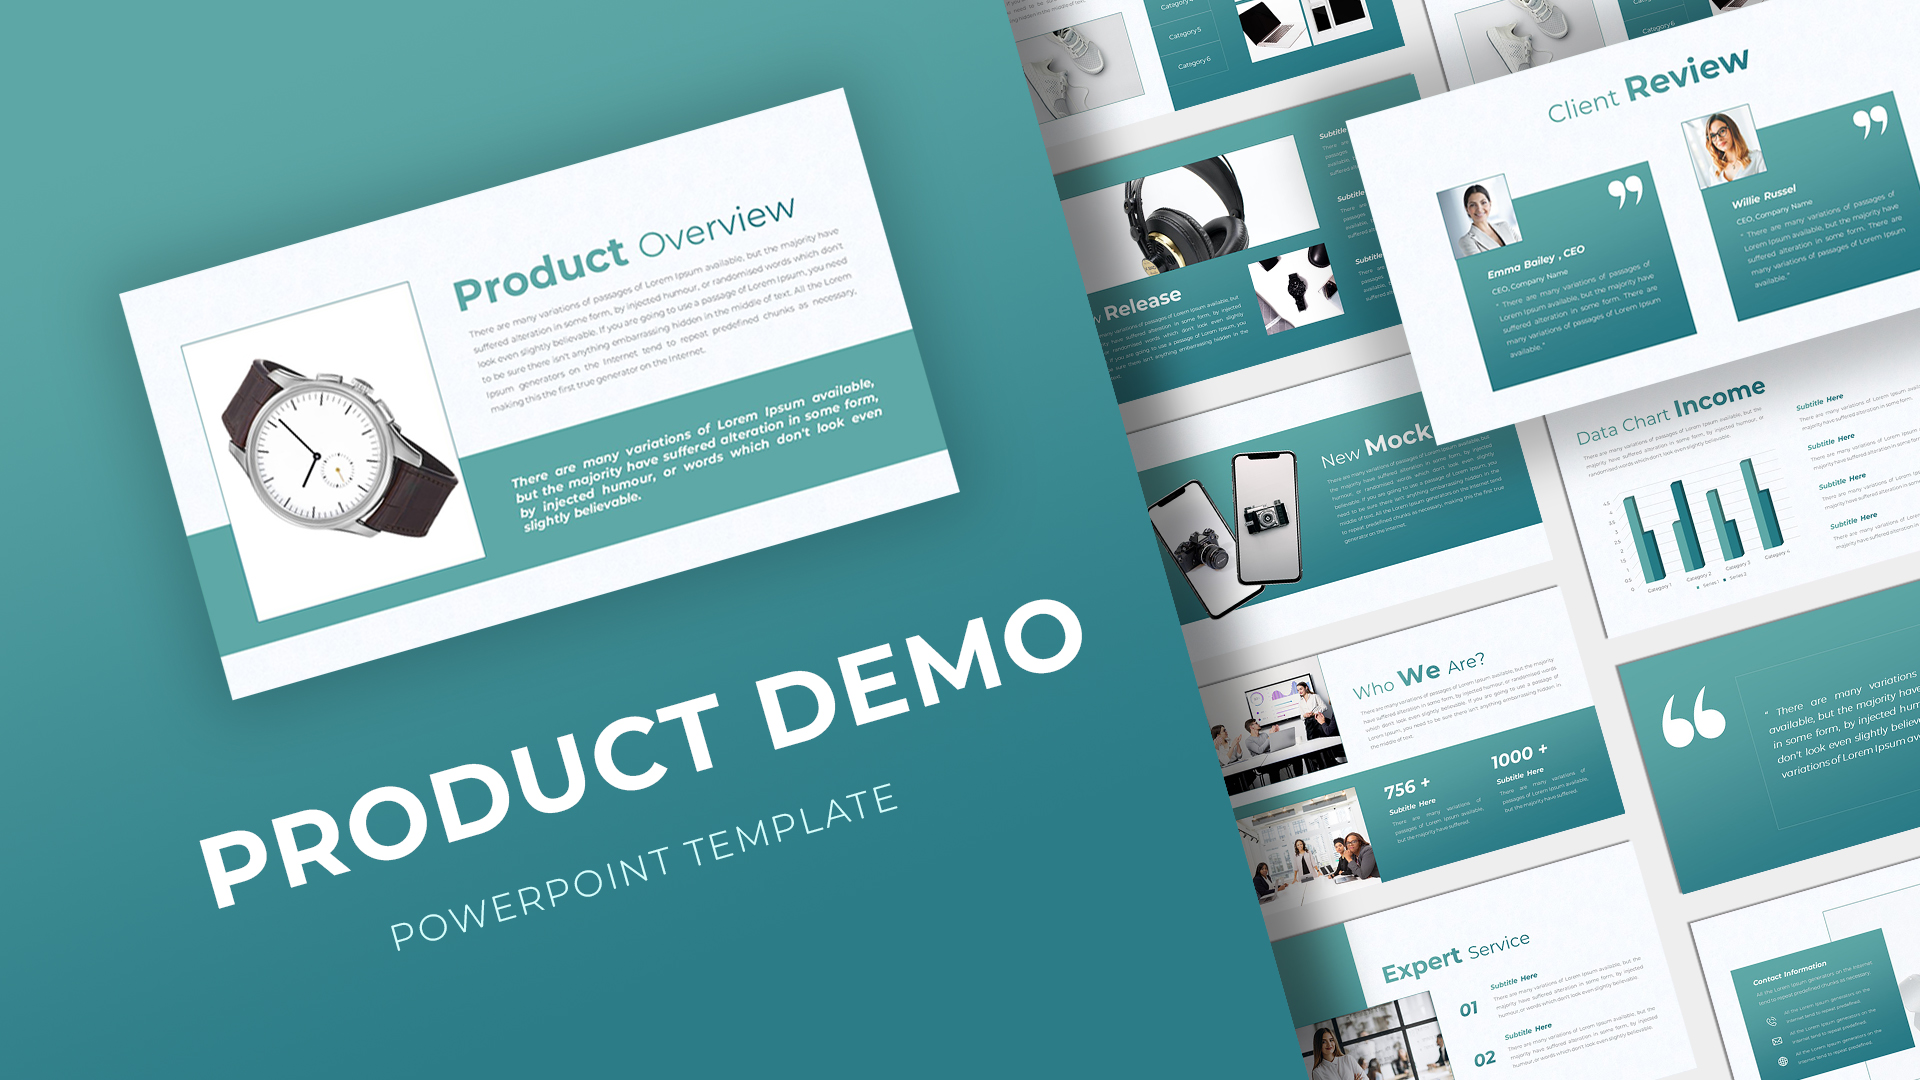
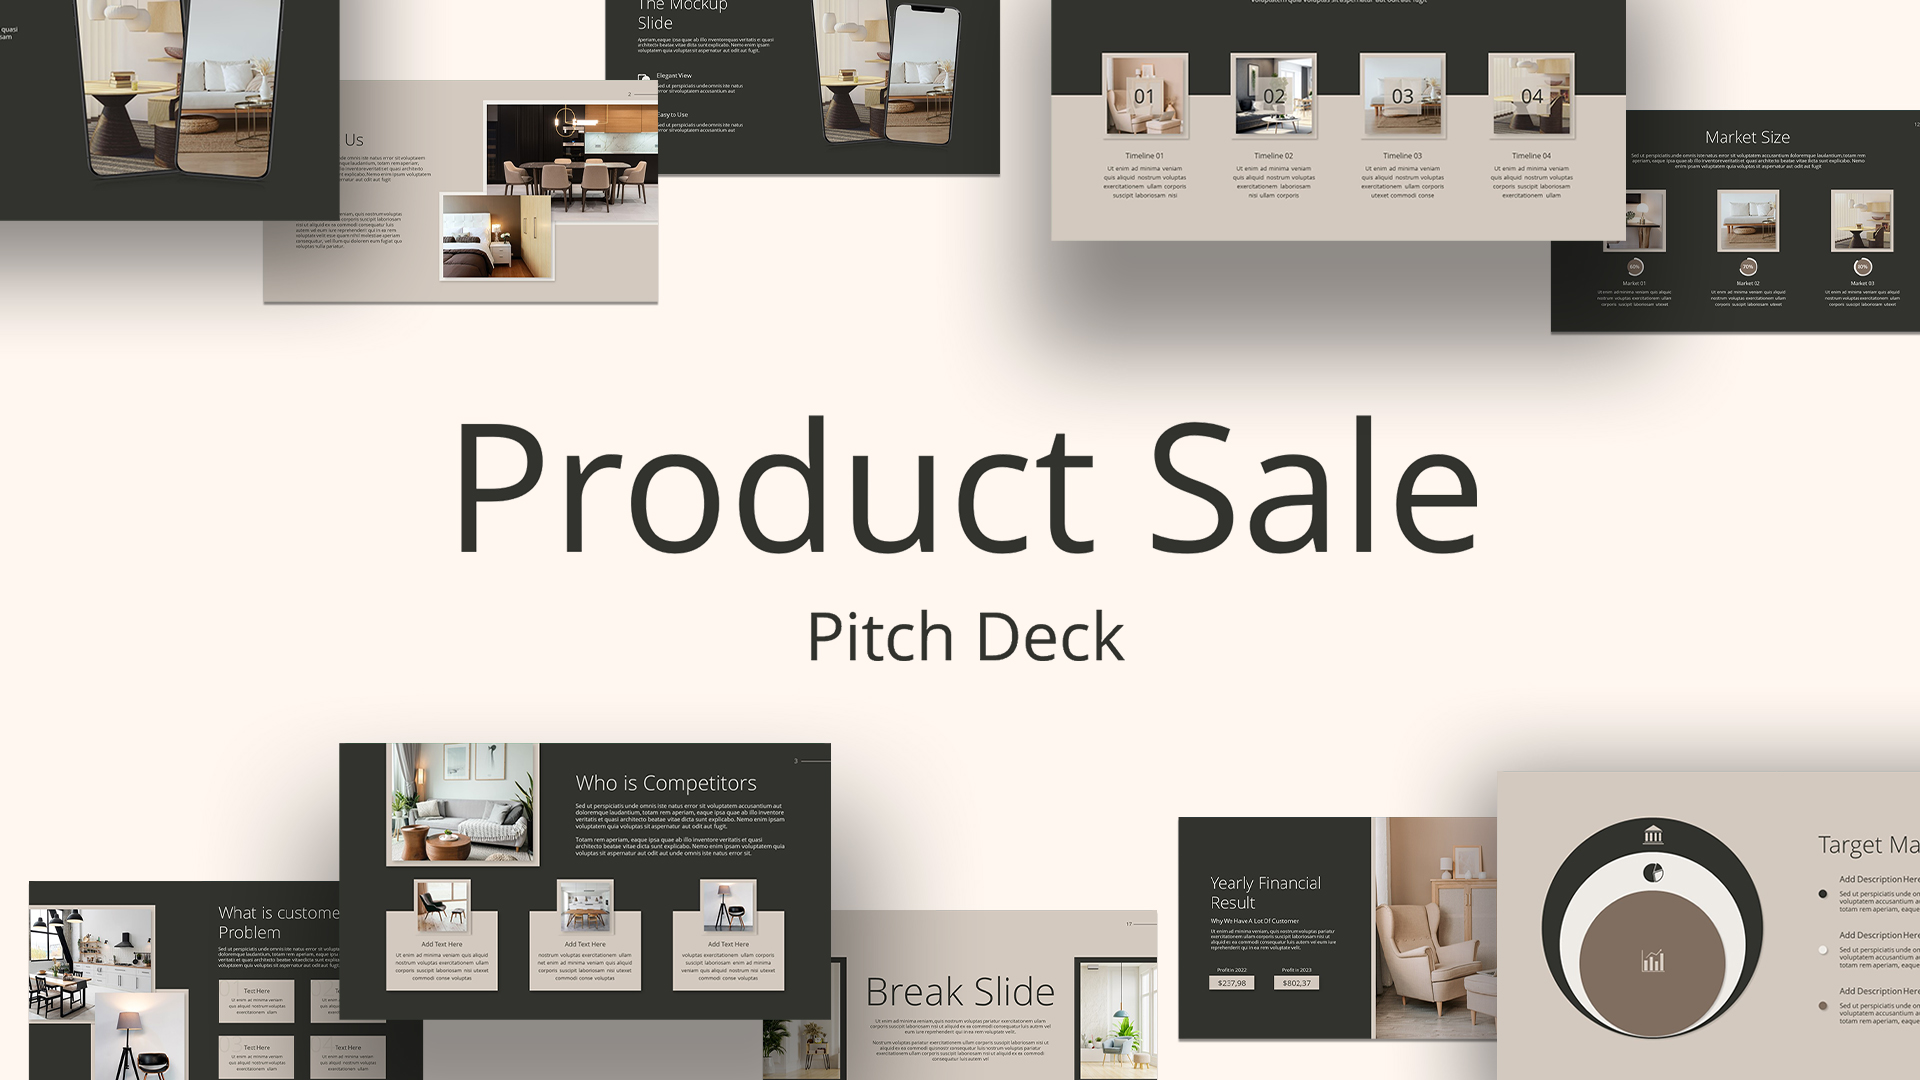
Product Sale Pitch Deck Presentation Template for PowerPoint & Google Slides
Pitch Deck
Free Versatile Product Comparison Chart Template for PowerPoint & Google Slides
Charts
Free
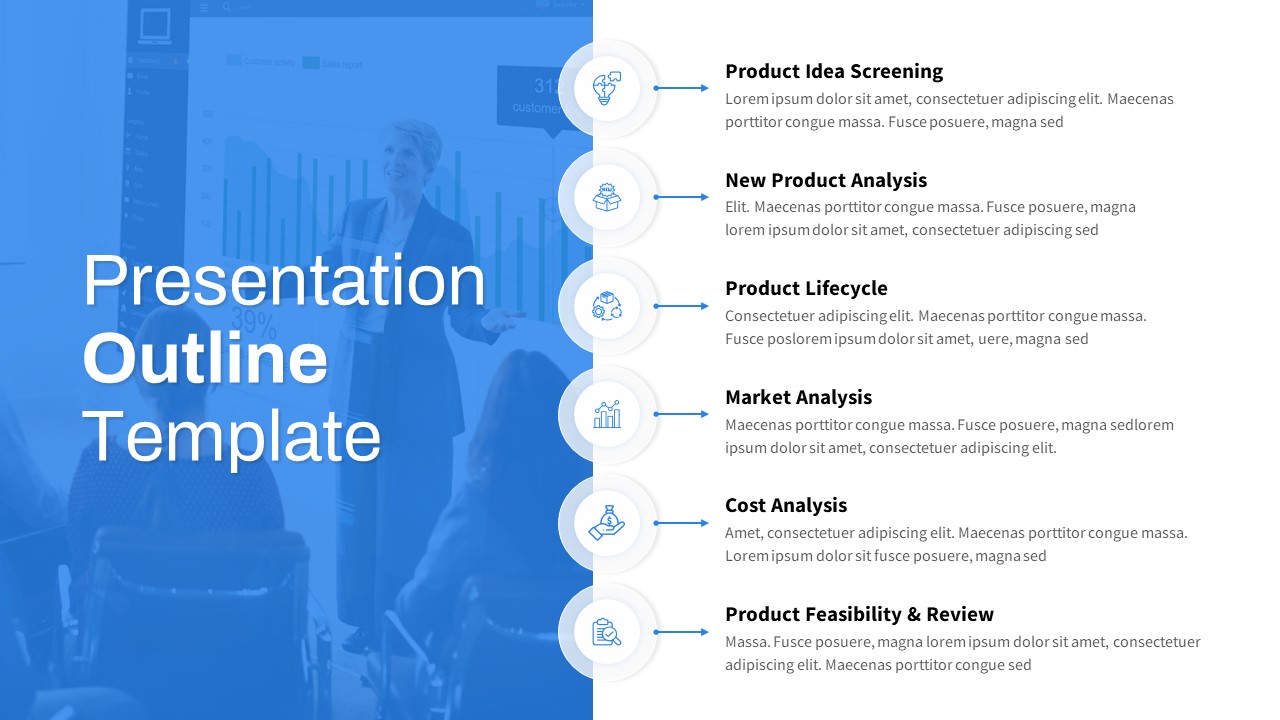
Free Product Development Process Outline Template for PowerPoint & Google Slides
Infographics
Free
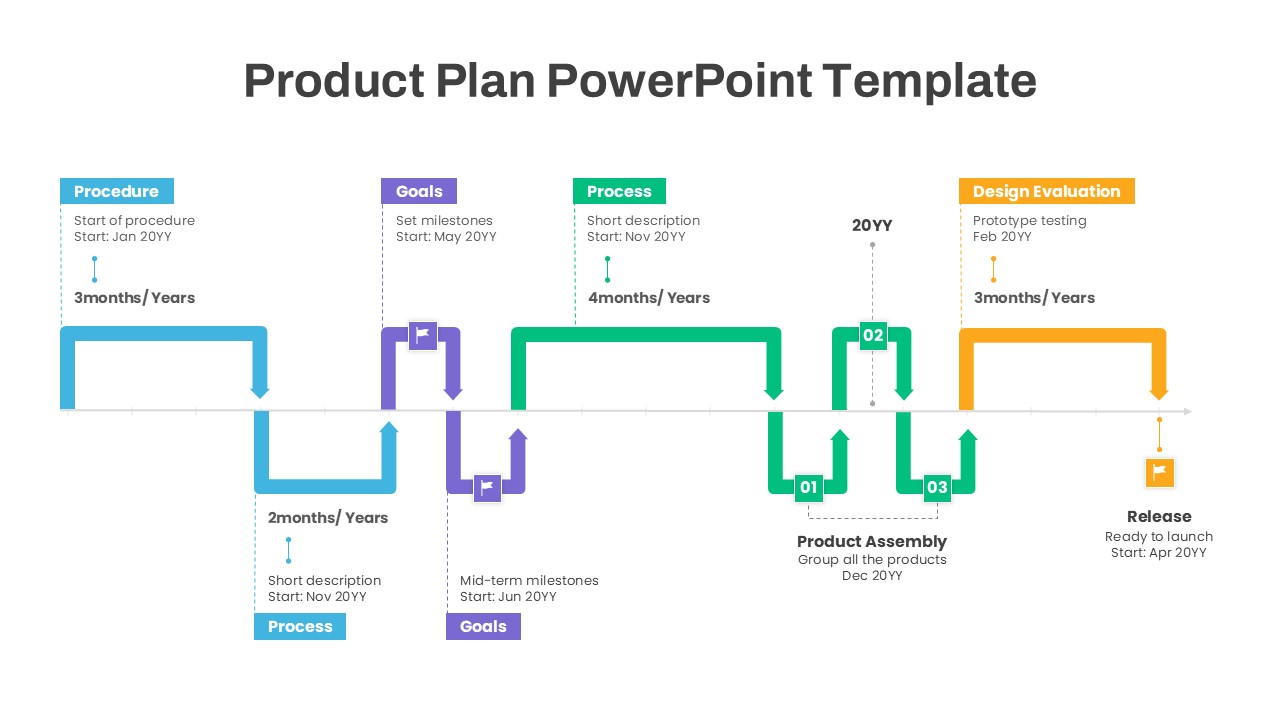
Product Plan Timeline and Milestones Template for PowerPoint & Google Slides
Timeline
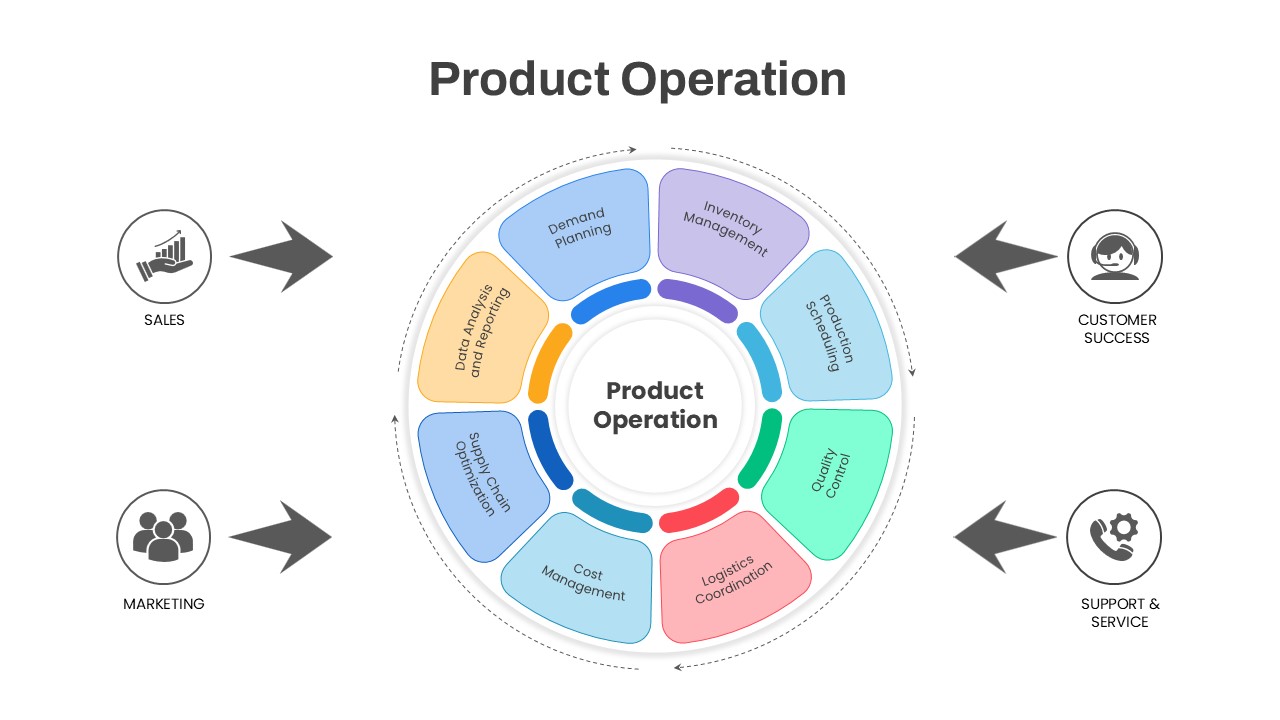
Product Operation Process Diagram Template for PowerPoint & Google Slides
Process
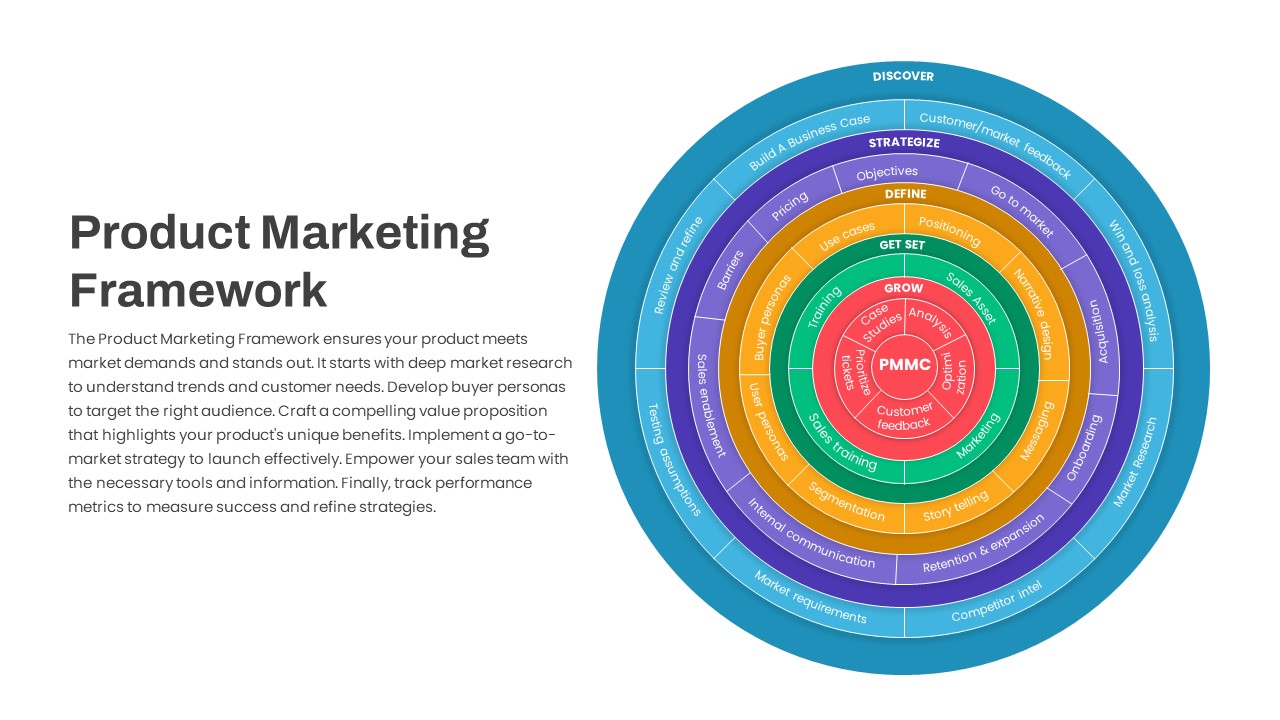
Product Marketing Framework Circular Template for PowerPoint & Google Slides
Circular
Product Feature Comparison Table Template for PowerPoint & Google Slides
Comparison Chart
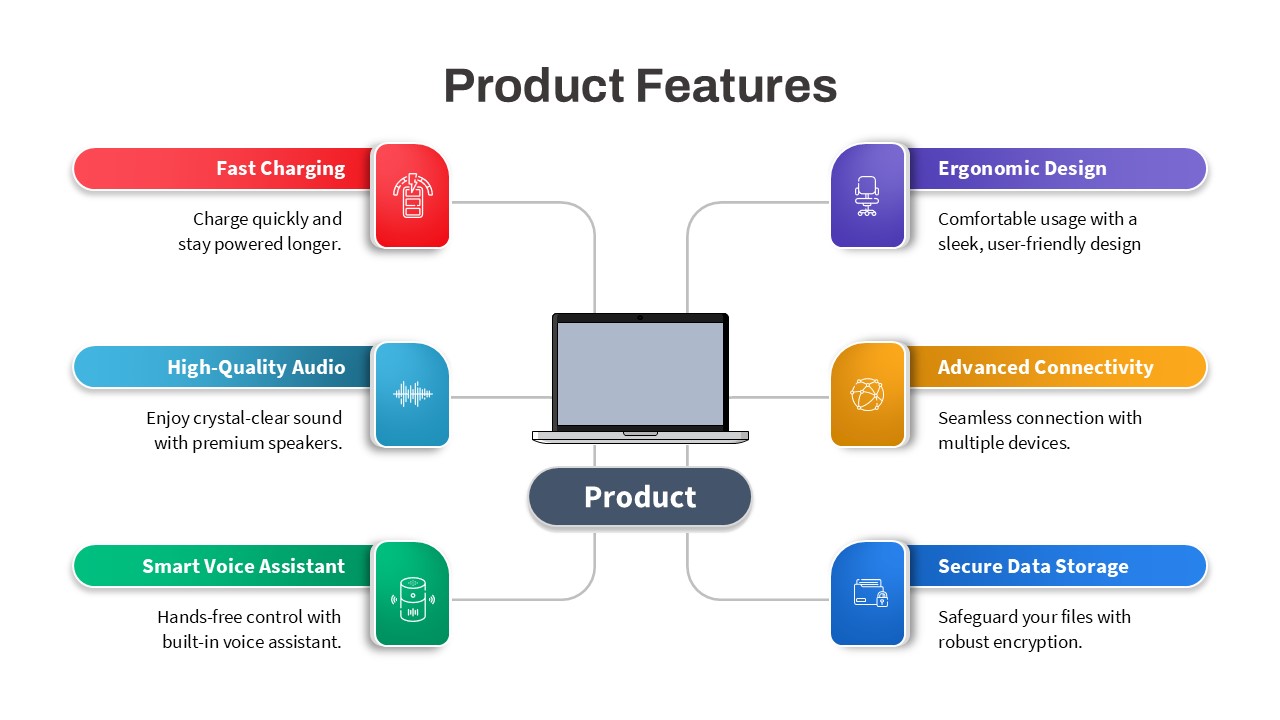
Product Features Diagram Template for PowerPoint & Google Slides
Process
Product Marketing Company Profile Deck Template for PowerPoint & Google Slides
Company Profile
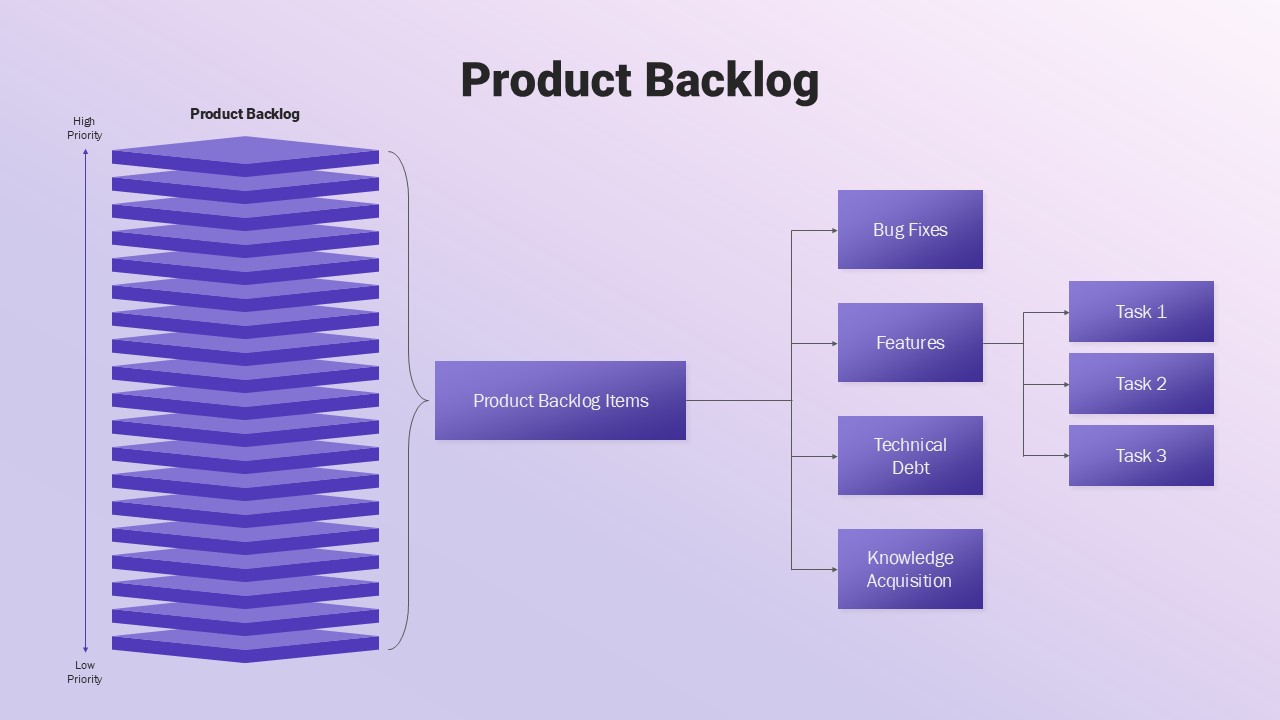
Product Backlog Diagram Template for PowerPoint & Google Slides
Software Development
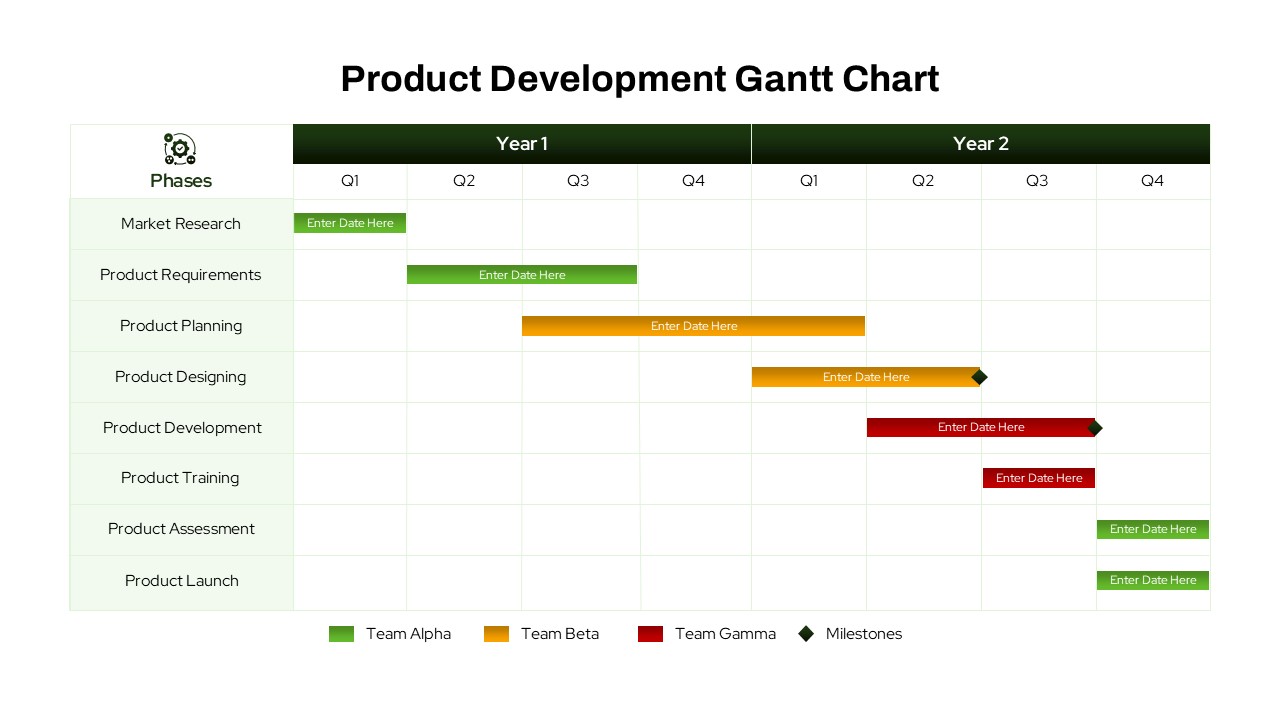
Product Development Gantt Chart template for PowerPoint & Google Slides
Gantt Chart
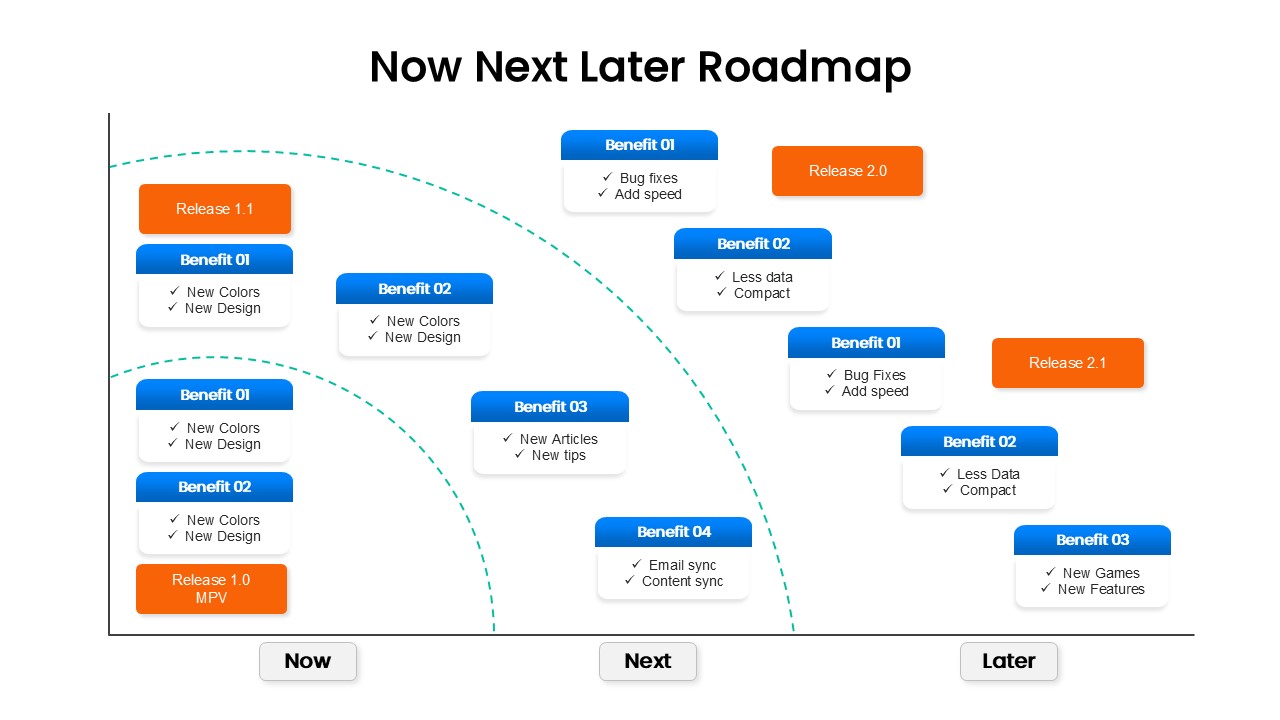
Now Next Later Product Roadmap with Releases Template for PowerPoint & Google Slides
Roadmap
Six Stage Product Development Process Template for PowerPoint & Google Slides
Software Development
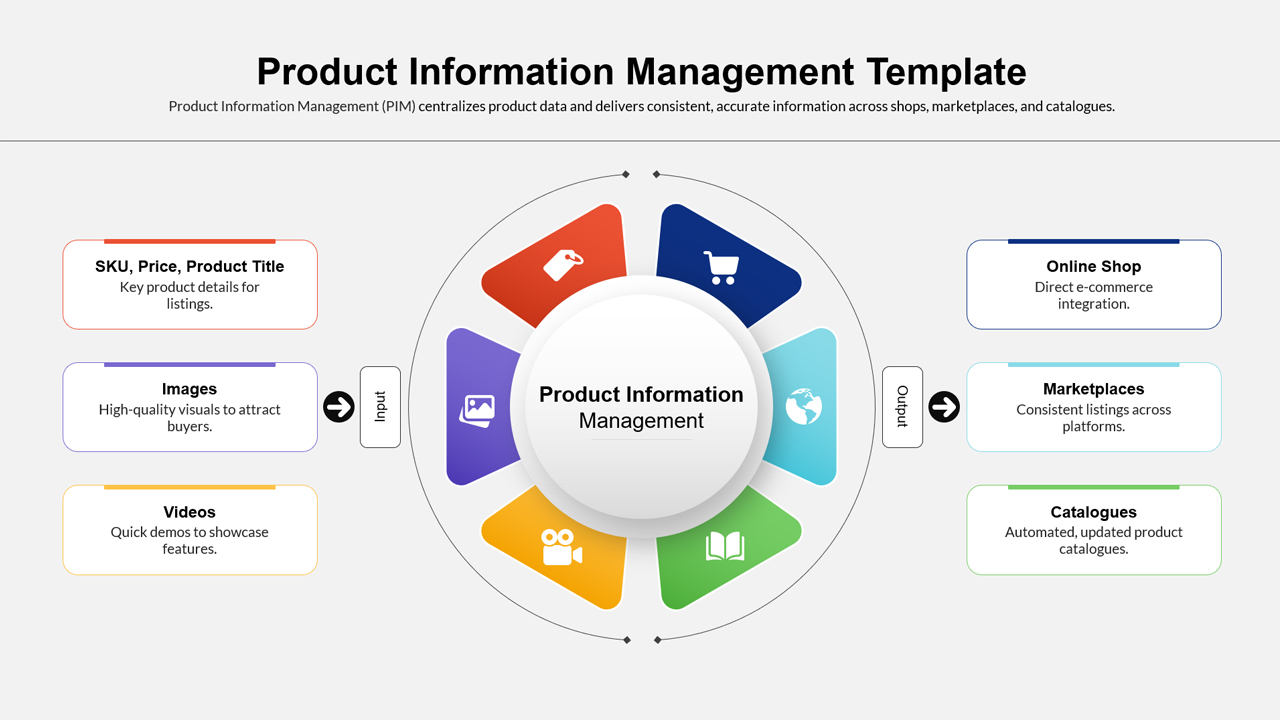
Product Information Management System Template for PowerPoint & Google Slides
Information Technology
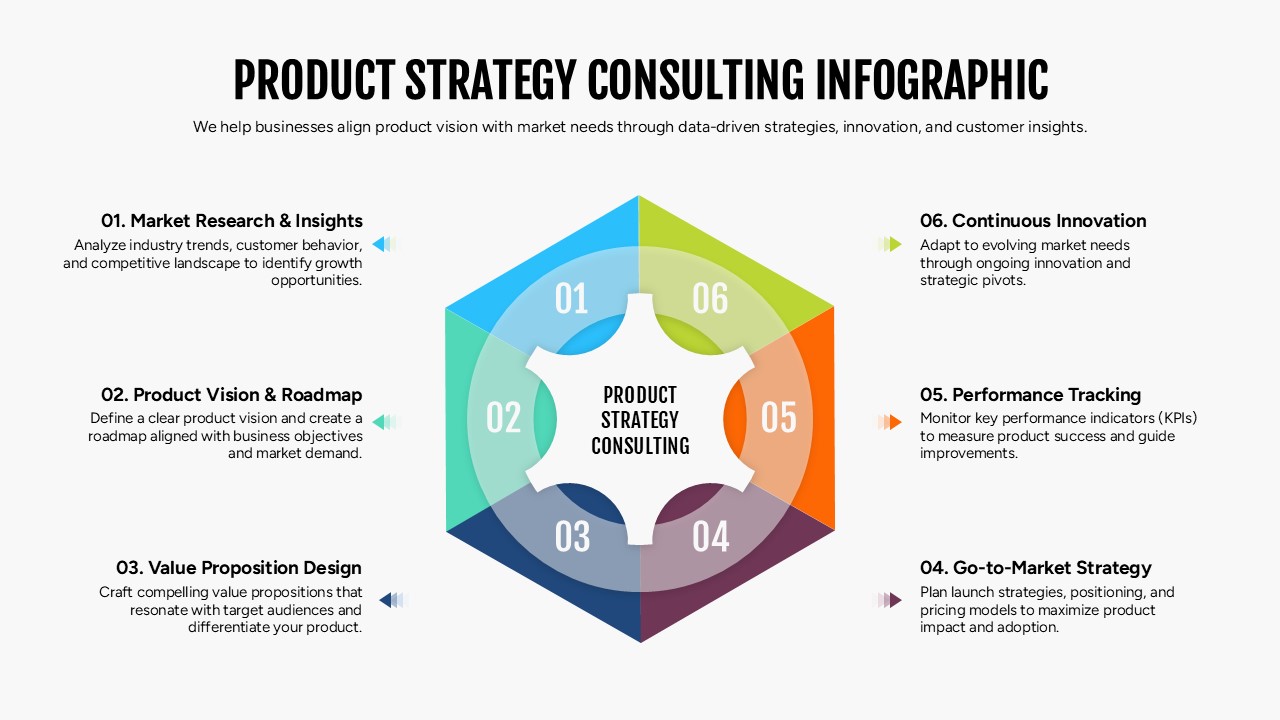
Product Strategy Consulting Infographic Template for PowerPoint & Google Slides
Consulting
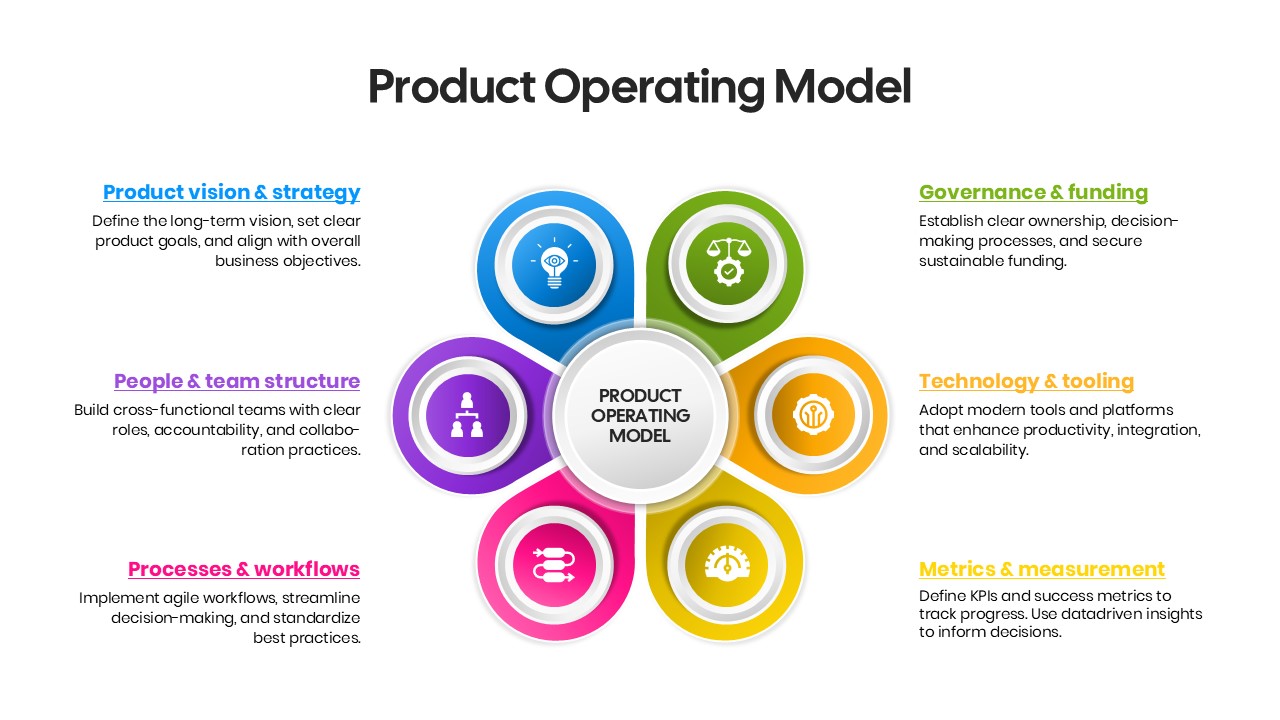
Product Operating Model Framework Template for PowerPoint & Google Slides
Business Strategy
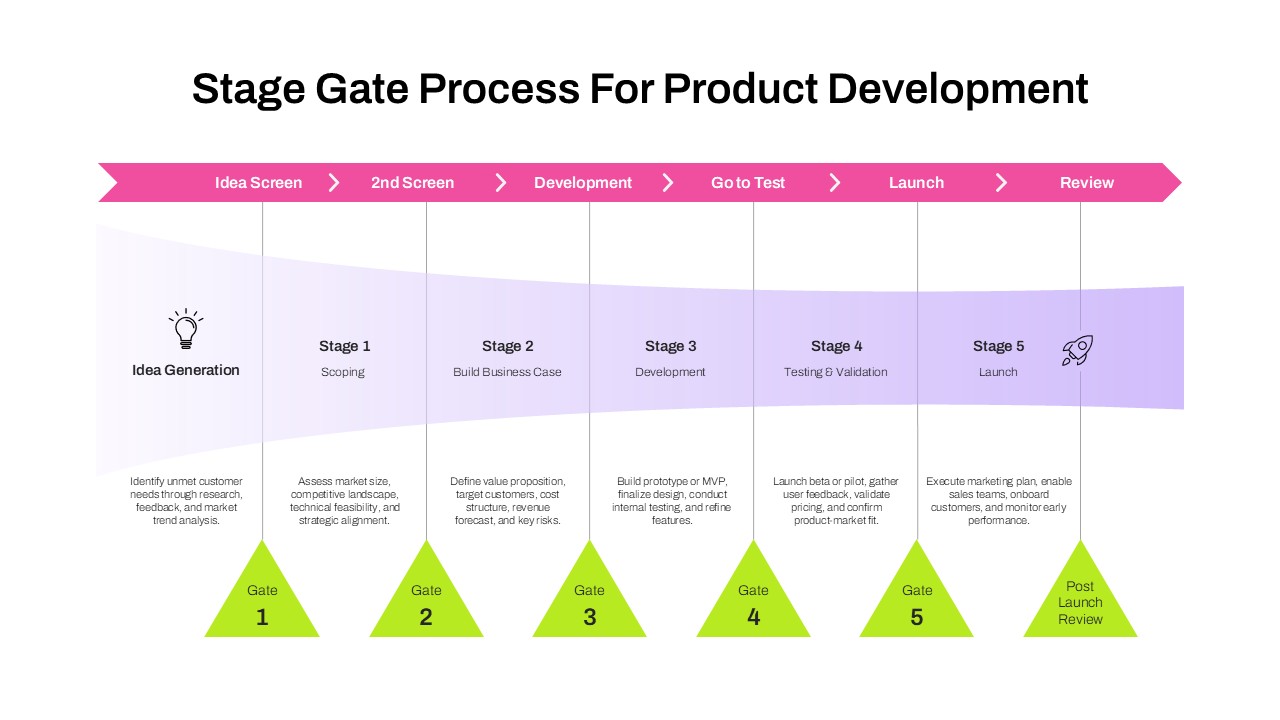
Stage Gate Process for Product Development Template for PowerPoint & Google Slides
Process
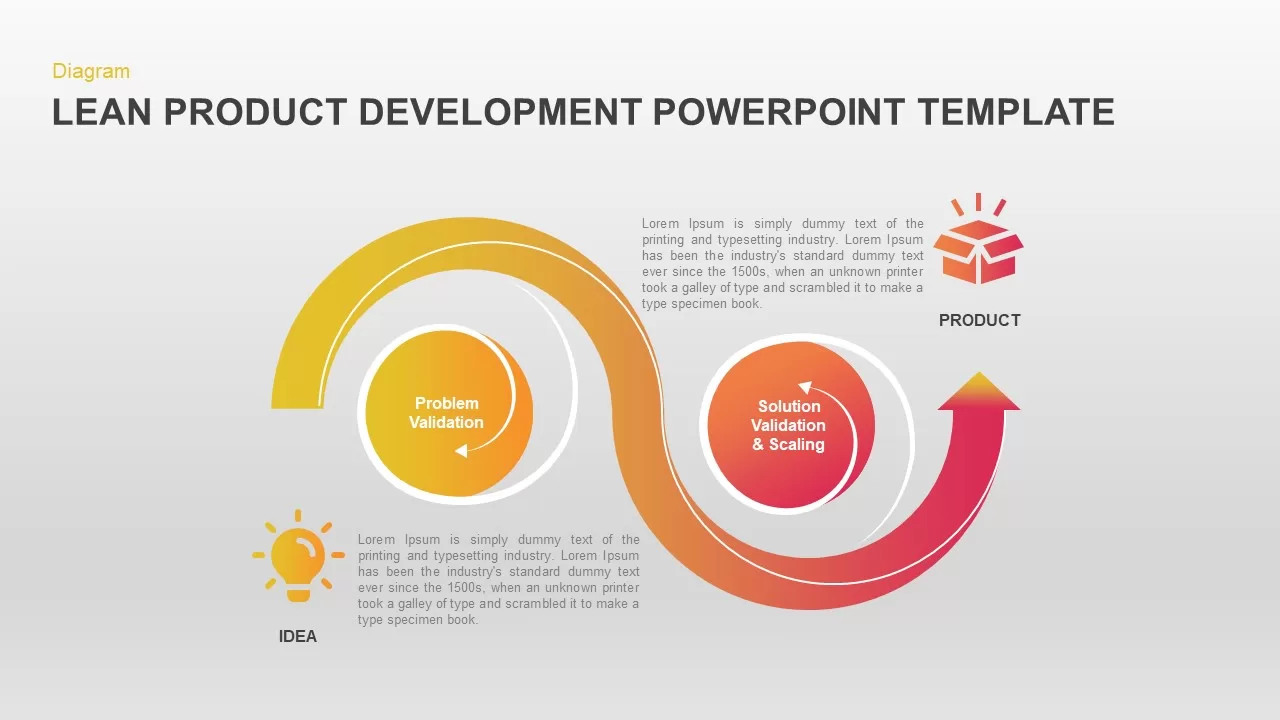
Lean Product Development Process diagram for PowerPoint & Google Slides
Business
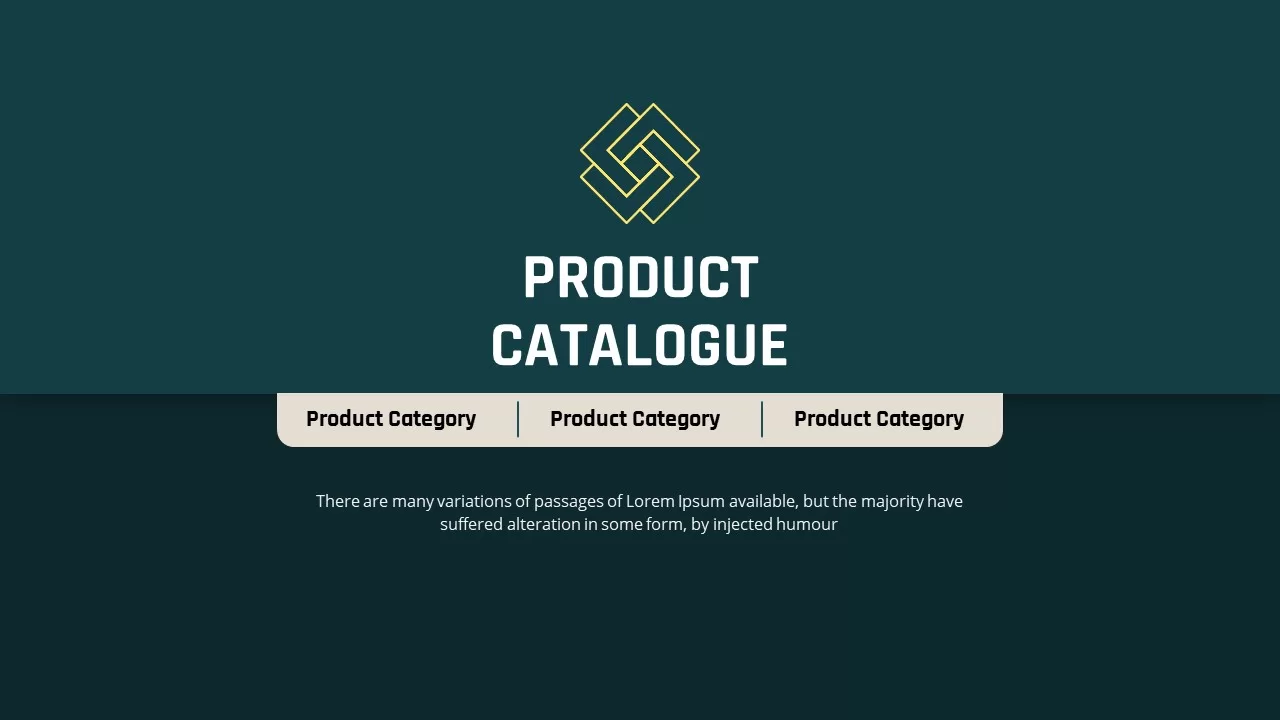
Product Catalog Slide Presentation for PowerPoint & Google Slides
Decks
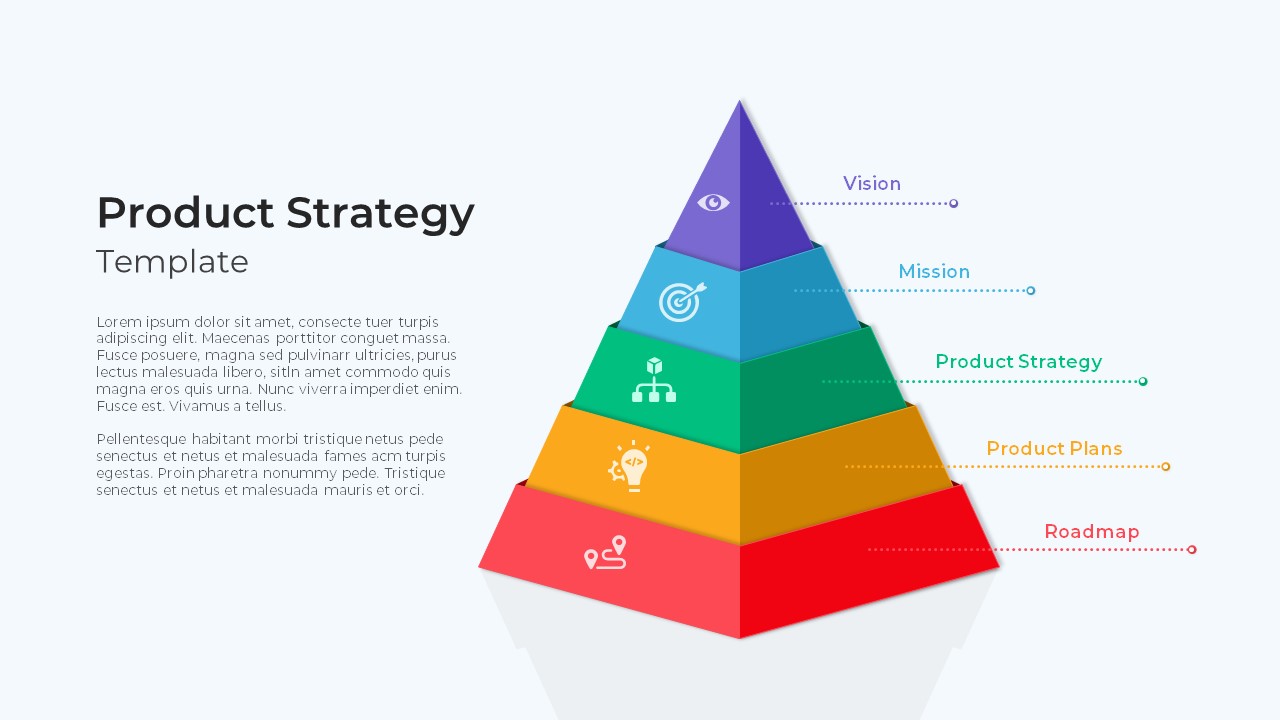
Product Strategy Pyramid Diagram for PowerPoint & Google Slides
Business Strategy
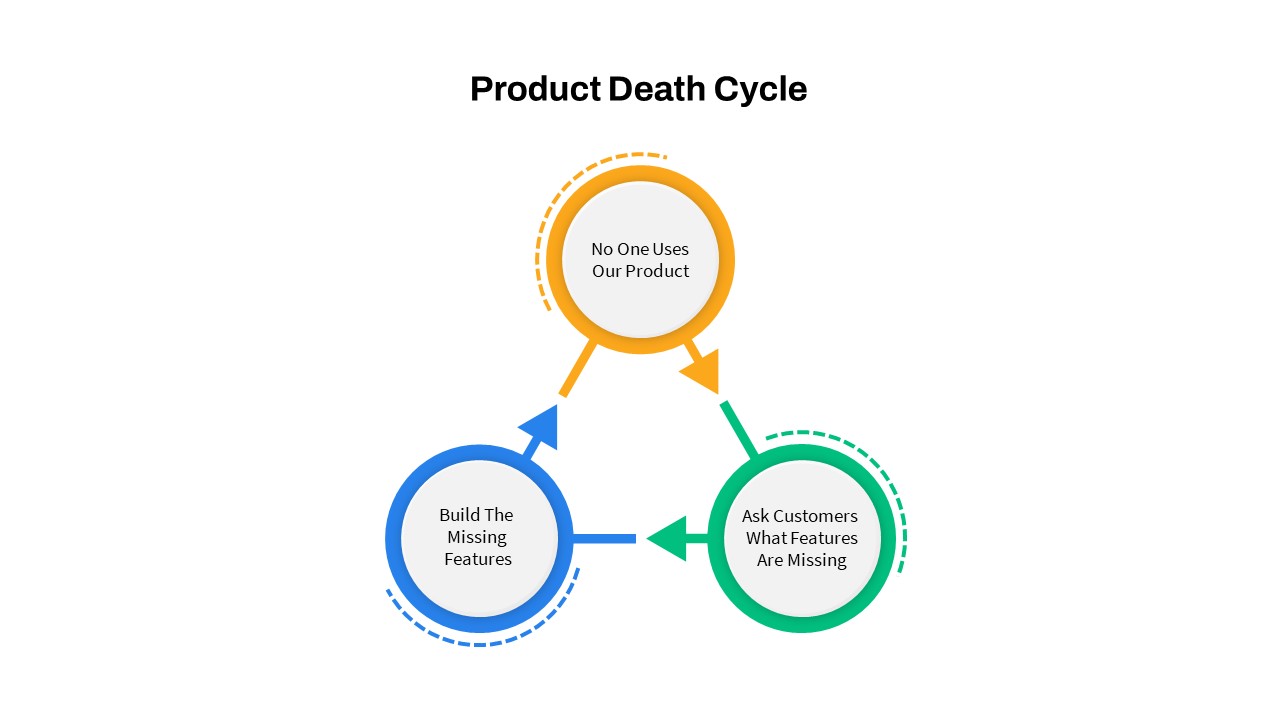
Product Death Cycle Diagram Slide for PowerPoint & Google Slides
Circular
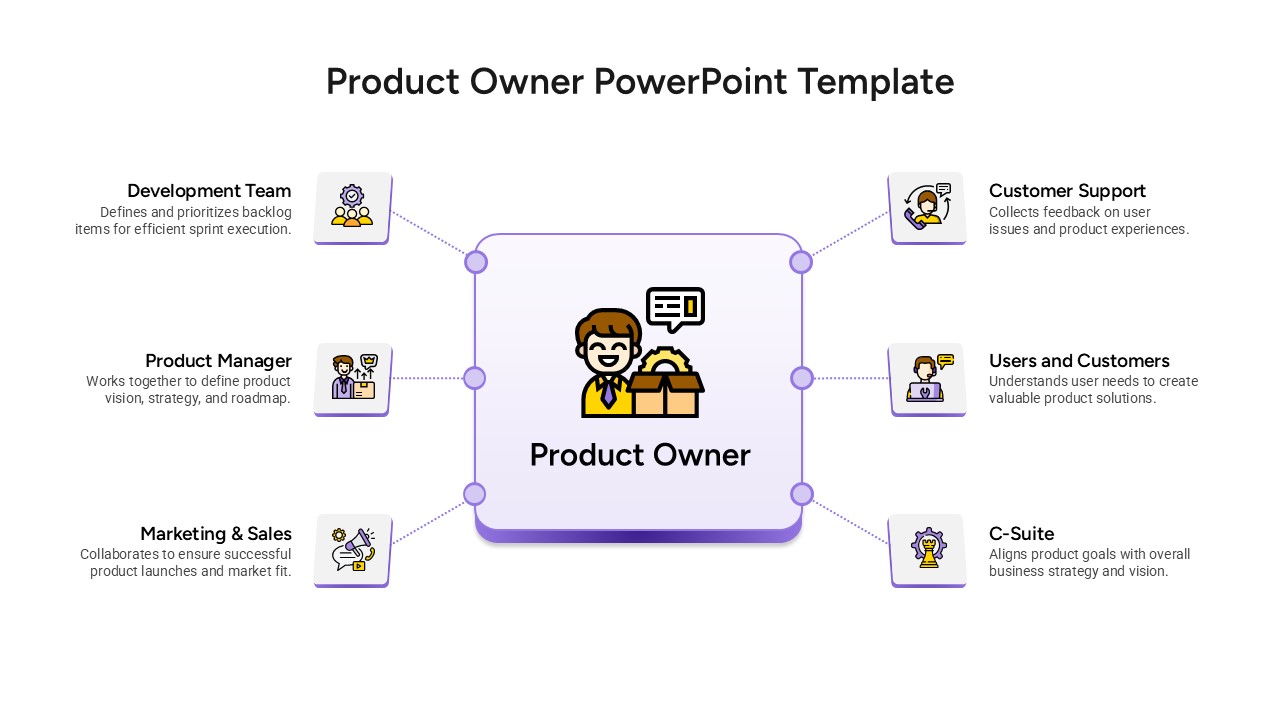
Product Owner Role and Responsibilities for PowerPoint & Google Slides
Business Plan
MVP Product Roadmap Delivery Dashboard for PowerPoint & Google Slides
Roadmap