Process Comparison Chart for PowerPoint & Google Slides

Description
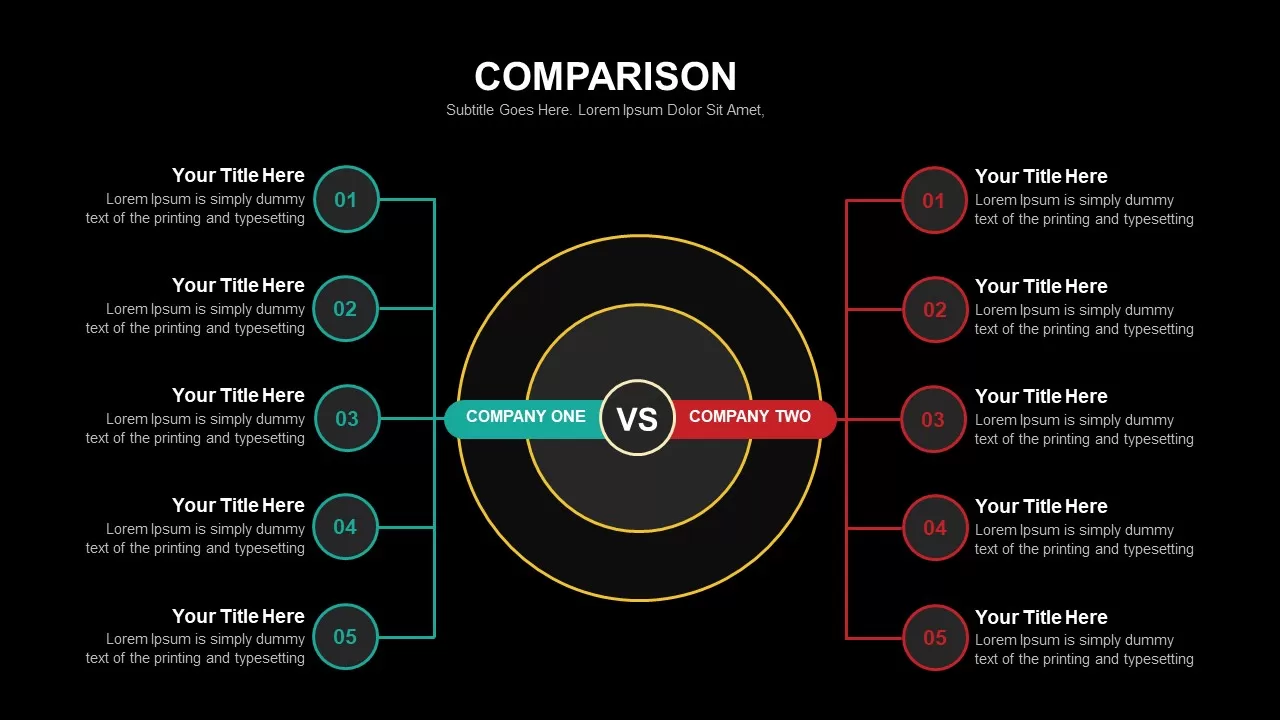
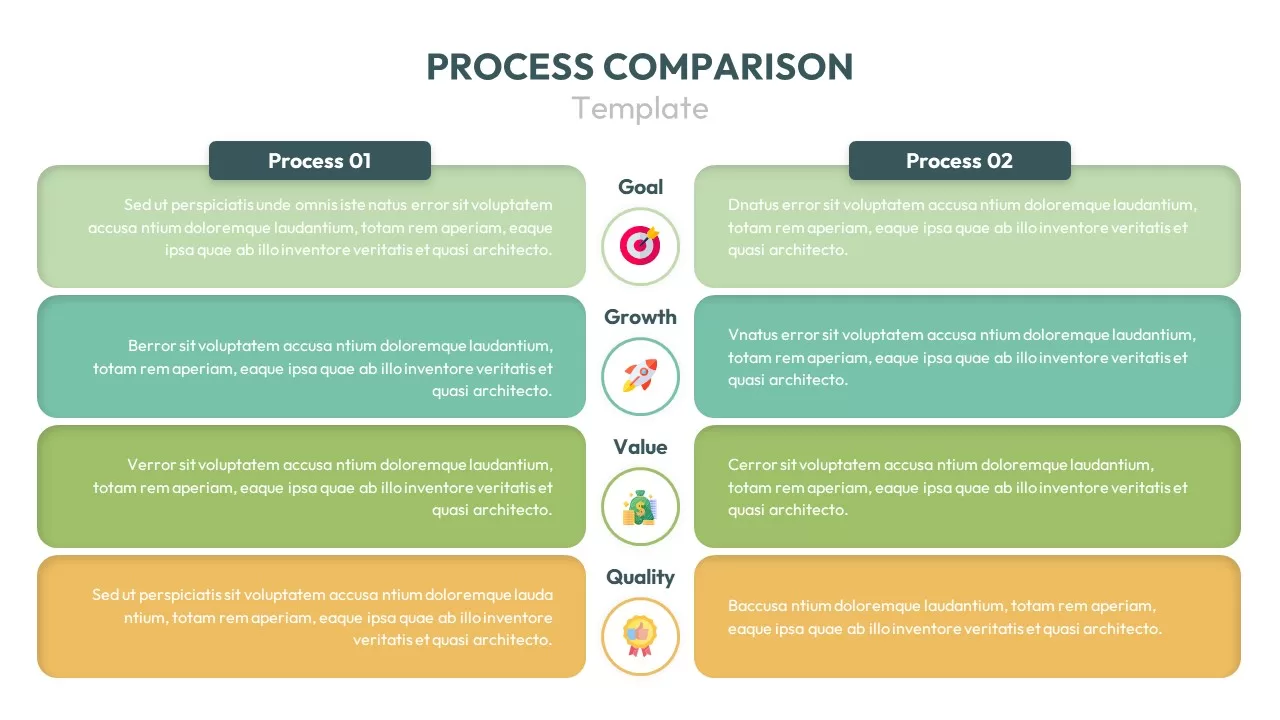
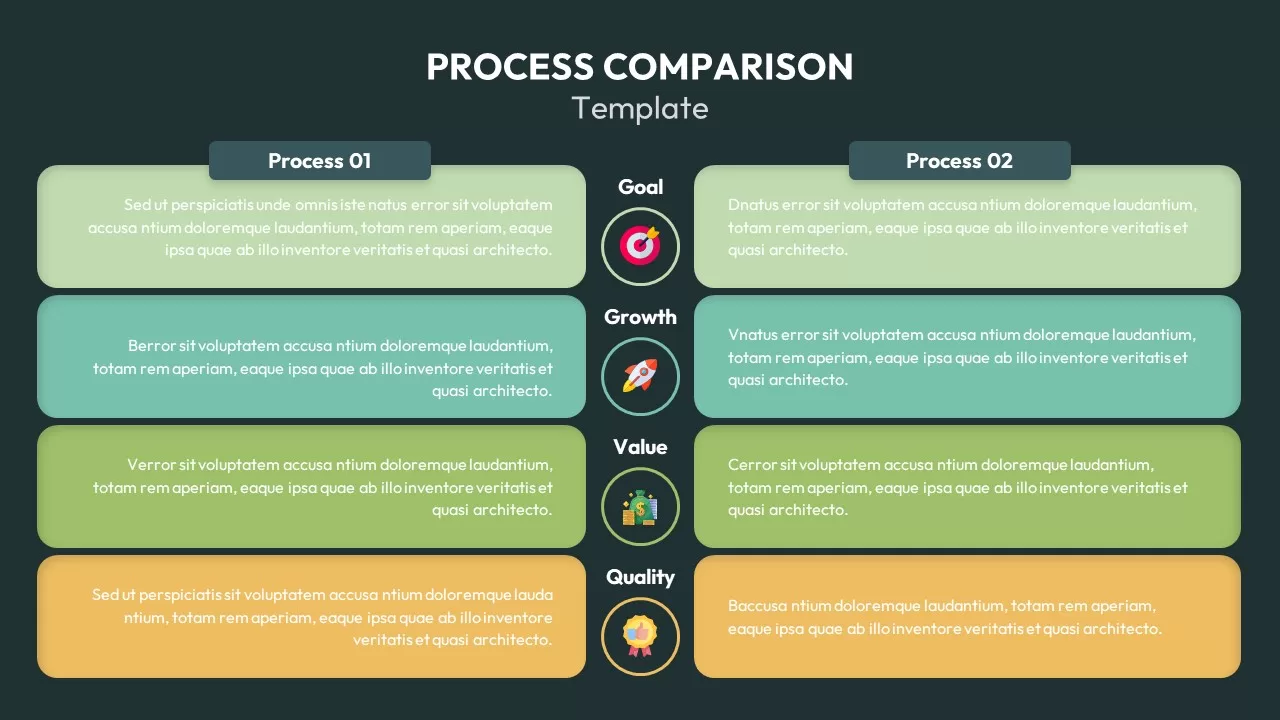
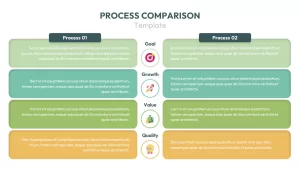
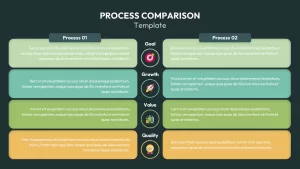
This “Process Comparison Chart” template provides a structured layout for comparing two processes across multiple categories such as goals, growth, value, and quality. Designed to facilitate clear side-by-side analysis, this template helps visualize strengths and weaknesses between two distinct processes or systems. It helps teams run clear side by side evaluations, and it fits neatly within broader needs covered in the comparison templates collection. Each section is color-coded and includes icons to represent key aspects such as growth, value, and quality, making it easy to highlight differences or similarities between Process 01 and Process 02.
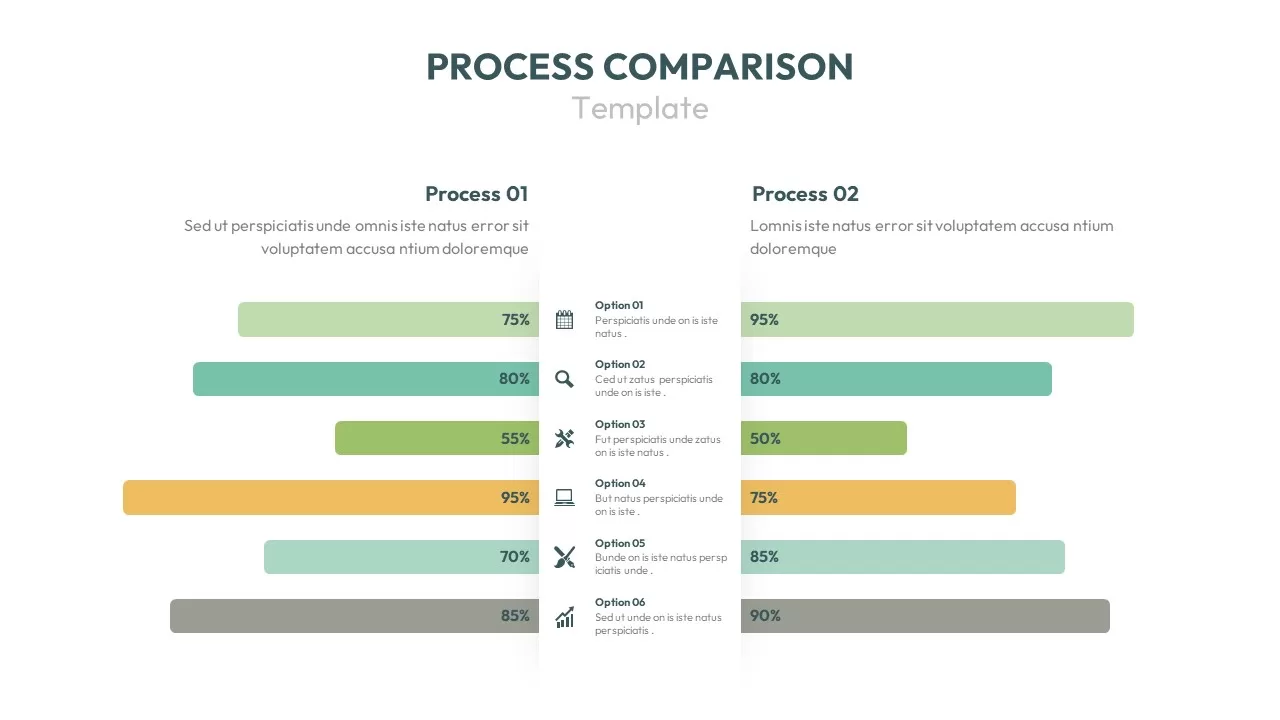
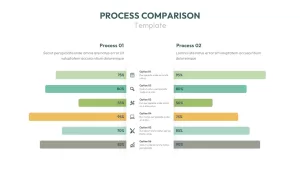
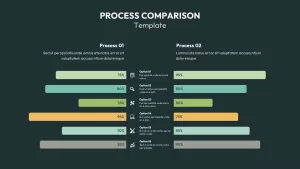
The template’s visual appeal and intuitive design allow users to quickly add relevant information for an efficient comparison. The second slide utilizes a progress bar format for performance evaluation, showing percentages for each process’s performance across various options. The final slides allow for customizable text and graphical elements, ensuring the comparison is adaptable to any business process, project analysis, or operational evaluation.
Who is it for
This template is ideal for operations managers, project managers, business analysts, and consultants who need to compare and contrast different workflows, systems, or processes. It’s also useful for teams working in process improvement, project planning, product development, and performance analysis.
Other Uses
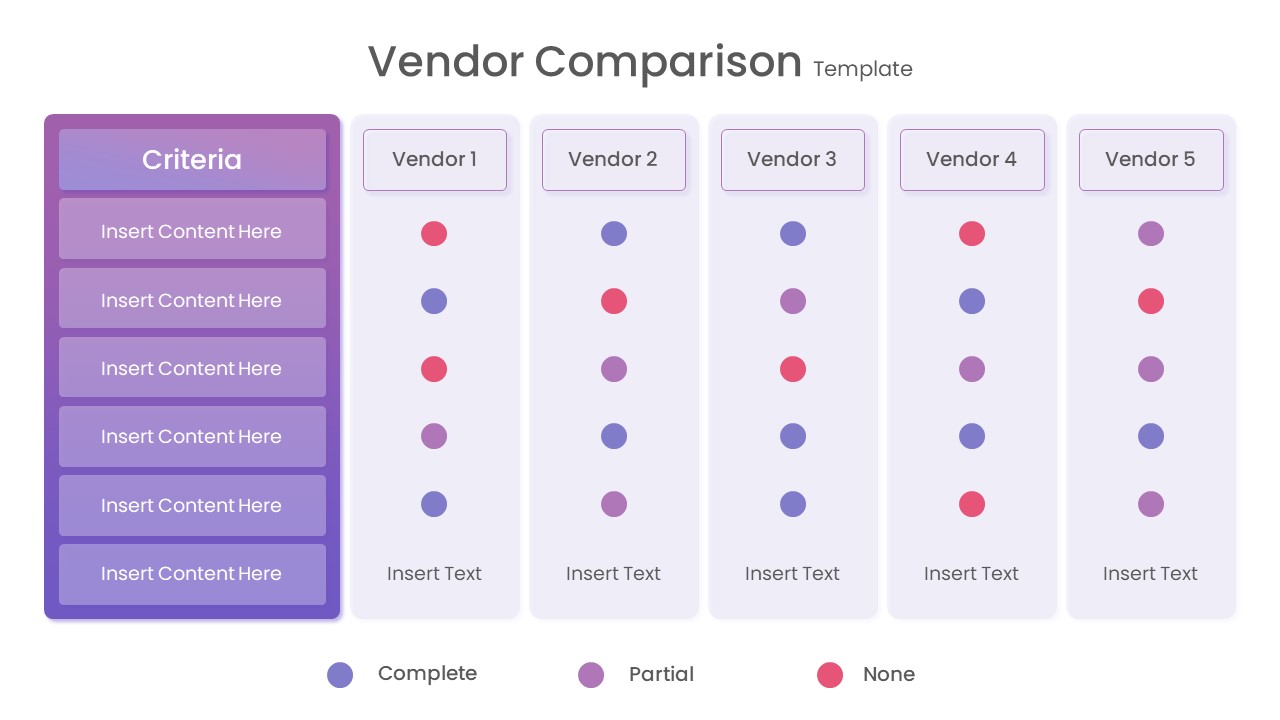
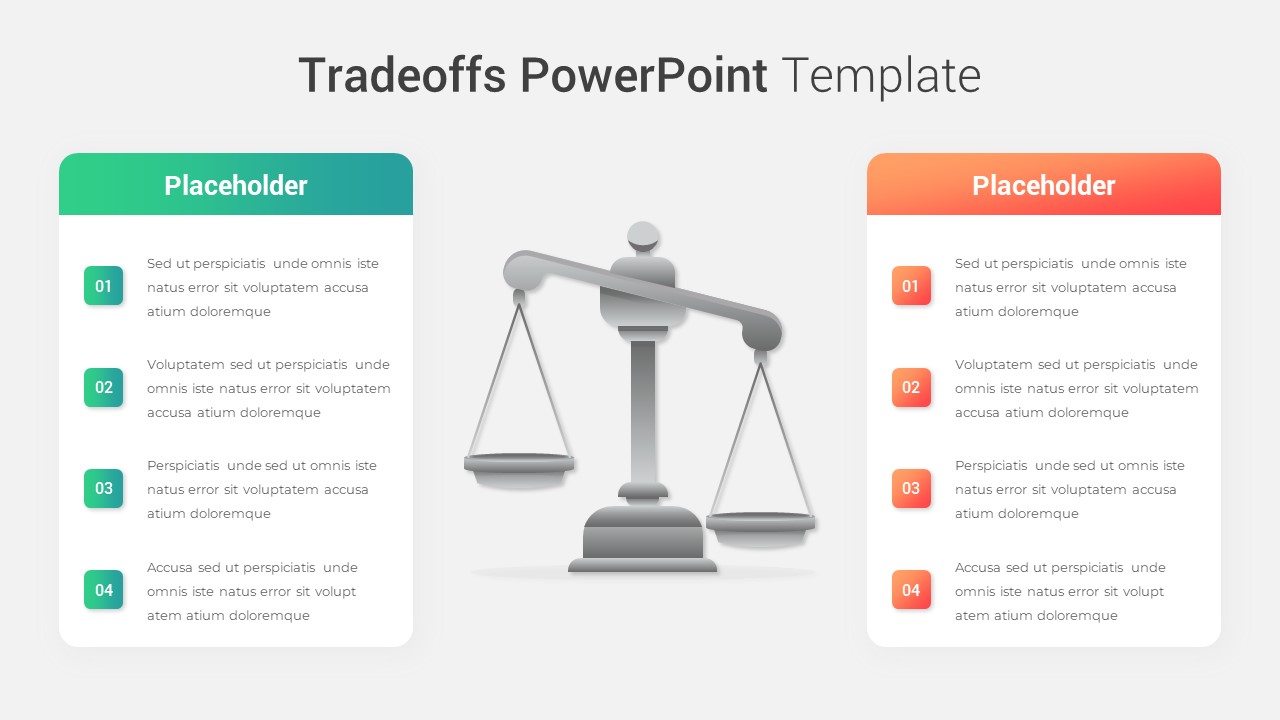
Beyond business process comparisons, this template can support product comparison or vendor evaluations in a structured way. Teams working on process optimization may find it helpful when paired with tools such as the tornado chart data comparison for visual scoring in decision workflows. It can guide educational or research based comparisons too, especially when a framework like the feasibility matrix comparison is needed to validate options across multiple criteria.
Login to download this file

Item ID
SB02419
Related Templates

Comparison Bar Chart template for PowerPoint & Google Slides
Comparison Chart
Four Section Comparison Chart Diagram Template for PowerPoint & Google Slides
Infographics
Interactive Product Comparison Bar Chart Template for PowerPoint & Google Slides
Bar/Column
Comparison Chart Overview template for PowerPoint & Google Slides
Comparison Chart
Tornado Chart Data Comparison Slide Template for PowerPoint & Google Slides
Bar/Column
Radar Chart Product Comparison Template for PowerPoint & Google Slides
Comparison Chart

BMI Category Comparison Chart Template for PowerPoint & Google Slides
Comparison
Circular Product Comparison Chart Template for PowerPoint & Google Slides
Comparison Chart
Pugh Matrix Decision Comparison Chart Template for PowerPoint & Google Slides
Comparison Chart
Dynamic Benchmarking Comparison Chart Template for PowerPoint & Google Slides
Comparison Chart
People Demographic Comparison Chart Template for PowerPoint & Google Slides
Comparison
Clustered Bar Chart Comparison Template for PowerPoint & Google Slides
Bar/Column
Business Timeline Comparison Bar Chart Template for PowerPoint & Google Slides
Comparison Chart
Grouped Column Chart Comparison Template for PowerPoint & Google Slides
Bar/Column
Multiple Line Chart Comparison Template for PowerPoint & Google Slides
Comparison Chart
Mirror Bar Chart Comparison Template for PowerPoint & Google Slides
Bar/Column
Free Versatile Product Comparison Chart Template for PowerPoint & Google Slides
Charts
Free
Dynamic Bar-of-Pie Chart Comparison Template for PowerPoint & Google Slides
Pie/Donut
ESG Initiatives Comparison Chart Template for PowerPoint & Google Slides
Business
Quarterly Revenue Comparison Bar Chart Template for PowerPoint & Google Slides
Bar/Column
Competitor Comparison Chart Design Template for PowerPoint & Google Slides
Comparison
Two-Option Bar Chart Comparison Table Template for PowerPoint & Google Slides
Comparison
Profile Comparison Chart template for PowerPoint & Google Slides
Comparison Chart
Sales Growth Comparison Chart & Table Template for PowerPoint & Google Slides
Bar/Column
Skills Gap Analysis Comparison Chart Template for PowerPoint & Google Slides
Gap
Feasibility Matrix Comparison Chart Template for PowerPoint & Google Slides
Comparison Chart
Quarterly Comparison Pie Chart Template for PowerPoint & Google Slides
Pie/Donut

Comparison Donut Chart PowerPoint Template and Keynote
Pie/Donut
Service Zoom Feature Slides Comparison template for PowerPoint & Google Slides
Process
Simple Comparison Table Template for PowerPoint & Google Slides
Comparison
Speedometer Infographic Gauge Comparison Template for PowerPoint & Google Slides
Comparison
Clean Mobile Service Comparison Slide Template for PowerPoint & Google Slides
Comparison

Success vs Failure Comparison Diagram Template for PowerPoint & Google Slides
Comparison
Scale Metaphor Metrics Comparison Template for PowerPoint & Google Slides
Charts
Dual Percentage Comparison Metaphor Template for PowerPoint & Google Slides
Comparison
Dynamic Multicolor Comparison Table Template for PowerPoint & Google Slides
Comparison
Five-Option Text Boxes Table Comparison Template for PowerPoint & Google Slides
Business Report
Pros and Cons Comparison Slide Template for PowerPoint & Google Slides
Comparison
Seller Portals Comparison Infographic Template for PowerPoint & Google Slides
Process
Fact and Figures Comparison Slide Template for PowerPoint & Google Slides
Business Report
Four Business Structure Types Comparison Diagram Template for PowerPoint & Google Slides
Business Strategy
Generations Comparison Infographic Template for PowerPoint & Google Slides
Timeline
Manpower Planning Concept Comparison Template for PowerPoint & Google Slides
Comparison Chart
RAG Status Infographic Comparison Template for PowerPoint & Google Slides
Project
Yin Yang Comparison template for PowerPoint & Google Slides
Business
Comparison Infographic Overview template for PowerPoint & Google Slides
Business
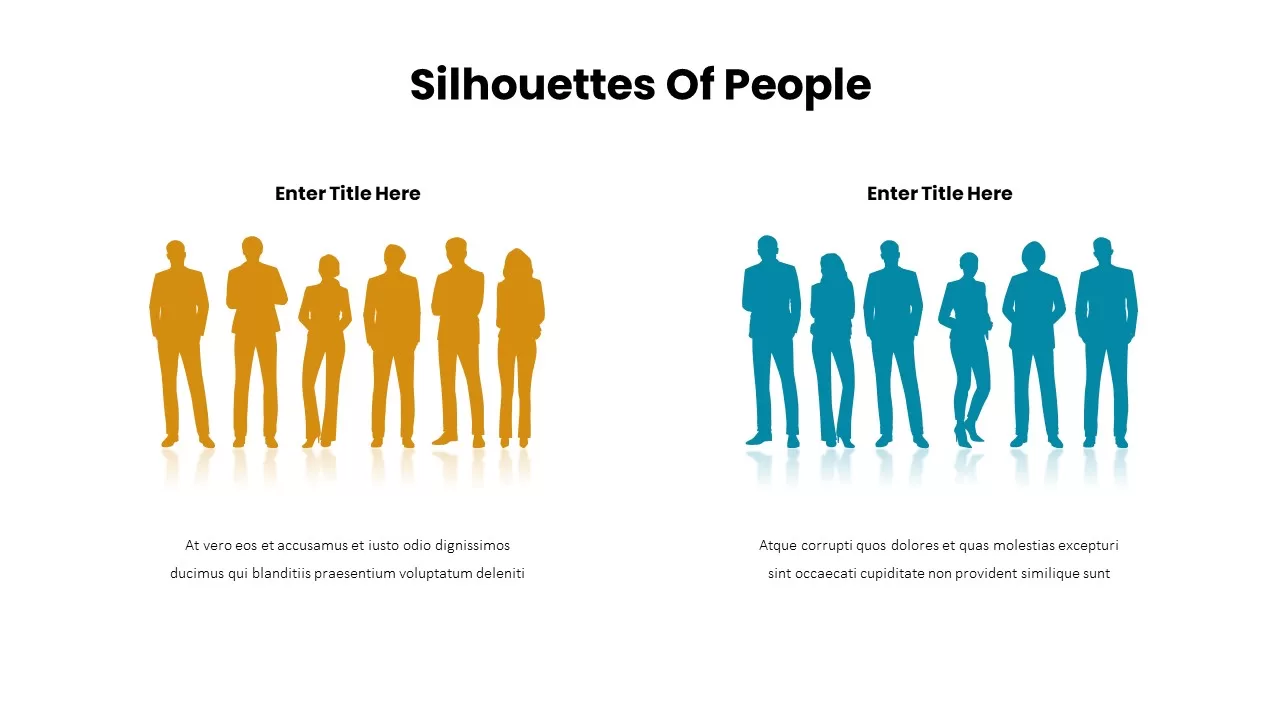
Business Silhouettes Comparison Slide Template for PowerPoint & Google Slides
HR
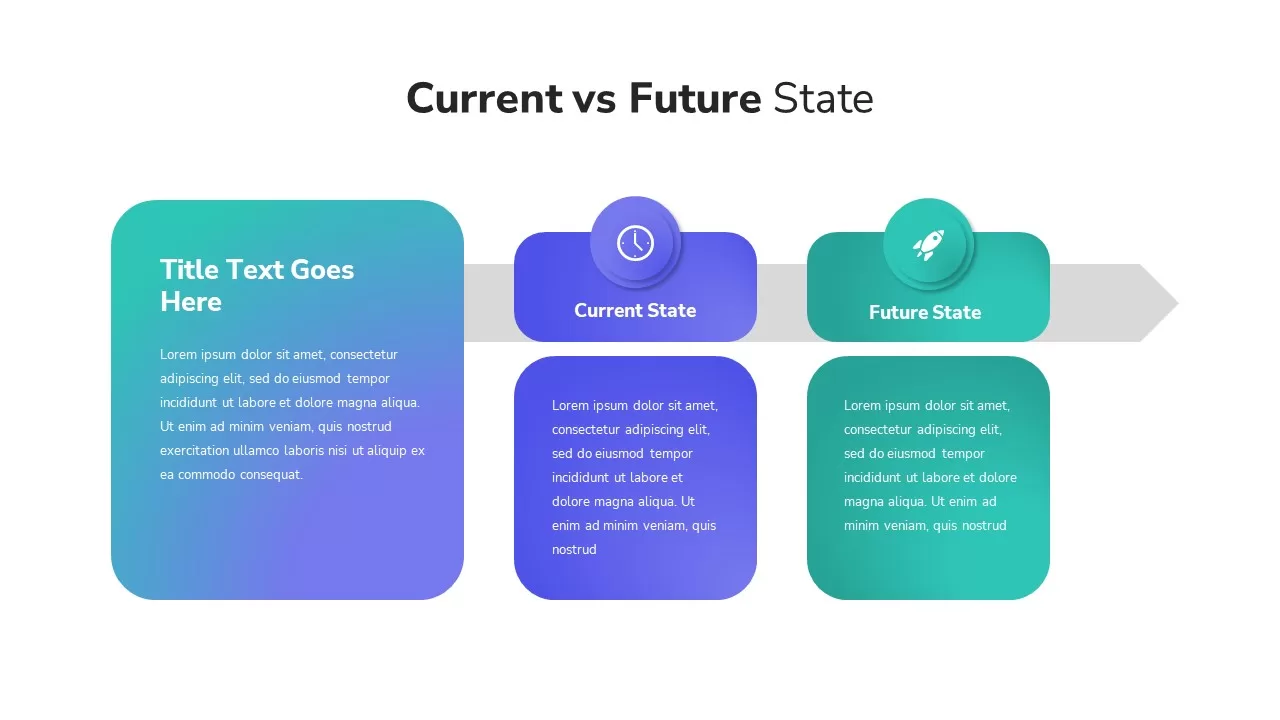
Current vs Future State Comparison Slide Template for PowerPoint & Google Slides
Comparison Chart
Current vs Future State Comparison Template for PowerPoint & Google Slides
Comparison Chart
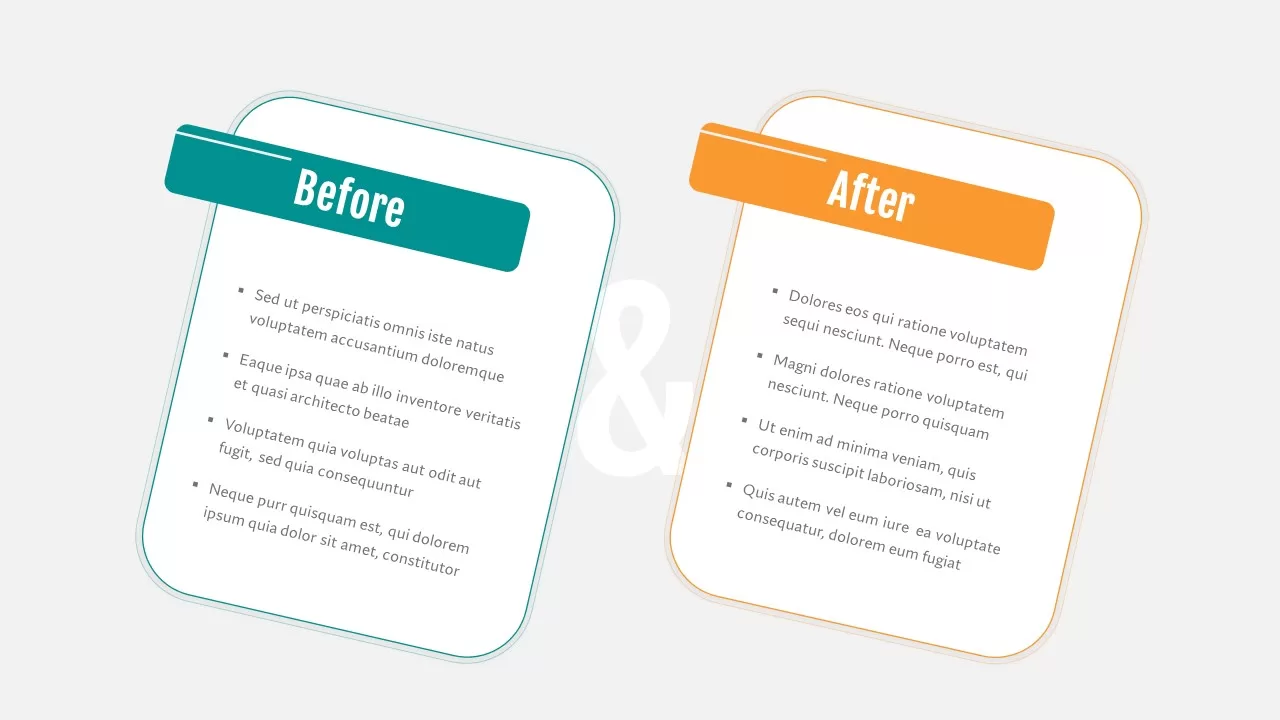
Before and After Comparison Infographic Template for PowerPoint & Google Slides
Comparison
Free
Before and After Comparison Slide Template for PowerPoint & Google Slides
Comparison
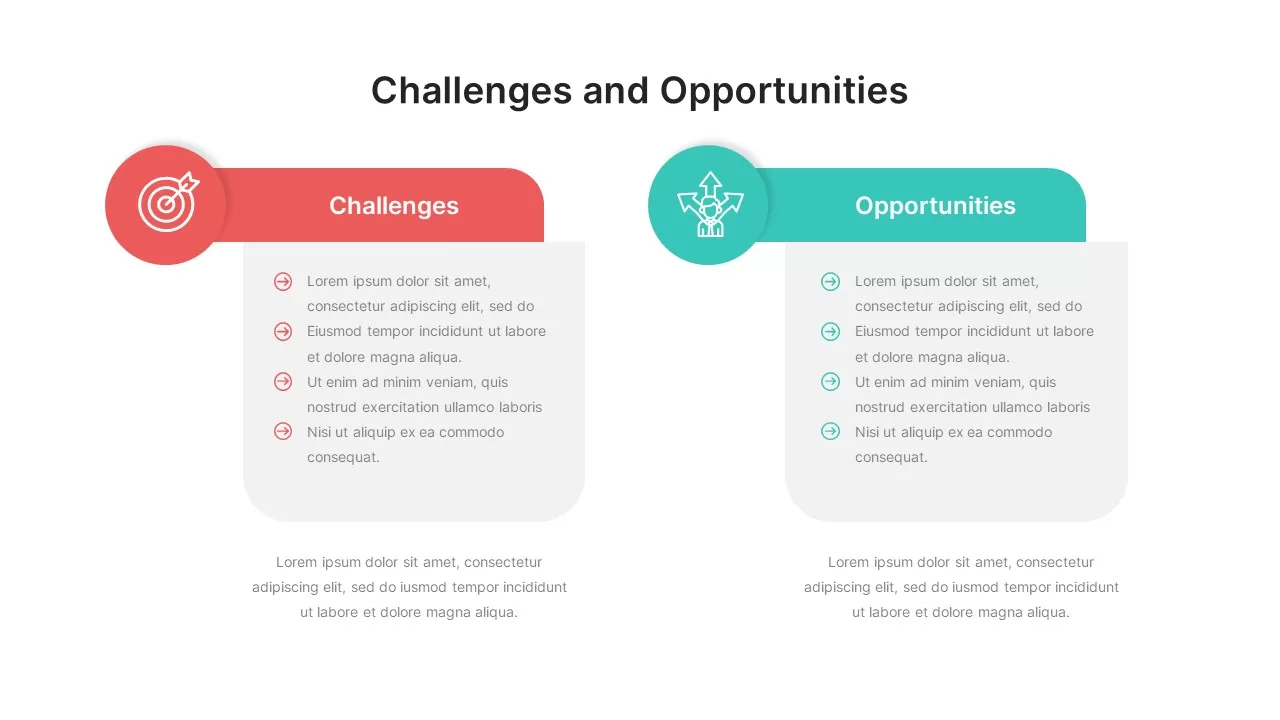
Challenges & Opportunities Comparison Template for PowerPoint & Google Slides
Opportunities Challenges
Opportunities Hub-and-Spoke Comparison Diagram Template for PowerPoint & Google Slides
Opportunities Challenges
Modern Before and After Comparison Template for PowerPoint & Google Slides
Infographics
Benchmarking Metrics Comparison Slide Template for PowerPoint & Google Slides
Pie/Donut
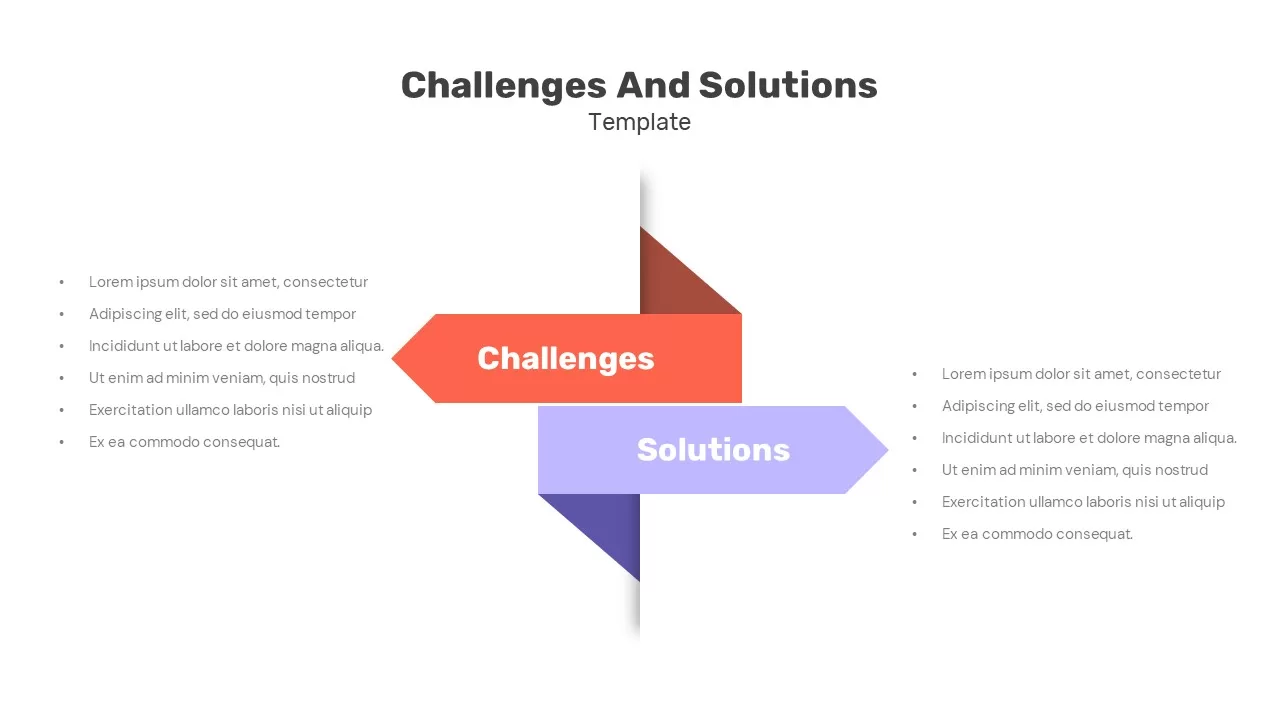
Challenges & Solutions Comparison Template for PowerPoint & Google Slides
Opportunities Challenges
Challenges and Opportunities Comparison Slide for PowerPoint & Google Slides
Opportunities Challenges
Challenges and Solutions Comparison Slide for PowerPoint & Google Slides
Opportunities Challenges
Adam’s Equity Theory Scale Comparison Template for PowerPoint & Google Slides
Comparison
Heatmap Comparison Template for PowerPoint & Google Slides
Maps
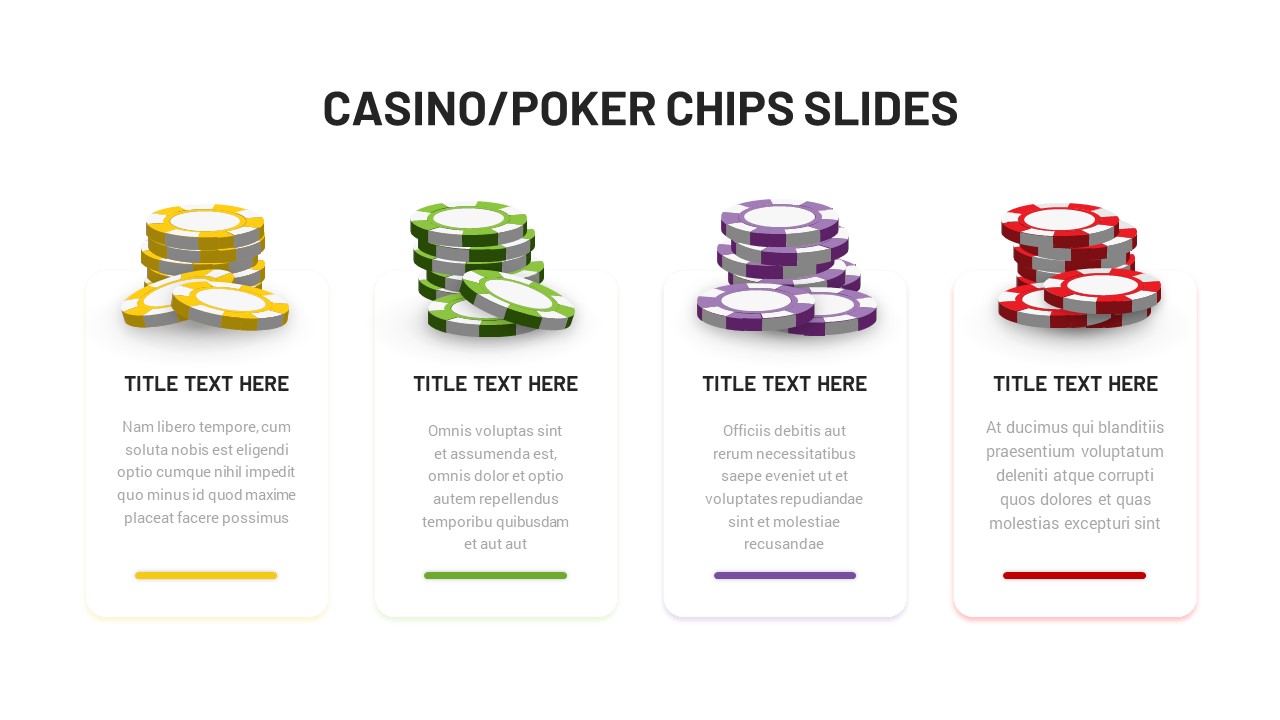
Casino Poker Chips Comparison Slide Template for PowerPoint & Google Slides
Comparison
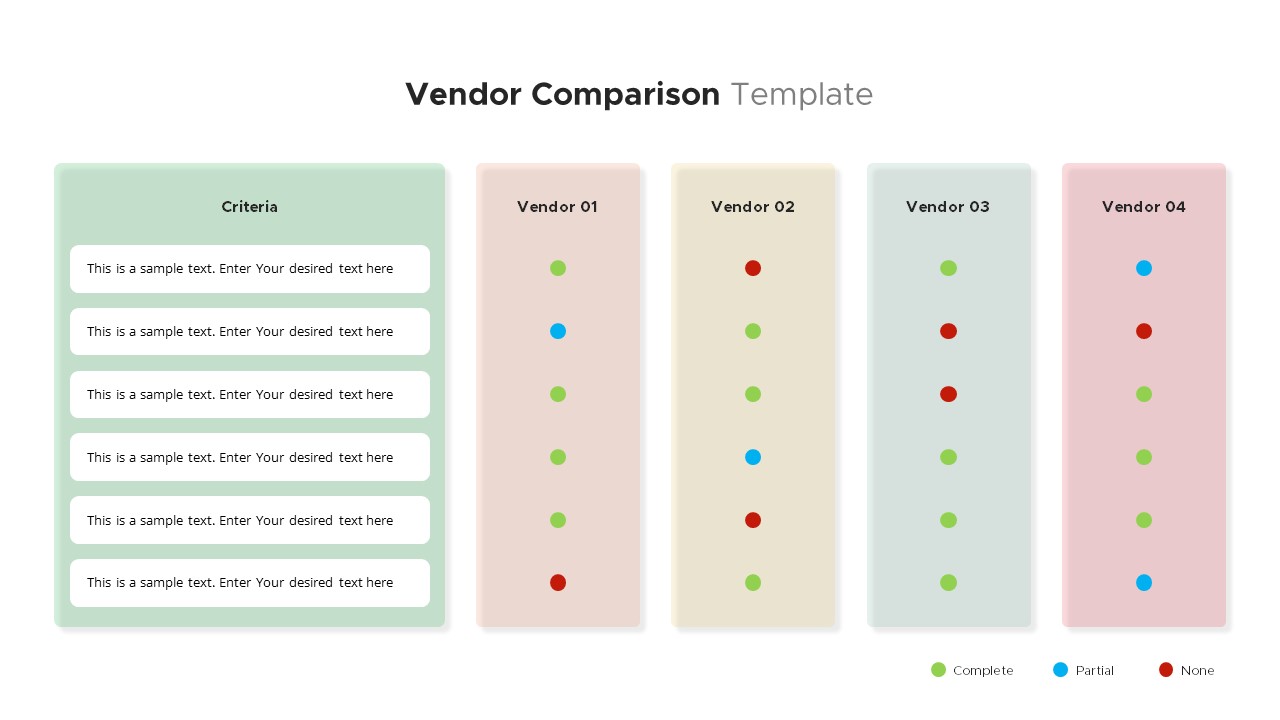
Vendor Comparison Slide for PowerPoint & Google Slides
Comparison
Vendor Comparison for PowerPoint & Google Slides
Business Models
Vendor Comparison Matrix with High-Level Requirements template for PowerPoint & Google Slides
Comparison Chart
Modern Tradeoffs Comparison Slide Template for PowerPoint & Google Slides
Comparison
Popular Social Media Comparison Grid Template for PowerPoint & Google Slides
Digital Marketing
Blue vs Red Ocean Strategy Comparison Template for PowerPoint & Google Slides
Business Strategy
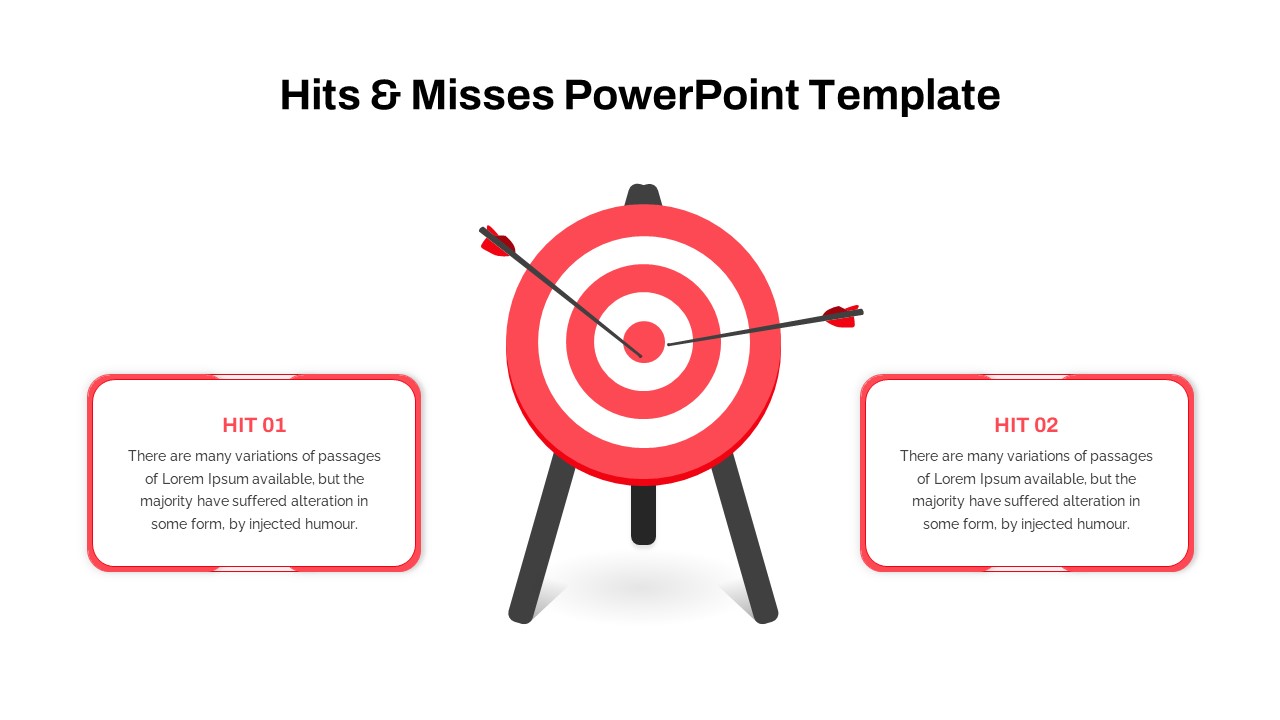
Hits and Misses Performance Comparison Template for PowerPoint & Google Slides
Comparison
Surgery Infographics Comparison Template for PowerPoint & Google Slides
Health
Free Business Review Comparison Slide for PowerPoint & Google Slides
Business Report
Free
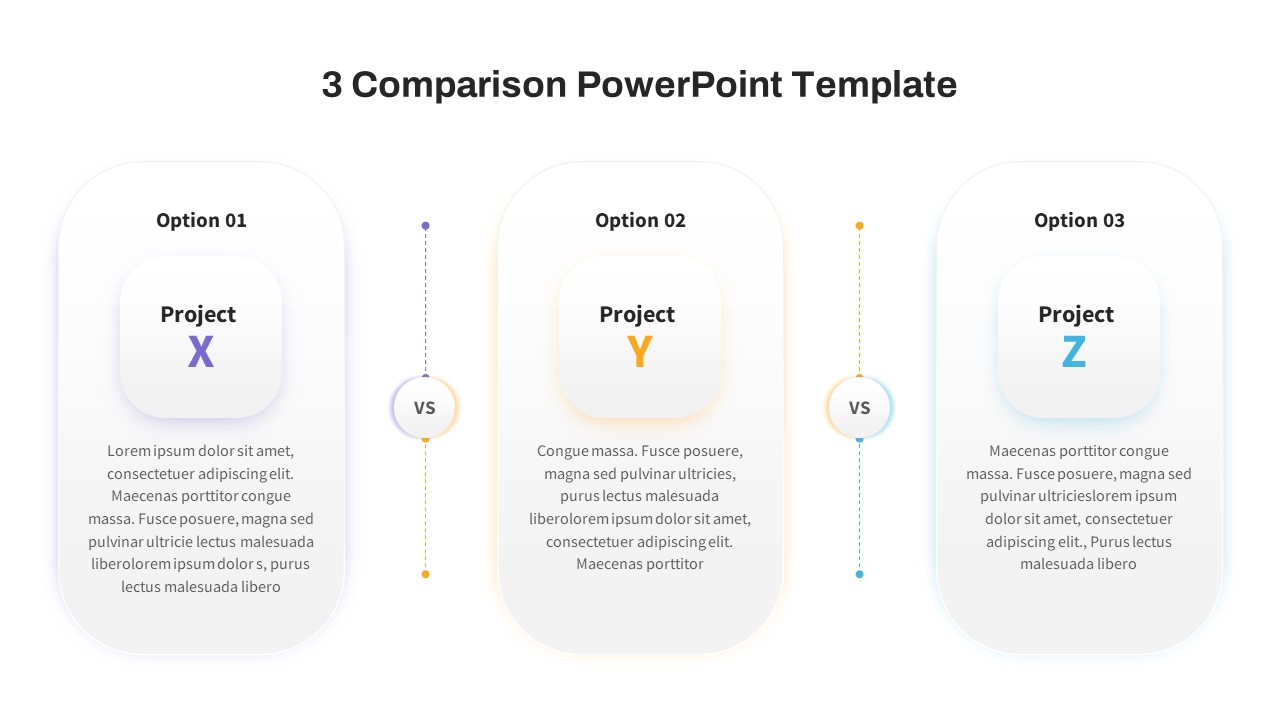
Free Three-Option Comparison Slide for PowerPoint & Google Slides
Comparison
Free
AI vs. Human Intelligence Comparison Template for PowerPoint & Google Slides
Comparison
Economies of Scale Cost Curve Comparison Template for PowerPoint & Google Slides
Comparison Chart
Hits & Misses Comparison Infographic Template for PowerPoint & Google Slides
Pitch Deck
Pricing Model Types Comparison Infographic Template for PowerPoint & Google Slides
Pitch Deck
Risk Level Gauge Comparison Dashboard Template for PowerPoint & Google Slides
Comparison
Cross Sell & Up Sell Strategy Comparison template for PowerPoint & Google Slides
Comparison
Product Feature Comparison Table Template for PowerPoint & Google Slides
Comparison Chart
Two-Sided Coin Comparison Diagram Template for PowerPoint & Google Slides
Comparison
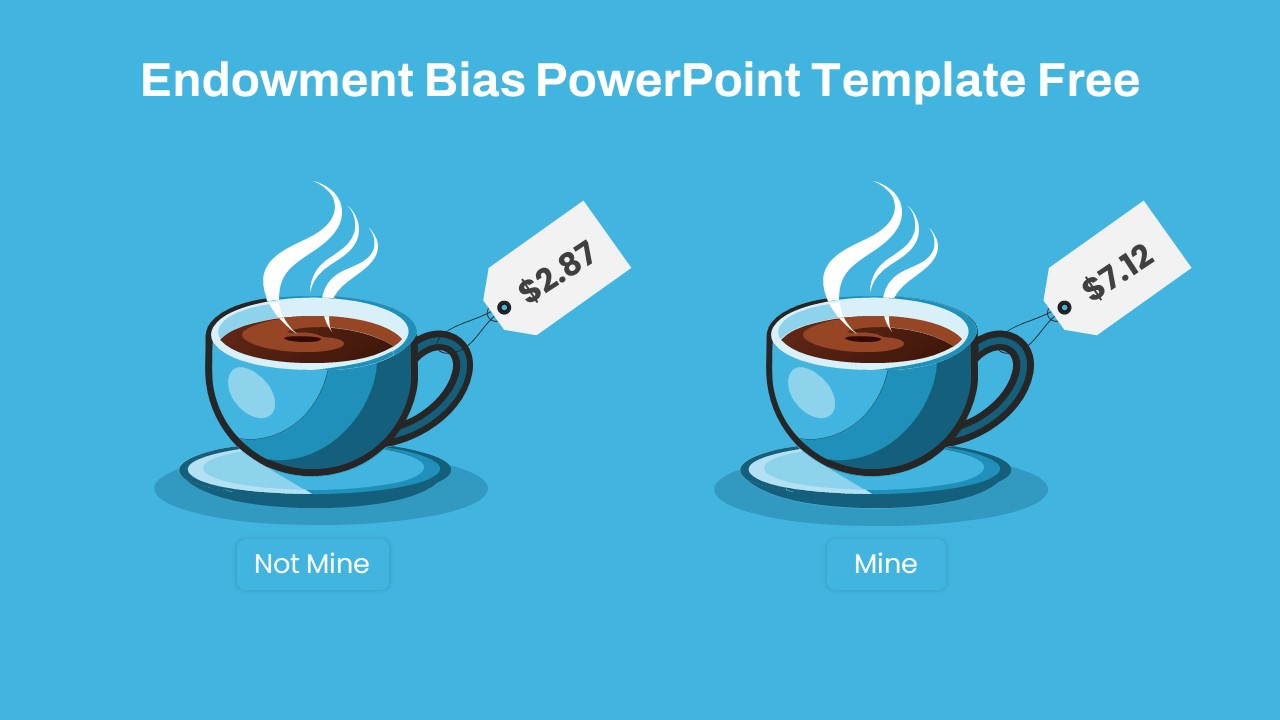
Endowment Bias Coffee Price Comparison Template for PowerPoint & Google Slides
Comparison
Free
Two-Box Analysis & Target Comparison Template for PowerPoint & Google Slides
Comparison
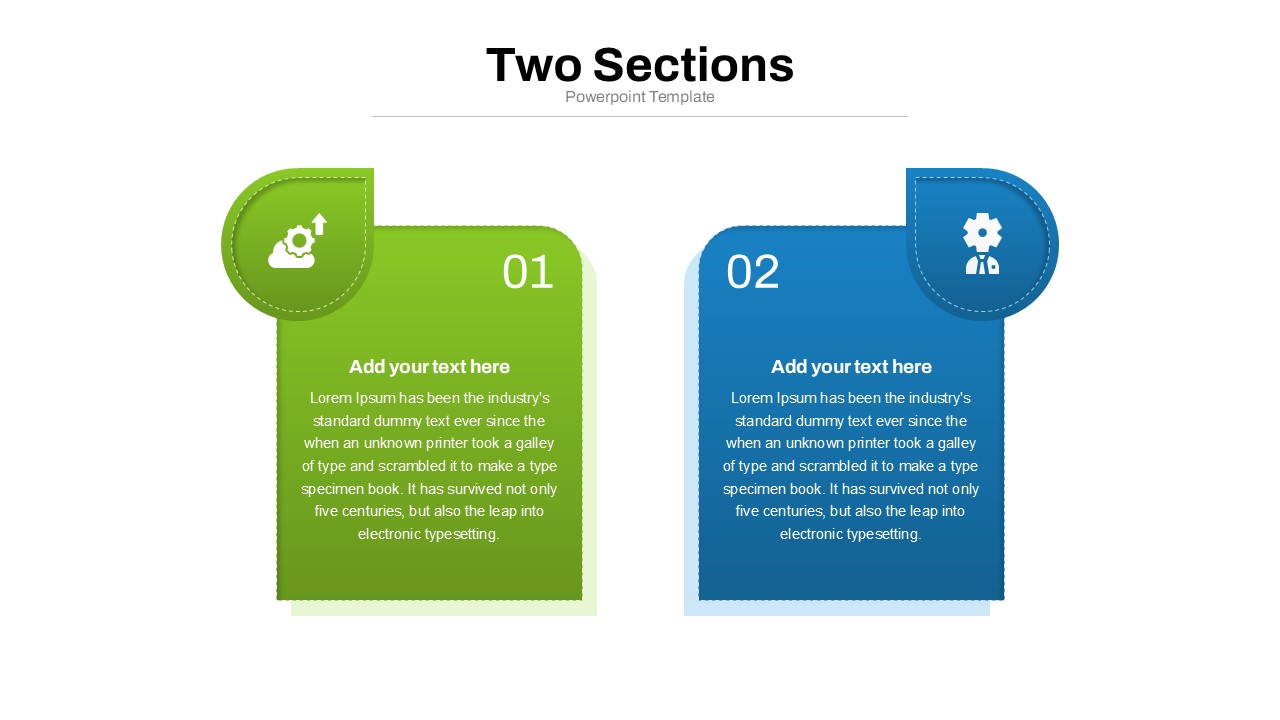
Two Section Comparison template for PowerPoint & Google Slides
Business Proposal
VUCA vs BANI Comparison Infographic Template for PowerPoint & Google Slides
Comparison
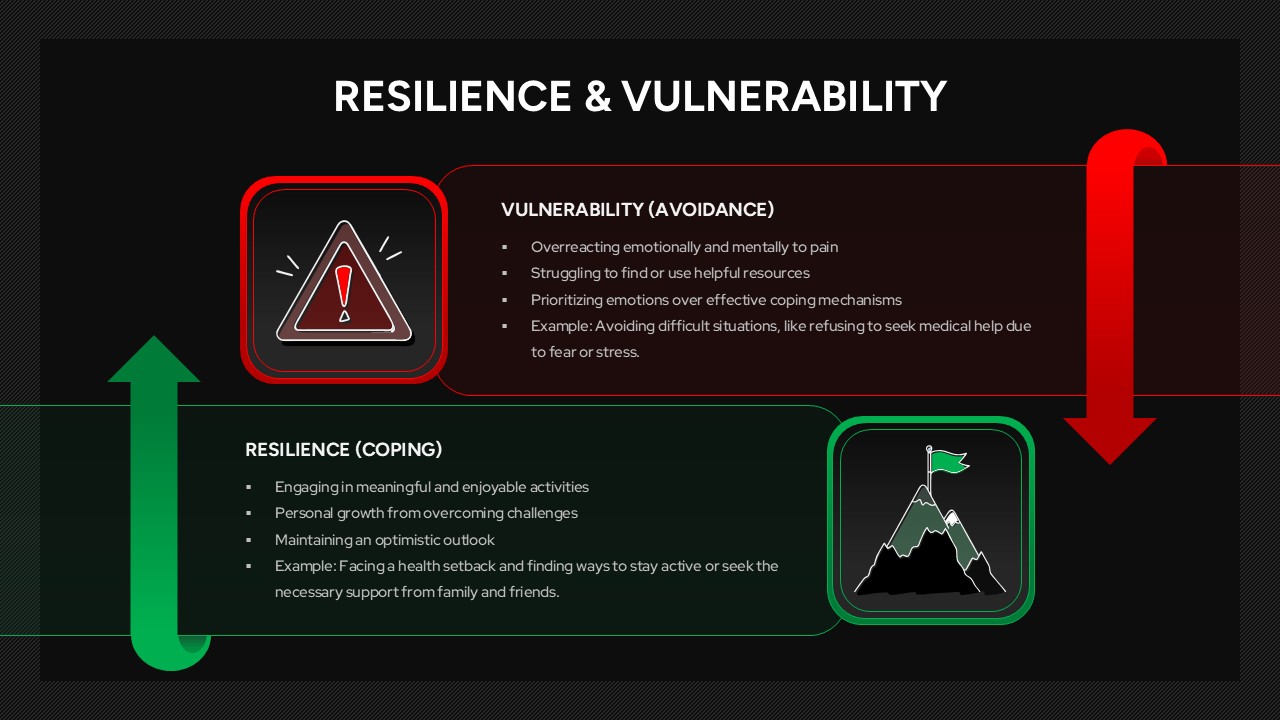
Resilience & Vulnerability Comparison Template for PowerPoint & Google Slides
Comparison
Category Analysis Comparison Infographic Template for PowerPoint & Google Slides
Comparison
Funnel and Flywheel Thinking Comparison template for PowerPoint & Google Slides
Infographics
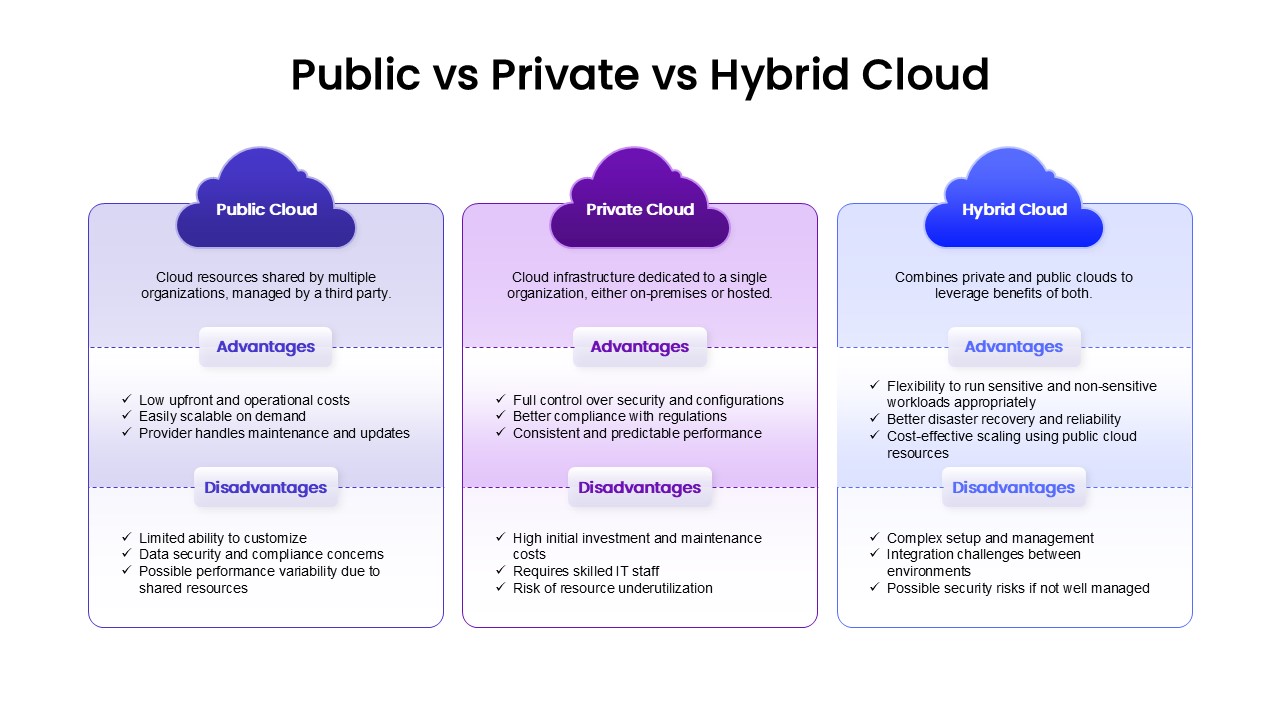
Public, Private & Hybrid Cloud Comparison Template for PowerPoint & Google Slides
Cloud Computing
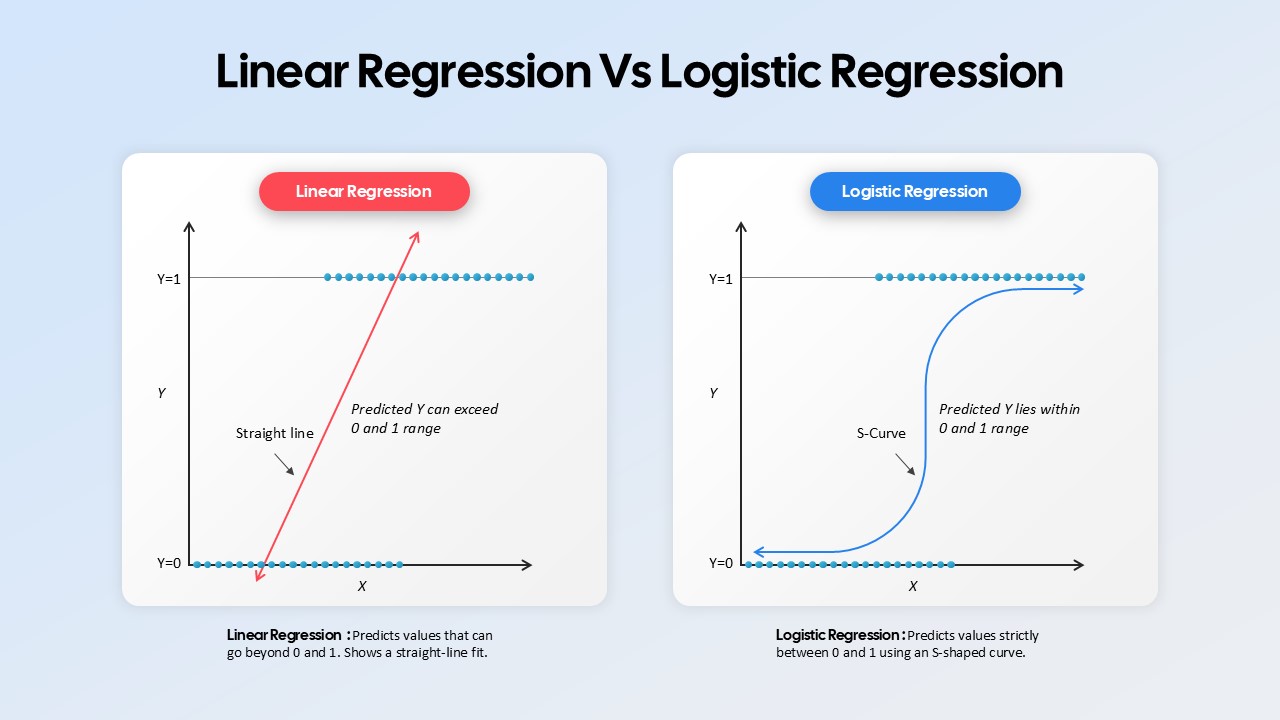
Linear Regression vs Logistic Regression Comparison template for PowerPoint & Google Slides
Comparison
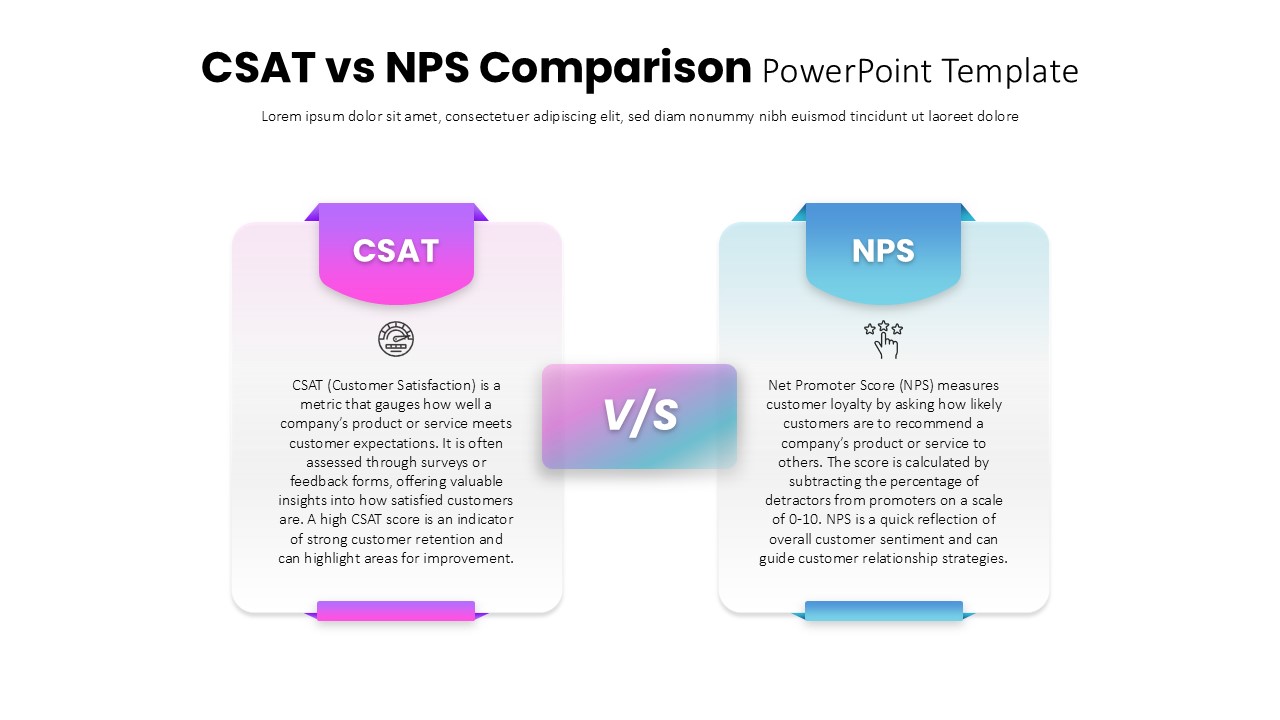
CSAT vs NPS Comparison template for PowerPoint & Google Slides
Business Strategy
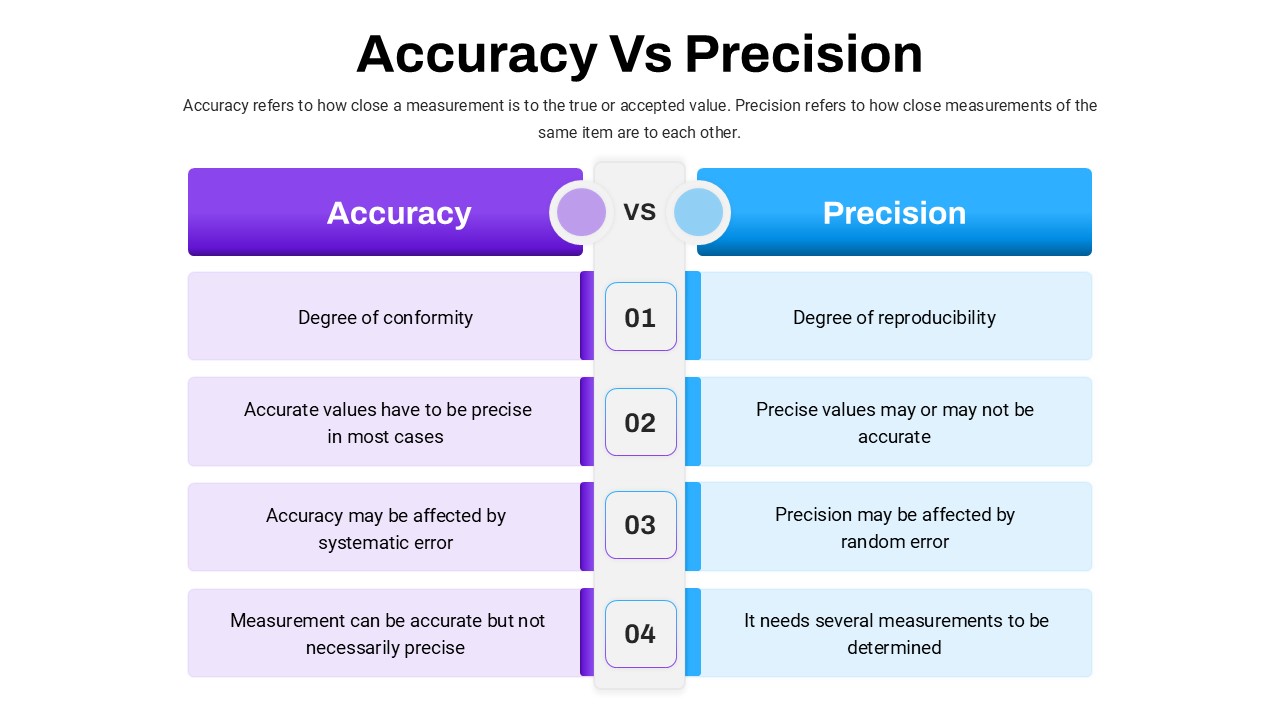
Accuracy Vs Precision Comparison Template for PowerPoint & Google Slides
Comparison Chart
Risk vs Reward Comparison Template for PowerPoint & Google Slides
Opportunities Challenges
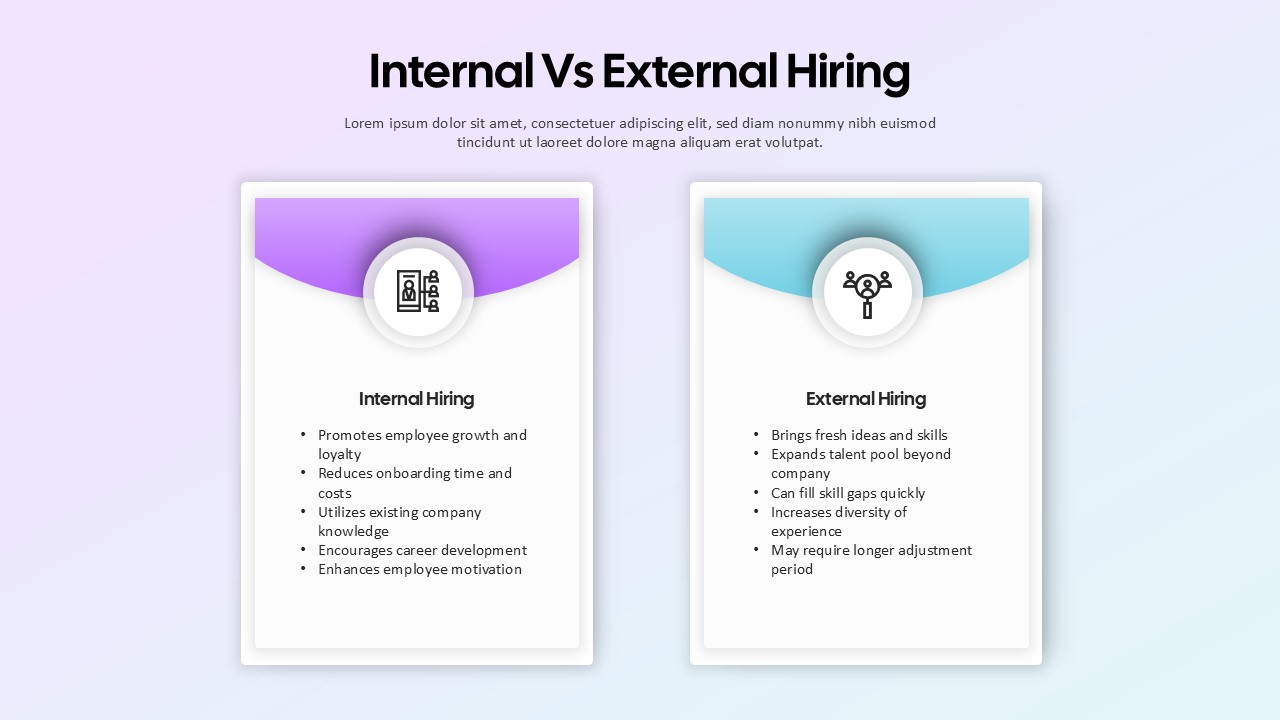
Internal vs External Hiring Comparison Template for PowerPoint & Google Slides
Comparison
Comparison Table Presentation Template for PowerPoint & Google Slides
Table
Colorful Comparison Table Presentation Template for PowerPoint & Google Slides
Table
Five Column Comparison Table Layout Template for PowerPoint & Google Slides
Comparison
Pros and Cons Comparison Table Template for PowerPoint & Google Slides
Comparison Chart
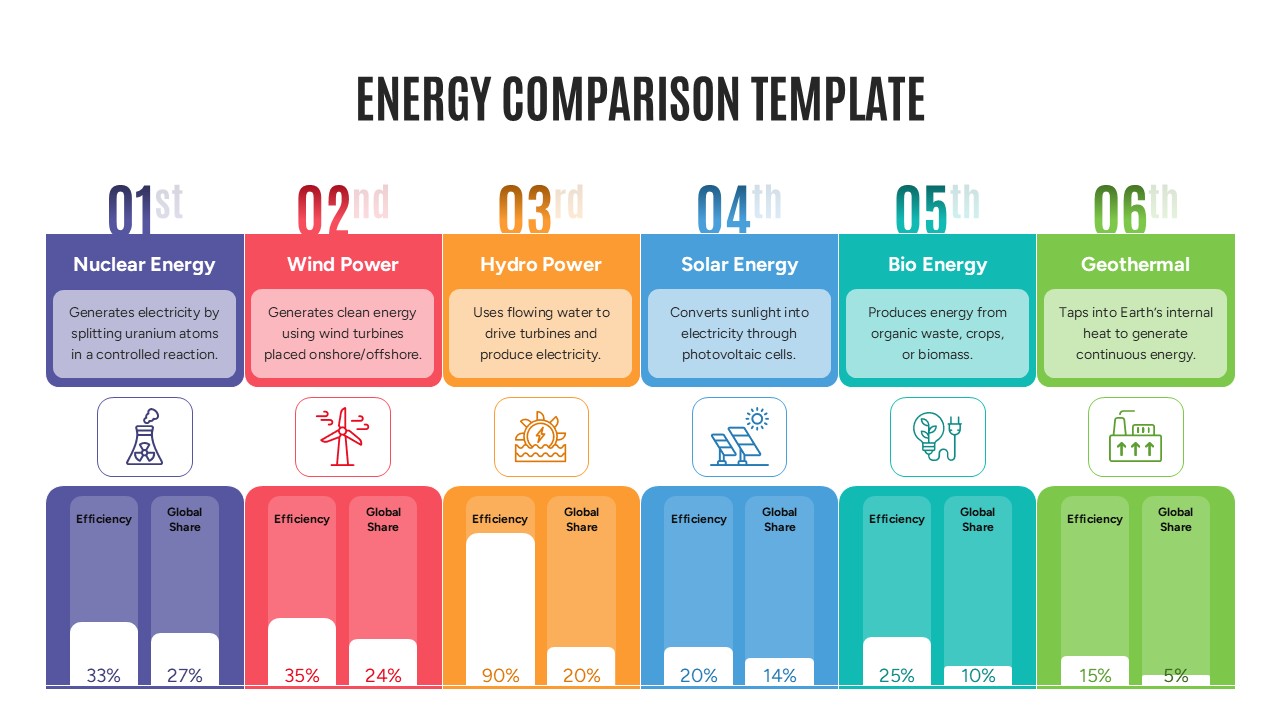
Energy Comparison Template for PowerPoint & Google Slides
Comparison
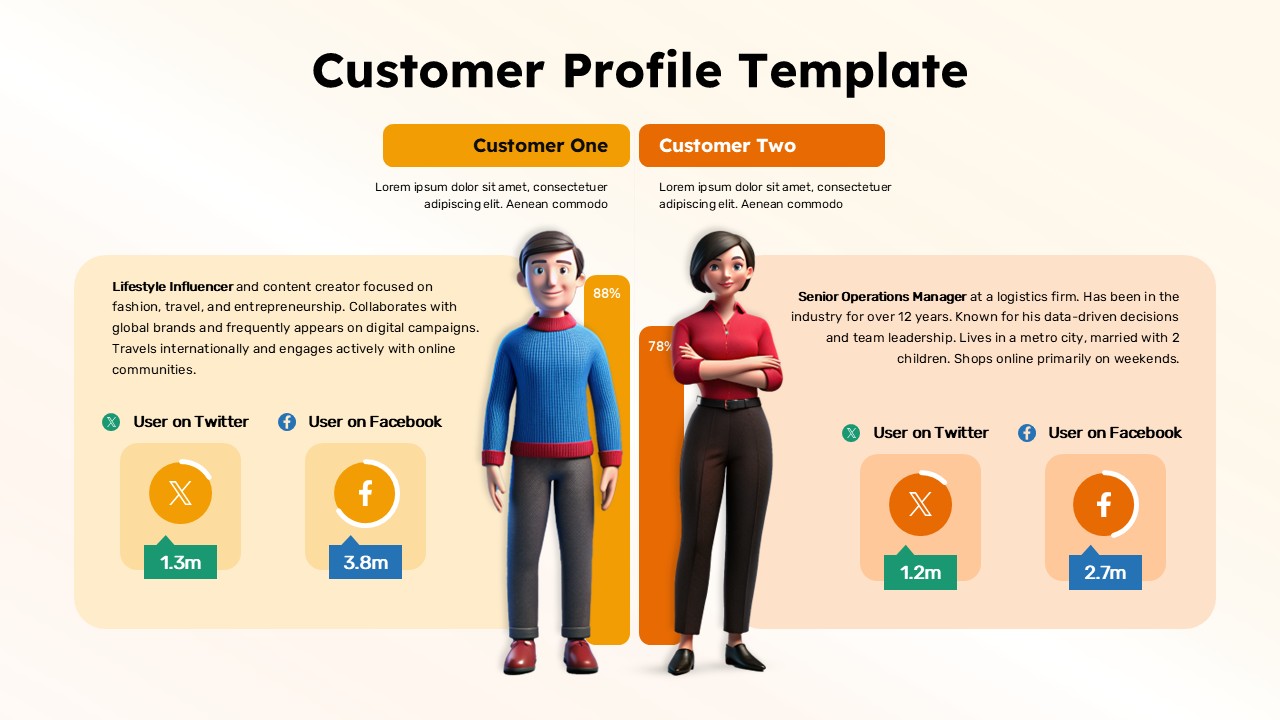
Customer Persona Comparison Profile Template for PowerPoint & Google Slides
Business
Argument Comparison Template for PowerPoint & Google Slides
Comparison
Operating Channels Comparison Diagram Template for PowerPoint & Google Slides
Business Models