Nine-Field Matrix Diagrams Collection Template for PowerPoint & Google Slides


Description
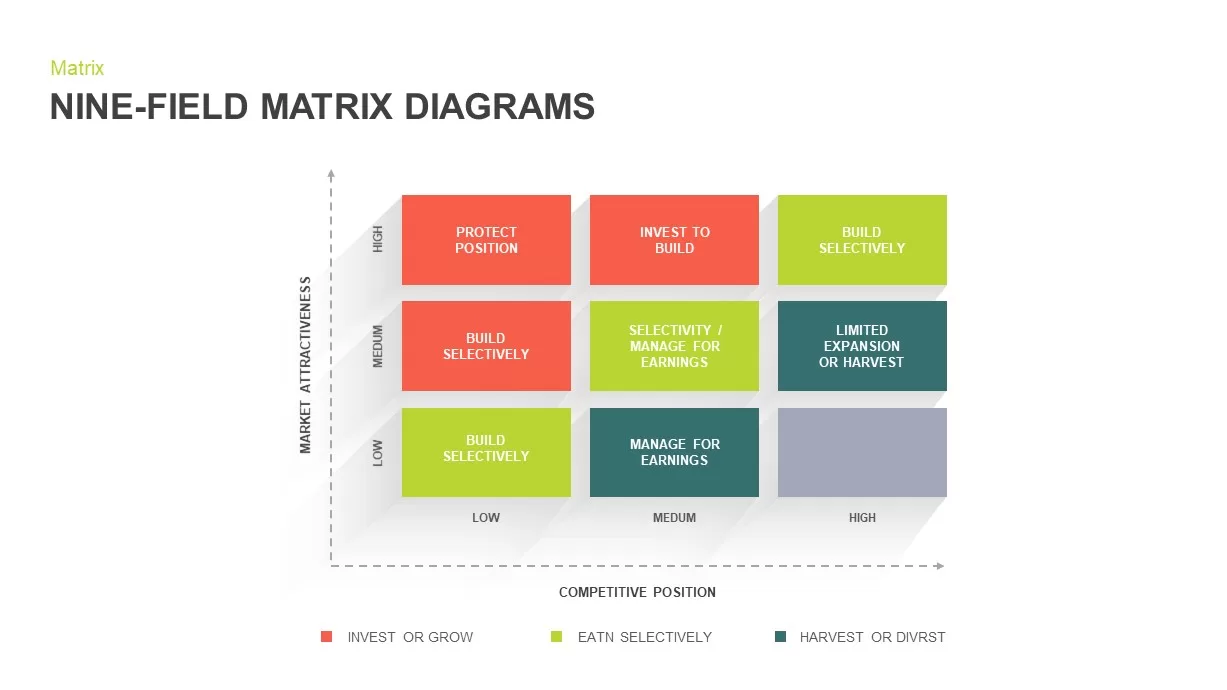
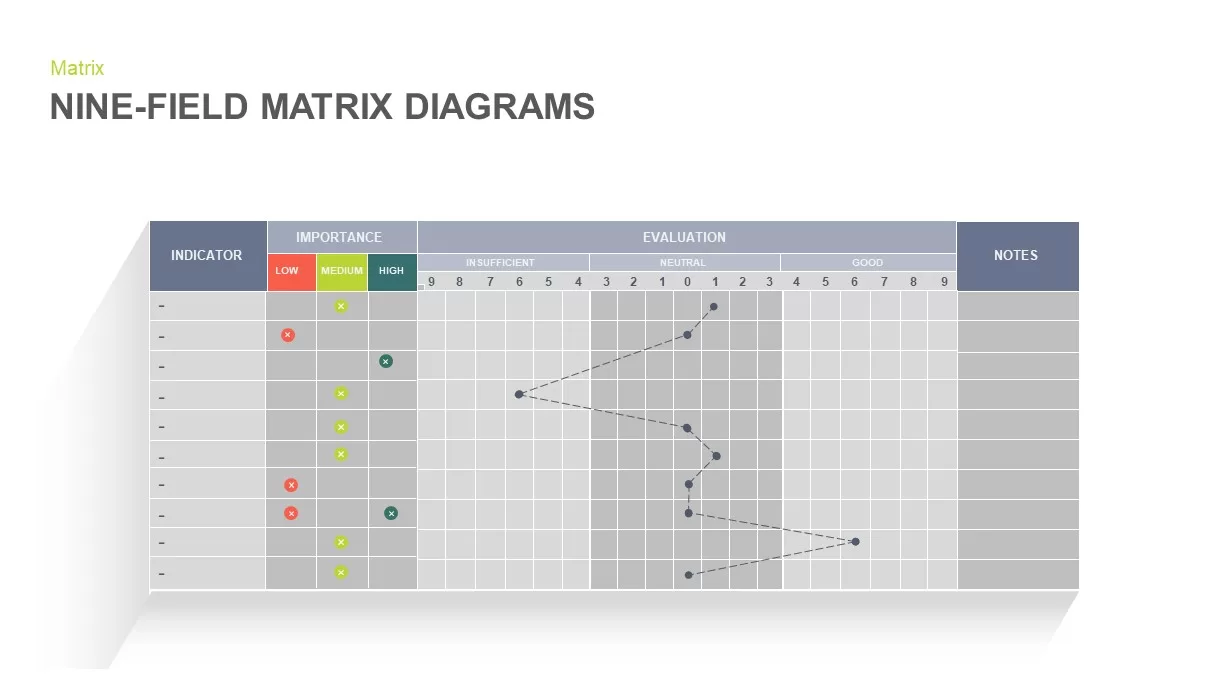
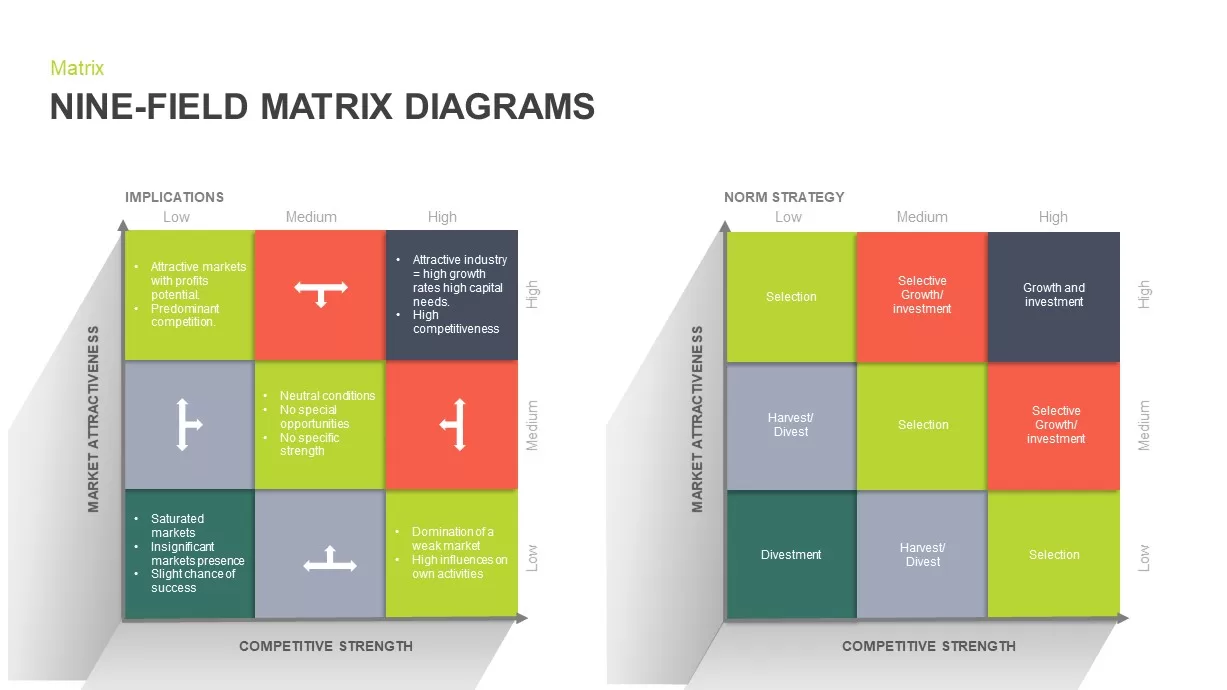
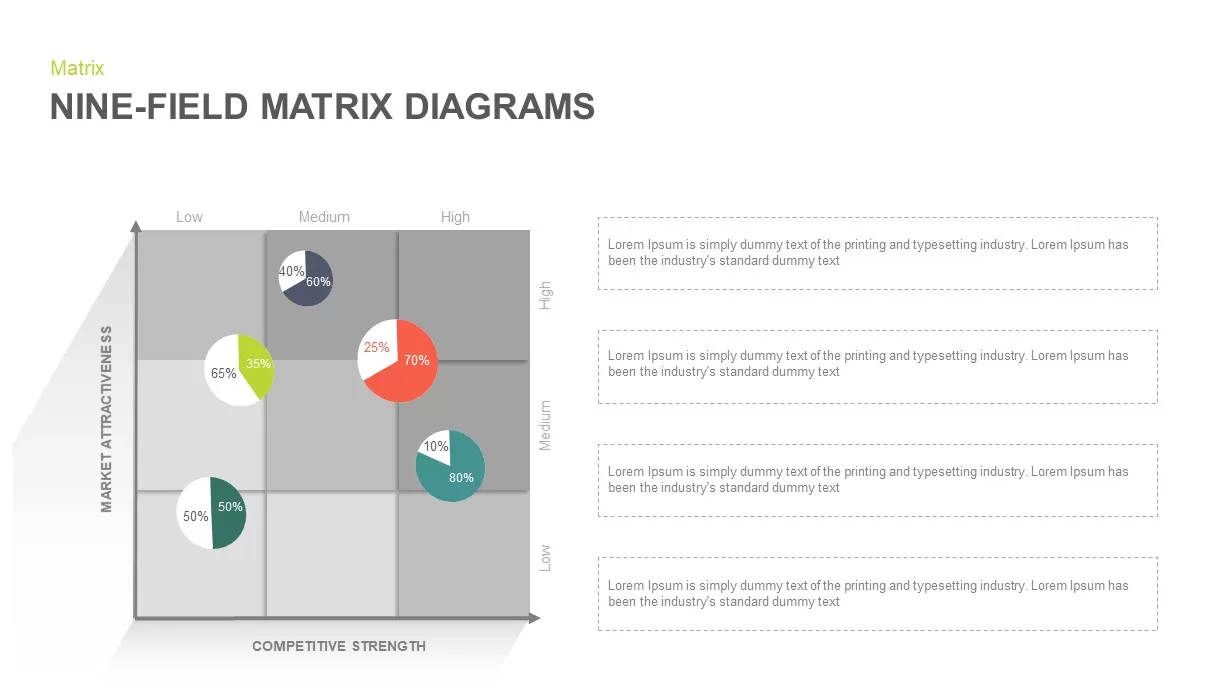
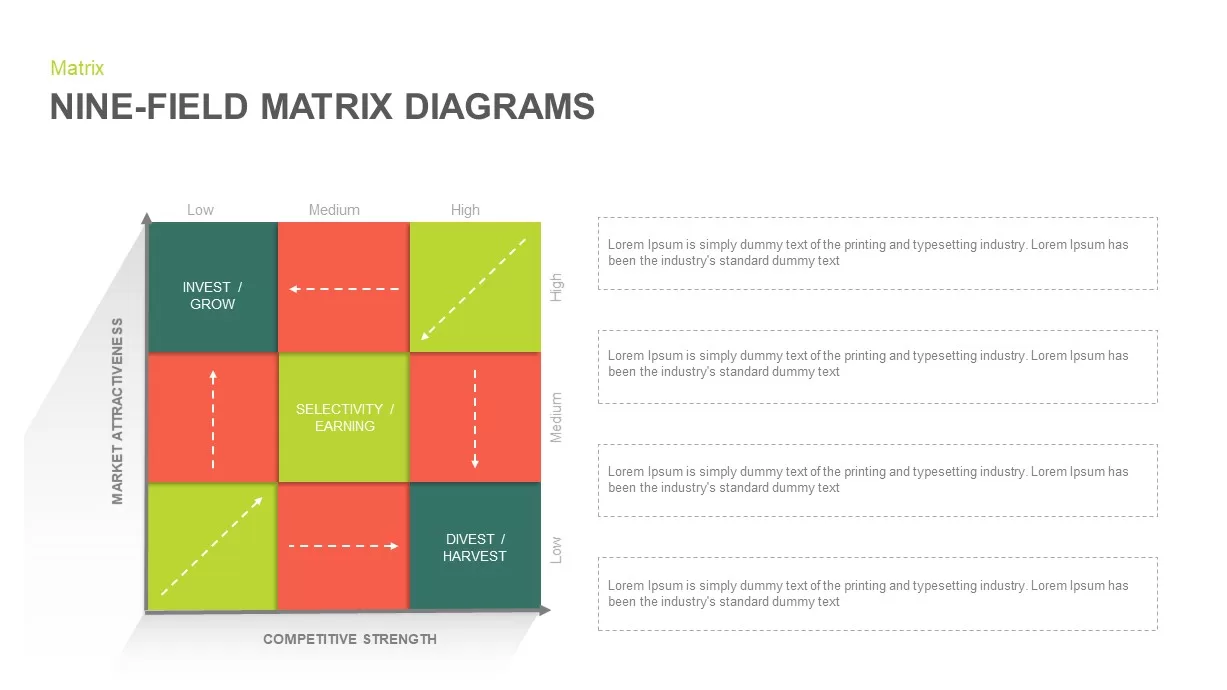
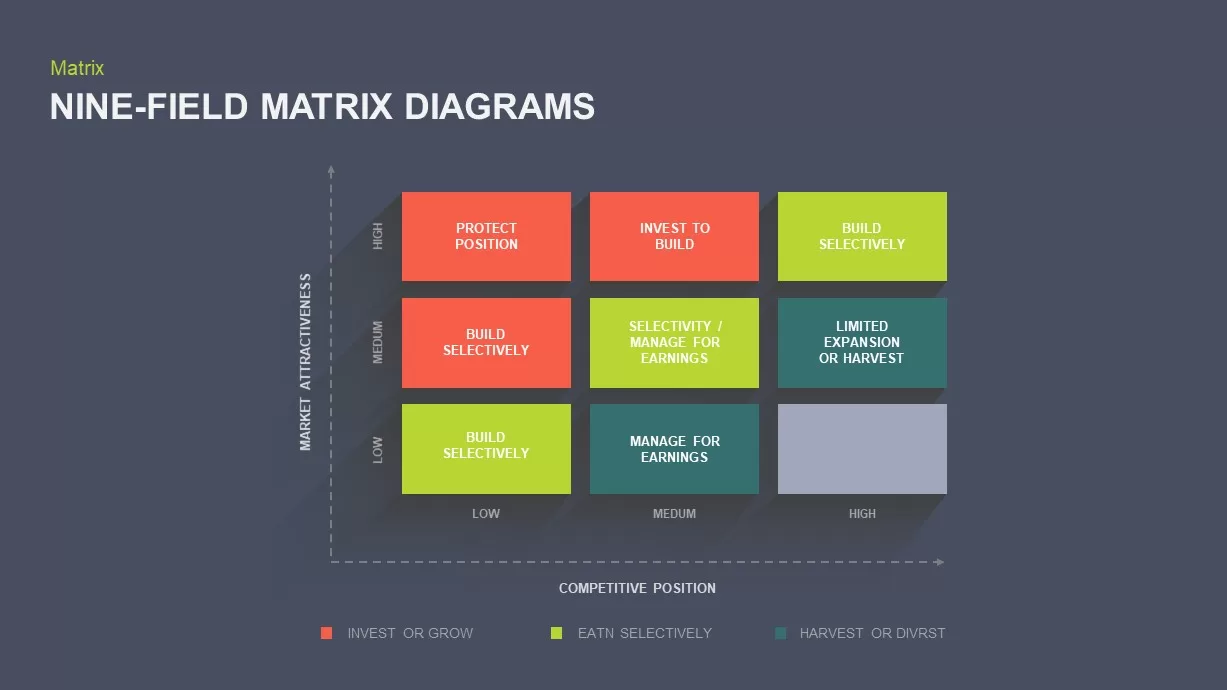
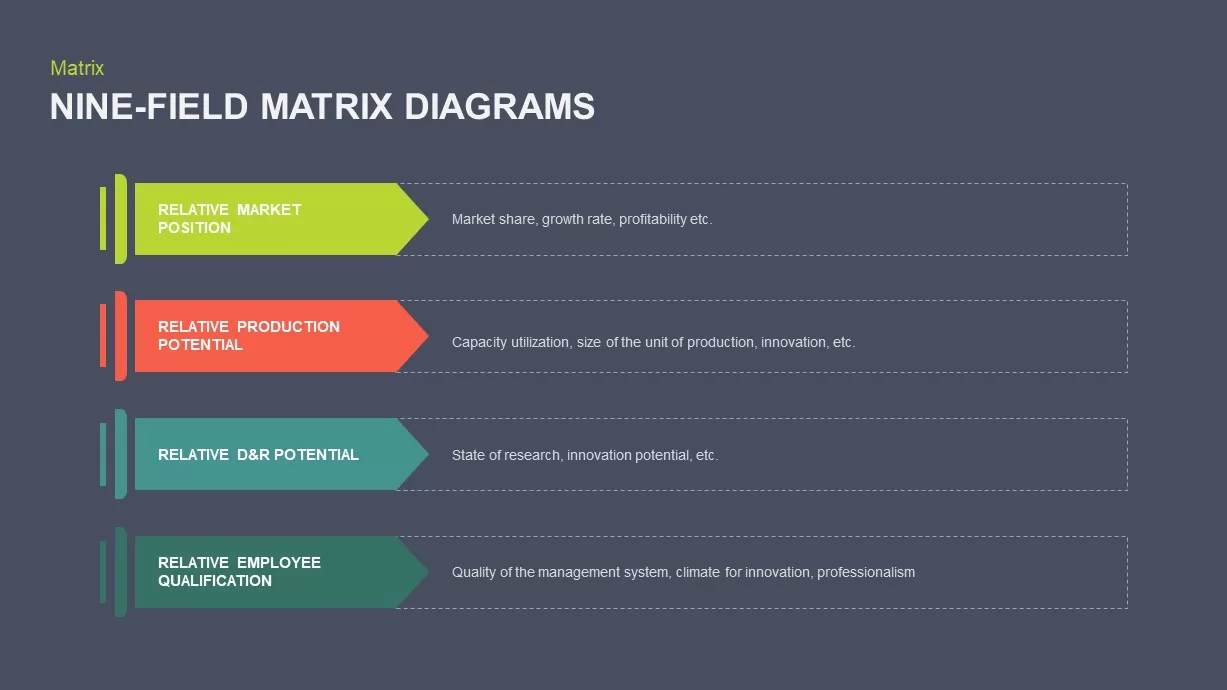
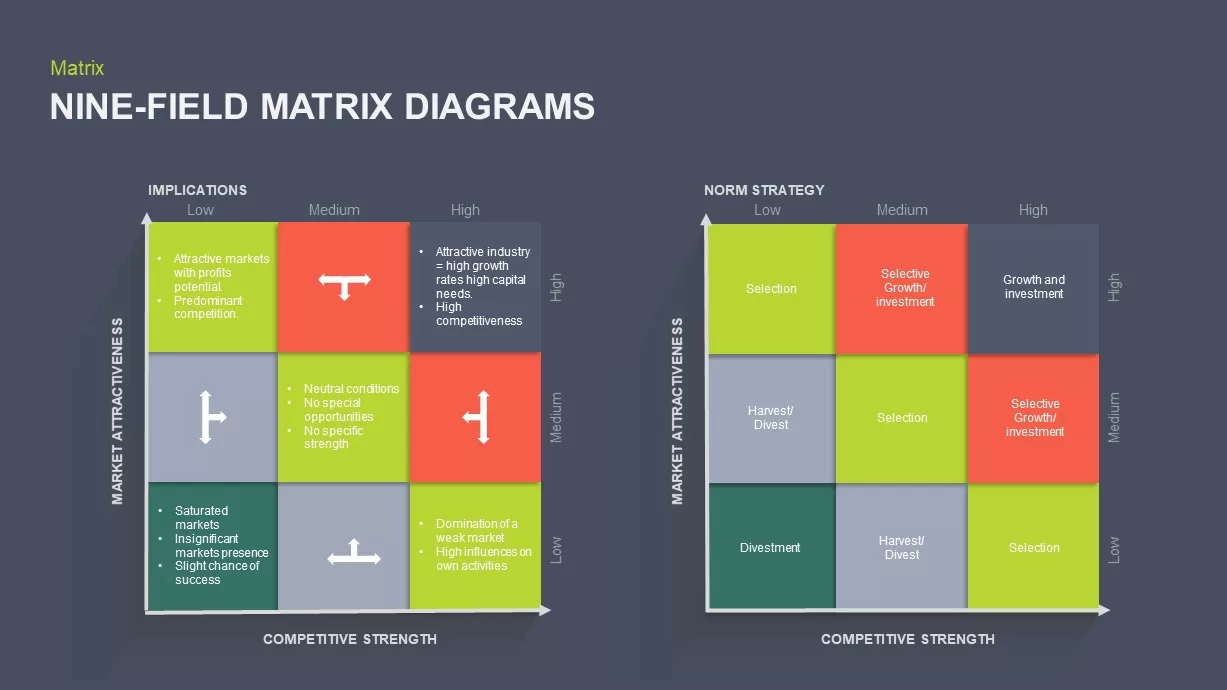
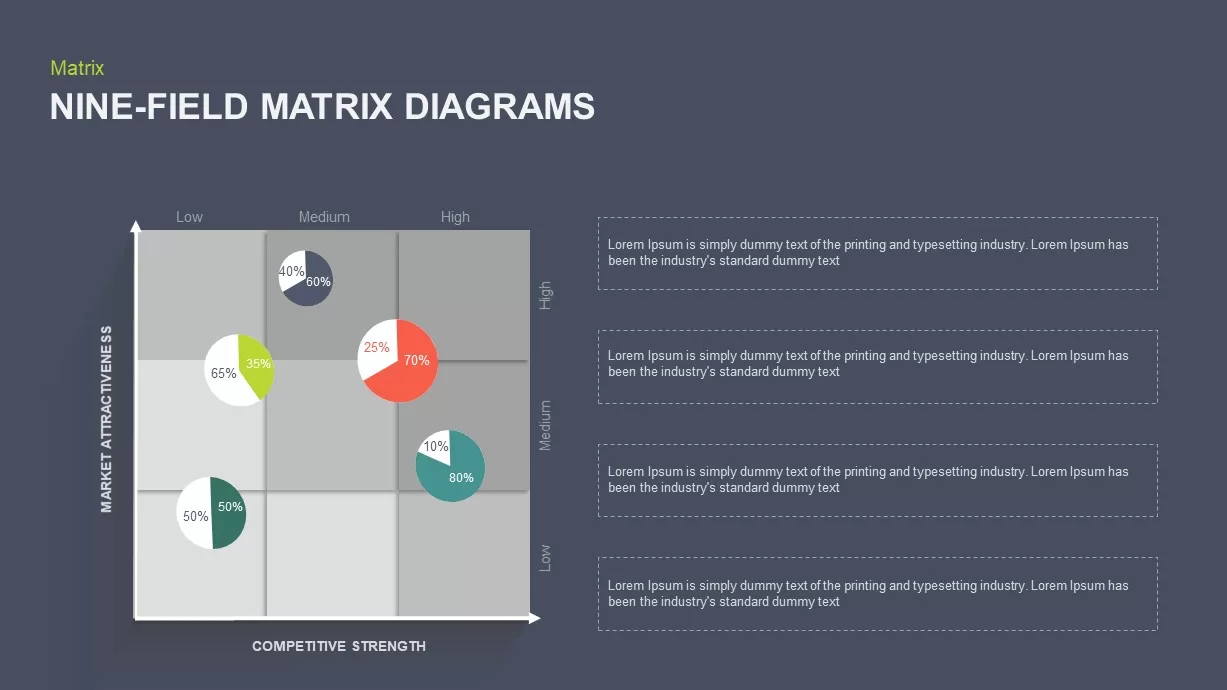
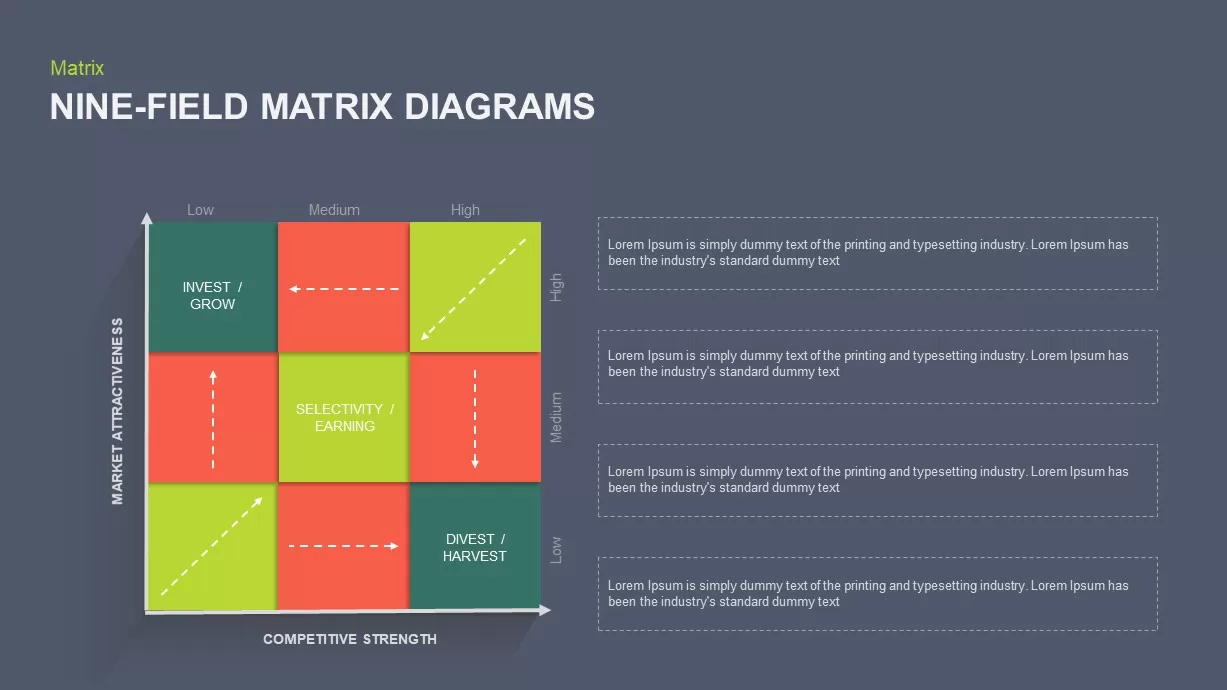
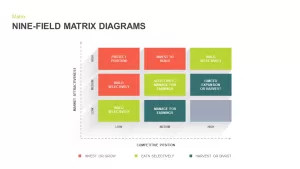
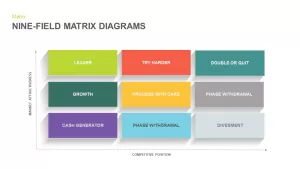
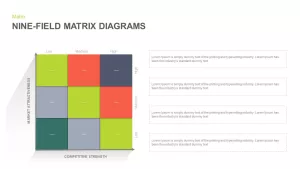
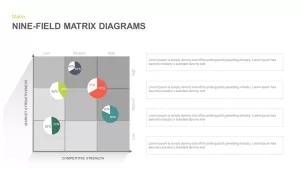
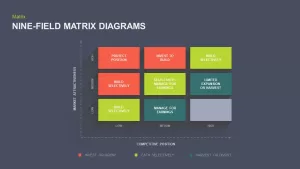
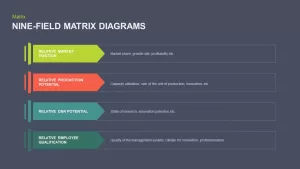
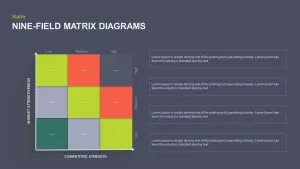
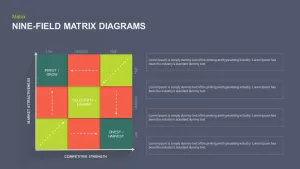
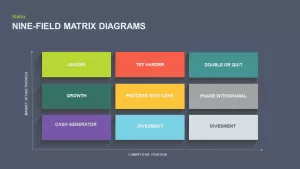
Leverage this comprehensive pack of nine-field matrix diagrams to analyze and compare market attractiveness against competitive strength in a visually engaging format. This versatile template offers multiple diagram variations—including color-coded nine-grid layouts, indicator and evaluation matrices, and phase analysis arrows—that can be customized to suit strategic planning, portfolio management, and performance assessment. Each slide features clear axes, editable labels, and intuitive legends, allowing you to highlight key strategic actions such as invest, grow, divest, or select. The modern flat design, enhanced by subtle shadows and crisp typography, ensures readability and professional appeal. With master slides and editable placeholders, you can swiftly adjust color schemes, replace icons, or update data points to align with corporate branding and project requirements.
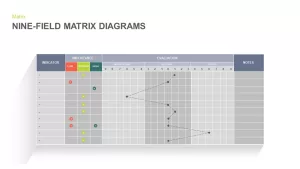
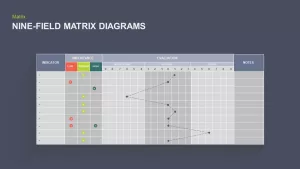
Optimized for both PowerPoint and Google Slides, this asset maintains full resolution clarity across devices, streamlining collaboration and version control. The combination of bold blocks, grid structures, and optional callout boxes enables dynamic storytelling, whether illustrating investment strategies, resource allocation, or risk evaluation. Built-in layouts support text annotations, bullet lists, and directional arrows, so you can tailor the presentation to executive briefings, team workshops, board reviews, or client proposals. The pack’s flexible format also includes side-by-side comparisons and workflow sequences to map analysis phases or indicator evaluations.
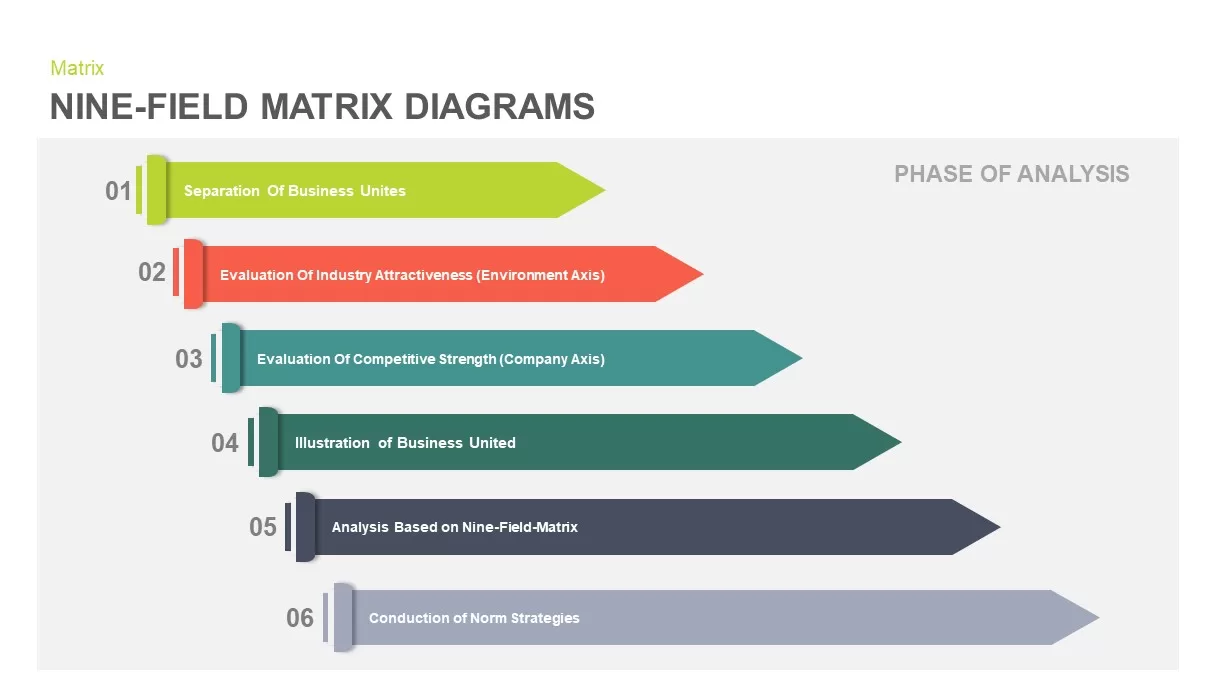
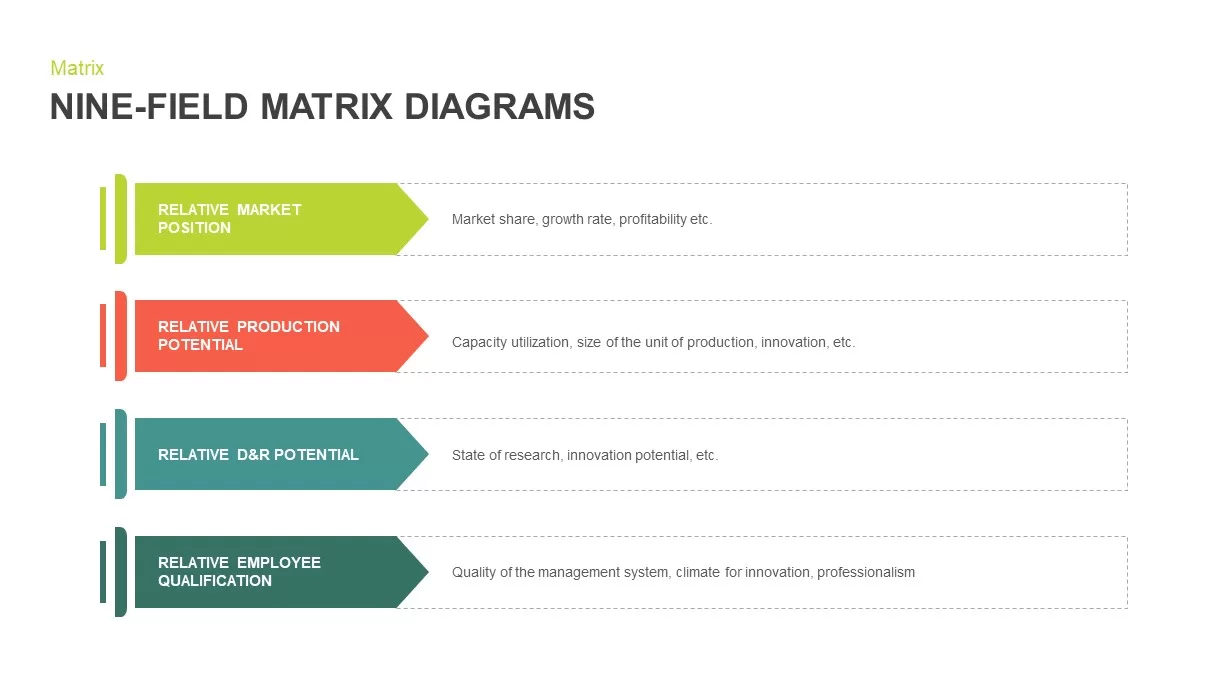
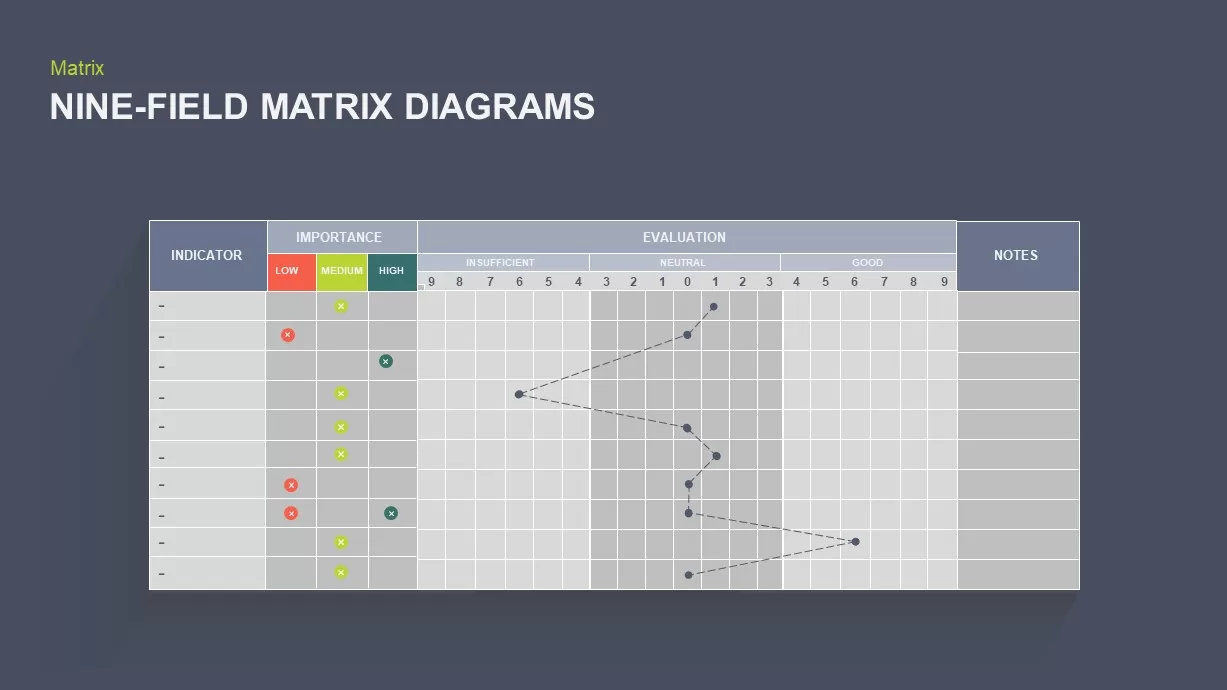
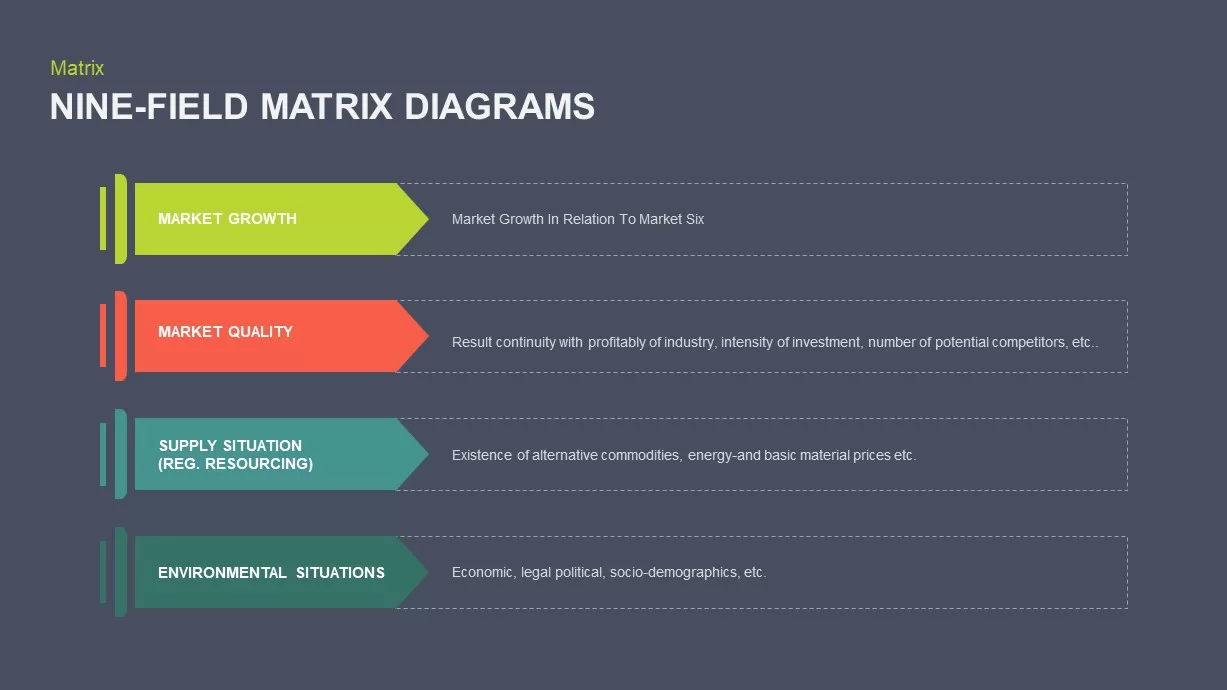
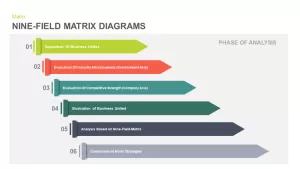
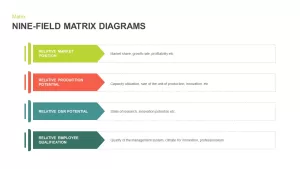
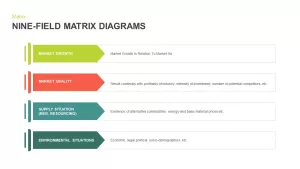
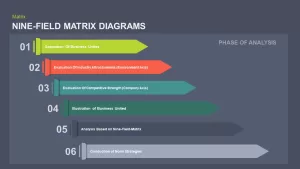
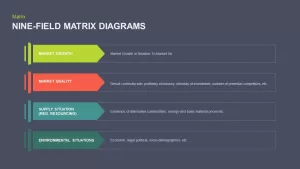
This slide pack also includes thematic variations such as arrow-based phase analysis diagrams, indicator evaluation grids, and side-by-side matrix comparisons with annotation boxes. Whether you need to showcase evaluation scores, highlight strategic phases, or detail normative actions, each layout can be tailored through editable shapes, icons, and text fields. The cohesive design language across slides ensures consistent branding and visual continuity.
Who is it for
Strategy consultants, portfolio managers, business analysts, and marketing strategists will benefit from these nine-field matrices when presenting market segmentation, growth opportunities, competitive positioning, or investment recommendations. Project leaders, financial planners, and MBA students can also leverage these diagrams to visualize data-driven insights and support decision-making.
Other Uses
Beyond traditional strategic assessments, repurpose these nine-field grids for risk matrices, performance scorecards, stakeholder mappings, or project prioritization frameworks. Duplicate and adapt the nine-cell layout for process optimization charts, balanced scorecards, or capability heatmaps, making it a versatile tool for cross-functional presentations.
Login to download this file

Item ID
SB01742
Related Templates

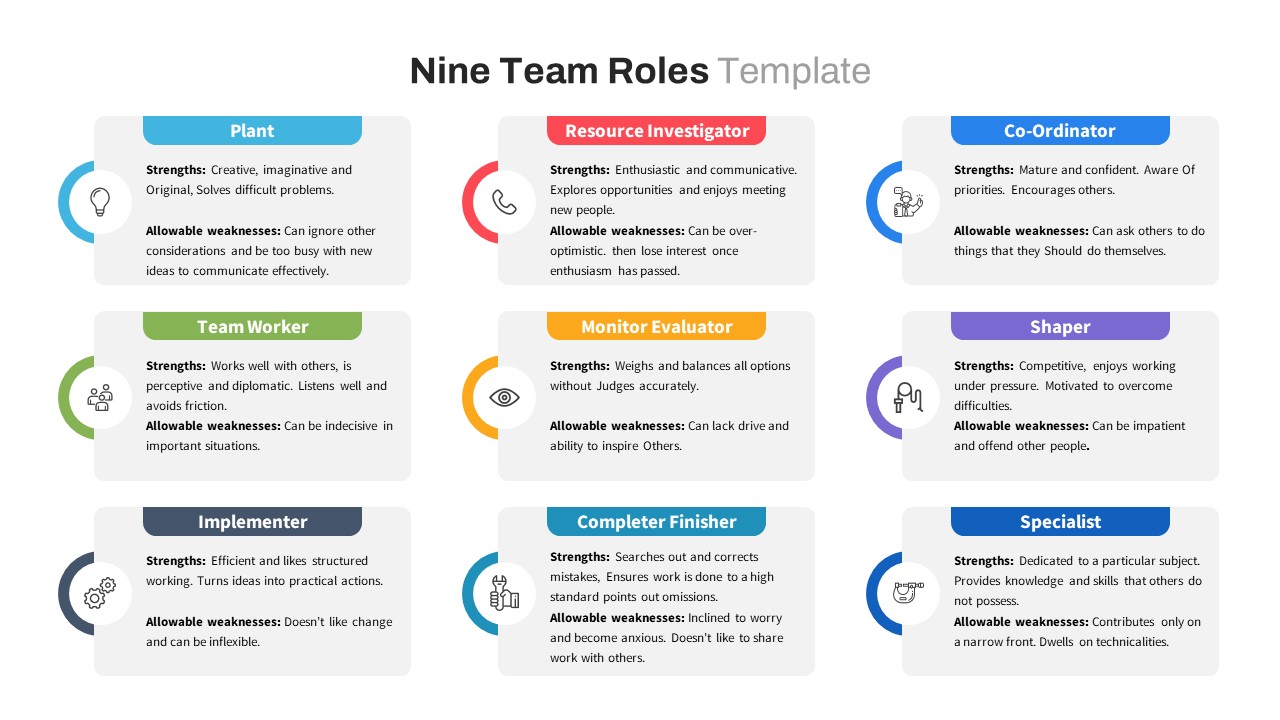
Nine Belbin Team Roles Matrix Slide for PowerPoint & Google Slides
Employee Performance
BEST Free Business PowerPoint Templates Collection Template for PowerPoint & Google Slides
Company Profile
Free
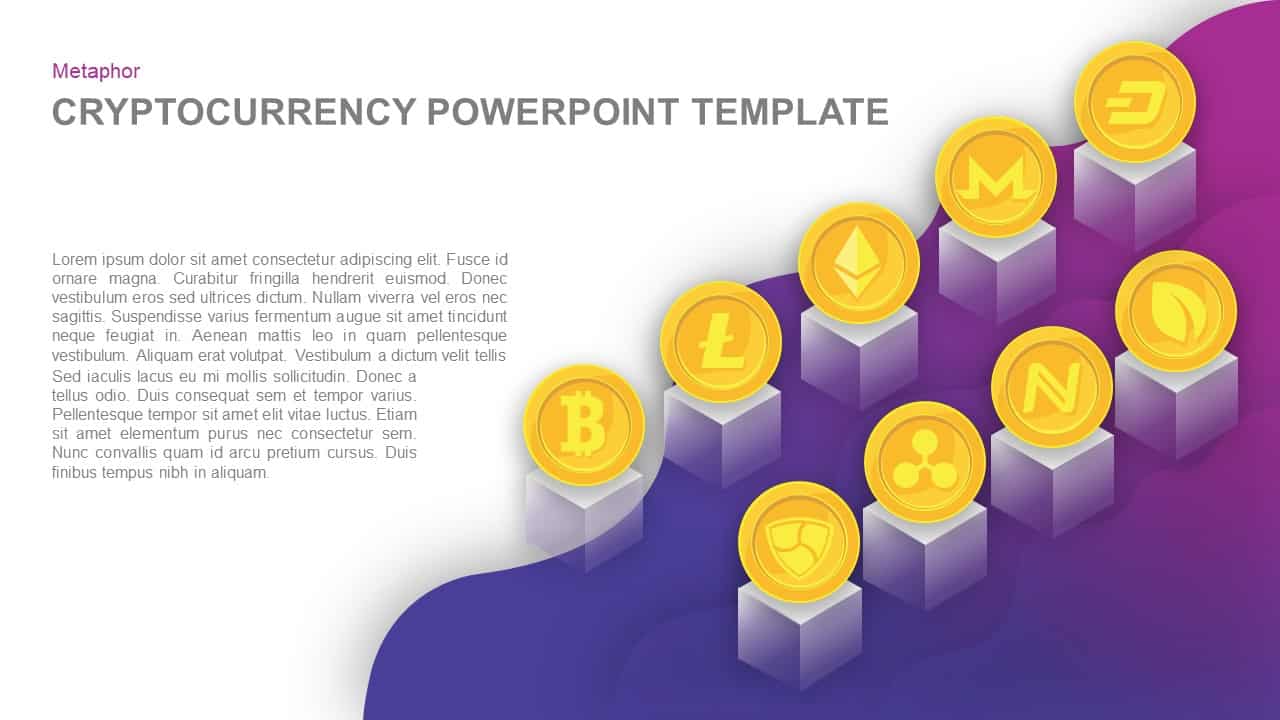
Cryptocurrency Icon Collection Template for PowerPoint & Google Slides
Finance
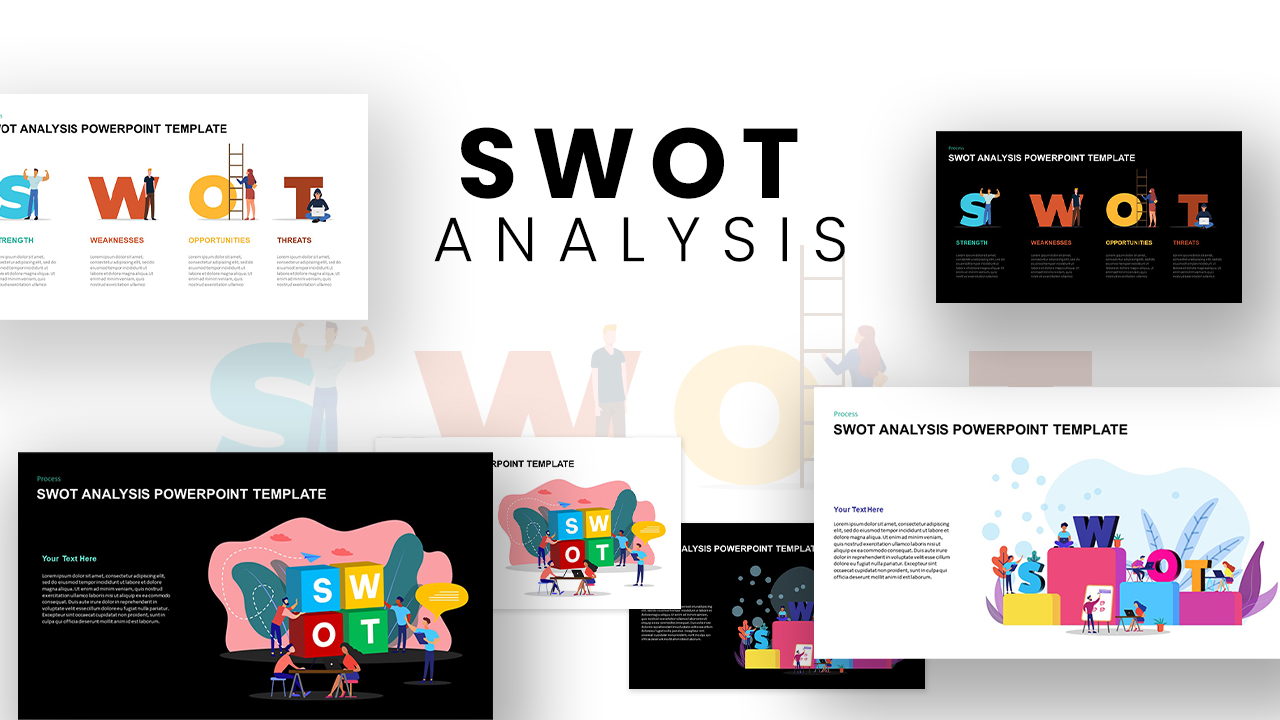
Versatile SWOT Analysis Slide Collection Template for PowerPoint & Google Slides
SWOT
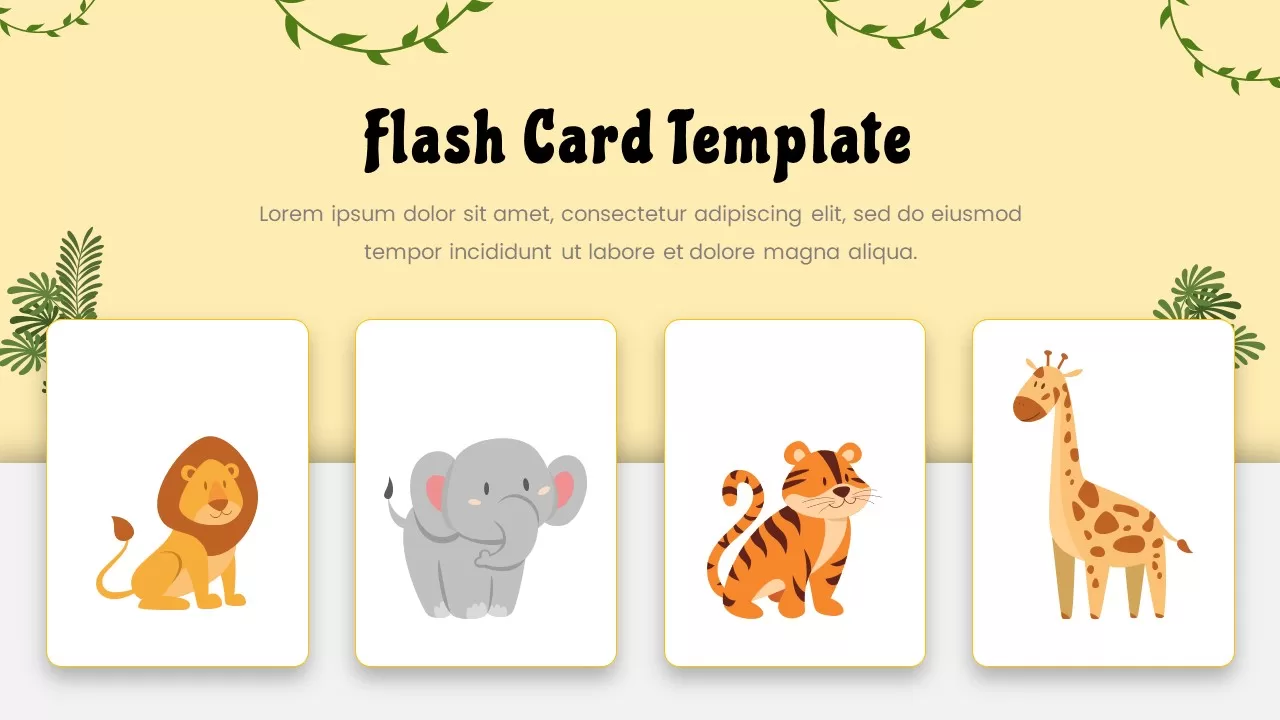
Jungle Animal Flash Card Collection Template for PowerPoint & Google Slides
Infographics
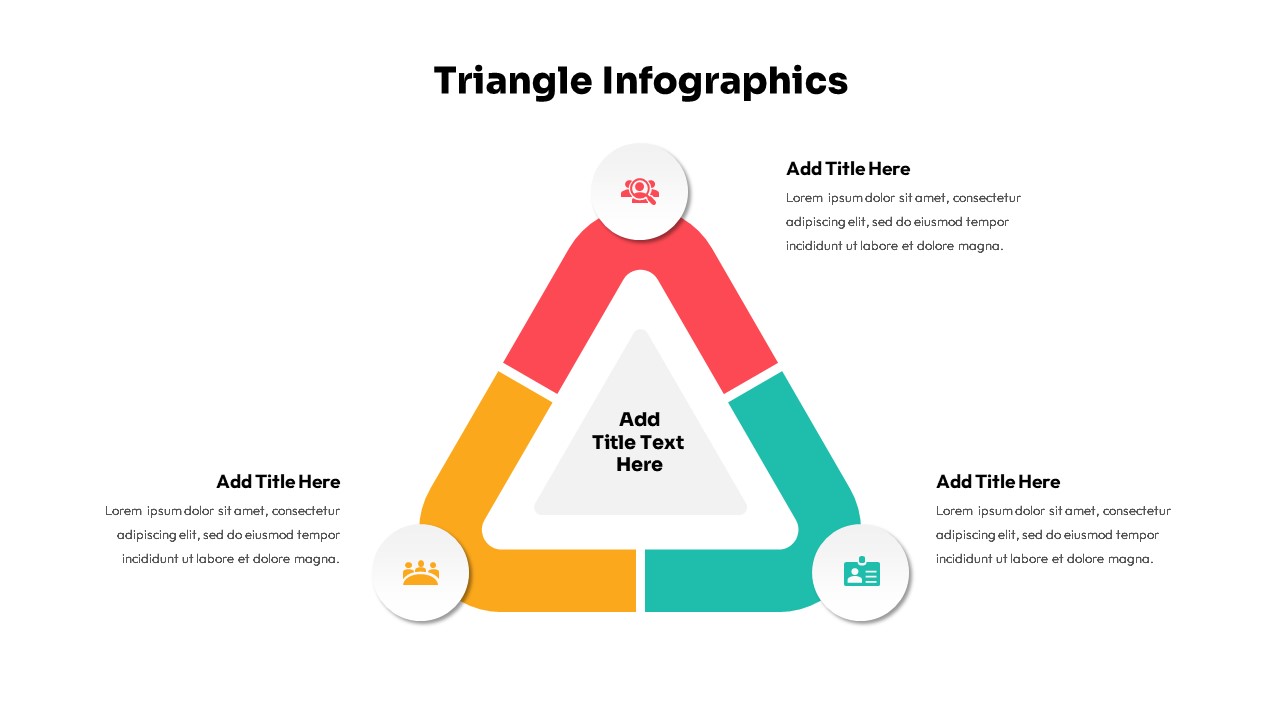
Triangle Infographic Slide Collection Template for PowerPoint & Google Slides
Decks
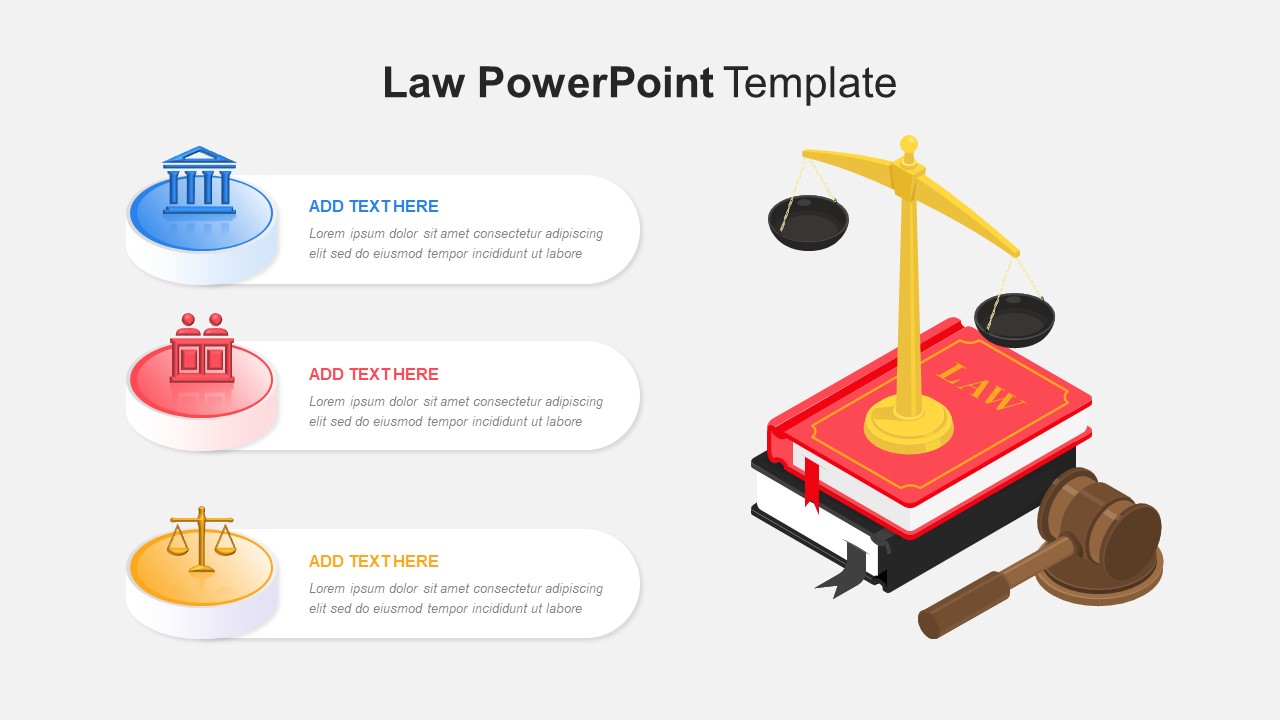
Free Law Infographics Slide Pack Collection Template for PowerPoint & Google Slides
Infographics
Free
Free Elegant Award Certificate Collection Template for PowerPoint & Google Slides
Accomplishment
Free
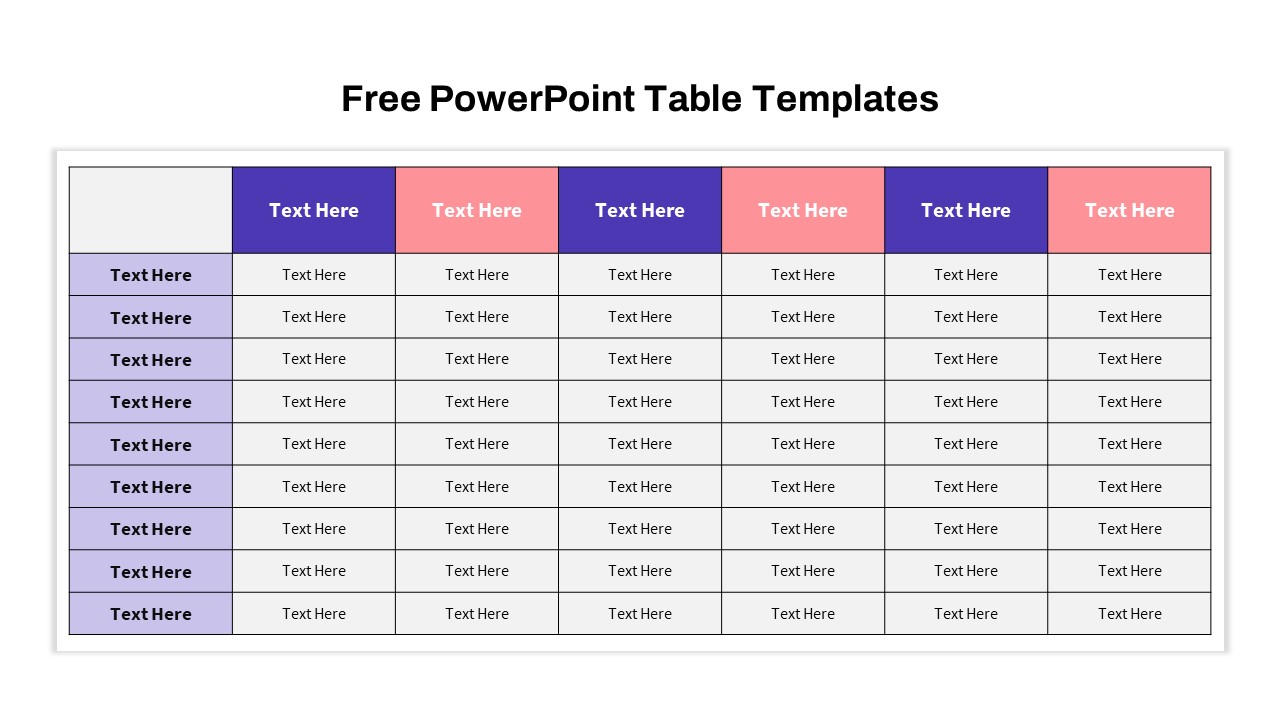
Free Versatile Table Collection Template for PowerPoint & Google Slides
Pitch Deck
Free
Editable Force Field Analysis Diagram Template for PowerPoint & Google Slides
Business Plan

Dynamic Green Field Sports Presentation Template for PowerPoint & Google Slides
Decks
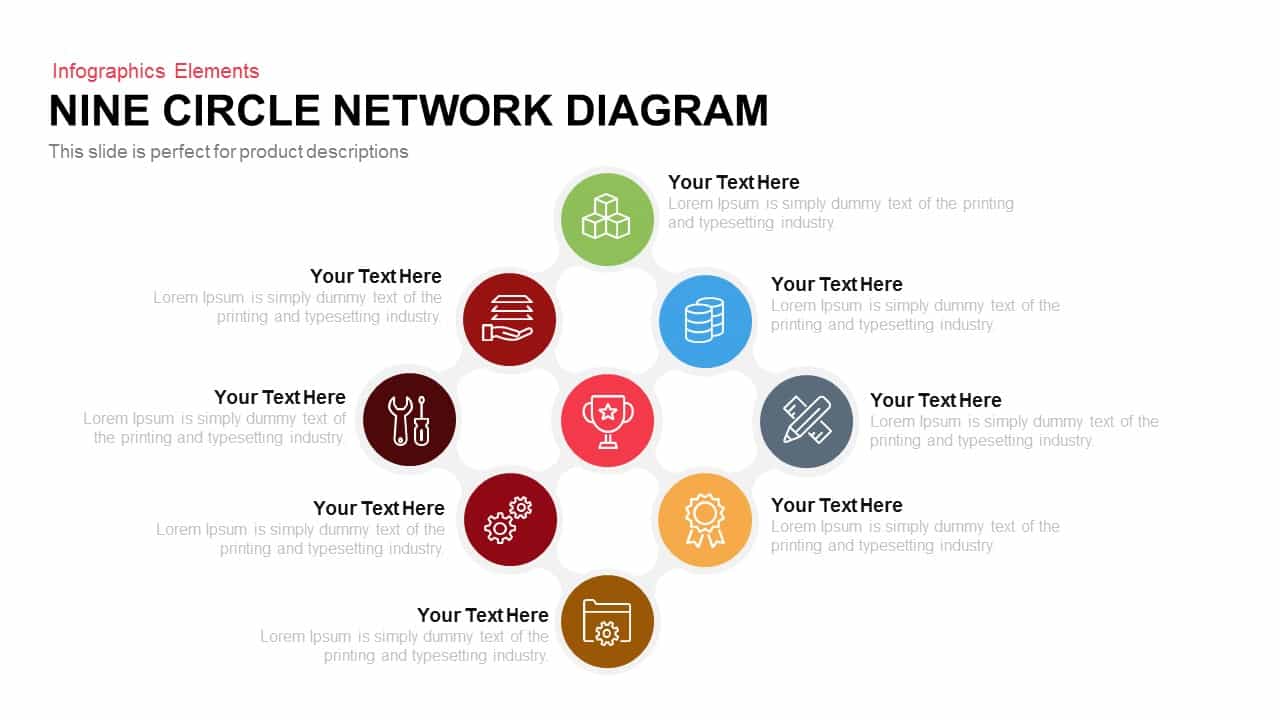
Modern Nine Circle Network Diagram Template for PowerPoint & Google Slides
Circular
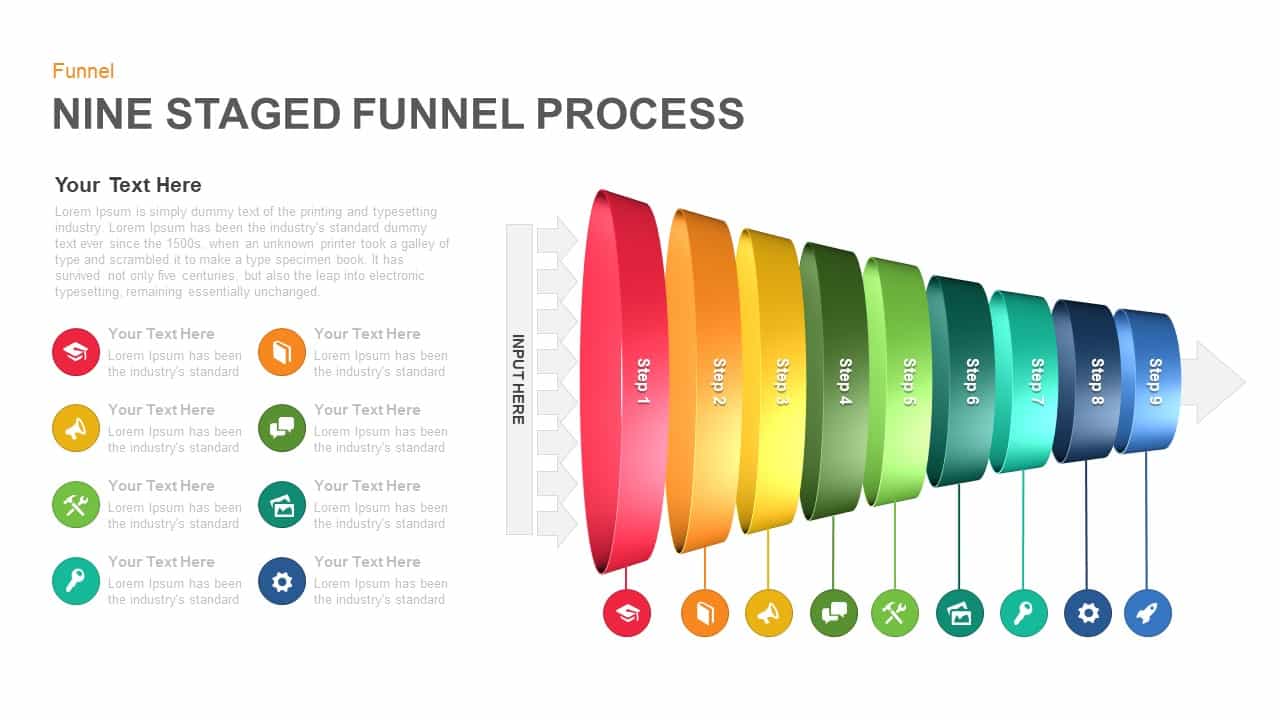
Nine-Stage 3D Funnel Process Diagram Template for PowerPoint & Google Slides
Funnel
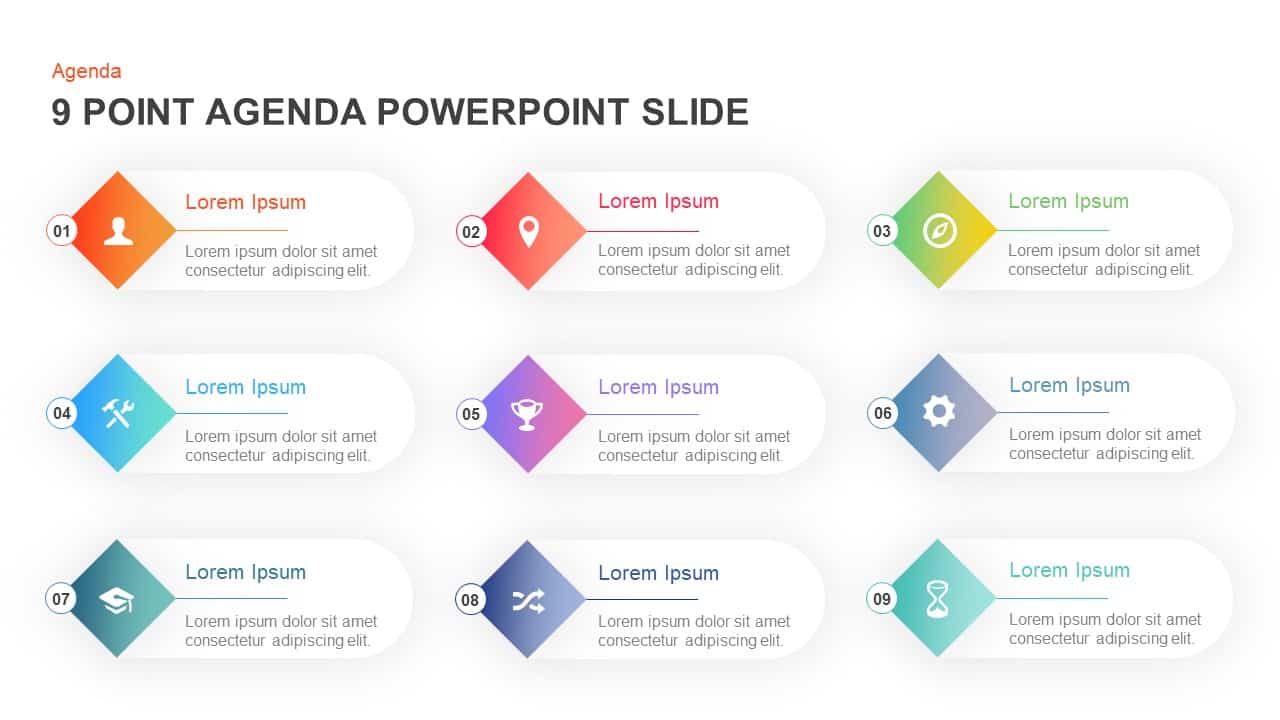
Nine-Point Agenda Infographic Slide Template for PowerPoint & Google Slides
Agenda
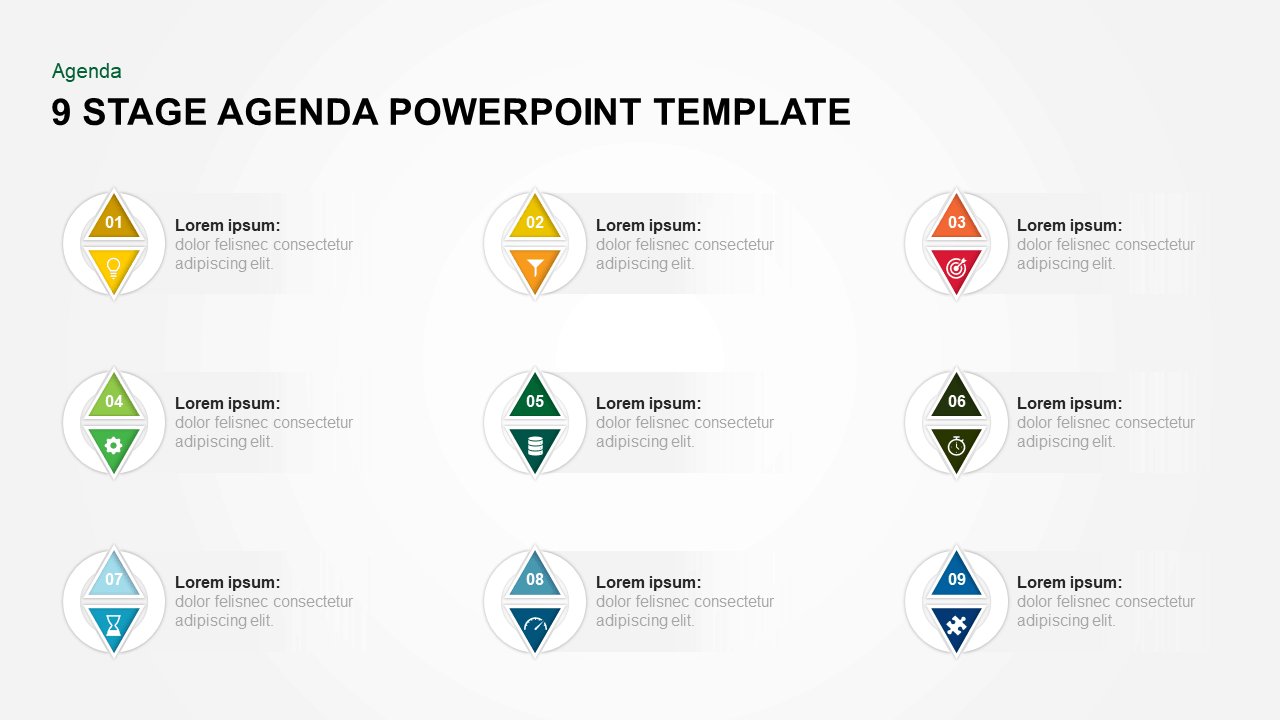
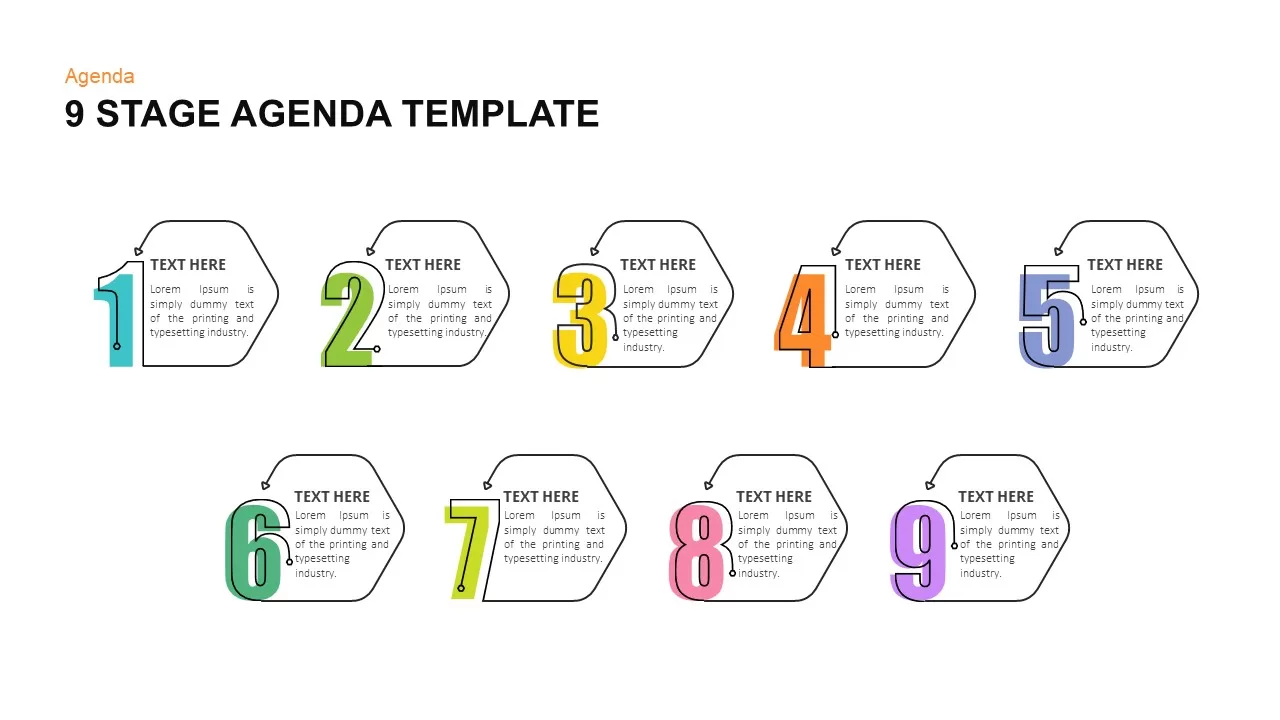
Colorful Nine-Stage Agenda Slide Template for PowerPoint & Google Slides
Agenda
Three to Nine-Step Puzzle Ring Process Diagram Template for PowerPoint & Google Slides
Circular
Clock-Timeline Nine-Stage Agenda Template for PowerPoint & Google Slides
Agenda
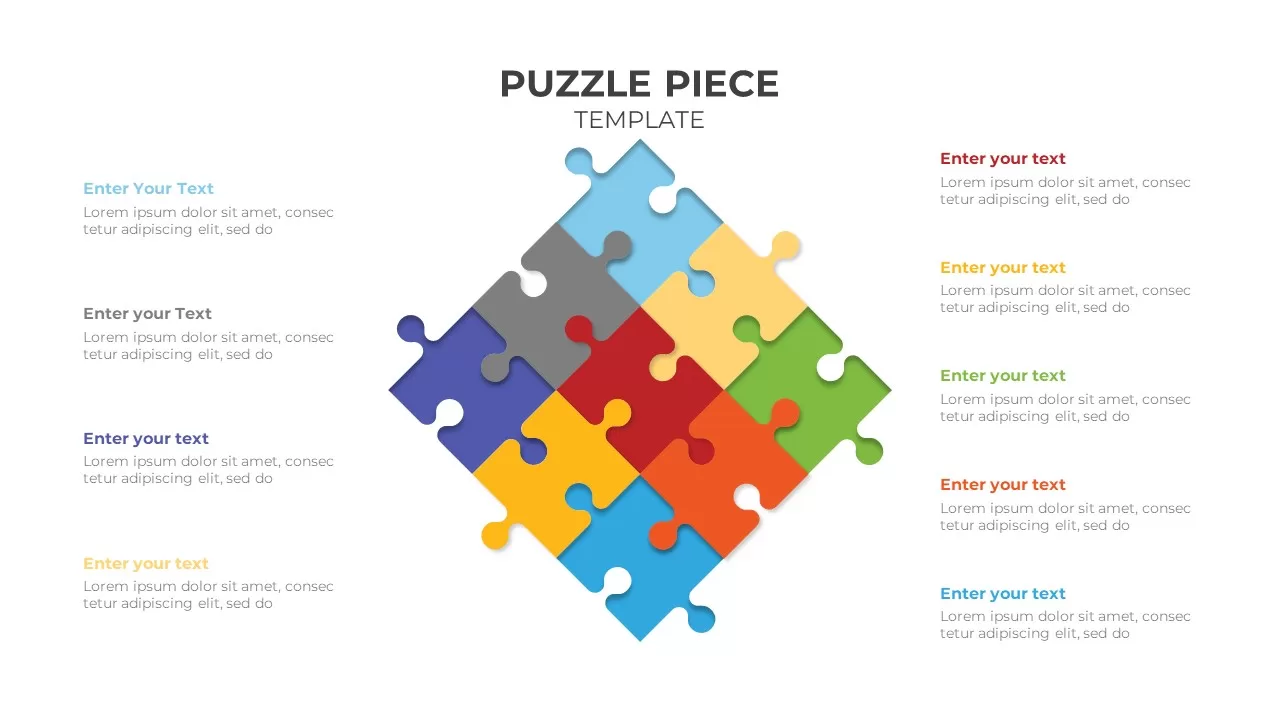
Colorful Nine-Piece Puzzle Diagram Template for PowerPoint & Google Slides
Process
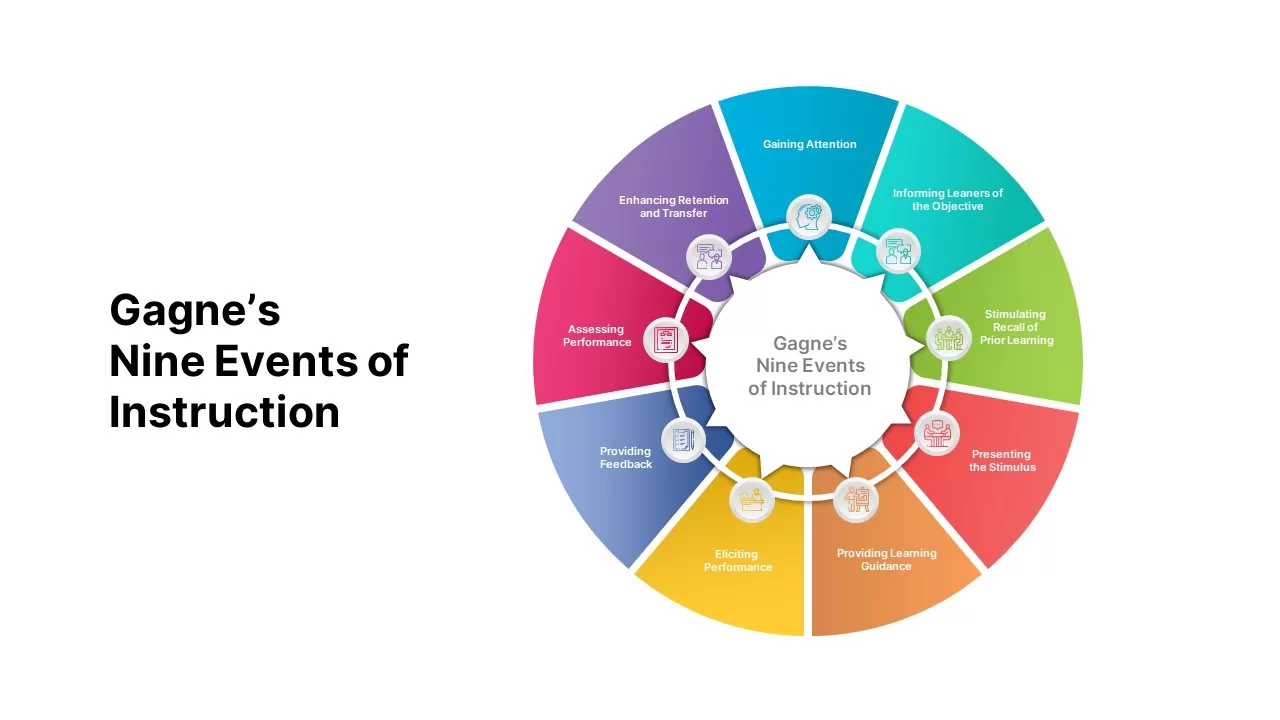
Gagne’s Nine Events of Instruction Diagram for PowerPoint & Google Slides
Infographics

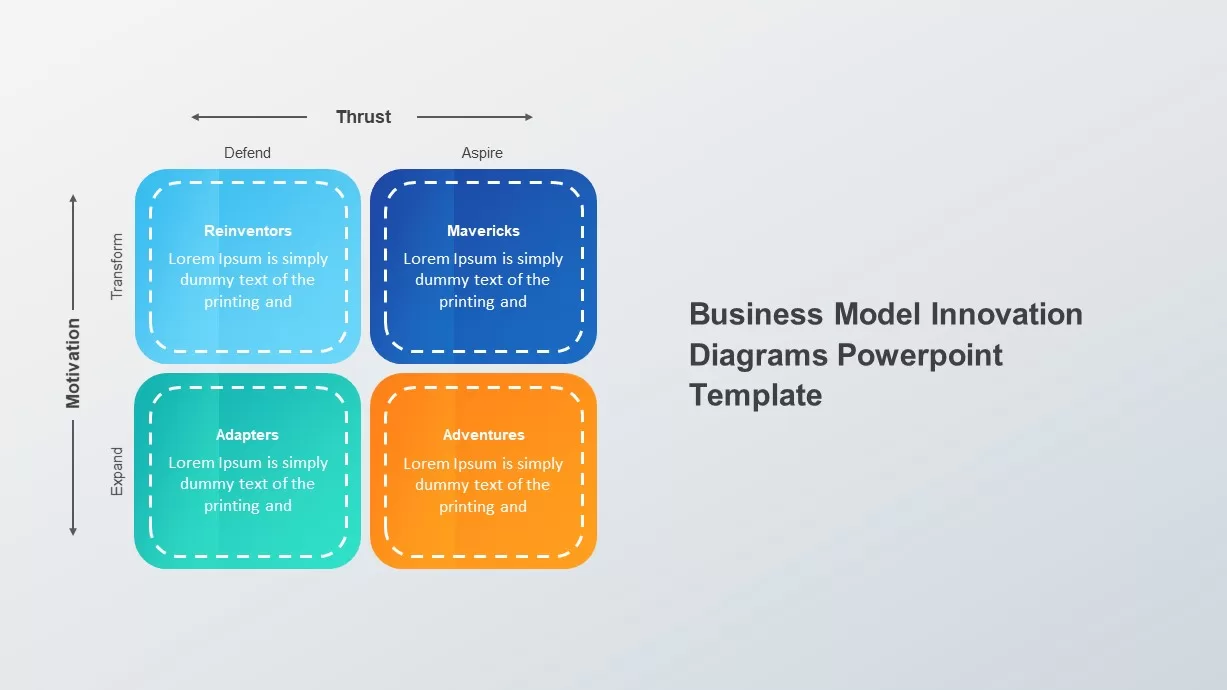
Business Model Innovation Diagrams template for PowerPoint & Google Slides
Process
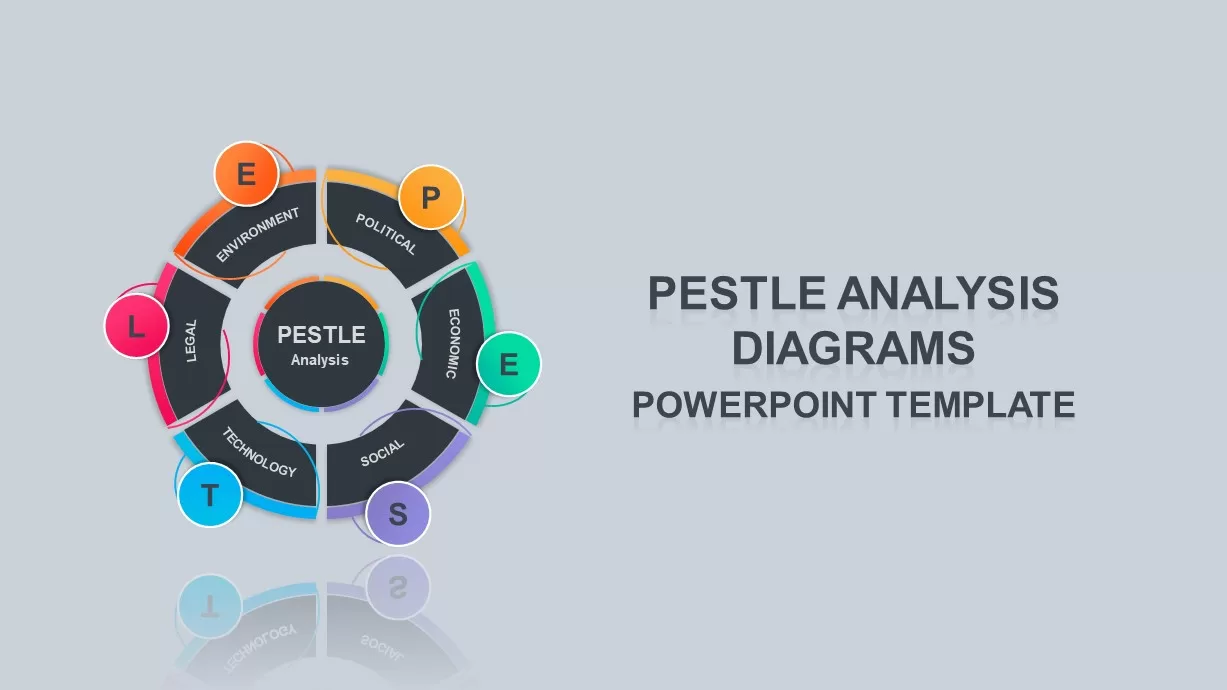
PESTLE and PEST Strategic Analysis Diagrams Template for PowerPoint & Google Slides
Business Strategy
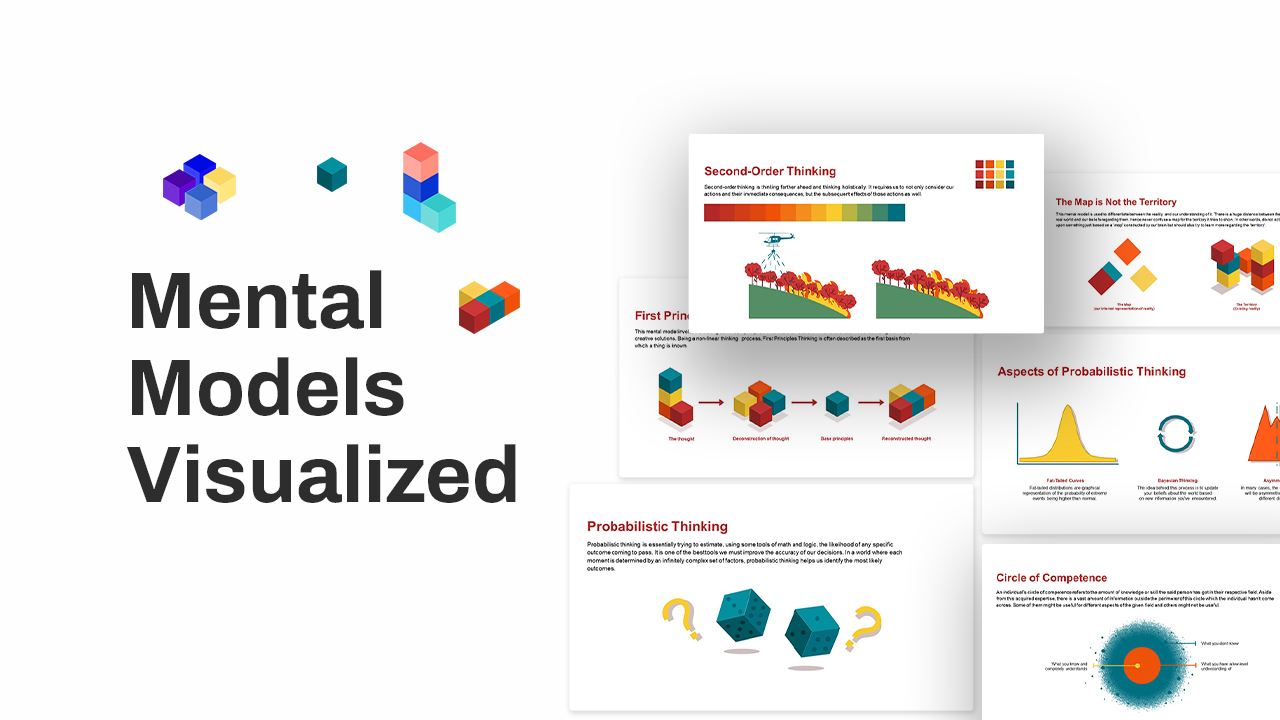
Free Mental Models Infographic Diagrams Template for PowerPoint & Google Slides
Process
Free
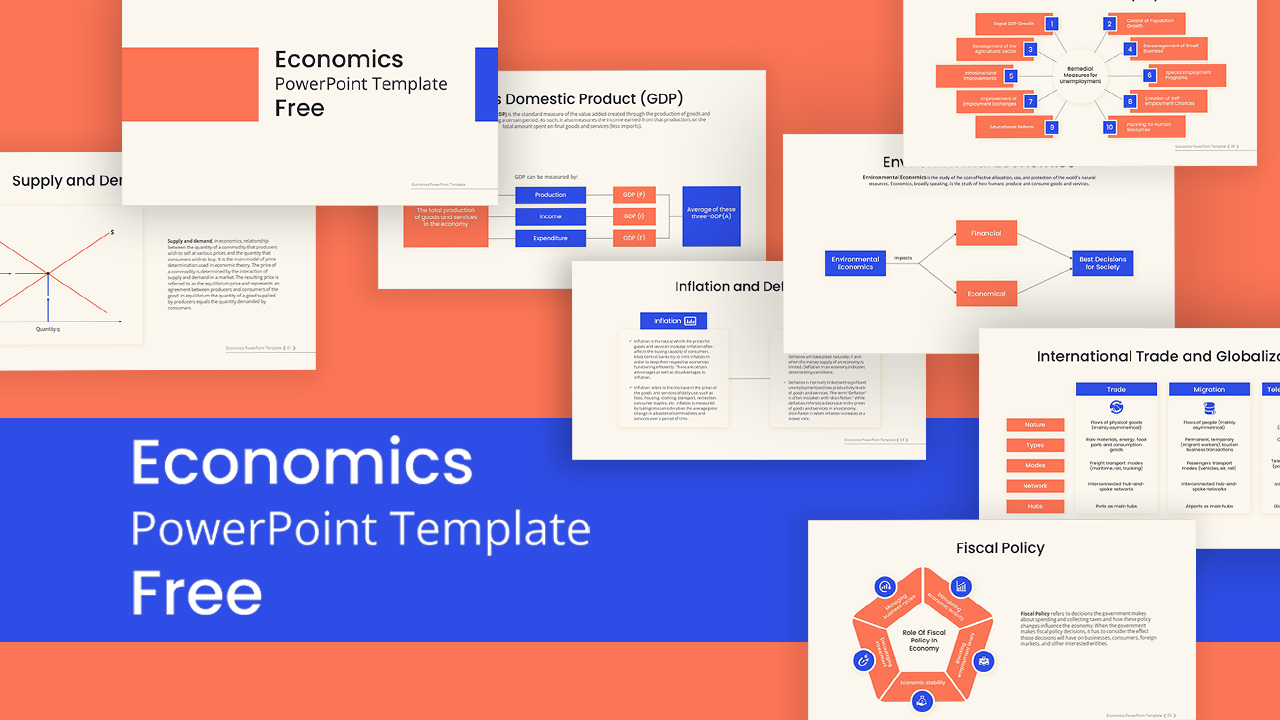
Free Key Economics Concepts & Diagrams Template for PowerPoint & Google Slides
Decks
Free
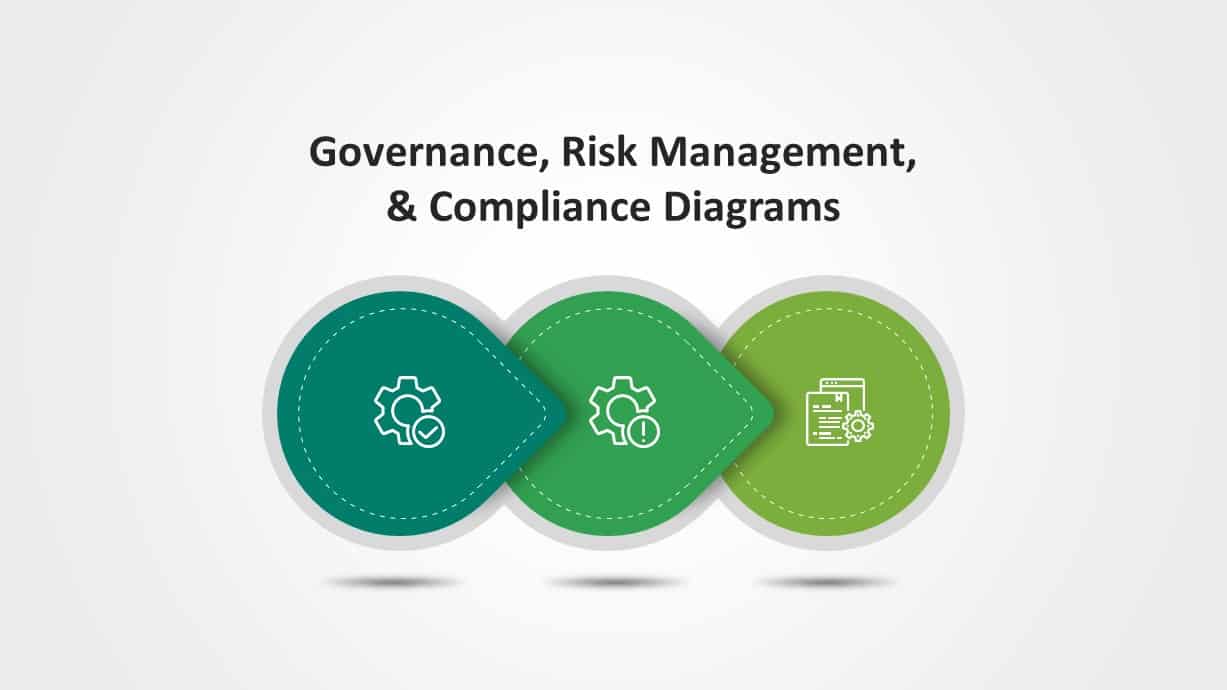
Governance, Risk & Compliance Overview Diagrams for PowerPoint & Google Slides
Risk Management
Innovation Ambition Matrix & Funnel Strategy Slides for PowerPoint & Google Slides
Process
Market Development Matrix Chart Template for PowerPoint & Google Slides
Comparison Chart
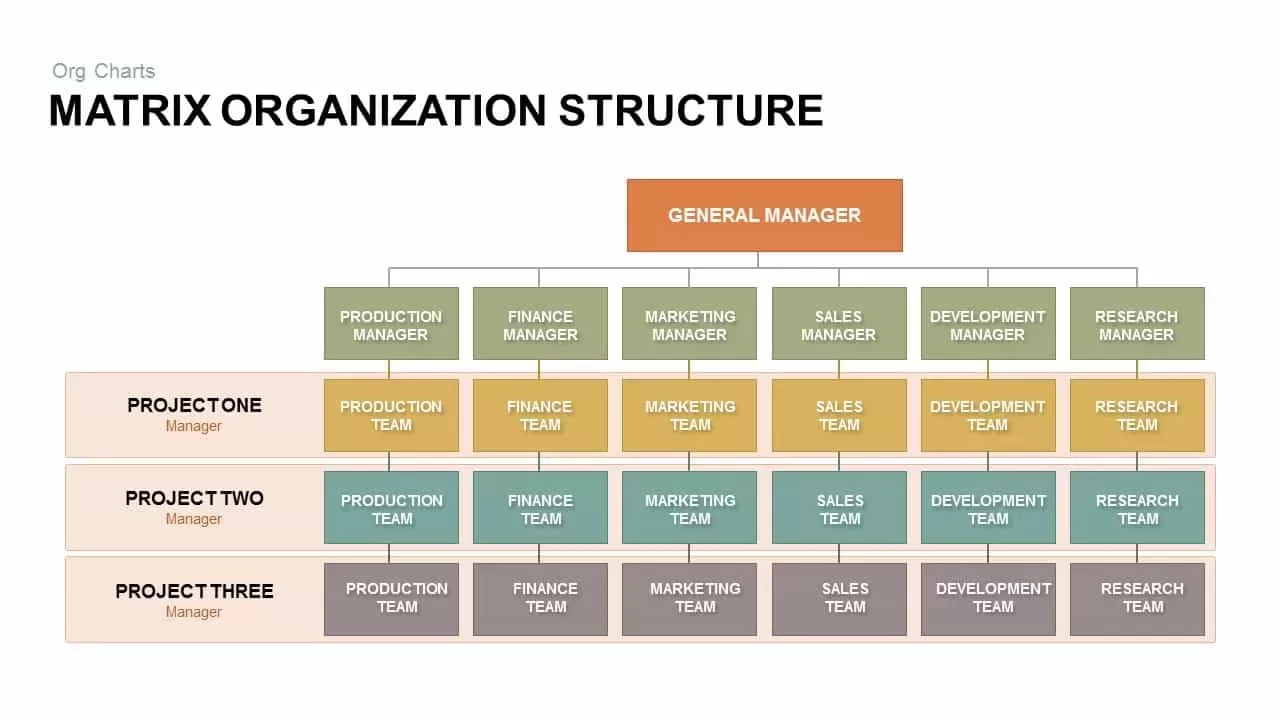
Matrix Organization Structure template for PowerPoint & Google Slides
Org Chart
Ansoff Matrix Growth Strategy Model Template for PowerPoint & Google Slides
BCG

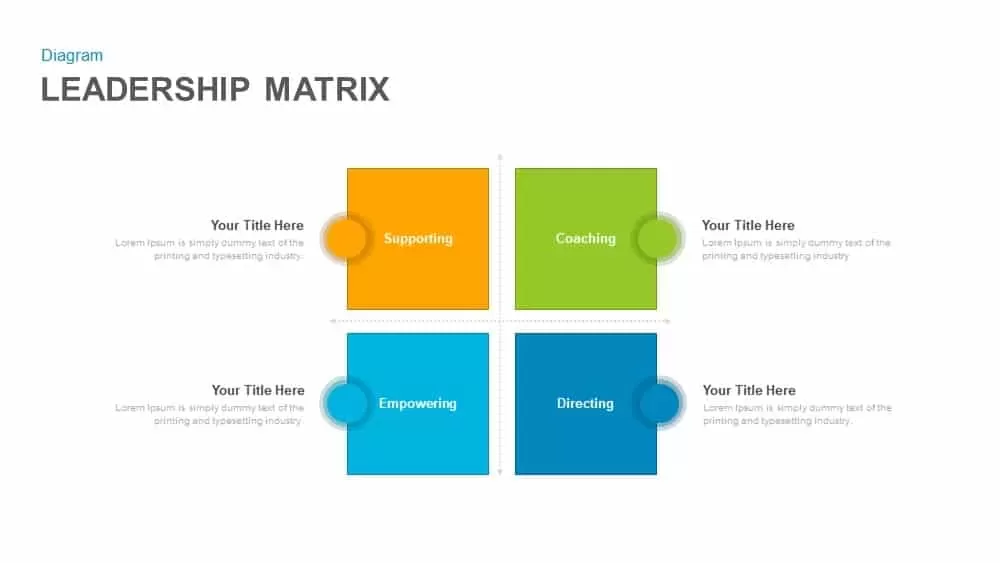
Leadership Matrix with Four Quadrants Template for PowerPoint & Google Slides
Comparison
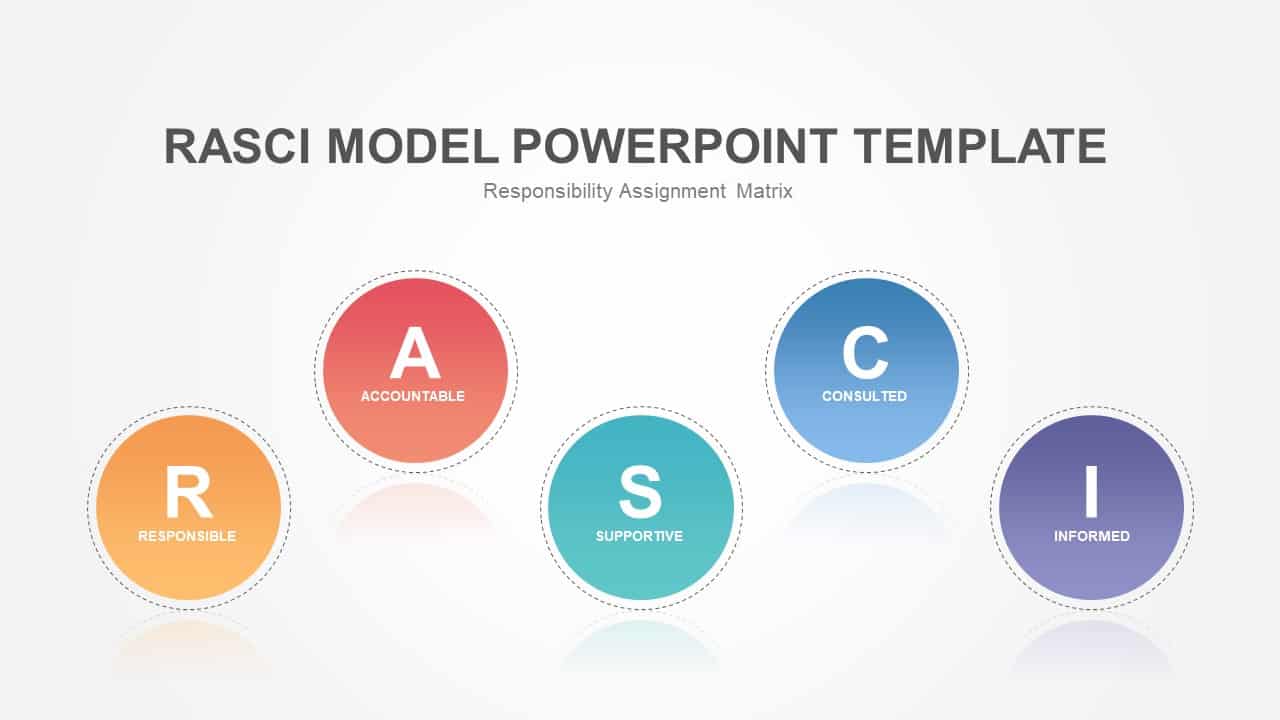
RASCI Responsibility Matrix Chart Template for PowerPoint & Google Slides
Business
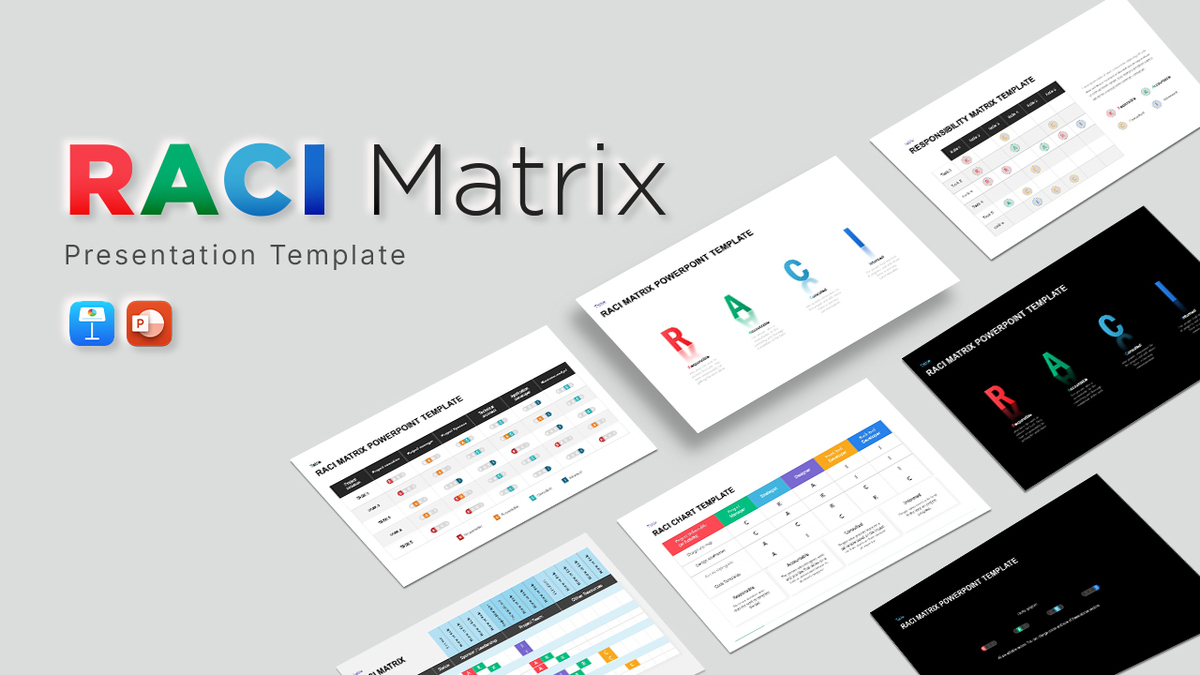
Interactive RACI Responsibility Matrix Template for PowerPoint & Google Slides
Project
Concentric Marketing Matrix Slide Template for PowerPoint & Google Slides
Circular
Three-Year Strategic Plan Matrix Template for PowerPoint & Google Slides
Timeline
Eisenhower Matrix Task Prioritization Template for PowerPoint & Google Slides
Comparison Chart
RASCI Responsibility Assignment Matrix Template for PowerPoint & Google Slides
Project
Strategic ADL Matrix by Industry Life Cycle & Position Template for PowerPoint & Google Slides
Business Strategy
Ansoff Growth Matrix Strategy Diagram Template for PowerPoint & Google Slides
Business Strategy
Supply Positioning Model Matrix Template for PowerPoint & Google Slides
Comparison Chart
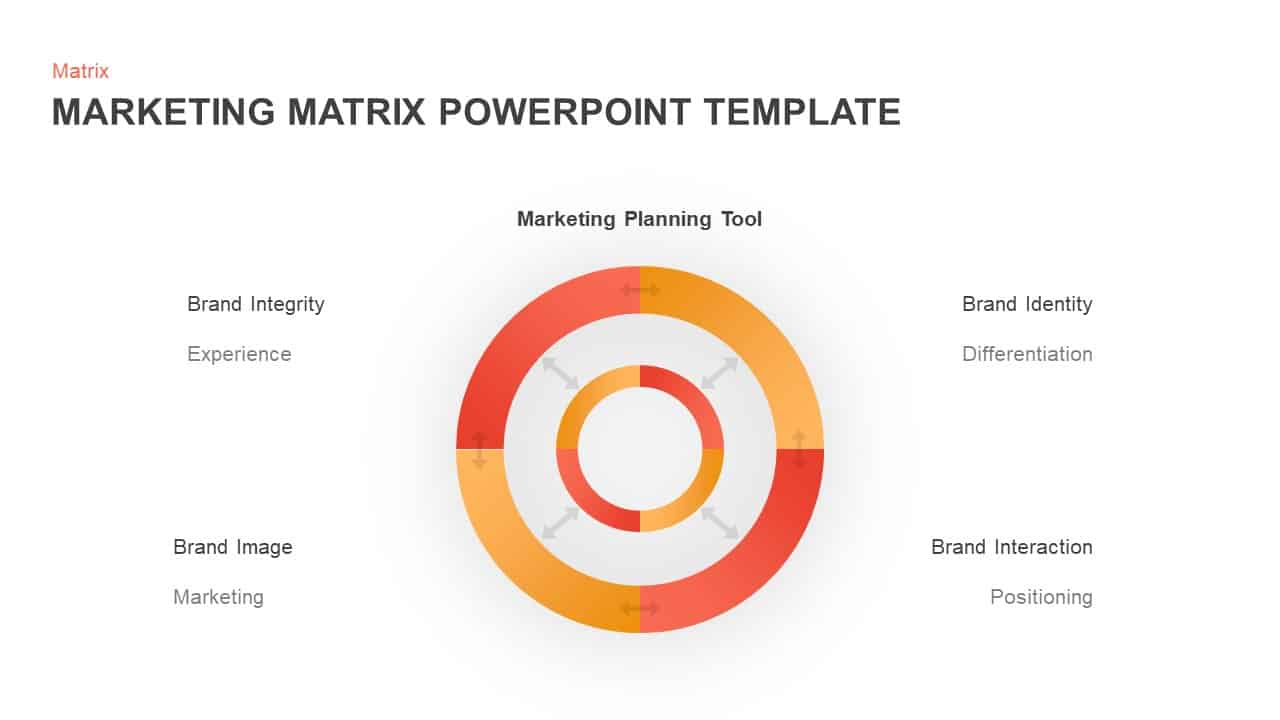
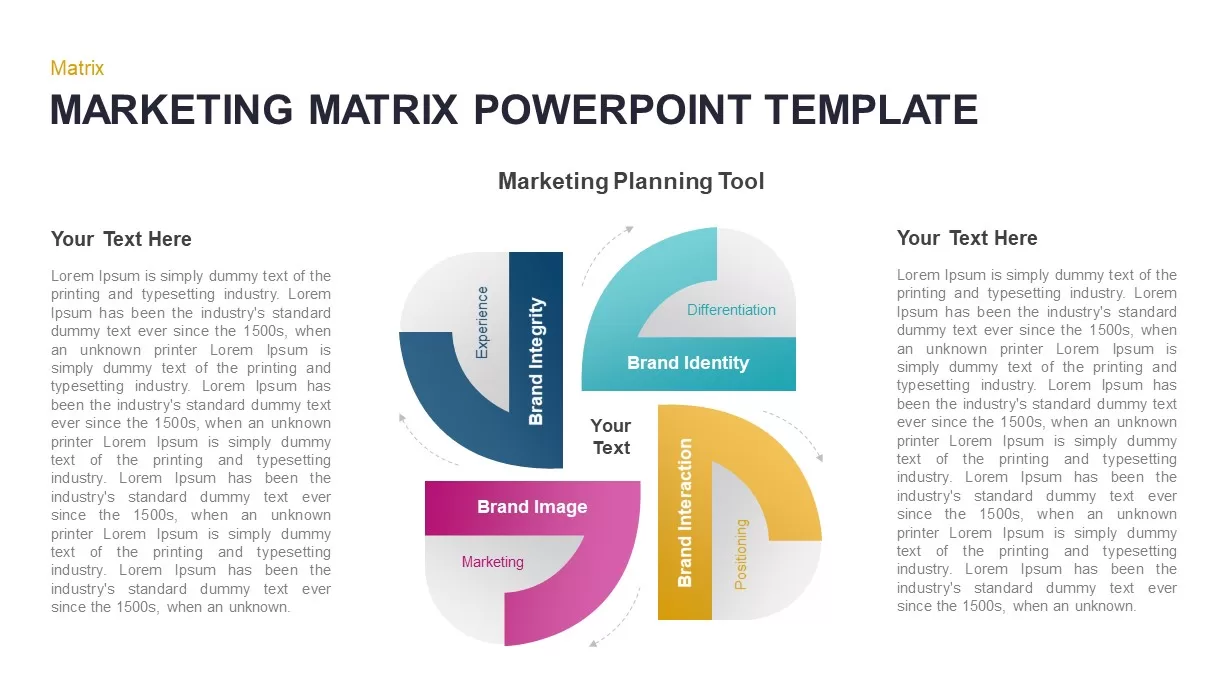
Marketing Matrix Brand Quadrant Diagram Template for PowerPoint & Google Slides
Process
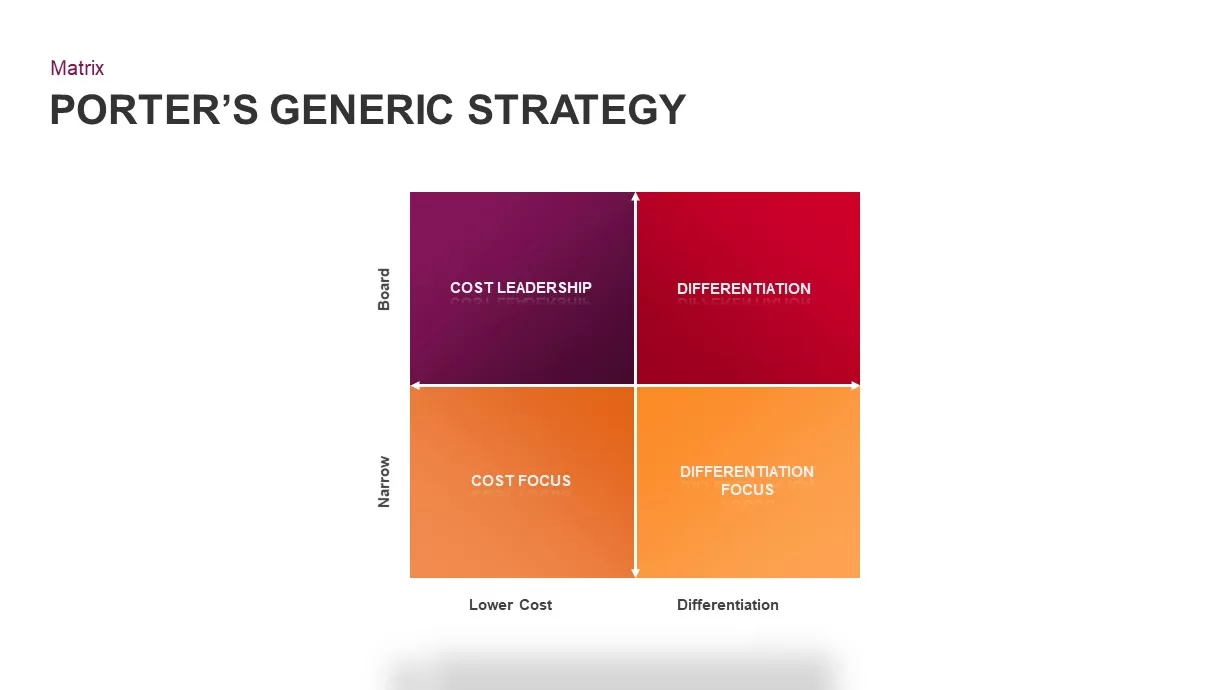
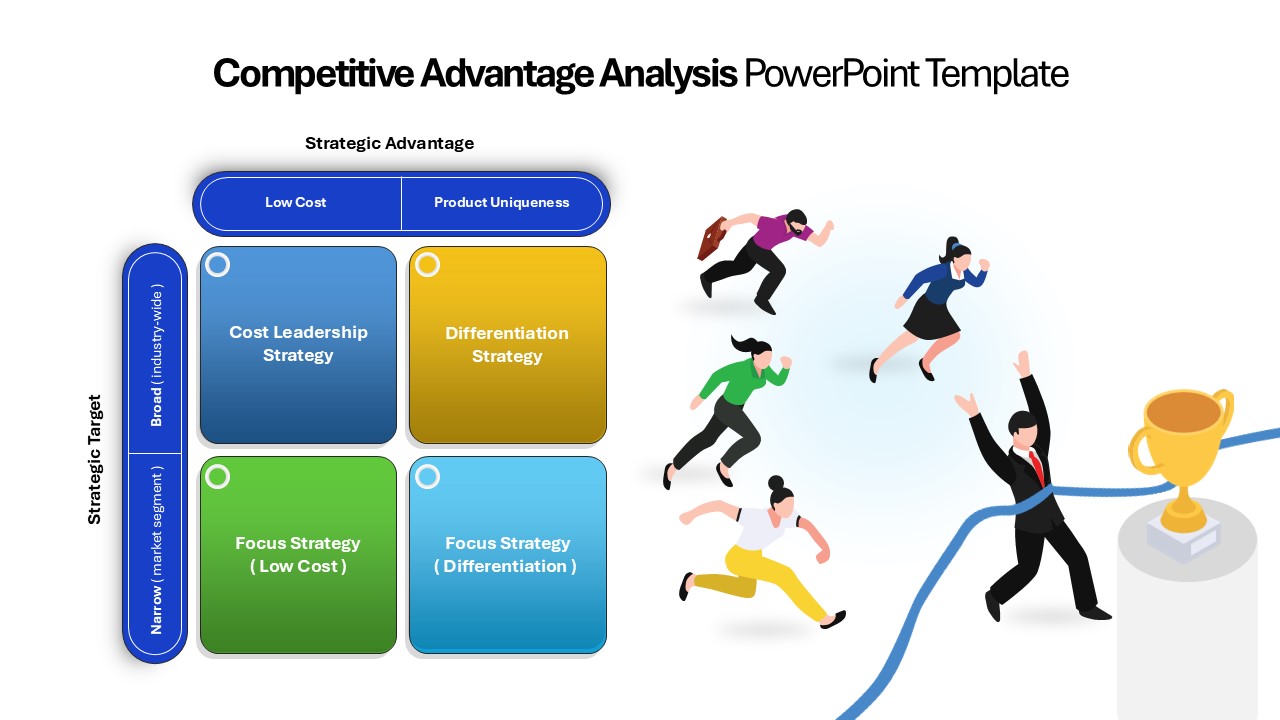
Porter’s Generic Strategy Matrix Diagram Template for PowerPoint & Google Slides
Competitor Analysis
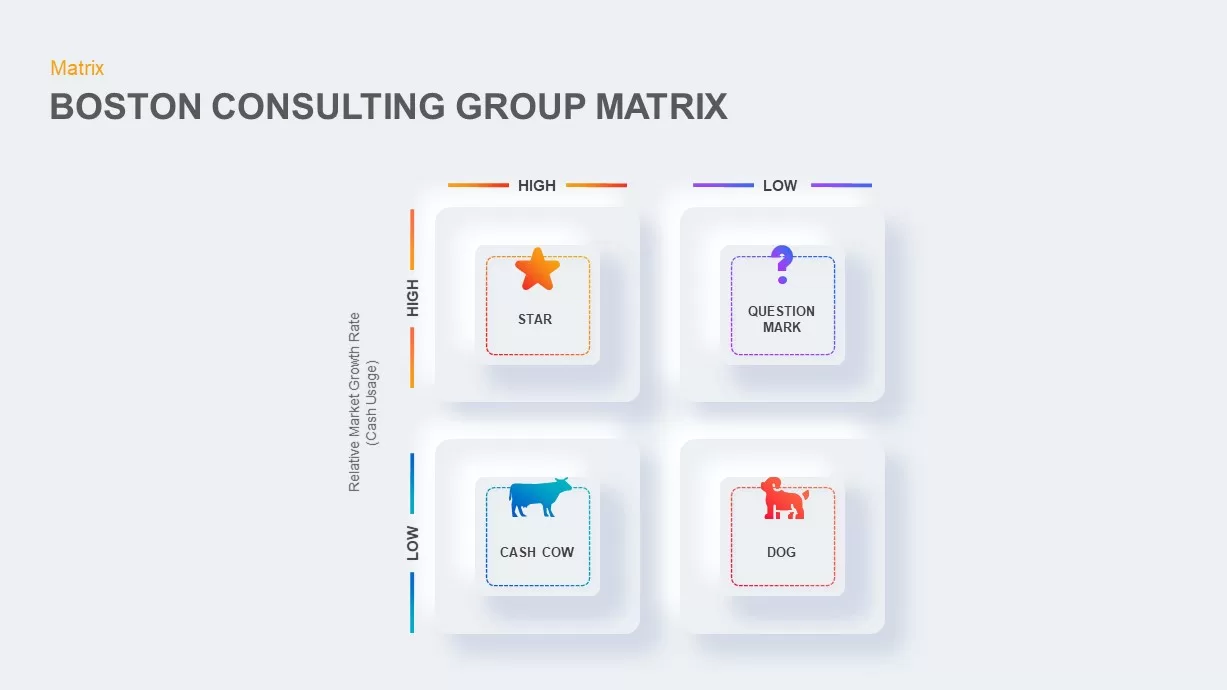
Boston Consulting Group Matrix Diagram Template for PowerPoint & Google Slides
BCG
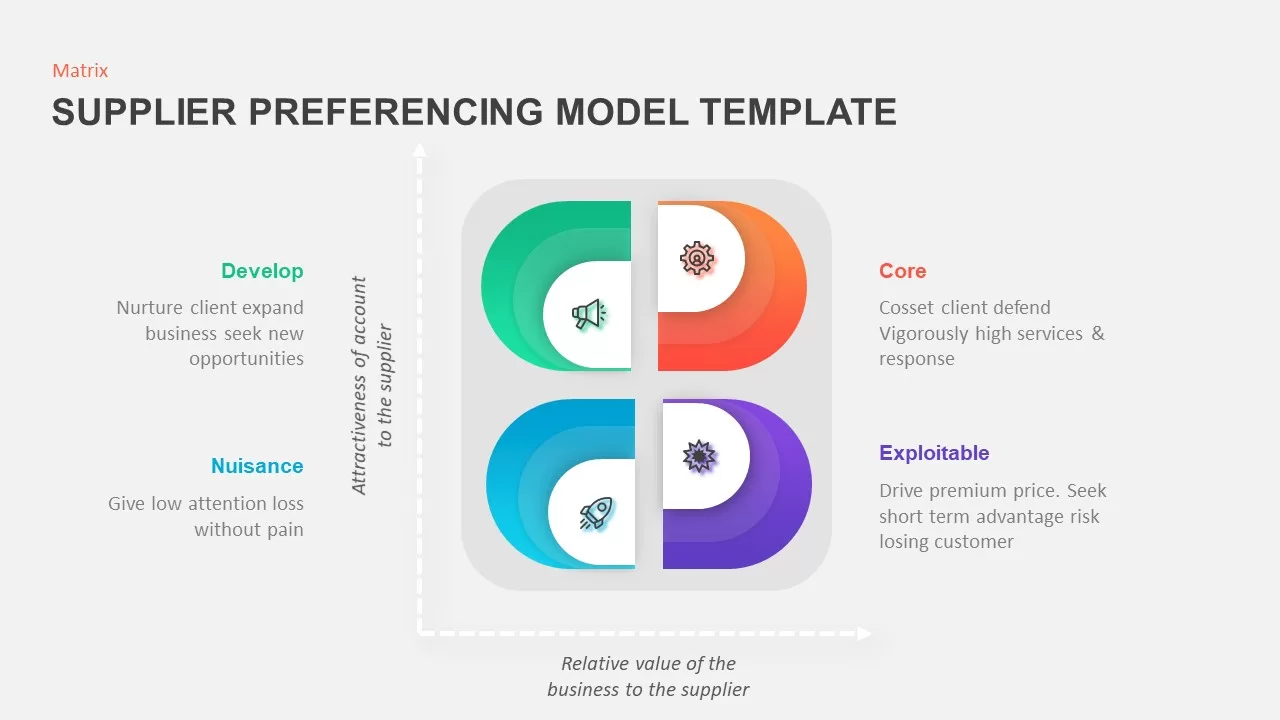
Supplier Preferencing Model Matrix Template for PowerPoint & Google Slides
Business Strategy
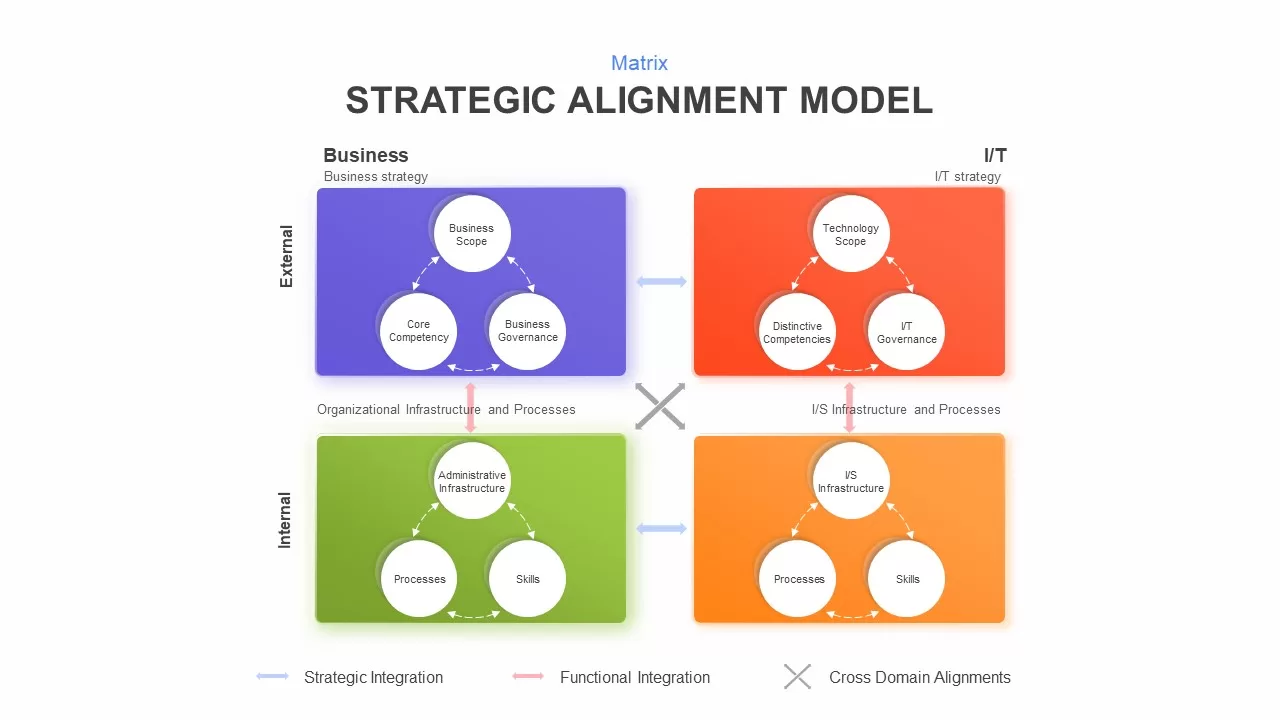
Strategic Alignment Matrix Model Template for PowerPoint & Google Slides
Project
Editable Four-Quadrant TOWS Matrix Template for PowerPoint & Google Slides
Opportunities Challenges
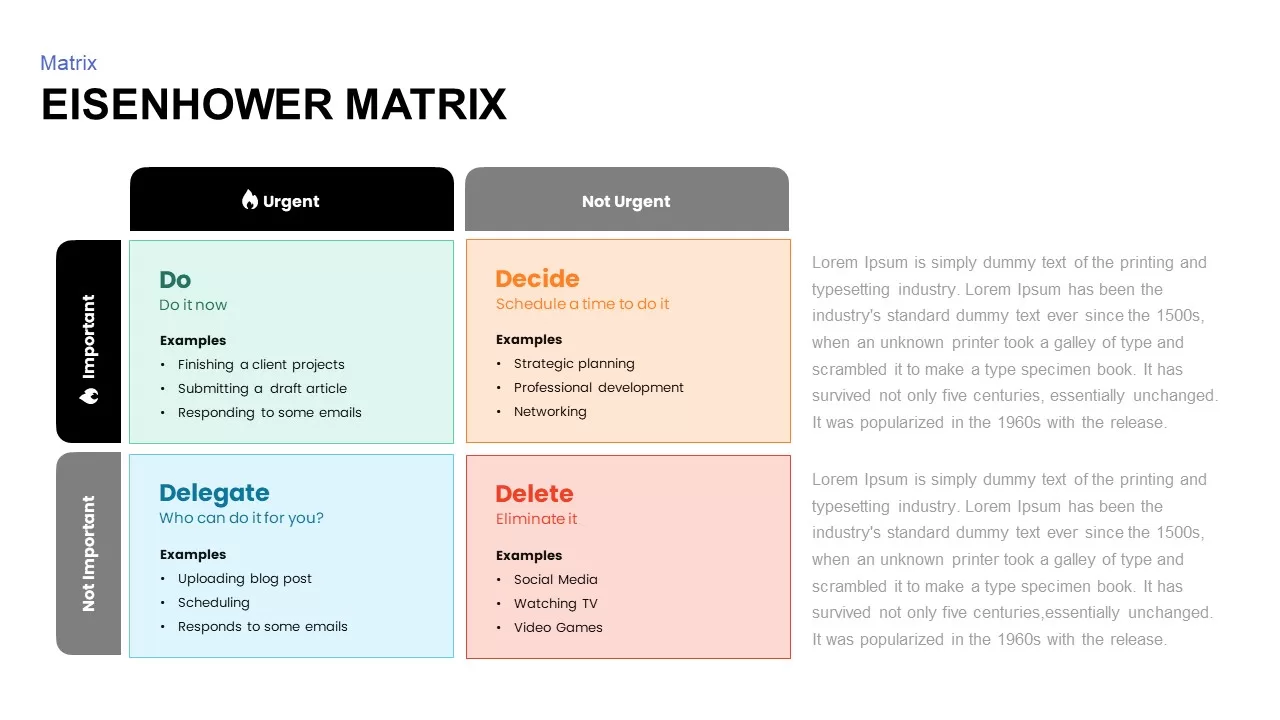
Eisenhower Matrix Decision-Making template for PowerPoint & Google Slides
Infographics
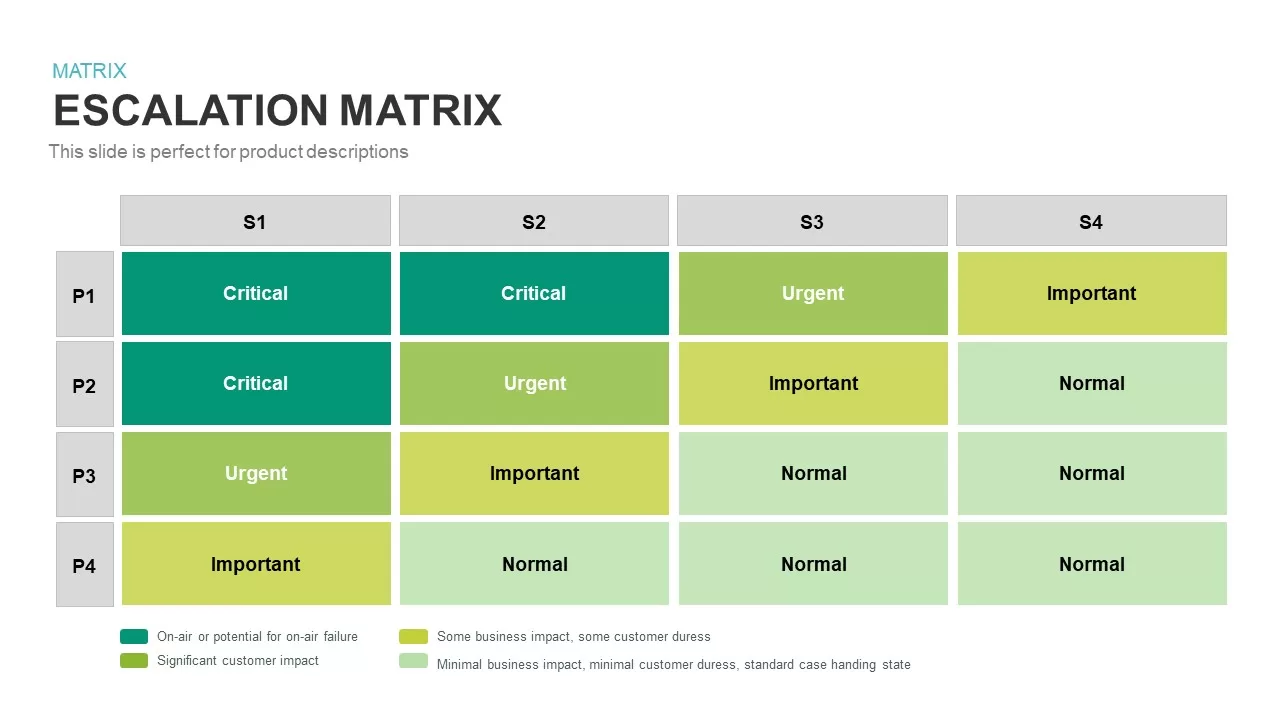
Escalation Matrix template for PowerPoint & Google Slides
Business
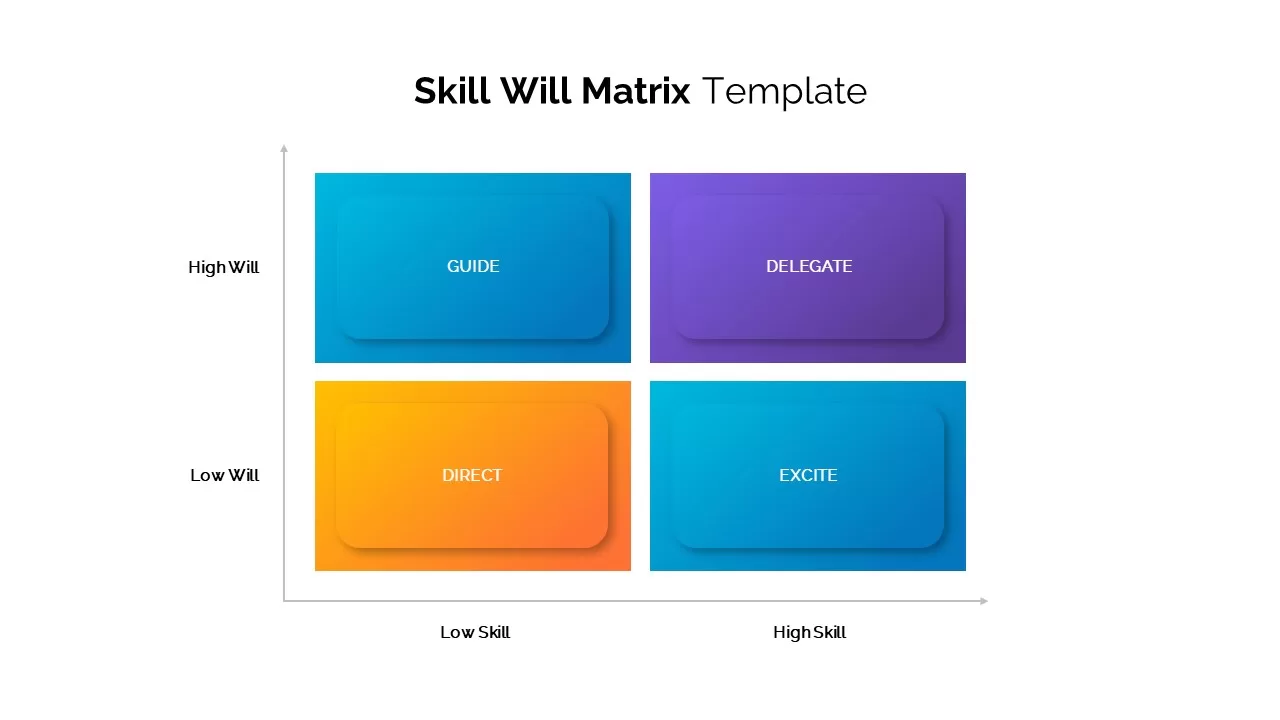
Skill Will Matrix Template for PowerPoint & Google Slides
Infographics
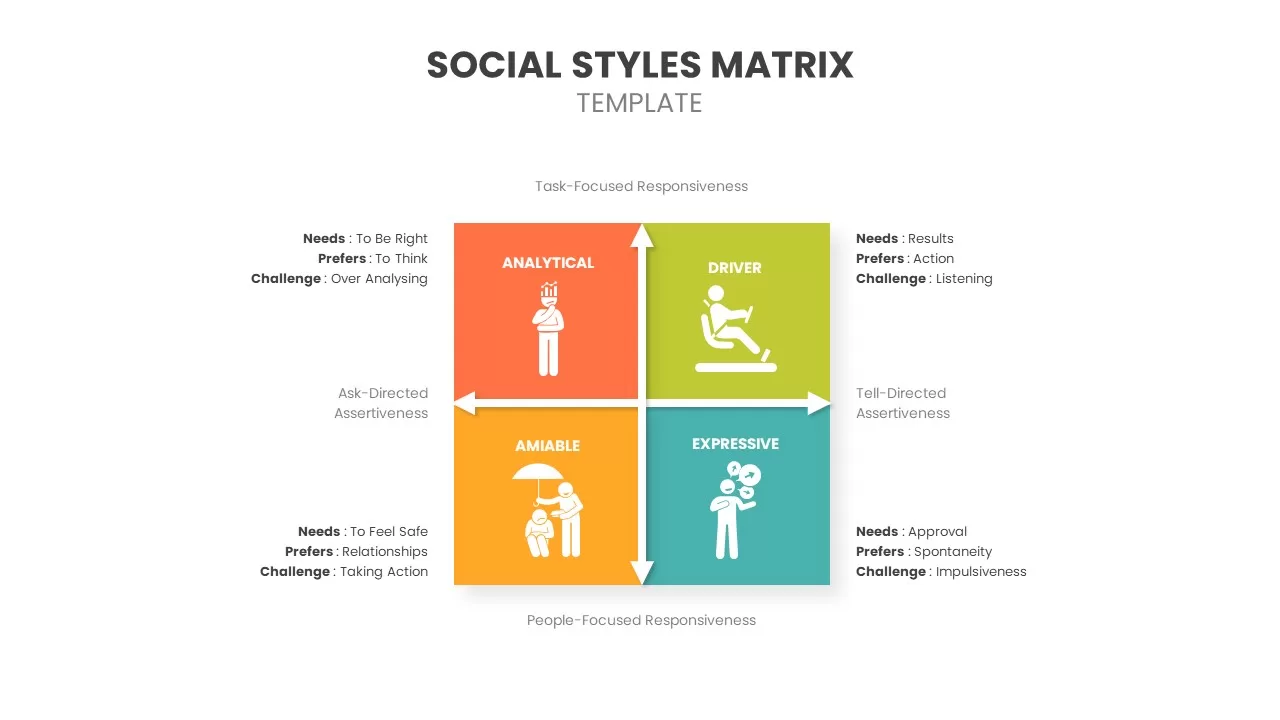
Social Styles Matrix Template for PowerPoint & Google Slides
Business
Pugh Matrix Decision Comparison Chart Template for PowerPoint & Google Slides
Comparison Chart
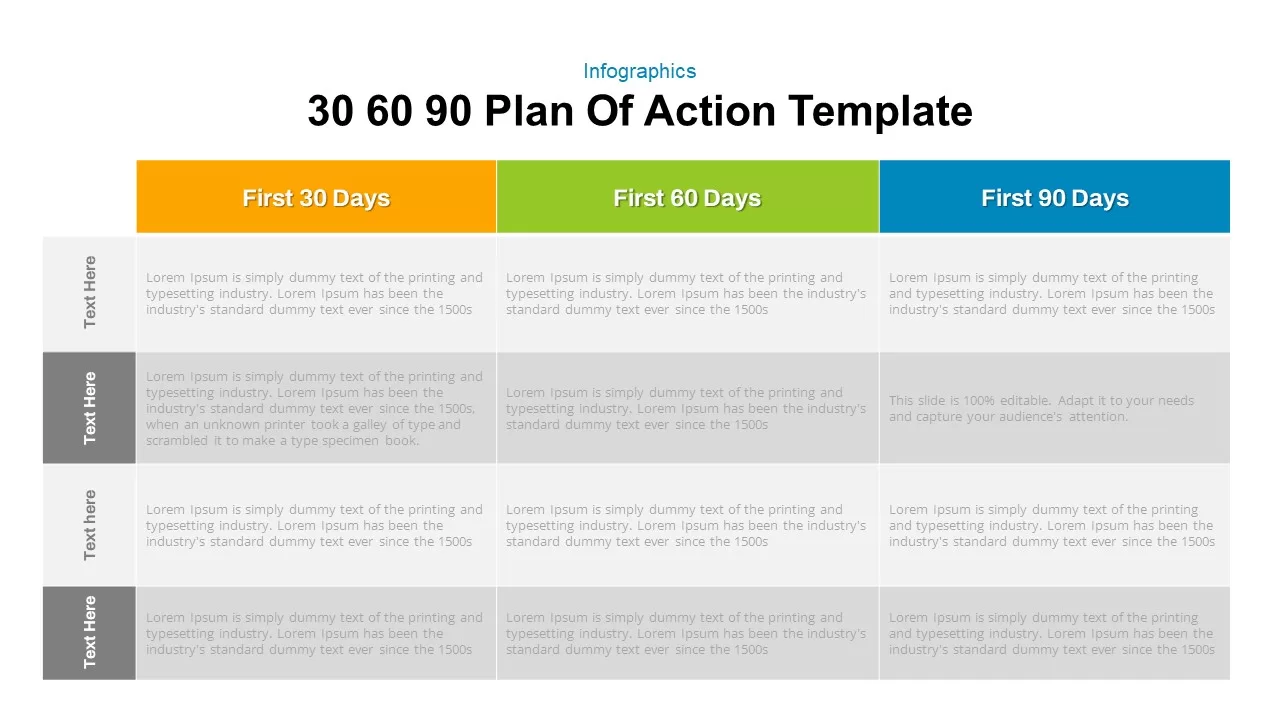
30 60 90 Day Plan Matrix Table Template for PowerPoint & Google Slides
Timeline
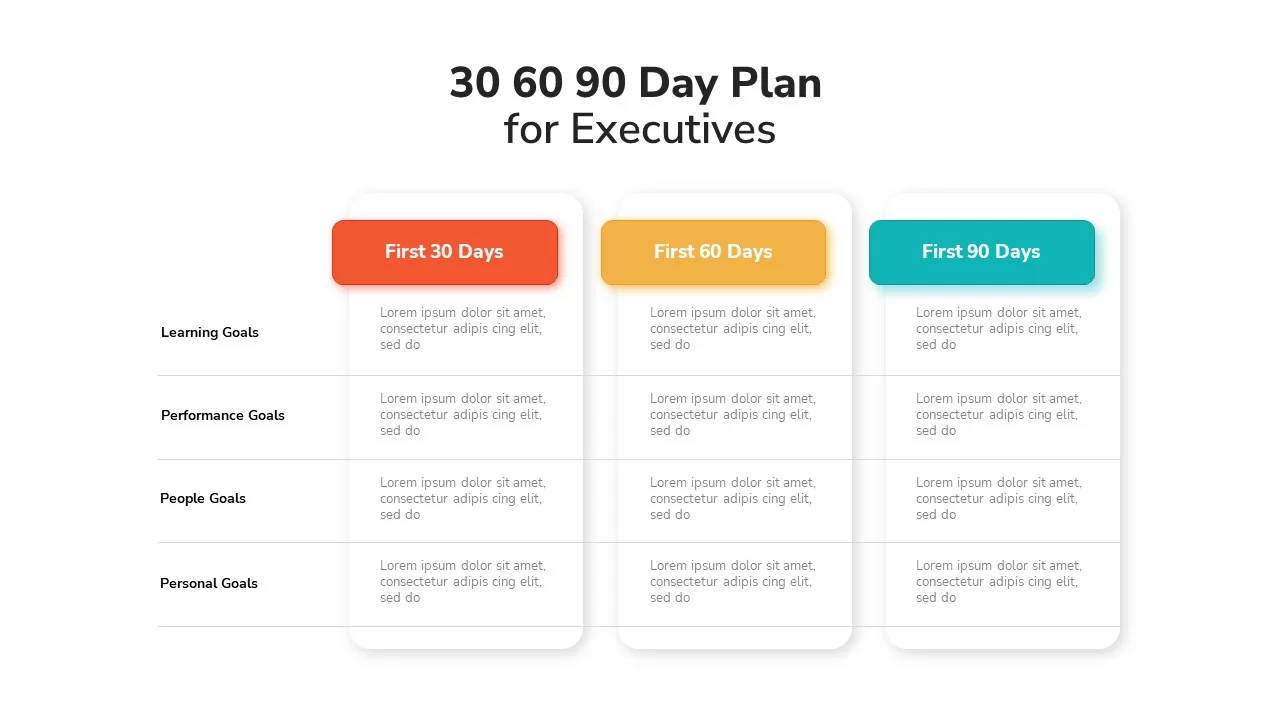
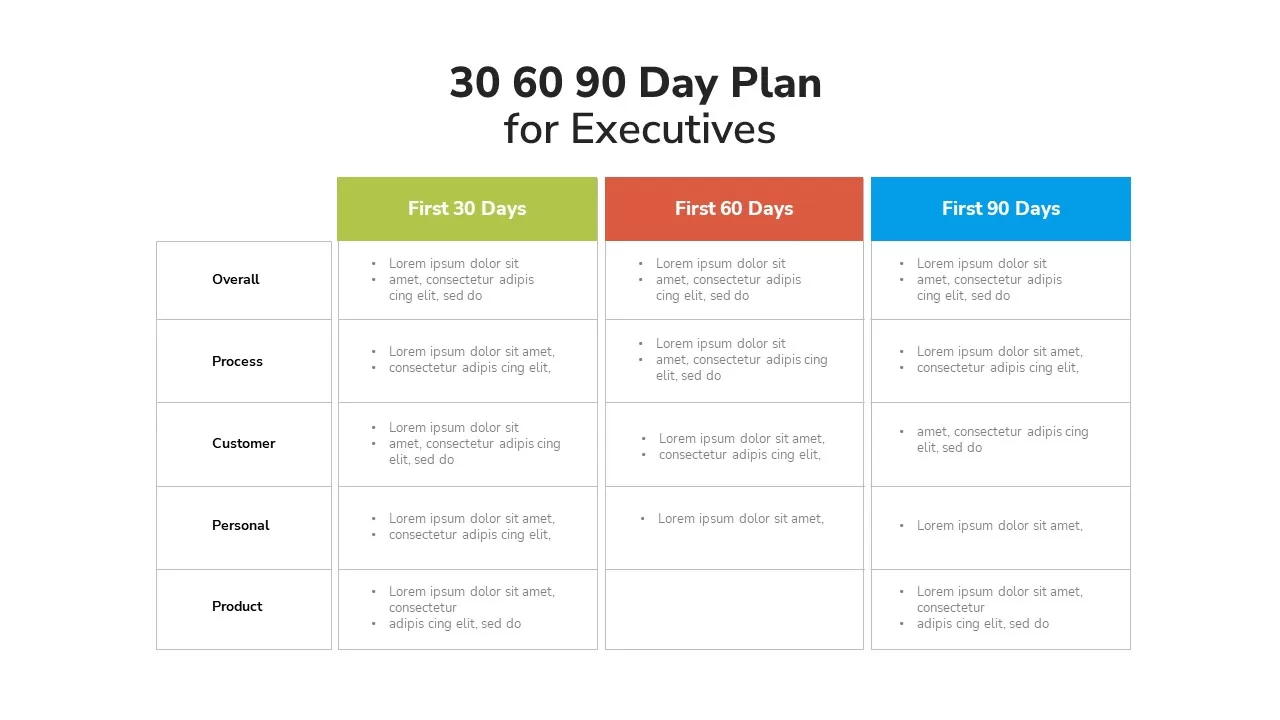
Executive 30-60-90 Day Plan Matrix Template for PowerPoint & Google Slides
Timeline
Executive 30-60-90 Day Plan Matrix Template for PowerPoint & Google Slides
Timeline
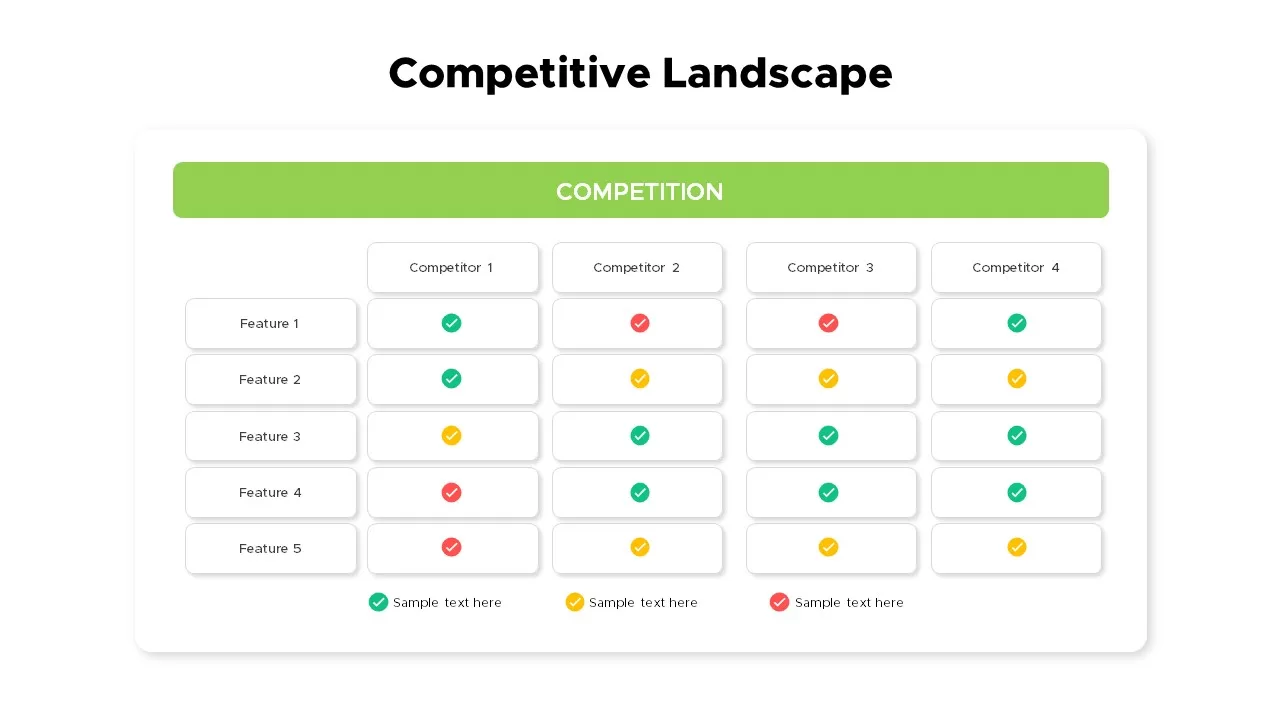
Competitive Landscape Matrix Template for PowerPoint & Google Slides
Comparison
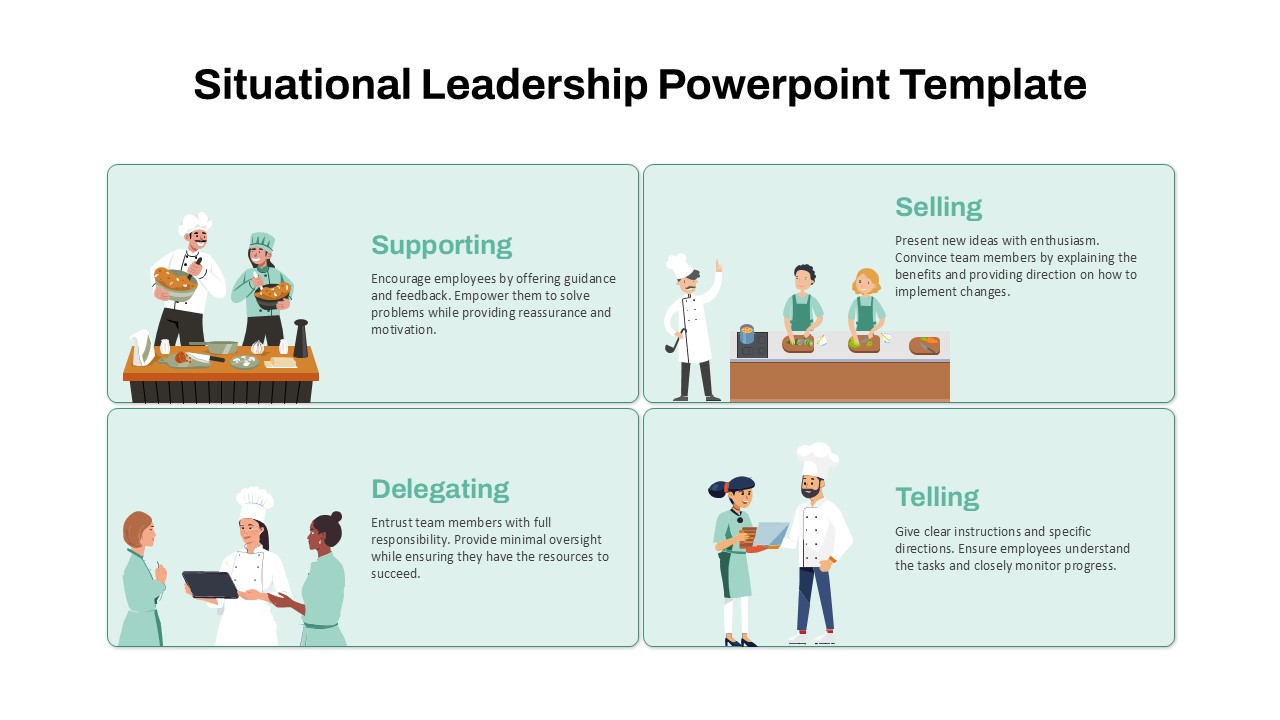
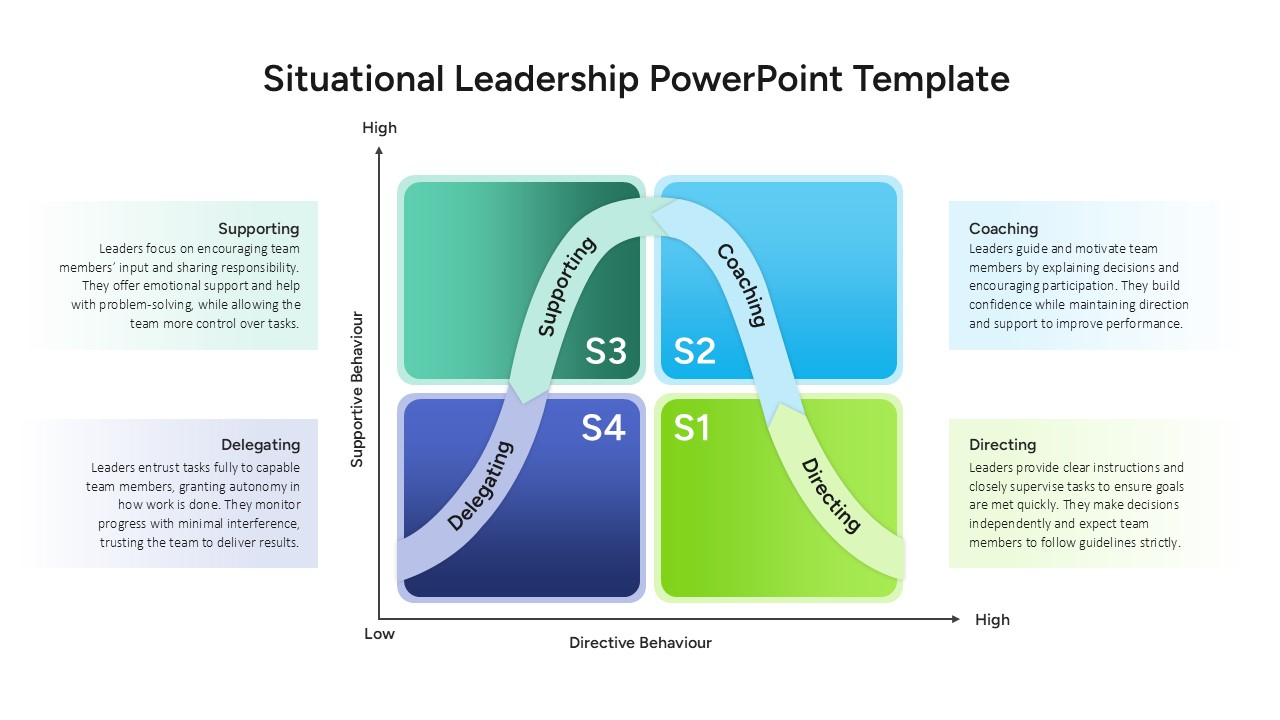
Situational Leadership Matrix Template for PowerPoint & Google Slides
Process
9-Box Matrix for Performance & Potential Template for PowerPoint & Google Slides
Employee Performance
Professional Interactive Heat Map Matrix Template for PowerPoint & Google Slides
Comparison Chart
Heat Map Risk Matrix Dashboard Template for PowerPoint & Google Slides
Comparison Chart
Risk Assessment Heatmap Matrix Slide Template for PowerPoint & Google Slides
Comparison Chart
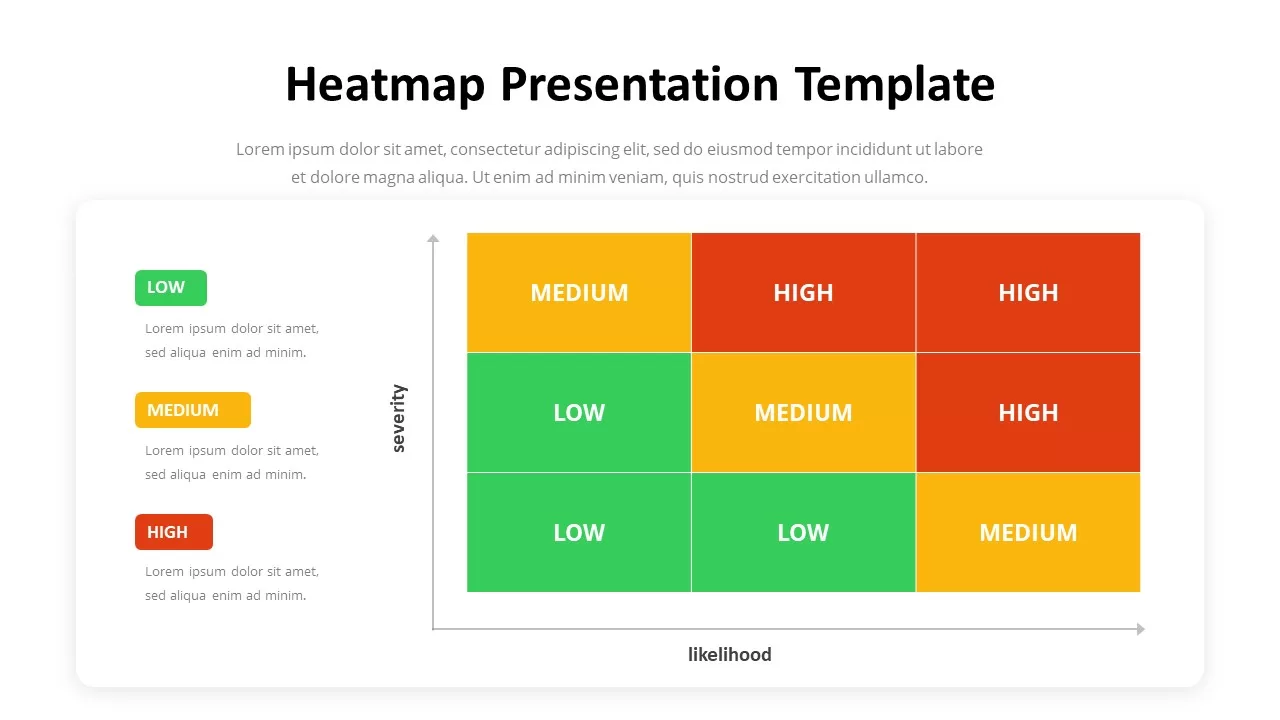
Heatmap Matrix Template for PowerPoint & Google Slides
Maps
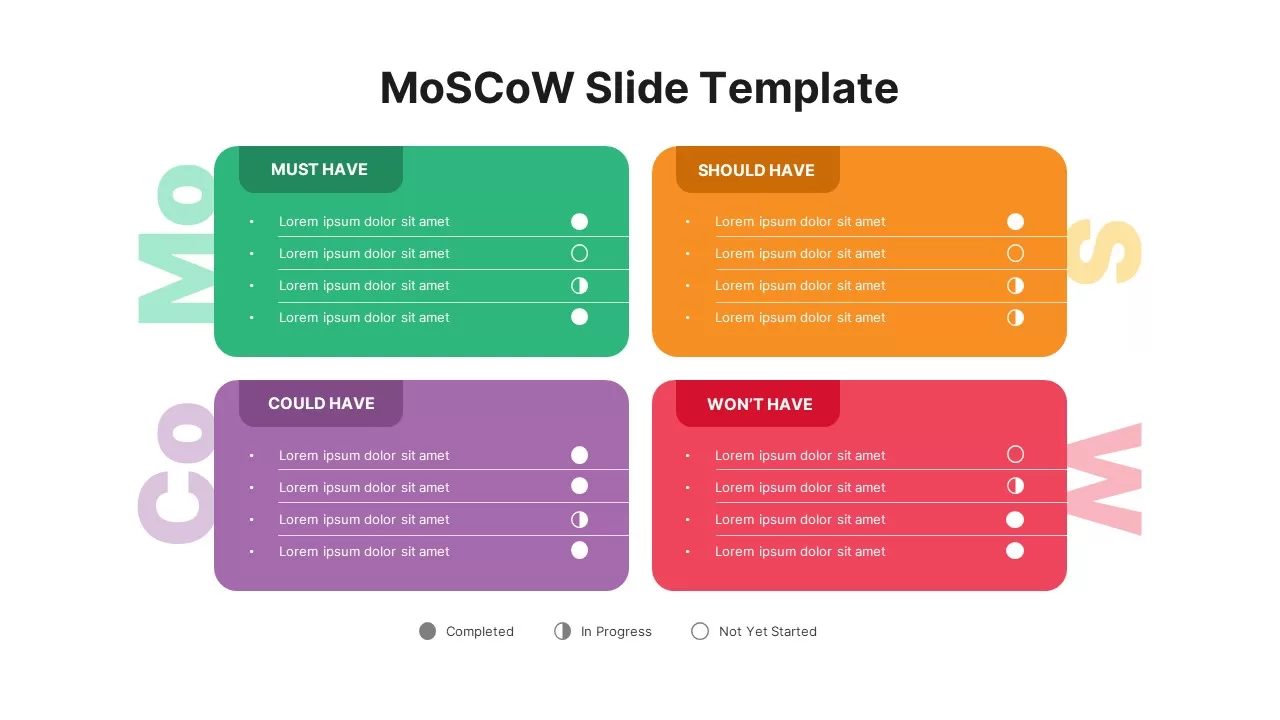
MoSCoW Prioritization Matrix Slide Template for PowerPoint & Google Slides
Business Strategy
Vendor Comparison Matrix with High-Level Requirements template for PowerPoint & Google Slides
Comparison Chart
MABA Attractiveness Matrix Chart Template for PowerPoint & Google Slides
Comparison Chart
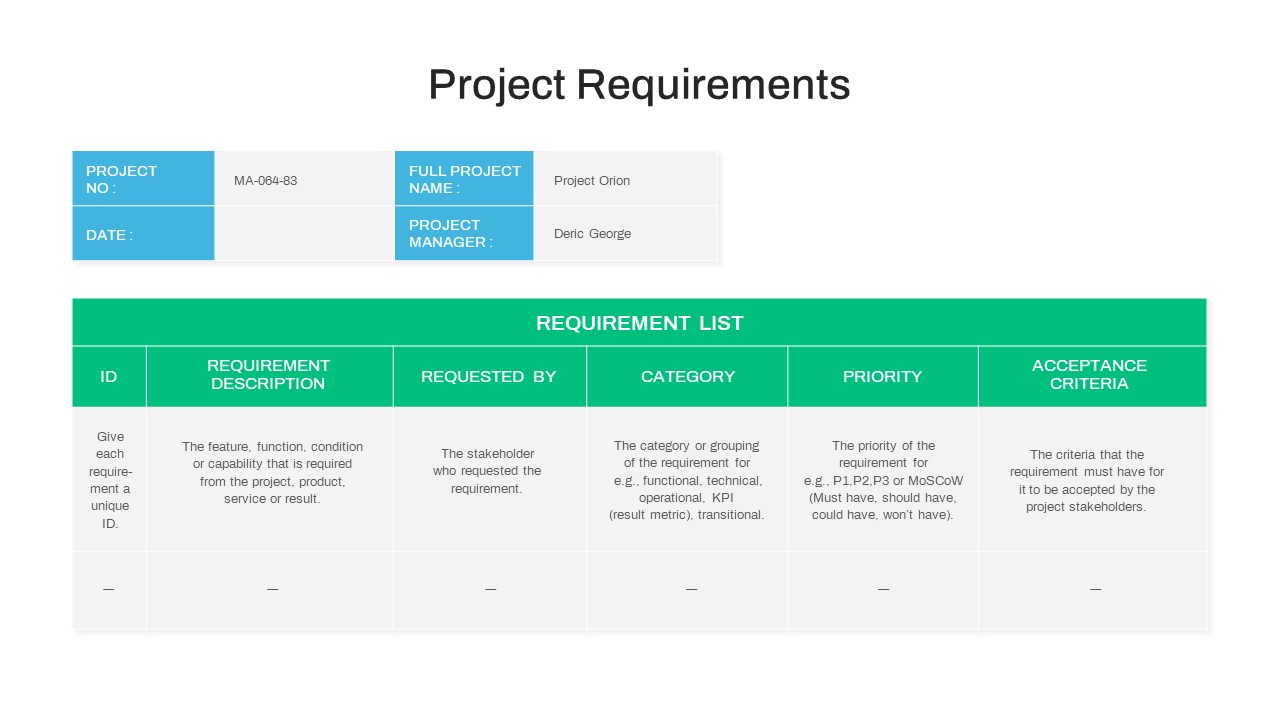
Project Requirements Matrix Template for PowerPoint & Google Slides
Project
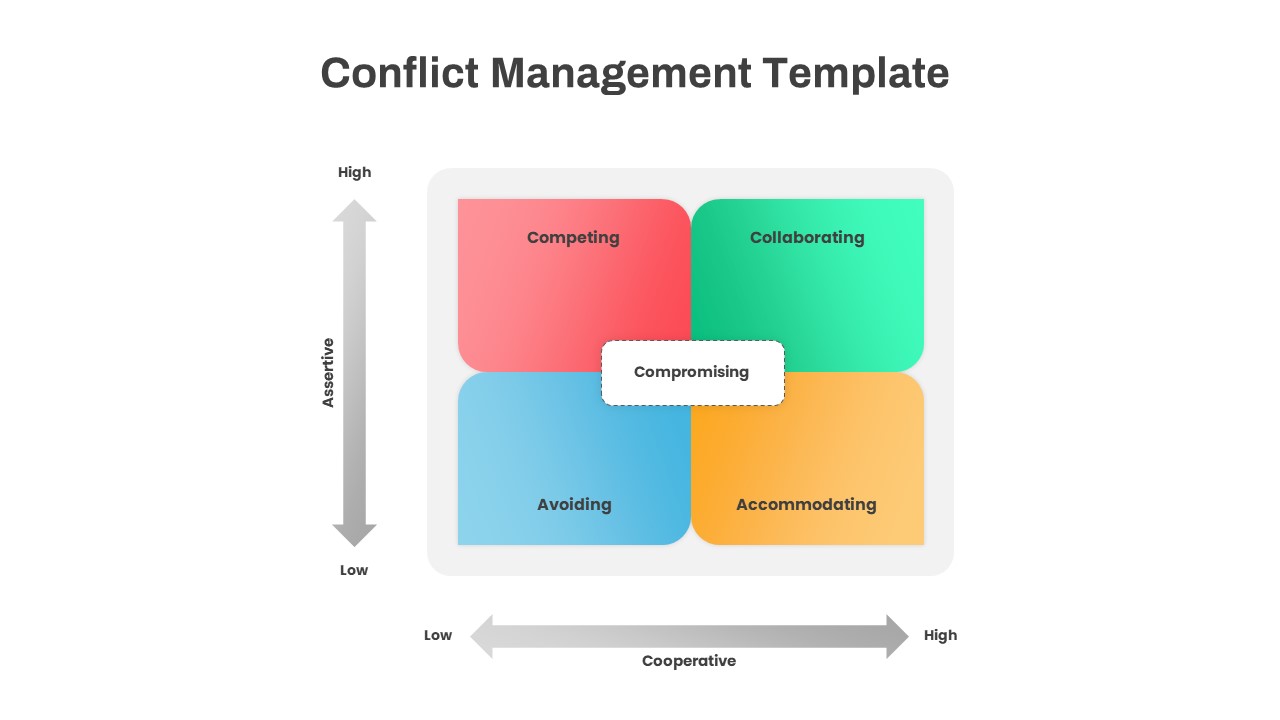
Conflict Management Matrix Template for PowerPoint & Google Slides
Leadership
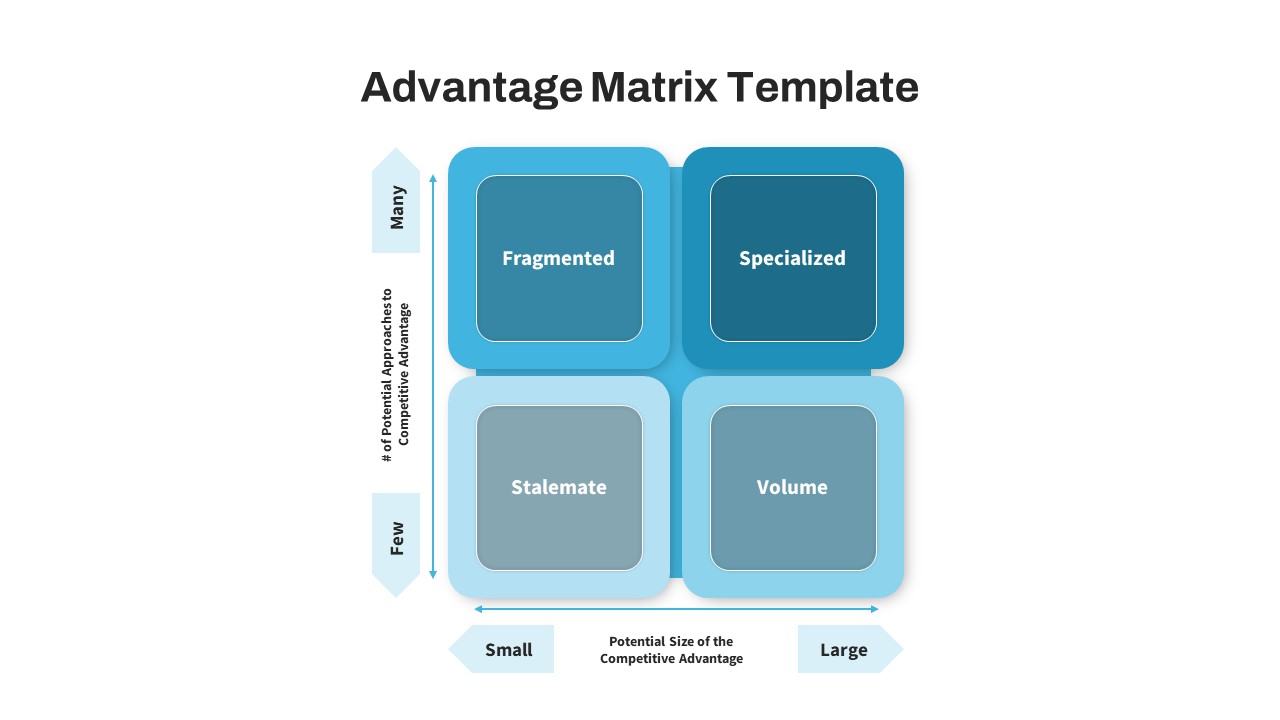
Advantage Matrix 2×2 Framework Template for PowerPoint & Google Slides
Competitor Analysis
Bubble Chart Scatter, Diagram & Matrix Template for PowerPoint & Google Slides
Comparison Chart
Business Growth Strategies Matrix Template for PowerPoint & Google Slides
Comparison
Free Competitor Analysis Matrix Template for PowerPoint & Google Slides
Competitor Analysis
Free
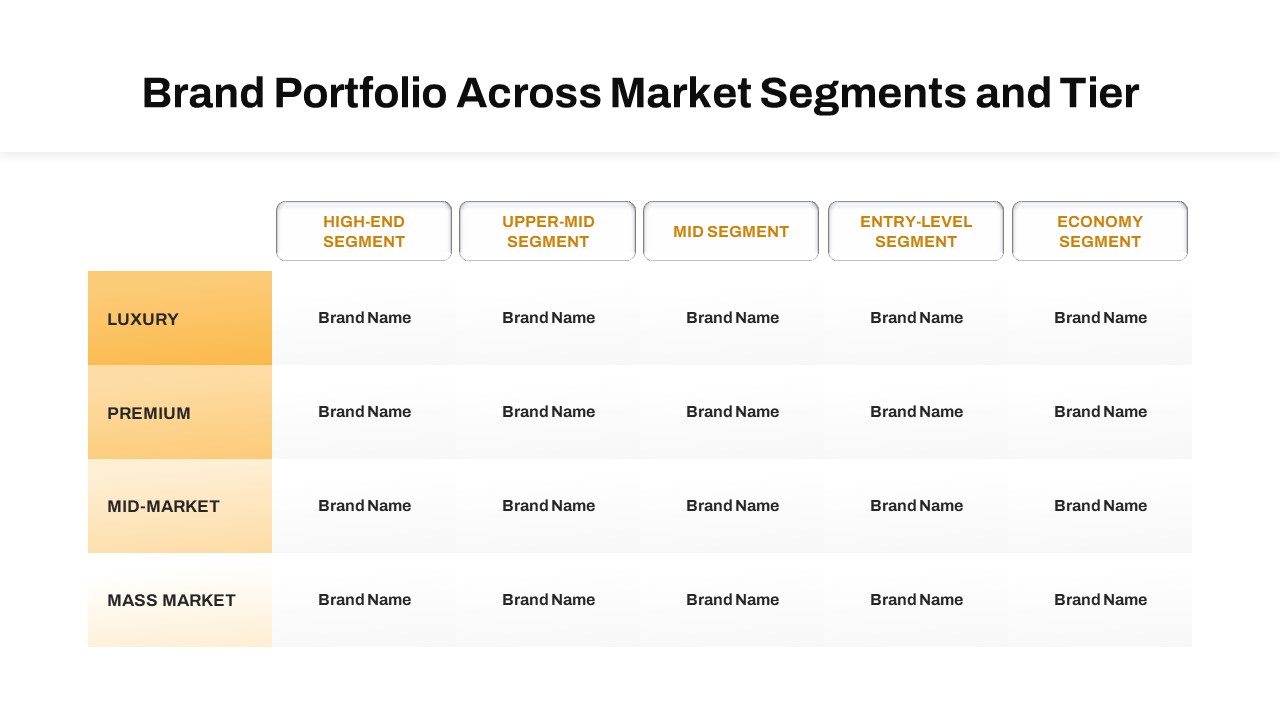
Brand Portfolio Matrix: Segments & Tiers Template for PowerPoint & Google Slides
Business Report
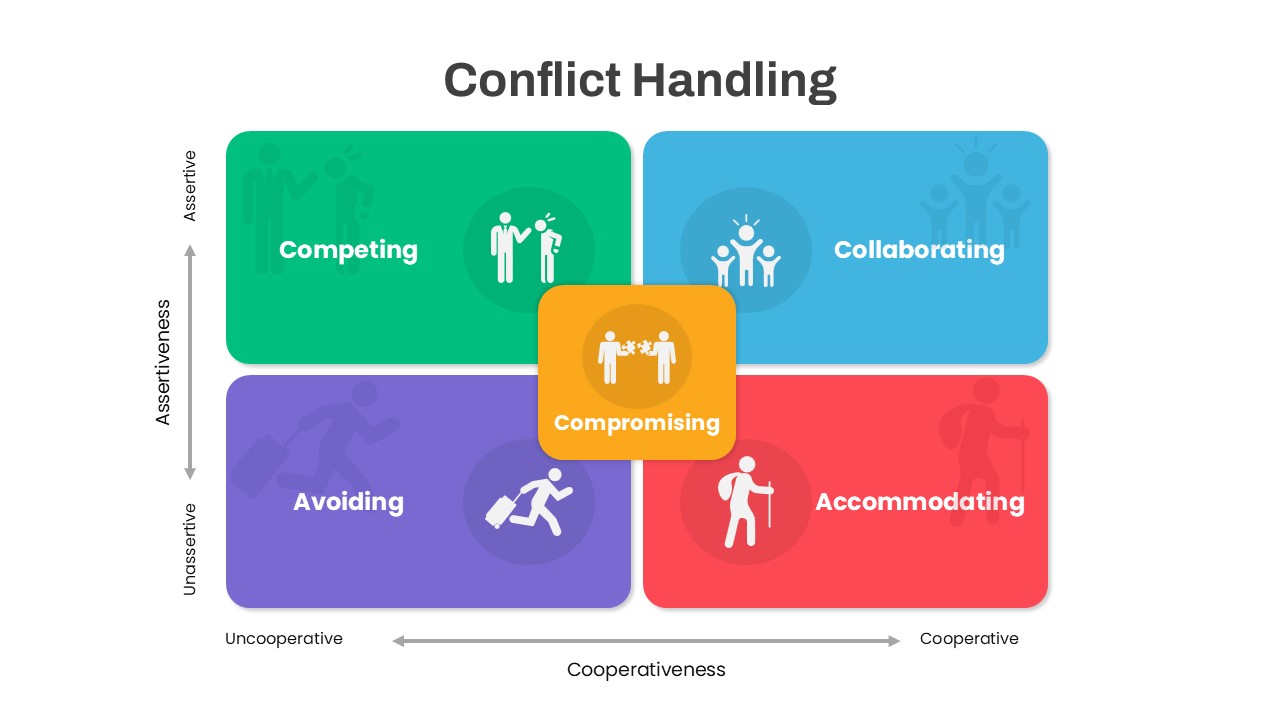
Colorful Conflict Handling Matrix Template for PowerPoint & Google Slides
Comparison
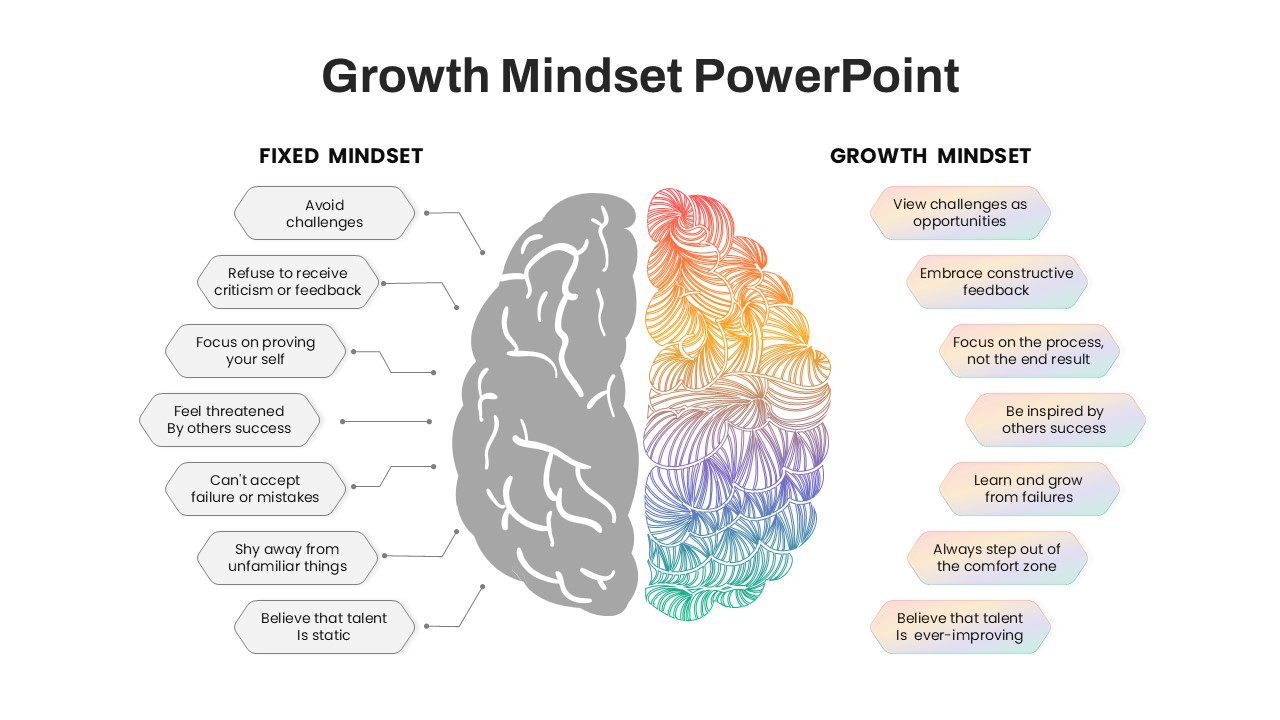
Fixed vs Growth Mindset Matrix Template for PowerPoint & Google Slides
Comparison
Decision Matrix & Prioritization Chart Template for PowerPoint & Google Slides
Comparison Chart
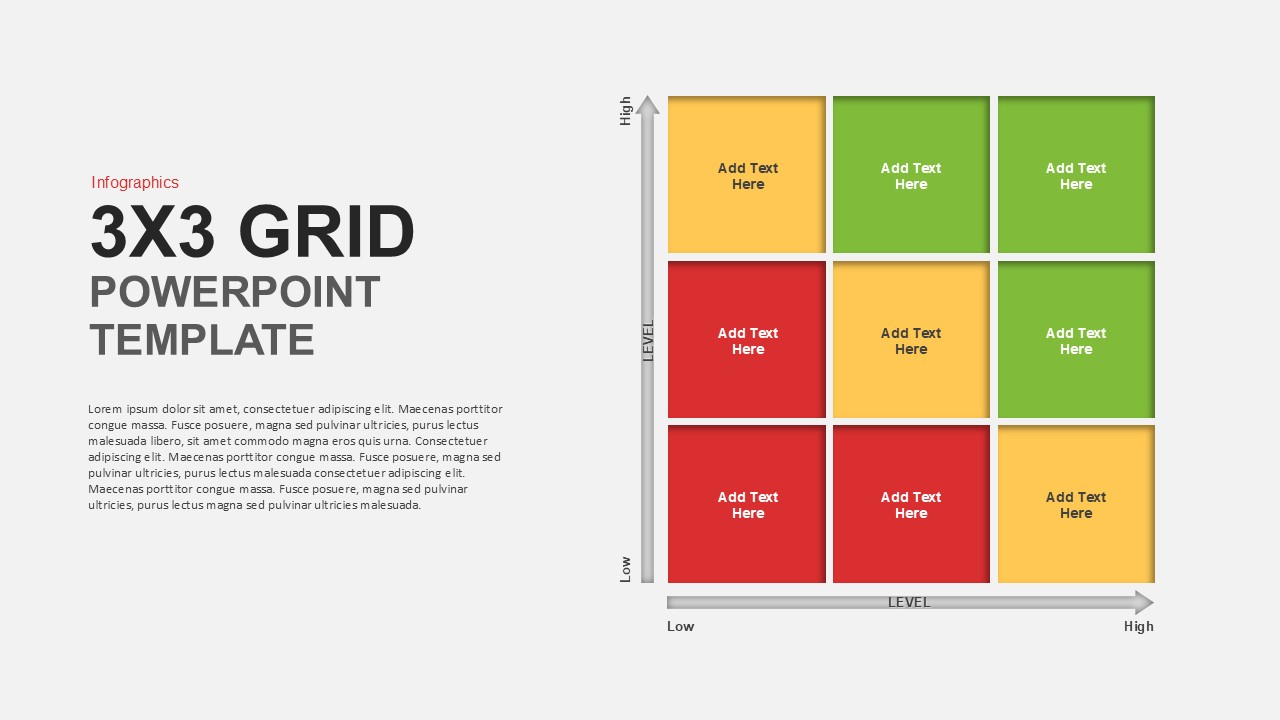
Matrix Grid Diagram Template for PowerPoint & Google Slides
Comparison
Porter’s Generic Strategies Matrix Template for PowerPoint & Google Slides
Business Strategy
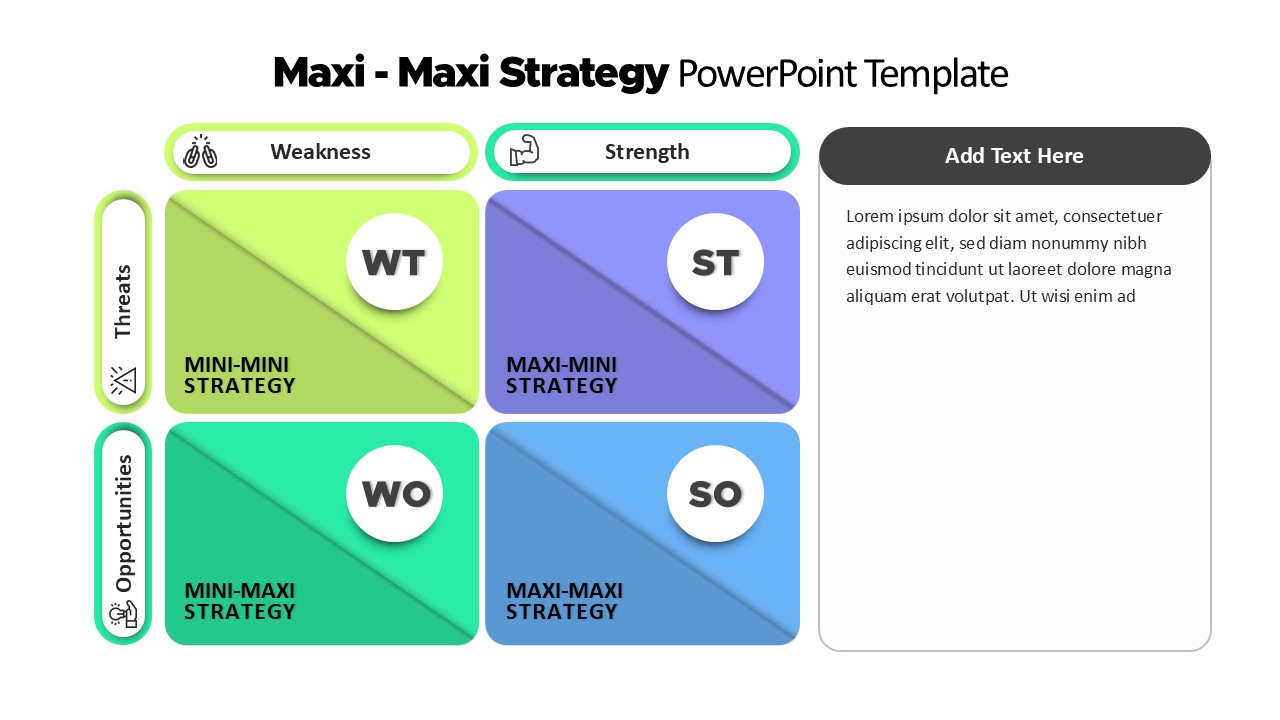
Maxi-Maxi Strategy Matrix SWOT Diagram Template for PowerPoint & Google Slides
SWOT
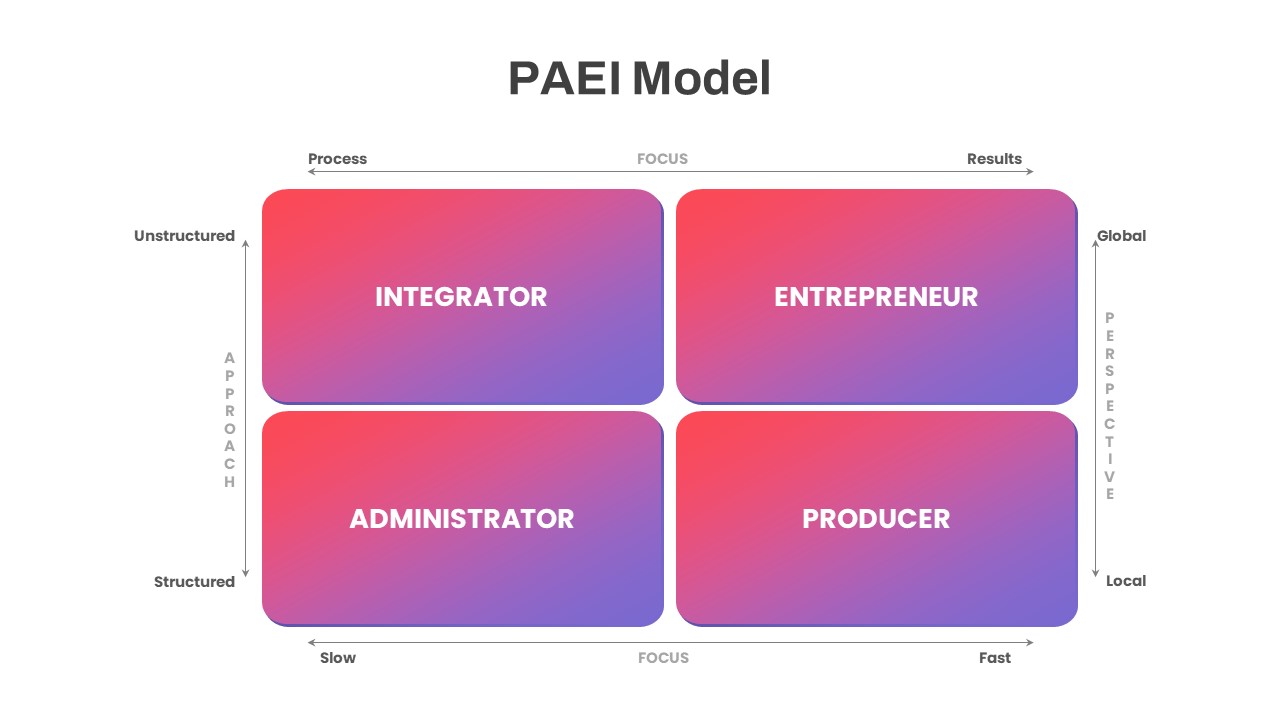
PAEI Leadership Roles 2×2 Matrix Diagram Template for PowerPoint & Google Slides
Business Models
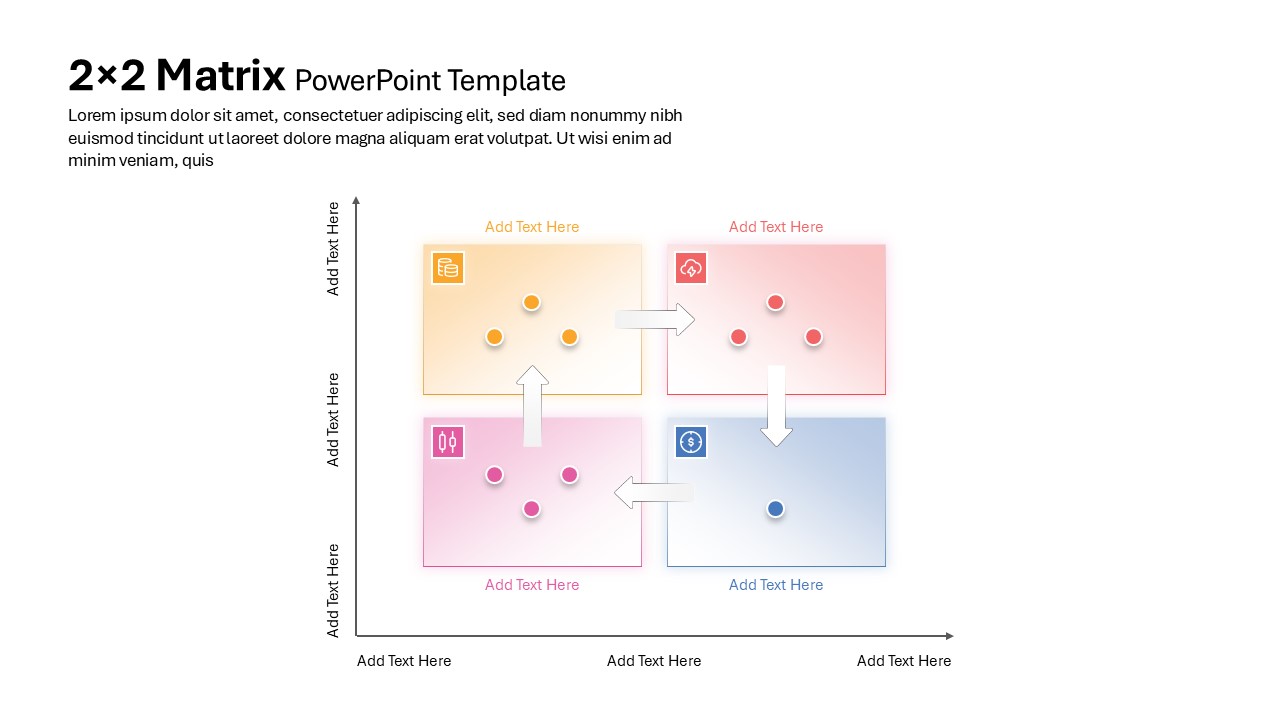
2×2 Matrix PowerPoint & Google Slides Template
Business Models
Competitor Profile Matrix Comparison Template for PowerPoint & Google Slides
Comparison Chart
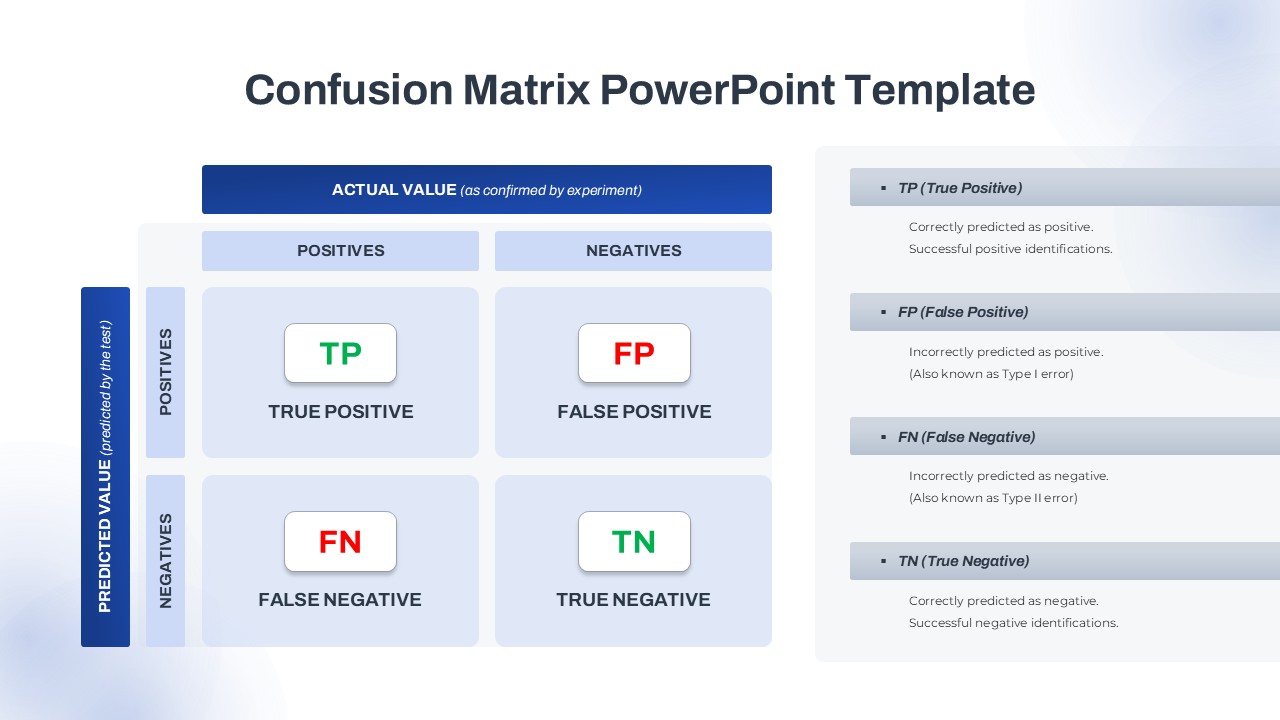
Confusion Matrix Diagram Overview Template for PowerPoint & Google Slides
Comparison
Risk Scoring & Ranking Heatmap Matrix Template for PowerPoint & Google Slides
Risk Management
Feasibility Matrix Comparison Chart Template for PowerPoint & Google Slides
Comparison Chart
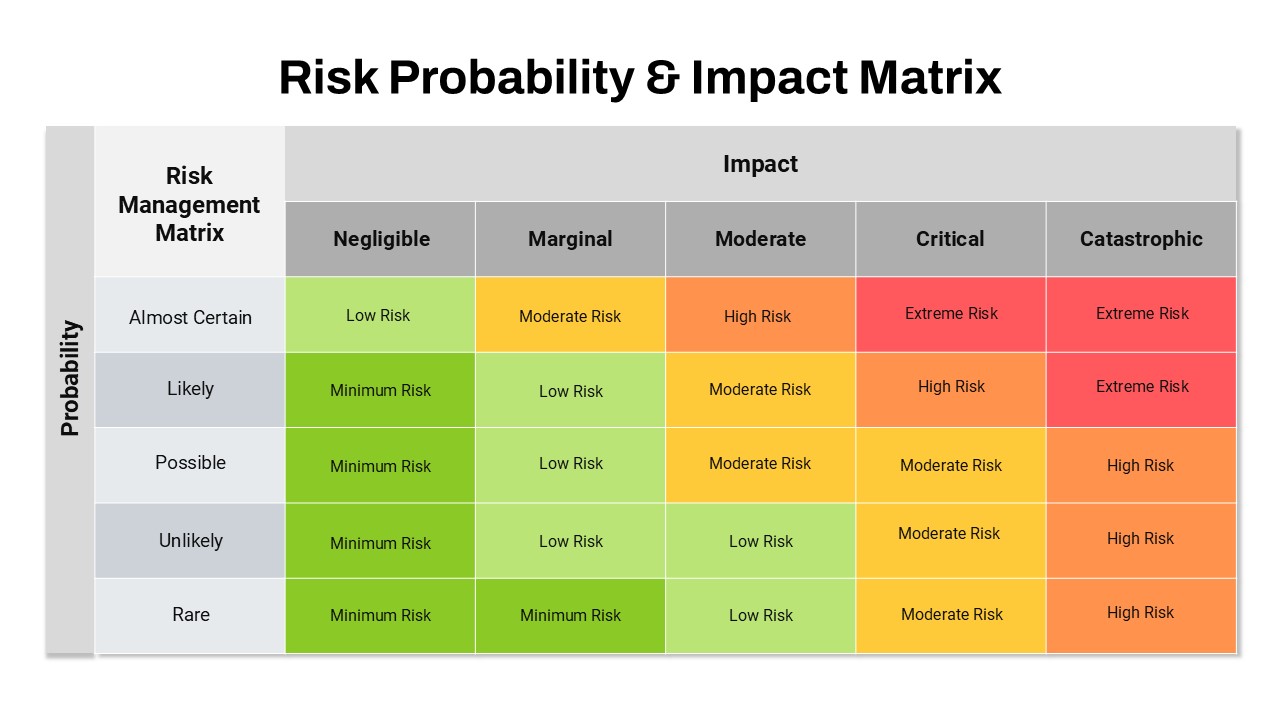
Risk Probability and Impact Matrix Template for PowerPoint & Google Slides
Risk Management
Quantitative Risk Analysis Matrix template for PowerPoint & Google Slides
Risk Management
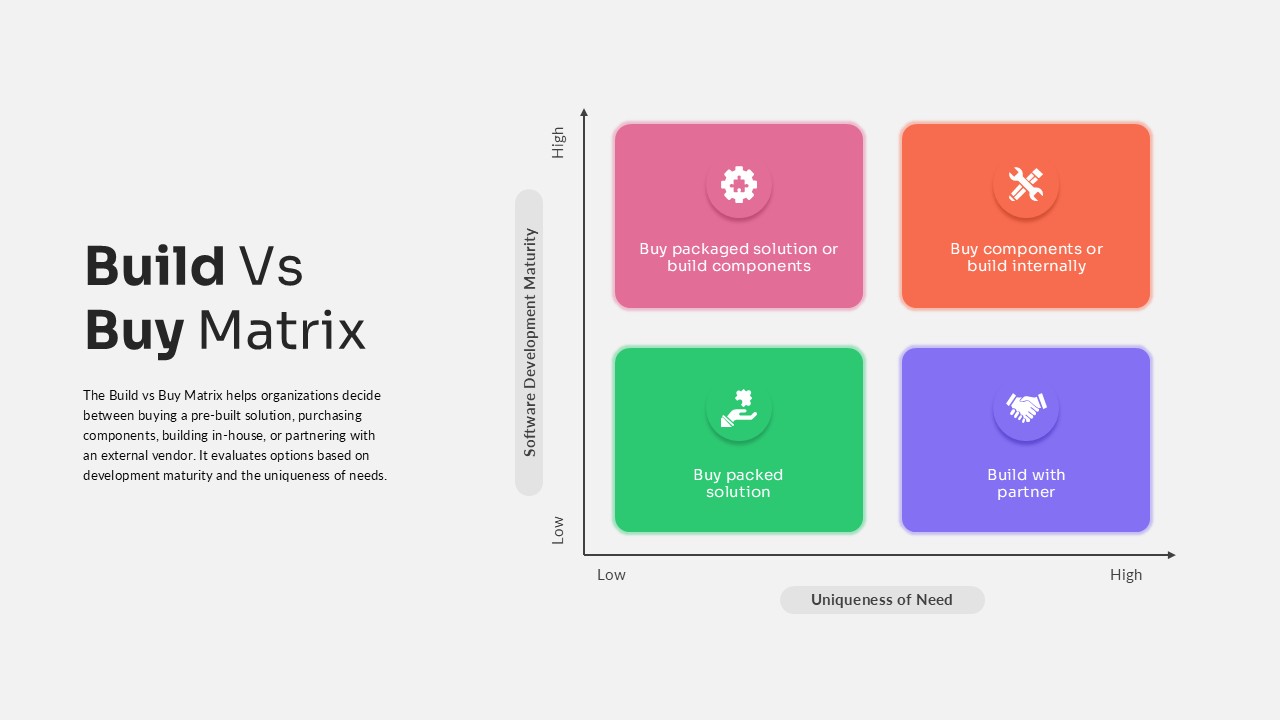
Build vs Buy Matrix Decision Framework template for PowerPoint & Google Slides
Business Strategy
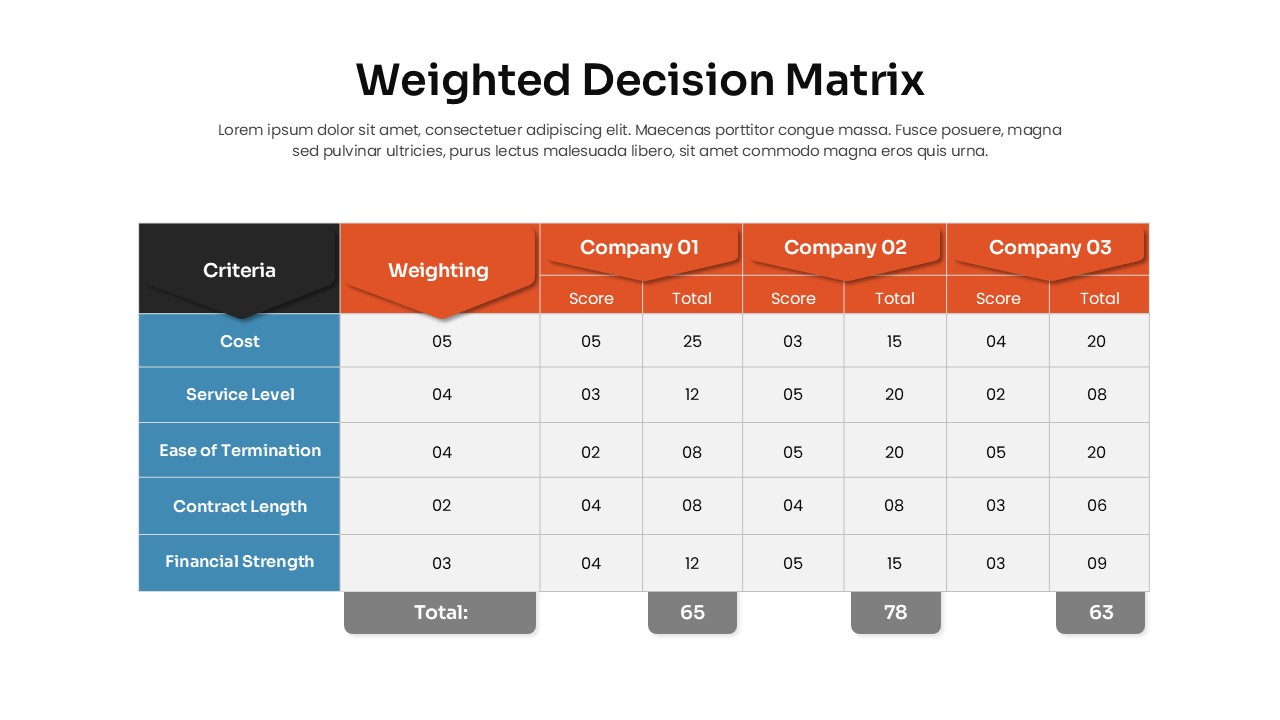
Weighted Decision Matrix template for PowerPoint & Google Slides
Business Models
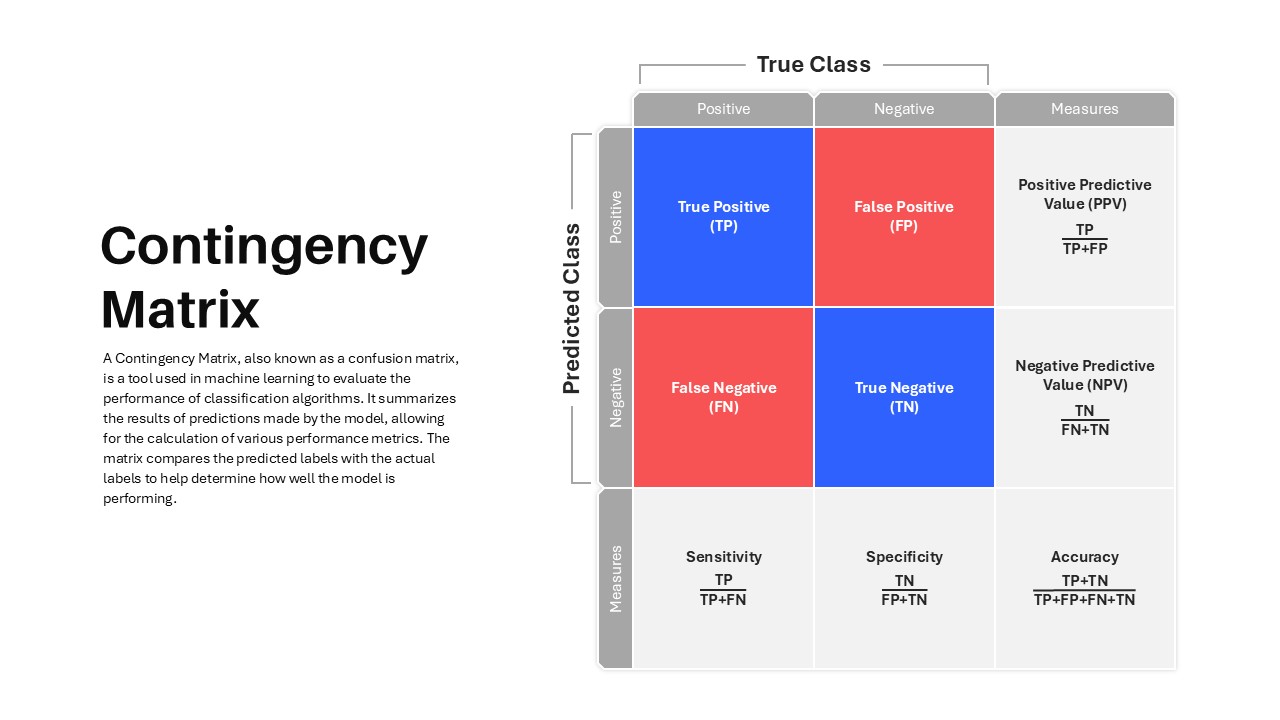
Contingency Matrix in Machine Learning template for PowerPoint & Google Slides
Technology
Situational Leadership Matrix Template for PowerPoint & Google Slides
Leadership
Disaster Response Role Matrix RACI Chart Template for PowerPoint & Google Slides
Project Status
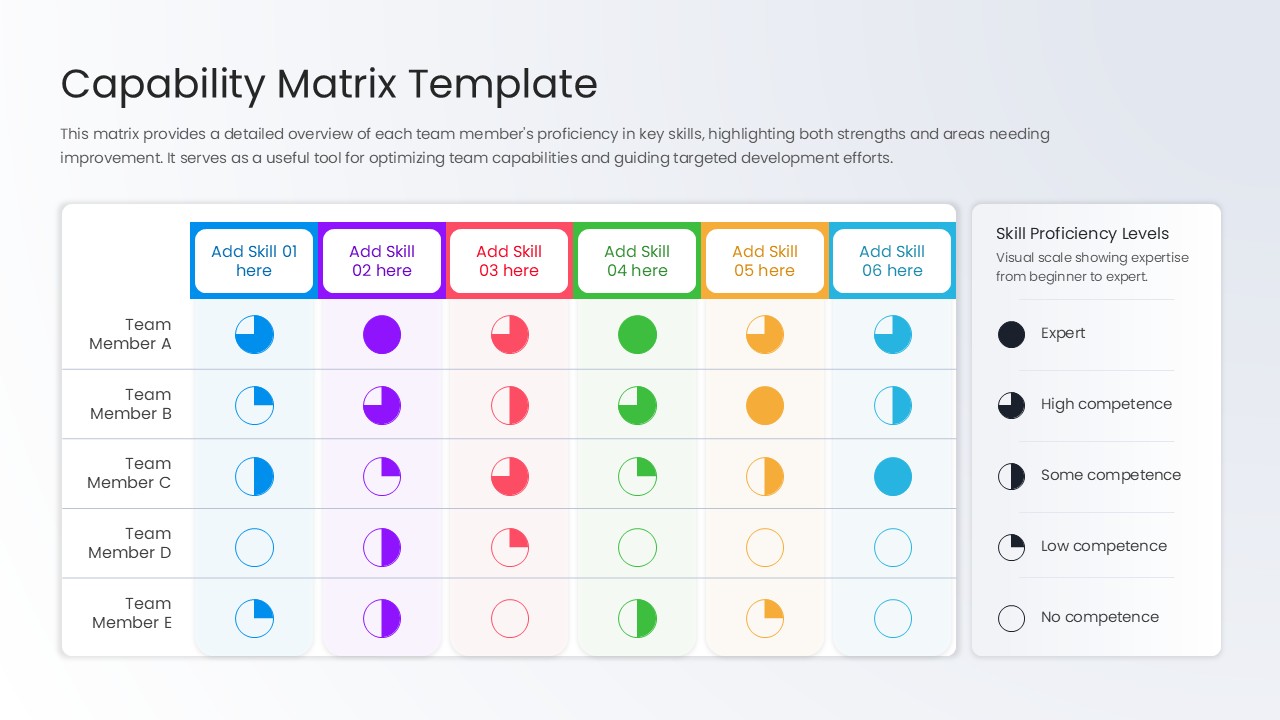
Capability Matrix Template for PowerPoint & Google Slides
HR
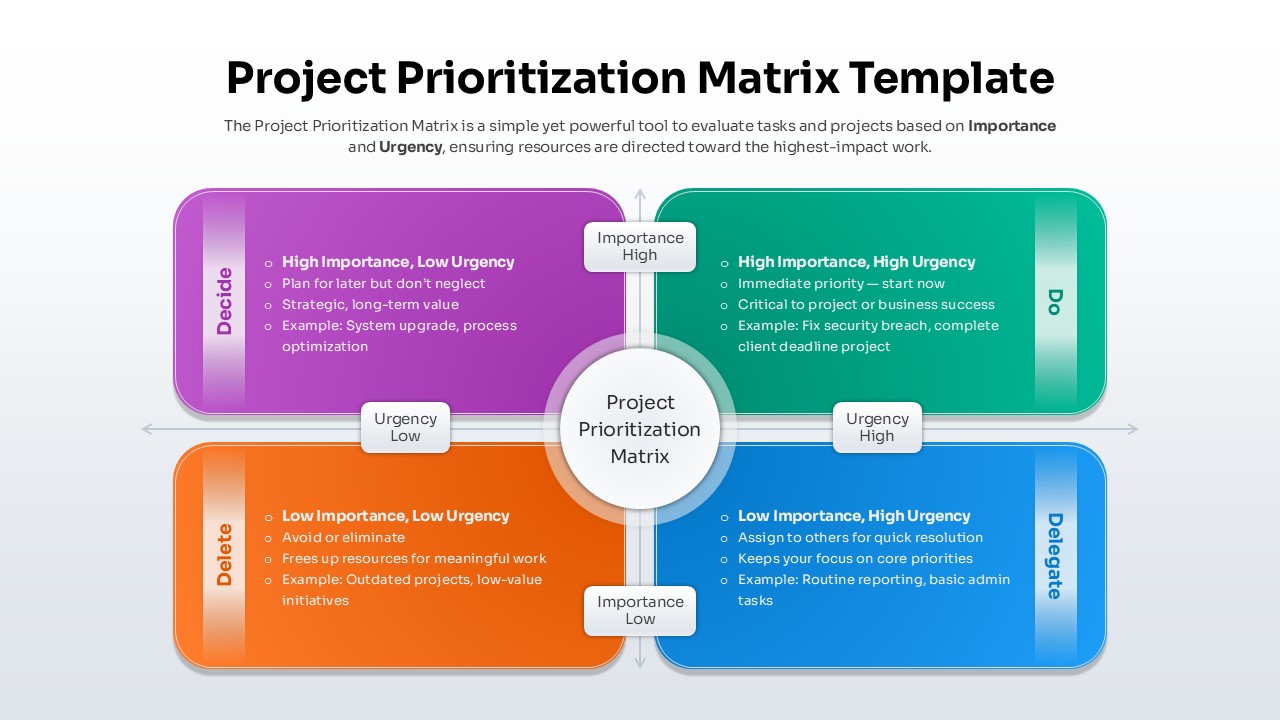
Project Prioritization Matrix Template for PowerPoint & Google Slides
Project
Personal SWOT Analysis Matrix Cards Template for PowerPoint & Google Slides
SWOT
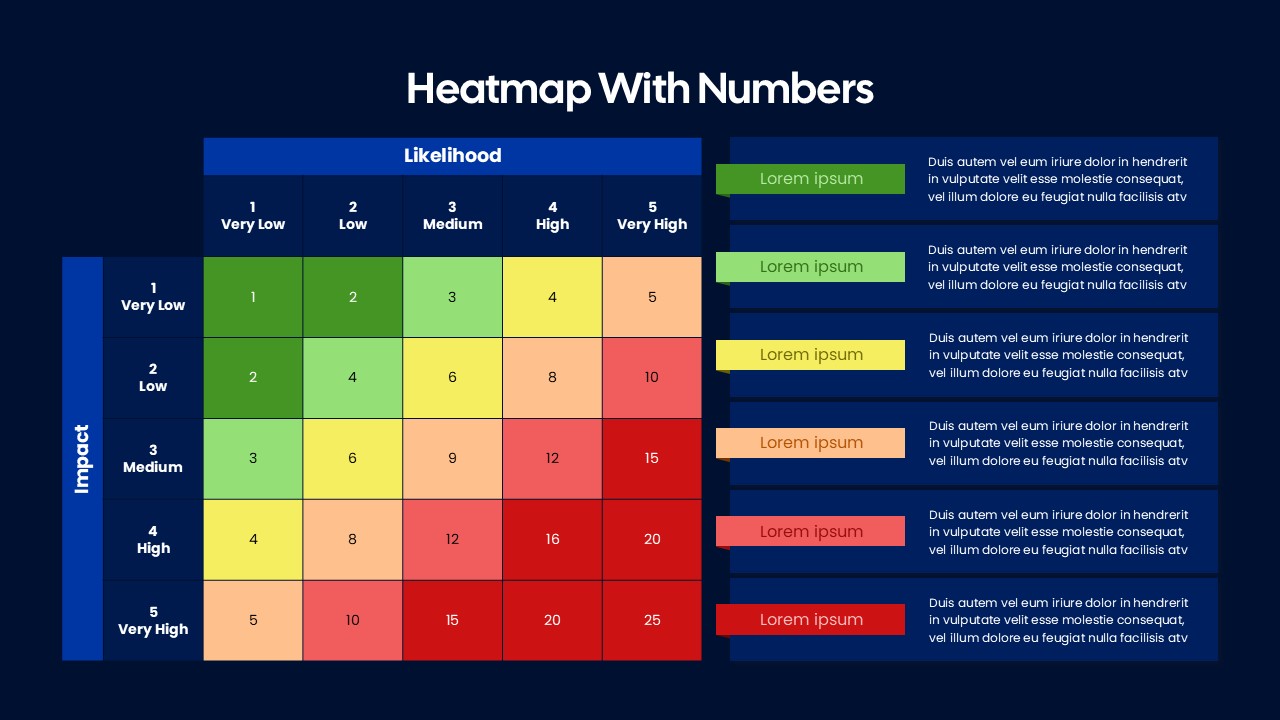
Heatmap Matrix with Numbers Template for PowerPoint & Google Slides
Project
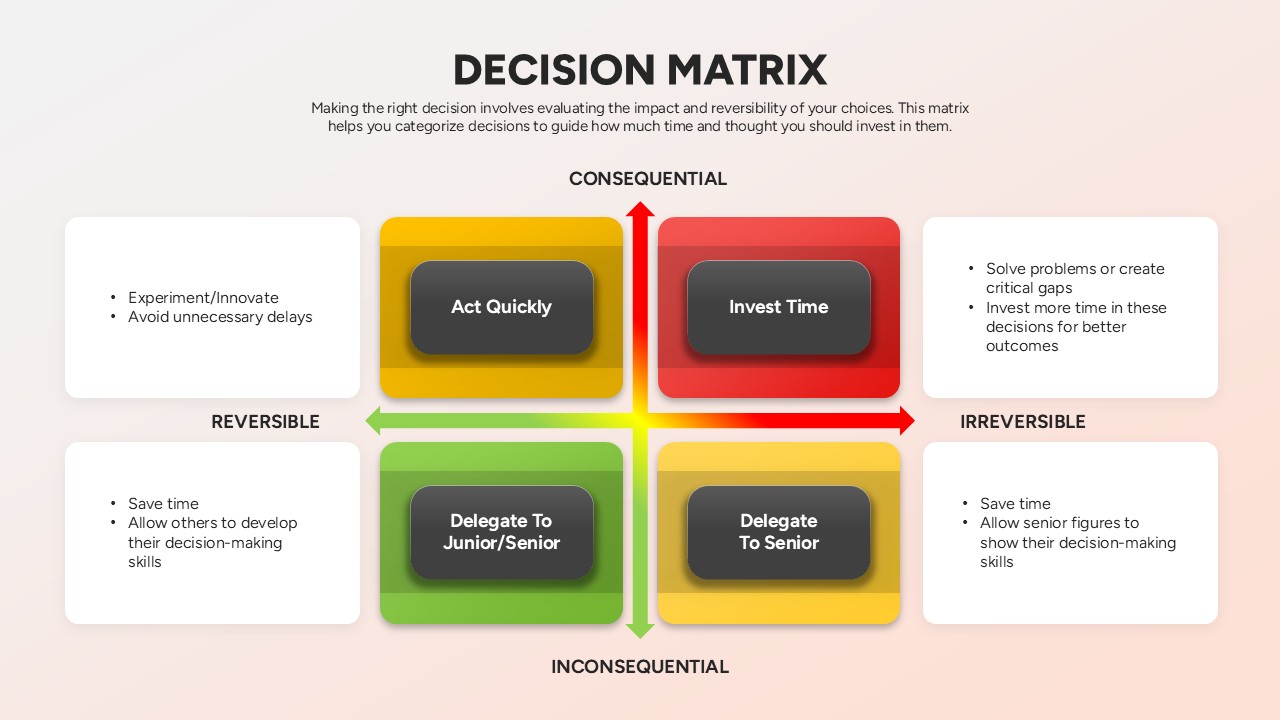
Decision Matrix Evaluation Framework Slide Template for PowerPoint & Google Slides
Leadership
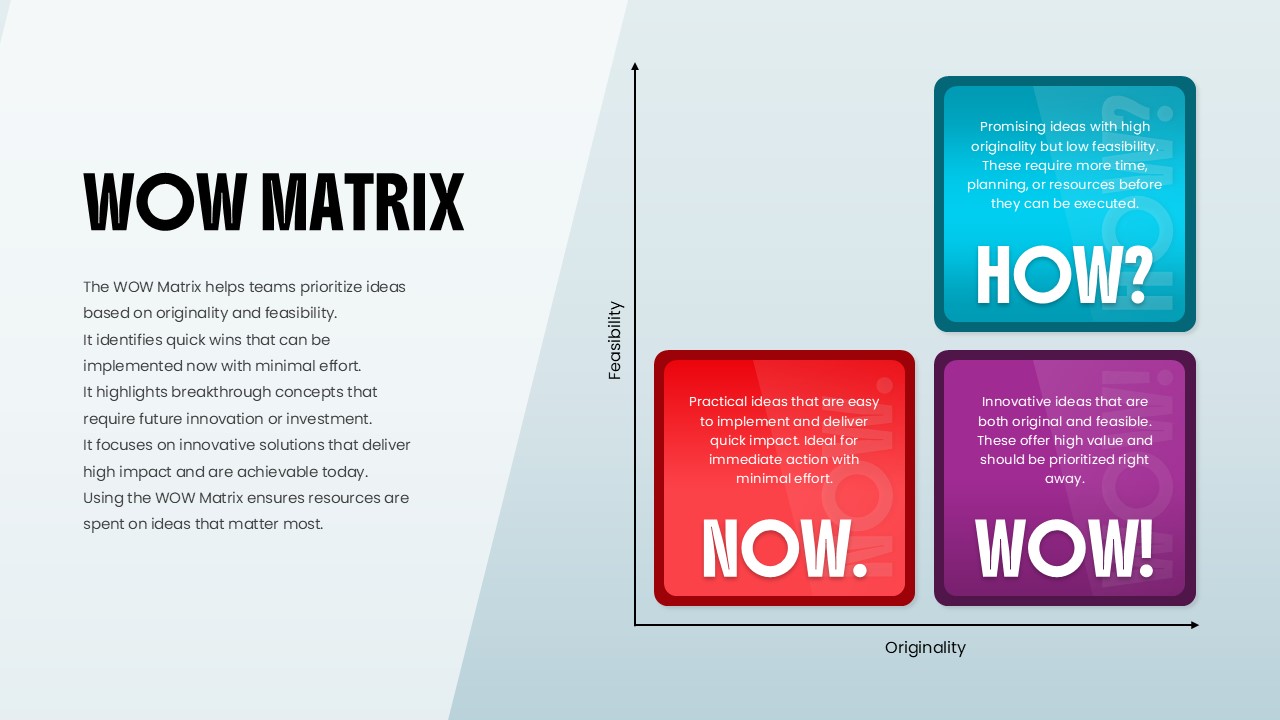
WOW Matrix Template for PowerPoint & Google Slides
Business Strategy

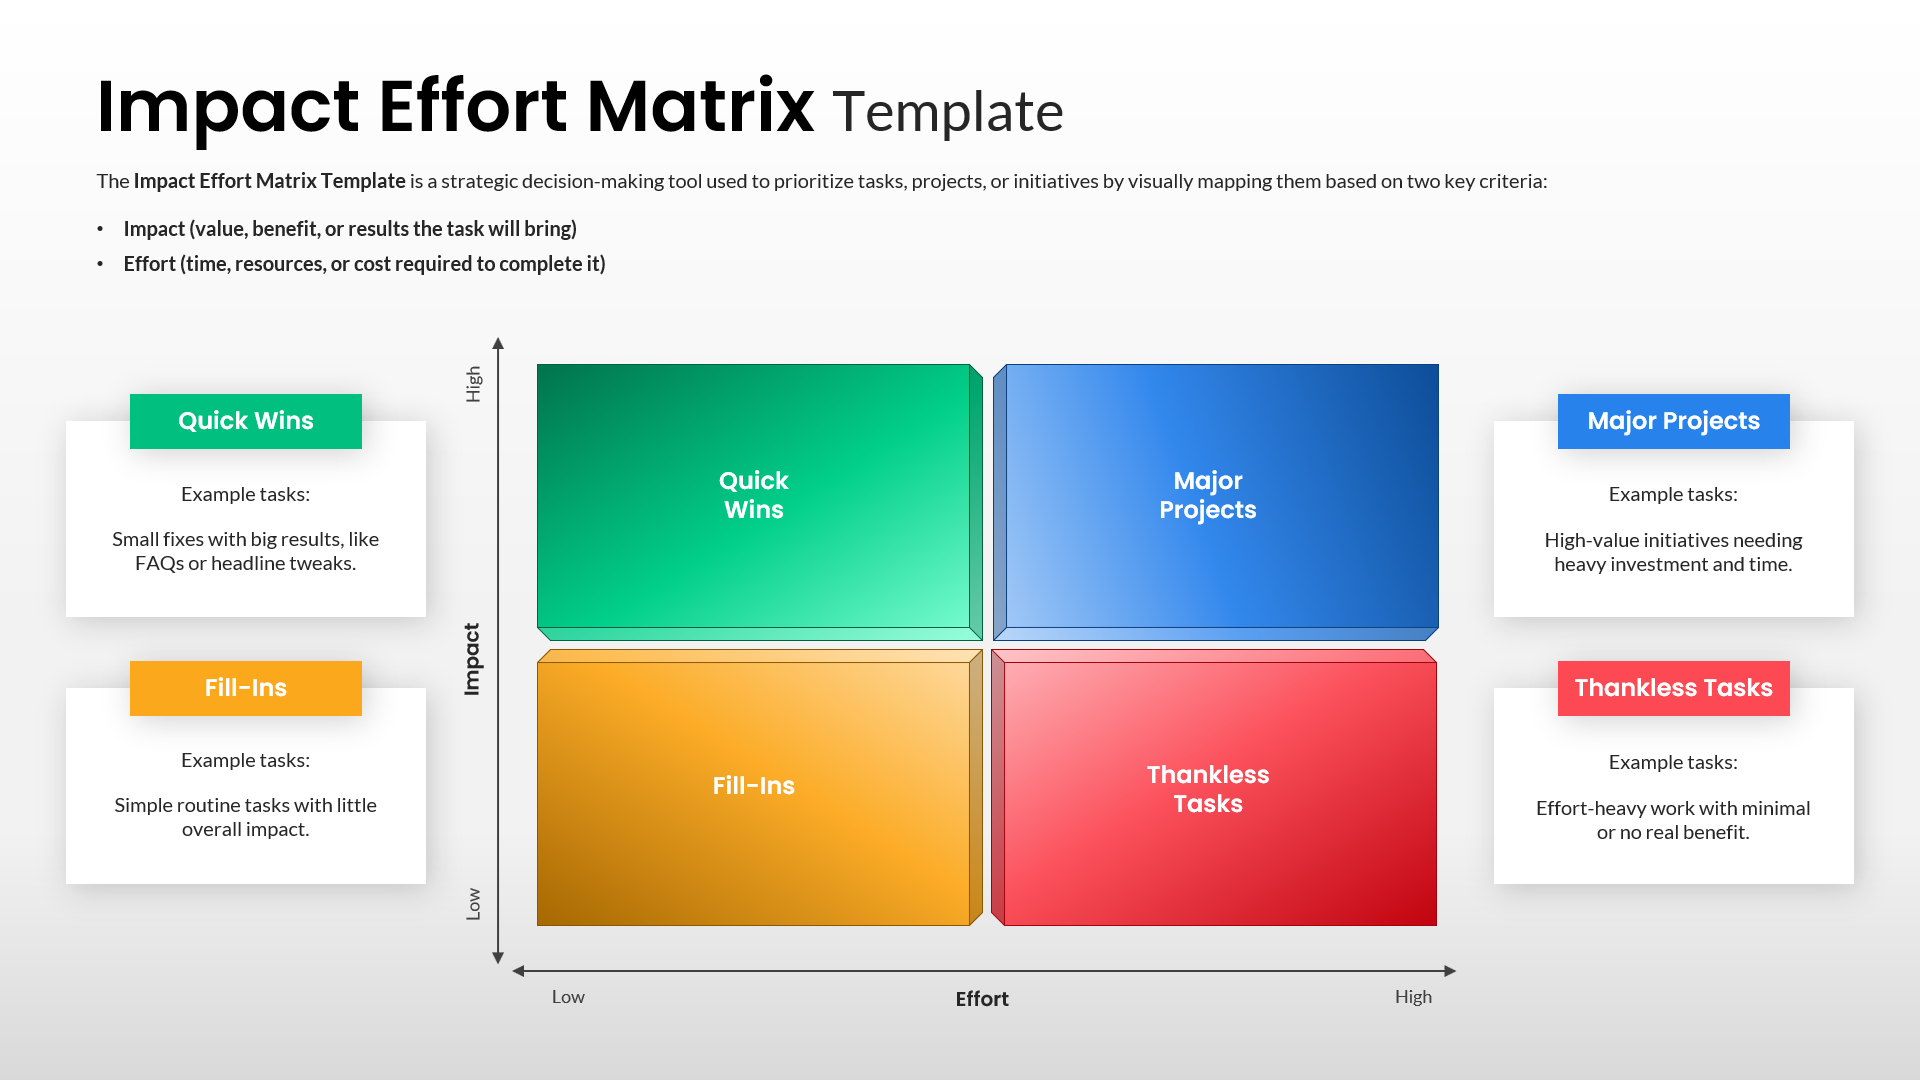
Impact Effort Matrix Template for PowerPoint & Google Slides
Comparison Chart
Ansoff Growth Matrix Template for PowerPoint & Google Slides
Business Strategy
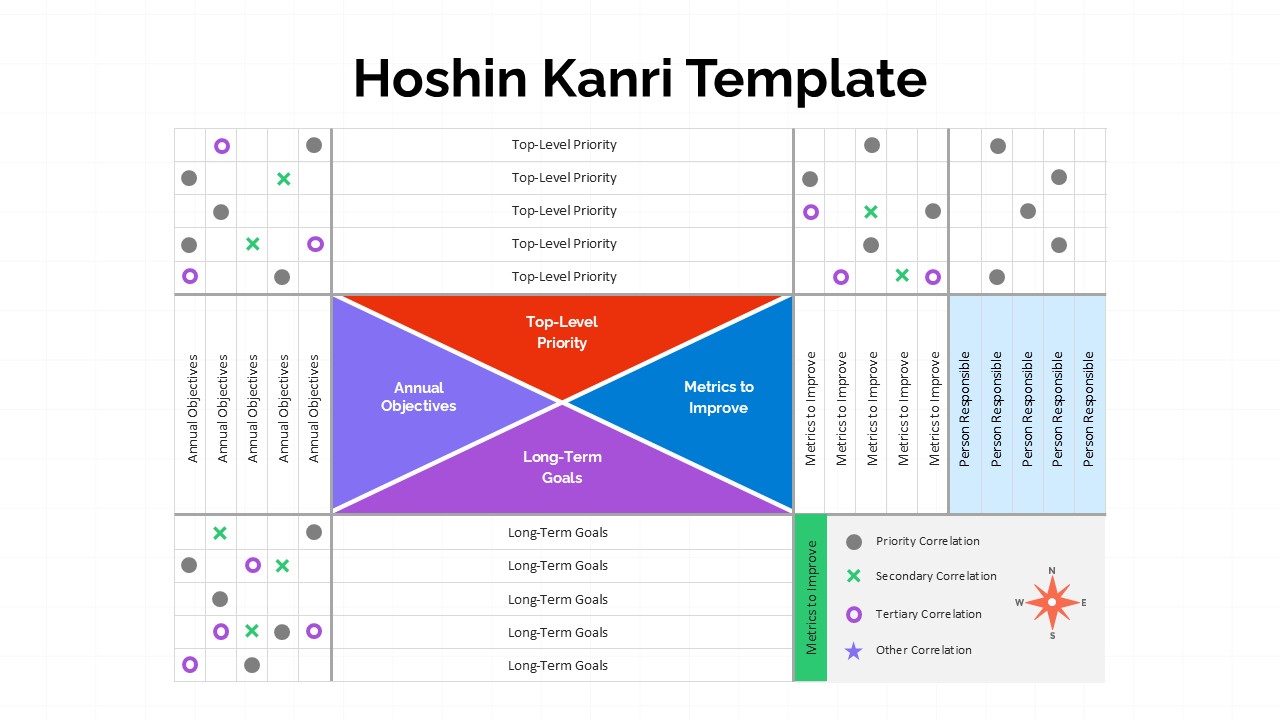
Hoshin Kanri Strategic Planning Matrix Template for PowerPoint & Google Slides
Business Strategy
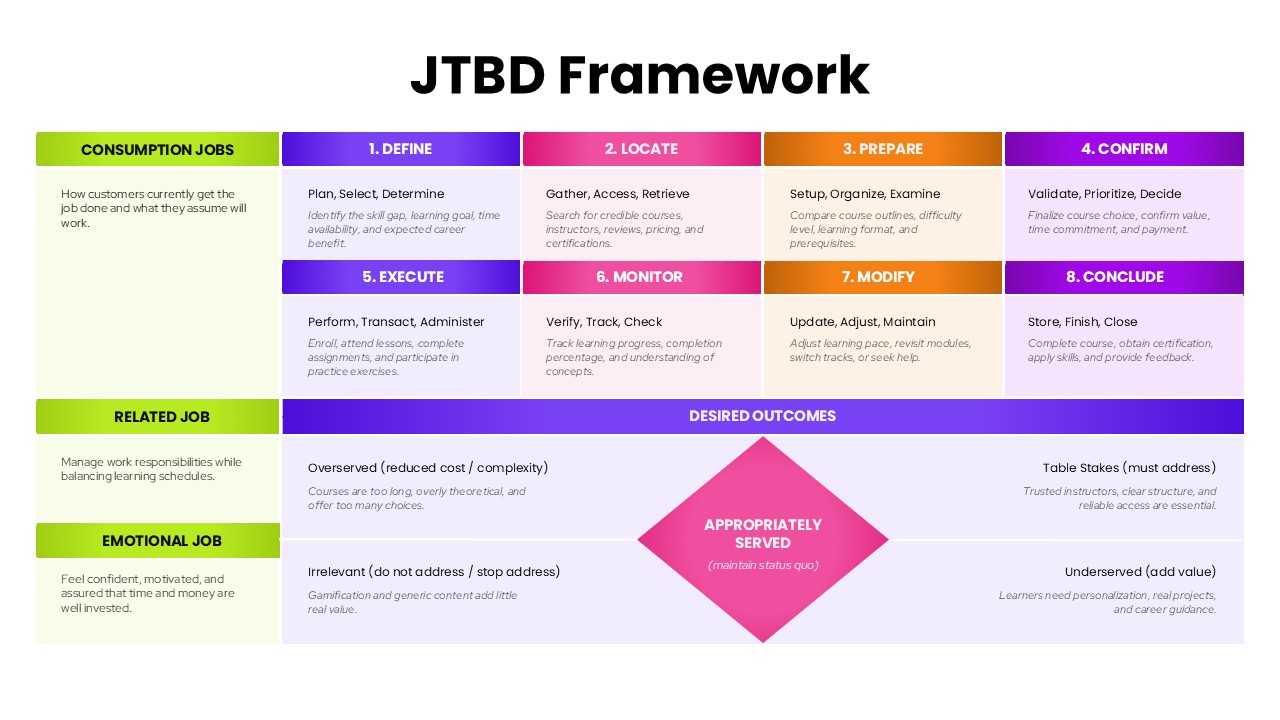
JTBD Framework Process and Outcomes Matrix Template for PowerPoint & Google Slides
Marketing
Materiality Assessment Matrix Diagram Template for PowerPoint & Google Slides
Risk Management
IT Gap Analysis Assessment Matrix Template for PowerPoint & Google Slides
Information Technology