Multi-Year Timeline Infographic Template for PowerPoint & Google Slides


Description
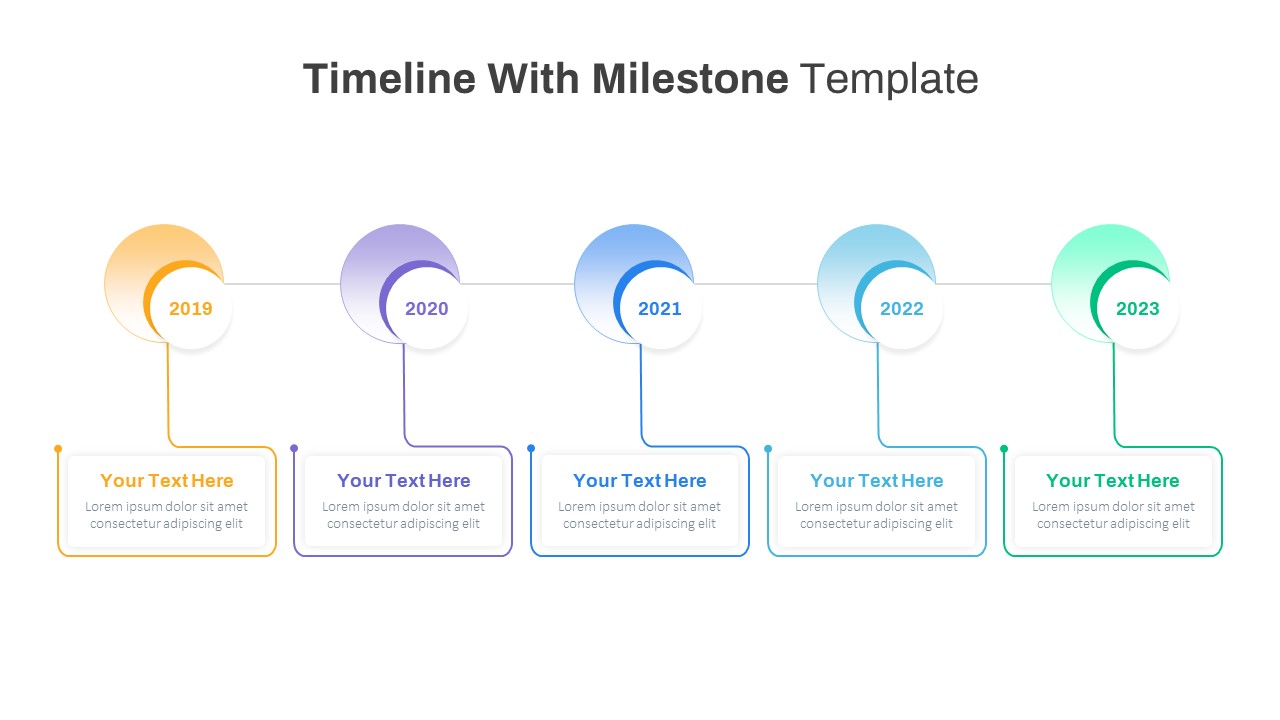
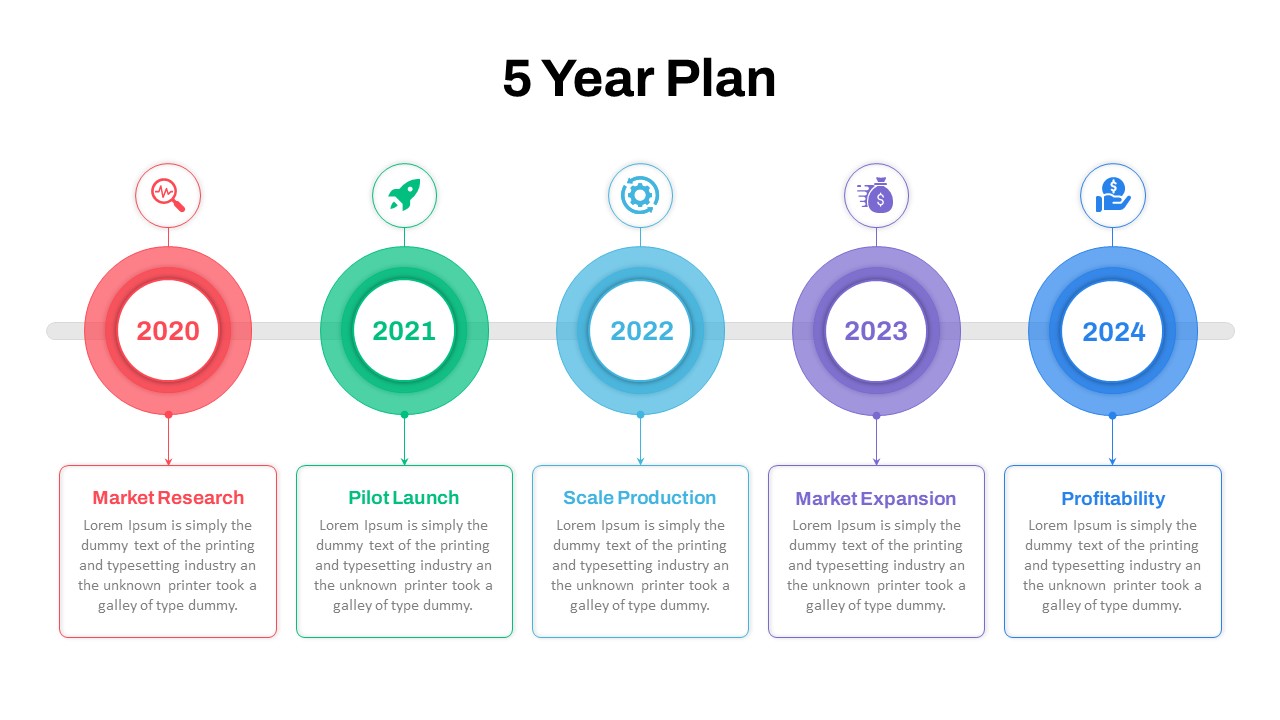
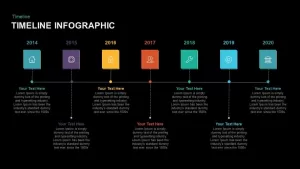
Showcase sequential milestones across seven years with this clean, two-row timeline infographic, designed to guide audiences through your organization’s journey with clarity and visual appeal. Seven color-coded square nodes—each in teal, purple, yellow, orange, green, cyan, and dark teal—mark annual checkpoints from 2014 to 2020, anchoring concise text blocks that alternate above and below a central axis. Fine dotted lines and circular markers connect each node, reinforcing the flow of events while maintaining a minimalist aesthetic on a crisp white background. Placeholder icons within each square allow rapid insertion of custom visuals—such as product launches, funding rounds, or key partnerships—to instantly contextualize each milestone.
Built on master slides for both PowerPoint and Google Slides, this template leverages fully editable vector graphics, allowing you to recolor squares, swap icons, or relabel year markers in seconds. Text placeholders automatically adjust for multi-line entries, supporting detailed descriptions without manual resizing. Employ subtle entrance animations on each node and text block to guide viewer attention sequentially through your narrative. The precise alignment grid ensures consistency across slides and simplifies translation or localization efforts. Export as high-resolution images or PDFs for print collateral, or present seamlessly on large-format displays without loss of sharpness.
Whether you’re recapping company growth, outlining project phases, or mapping product roadmaps, this timeline infographic provides a versatile framework that adapts to any industry. Its balanced combination of vibrant hues and understated typography keeps your audience focused on critical insights, while the modular design supports extension to additional years or contraction for shorter time spans.
Who is it for
Corporate communications teams, project managers, and executive leadership will find this timeline invaluable for annual reviews, investor presentations, and strategic planning sessions. Marketing directors, product managers, and trainers can also leverage the slide to illustrate campaign rollouts, development cycles, or training roadmaps.
Other Uses
Beyond company histories, repurpose this infographic to chart research timelines, fundraising milestones, or event schedules. Adapt the color scheme and iconography to showcase product feature releases, customer journey stages, or compliance checkpoints with equal impact.
Login to download this file

Item ID
SB00928
Related Templates

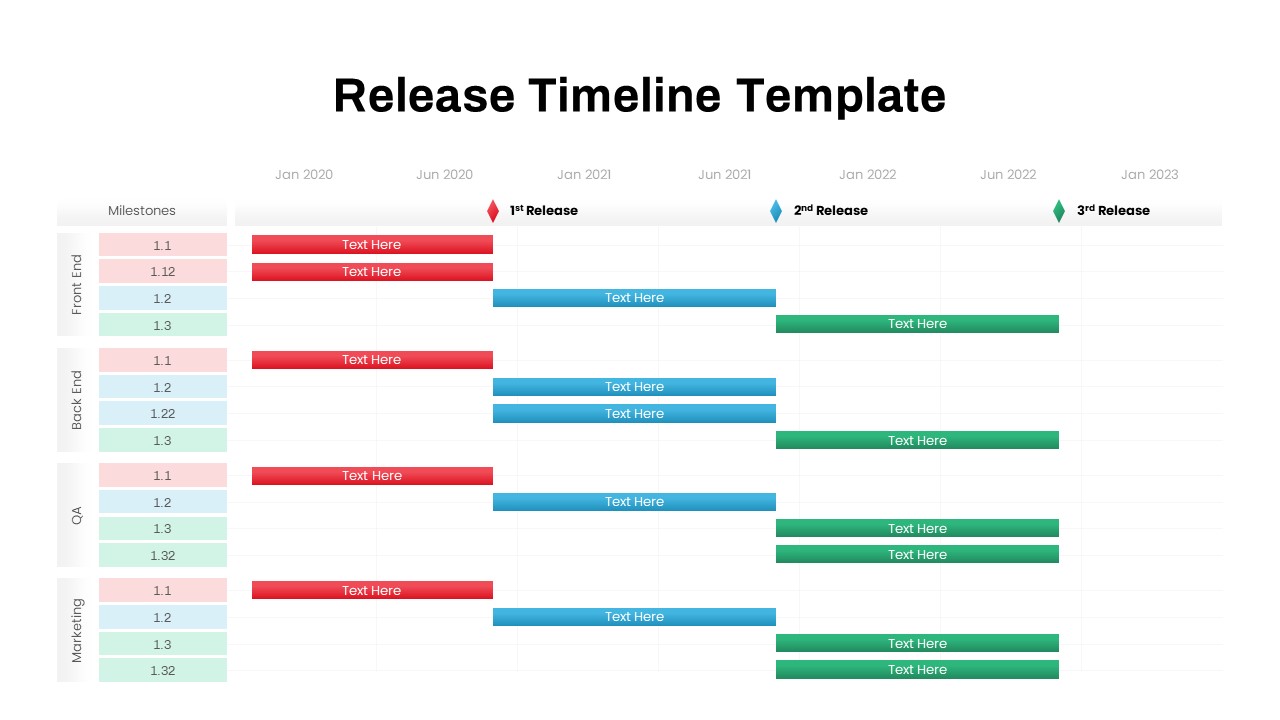
Multi-Team Multi-Phase Release Timeline Template for PowerPoint & Google Slides
Timeline

Free Multi-Year Arrow Timeline Infographic Template for PowerPoint & Google Slides
Timeline
Free
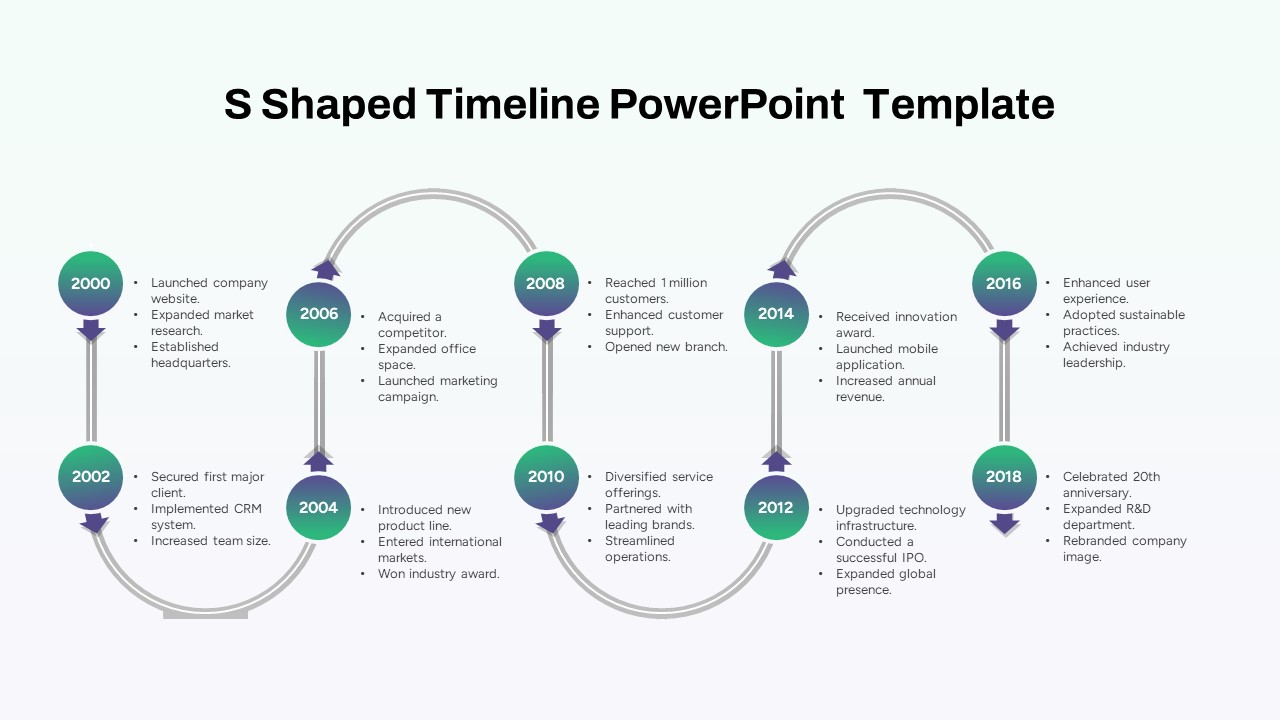
Multi-Year S-Shaped Roadmap Timeline Template for PowerPoint & Google Slides
Timeline
Minimal Multi-Year Column Chart Template for PowerPoint & Google Slides
Bar/Column
Year-over-Year Stacked Gender Bar Chart Template for PowerPoint & Google Slides
Bar/Column
Year-over-Year Performance Comparison Template for PowerPoint & Google Slides
Comparison Chart
Multi-Stage Timeline Infographics Template for PowerPoint & Google Slides
Timeline
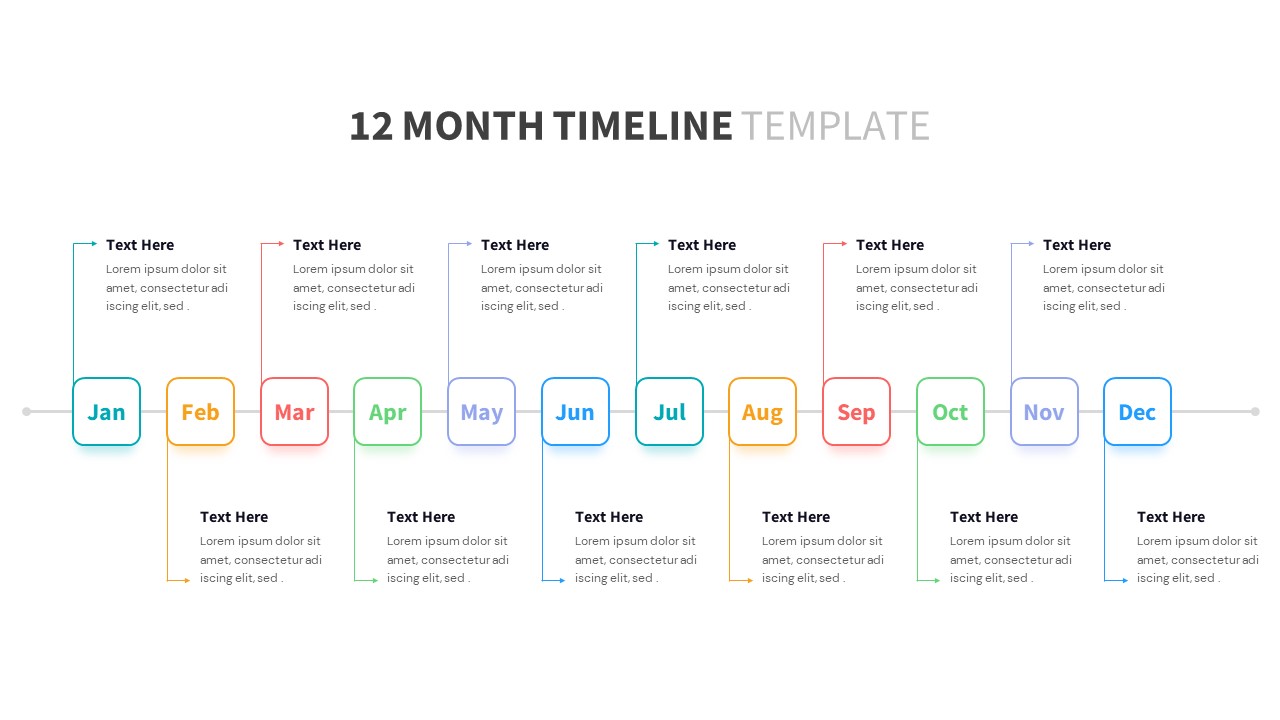
Versatile 12-Month Multi-Style Timeline Template for PowerPoint & Google Slides
Timeline
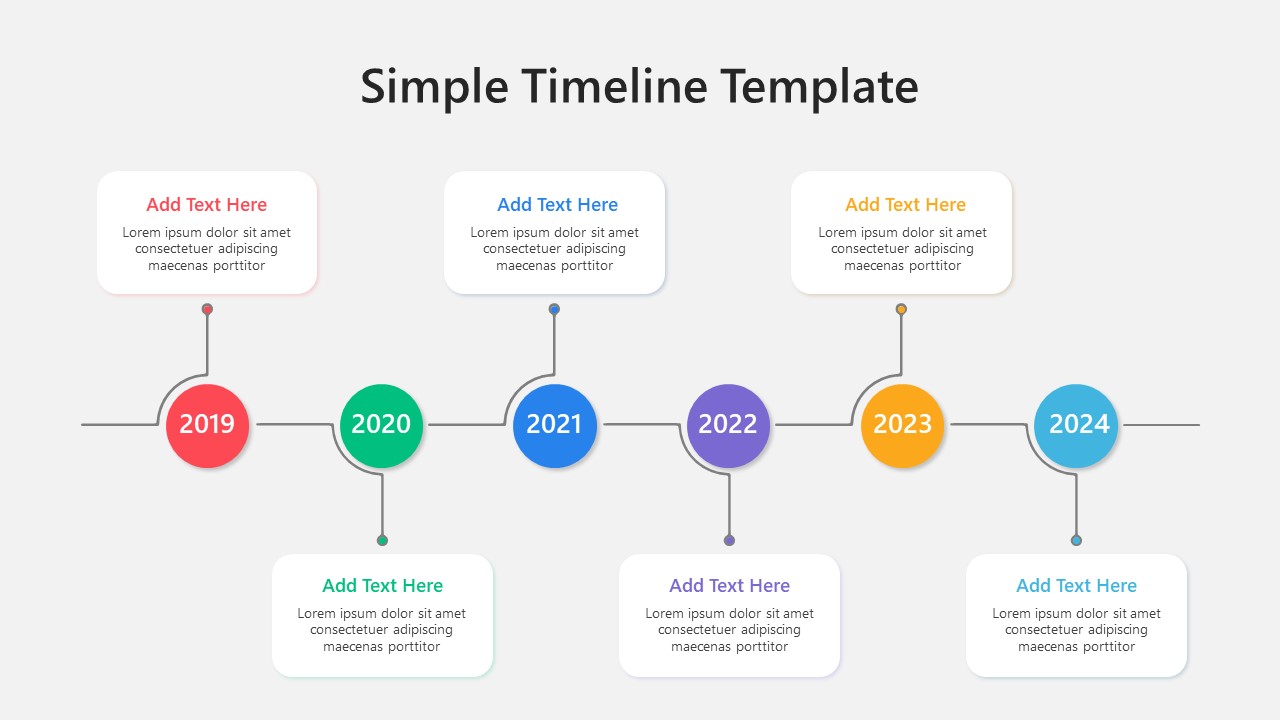
Multi-Color Milestone Timeline Layout Template for PowerPoint & Google Slides
Timeline
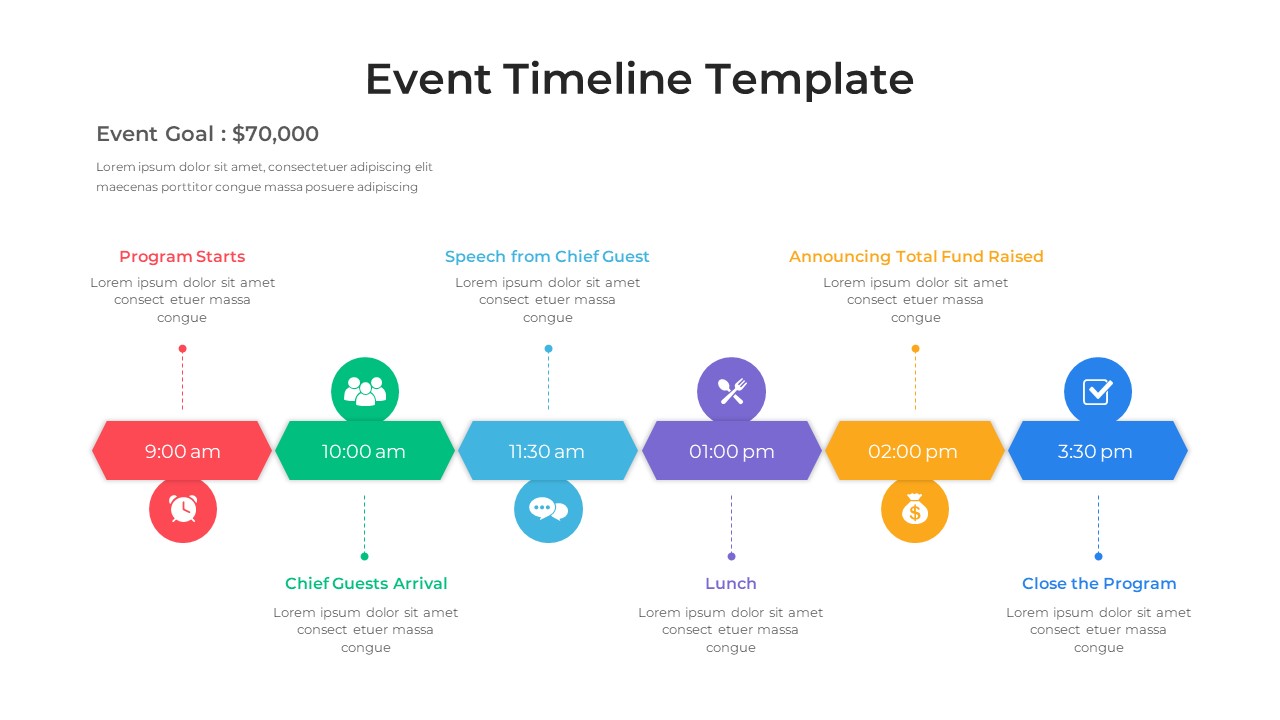
Multi-Style Event Timeline Agenda Template for PowerPoint & Google Slides
Timeline
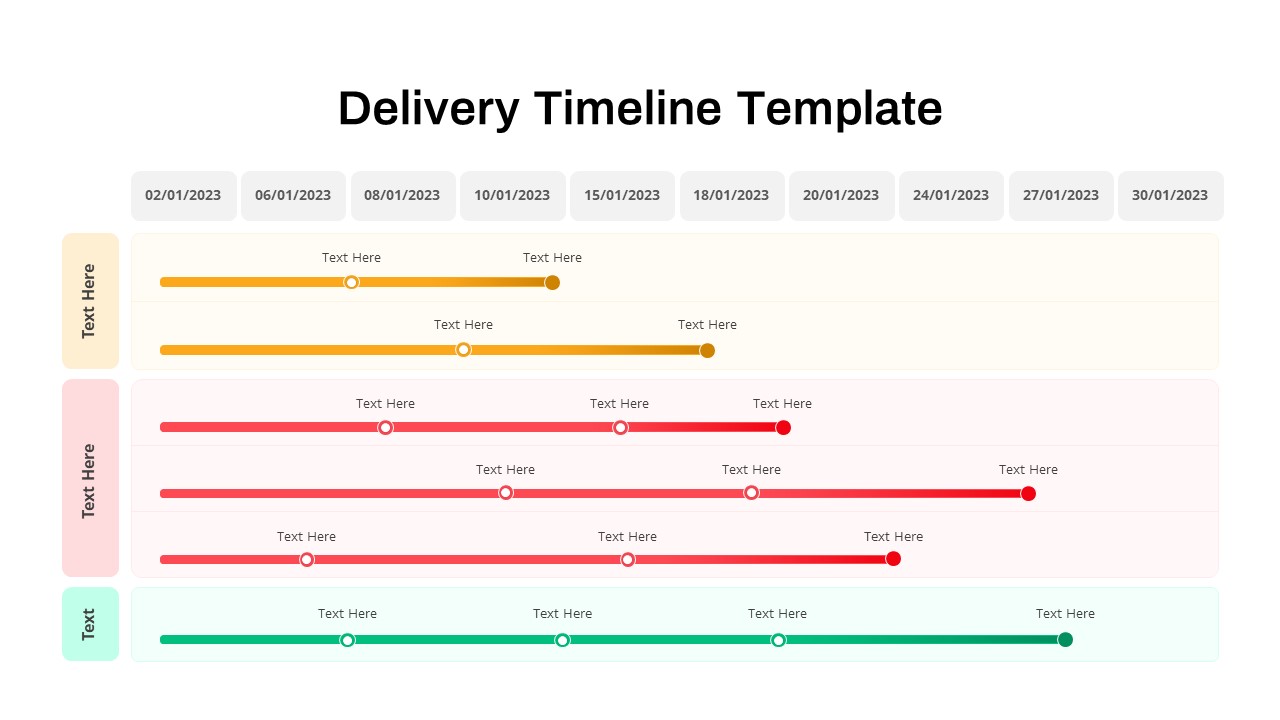
Delivery Timeline Multi-Row Template for PowerPoint & Google Slides
Timeline
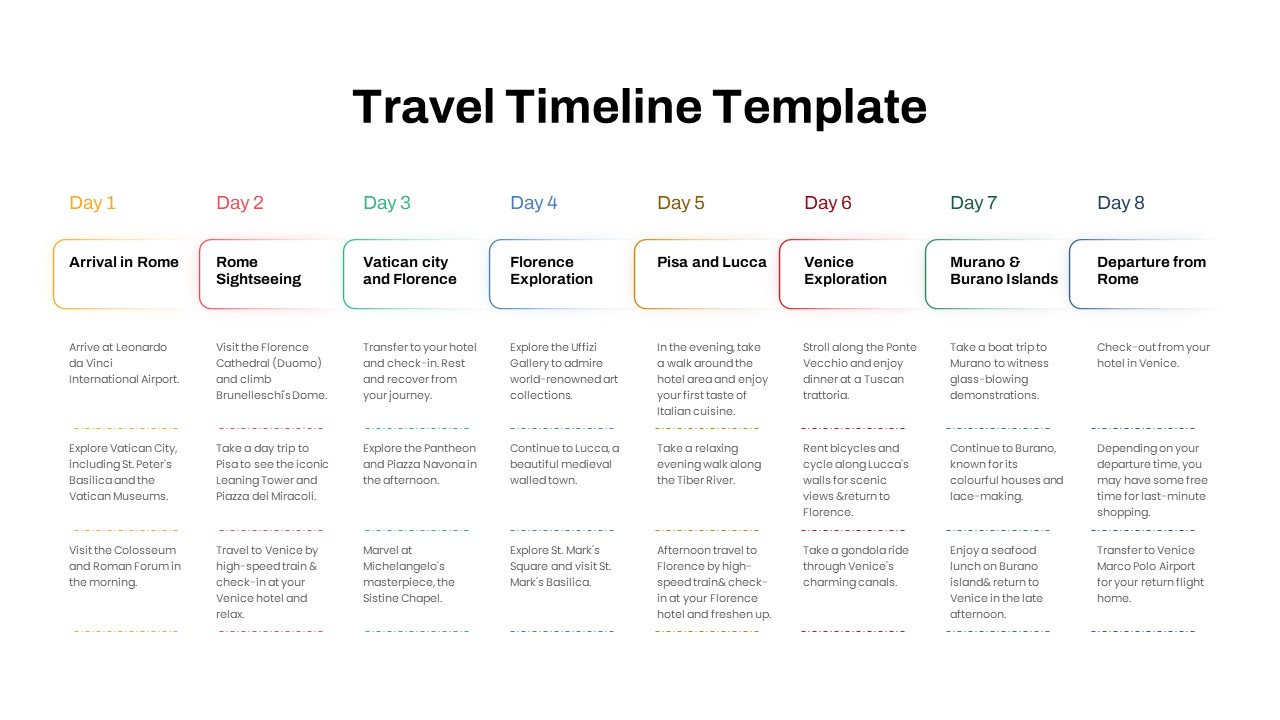
Free Elegant Multi-Day Travel Timeline Template for PowerPoint & Google Slides
Timeline
Free
Multi-color Curved Timeline Roadmap Template for PowerPoint & Google Slides
Timeline
Five-Year Gradient Timeline Infographic Template for PowerPoint & Google Slides
Timeline

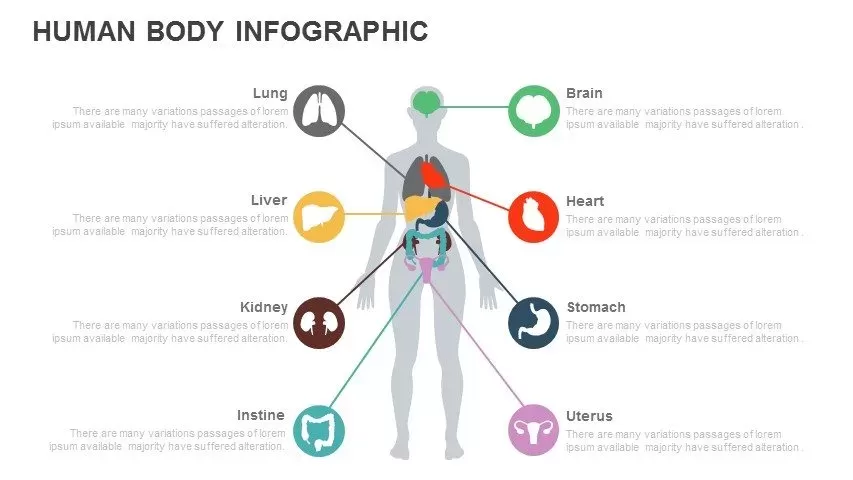
Multi-Organ Human Body Infographic Template for PowerPoint & Google Slides
Comparison

Multi-Cluster Mind Map Infographic Template for PowerPoint & Google Slides
Mind Maps
Multi-Purpose Corporate Infographic Template for PowerPoint & Google Slides
Company Profile
Free
Free Multi-Level Roadmap Infographic Template for PowerPoint & Google Slides
Roadmap
Free
Multi-Step Infographic Process Layout Template for PowerPoint & Google Slides
Process
Multi-Style Flow Infographic Slide template for PowerPoint & Google Slides
Process
Automotive Infographic Multi-Layout Template for PowerPoint & Google Slides
Comparison
Animated Multi-Gear Cluster Infographic Template for PowerPoint & Google Slides
Process
Multi-Phase Research Roadmap Infographic Template for PowerPoint & Google Slides
Roadmap
Free Multi-Step Funnel Infographic Slide Pack Template for PowerPoint & Google Slides
Funnel
Free
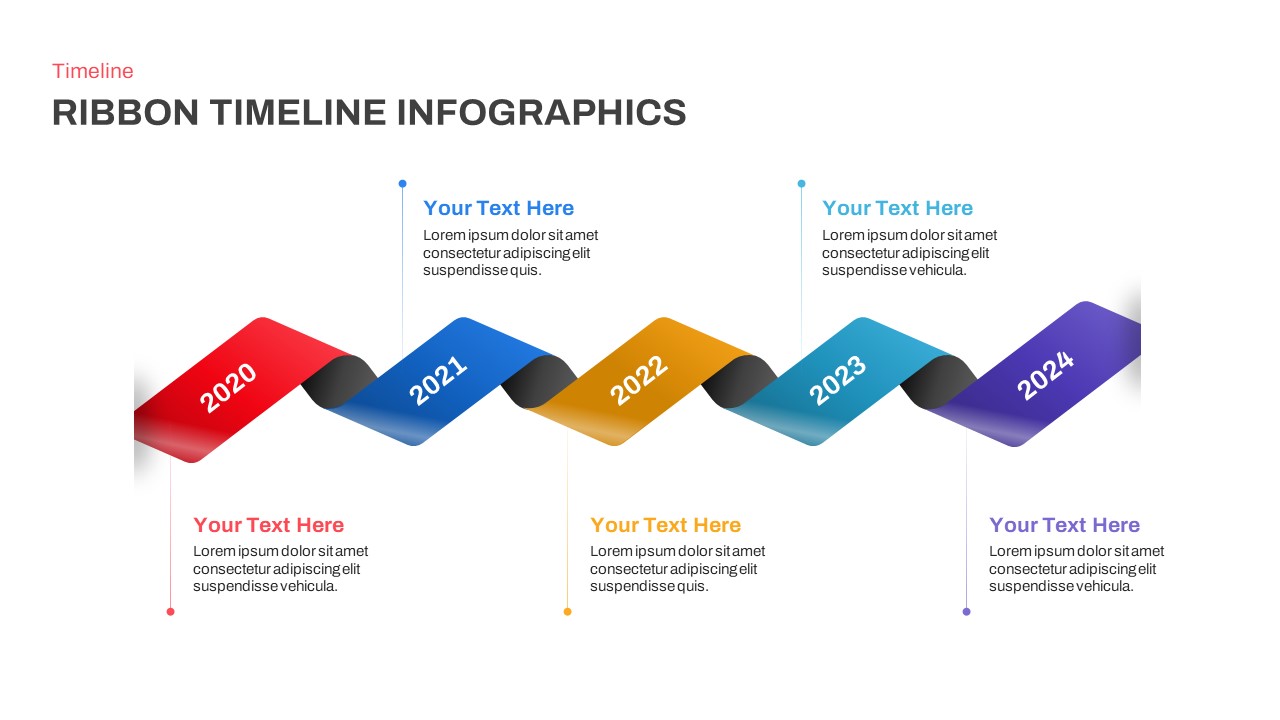
Five-Year Ribbon Timeline Diagram Template for PowerPoint & Google Slides
Timeline
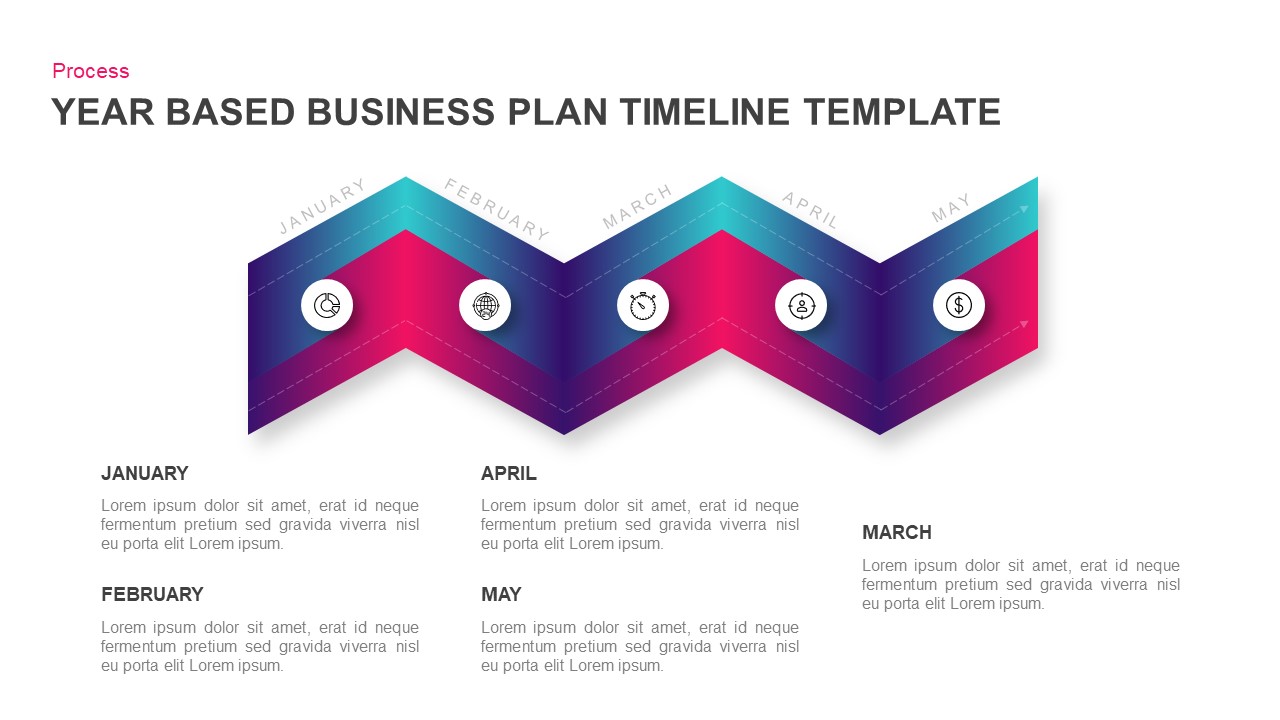
Year-Based Business Plan Zigzag Timeline Template for PowerPoint & Google Slides
Business Plan
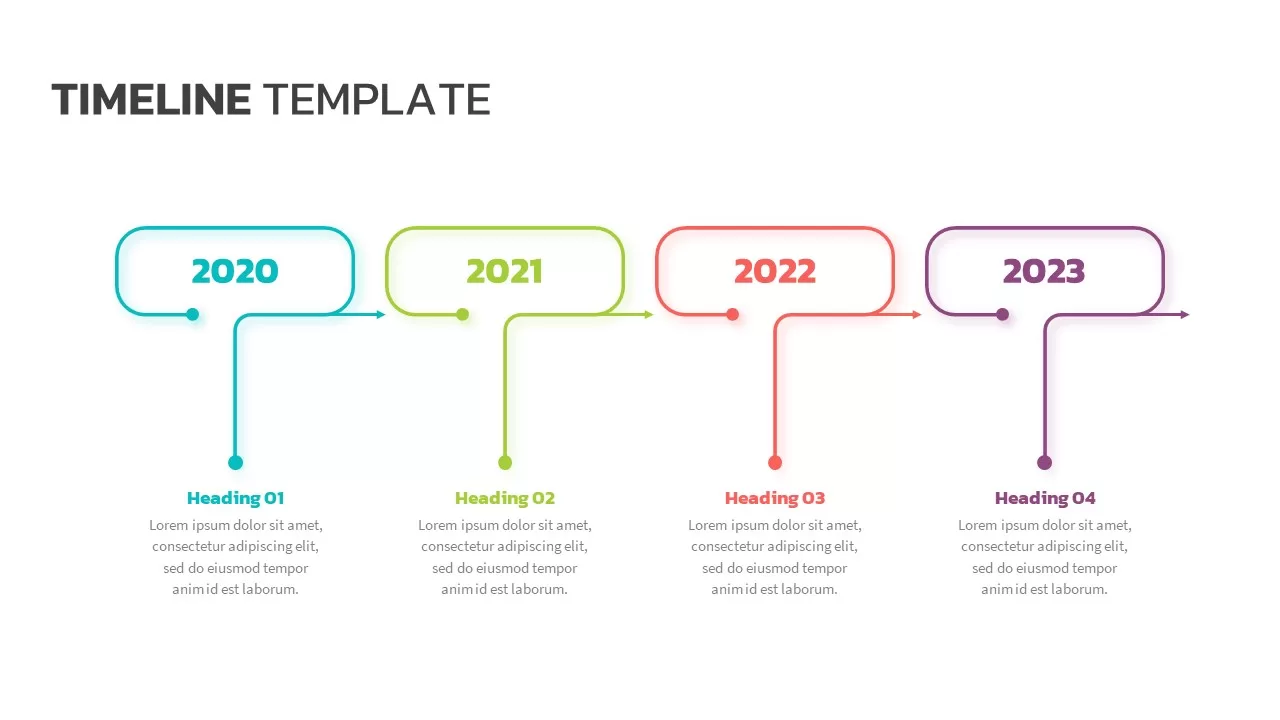
Colorful Four-Year Timeline Layout Template for PowerPoint & Google Slides
Timeline
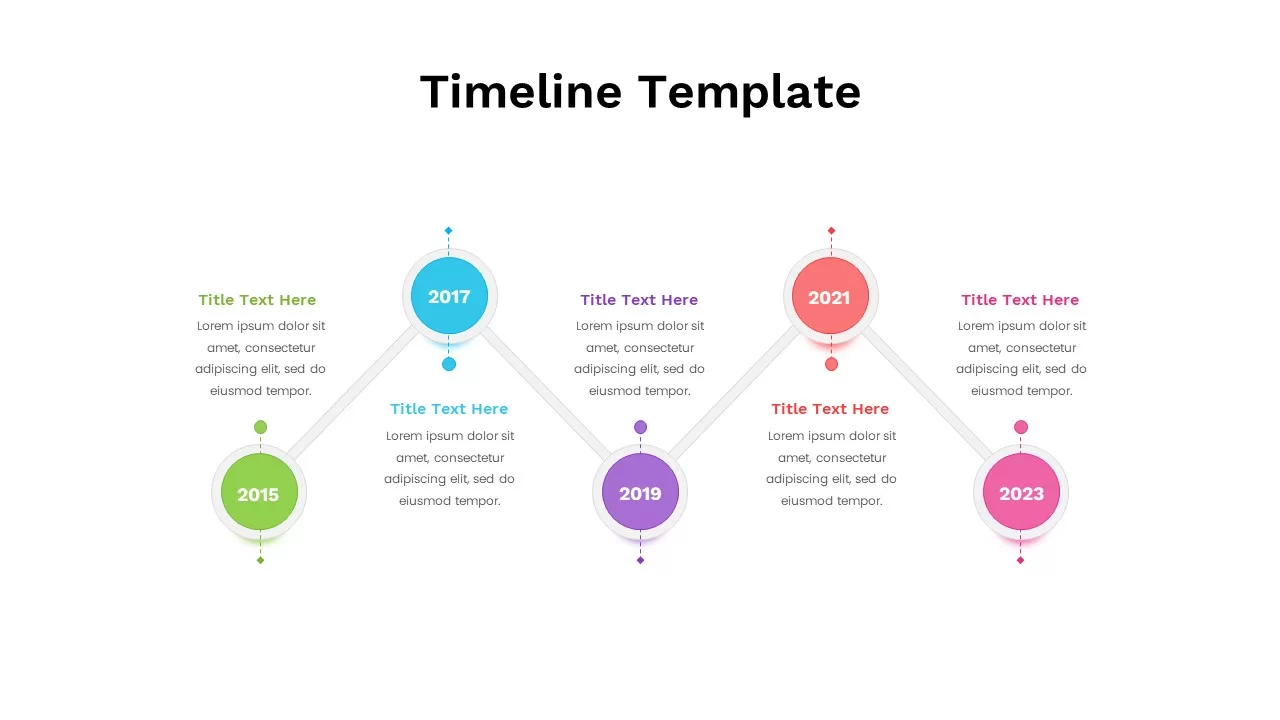
Colorful Five-Year Timeline Layout Template for PowerPoint & Google Slides
Timeline
Milestone Timeline with Year Markers Template for PowerPoint & Google Slides
Timeline
Three-Year Vertical Milestone Timeline Template for PowerPoint & Google Slides
Timeline
Three-Year Project Roadmap Timeline Template for PowerPoint & Google Slides
Timeline
5 Year Timeline Template for PowerPoint & Google Slides
Timeline
Five-Year Plan Timeline Diagram Template for PowerPoint & Google Slides
Timeline
Three-Year Plan Timeline Diagram Template for PowerPoint & Google Slides
Timeline
5-Year Business Timeline Template for PowerPoint & Google Slides
Timeline
Smart Multi-Purpose PowerPoint Template for PowerPoint & Google Slides
Company Profile
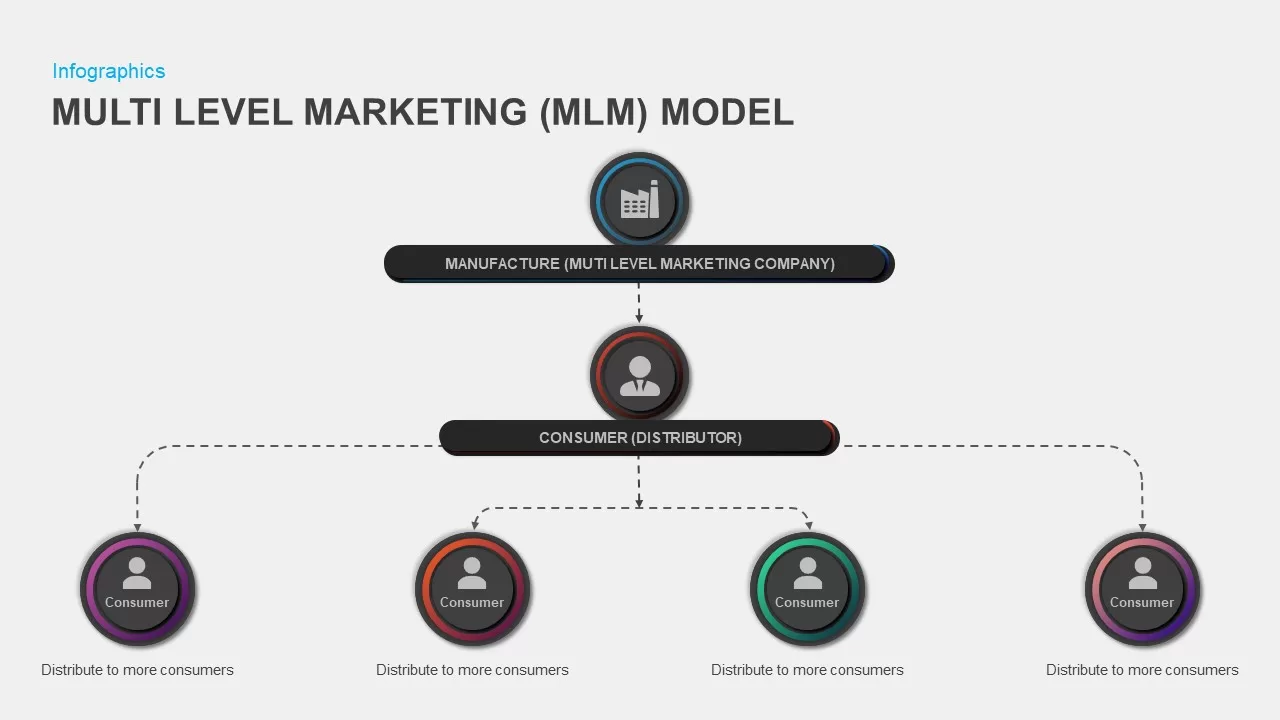
Multi-Level Marketing PowerPoint Template for PowerPoint & Google Slides
Business Models
Multi-Series Curved Line Graph Analytics Template for PowerPoint & Google Slides
Comparison Chart
Multi-Segment Circle Split Diagram template for PowerPoint & Google Slides
Circular
Horizontal Multi-Level Hierarchy Chart template for PowerPoint & Google Slides
Org Chart
Simple Multi-Branch Mind Map Template for PowerPoint & Google Slides
Mind Maps
Multi-layout Circle Spoke Diagram Template for PowerPoint & Google Slides
Circular
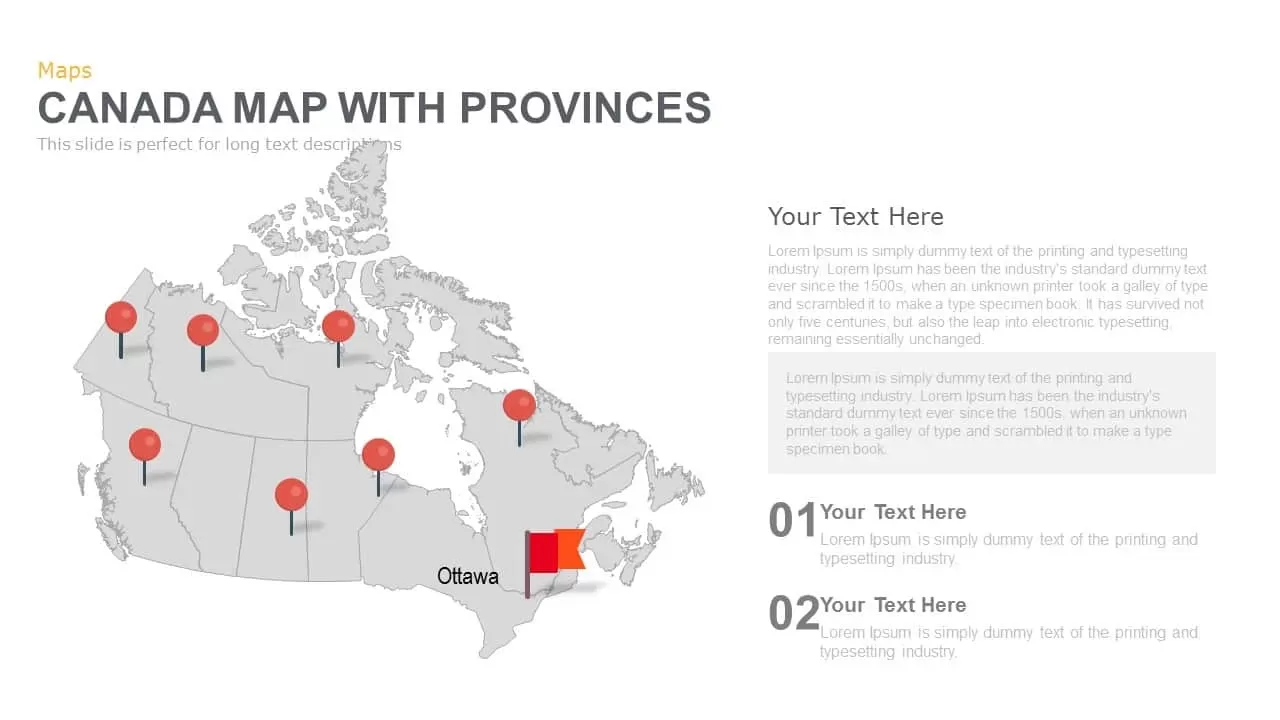
Canada Provinces Map Multi-Layout Template for PowerPoint & Google Slides
World Maps
Modern Multi-Section Circle Diagram Template for PowerPoint & Google Slides
Circular
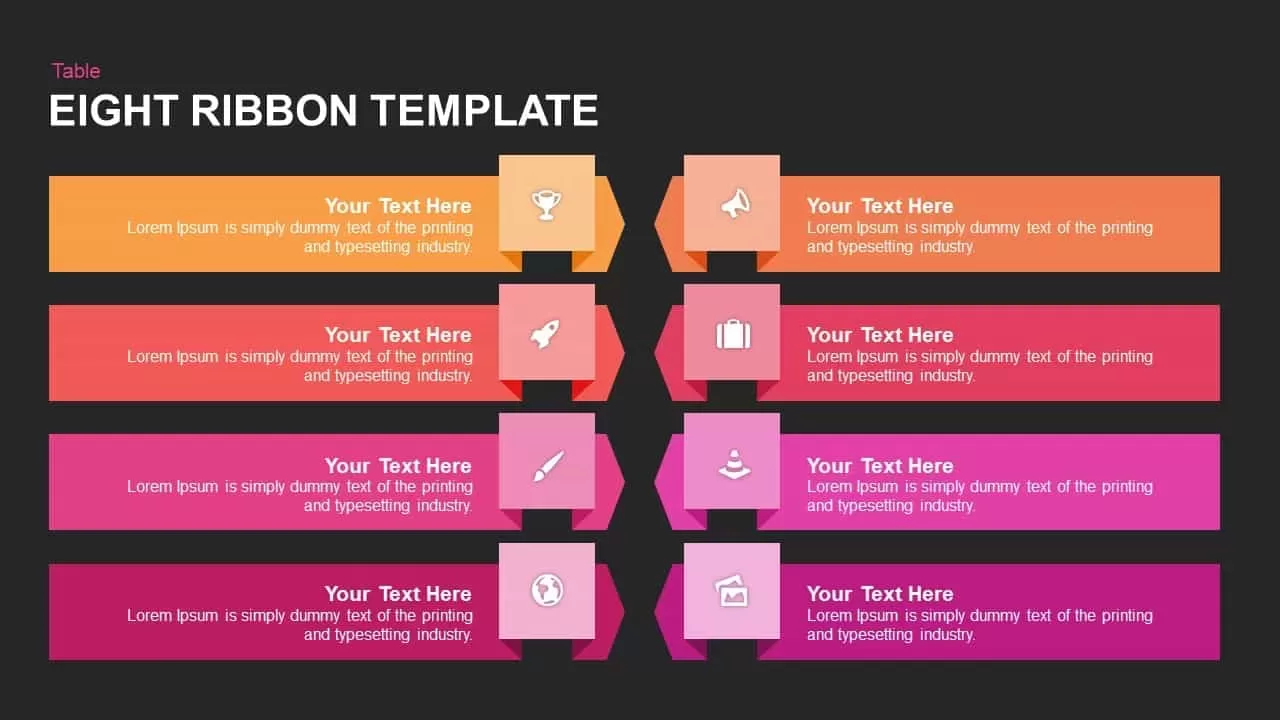
Multi-Color Eight-Step Ribbon Diagram Template for PowerPoint & Google Slides
Process
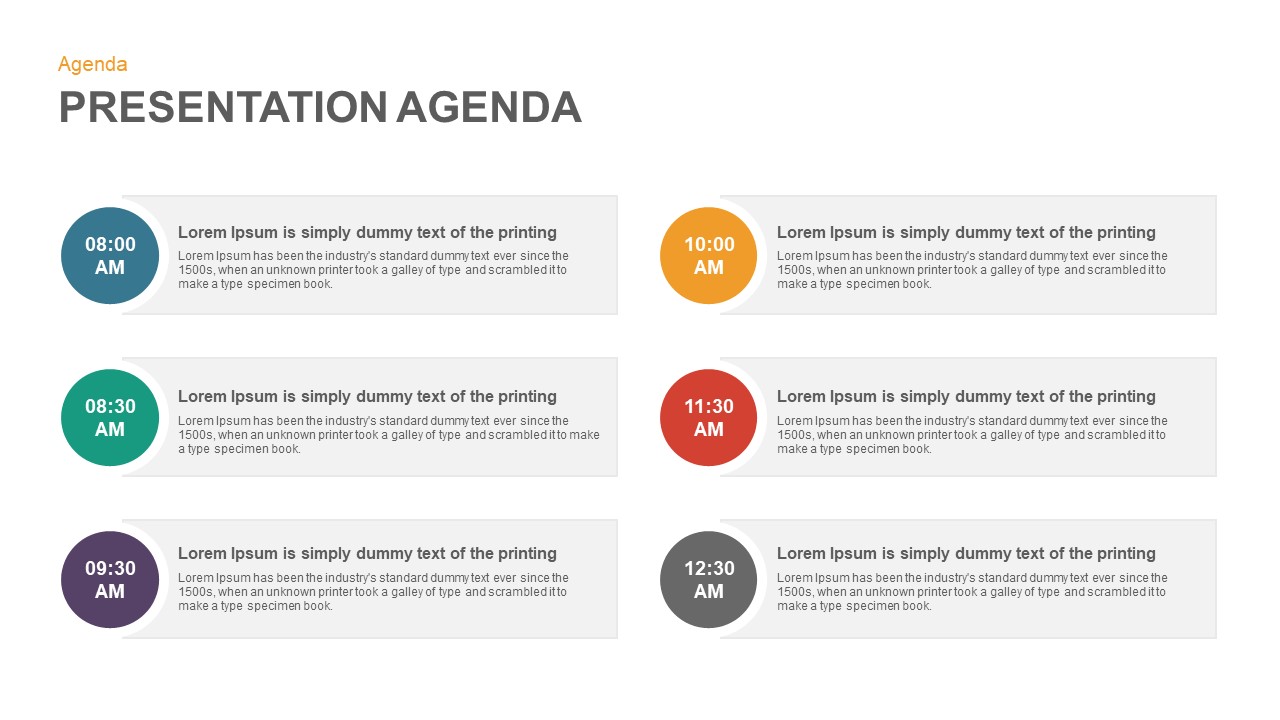
Multi-Style Presentation Agenda Template for PowerPoint & Google Slides
Agenda
Multi-Style Project Life Cycle Diagram Template for PowerPoint & Google Slides
Process
Multi-Functional Presentation Template for PowerPoint & Google Slides
Pitch Deck
Multi-Color Enneagram Circular Diagram Template for PowerPoint & Google Slides
Circular
Multi-Item Agenda Hub-and-Spoke Diagram Template for PowerPoint & Google Slides
Agenda
Doodle Multi Presentation Template for PowerPoint & Google Slides
Company Profile
Free Circular Multi-Step Flow Chart Diagram Template for PowerPoint & Google Slides
Flow Charts
Free
Multi-Color Five-Step Curved Arrow Template for PowerPoint & Google Slides
Process
Multi-Series Stacked Bar Chart Template for PowerPoint & Google Slides
Bar/Column
Editable Multi-Series Peak Line Chart Template for PowerPoint & Google Slides
Comparison Chart
Multi-Series Line Chart with Icons Template for PowerPoint & Google Slides
Comparison Chart
Multi-Series Vertical Dot Chart Template for PowerPoint & Google Slides
Comparison Chart
Multi-Variation Thermometer Chart Template for PowerPoint & Google Slides
Bar/Column
Interactive Multi-Use Cost Comparison Template for PowerPoint & Google Slides
Comparison
Multi-Style Clock Chart Diagram Template for PowerPoint & Google Slides
Circular
Multi-Variation Circular Chart Diagram Template for PowerPoint & Google Slides
Circular
Free Editable Multi-Step Ribbon Agenda Slide Template for PowerPoint & Google Slides
Agenda
Free
Multi-Color Technology Roadmap Template Pack for PowerPoint & Google Slides
Roadmap
Modern Multi-Color Polar Chart Diagram Template for PowerPoint & Google Slides
Charts
Multi-Level Wheel Chart Diagram template for PowerPoint & Google Slides
Pie/Donut
Multi-Level Colorful Pyramid Chart Template for PowerPoint & Google Slides
Pyramid
Free Minimal Multi-Color Table of Contents Template for PowerPoint & Google Slides
Agenda
Free
Colorful Multi-Branch Mind Map Slide Template for PowerPoint & Google Slides
Mind Maps
Multi-Sector Revenue Breakdown Cards Template for PowerPoint & Google Slides
Comparison
Multi-Style Board of Directors Profile Template for PowerPoint & Google Slides
Our Team
Multi-Point Diagram Presentation Template for PowerPoint & Google Slides
Process
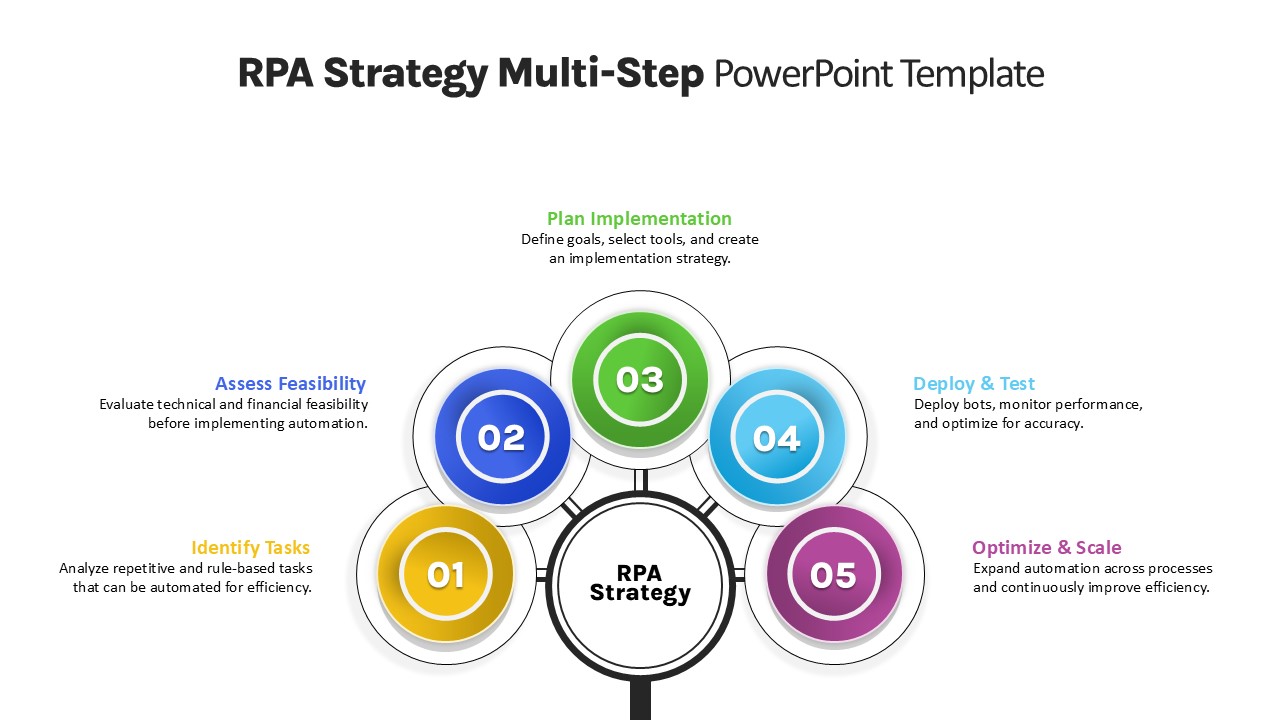
RPA Strategy Multi-Step Diagram Template for PowerPoint & Google Slides
Process
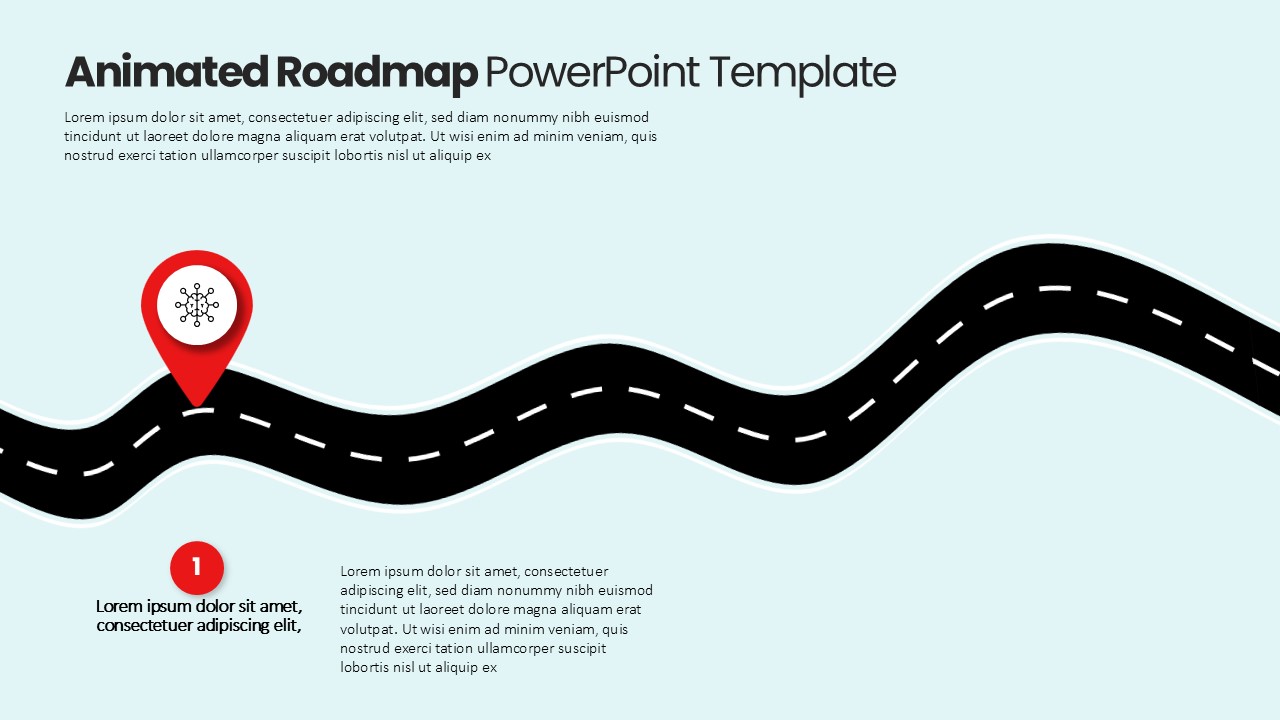
Animated Multi-Milestone Roadmap Template for PowerPoint & Google Slides
Roadmap
Multi-Column Table Presentation Template for PowerPoint & Google Slides
Table
Six-Row Multi-Column Table Presentation Template for PowerPoint & Google Slides
Table
Multi Color SWOT Analysis Quadrant Template for PowerPoint & Google Slides
SWOT
Three-Year Plan Infographic Pack Template for PowerPoint & Google Slides
Timeline
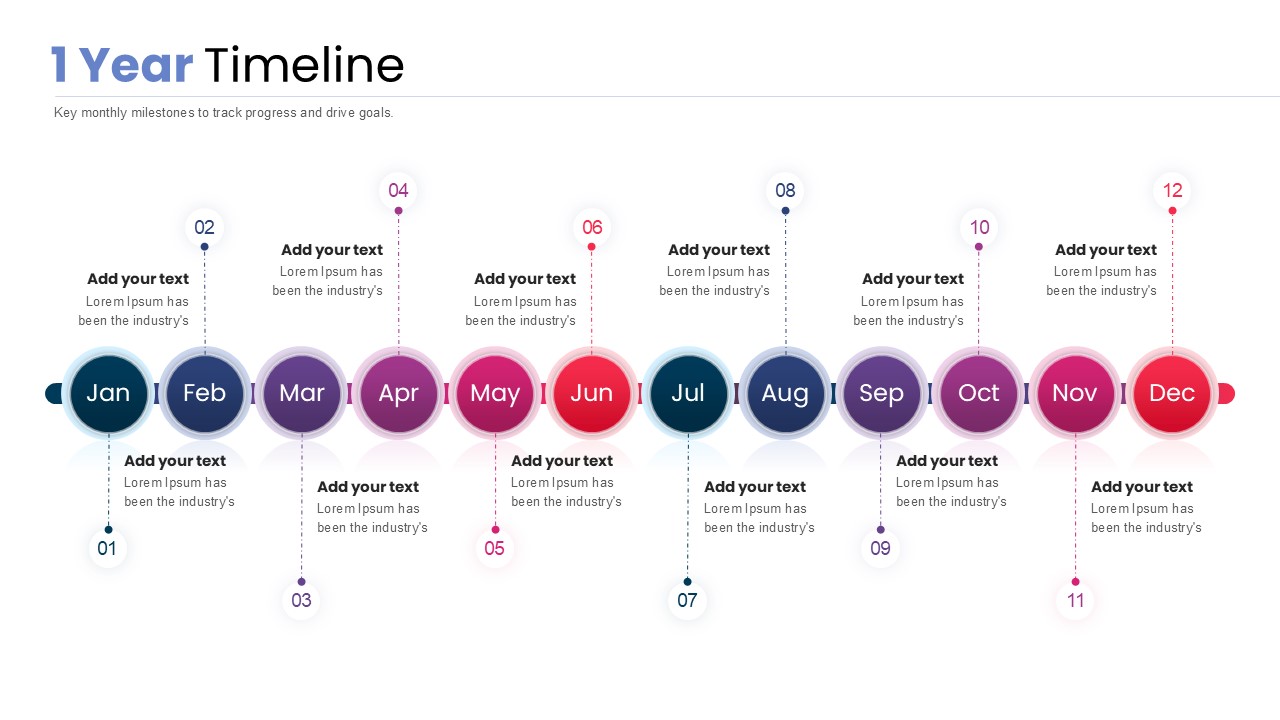
1 Year Timeline PowerPoint Template
Timeline
Free New Year’s Resolution Slides Pack for PowerPoint & Google Slides 2023
Graphics
Free
Three-Year Bar Chart template for PowerPoint & Google Slides
Charts
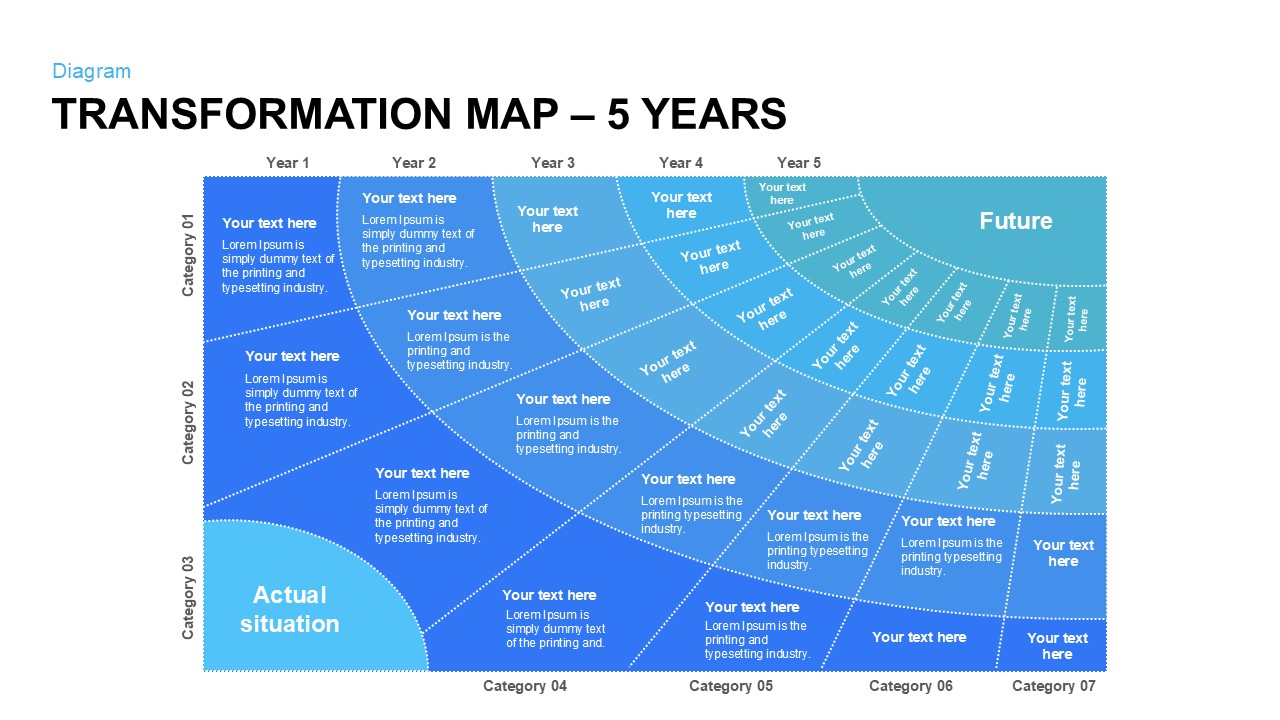
Five-Year Transformation Map Diagram Template for PowerPoint & Google Slides
Process
Three-Year Strategic Plan Matrix Template for PowerPoint & Google Slides
Timeline
Free Elegant Happy New Year Greeting Slide Template for PowerPoint & Google Slides
Graphics
Free
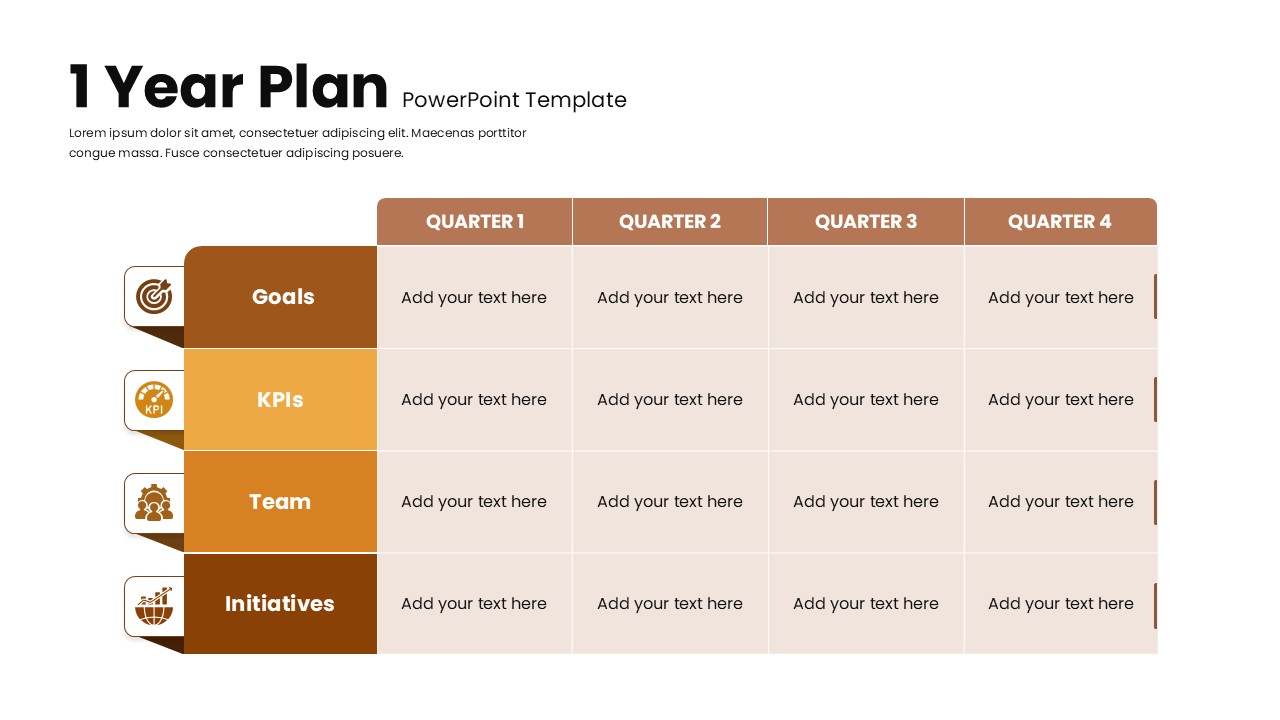
1 Year Plan Overview template for PowerPoint & Google Slides
Business Plan
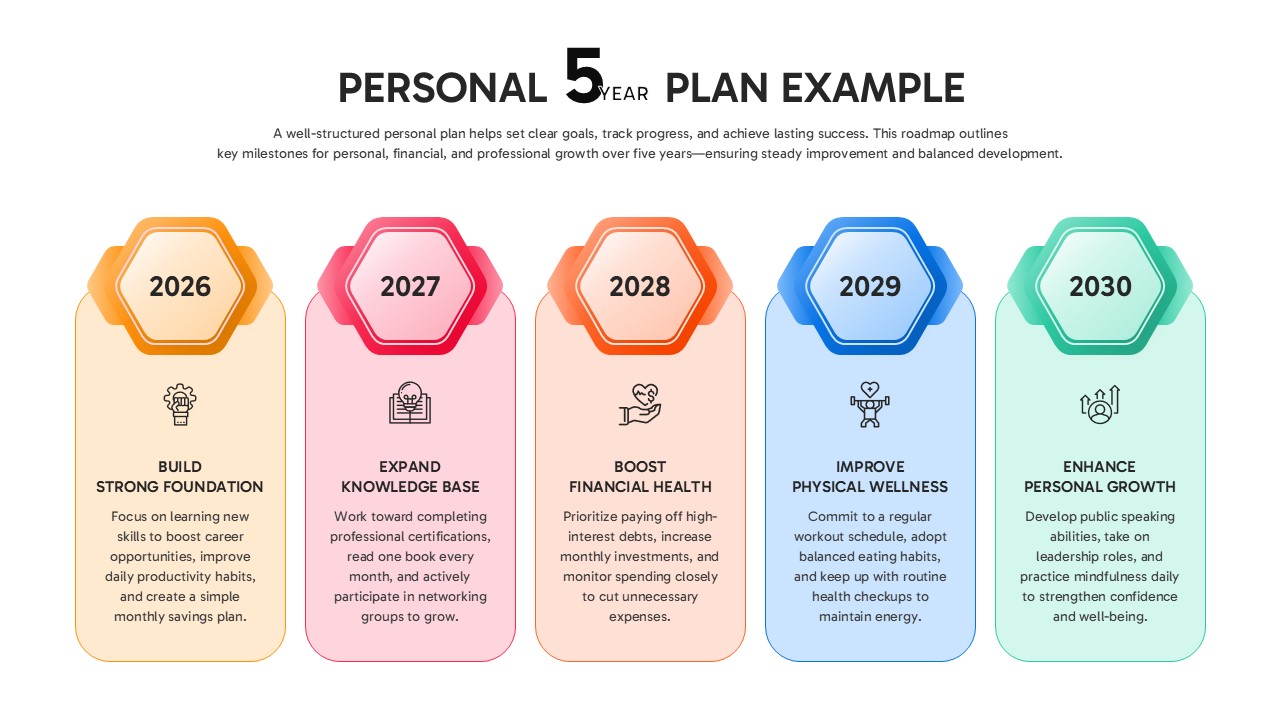
Personal 5-Year Roadmap Plan Example Template for PowerPoint & Google Slides
Timeline
End of Year Review Dashboard Template for PowerPoint & Google Slides
Business Report
Year in Review KPI Highlights Slide for PowerPoint & Google Slides
Business Report
Half Year Gantt Chart Templat for PowerPoint & Google Slides
Gantt Chart
Creative New Year Resolution Planner for PowerPoint & Google Slides
Leadership
Free
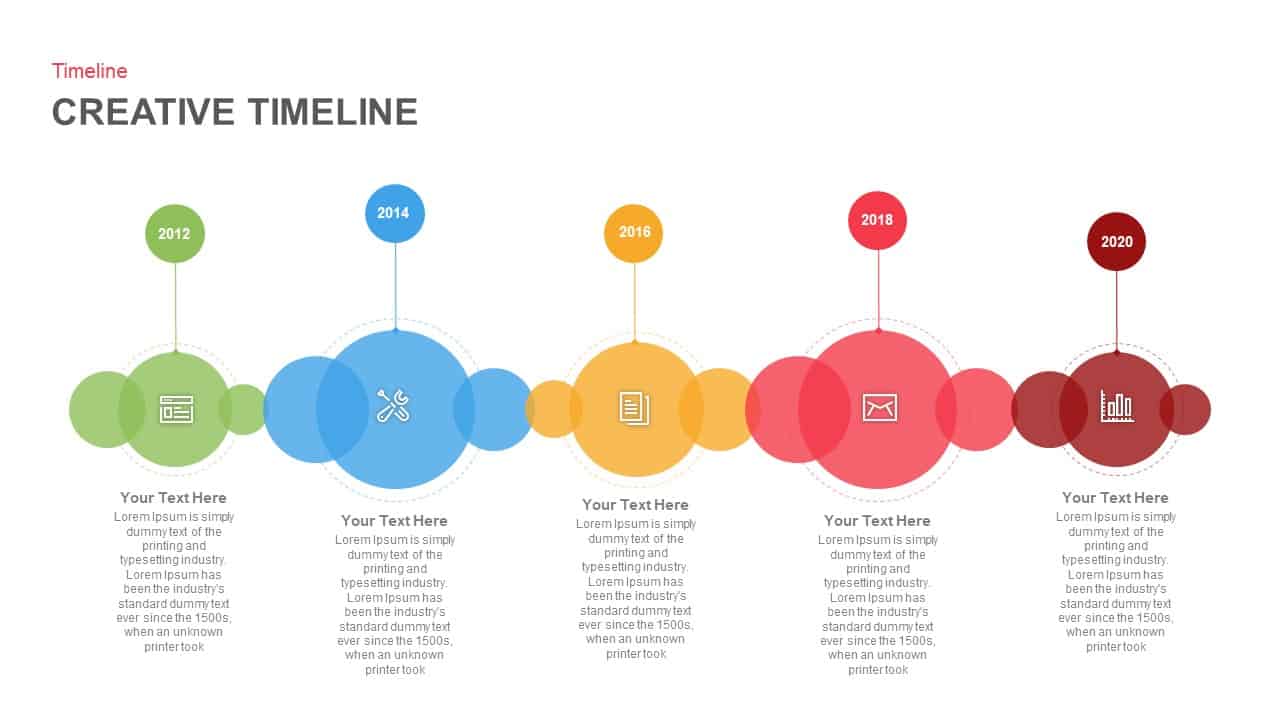
Creative Bubble Timeline Infographic Template for PowerPoint & Google Slides
Timeline
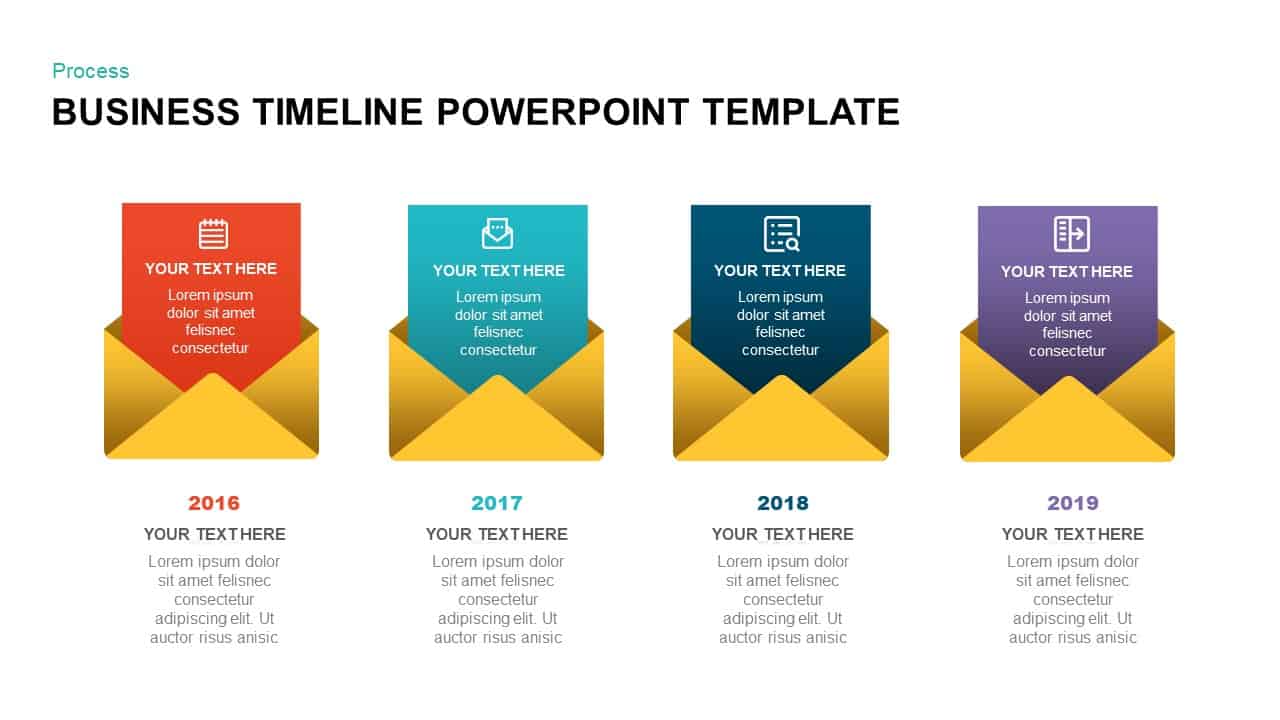
Business Timeline Envelope Infographic Template for PowerPoint & Google Slides
Timeline
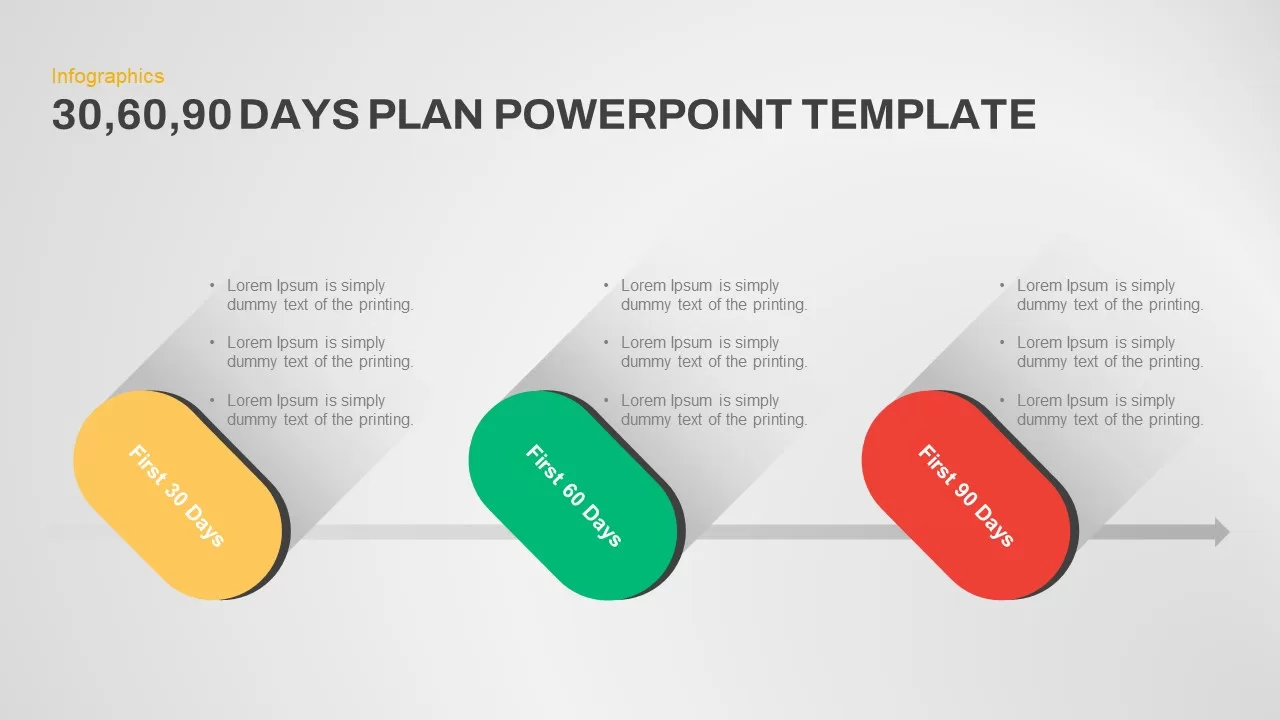
Pill-Style 30-60-90 Timeline Infographic Template for PowerPoint & Google Slides
Timeline
Project Update & Timeline Infographic Template for PowerPoint & Google Slides
Business
Timeline Infographic Steps template for PowerPoint & Google Slides
Business Plan
Editable Monthly Timeline Infographic Template for PowerPoint & Google Slides
Timeline
Quarterly Roadmap Timeline Infographic Template for PowerPoint & Google Slides
Timeline
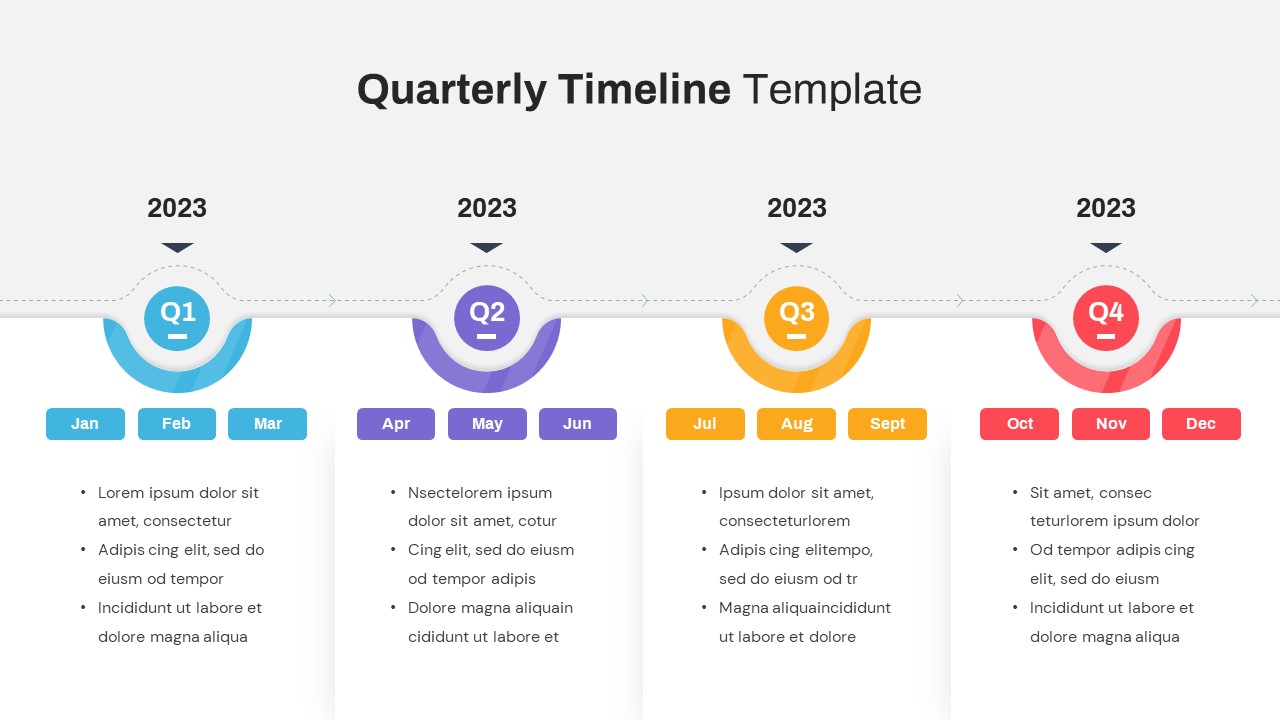
Quarterly Timeline Infographic Template for PowerPoint & Google Slides
Timeline
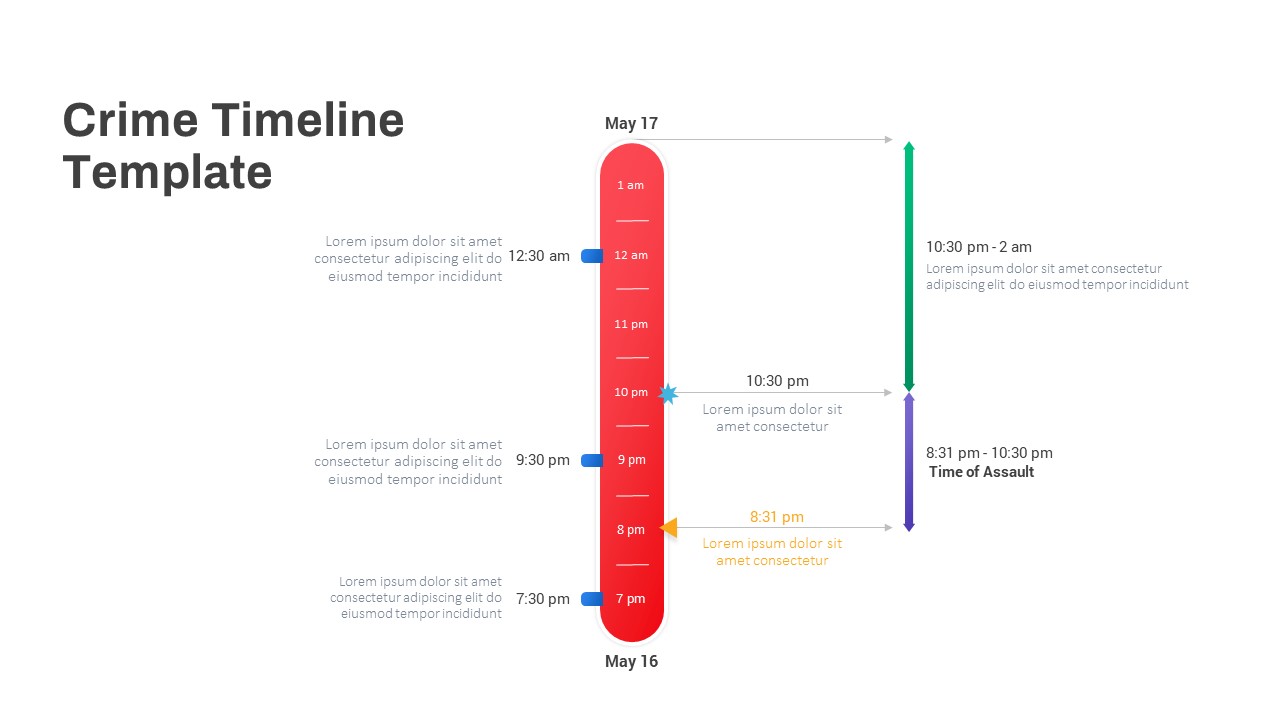
Vertical Crime Timeline Infographic Template for PowerPoint & Google Slides
Timeline
Fishbone Timeline Infographic Series Template for PowerPoint & Google Slides
Manufacturing
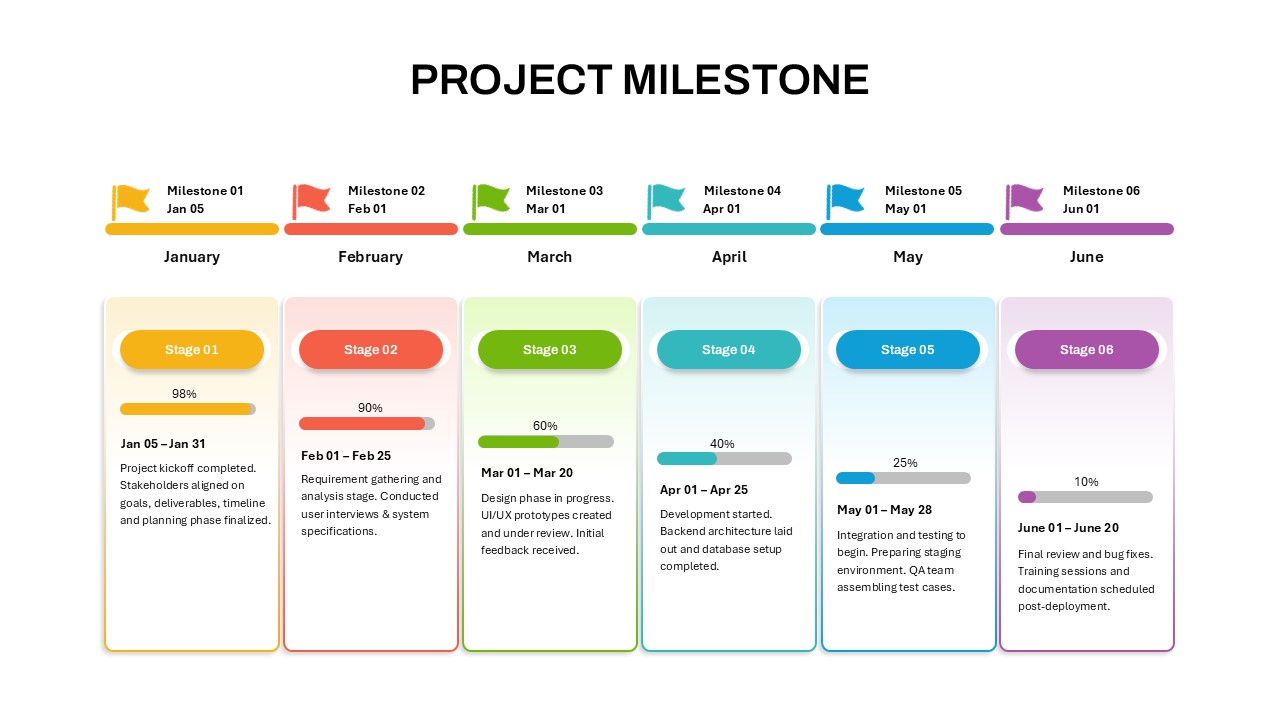
Project Milestone Timeline Infographic Template for PowerPoint & Google Slides
Timeline