Machine Learning Three-Step Process Template for PowerPoint & Google Slides


Description
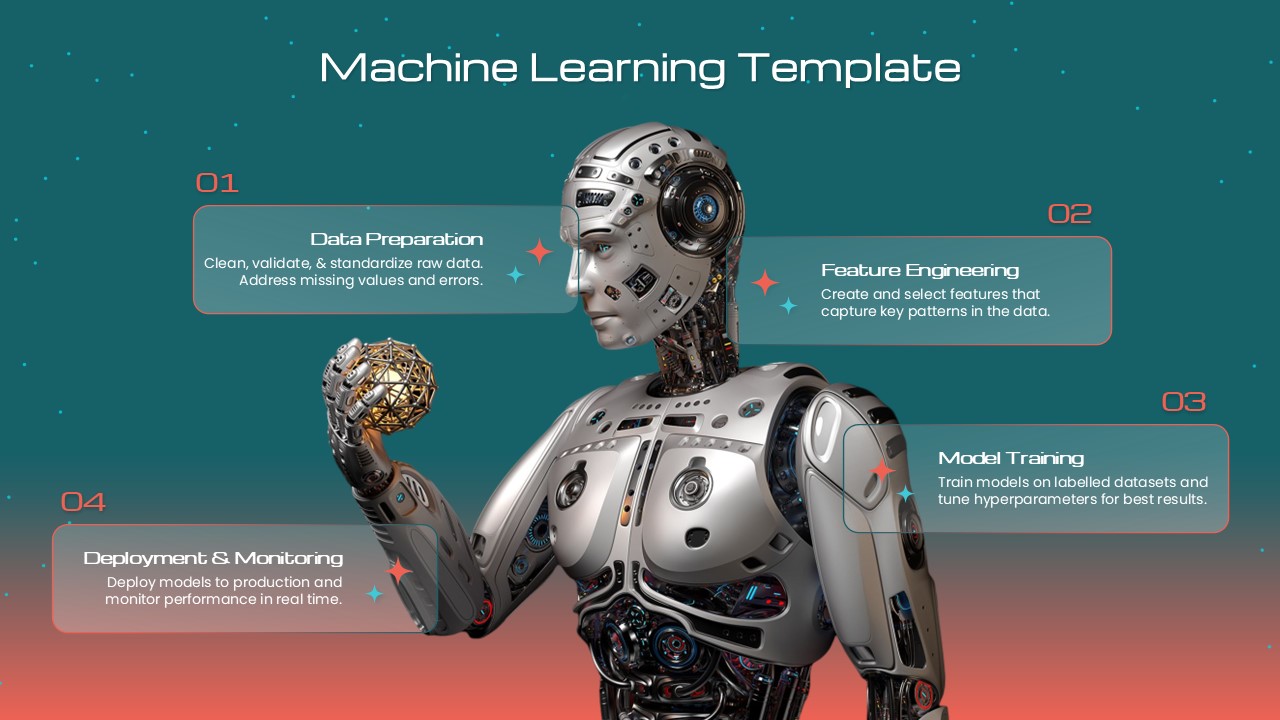
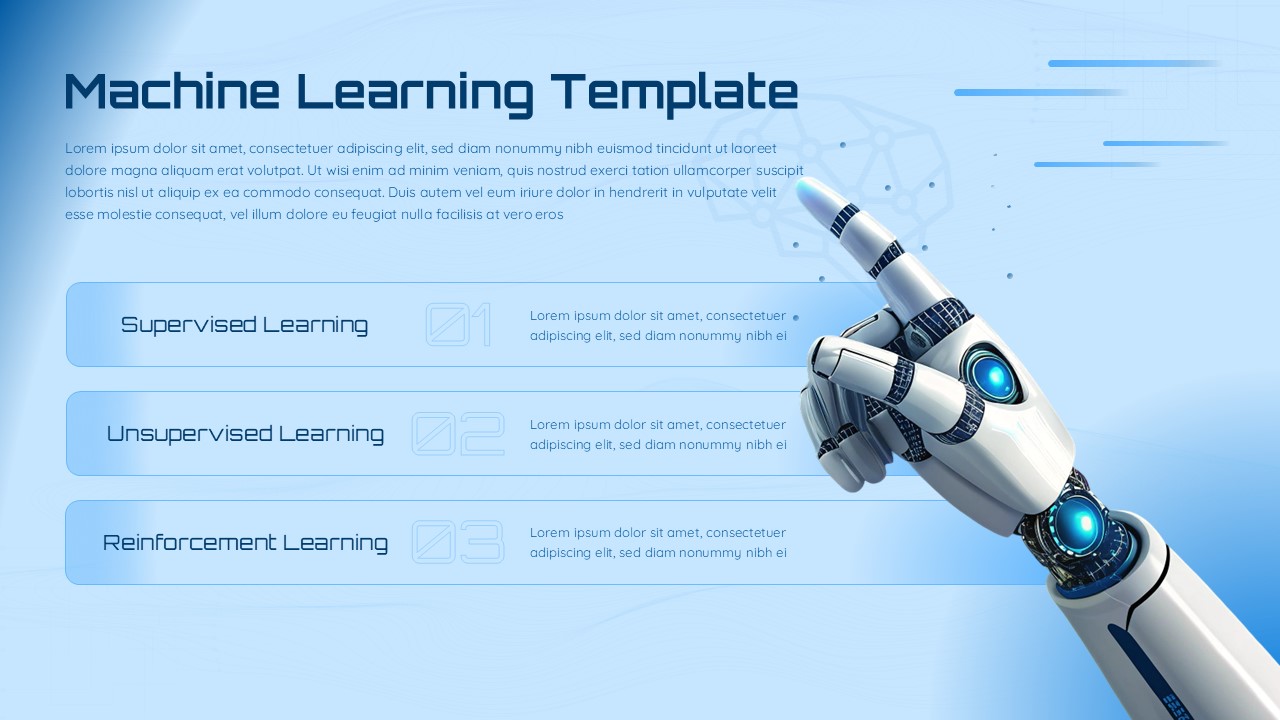
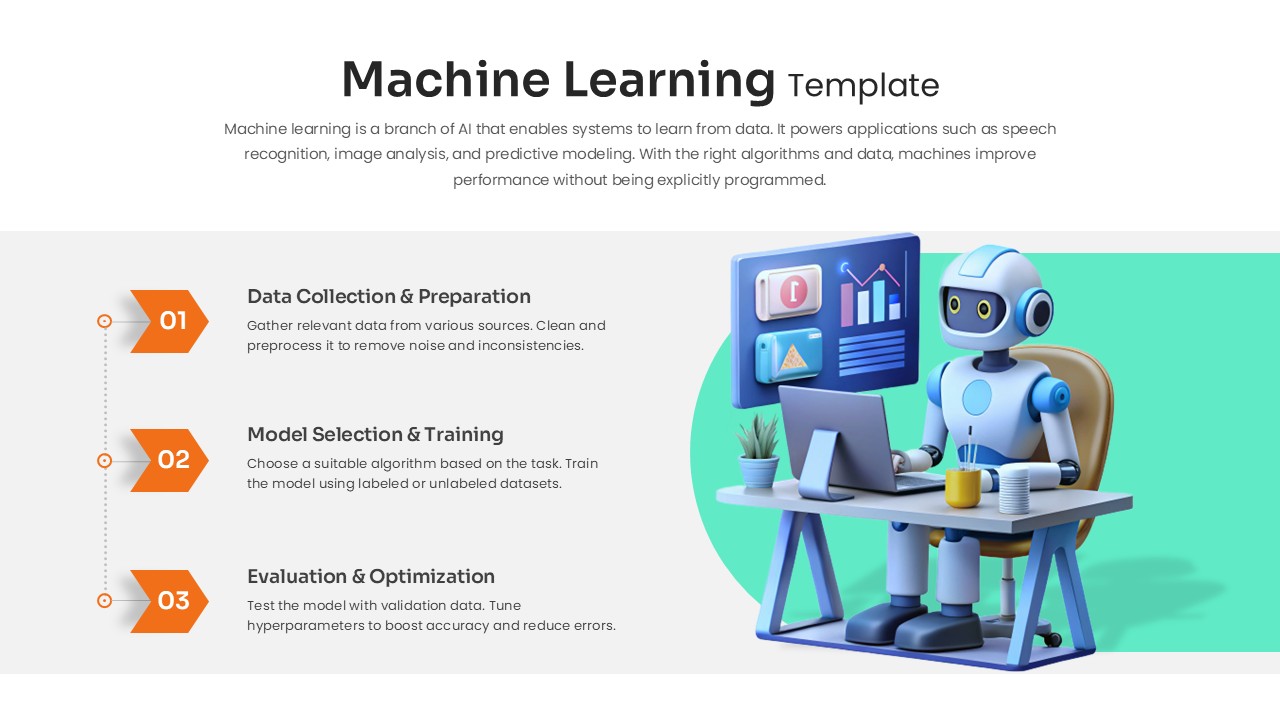
Clarify the machine learning lifecycle with a sleek three-step process slide. The left column uses bold orange arrow markers (01–03) and a dotted guide to highlight each phase: Data Collection & Preparation, Model Selection & Training, and Evaluation & Optimization. On the right, a 3D robot analyst at a desk reinforces the theme without distracting from content. Clear headings and concise body text help you explain how to gather diverse datasets, choose algorithms, train with labeled or unlabeled data, and tune hyperparameters to improve accuracy. Fully editable shapes, fonts, and colors let you adapt the layout to your brand, while master-based spacing ensures consistent alignment across decks. Optimized for both PowerPoint and Google Slides, this slide scales cleanly on large displays and is easy to duplicate for deeper dives or comparisons.
Who is it for
Designed for data scientists, ML engineers, analytics managers, product owners, and technical educators who need to communicate workflows to non-specialists. Consultants and startup founders can use it to frame proposals, explain project stages, or set expectations with stakeholders. University instructors and bootcamp trainers will appreciate the simple hierarchy for lectures, assignments, and capstone reviews. Team leads can also map responsibilities and handoffs across data, modeling, and MLOps.
Other Uses
Repurpose the structure for CRISP-DM overviews, feature engineering checklists, or model governance briefings. Turn each step into milestones on a roadmap, attach KPIs like accuracy and latency, or convert the slide into a project status tracker with owners and due dates. Swap the robot visual for product screenshots to document experiments, A/B tests, or deployment pathways, creating a compact narrative for demos, retrospectives, or stakeholder updates.
Login to download this file

Item ID
SB05484Designed By
Athira
Related Templates

Machine Learning Four-Step Process Template for PowerPoint & Google Slides
Machine Learning
Machine Learning 4-Step Workflow Template for PowerPoint & Google Slides
Machine Learning
Machine Learning Process Template for PowerPoint & Google Slides
Machine Learning
Machine Learning Diagram Template for PowerPoint & Google Slides
Process
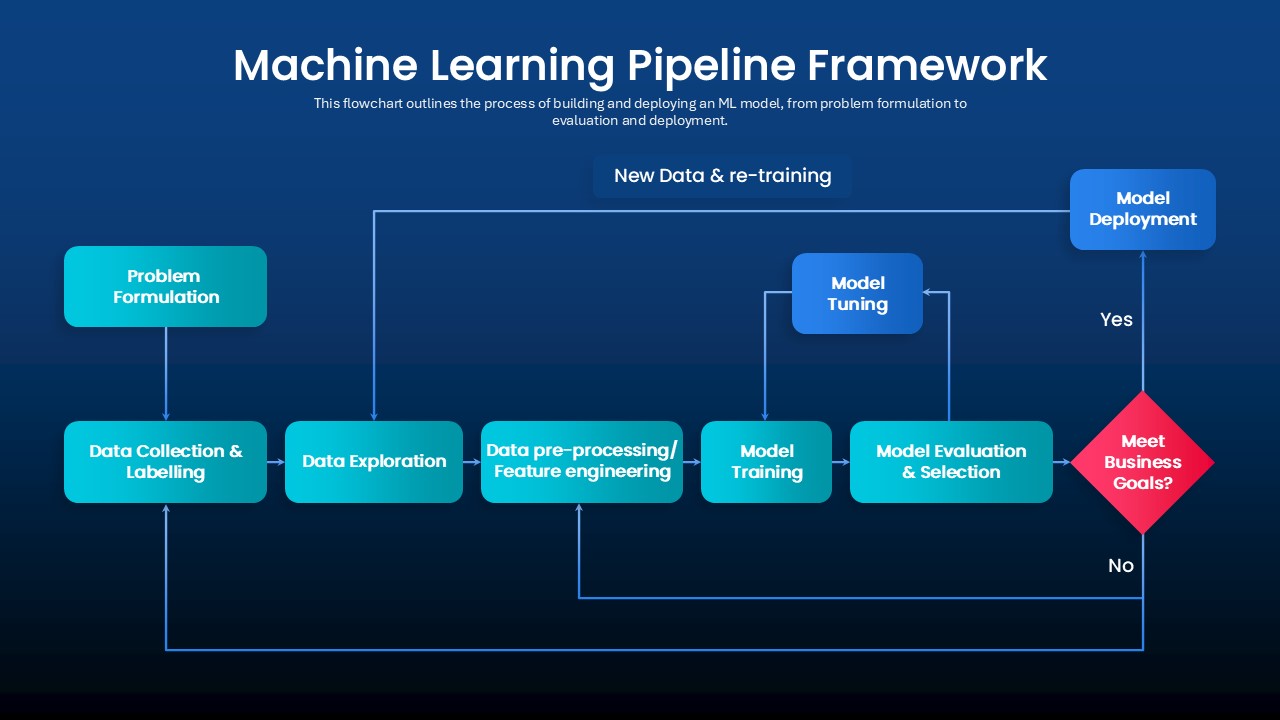
Machine Learning Pipeline Framework Template for PowerPoint & Google Slides
Charts
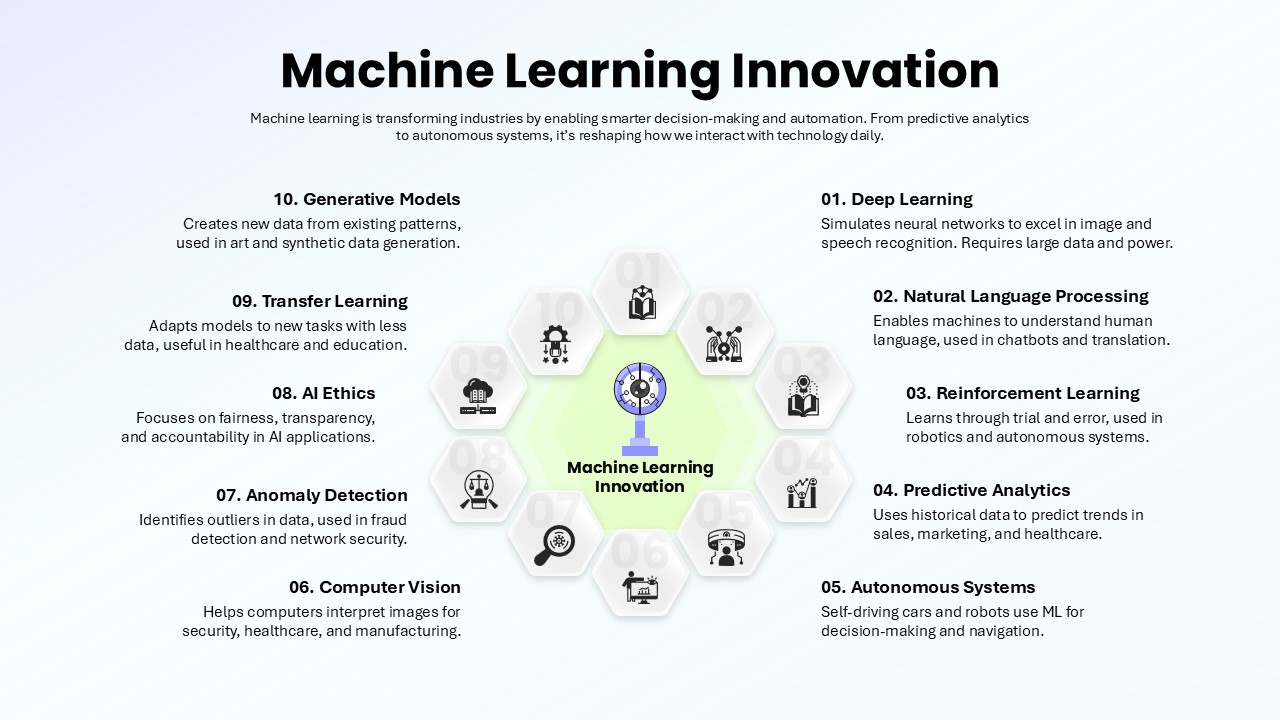
Machine Learning Innovation Overview template for PowerPoint & Google Slides
AI
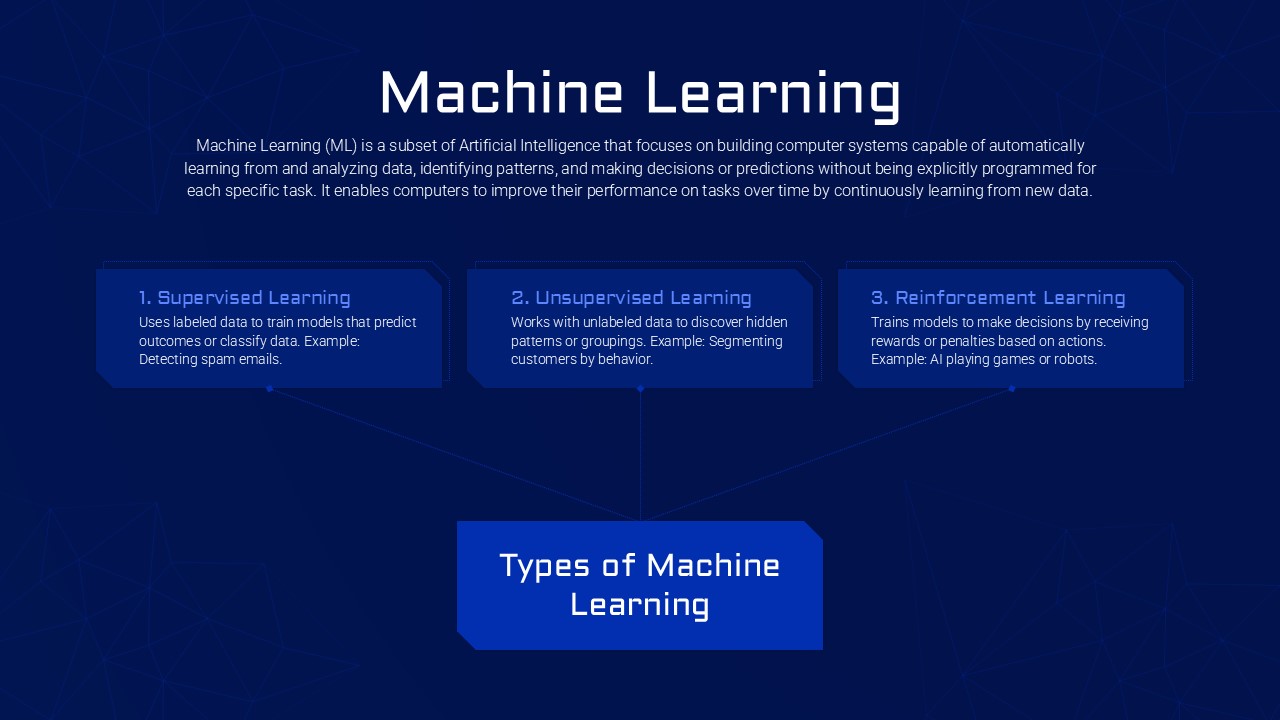
Machine Learning Types template for PowerPoint & Google Slides
Technology
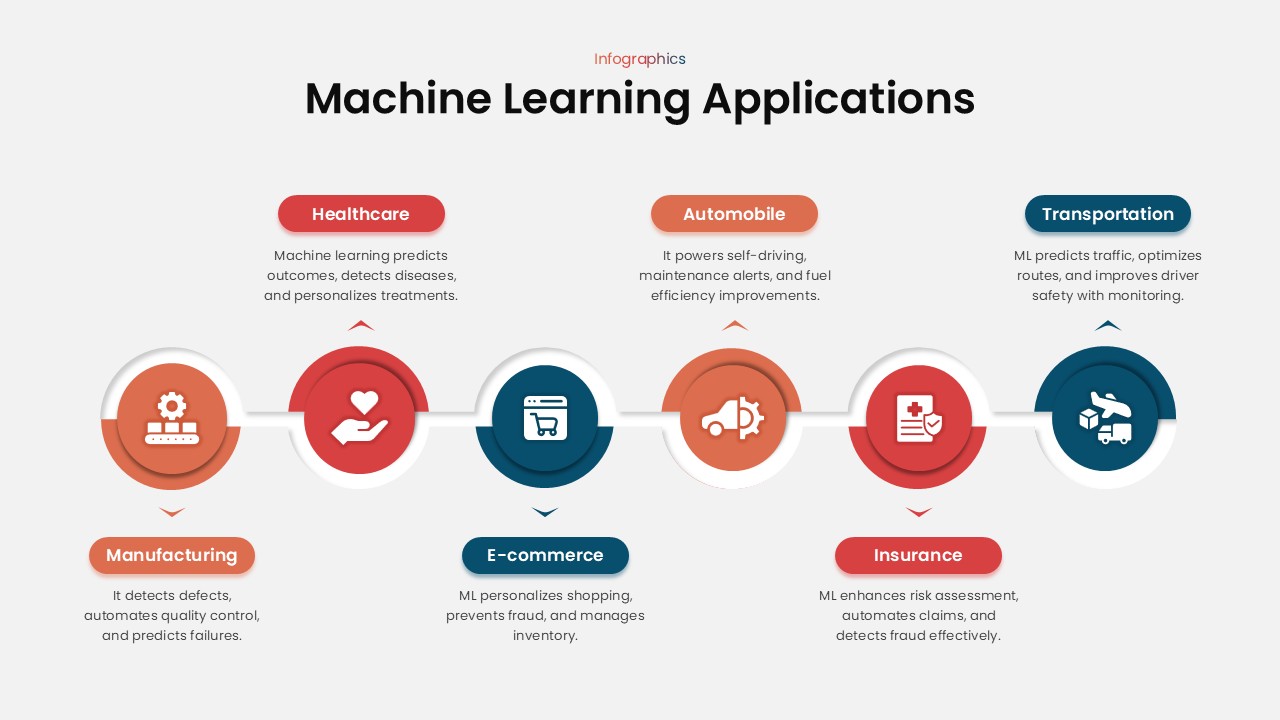
Machine Learning Applications template for PowerPoint & Google Slides
Technology
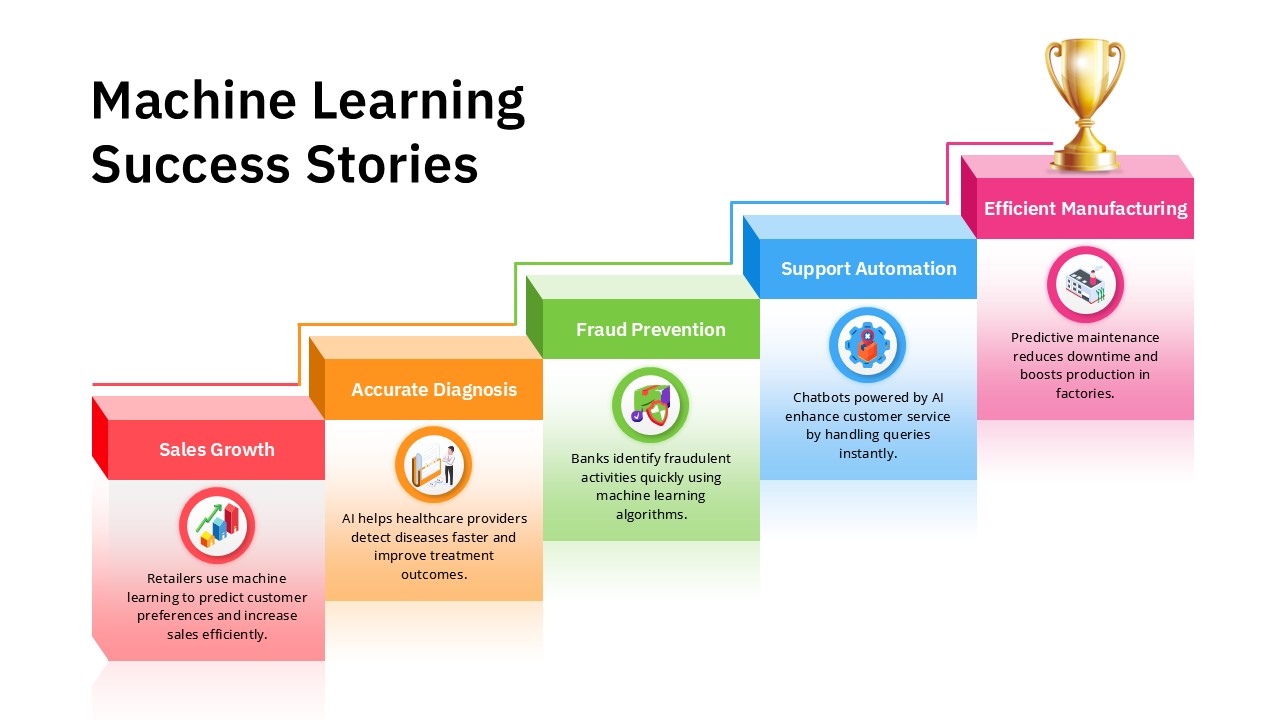
Machine Learning Success Stories Infographic Template for PowerPoint & Google Slides
Process
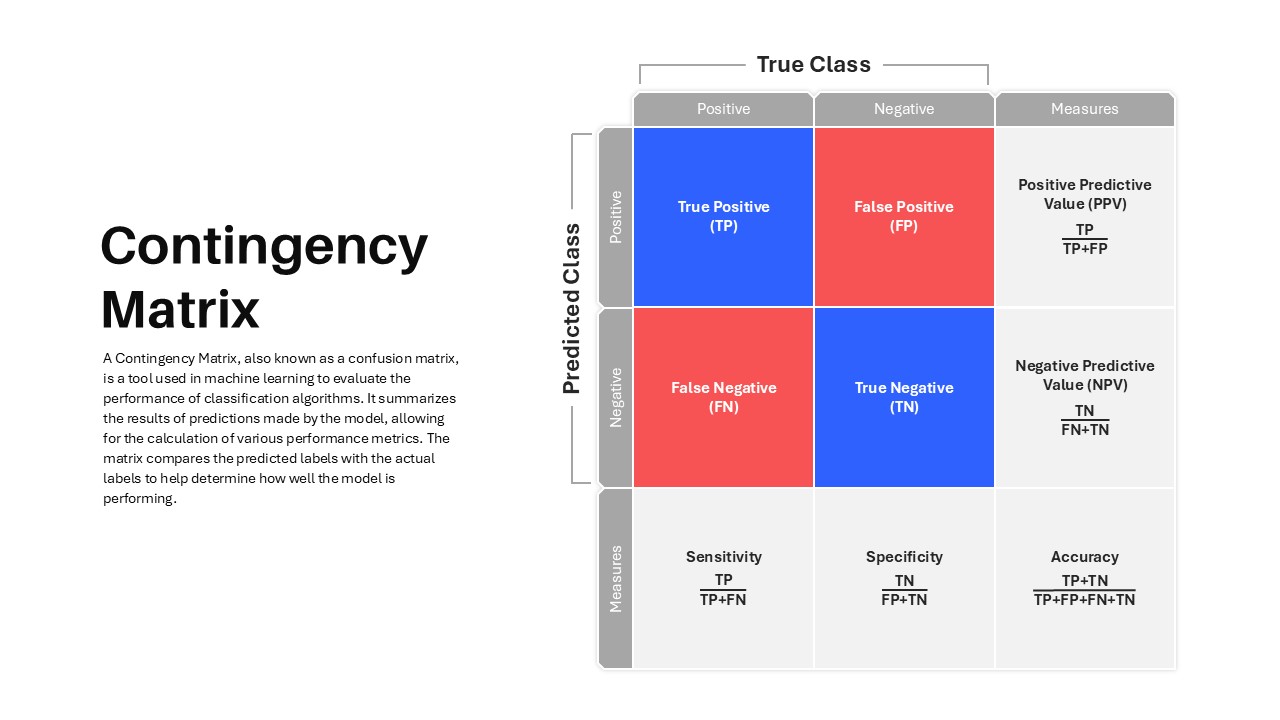
Contingency Matrix in Machine Learning template for PowerPoint & Google Slides
Technology
Machine Learning Overview Slide Template for PowerPoint & Google Slides
Machine Learning
Free Machine Learning Concept Slide Template for PowerPoint & Google Slides
Machine Learning
Free
Futuristic Machine Learning Workflow Template for PowerPoint & Google Slides
Machine Learning
Futuristic Machine Learning Types Overview Template for PowerPoint & Google Slides
AI
Machine Learning Pipeline Overview Template for PowerPoint & Google Slides
Machine Learning
Machine Learning Presentation Use Cases Template for PowerPoint & Google Slides
Machine Learning
Machine Learning Model Management Template for PowerPoint & Google Slides
Machine Learning
Machine Learning Pipeline & MLOps Flow Template for PowerPoint & Google Slides
Machine Learning
Seven Stage Machine Learning Pipeline Template for PowerPoint & Google Slides
Machine Learning
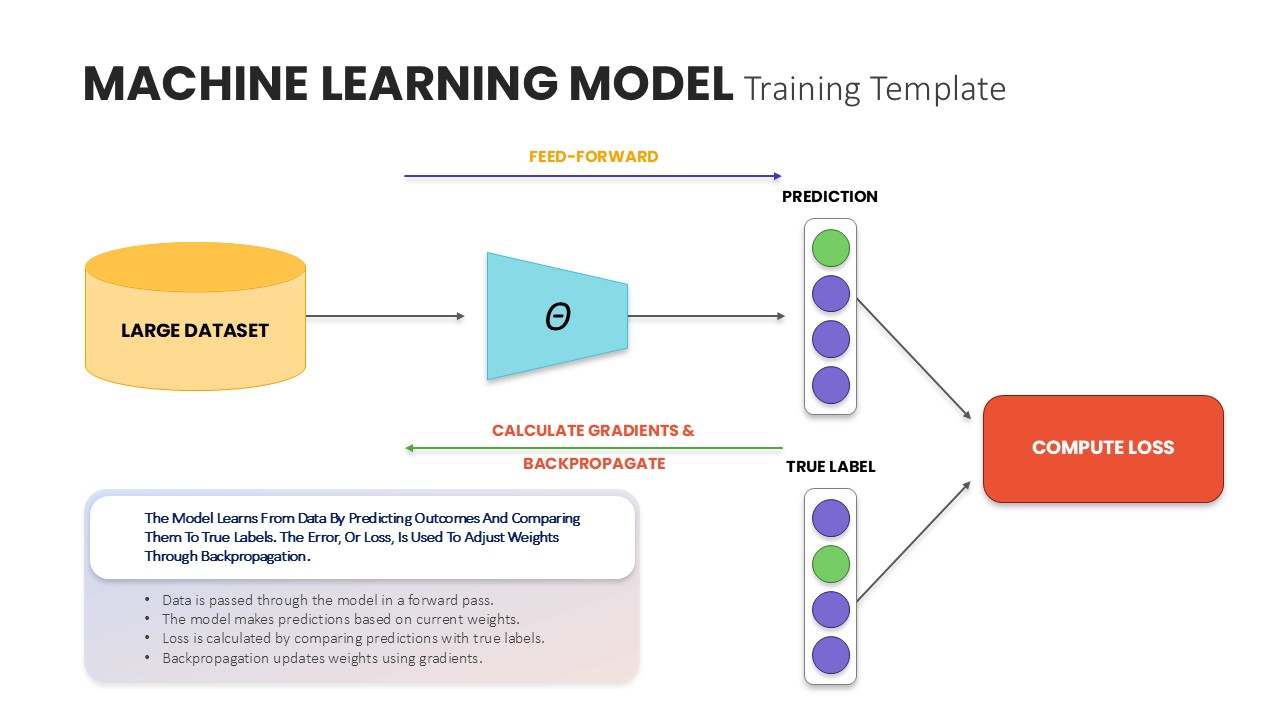
Machine Learning Model Training Template for PowerPoint & Google Slides
Machine Learning
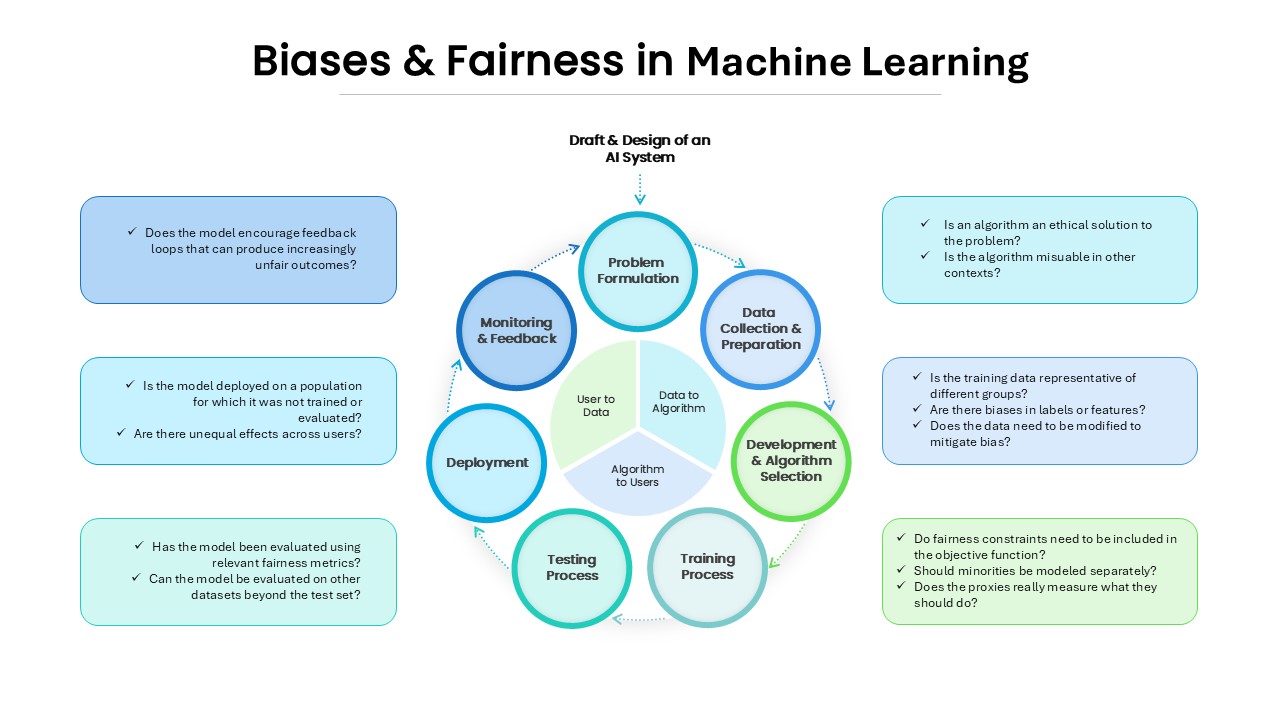
Biases and Fairness in Machine Learning for PowerPoint & Google Slides
Information Technology
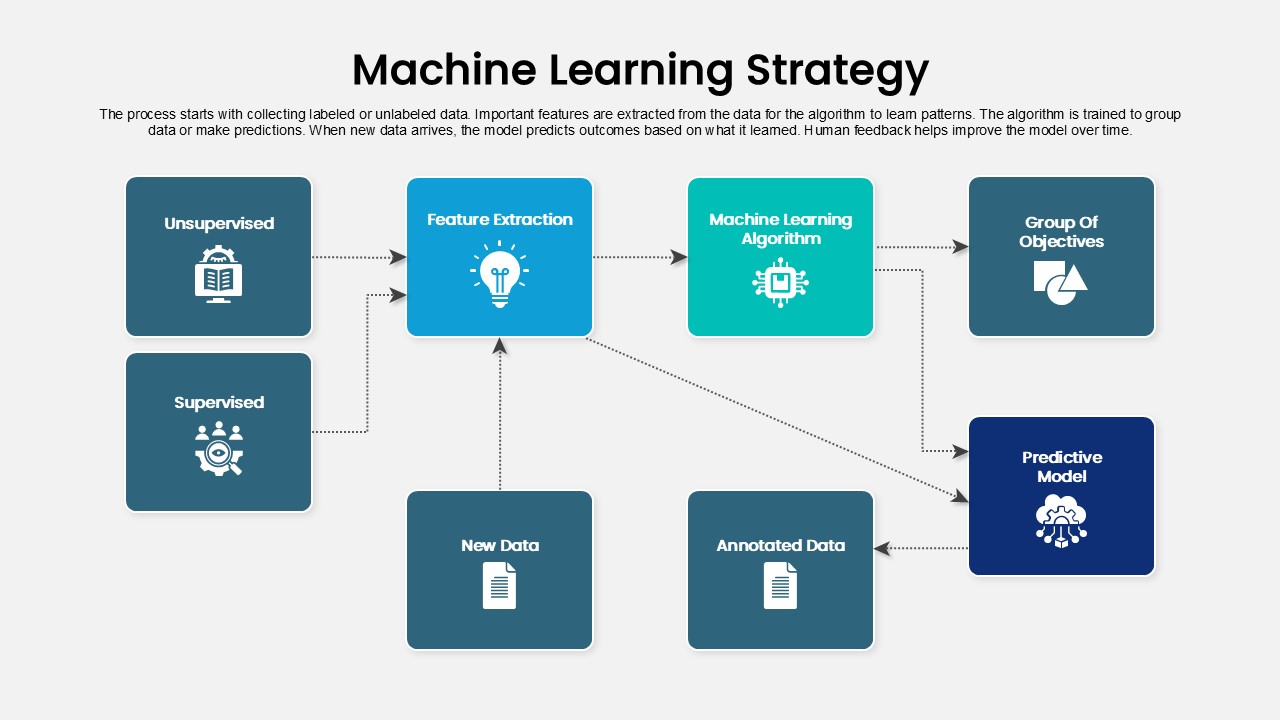
Machine Learning Strategy Flowchart
Machine Learning
Three to Nine-Step Puzzle Ring Process Diagram Template for PowerPoint & Google Slides
Circular
Three-Step Flowchart Process Diagram Template for PowerPoint & Google Slides
Flow Charts
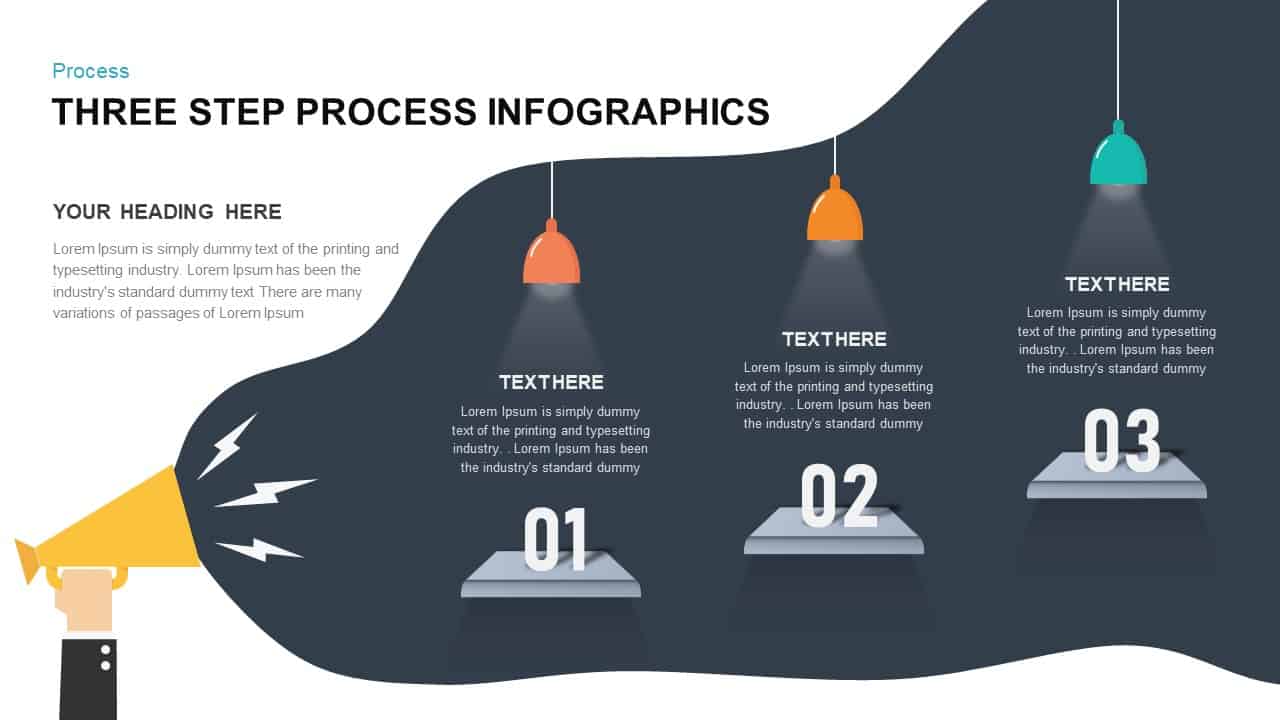
Three-Step Process Infographics Template for PowerPoint & Google Slides
Process
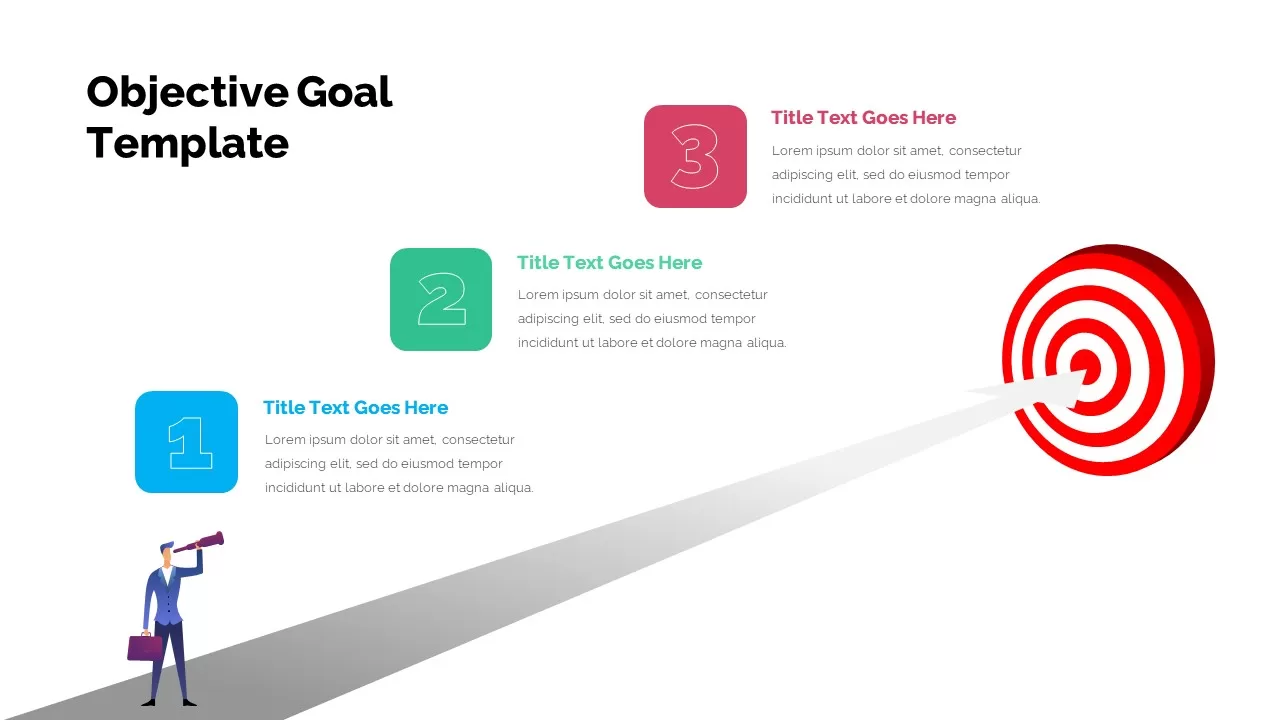
Three-Step Objective Goal Process Template for PowerPoint & Google Slides
Goals
Three-Step Curved Arrow Process Diagram Template for PowerPoint & Google Slides
Arrow
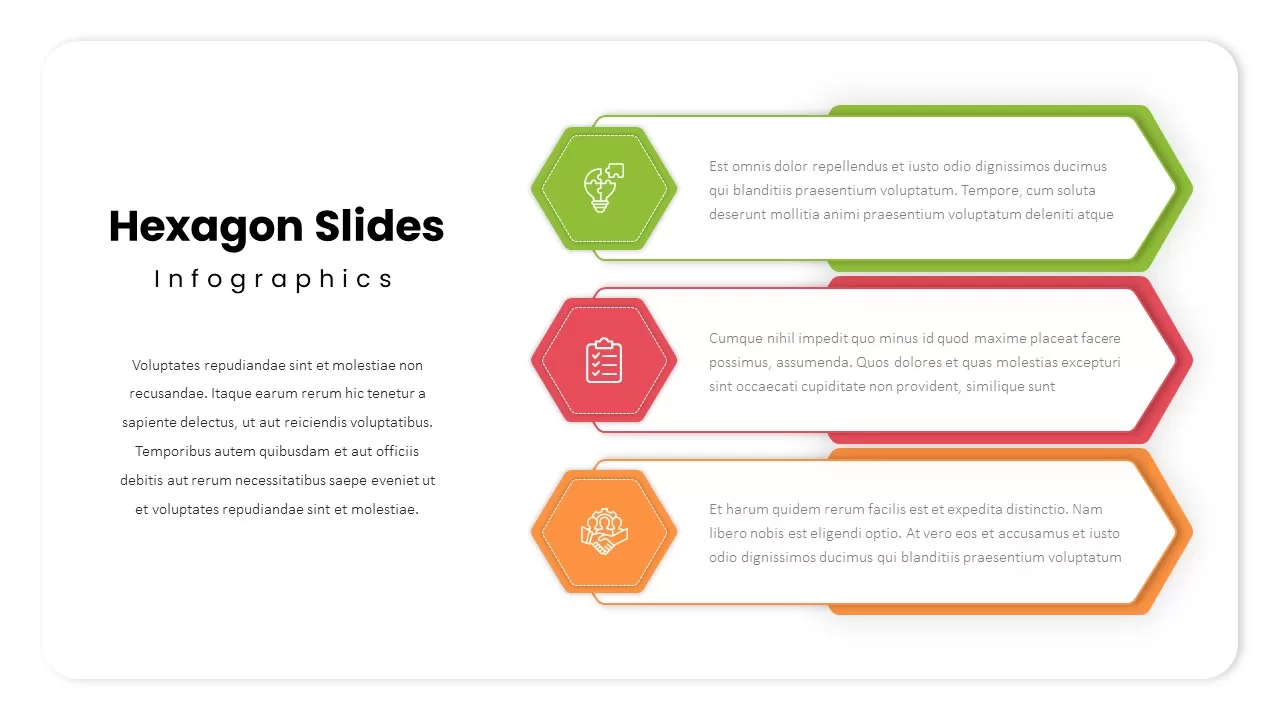
Three-Step Hexagon Infographic Process Template for PowerPoint & Google Slides
Process
Open Door Policy Three-Step Process Template for PowerPoint & Google Slides
Process
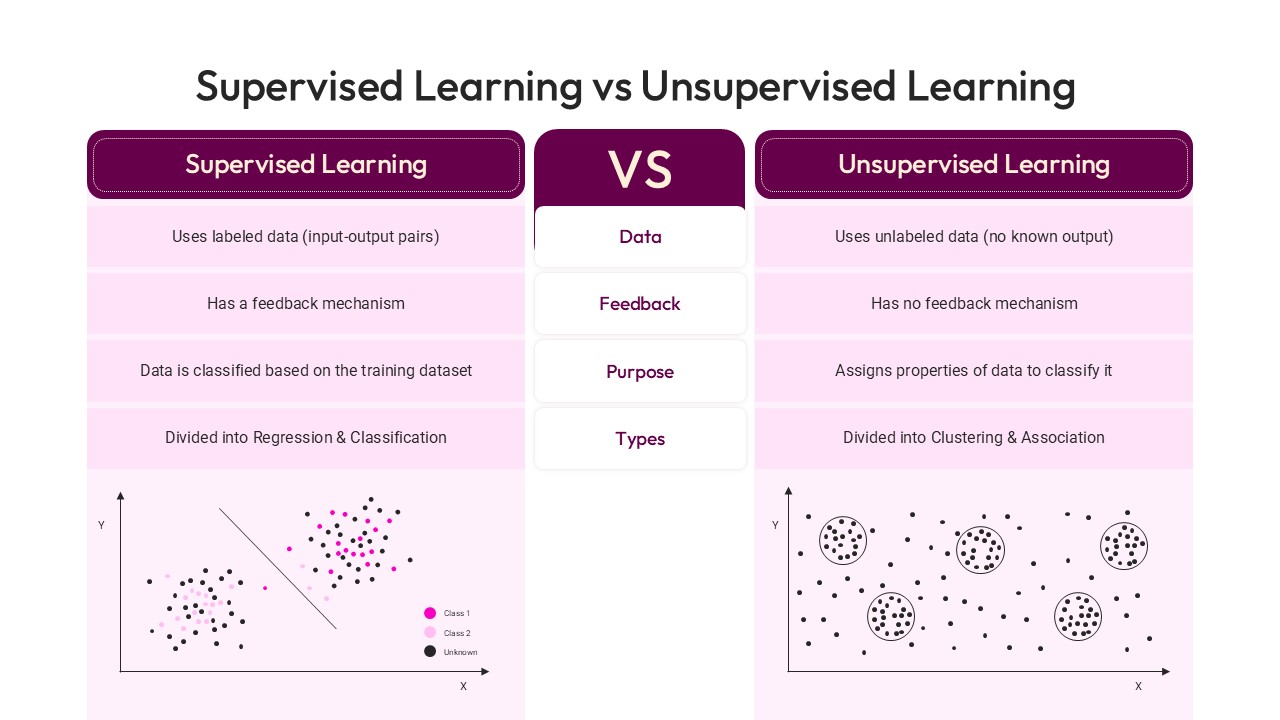
Supervised Learning vs Unsupervised Learning template for PowerPoint & Google Slides
Technology
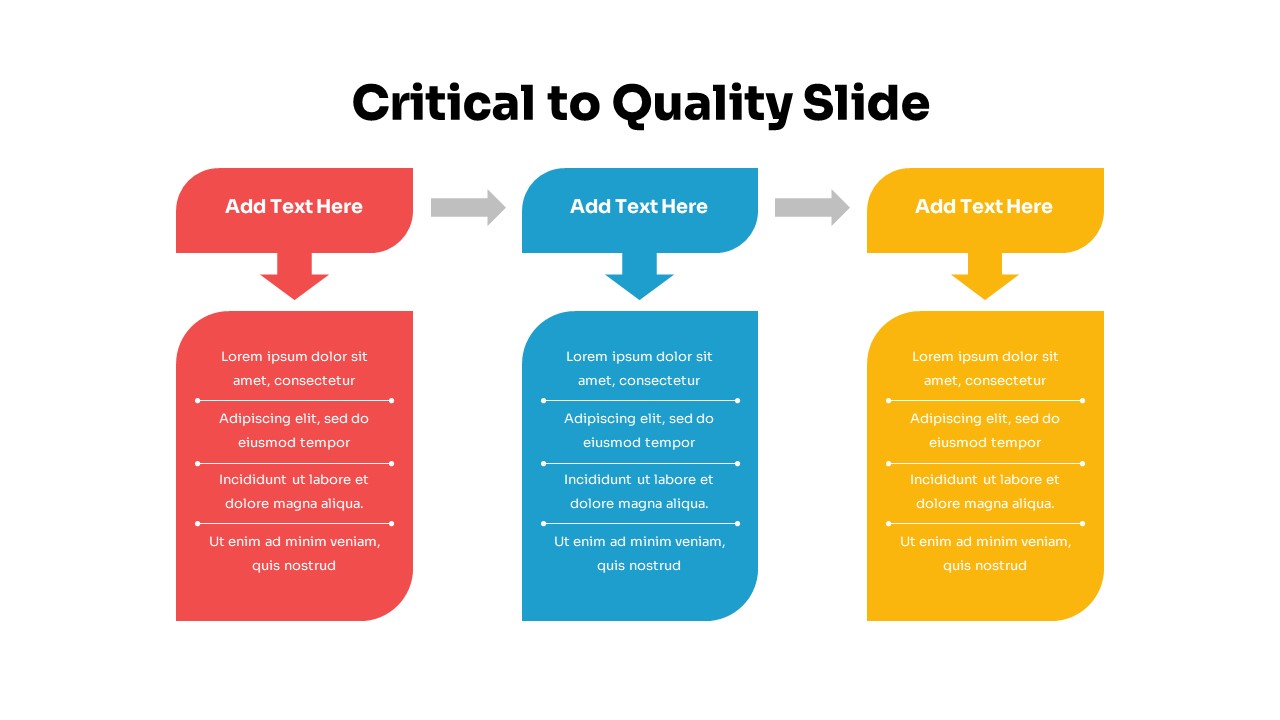
Three-Step Critical to Quality Slides Template for PowerPoint & Google Slides
Process
Dual-Side Three-Step Ribbon Infographic Template for PowerPoint & Google Slides
Comparison
Circular Three-Step Infographic Diagram Template for PowerPoint & Google Slides
Circular

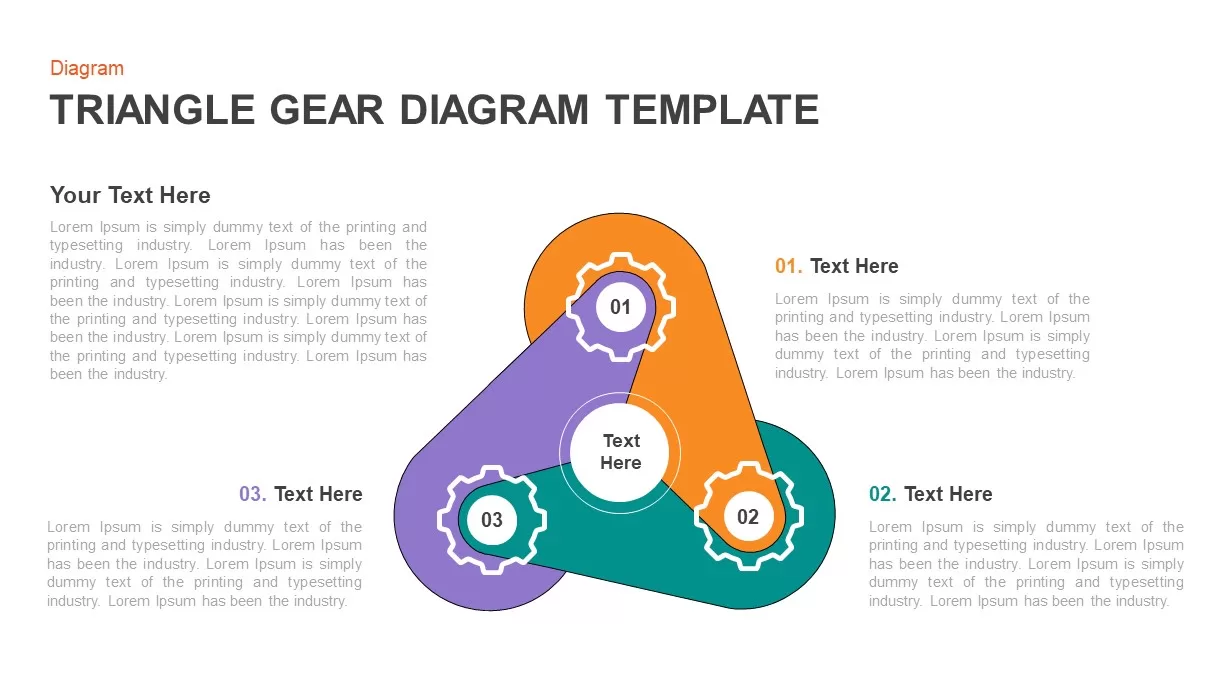
Three-Step Triangular Gear Diagram Template for PowerPoint & Google Slides
Process
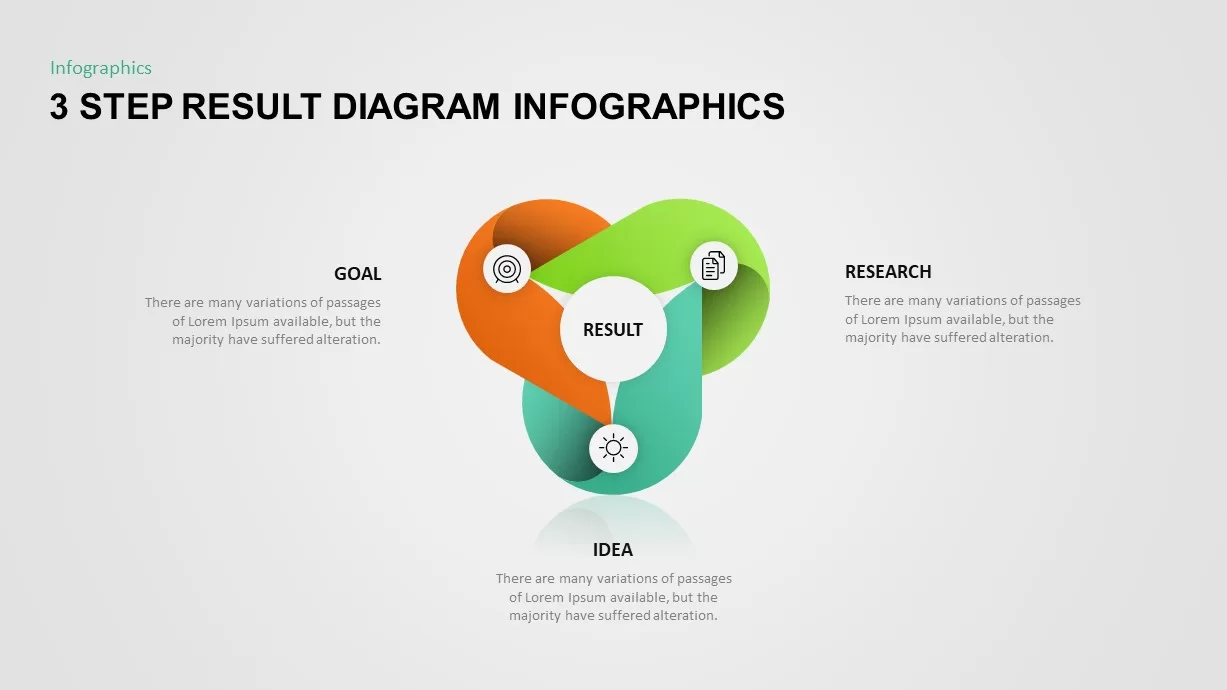
Three-Step Result Diagram Infographic Template for PowerPoint & Google Slides
Process
Three-Step Wavy Arrow Flow Template for PowerPoint & Google Slides
Process
Three-Step Circular Arrows Diagram Template for PowerPoint & Google Slides
Process
Three-Step Hub and Spoke Diagram Template for PowerPoint & Google Slides
Circular
Three-Step Gears Brain Diagram Template for PowerPoint & Google Slides
Process
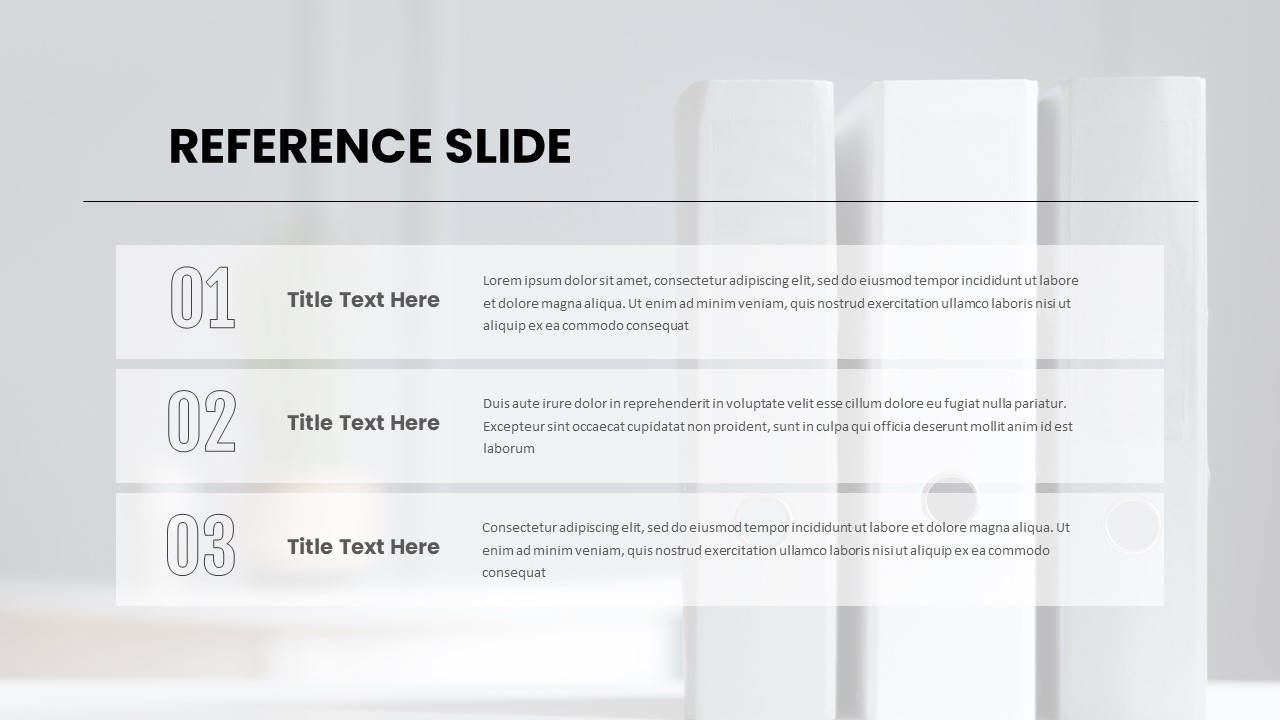
Three-Step Reference Slide Layout Template for PowerPoint & Google Slides
Infographics
Clean Three-Step Reference Slide Template for PowerPoint & Google Slides
Agenda
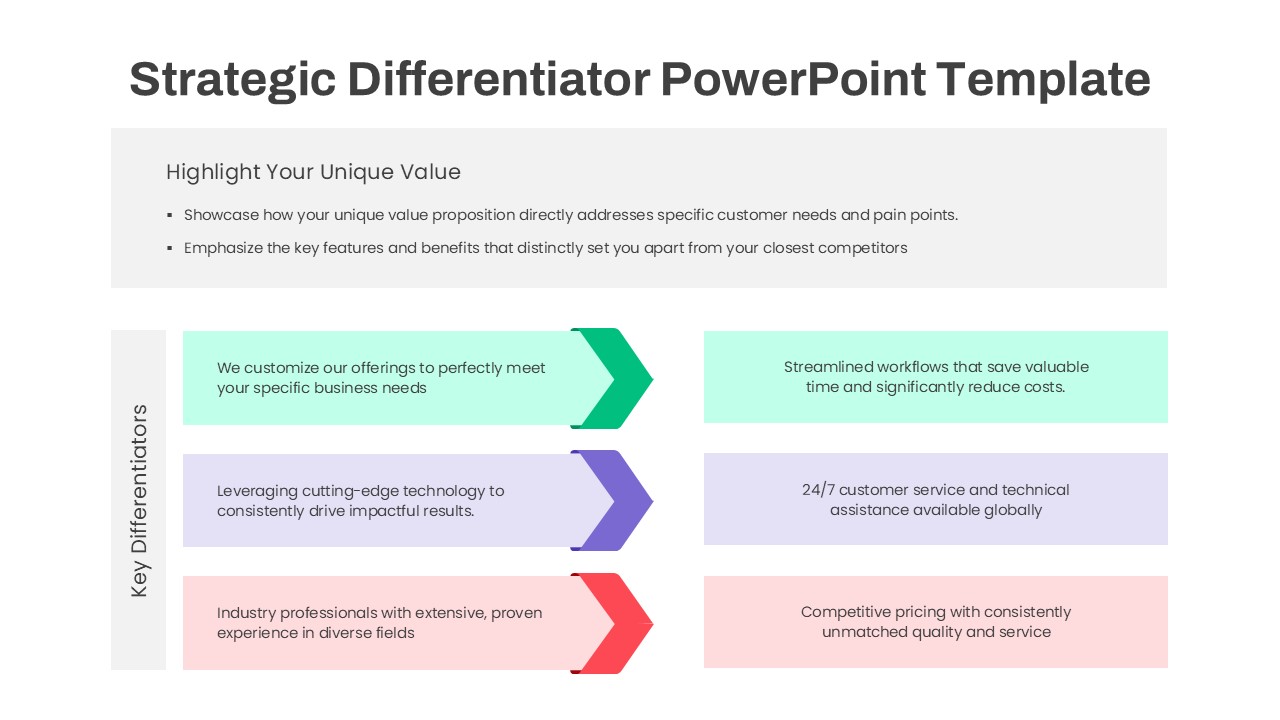
Three-Step Strategic Differentiator Template for PowerPoint & Google Slides
Competitor Analysis
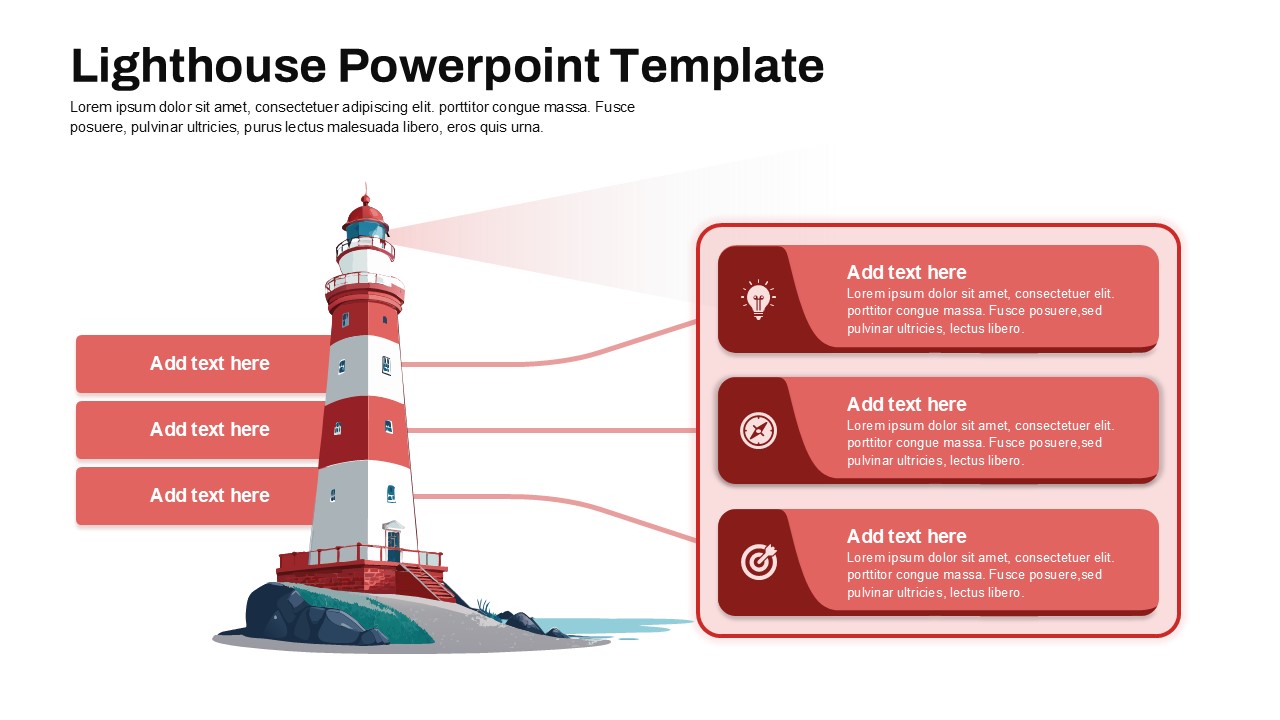
Lighthouse Three-Step Guidance Diagram Template for PowerPoint & Google Slides
Process
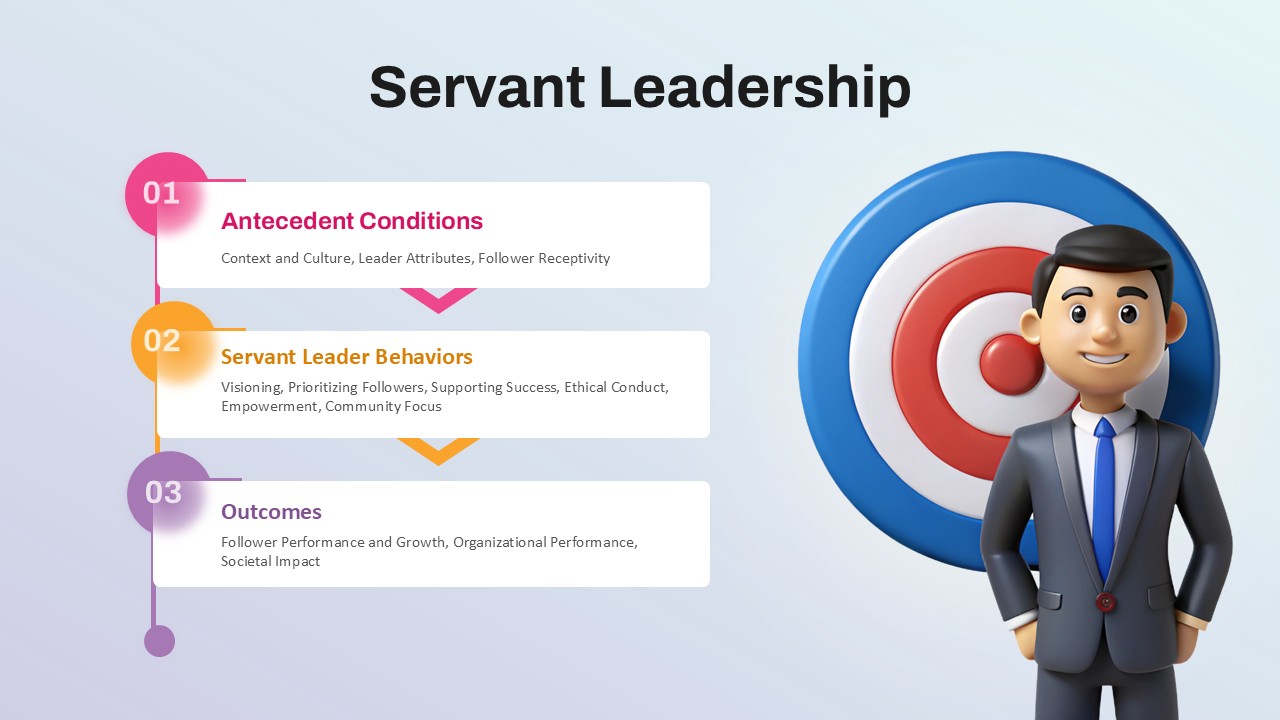
Three-Step Servant Leadership Framework Template for PowerPoint & Google Slides
Leadership
QR Code Scan Me Three-Step Slide Template for PowerPoint & Google Slides
Infographics
Three-Section Fishbone Process Diagram template for PowerPoint & Google Slides
Process
Three Circle Arrow Process Diagram template for PowerPoint & Google Slides
Circular

Three Stage 3D Arrow Process Diagram Template for PowerPoint & Google Slides
Process

Three-Stage Ring Process Diagram Template for PowerPoint & Google Slides
Circular
Engaging Three-Stage Process Diagram Template for PowerPoint & Google Slides
Process

Three-Circle Process Infographic Template for PowerPoint & Google Slides
Circular
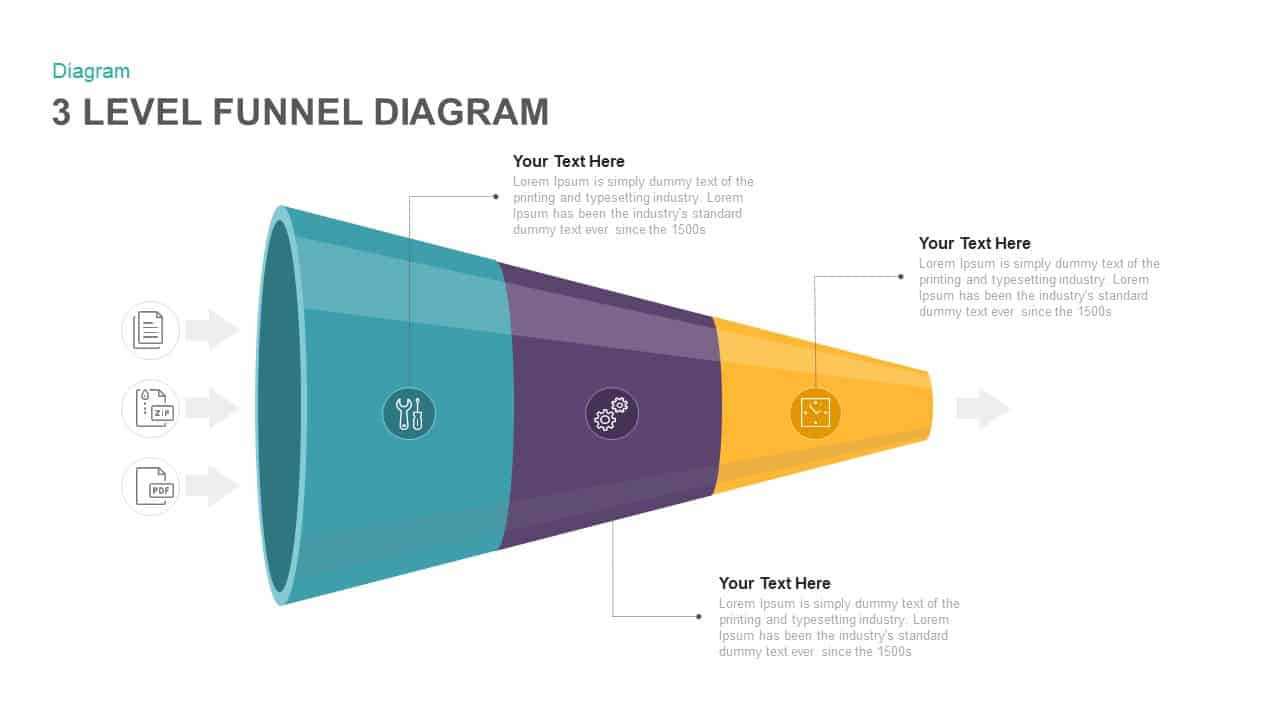
Three Level Funnel Process Diagram Template for PowerPoint & Google Slides
Funnel
Three-Way Decision Process Arrow Diagram Template for PowerPoint & Google Slides
Arrow
Three-Stage Loop Process Diagram Template for PowerPoint & Google Slides
Process
Modern Three-Point Process Diagram Template for PowerPoint & Google Slides
Process
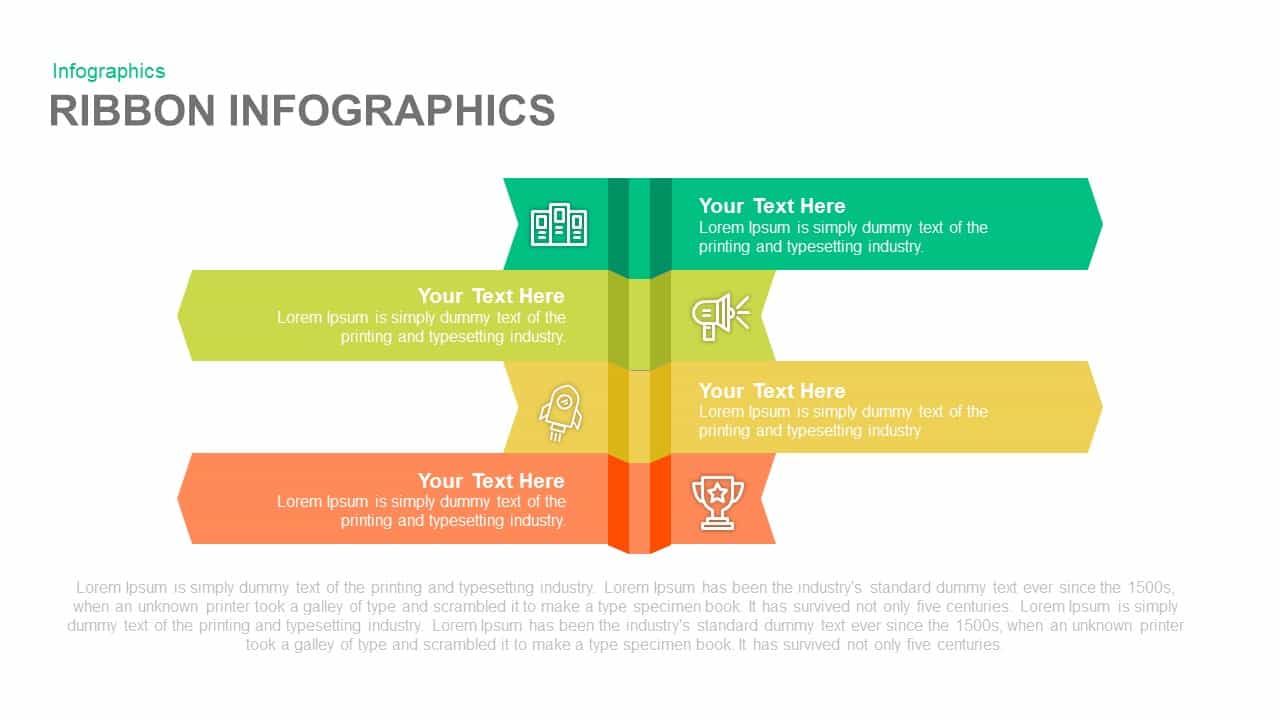
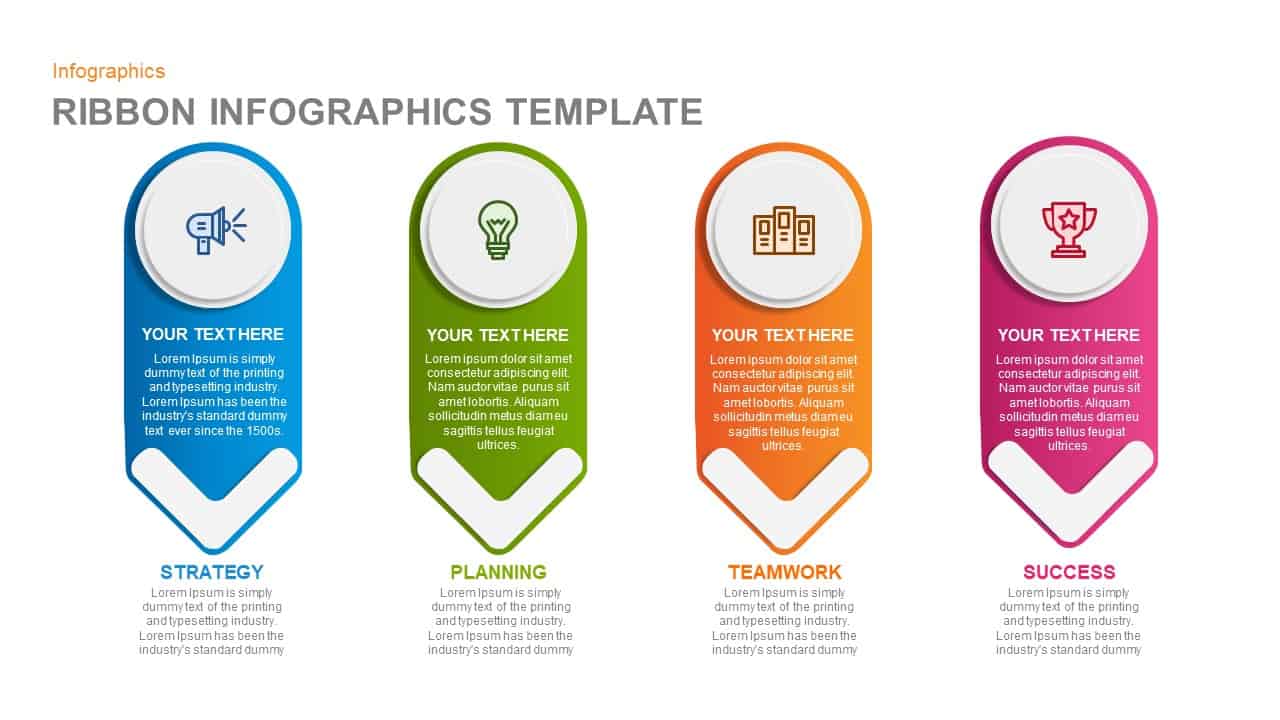
Ribbon Infographics Step-by-Step Process Template for PowerPoint & Google Slides
Process
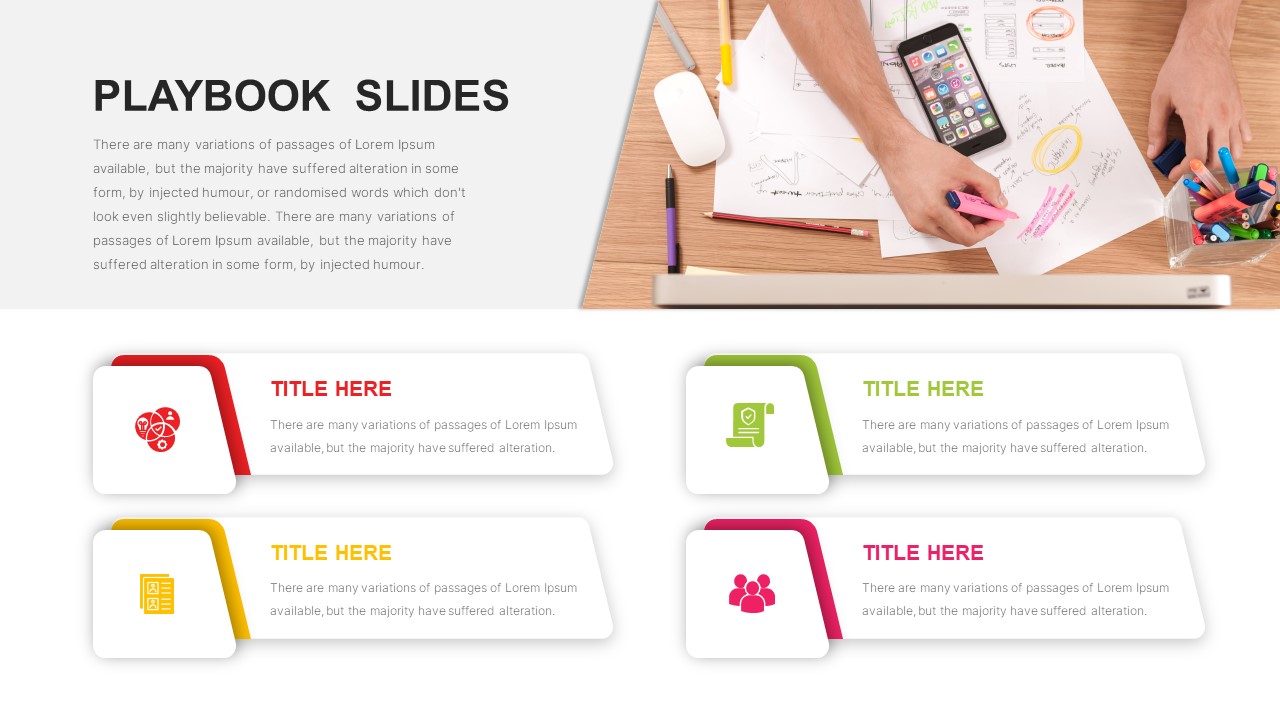
Sales Playbook Step-by-Step Process Template for PowerPoint & Google Slides
Process
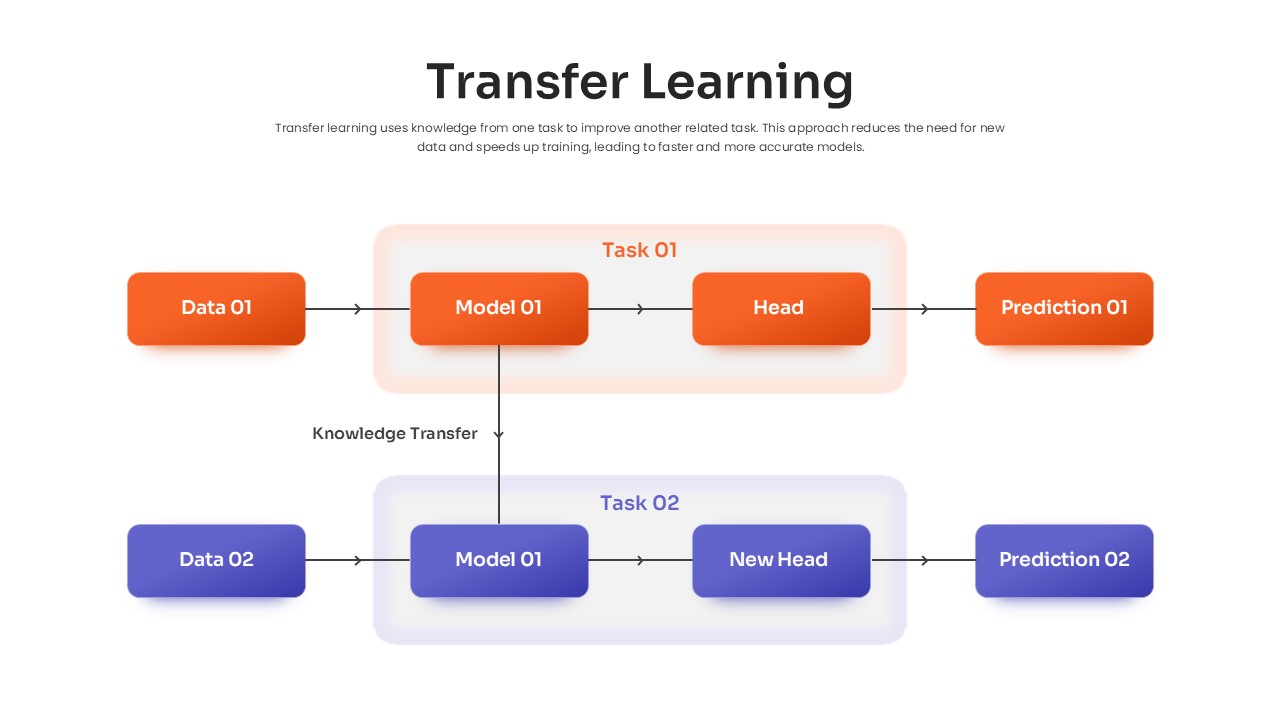
Transfer Learning Process template for PowerPoint & Google Slides
Technology
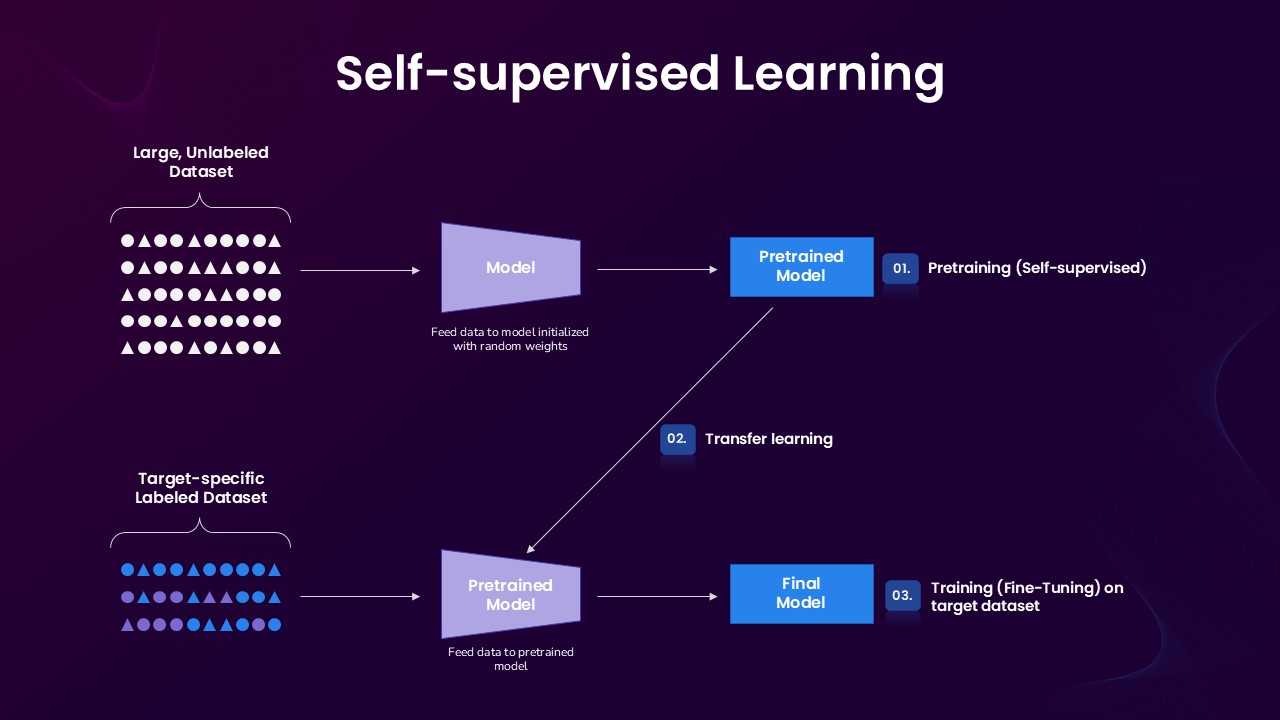
Self-supervised Learning Process template for PowerPoint & Google Slides
Technology
Q-Learning Process Flow Diagram Template for PowerPoint & Google Slides
Process
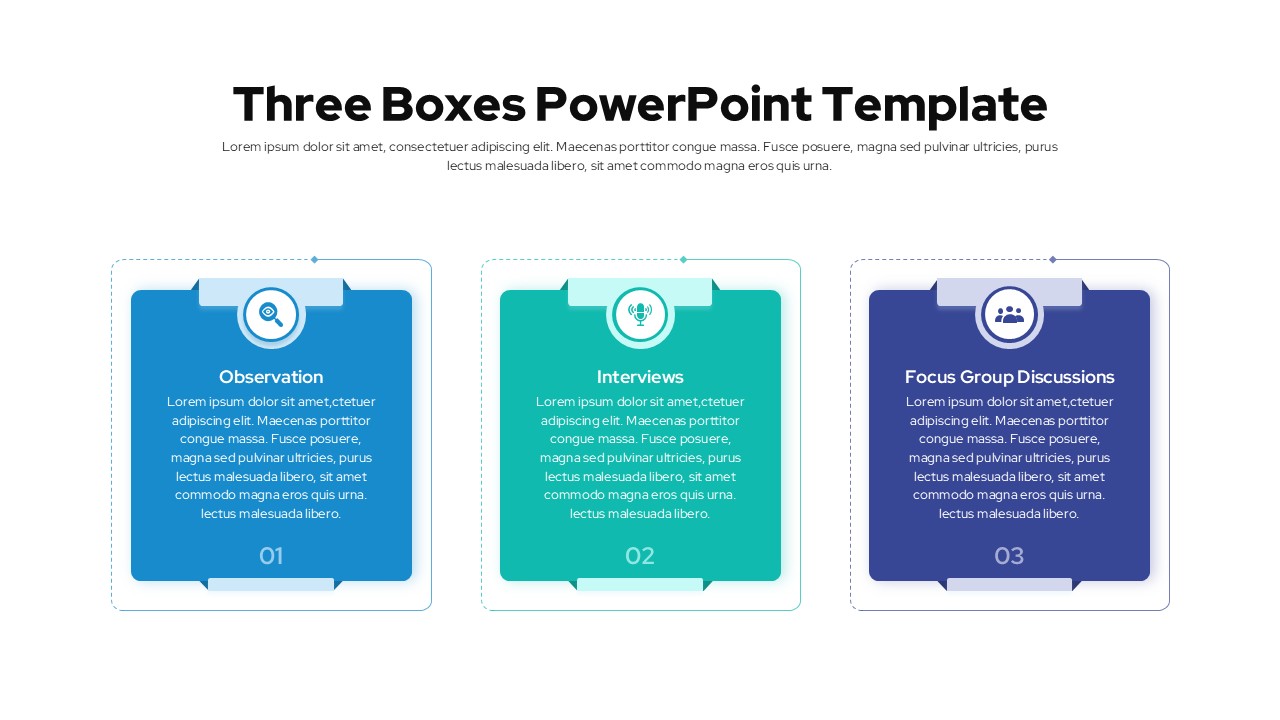
Three Boxes PowerPoint Template for PowerPoint & Google Slides
Business Report
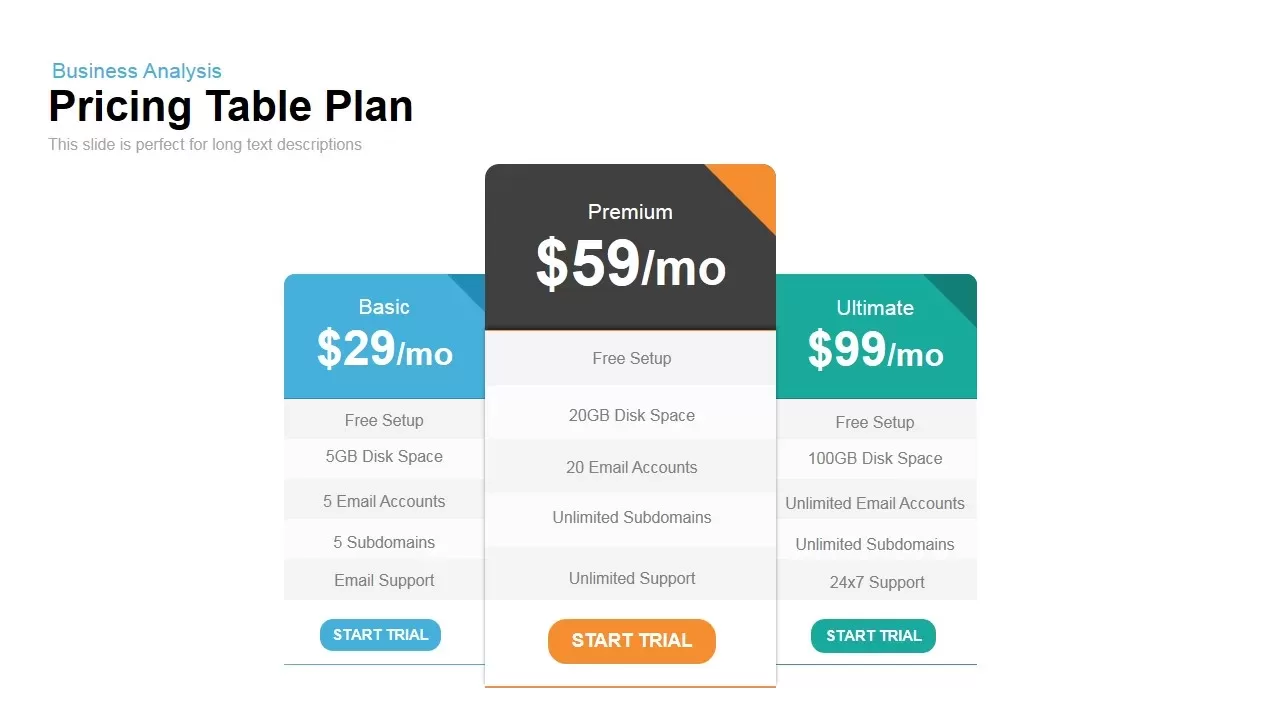
Three-Tier Pricing Table Slide Template for PowerPoint & Google Slides
Comparison
Three-Year Bar Chart template for PowerPoint & Google Slides
Charts
Three Four Five Stage Timeline Infographic Template for PowerPoint & Google Slides
Timeline

Three Subscription Pricing Plans Template for PowerPoint & Google Slides
Comparison
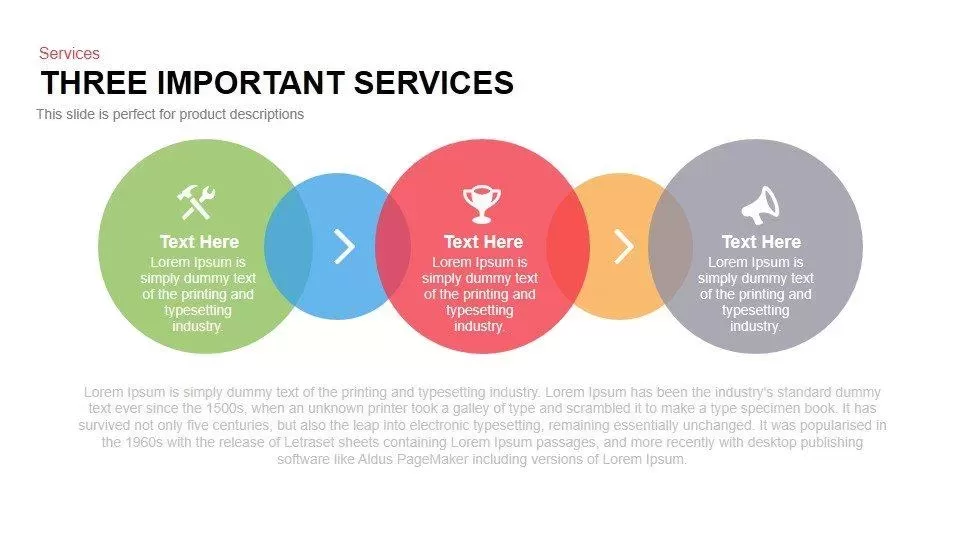
Three Important Services Flow Diagram Template for PowerPoint & Google Slides
Process
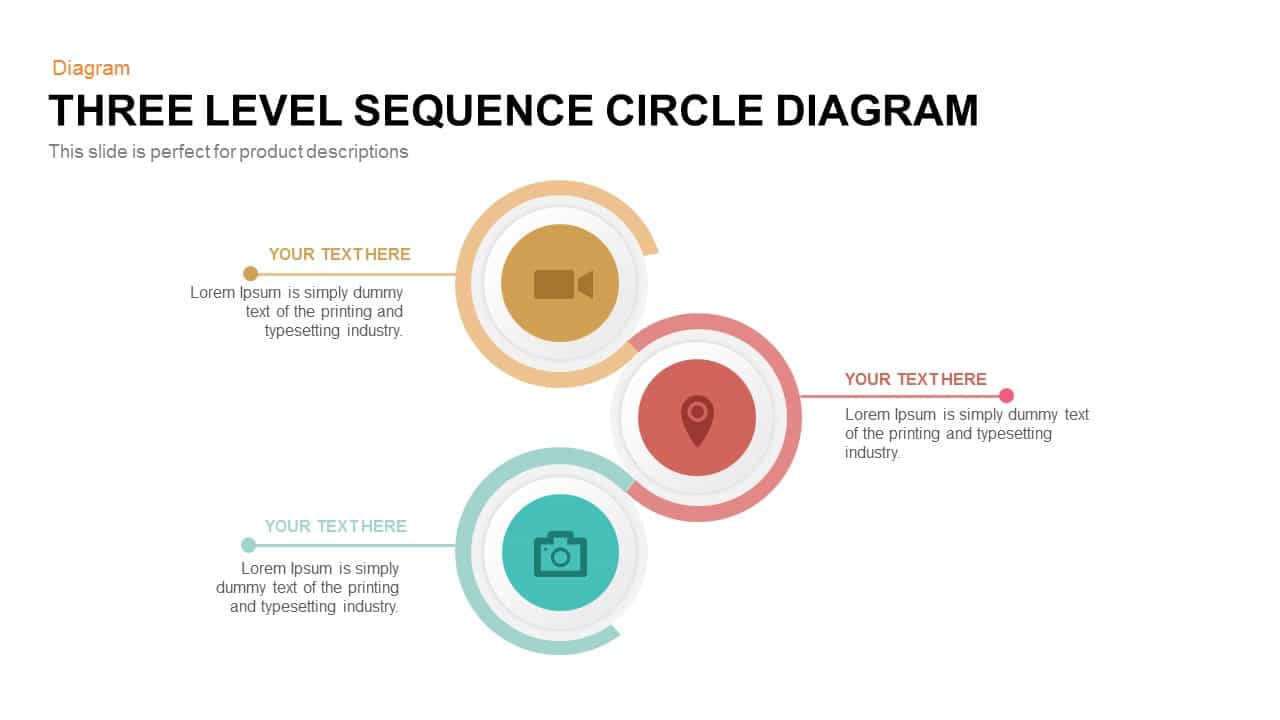
Three-Level Sequence Circle Diagram Template for PowerPoint & Google Slides
Circular
Three-Circle Diagram Infographic Template for PowerPoint & Google Slides
Circular
Three-Stage Circular Options Chart Template for PowerPoint & Google Slides
Comparison
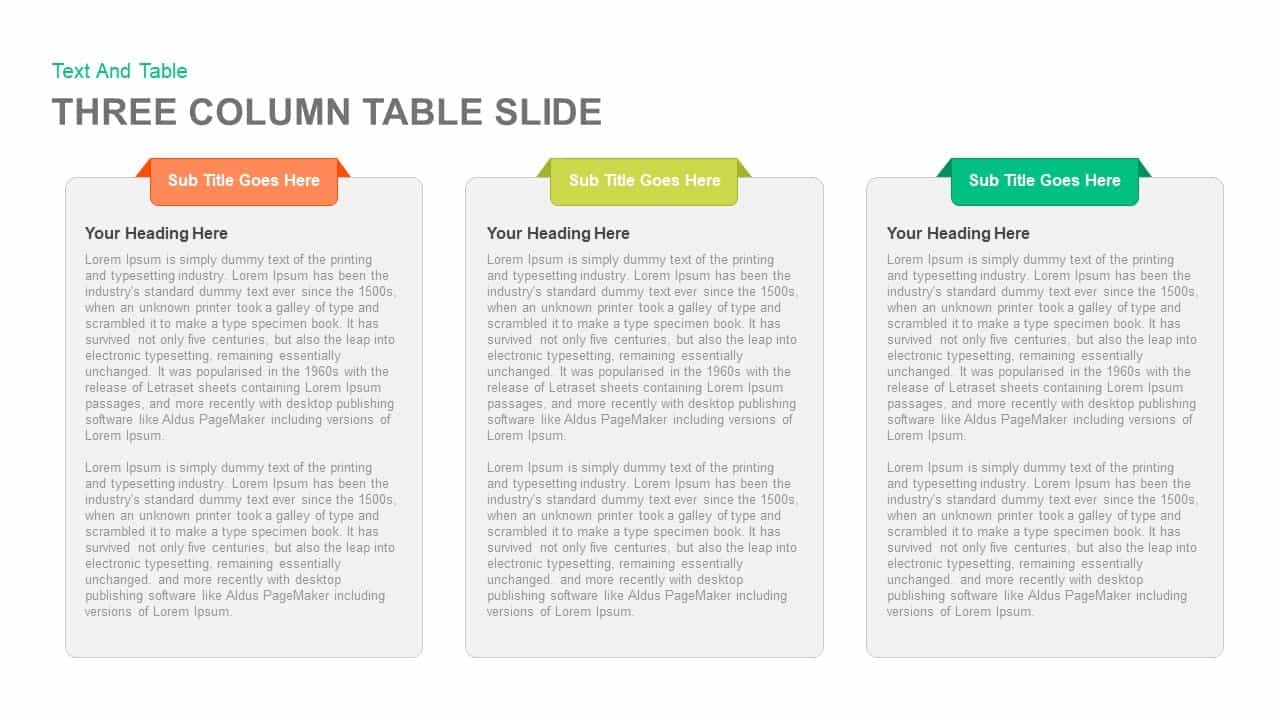
Clean Three-Four Column Table Slide Template for PowerPoint & Google Slides
Business Report
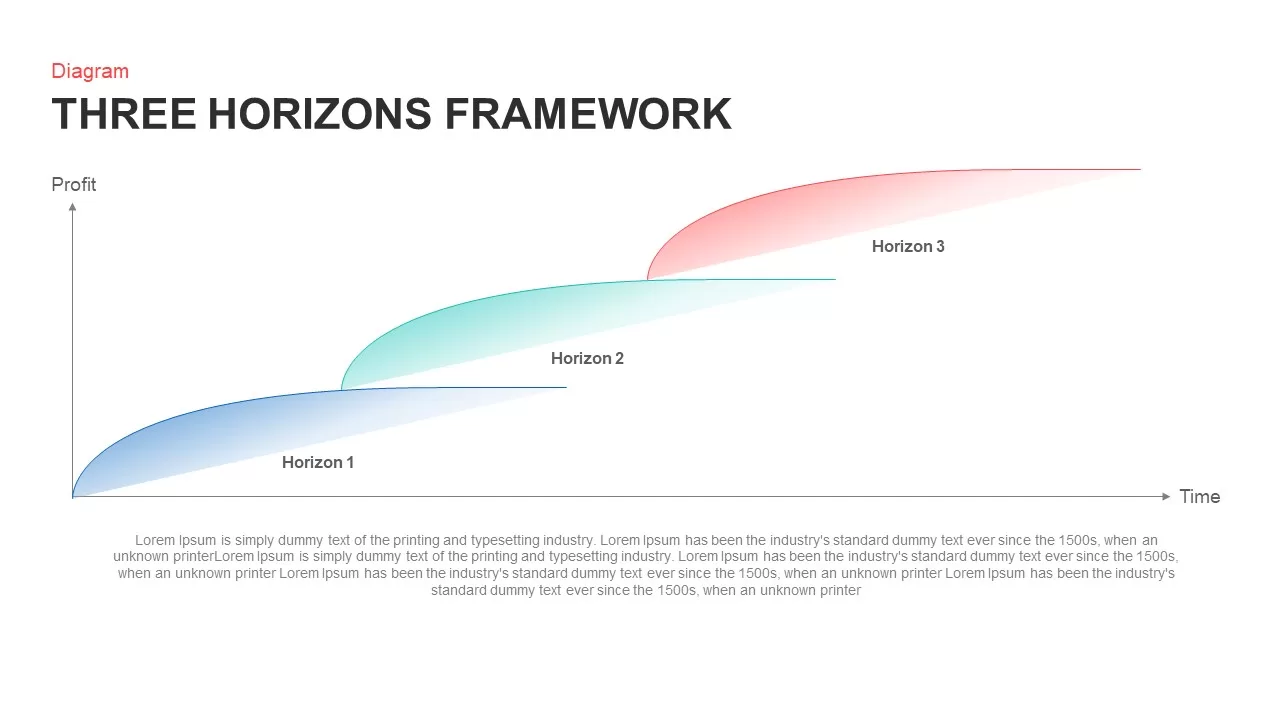
Strategic Three Horizons Framework Template for PowerPoint & Google Slides
Business Strategy
Three to Six Staged Circular Diagram Template for PowerPoint & Google Slides
Process
Three and Four-Column Card Layout Template for PowerPoint & Google Slides
Infographics
Three-Branch Cluster Diagram Presentation Template for PowerPoint & Google Slides
Mind Maps
Creative Three-Circle Venn Diagram Template for PowerPoint & Google Slides
Comparison
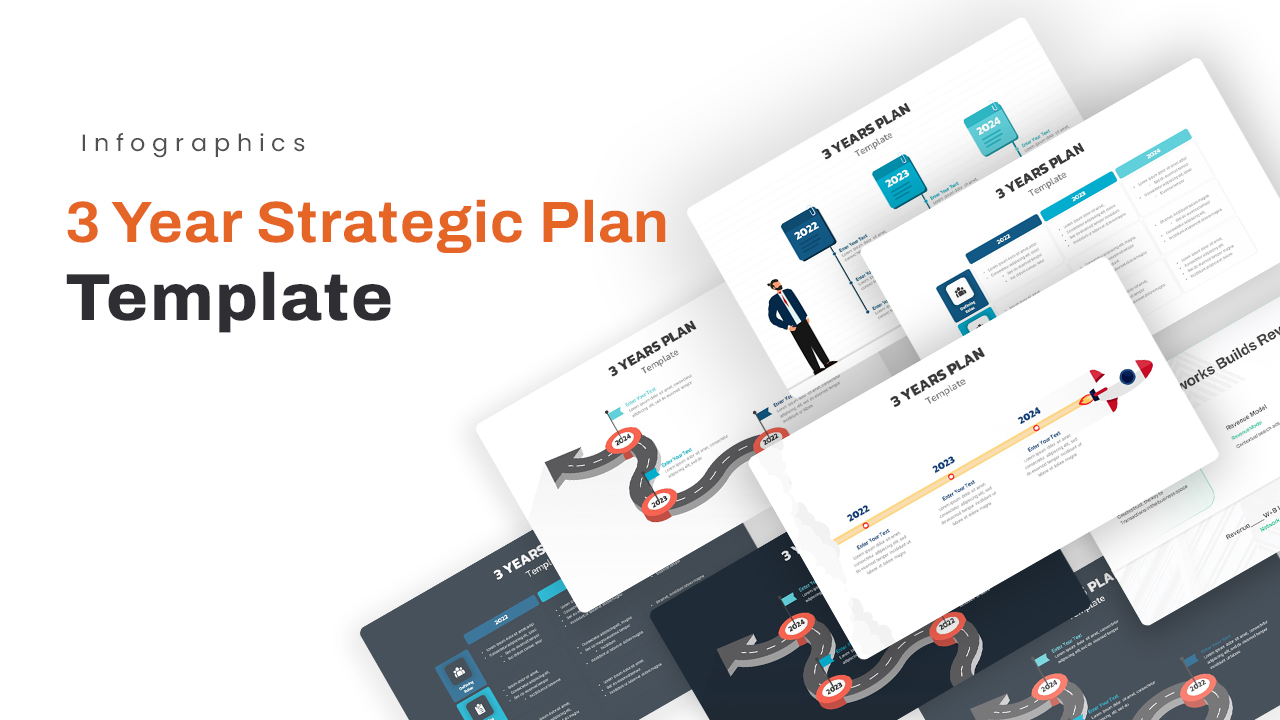
Three-Year Strategic Plan Matrix Template for PowerPoint & Google Slides
Timeline
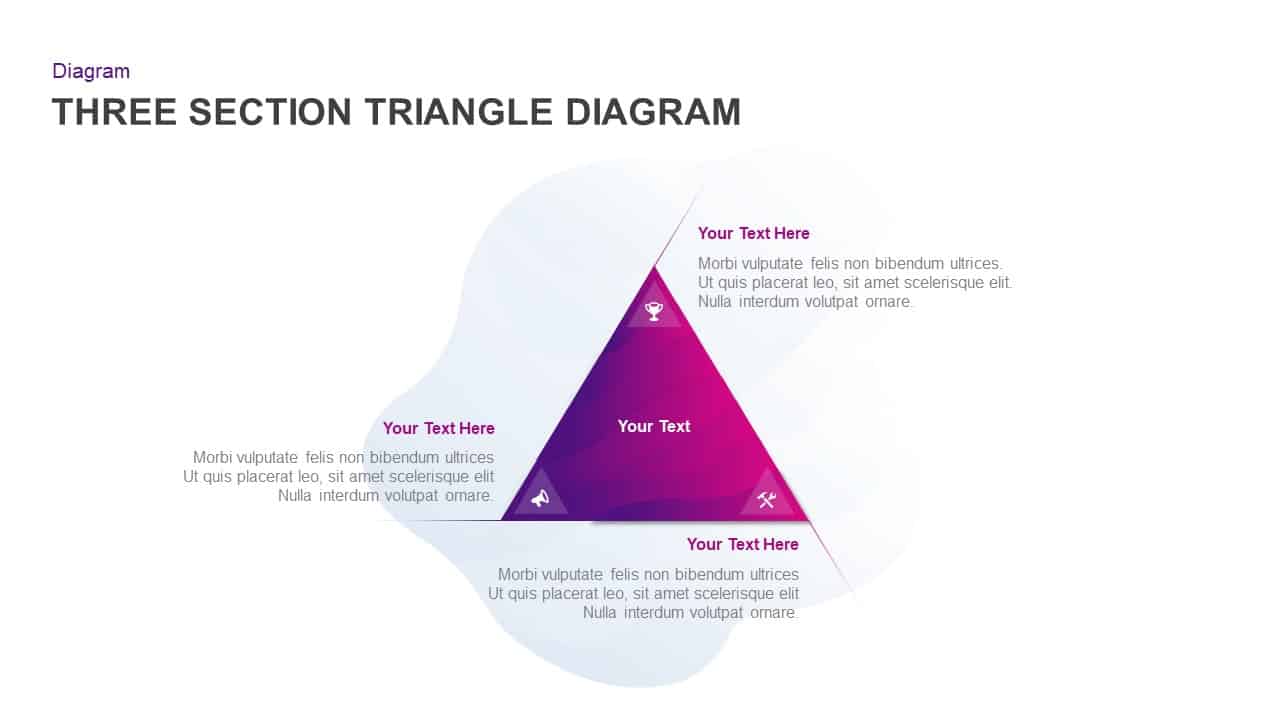
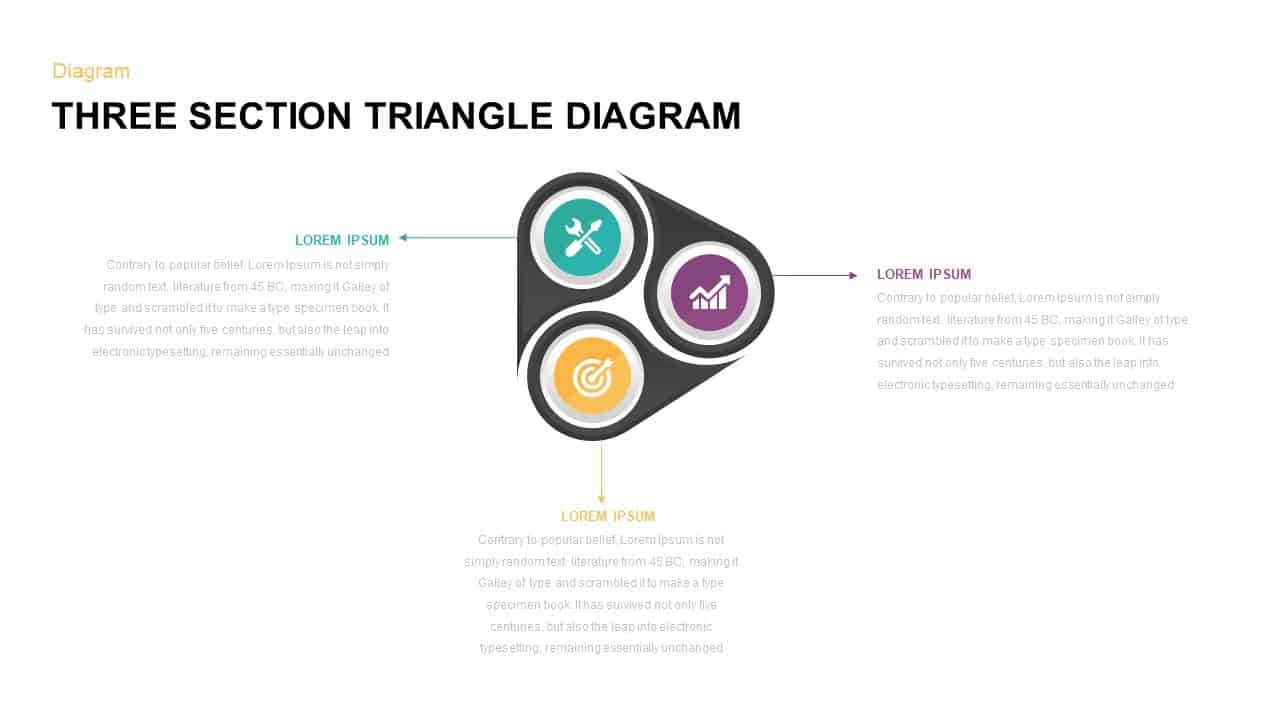
Three-Section Triangle Diagram Template for PowerPoint & Google Slides
Pyramid
Three Section Triangle Diagram Template for PowerPoint & Google Slides
Process
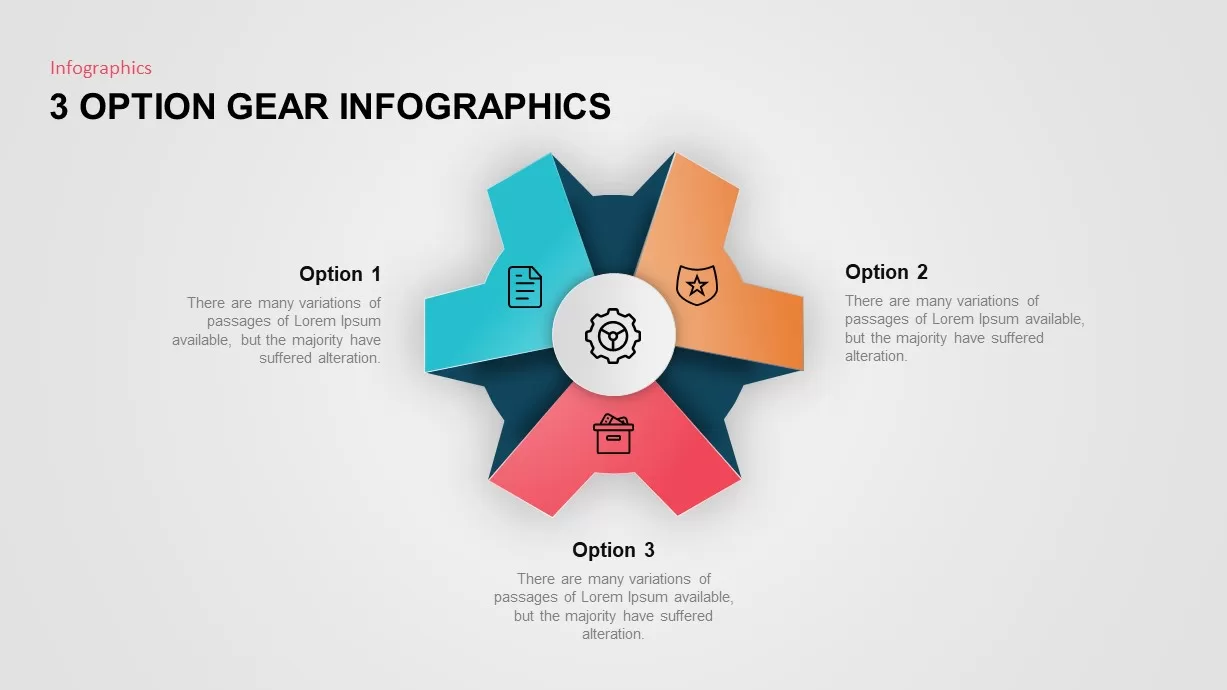
Three-Option Gear Infographic Pro Template for PowerPoint & Google Slides
Process
Three-Phase Planning Gear Infographic Template for PowerPoint & Google Slides
Process
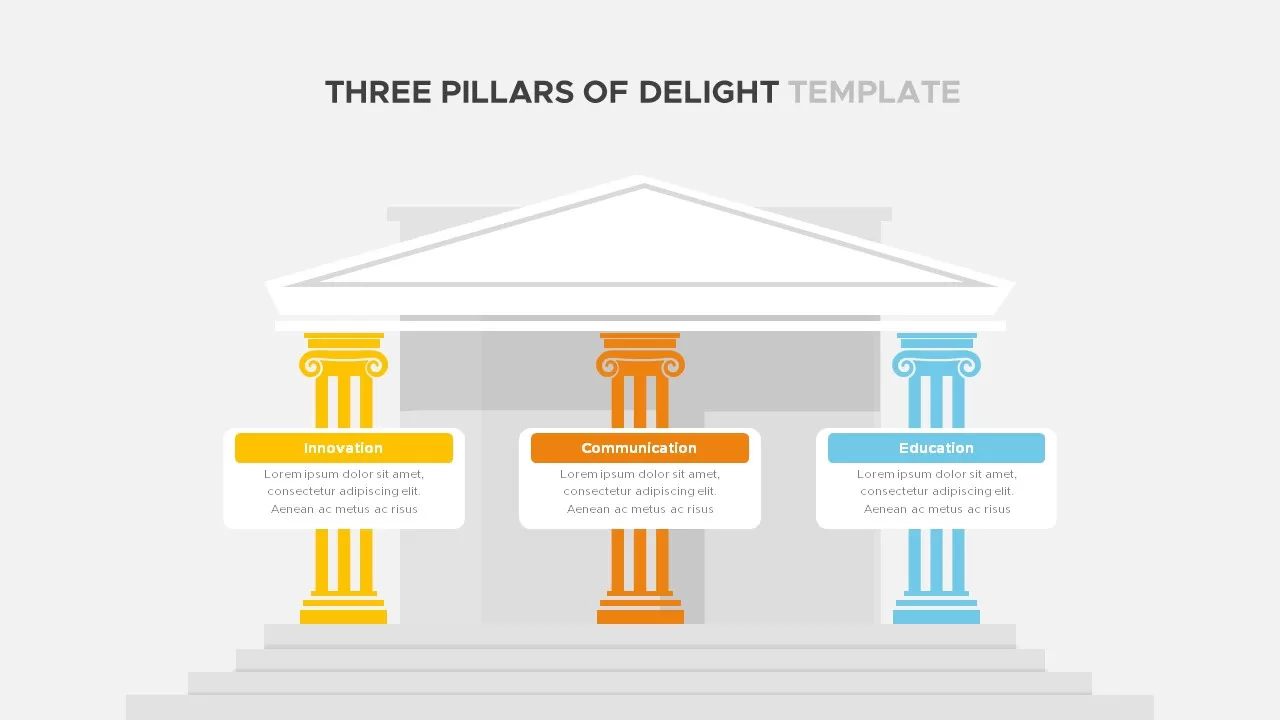
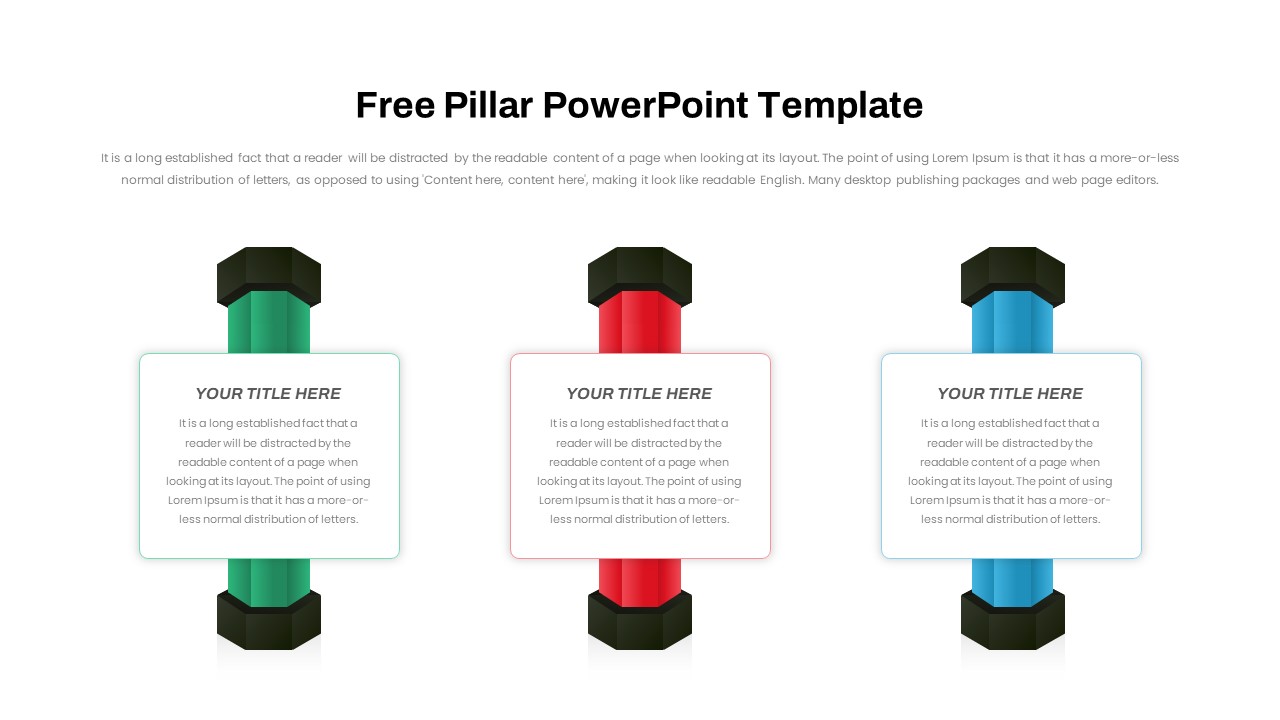
Three Pillars of Delight Template for PowerPoint & Google Slides
Business
Three-Year Plan Infographic Pack Template for PowerPoint & Google Slides
Timeline
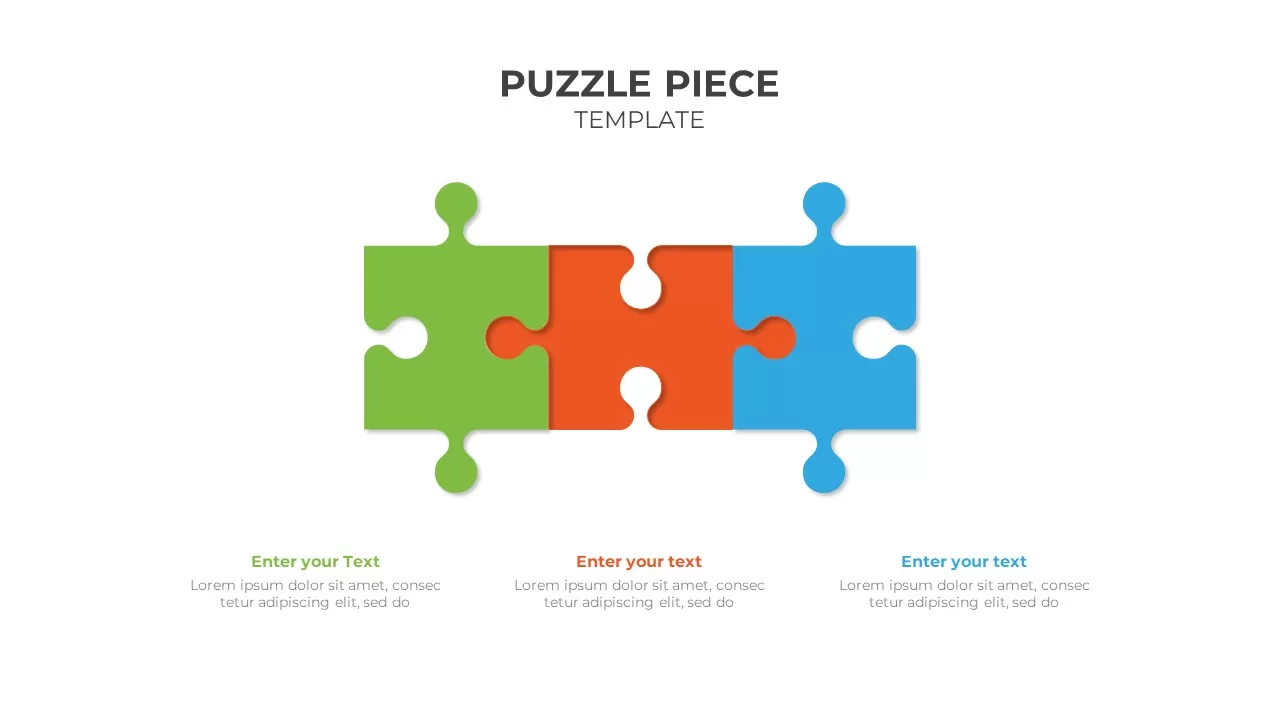
Three-Part Puzzle Piece Diagram Template for PowerPoint & Google Slides
Process
Three-Segment Circular Arrow Cycle Template for PowerPoint & Google Slides
Circular
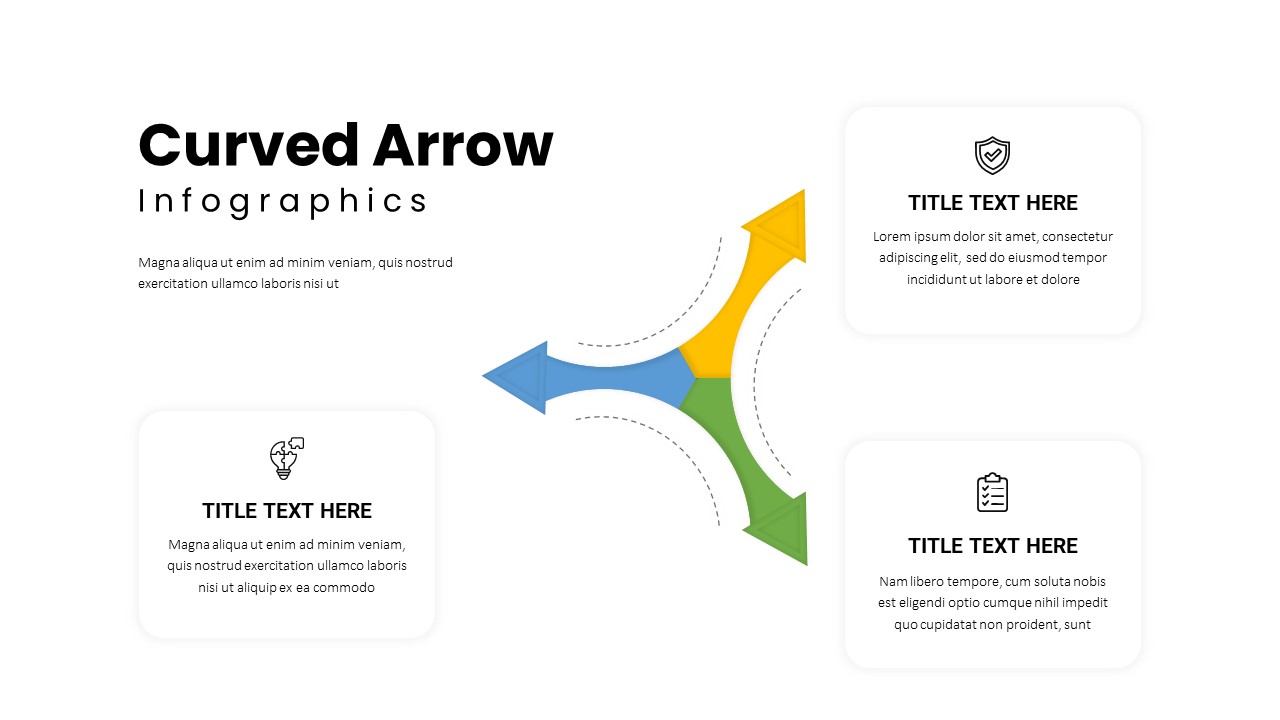
Three-Path Curved Arrow Infographic Template for PowerPoint & Google Slides
Arrow
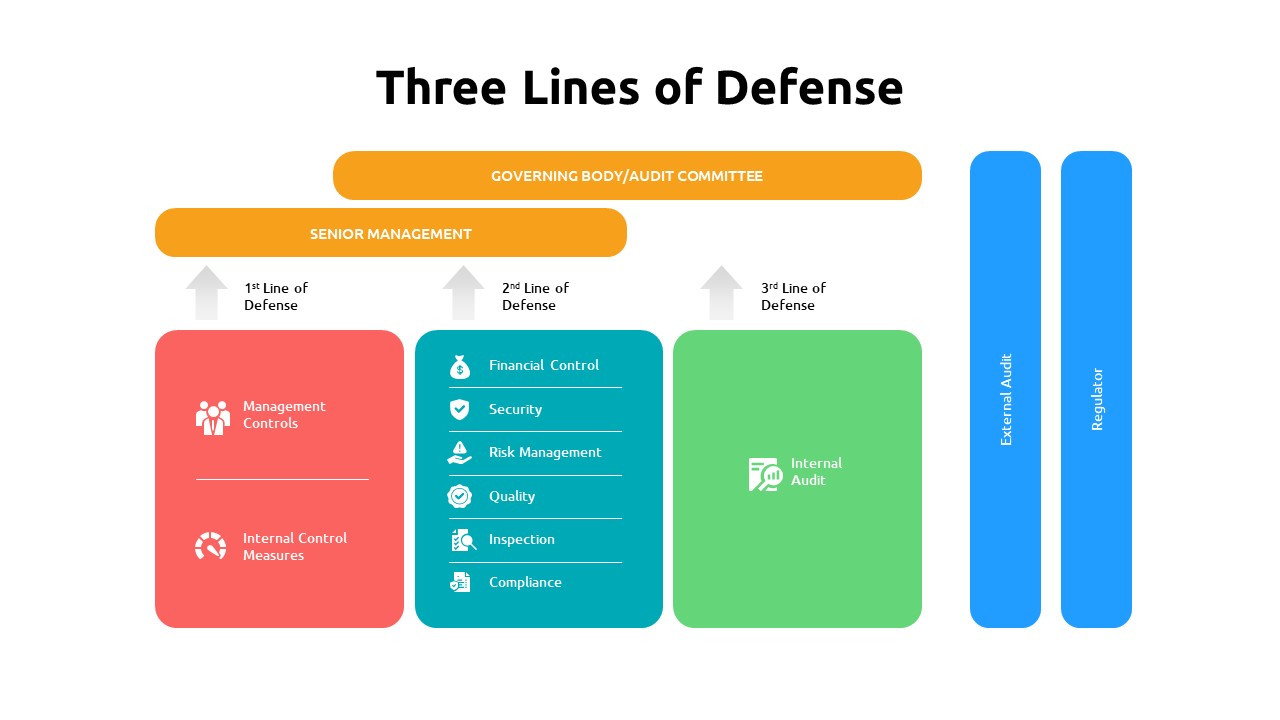
Three lines of defense template for PowerPoint & Google Slides
Risk Management
Three-Stage S Curve Growth Diagram Template for PowerPoint & Google Slides
Process
Five-Phase and Three-Phase Phases Chart Template for PowerPoint & Google Slides
Charts
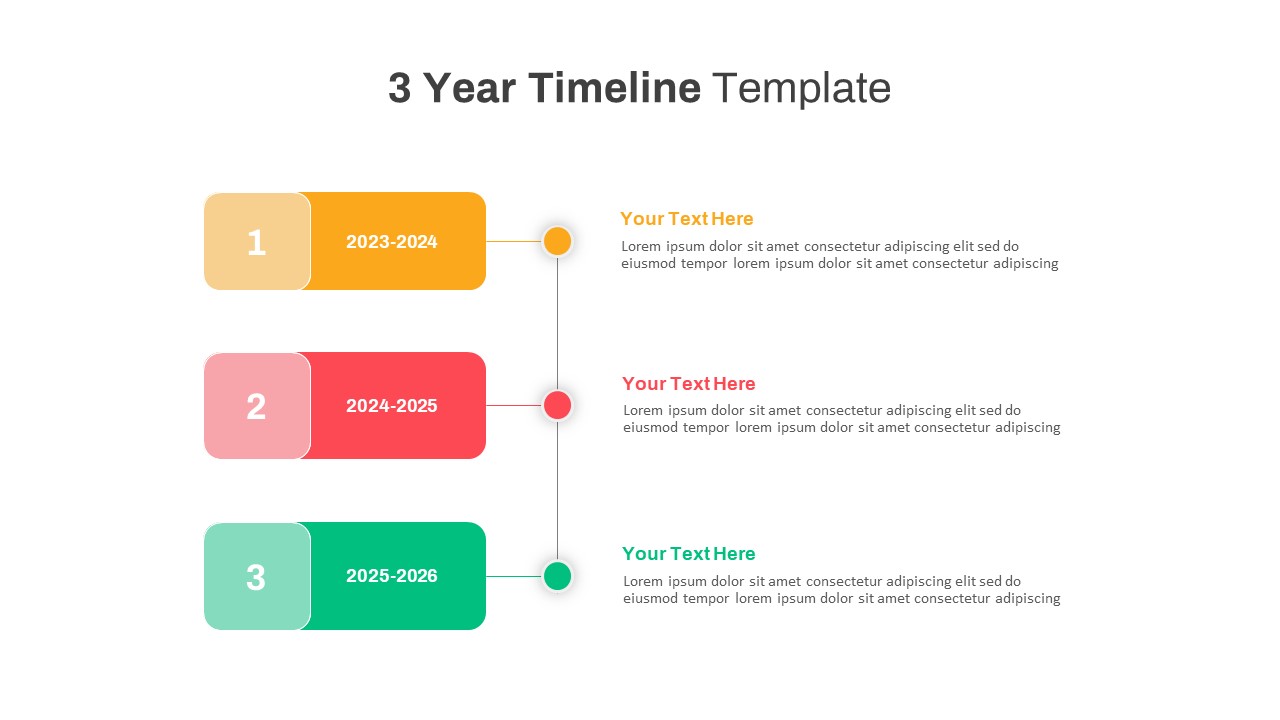
Three-Year Vertical Milestone Timeline Template for PowerPoint & Google Slides
Timeline
Dynamic Three-Series Stacked Area Chart Template for PowerPoint & Google Slides
Comparison Chart
Free Three and Four Pillar Infographic Pack Template for PowerPoint & Google Slides
Process
Free
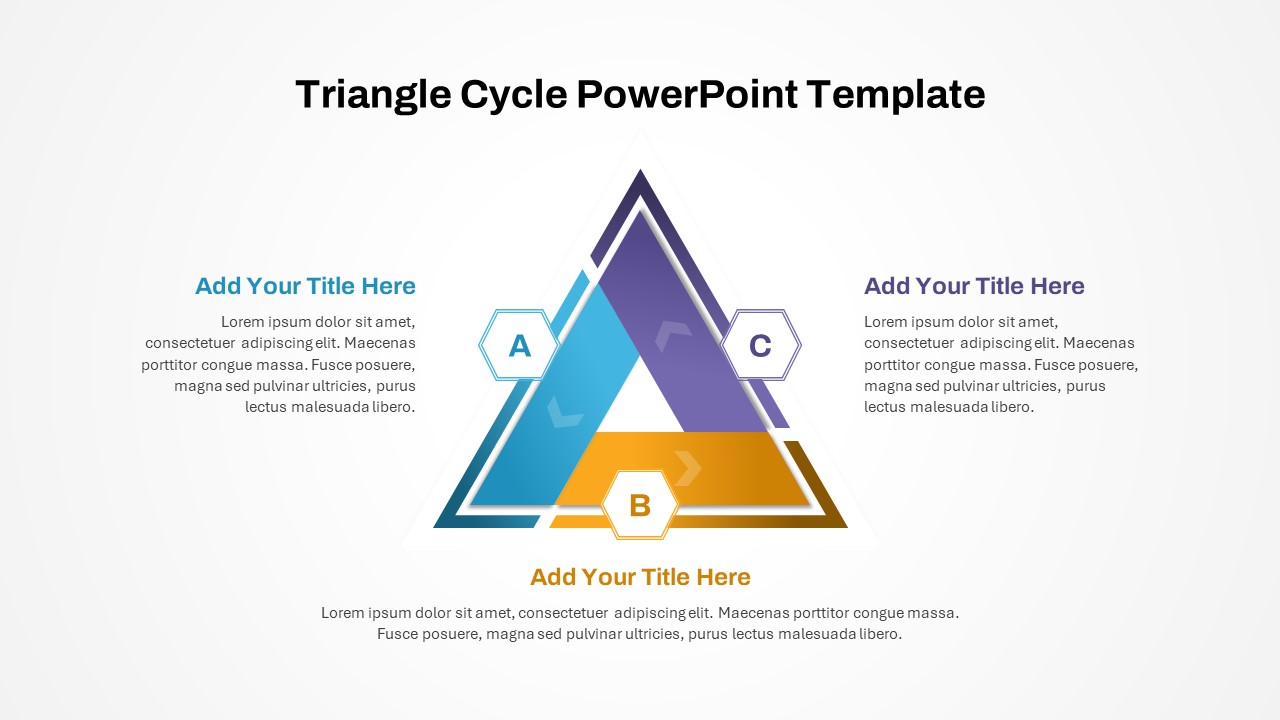
Three-Phase Triangle Cycle Diagram Template for PowerPoint & Google Slides
Infographics
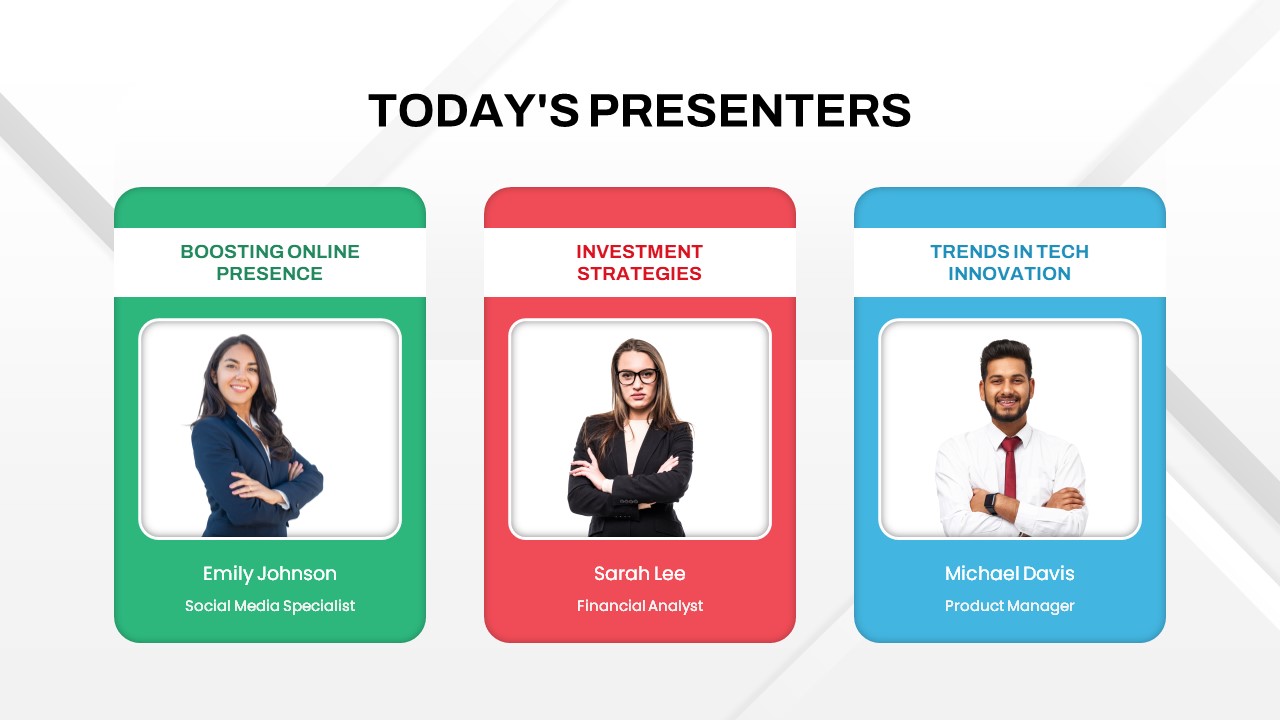
Colorful Three-Presenter Profile Cards Template for PowerPoint & Google Slides
Our Team
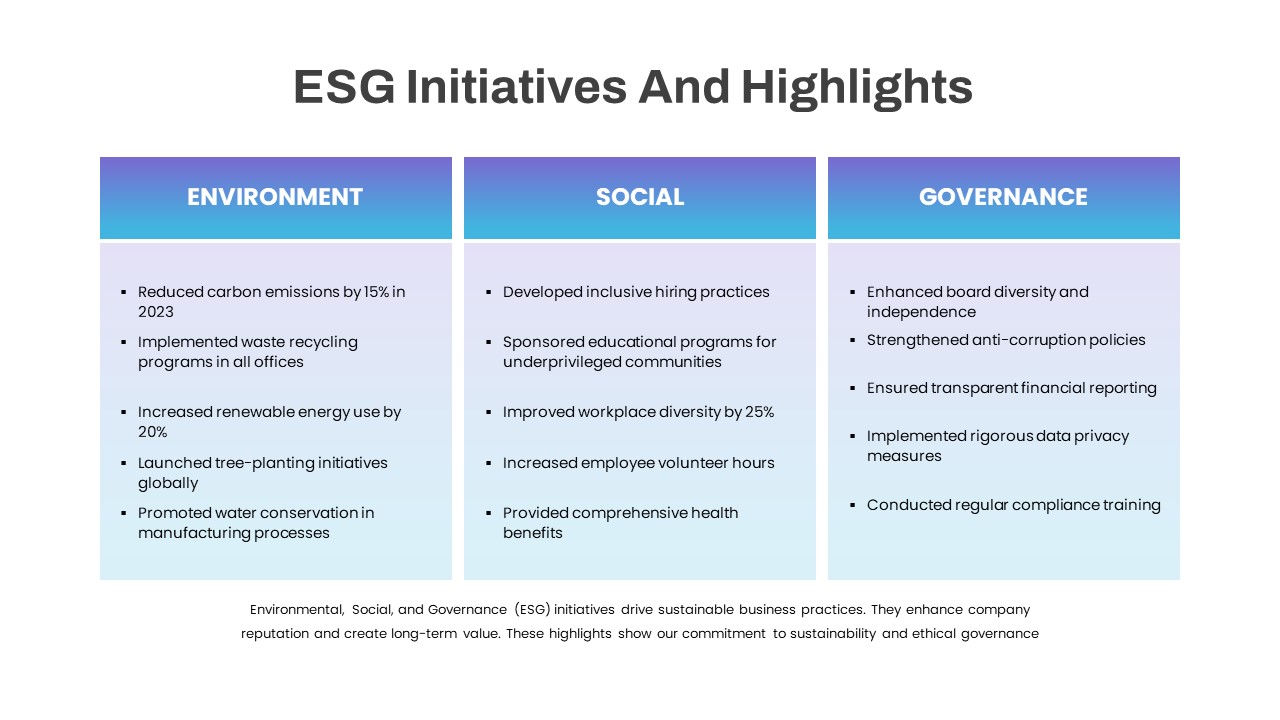
ESG Initiatives Three-Column Template for PowerPoint & Google Slides
Comparison
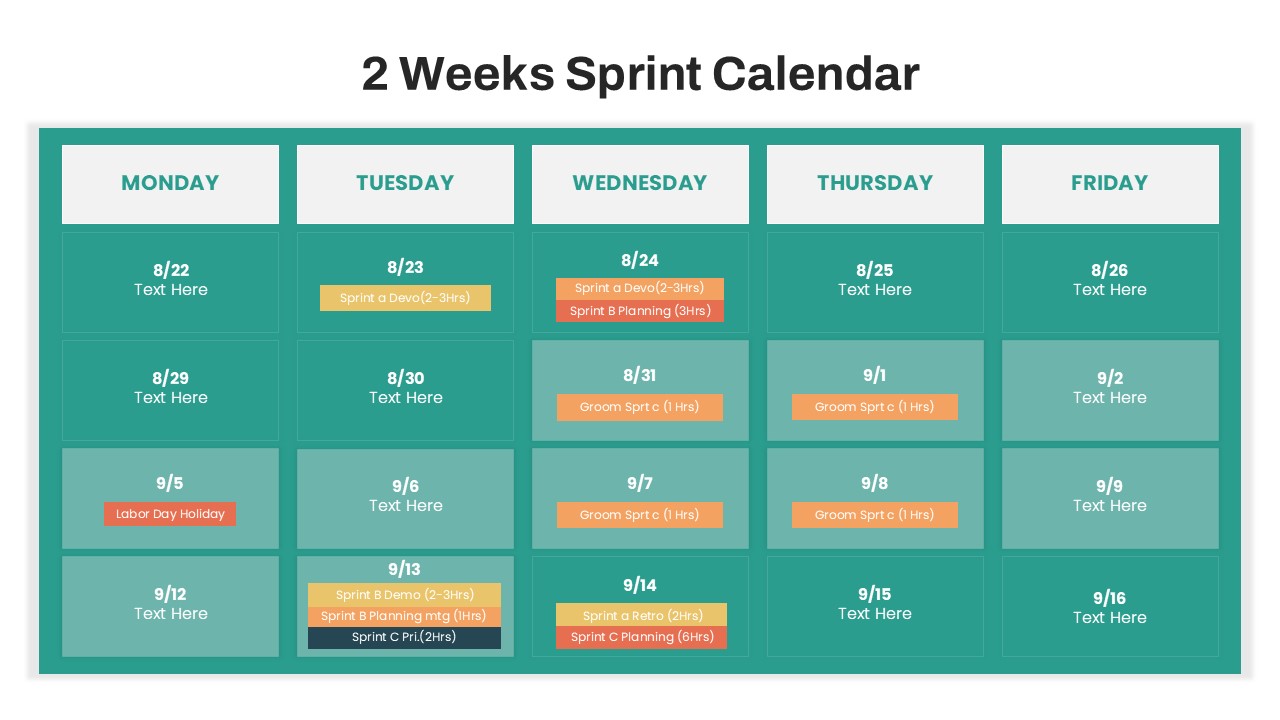
Two- and Three-Week Sprint Calendar Template for PowerPoint & Google Slides
Scrum
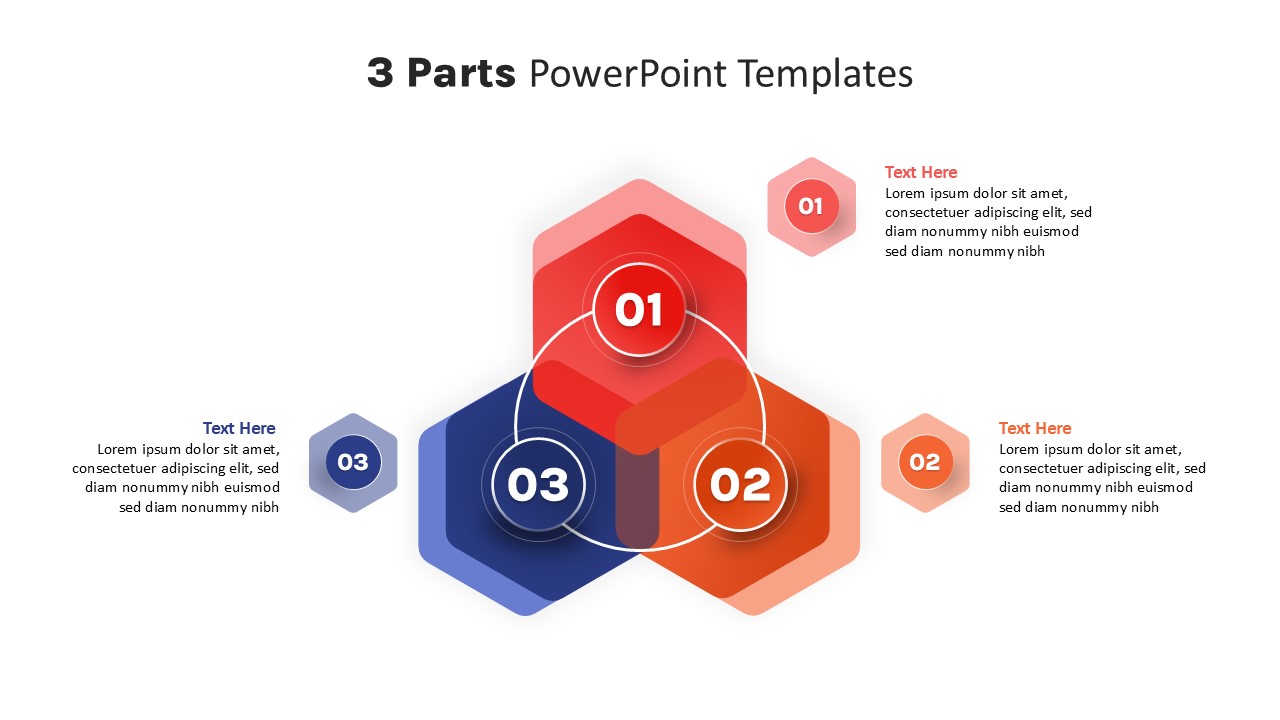
Three-Part Parts Infographic Diagram Template for PowerPoint & Google Slides
Process
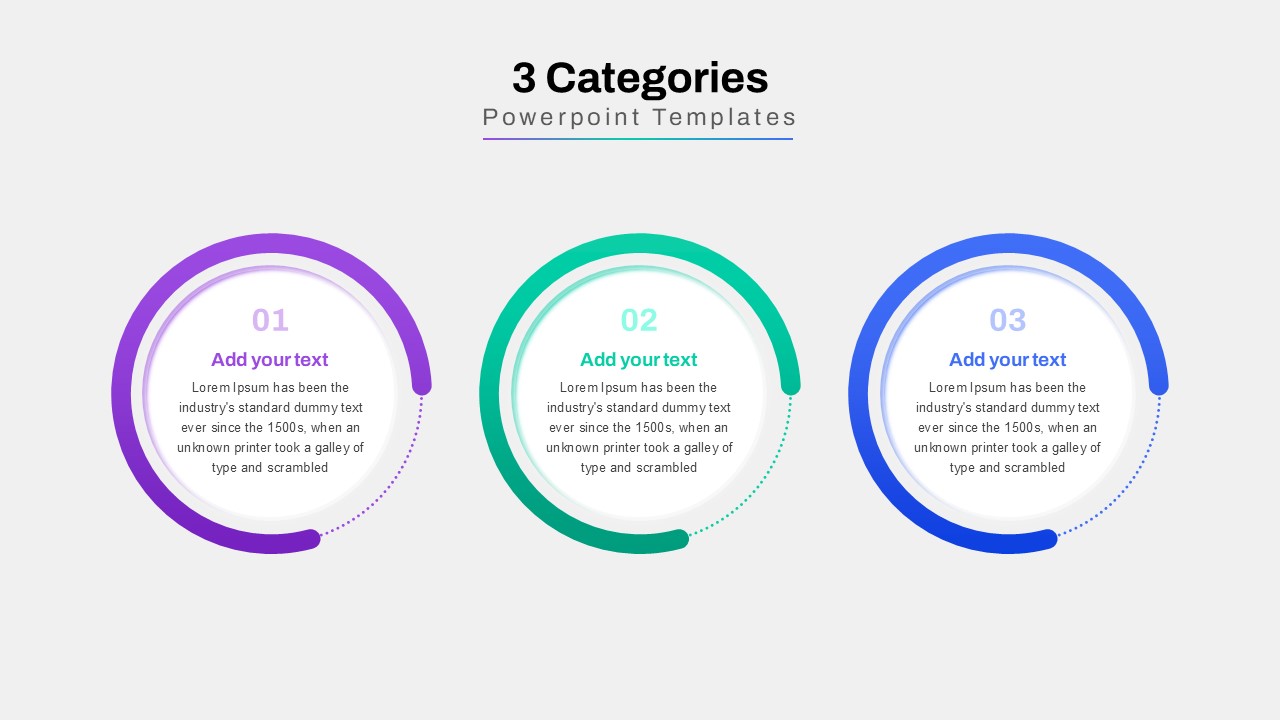
Three-Category Comparison Template for PowerPoint & Google Slides
Comparison
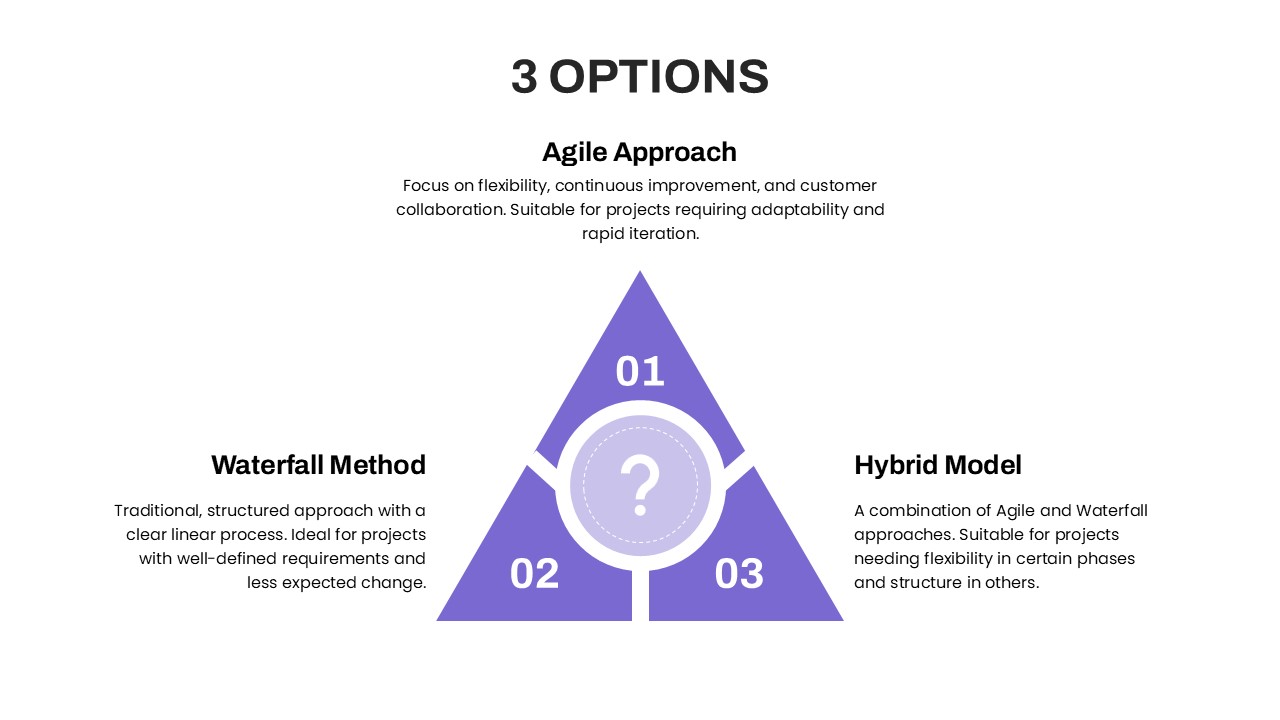
Three Options Infographic Pack Template for PowerPoint & Google Slides
Process
Three Segment Donut Chart KPI Infographic Template for PowerPoint & Google Slides
Pie/Donut
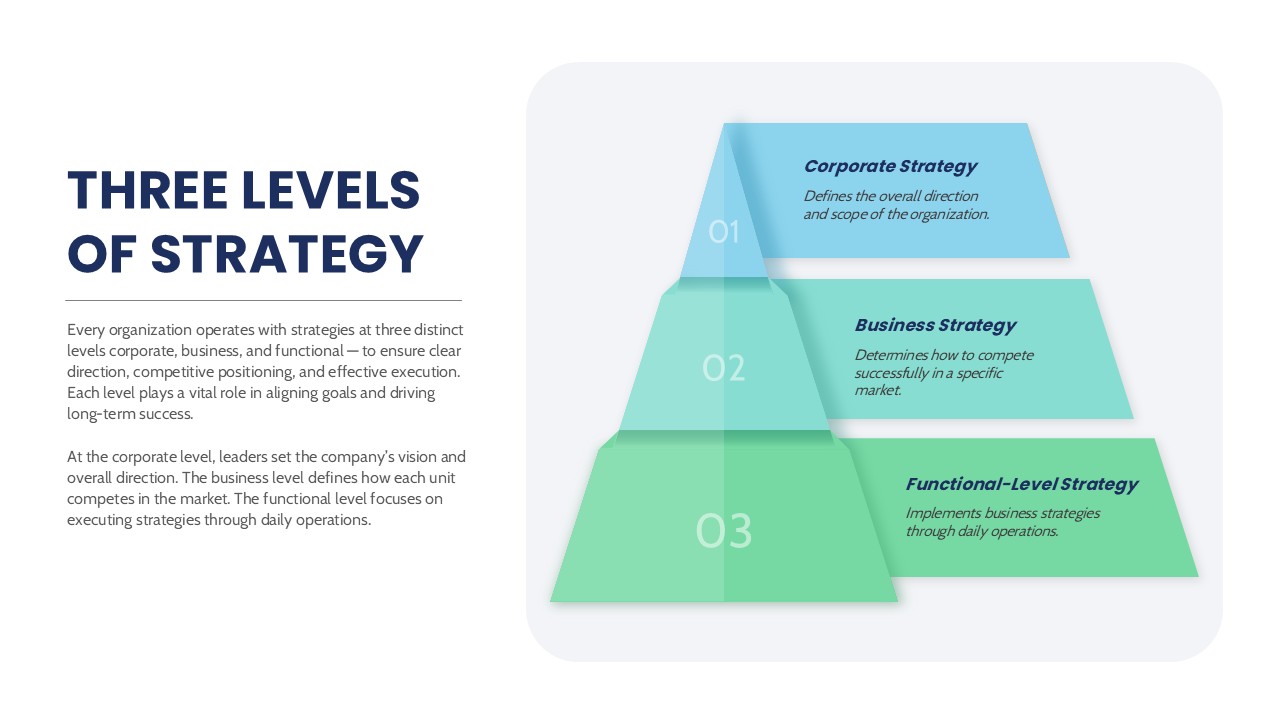
Three Levels of Strategy Template for PowerPoint & Google Slides
Business Strategy