LinkedIn Performance Reporting Dashboard Template for PowerPoint & Google Slides
Description
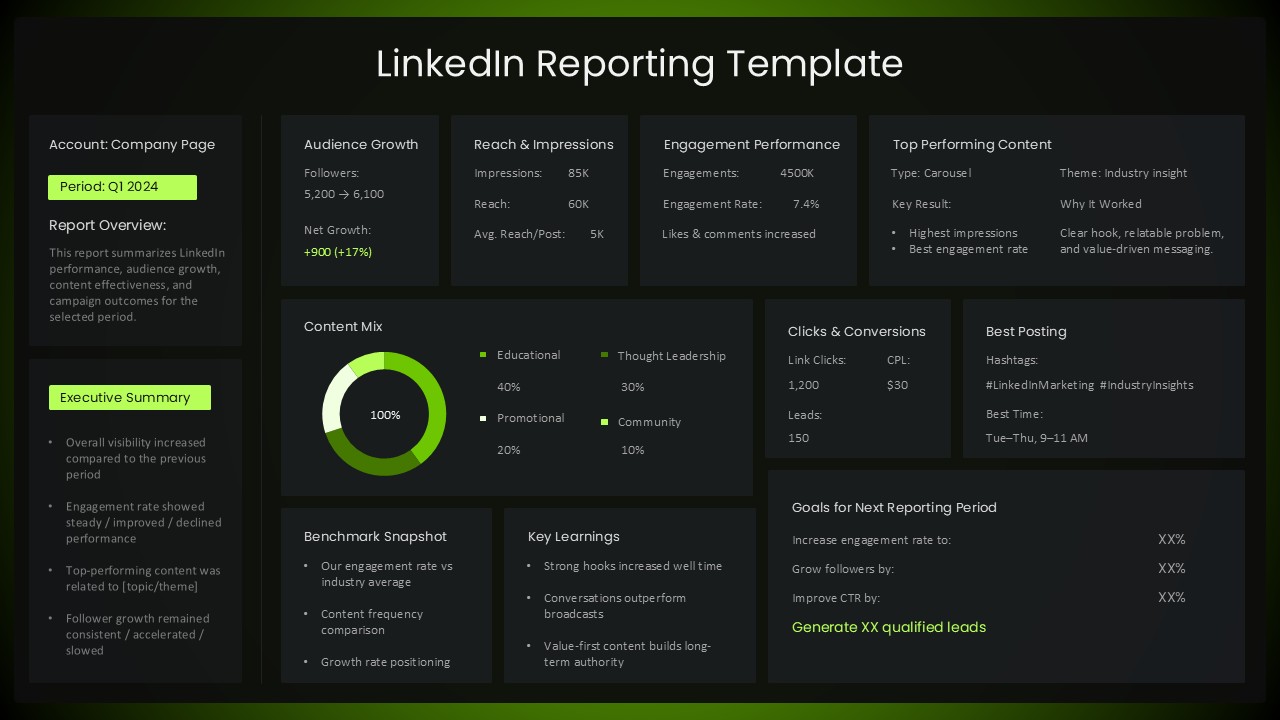
This LinkedIn performance reporting dashboard is designed to help marketing teams present campaign results, audience growth, and engagement metrics in a clear, executive-ready format. The slide uses a structured grid layout with dark panels and high-contrast highlights to showcase key indicators such as followers growth, reach and impressions, engagement rate, clicks, conversions, and content mix. Dedicated sections for top-performing content, best posting times, benchmarks, and key learnings make it easy to transform raw LinkedIn analytics into actionable insights. The circular content mix visual and KPI cards support quick scanning while maintaining a polished, data-driven appearance suitable for leadership reviews.
Built for efficiency, this dashboard is fully editable in PowerPoint and Google Slides. Users can quickly update metrics, adjust labels, replace icons, or align colors with brand guidelines without redesigning the layout. The modular design supports consistent quarterly or monthly reporting while reducing preparation time and ensuring visual consistency across reports.
Who is it for
This template is ideal for digital marketers, social media managers, growth teams, and marketing consultants who manage LinkedIn company pages. It is also well suited for marketing leads, CMOs, and analysts preparing executive summaries, performance reviews, or client reports focused on LinkedIn marketing outcomes.
Other Uses
Beyond LinkedIn reporting, this slide can be adapted for other social media performance dashboards, campaign summaries, executive marketing reports, or internal KPI reviews. Replace metrics and labels to track different platforms, content strategies, or lead-generation initiatives.
Login to download this file

Item ID
SB05793
Related Templates

LinkedIn Metrics Infographic Slide Template for PowerPoint & Google Slides
Digital Marketing
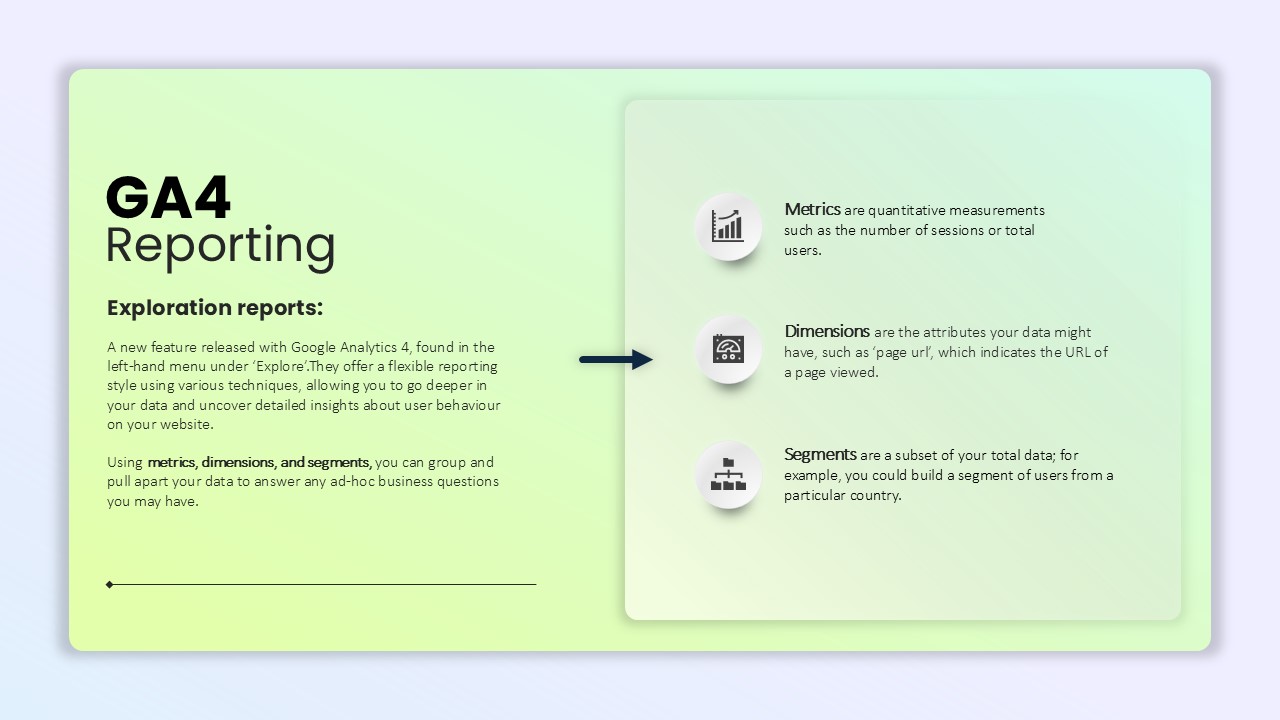
GA4 Reporting PowerPoint template for PowerPoint & Google Slides
Information Technology
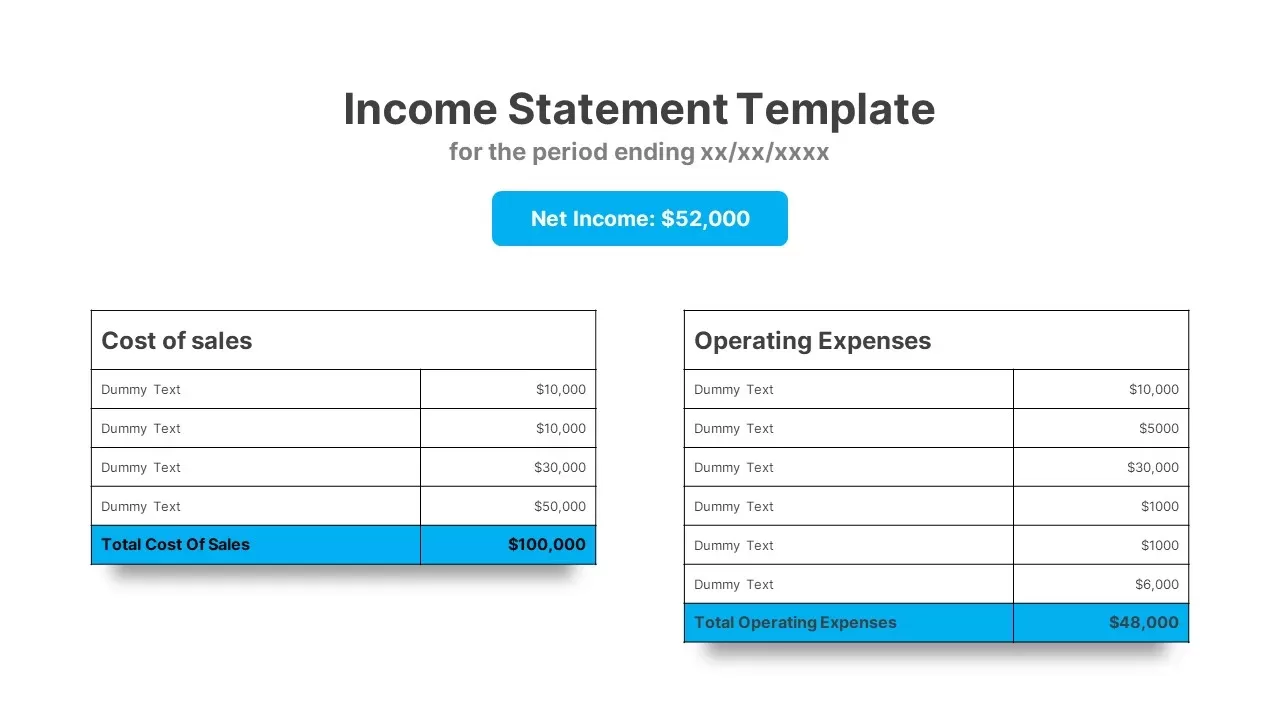
Income Statement Financial Reporting Template for PowerPoint & Google Slides
Finance
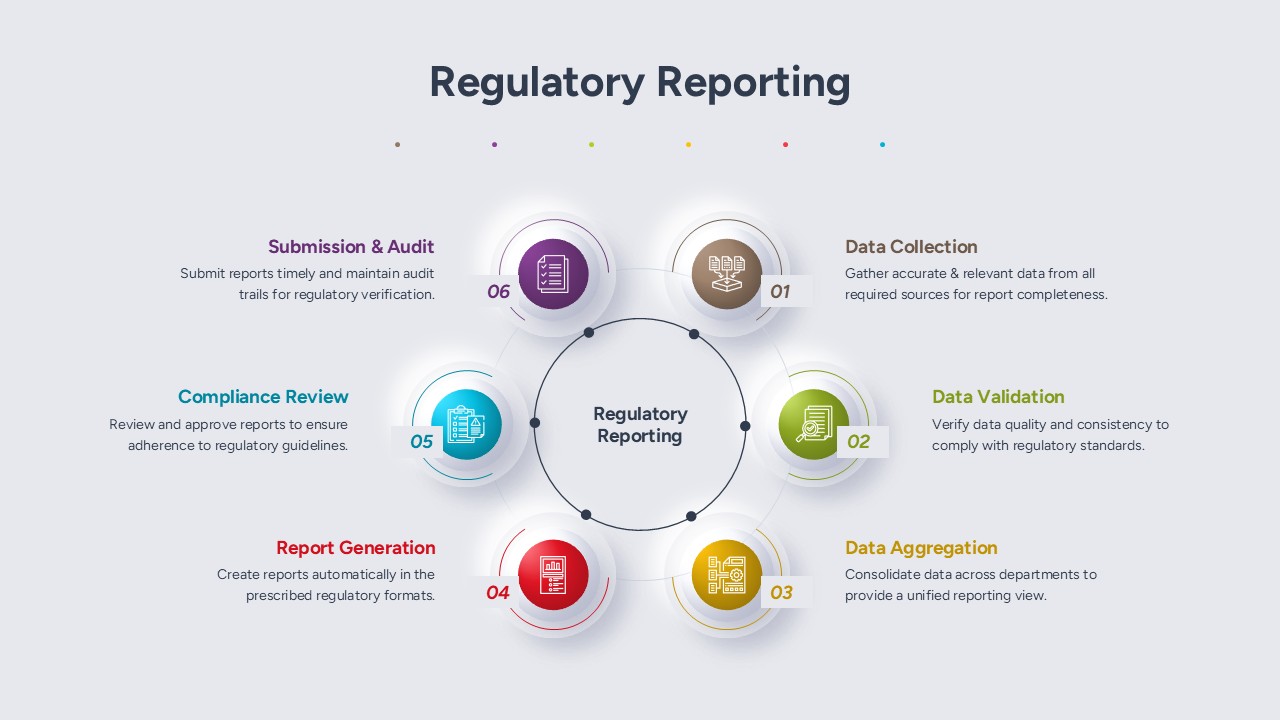
Regulatory Reporting Process Overview template for PowerPoint & Google Slides
Business

Website Performance Dashboard template for PowerPoint & Google Slides
Charts
Sales Performance Dashboard template for PowerPoint & Google Slides
Business Report
Social Media Performance Dashboard Template for PowerPoint & Google Slides
Bar/Column
Performance KPI Dashboard Slide Template for PowerPoint & Google Slides
Business Report
Website Performance Monitoring Dashboard Template for PowerPoint & Google Slides
Business Report
DevOps KPI Dashboard Performance Metrics Template for PowerPoint & Google Slides
Software Development
Monthly Sales Performance Dashboard Template for PowerPoint & Google Slides
Charts
Employee Performance Metrics Dashboard Template for PowerPoint & Google Slides
Employee Performance
Google Ads Optimization & Performance Infographic Template for PowerPoint & Google Slides
Digital Marketing
Profit Performance Trend Chart Template for PowerPoint & Google Slides
Finance
Sales vs Budget Performance Chart Template for PowerPoint & Google Slides
Bar/Column
Performance Review Process Management Cycle template for PowerPoint & Google Slides
Employee Performance
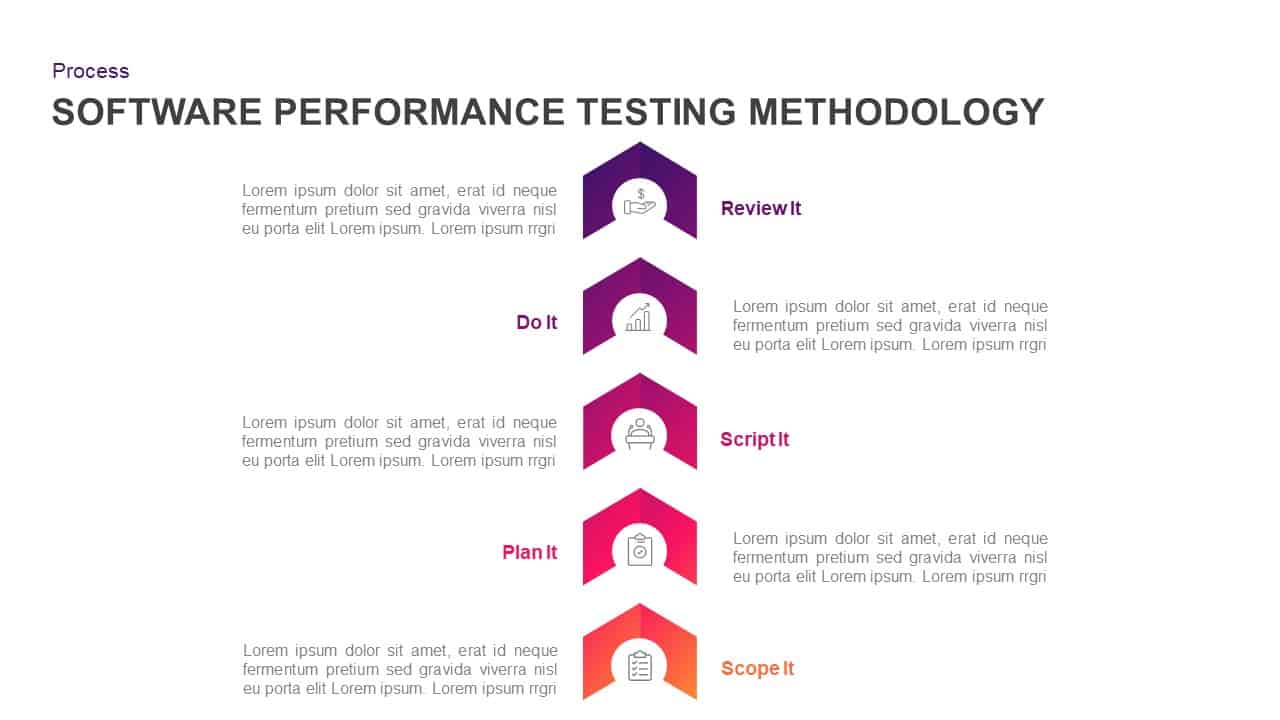
Software Performance Testing Methodology Template for PowerPoint & Google Slides
Process
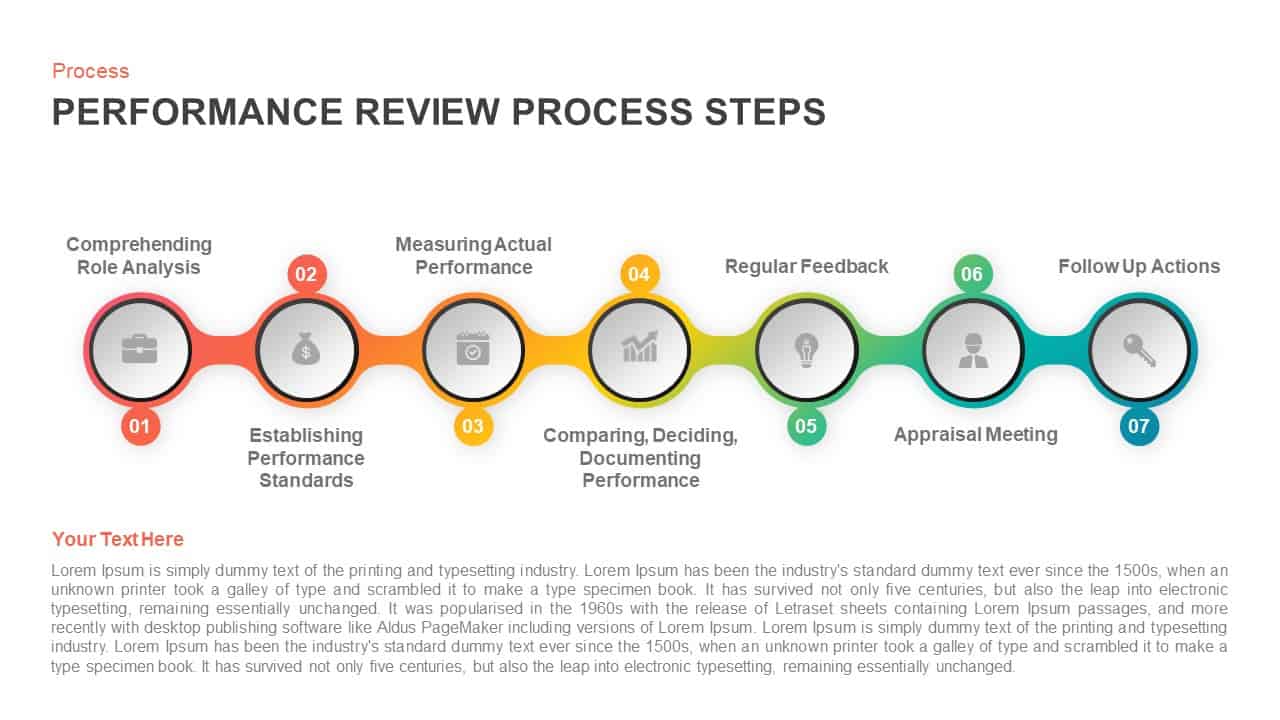
Performance Review Process Steps Template for PowerPoint & Google Slides
Employee Performance
Professional Sales Performance Report Template for PowerPoint & Google Slides
Business Report
Performance Review Progress Management Template for PowerPoint & Google Slides
Process
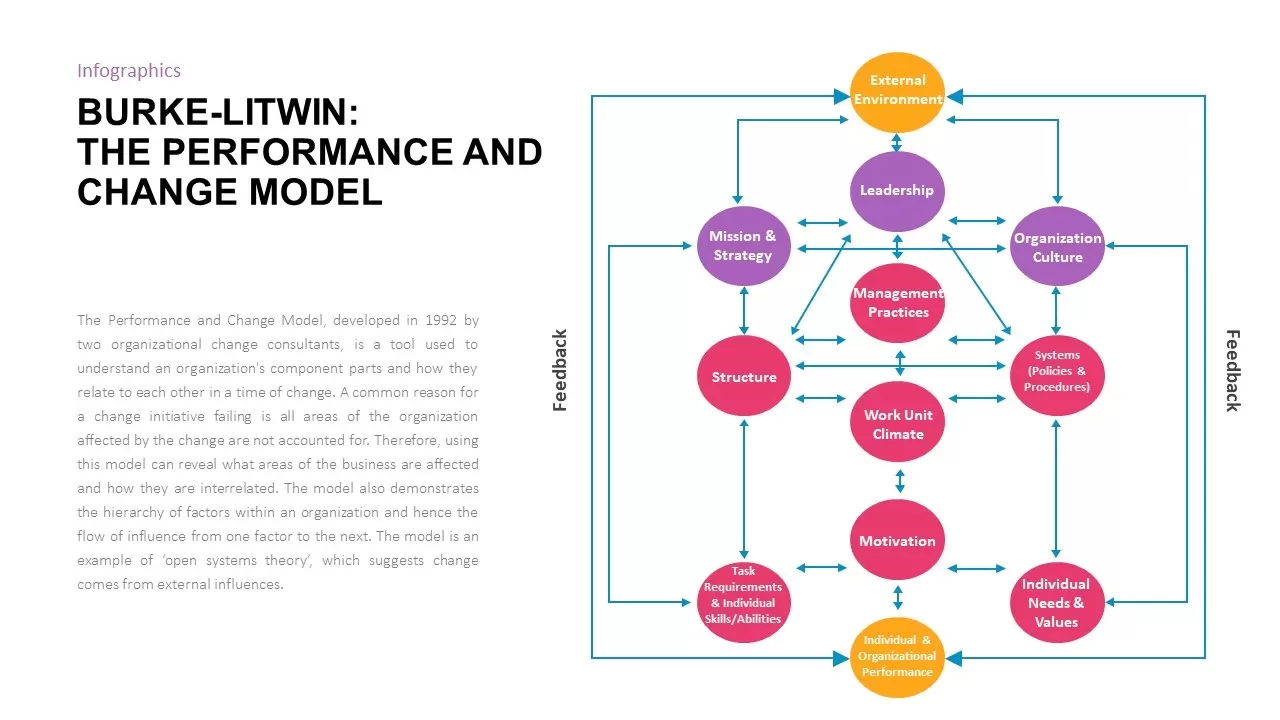
Burke-Litwin Performance and Change Model template for PowerPoint & Google Slides
Infographics
Corporate Performance Management Template for PowerPoint & Google Slides
Pitch Deck
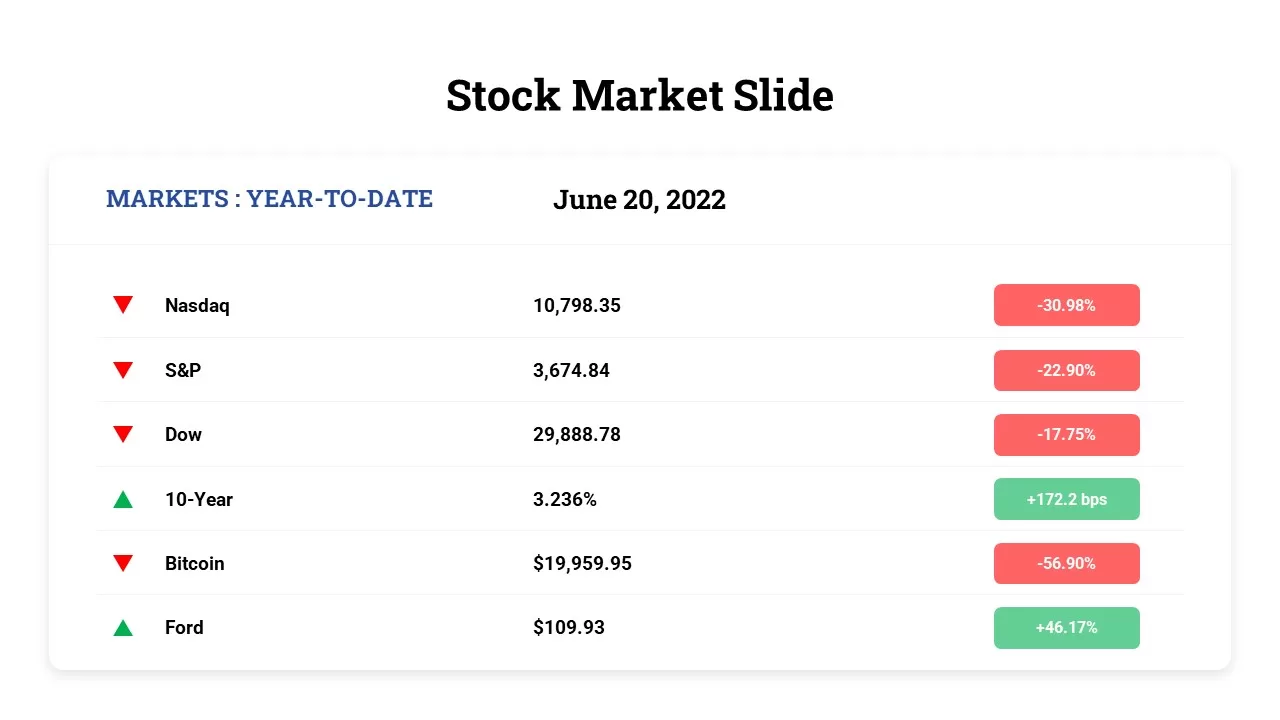
Free Stock Market Performance Overview template for PowerPoint & Google Slides
Finance
Free
9-Box Matrix for Performance & Potential Template for PowerPoint & Google Slides
Employee Performance
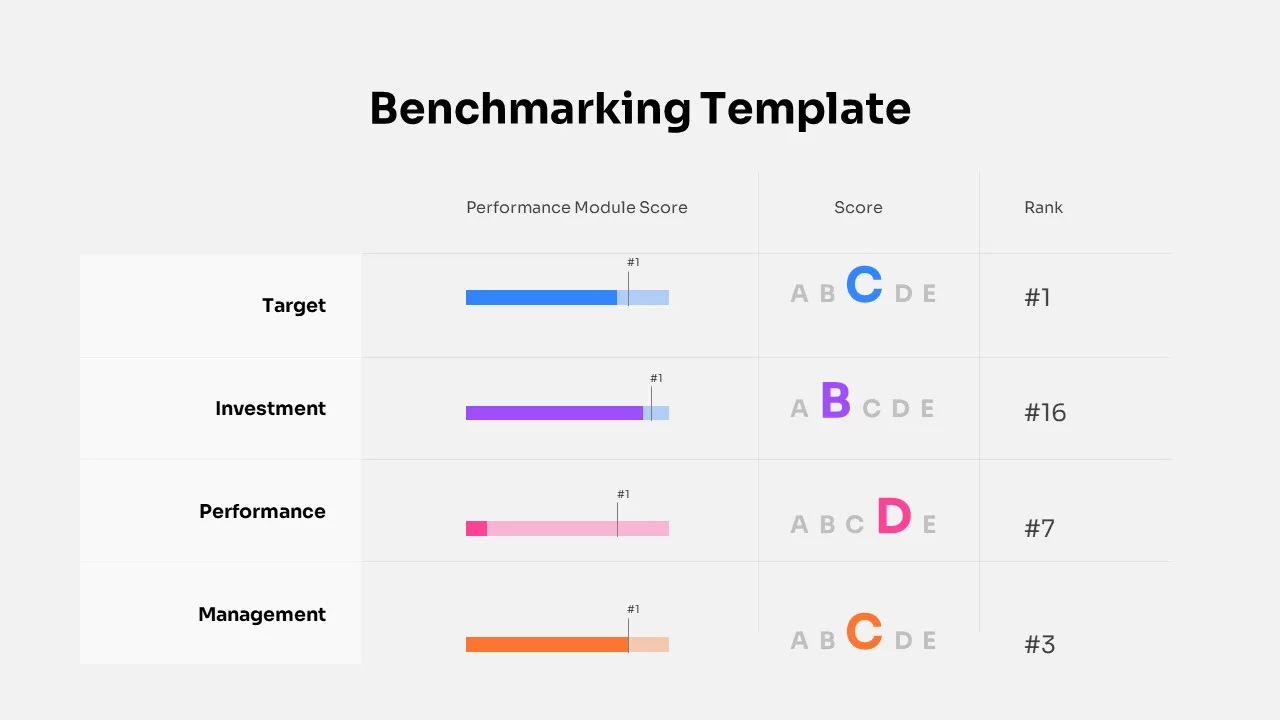
Benchmarking Performance Score Template for PowerPoint & Google Slides
Comparison Chart
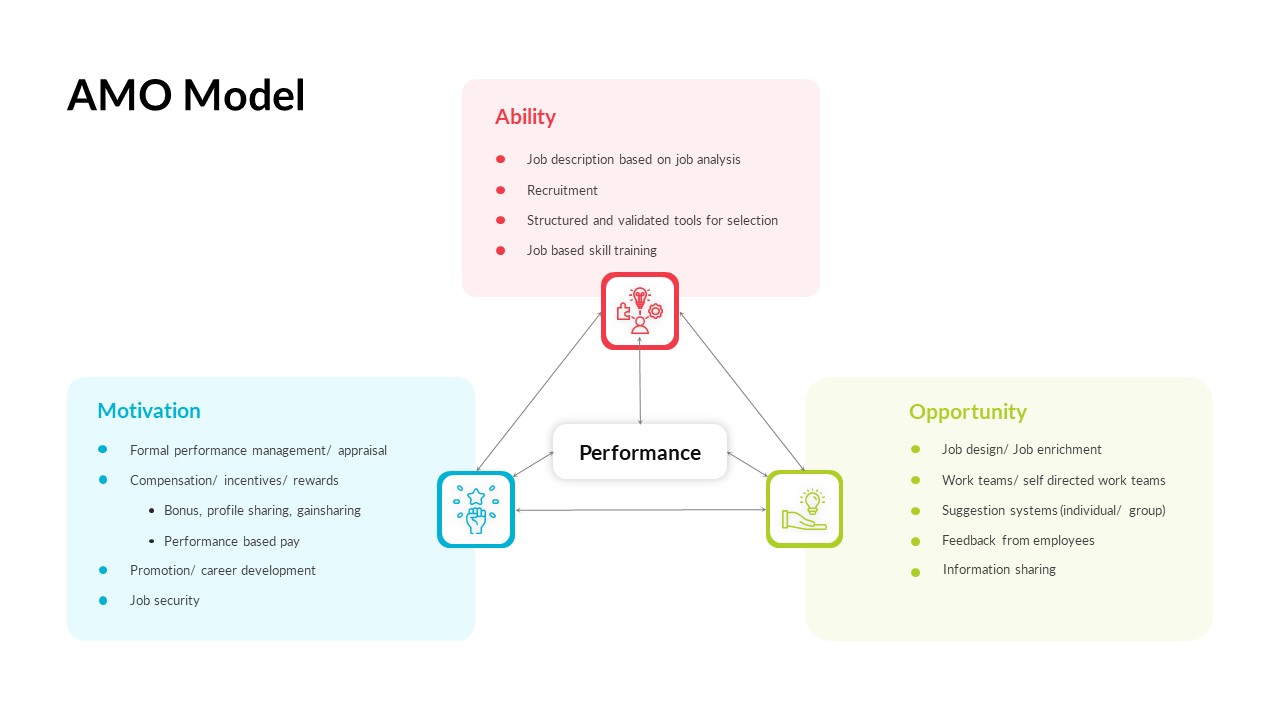
AMO Performance Model Feedback Diagram Template for PowerPoint & Google Slides
Employee Performance
Hits and Misses Performance Comparison Template for PowerPoint & Google Slides
Comparison
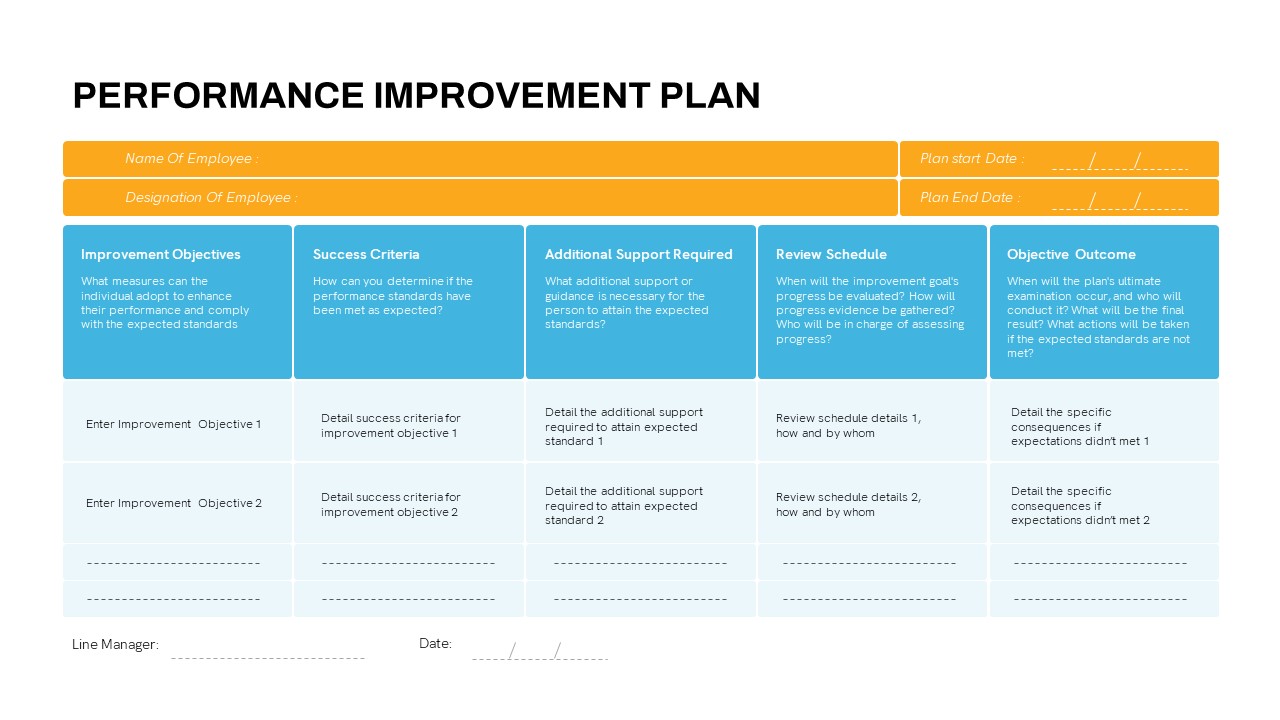
Detailed Performance Improvement Plan Template for PowerPoint & Google Slides
Employee Performance
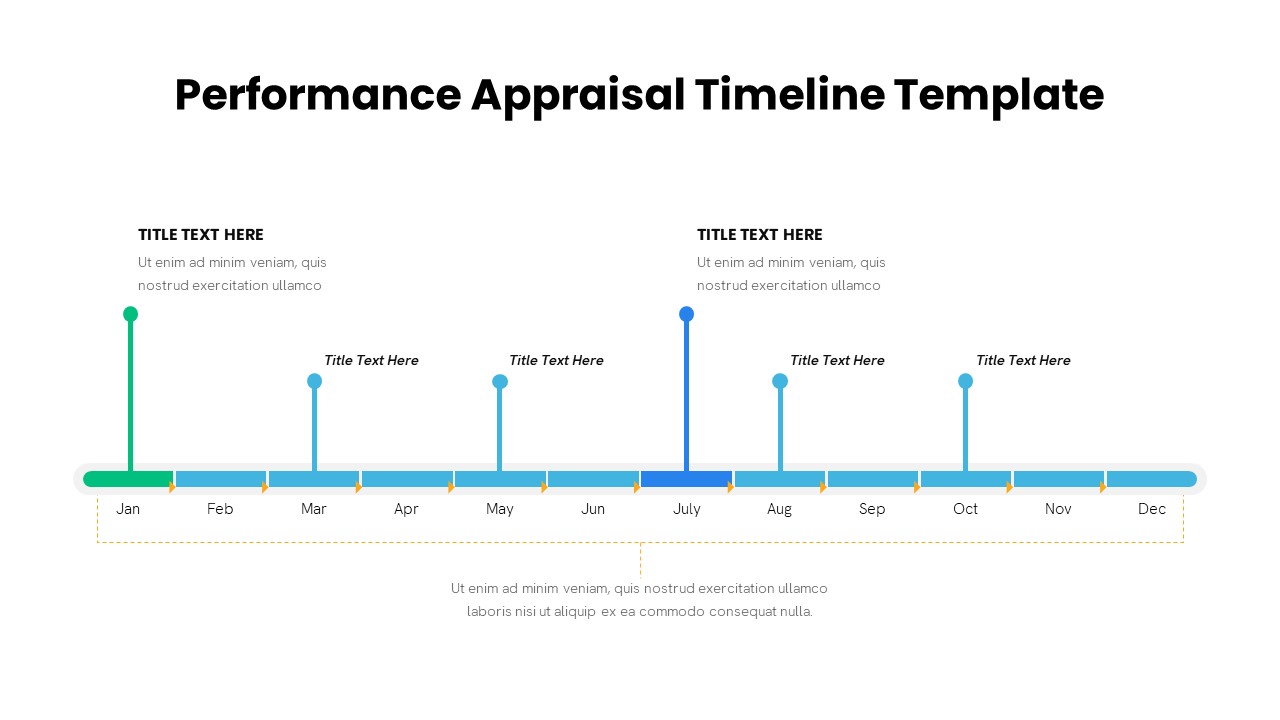
Performance Appraisal Timeline Diagram Template for PowerPoint & Google Slides
Timeline
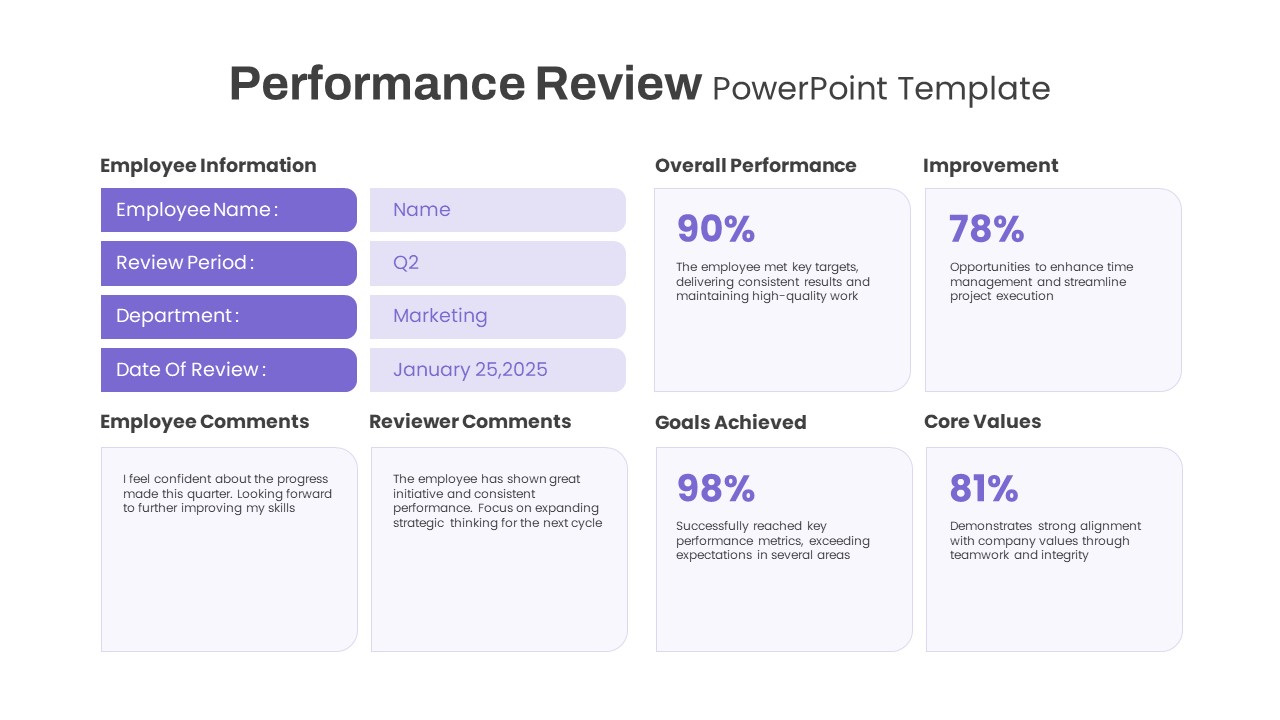
Performance Review template for PowerPoint & Google Slides
Employee Performance
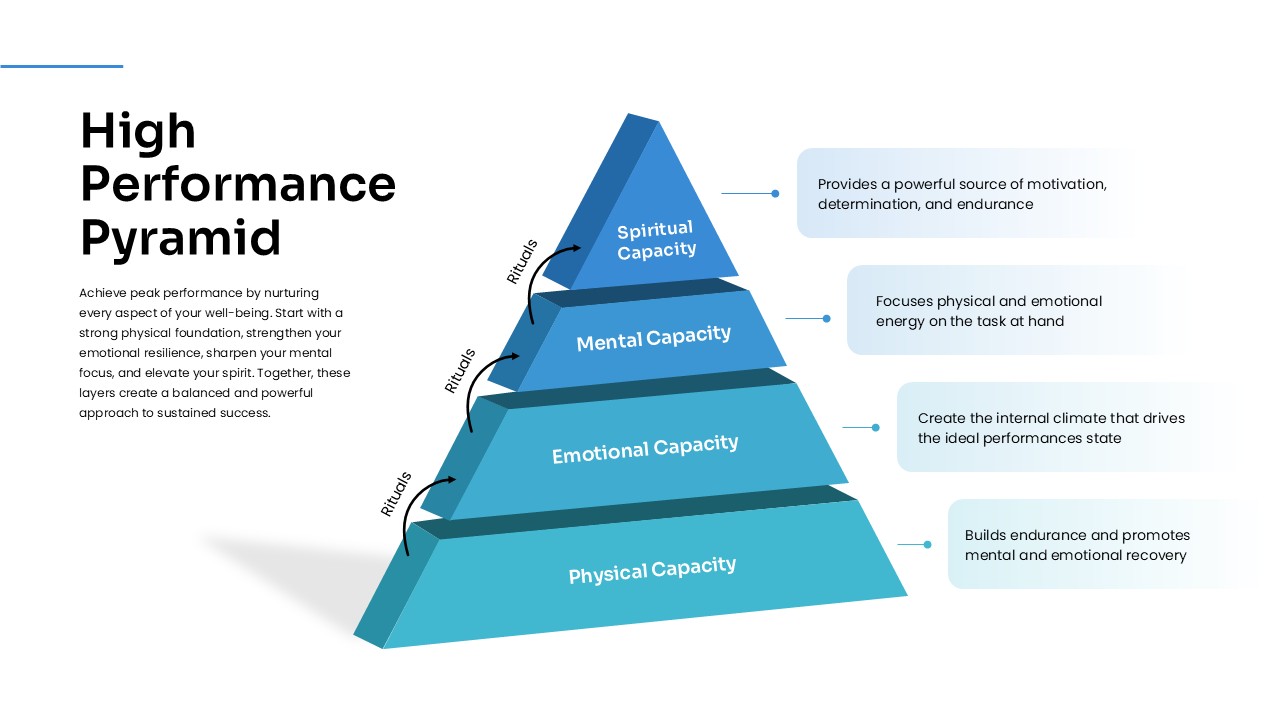
High Performance Pyramid Diagram Template for PowerPoint & Google Slides
Pyramid
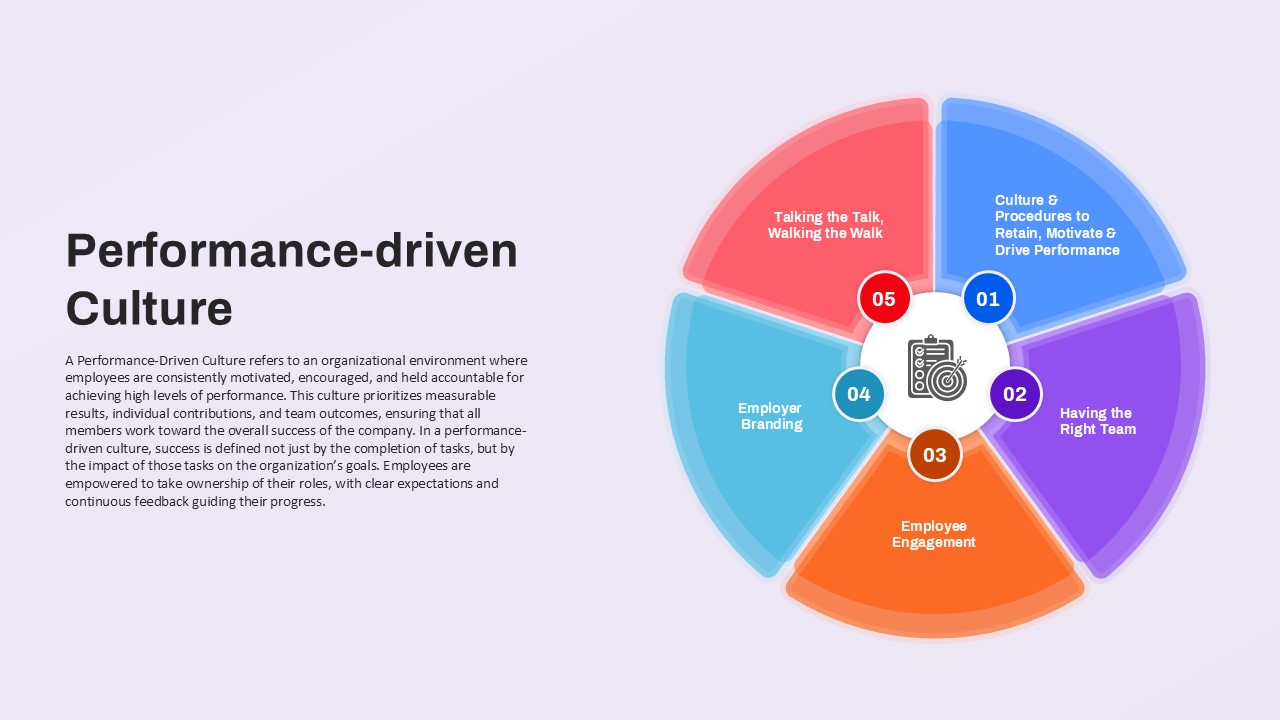
Performance-driven Culture framework template for PowerPoint & Google Slides
Leadership
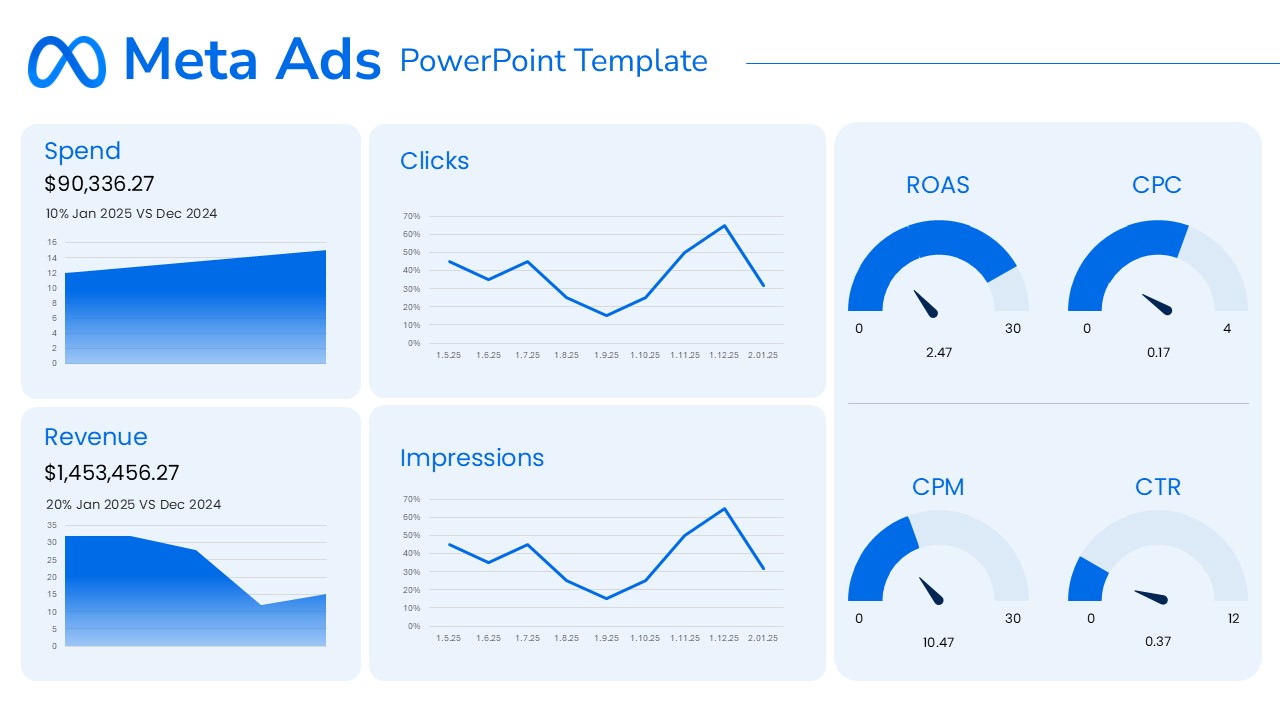
Meta Ads Performance Overview template for PowerPoint & Google Slides
Advertising
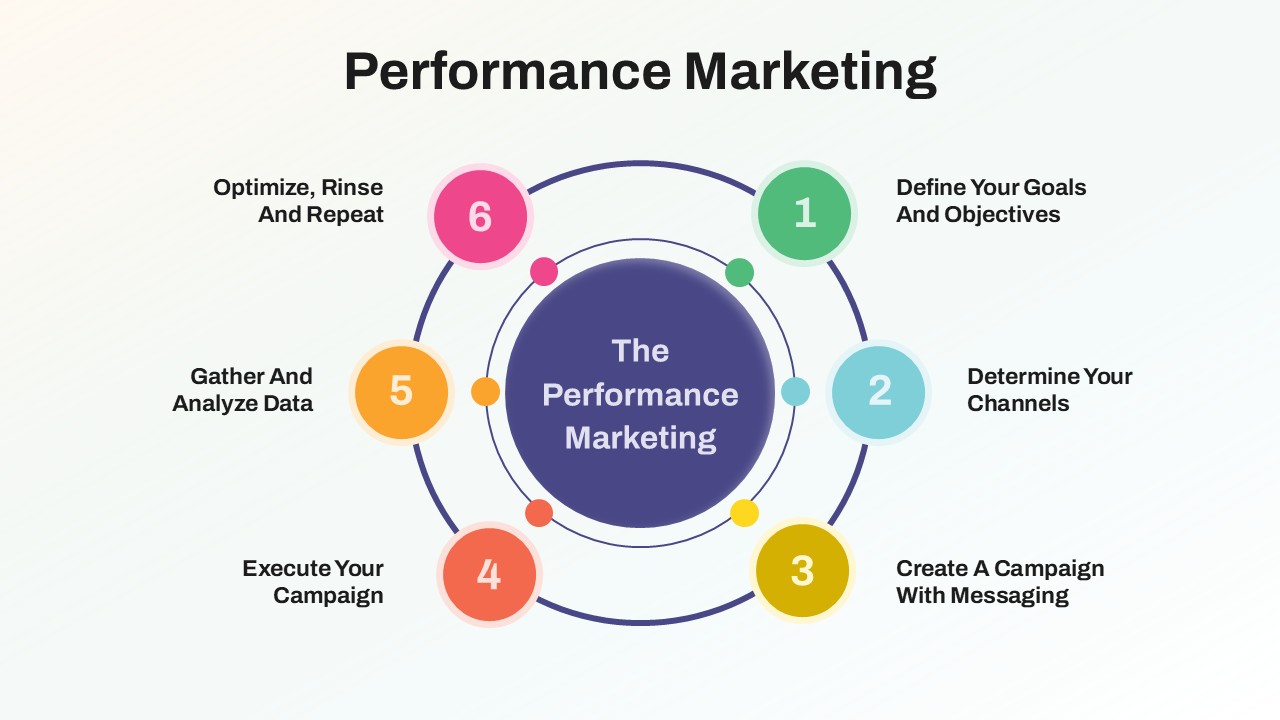
Performance Marketing Strategy template for PowerPoint & Google Slides
Digital Marketing
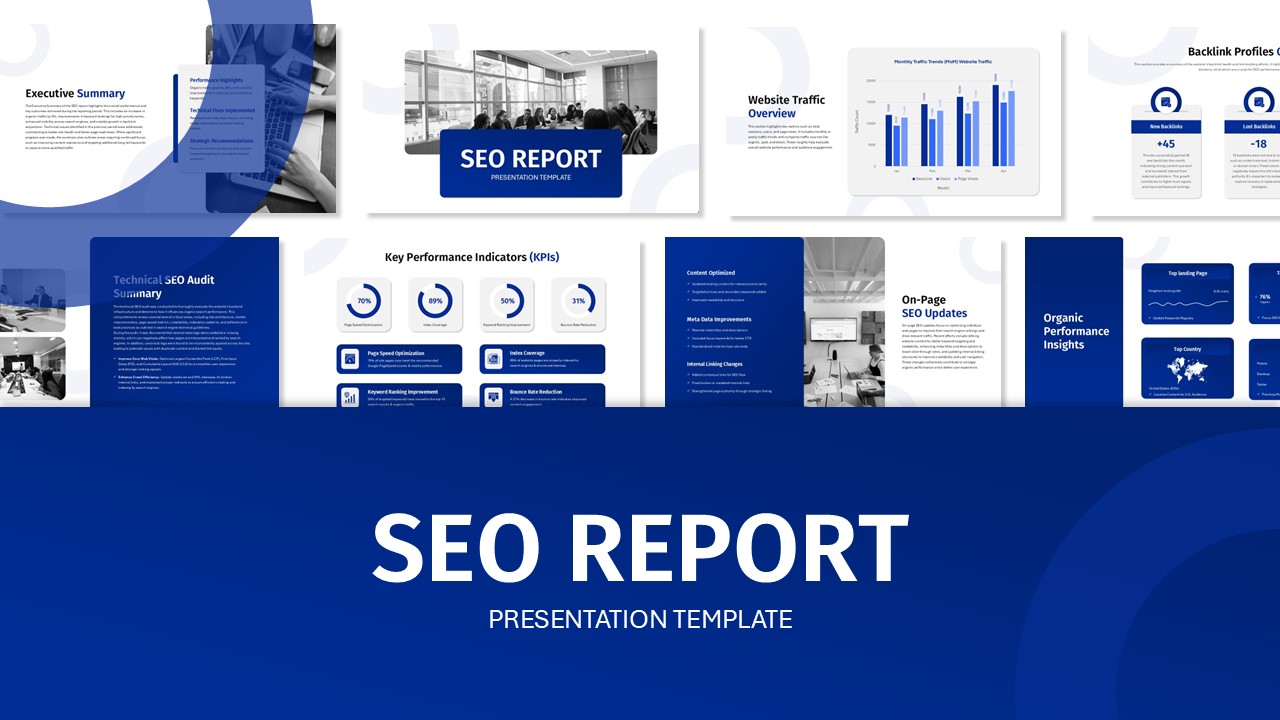
SEO Performance Report Overview template for PowerPoint & Google Slides
Digital Marketing
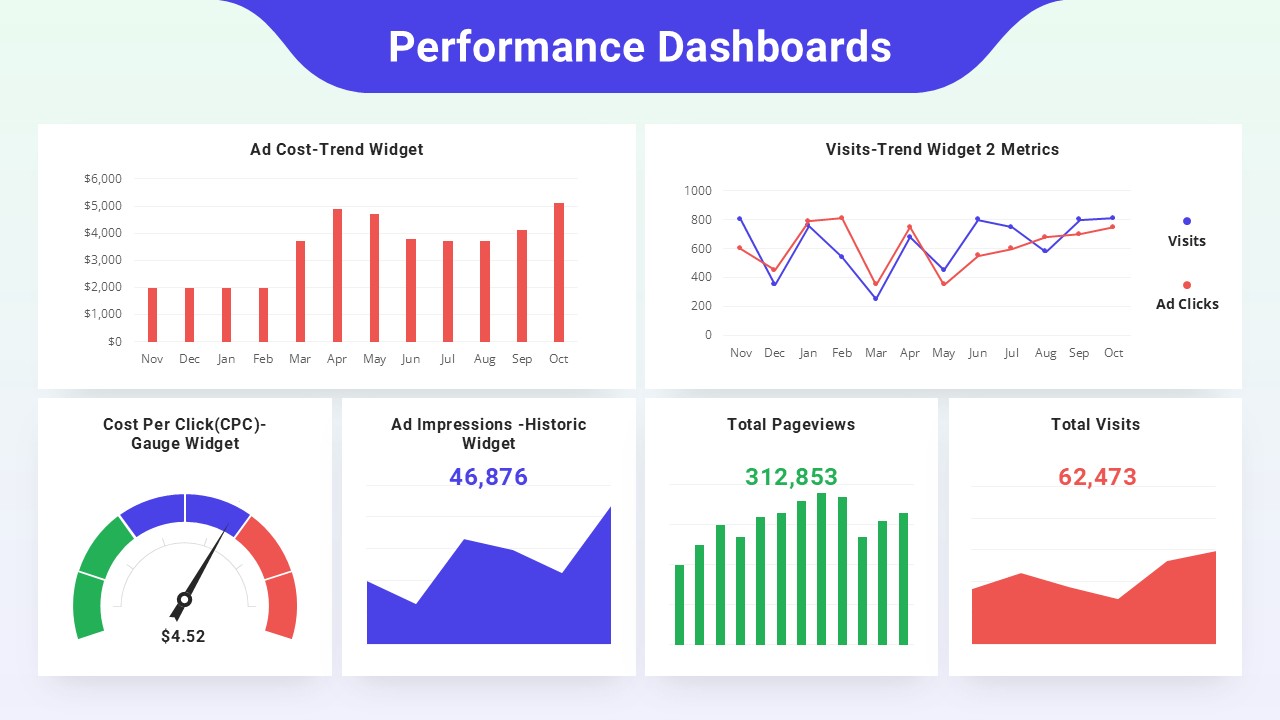
Performance Dashboards Overview Template for PowerPoint & Google Slides
Business Report
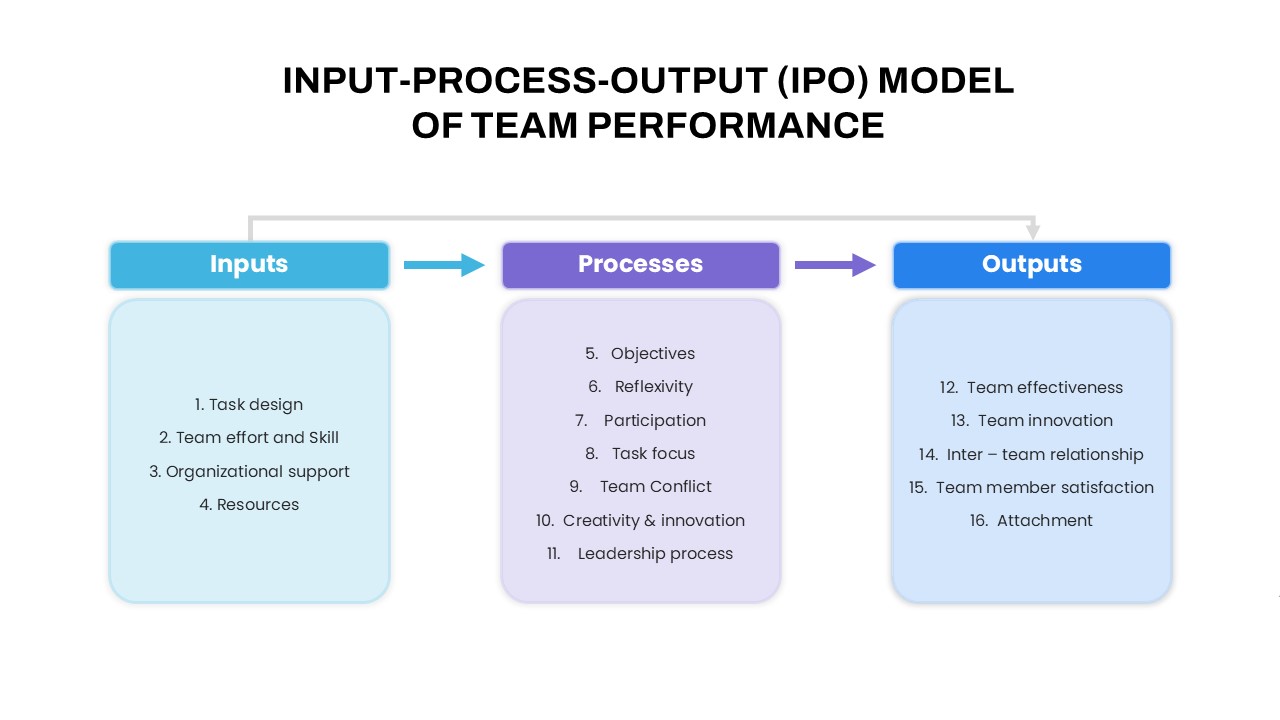
IPO Model of Team Performance for PowerPoint & Google Slides
Process
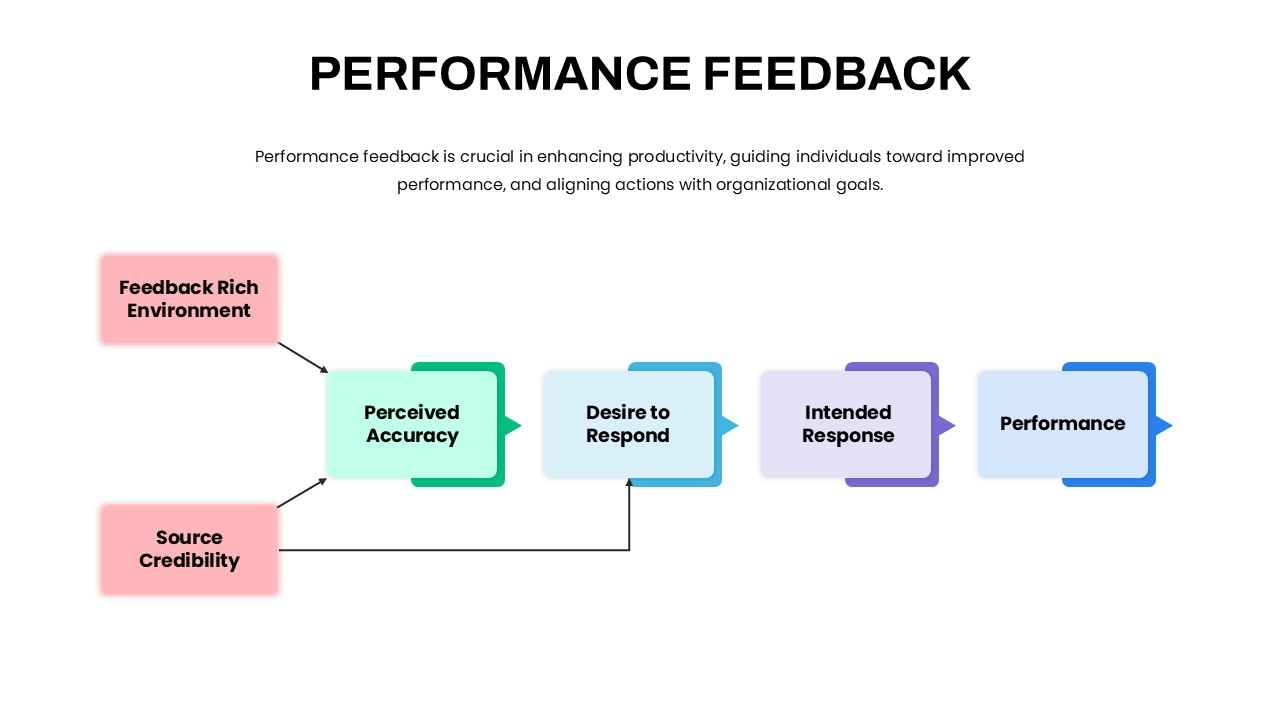
Performance Feedback Model for PowerPoint & Google Slides
Employee Performance
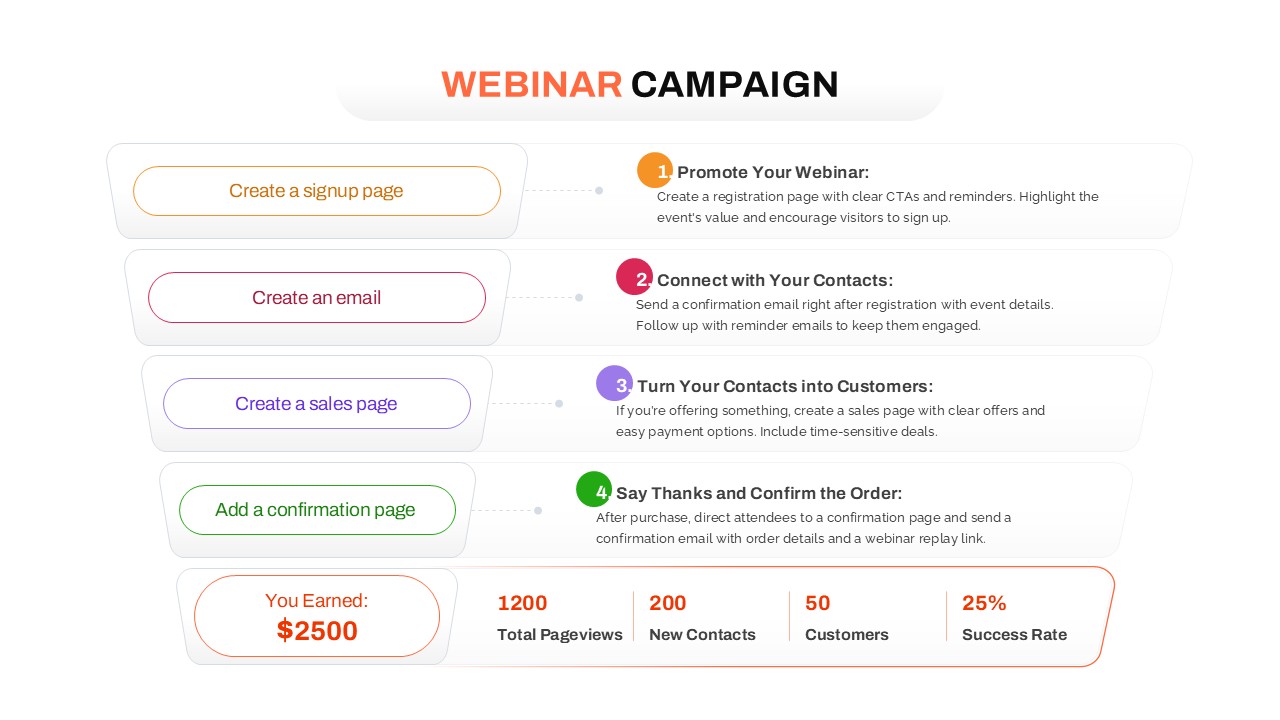
Webinar Campaign Steps and Performance for PowerPoint & Google Slides
Advertising
Free KPI Dashboard PowerPoint Template for PowerPoint & Google Slides
Charts
Free
E-commerce Analytics Dashboard Template for PowerPoint & Google Slides
Bar/Column

Dynamic Data Dashboard Infographic Template for PowerPoint & Google Slides
Bar/Column
Product Usage Analytics Dashboard Chart Template for PowerPoint & Google Slides
Bar/Column
Data Analytics Dashboard Design template for PowerPoint & Google Slides
Bar/Column

Efficiency KPI Dashboard Metaphor Template for PowerPoint & Google Slides
Infographics
Professional Team Efficiency Dashboard Template for PowerPoint & Google Slides
Business Report
Project Management Dashboard Template for PowerPoint & Google Slides
Project
Immigration Data Dashboard Template for PowerPoint & Google Slides
Bar/Column
Employee Skill Analysis Dashboard Template for PowerPoint & Google Slides
Employee Performance
Sales Growth Dashboard: KPI Gauge & Line Template for PowerPoint & Google Slides
Revenue

Net Promoter Score Dashboard Template for PowerPoint & Google Slides
Customer Experience
Modern Project Status Report Dashboard Template for PowerPoint & Google Slides
Project Status
Bull and Bear Stock Market Dashboard Template for PowerPoint & Google Slides
Infographics
KPI Dashboard template for PowerPoint & Google Slides
Business Report
KPI Dashboard Overview template for PowerPoint & Google Slides
Finance
KPI Dashboard Data Visualization Template for PowerPoint & Google Slides
Bar/Column
KPI Dashboard Data Overview Slide Template for PowerPoint & Google Slides
Bar/Column
Interactive Benchmarking Gauge Dashboard Template for PowerPoint & Google Slides
Pie/Donut
Heat Map Risk Matrix Dashboard Template for PowerPoint & Google Slides
Comparison Chart
Project Status Dashboard Table Template for PowerPoint & Google Slides
Project Status
Project Status Dashboard with Metrics Template for PowerPoint & Google Slides
Project Status
Colorful Project Status Dashboard Template for PowerPoint & Google Slides
Project Status
Weekly Update Schedule Dashboard Template for PowerPoint & Google Slides
Agenda
One Pager Project Status Dashboard Template for PowerPoint & Google Slides
Project Status
One Pager Annual Report Dashboard Template for PowerPoint & Google Slides
Business Report
Social Media Analytics Dashboard Template for PowerPoint & Google Slides
Digital Marketing
Social Media Statistics 2023 Dashboard Template for PowerPoint & Google Slides
Comparison
Mastodon Metrics Infographic Dashboard Template for PowerPoint & Google Slides
Business Report
Soccer Match Stats Dashboard Slide Template for PowerPoint & Google Slides
Graphics
Free Quarterly Business Review Dashboard Template for PowerPoint & Google Slides
Business
Free
Free Monthly Financial Dashboard & Cash Flow Template for PowerPoint & Google Slides
Business Report
Free
Michigan County Map with KPI Dashboard Template for PowerPoint & Google Slides
World Maps
Quarterly Financial Summary Dashboard Template for PowerPoint & Google Slides
Business Report
Banking Financial Overview Dashboard Template for PowerPoint & Google Slides
Finance
Quarterly Business Review Dashboard Template for PowerPoint & Google Slides
Pitch Deck
Monthly Business Review Dashboard Deck Template for PowerPoint & Google Slides
Business Report
Purchasing KPI Metrics Dashboard Template for PowerPoint & Google Slides
Business Report
Procurement KPI Dashboard & Metrics Template for PowerPoint & Google Slides
Business Report
Project Progress Dashboard Pie Charts Template for PowerPoint & Google Slides
Project
HR Report Dashboard Template for PowerPoint & Google Slides
Employee Performance
Budget Forecast Dashboard & Donut Charts Template for PowerPoint & Google Slides
Pie/Donut
Risk Level Gauge Comparison Dashboard Template for PowerPoint & Google Slides
Comparison
Inventory Management Dashboard Template for PowerPoint & Google Slides
Process
Digital Marketing KPIs Dashboard Dark Template for PowerPoint & Google Slides
Business Report
Project Tracking Dashboard Table Template for PowerPoint & Google Slides
Project Status
Action Items Management Dashboard Table Template for PowerPoint & Google Slides
Project Status
Electronic Health Records Dashboard template for PowerPoint & Google Slides
Health
Customer Interview Insights Dashboard Template for PowerPoint & Google Slides
Customer Experience
Account Overview Dashboard template for PowerPoint & Google Slides
Business
Project Status Dashboard Report Template for PowerPoint & Google Slides
Project Status
Project Status Update Dashboard Table Template for PowerPoint & Google Slides
Project Status
Cohort Analysis Retention Dashboard Template for PowerPoint & Google Slides
Comparison Chart
Project Status Dashboard Template for PowerPoint & Google Slides
Project Status
Dashboard Project Status Template for PowerPoint & Google Slides
Project Status
Project Status Template Dashboard with Gauge for PowerPoint & Google Slides
Project Status
Task Completion Rate Dashboard Template for PowerPoint & Google Slides
Business
Project Status Dashboard with RAG Legend Template for PowerPoint & Google Slides
Project Status
Construction Project Dashboard Template for PowerPoint & Google Slides
Project
Employee Headcount Dashboard Report Template for PowerPoint & Google Slides
Employee Performance
4DX Scoreboard KPI Gauge Dashboard Template for PowerPoint & Google Slides
Business Strategy