LinkedIn Metrics Infographic Slide Template for PowerPoint & Google Slides


Description
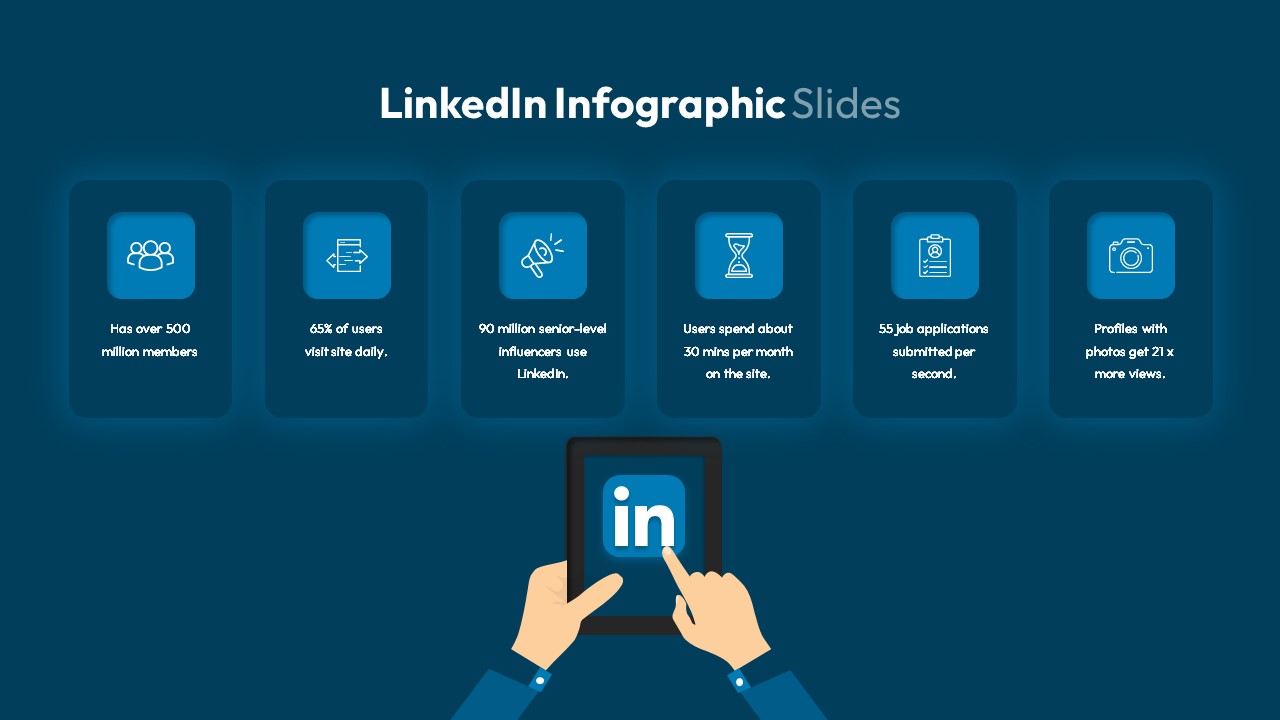
Download and customize this LinkedIn infographic slide to showcase critical platform statistics in a clean, visual format. The slide features six rounded‐corner cards—each with a blue icon placeholder and editable text block—to highlight key metrics such as total members, daily visit rates, influencer usage, time spent, job applications per second, and profile photo engagement. The minimalist white background, crisp typography, and soft drop shadows ensure readability, while intuitive master slides and alignment guides let you swap icons, update figures, or adjust layouts in seconds. Fully compatible with PowerPoint and Google Slides, this template maintains design integrity across devices and simplifies your data presentation.
Who is it for
Social media managers, marketing analysts, and business strategists can leverage this infographic to report LinkedIn performance metrics, benchmark engagement, and support data-driven proposals. Agency teams and corporate communications leads will find it invaluable for stakeholder presentations.
Other Uses
Repurpose this layout for any platform or product metrics—swap icons and labels to display user growth, website KPIs, sales figures, or operational statistics. Adapt cards for competitive benchmarks, quarterly reports, or investor updates.
Login to download this file

Item ID
SB03404
Related Templates

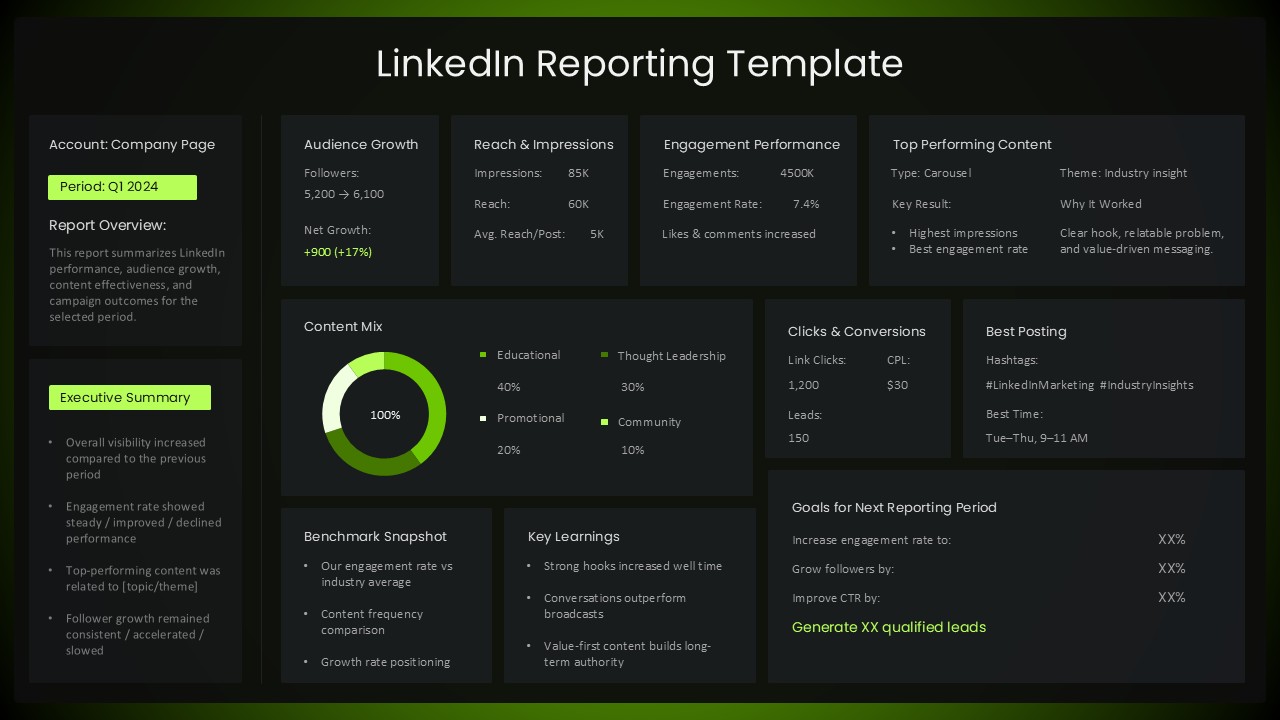
LinkedIn Performance Reporting Dashboard Template for PowerPoint & Google Slides
Digital Marketing
Colorful Block Infographic Metrics Slide Template for PowerPoint & Google Slides
Infographics
Instagram Infographic Metrics Slide Template for PowerPoint & Google Slides
Marketing
Bubble Head Metrics Infographic Template for PowerPoint & Google Slides
Circular
Circle Segment Sales Metrics Infographic Template for PowerPoint & Google Slides
Circular
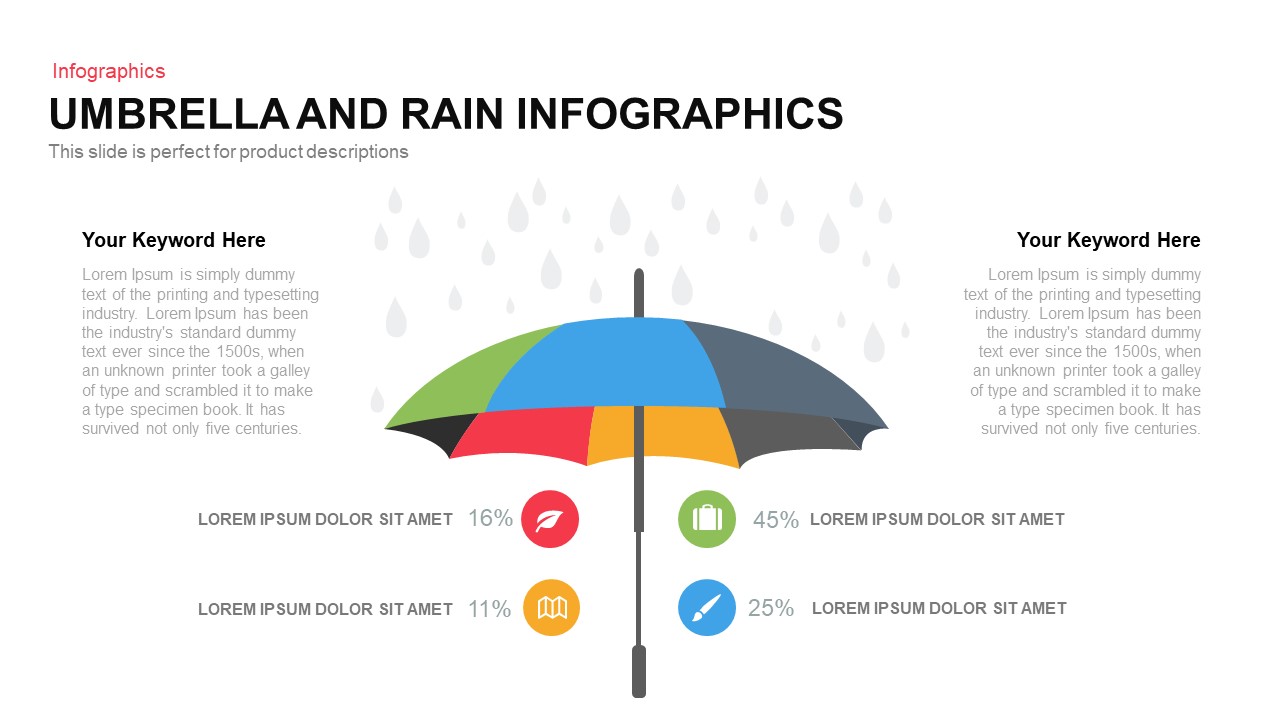
Umbrella and Rain Infographic Metrics Template for PowerPoint & Google Slides
Comparison
Statistics & Global Metrics Infographic Template for PowerPoint & Google Slides
Bar/Column
Facebook Social Metrics Infographic Template for PowerPoint & Google Slides
Graphics
Mastodon Metrics Infographic Dashboard Template for PowerPoint & Google Slides
Business Report
Benchmarking Metrics Comparison Slide Template for PowerPoint & Google Slides
Pie/Donut
Agriculture Infographics Slide with Progress Rings & Metrics Template for PowerPoint & Google Slides
Pie/Donut
Social Media Analysis Metrics Slide Deck Template for PowerPoint & Google Slides
Digital Marketing
iPad App Mockup with Progress Metrics Template for PowerPoint & Google Slides
Bar/Column
Asia Map with KPI Metrics and Legend Template for PowerPoint & Google Slides
World Maps
Social Media Metrics template for PowerPoint & Google Slides
Comparison Chart
Mobile Usage Metrics template for PowerPoint & Google Slides
Comparison Chart

Scale Metaphor Metrics Comparison Template for PowerPoint & Google Slides
Charts
Comprehensive Recruitment Metrics Report Template for PowerPoint & Google Slides
Recruitment
Project Status Dashboard with Metrics Template for PowerPoint & Google Slides
Project Status
Circular Image Gallery & KPI Metrics Template for PowerPoint & Google Slides
Pie/Donut
Annual Recurring Revenue Metrics Template for PowerPoint & Google Slides
Bar/Column
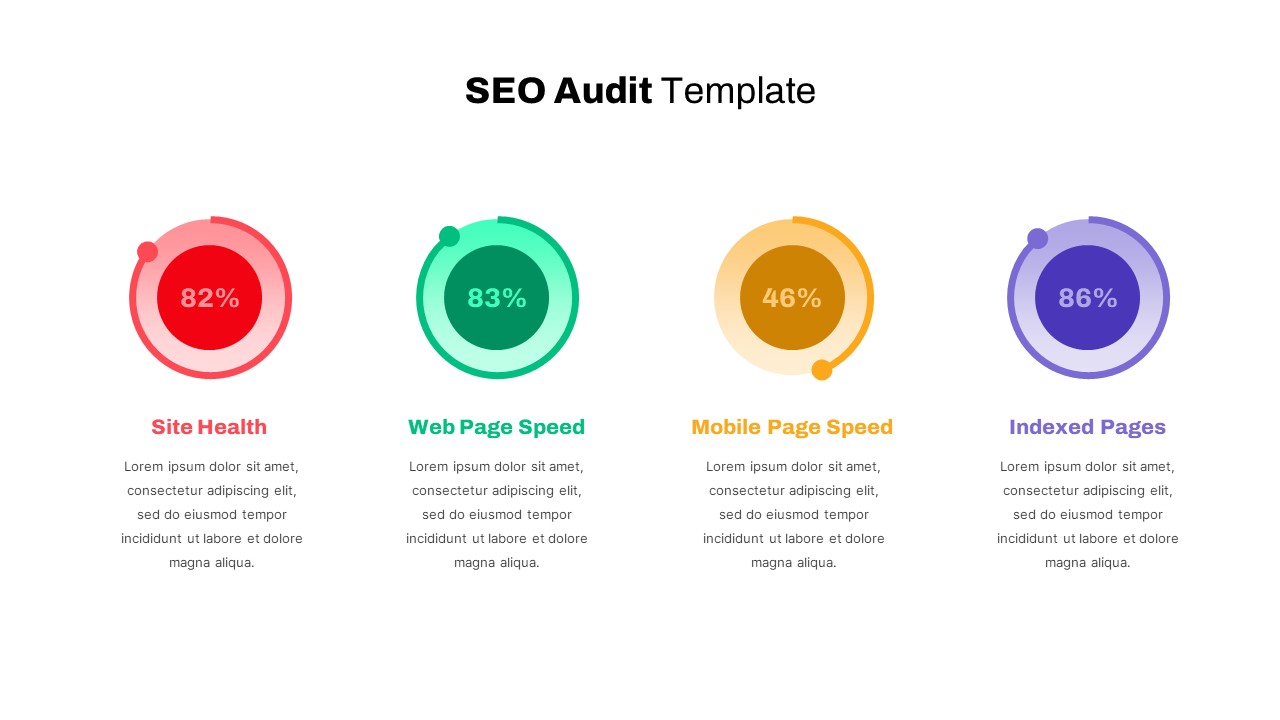
Detailed SEO Audit Metrics Overview Template for PowerPoint & Google Slides
Circular
Free Editable U.S. Map with Regional Metrics Template for PowerPoint & Google Slides
World Maps
Free
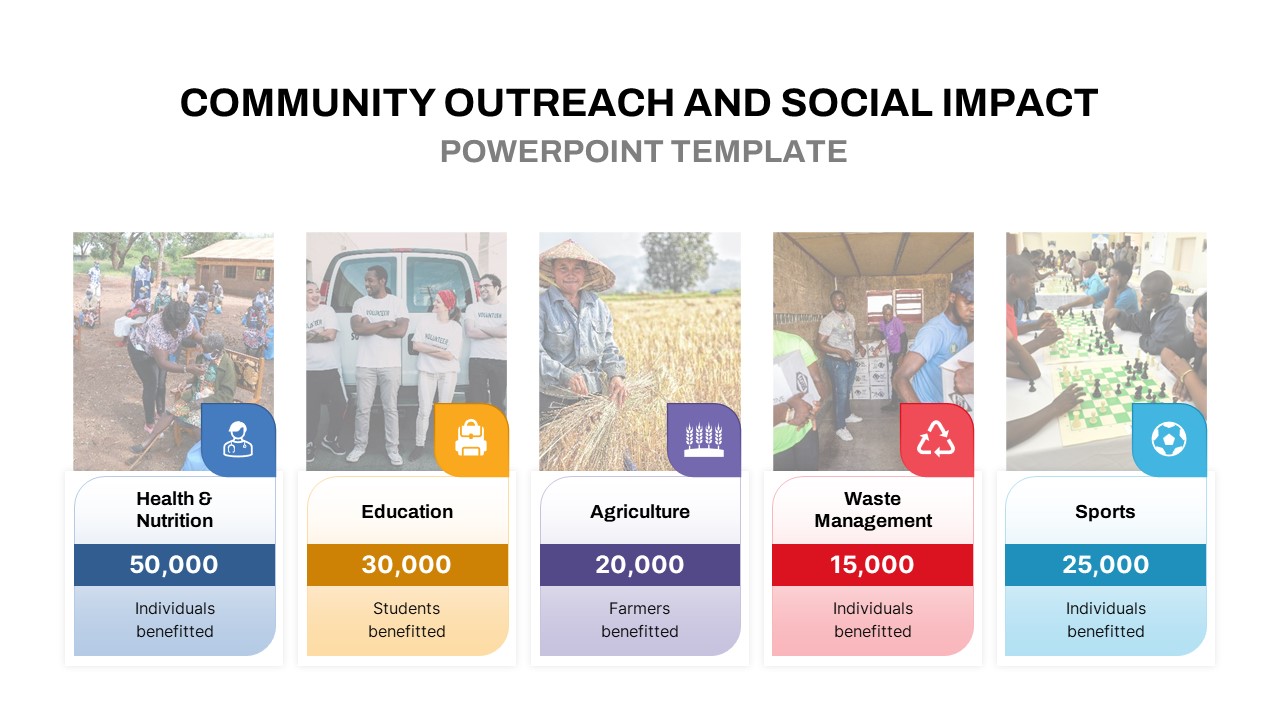
Community Outreach Impact Metrics Template for PowerPoint & Google Slides
Accomplishment
DevOps KPI Dashboard Performance Metrics Template for PowerPoint & Google Slides
Software Development
Purchasing KPI Metrics Dashboard Template for PowerPoint & Google Slides
Business Report
Financial Snapshot & Metrics Overview Template for PowerPoint & Google Slides
Finance
Procurement KPI Dashboard & Metrics Template for PowerPoint & Google Slides
Business Report
Market Validation Metrics Overview Template for PowerPoint & Google Slides
Business
Employee Performance Metrics Dashboard Template for PowerPoint & Google Slides
Employee Performance
Pirate Metrics AARRR Funnel Framework Template for PowerPoint & Google Slides
Funnel
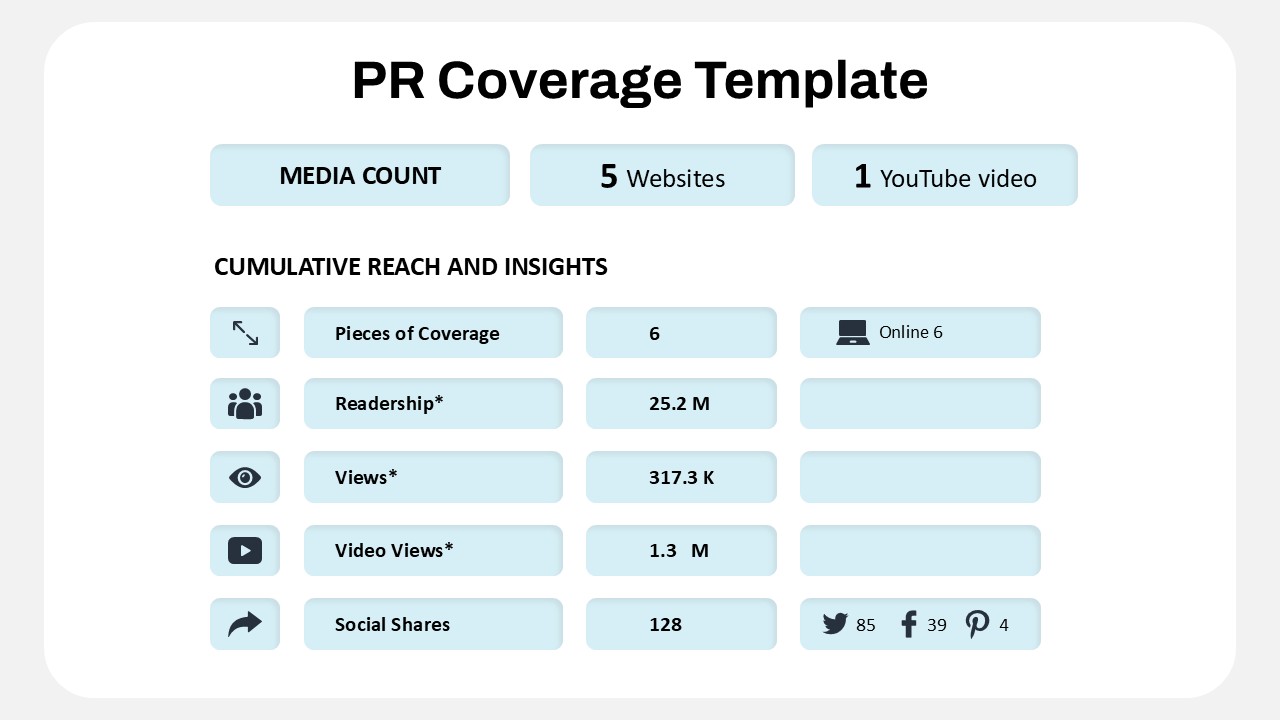
Public Relations Coverage Metrics Template for PowerPoint & Google Slides
Business Report
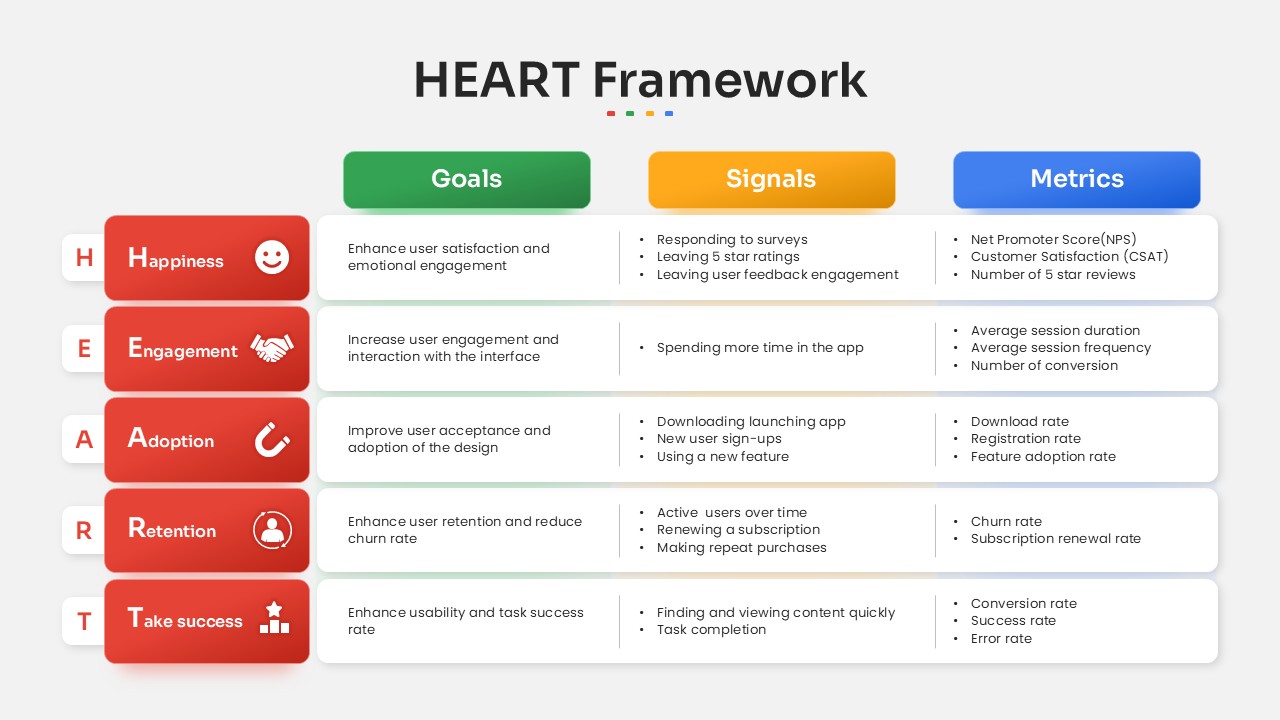
HEART Framework Goals, Signals & Metrics Template for PowerPoint & Google Slides
Process
Five 3D Growth Arrow Infographic Slide Template for PowerPoint & Google Slides
Arrow
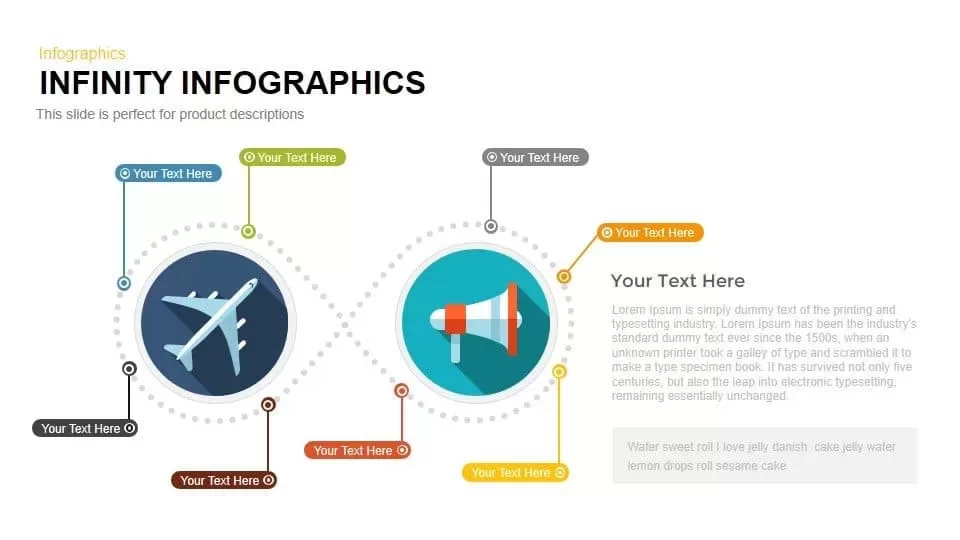
Looped Infinity Infographic Slide Template for PowerPoint & Google Slides
Process
Key Metaphor Infographic Slide Template for PowerPoint & Google Slides
Process
Customer Feedback Infographic Slide Template for PowerPoint & Google Slides
Customer Experience
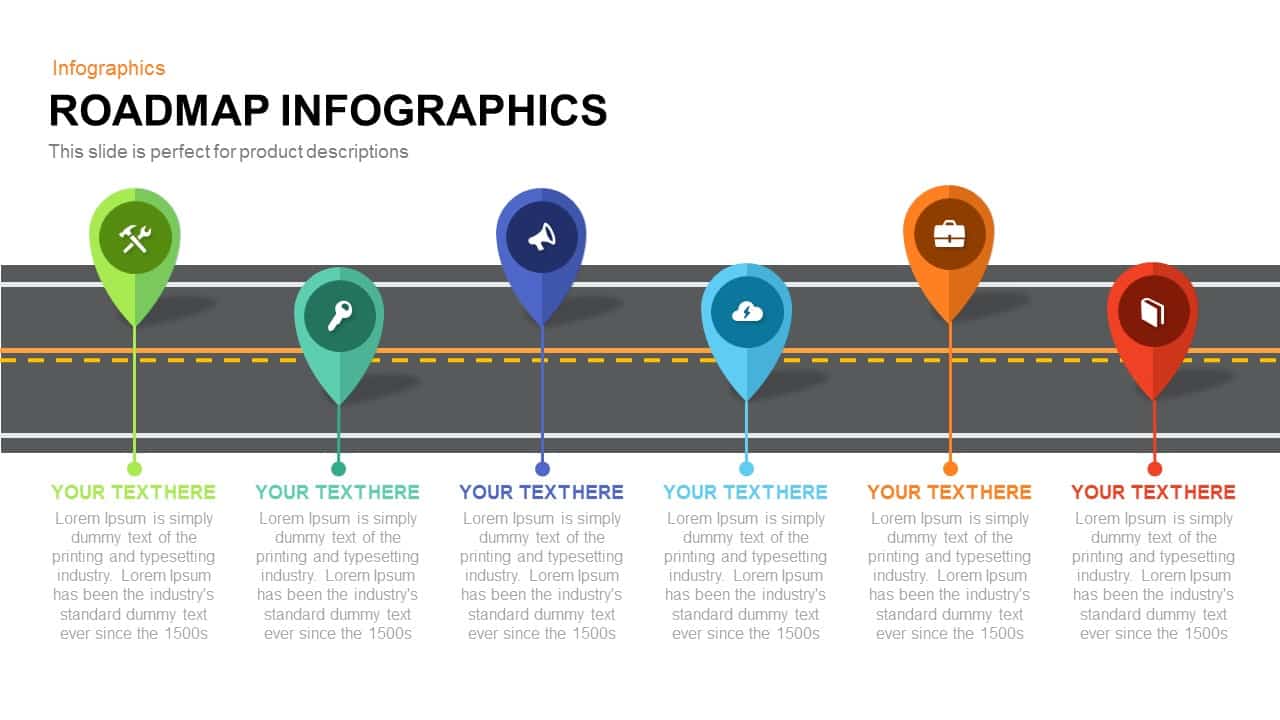
Roadmap Infographic Timeline Slide Template for PowerPoint & Google Slides
Roadmap
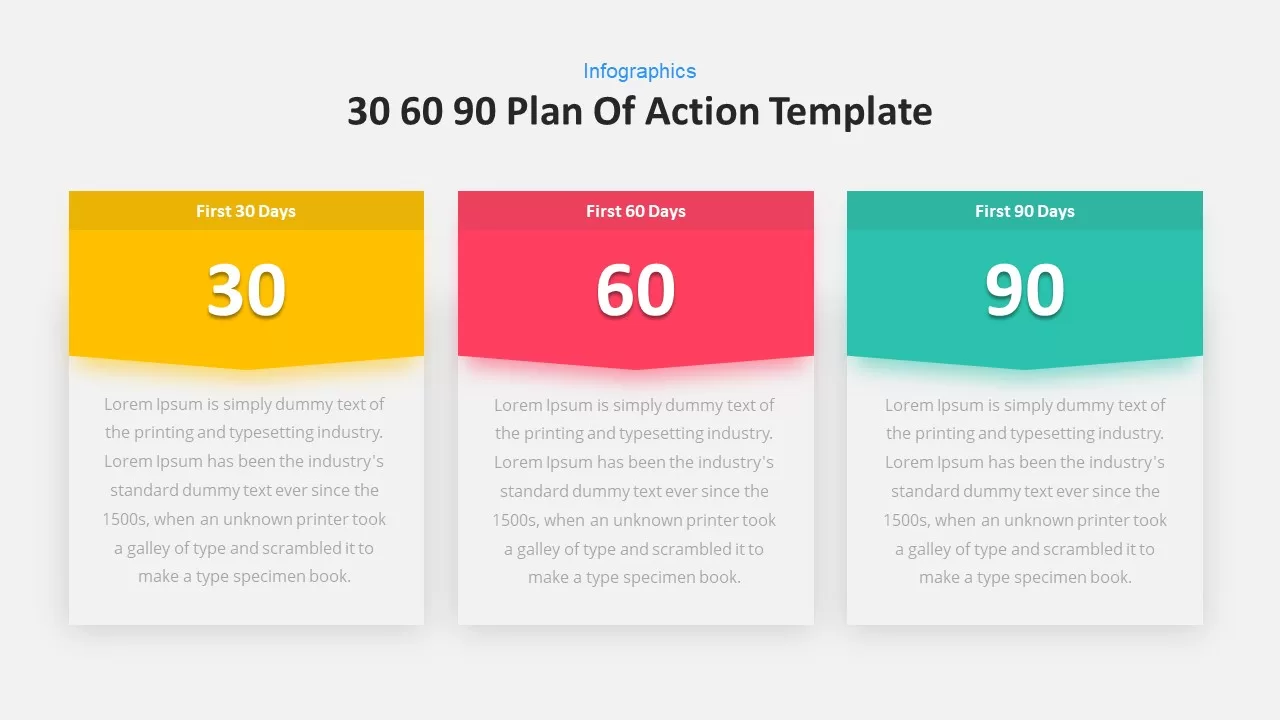
30 60 90-Day Plan Infographic Slide Template for PowerPoint & Google Slides
Business
Arrow Timeline Infographic Slide Template for PowerPoint & Google Slides
Timeline
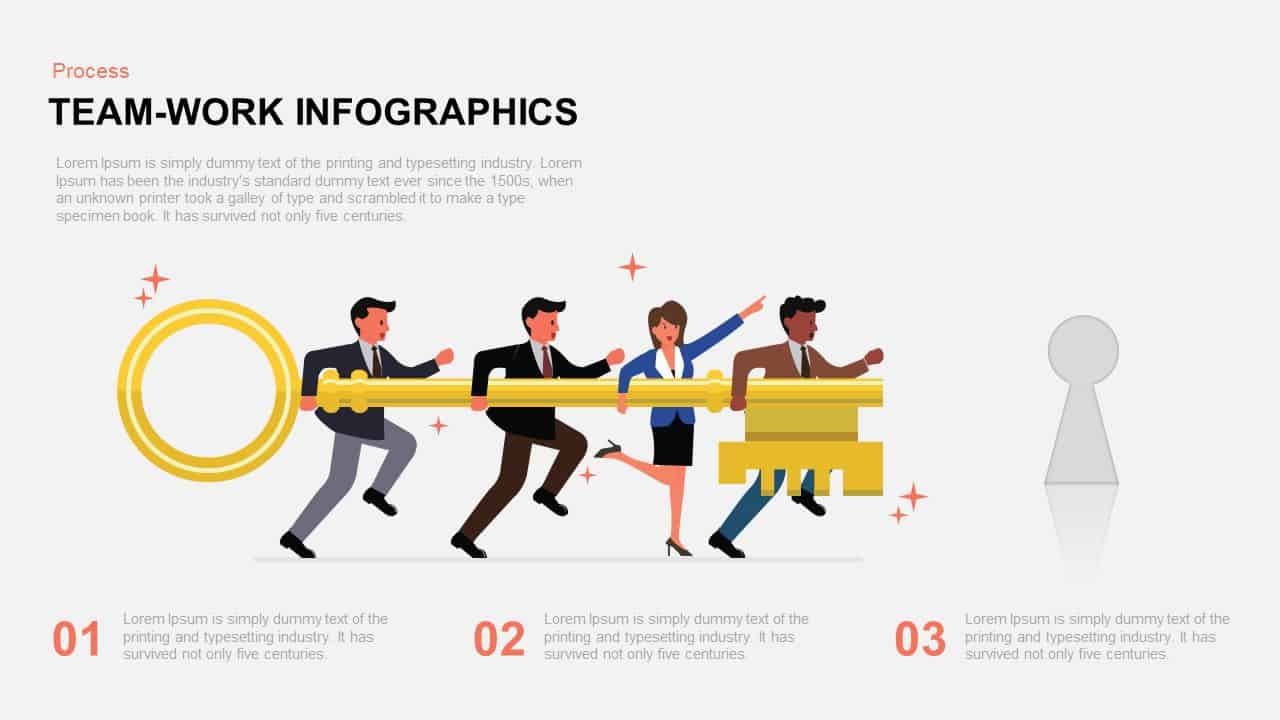
Teamwork Key Infographic Slide Template for PowerPoint & Google Slides
Process
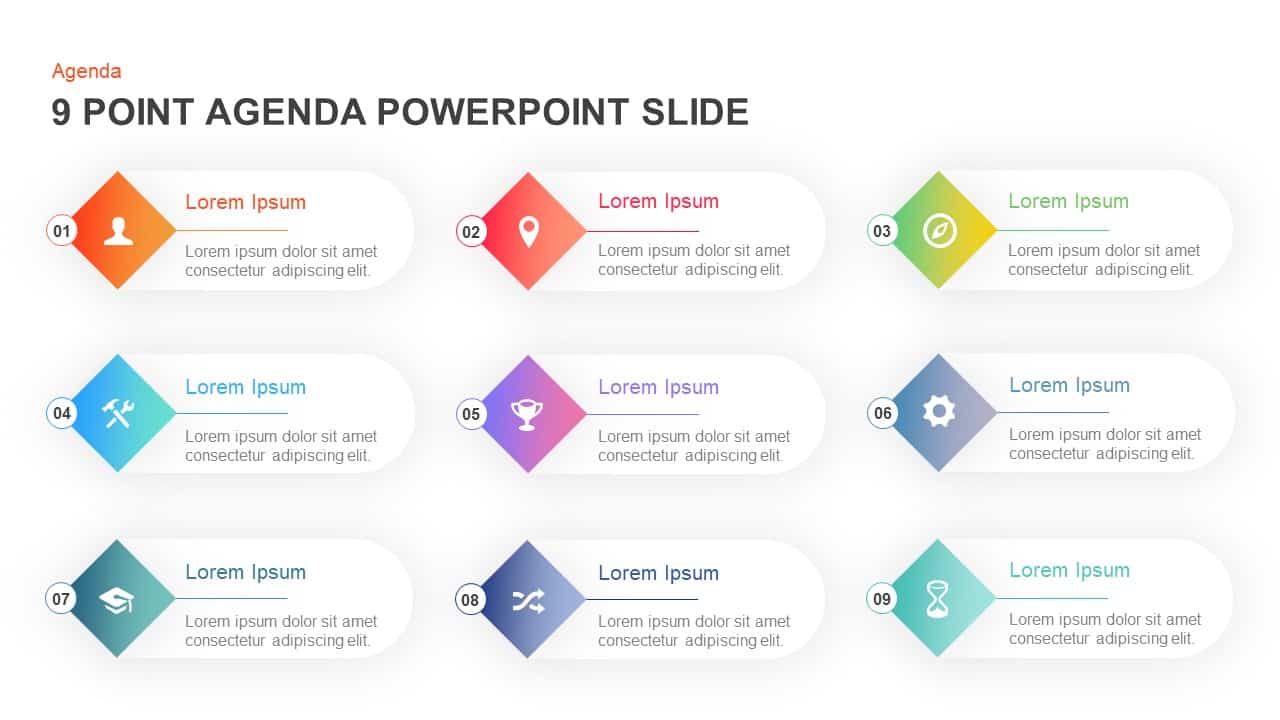
Nine-Point Agenda Infographic Slide Template for PowerPoint & Google Slides
Agenda
Five-Step Growth Infographic Slide Template for PowerPoint & Google Slides
Process
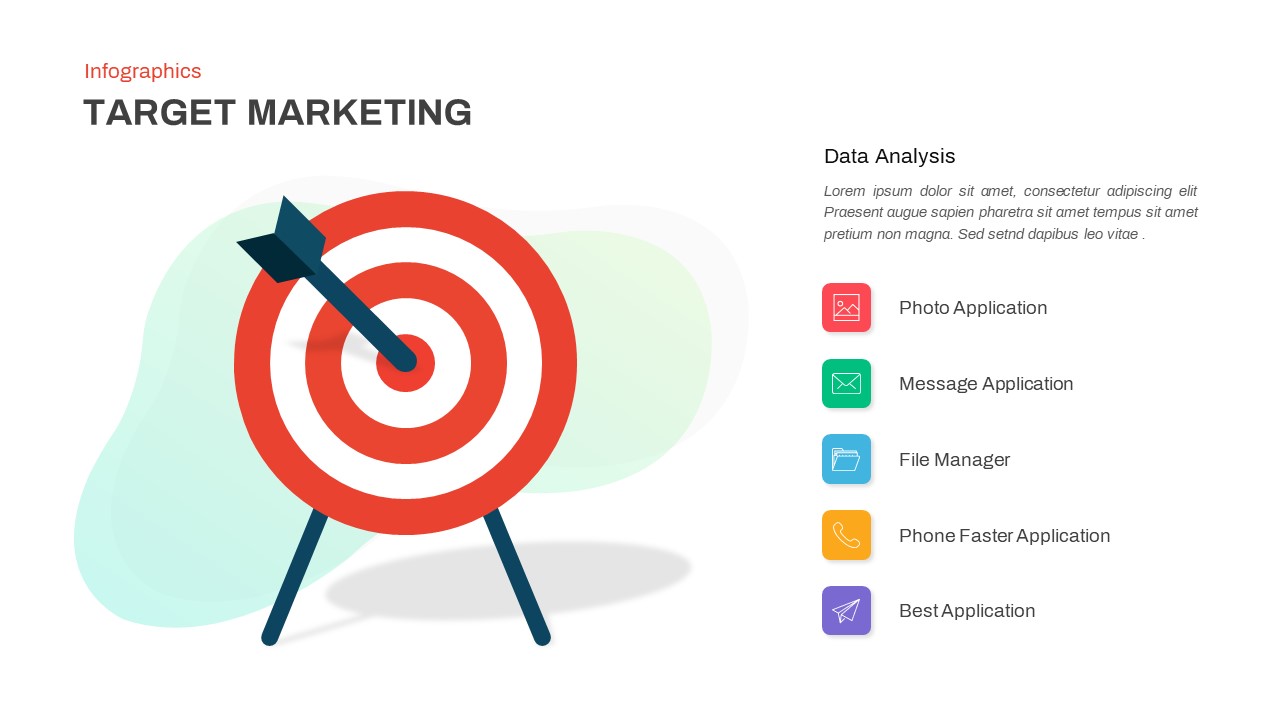
Target Marketing Infographic Slide Pack Template for PowerPoint & Google Slides
Infographics
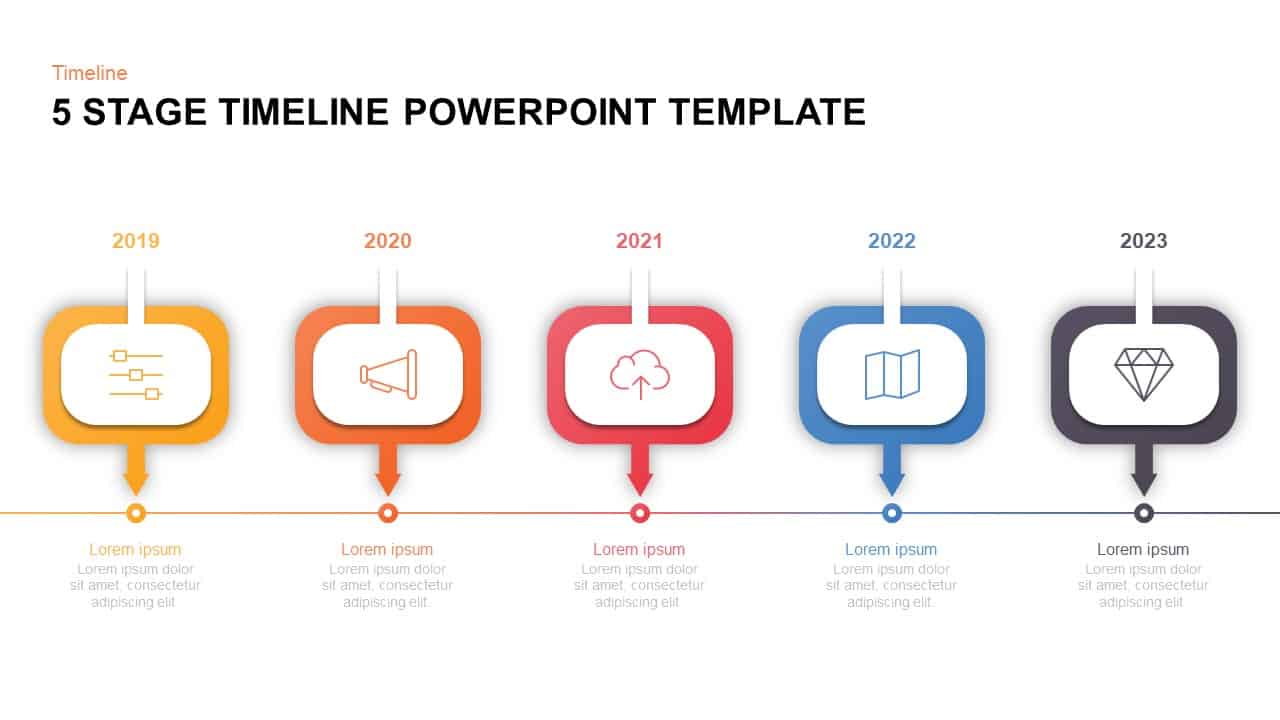
5 Stage Timeline Infographic Slide Template for PowerPoint & Google Slides
Timeline
Two-Column Comparison Infographic Slide Template for PowerPoint & Google Slides
Comparison

Team Achievements Infographic Slide Template for PowerPoint & Google Slides
Accomplishment
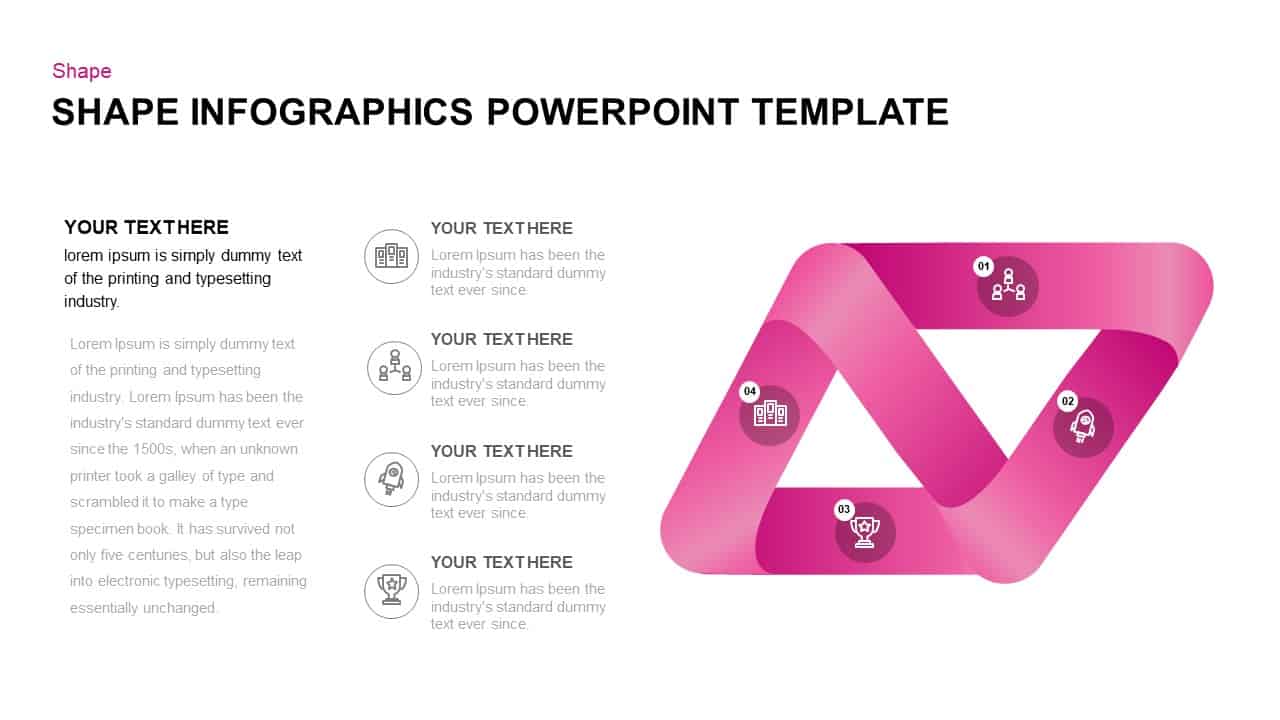
Shape Loop Four-Step Infographic Slide Template for PowerPoint & Google Slides
Process
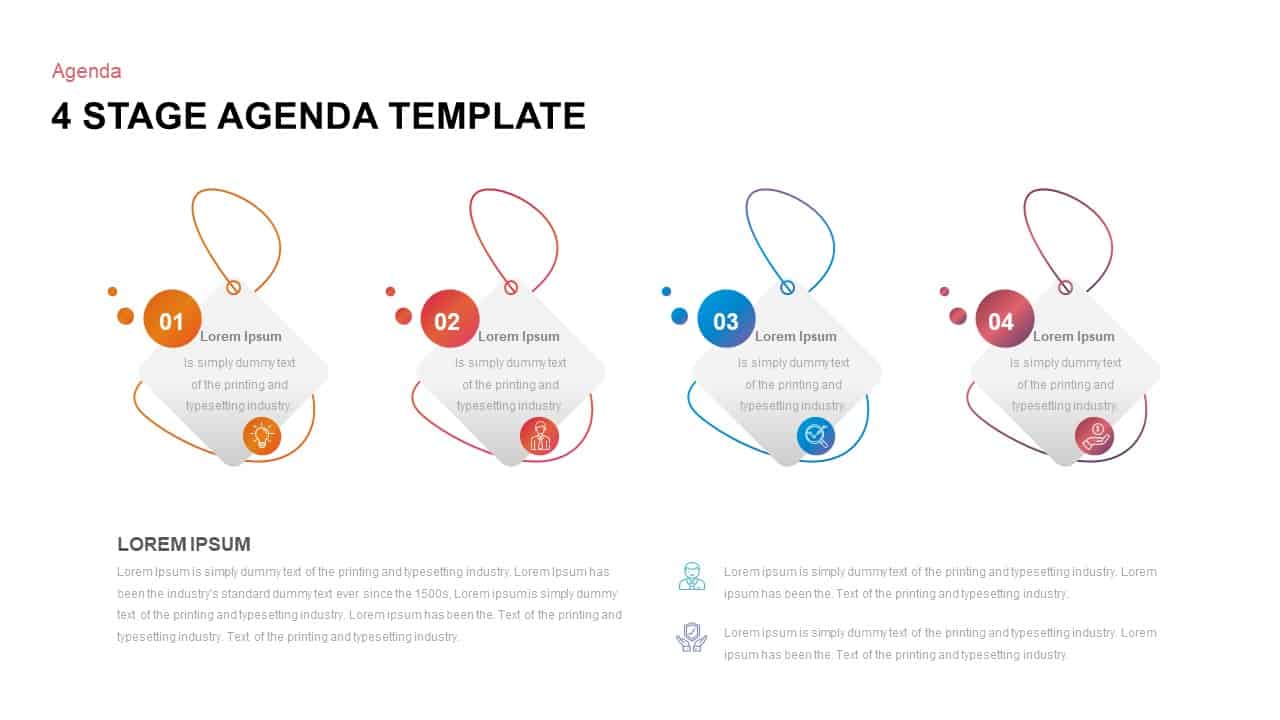
Four-Stage Agenda Infographic Slide Template for PowerPoint & Google Slides
Agenda
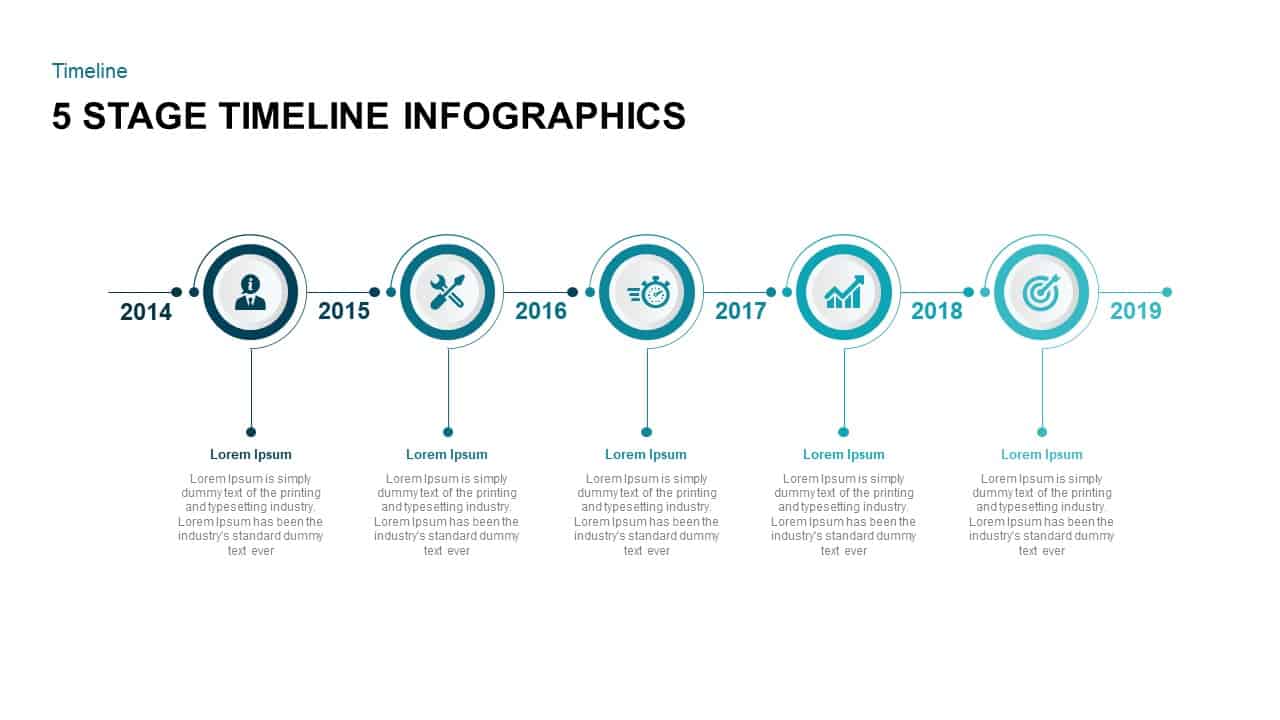
5-Stage Timeline Infographic Slide Template for PowerPoint & Google Slides
Timeline
Four Step Process Infographic Slide Template for PowerPoint & Google Slides
Process
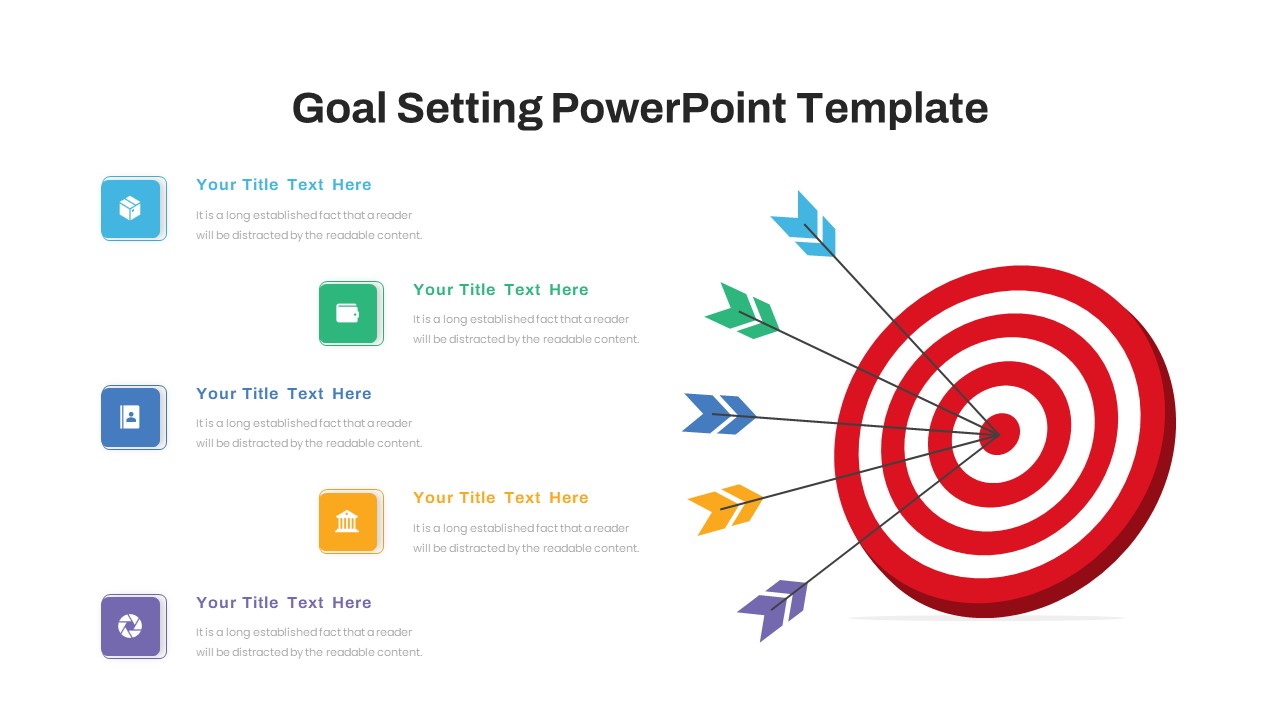
Target Goals Infographic Slide Template for PowerPoint & Google Slides
Goals
Mind Map Infographic Slide Template for PowerPoint & Google Slides
Mind Maps

Bulb Idea Concept Infographic Slide Template for PowerPoint & Google Slides
Process
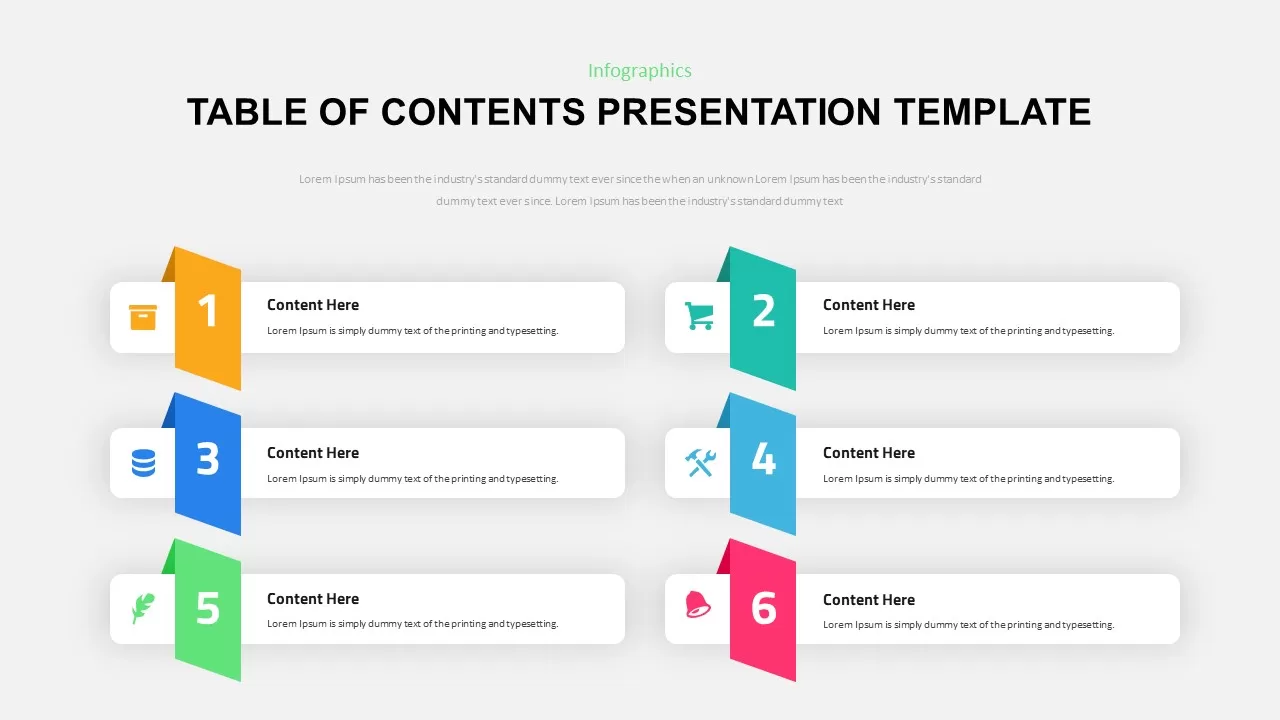
Table of Contents Infographic Slide template for PowerPoint & Google Slides
Agenda
Multi-Style Flow Infographic Slide template for PowerPoint & Google Slides
Process
North America Map Infographic Slide Template for PowerPoint & Google Slides
World Maps
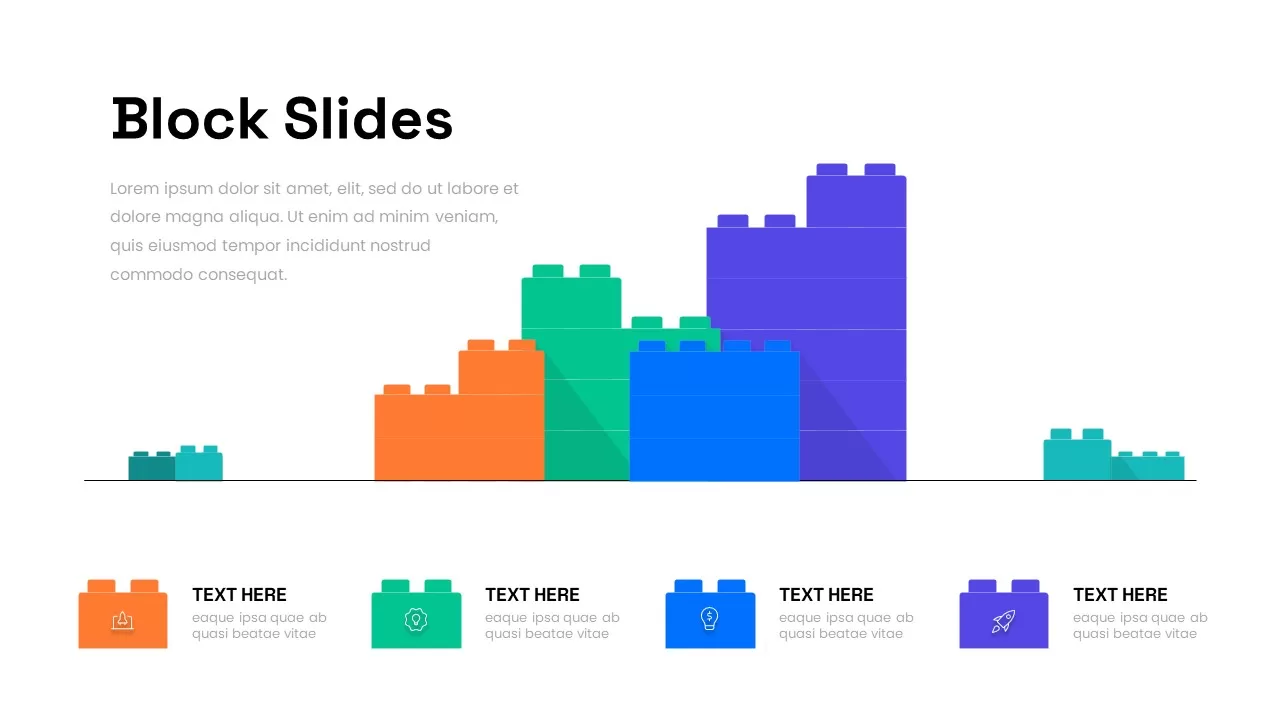
Modular Block Infographic Slide Template for PowerPoint & Google Slides
Infographics
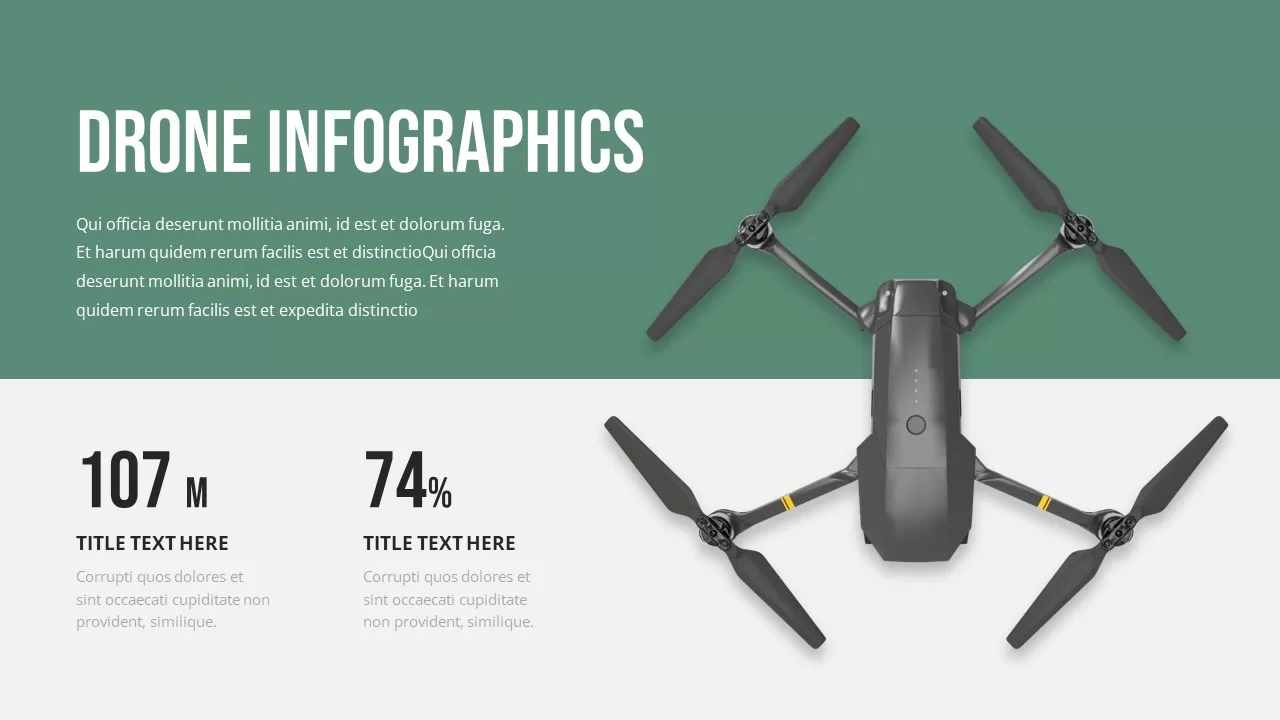
Professional Drone Infographic Slide Template for PowerPoint & Google Slides
Infographics
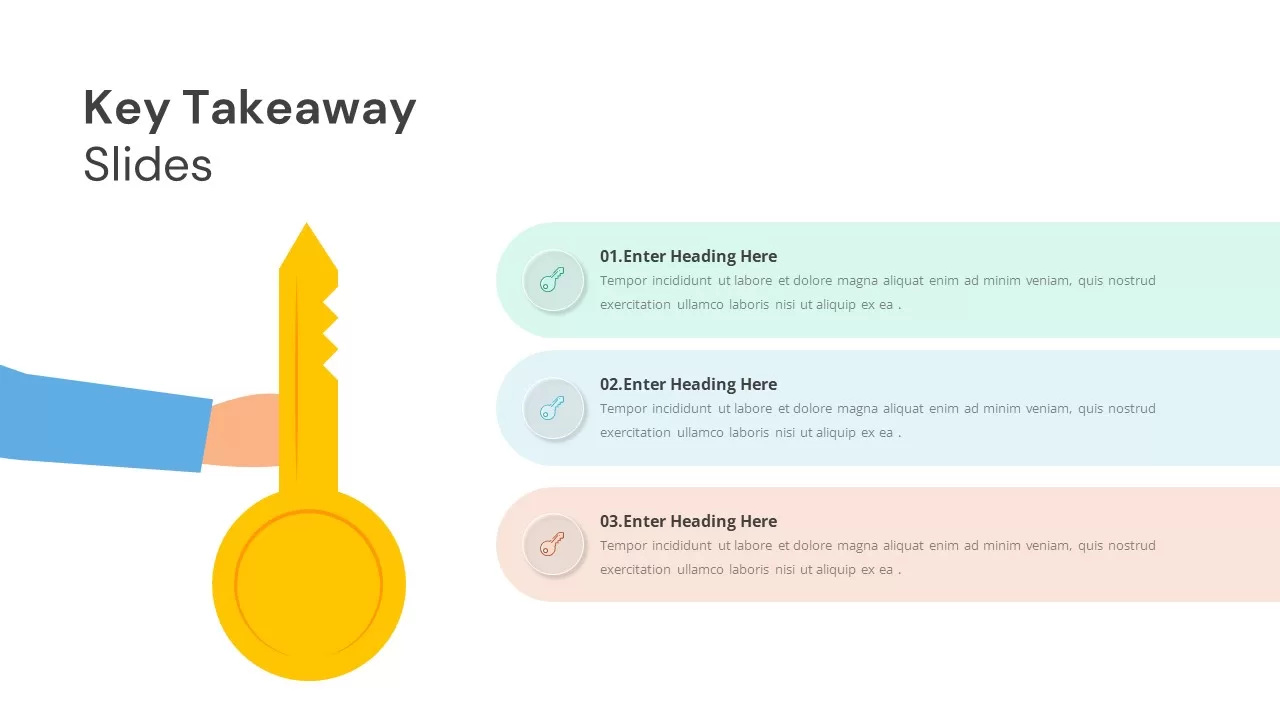
Key Takeaway Slide Infographic Template for PowerPoint & Google Slides
Process
Key Takeaway Infographic Slide Deck Template for PowerPoint & Google Slides
Process
Key Takeaway Keyhole Infographic Slide Template for PowerPoint & Google Slides
Process
Animated 3D Dice Infographic Slide Template for PowerPoint & Google Slides
Process
Core Values Infographic Slide Template for PowerPoint & Google Slides
Comparison
8-Bell Curve Infographic Slide Template for PowerPoint & Google Slides
Comparison Chart
Bow and Arrow Goal Infographic Slide Template for PowerPoint & Google Slides
Goals
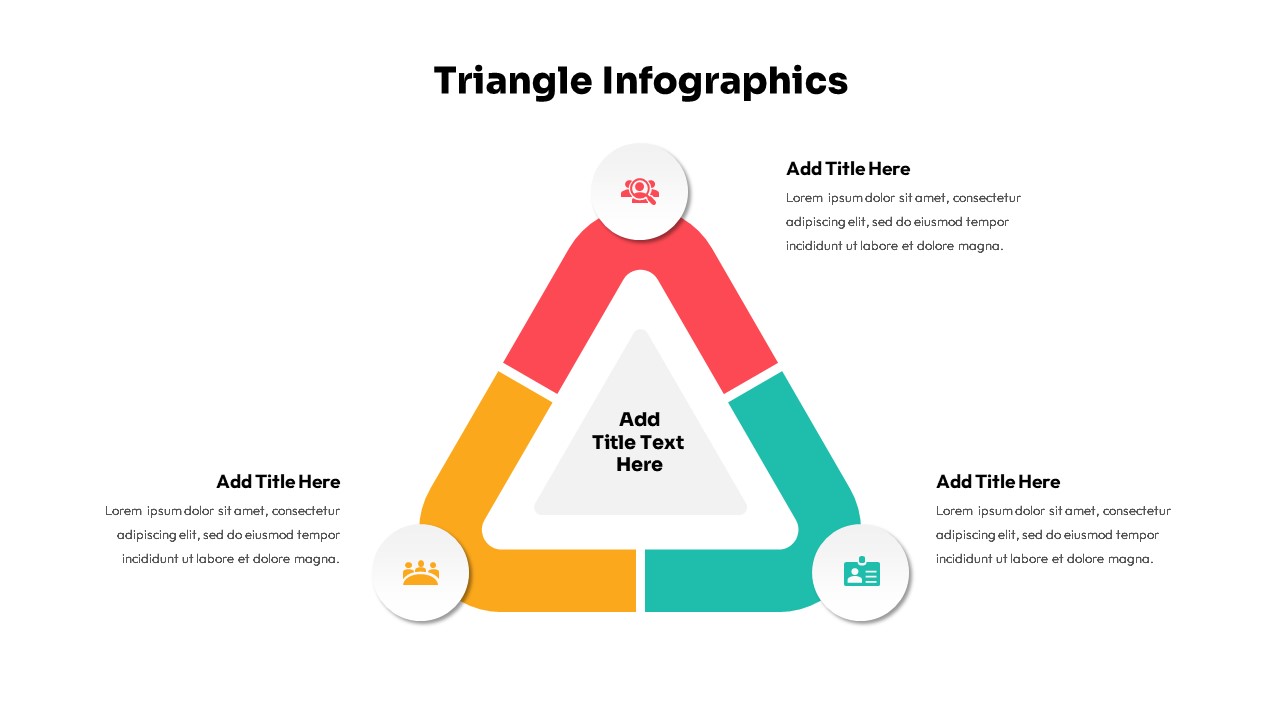
Triangle Infographic Slide Collection Template for PowerPoint & Google Slides
Decks

Free Colorful Infographic Slide Pack Template for PowerPoint & Google Slides
Roadmap
Free
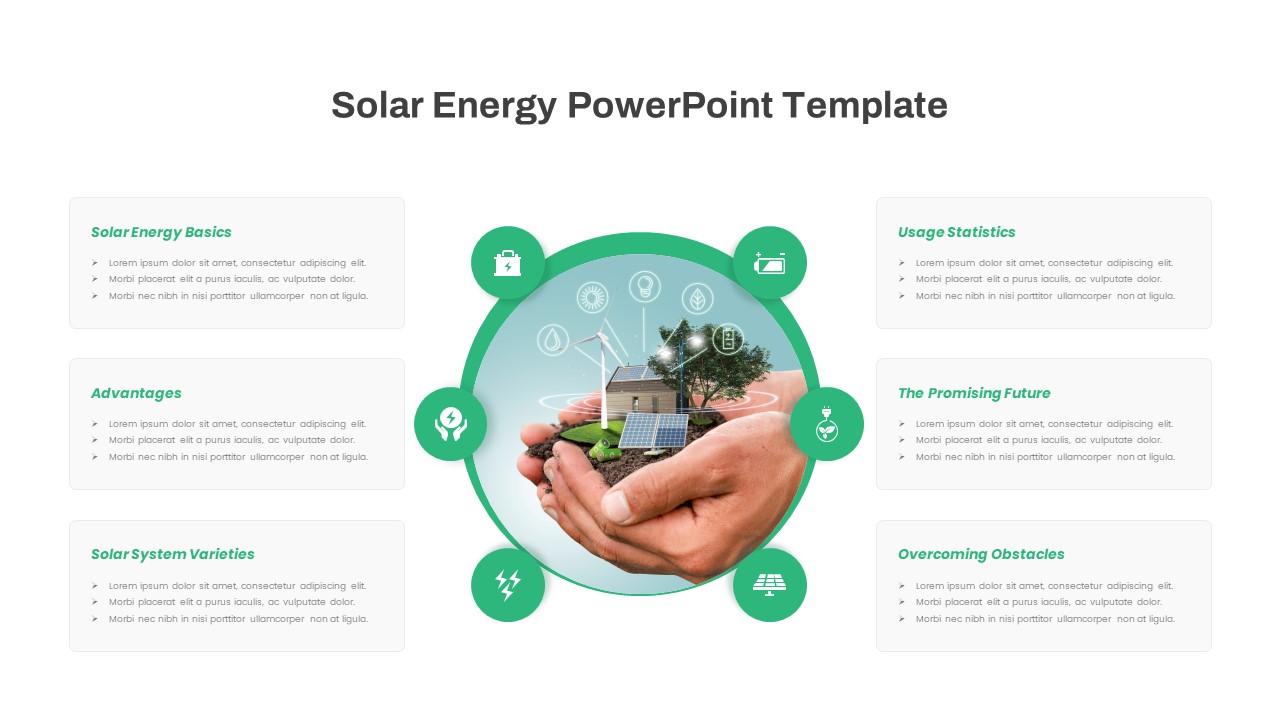
Free Solar Energy Infographic Slide Template for PowerPoint & Google Slides
Circular
Free
Free Multi-Step Funnel Infographic Slide Pack Template for PowerPoint & Google Slides
Funnel
Free
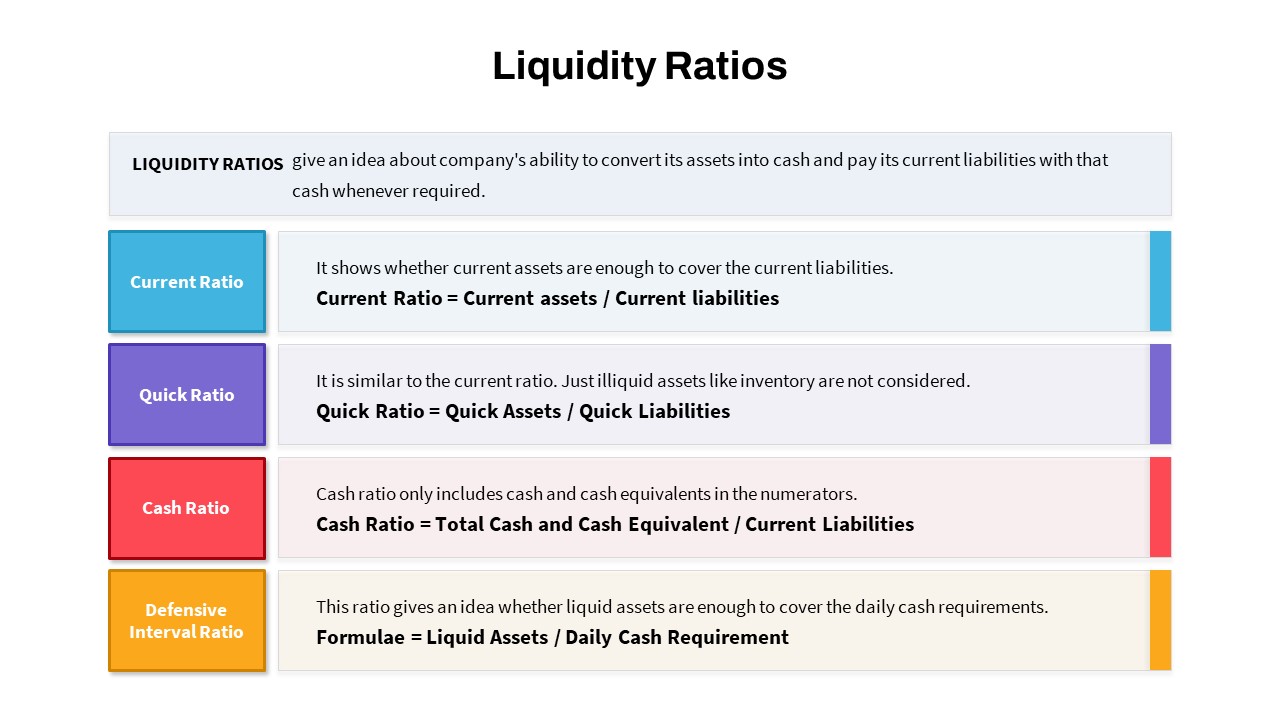
Liquidity Ratios Infographic Slide Template for PowerPoint & Google Slides
Finance
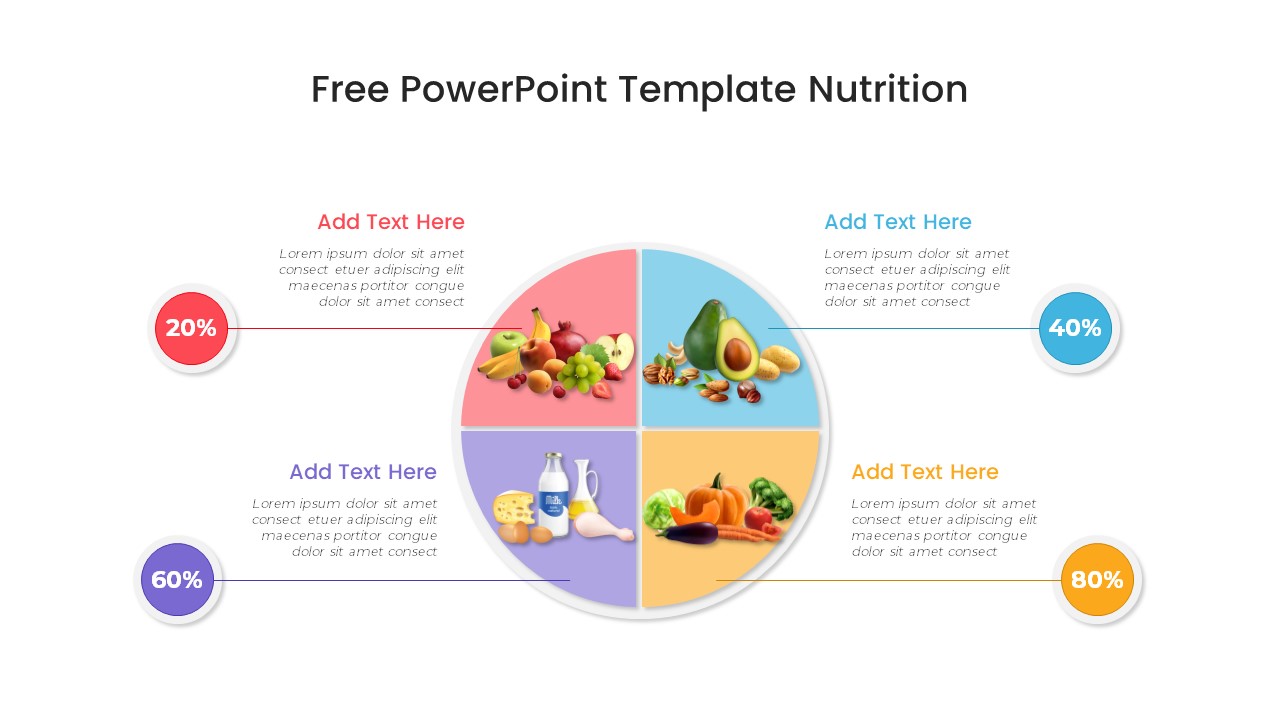
Free Nutrition Infographic Slide Template for PowerPoint & Google Slides
Health
Free
Free Goal Setting Target Infographic Slide Template for PowerPoint & Google Slides
Goals
Free
Editable Ireland Map Infographic Slide Template for PowerPoint & Google Slides
World Maps
Free
HIV AIDS Infographic Diagram Slide Deck Template for PowerPoint & Google Slides
Graphics
Free Online Shopping 3-Slide Infographic Template for PowerPoint & Google Slides
Digital Marketing
Free
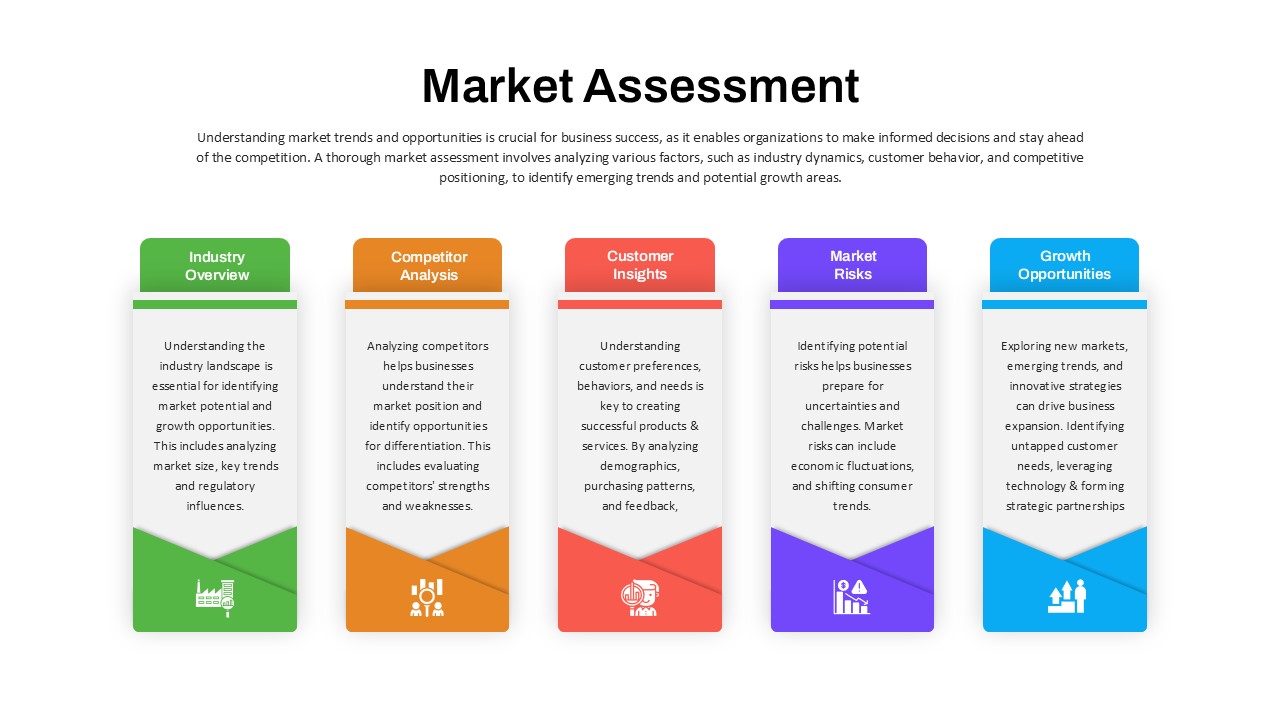
Market Assessment Infographic Slide Template for PowerPoint & Google Slides
Process
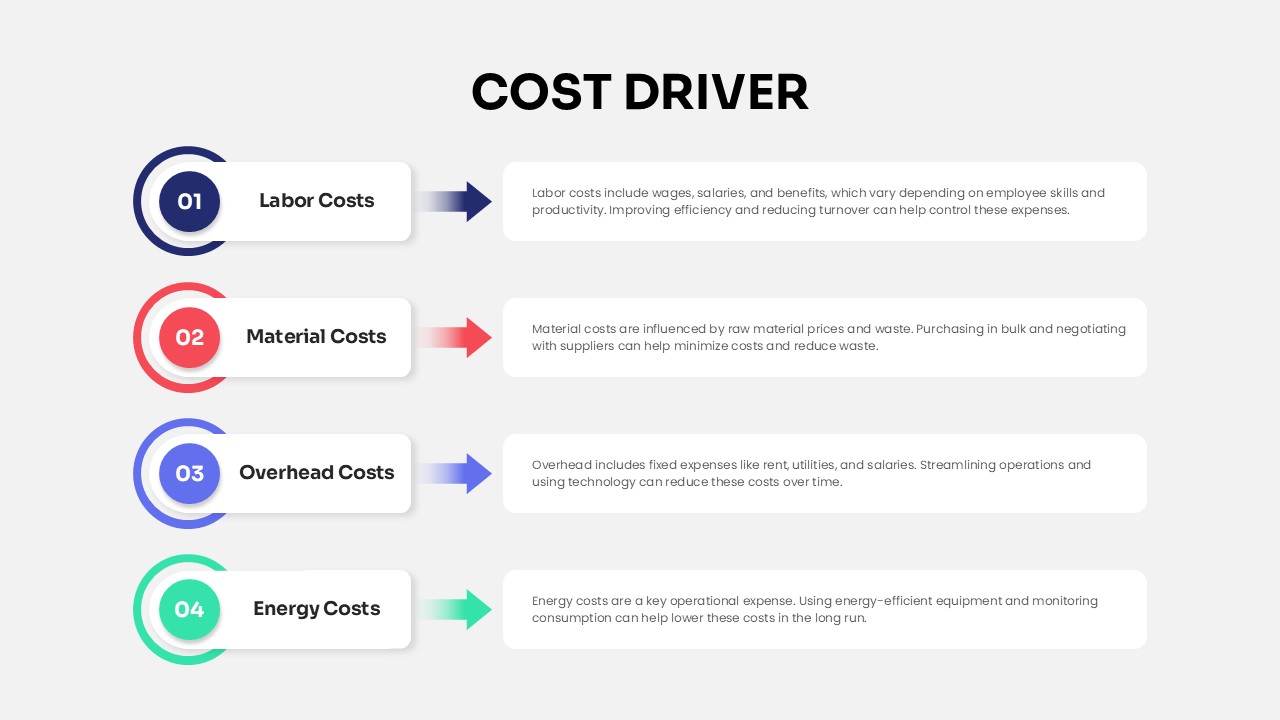
Cost Driver Infographic Slide Pack Template for PowerPoint & Google Slides
Process
Community Building Infographic Slide Template for PowerPoint & Google Slides
Leadership
Pros and Cons Infographic Slide Pack Template for PowerPoint & Google Slides
Comparison
SWOT Analysis Infographic Slide for PowerPoint & Google Slides
SWOT
Colorful Concentric Circles Infographic Slide for PowerPoint & Google Slides
Process
Free Infographic Statistics Dashboard Slide for PowerPoint & Google Slides
Bar/Column
Free
Kidney Disease Infographic Slide for PowerPoint & Google Slides
Health
Google Ads Optimization & Performance Infographic Template for PowerPoint & Google Slides
Digital Marketing
SQ3R Study Strategy Infographic Slides Template for PowerPoint & Google Slides
Business Strategy
Six Double Diamond Infographic Slides Template for PowerPoint & Google Slides
Process

Sales Process Infographic Slides Pack Template for PowerPoint & Google Slides
Process
Casino/Poker Chips Infographic Slides template for PowerPoint & Google Slides
Business Strategy
Agenda Infographic Pack of 2 Slides Template for PowerPoint & Google Slides
Agenda
Quad Chart Infographic Pack of 8 Slides Template for PowerPoint & Google Slides
Comparison Chart
Four Options Infographic Slides Template for PowerPoint & Google Slides
Comparison
Game Plan Infographic Slides Pack Template for PowerPoint & Google Slides
Infographics
Teamwork PowerPoint Infographic Template for PowerPoint & Google Slides
Leadership
Kite Infographic PowerPoint Template for PowerPoint & Google Slides
Process
Cladogram Infographic Di Template for PowerPoint & Google Slides Template
Decision Tree
Workflow PowerPoint Process infographic for PowerPoint & Google Slides
Process
Free Infographic Deck PowerPoint Pack for PowerPoint & Google Slides
Infographics
Free
Five-Year Gradient Timeline Infographic Template for PowerPoint & Google Slides
Timeline
Free Global Warming Infographic Comparison Template for PowerPoint & Google Slides
Comparison Chart
Free