IQ Scale Analysis Diagram template for PowerPoint & Google Slides

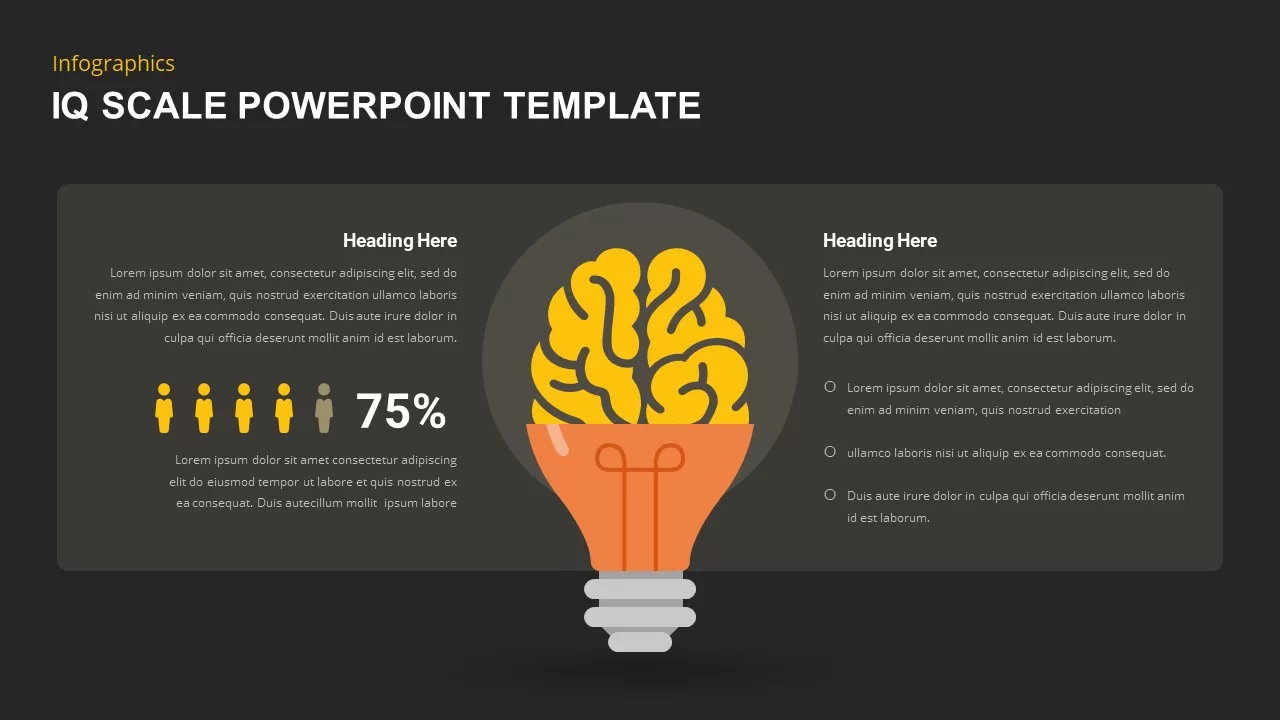
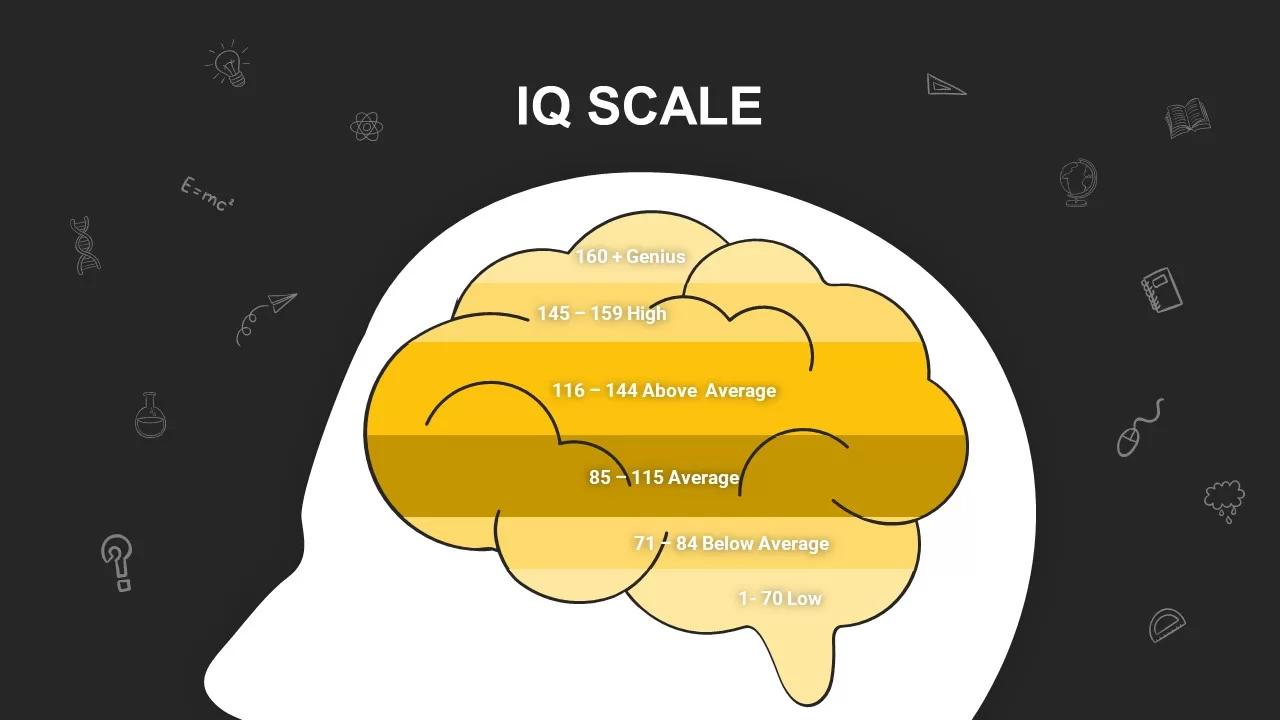
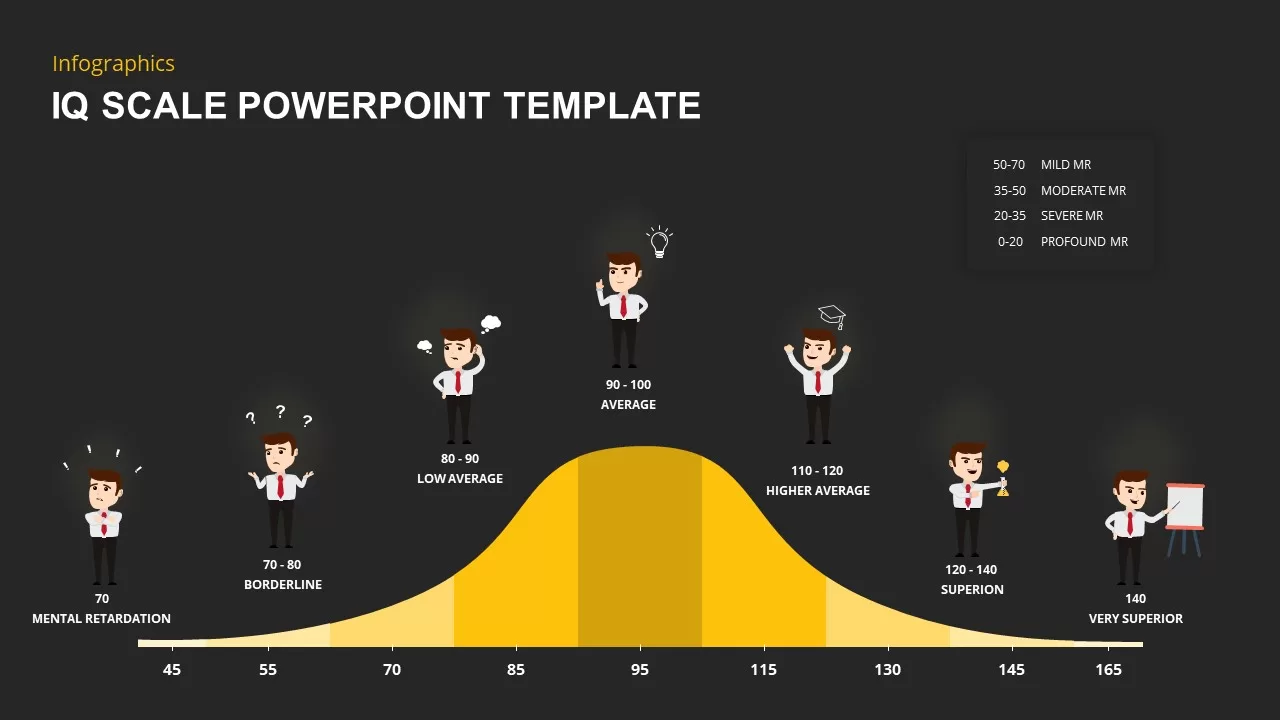

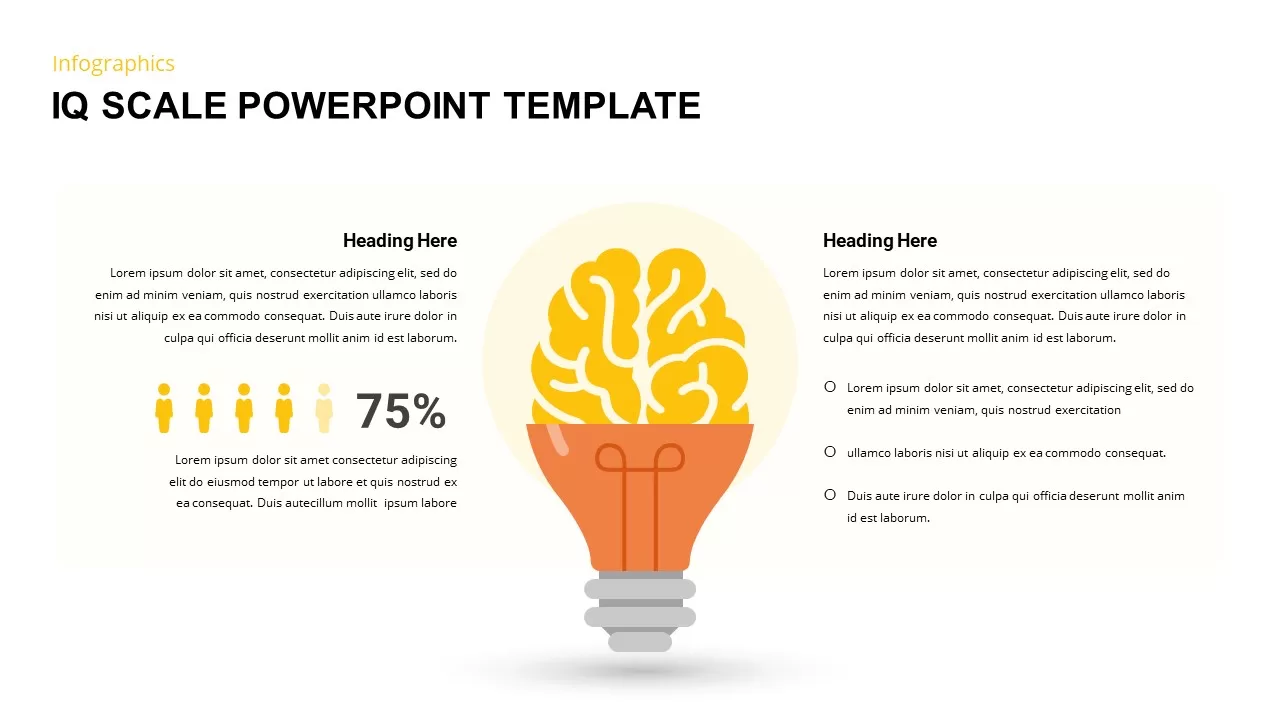
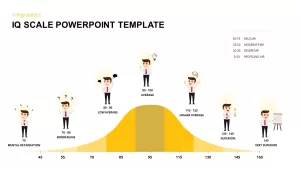
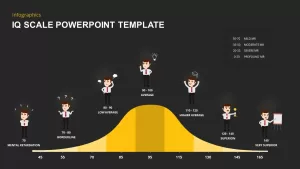
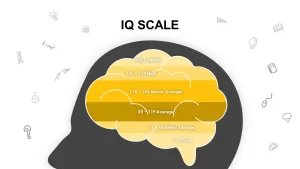
This visually engaging IQ Scale slide presents a clear and colorful representation of IQ levels, ranging from “Mental Retardation” to “Very Superior.” The template features a bell curve with icons representing individuals at various IQ levels, from low average to very superior. The gradient yellow scale highlights each IQ range, and the playful character illustrations add a fun, relatable touch to the data.
Ideal for educational, psychological, or HR presentations, this slide helps communicate the differences between various IQ levels, making it easier for the audience to grasp the concept of intellectual capacity distribution. The clear divisions on the scale and the icons make it easy to explain the various ranges, including borderline, low average, average, higher average, superior, and very superior IQ levels.
Fully customizable, this template allows you to adjust the text, icons, and colors to fit your specific content or branding. Optimized for both PowerPoint and Google Slides, it ensures smooth integration into your presentation deck with no loss in quality, making it a great tool for academic discussions, training sessions, or even team workshops on cognitive abilities.
Who is it for
This slide is perfect for educators, psychologists, HR professionals, or anyone presenting information on intelligence testing, cognitive abilities, or educational performance. It’s also useful for motivational speakers, recruitment professionals, or team leaders discussing intellectual potential and development.
Other Uses
Aside from IQ testing and analysis, this slide can be adapted for discussions about cognitive skills, performance evaluations, or other metrics that involve ranking or classification. It’s versatile enough to be used in educational settings, corporate training, or personal development sessions.
Login to download this file

Item ID
SB02053
Related Templates

Emoji Scale PowerPoint Diagram for PowerPoint & Google Slides
Infographics

Scale Metaphor Metrics Comparison Template for PowerPoint & Google Slides
Charts
Mustard and Navy Balance Scale Metaphor Template for PowerPoint & Google Slides
Comparison
Balance Scale Visualization Infographic Template for PowerPoint & Google Slides
Comparison
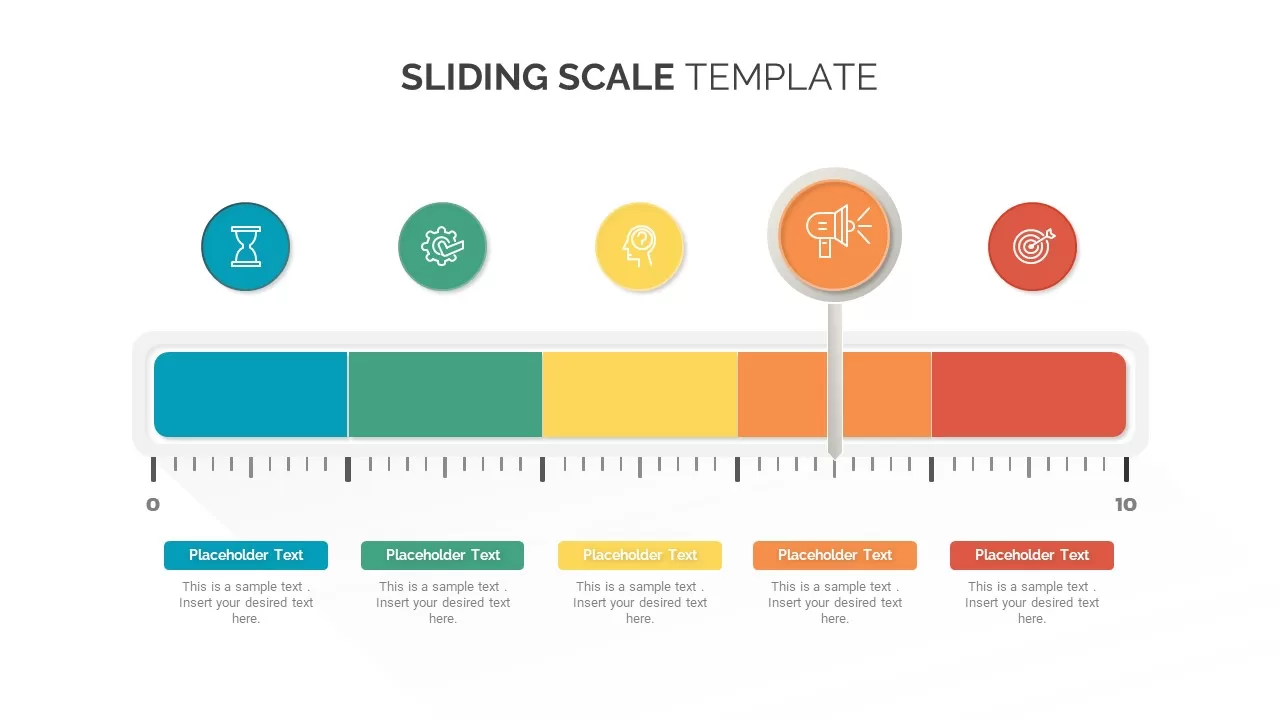
Sliding Scale template for PowerPoint & Google Slides
Business
Adam’s Equity Theory Scale Comparison Template for PowerPoint & Google Slides
Comparison
Economies of Scale Cost Curve Comparison Template for PowerPoint & Google Slides
Comparison Chart
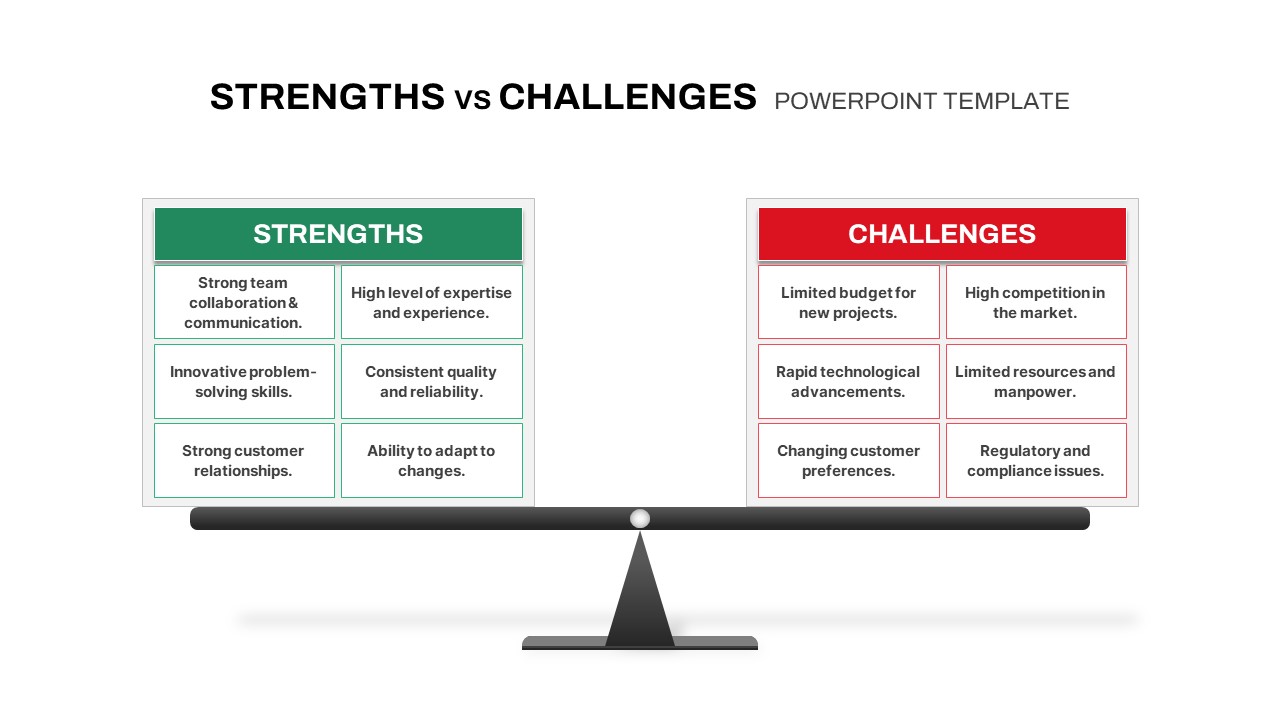
Strengths vs Challenges Weighing Scale Template for PowerPoint & Google Slides
Opportunities Challenges
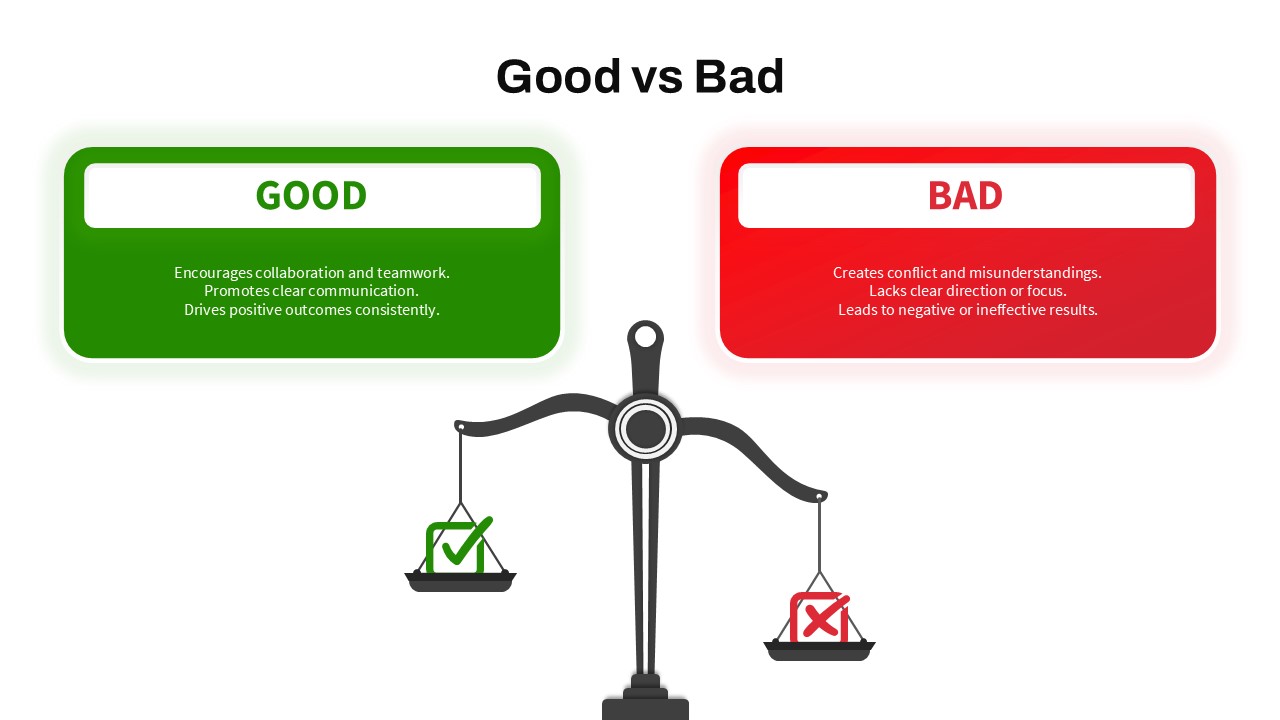
Good vs Bad Comparison with Scale Template for PowerPoint & Google Slides
Comparison
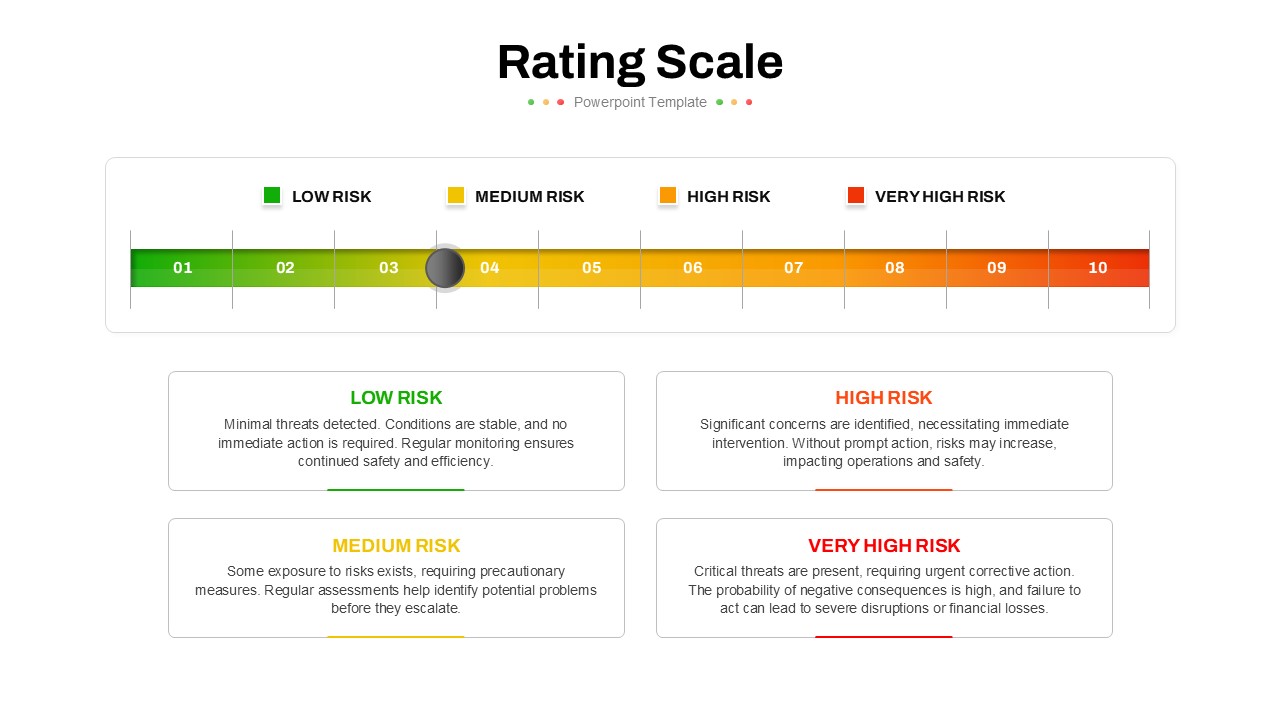
Five-Point Rating Scale Feedback Template for PowerPoint & Google Slides
Employee Performance
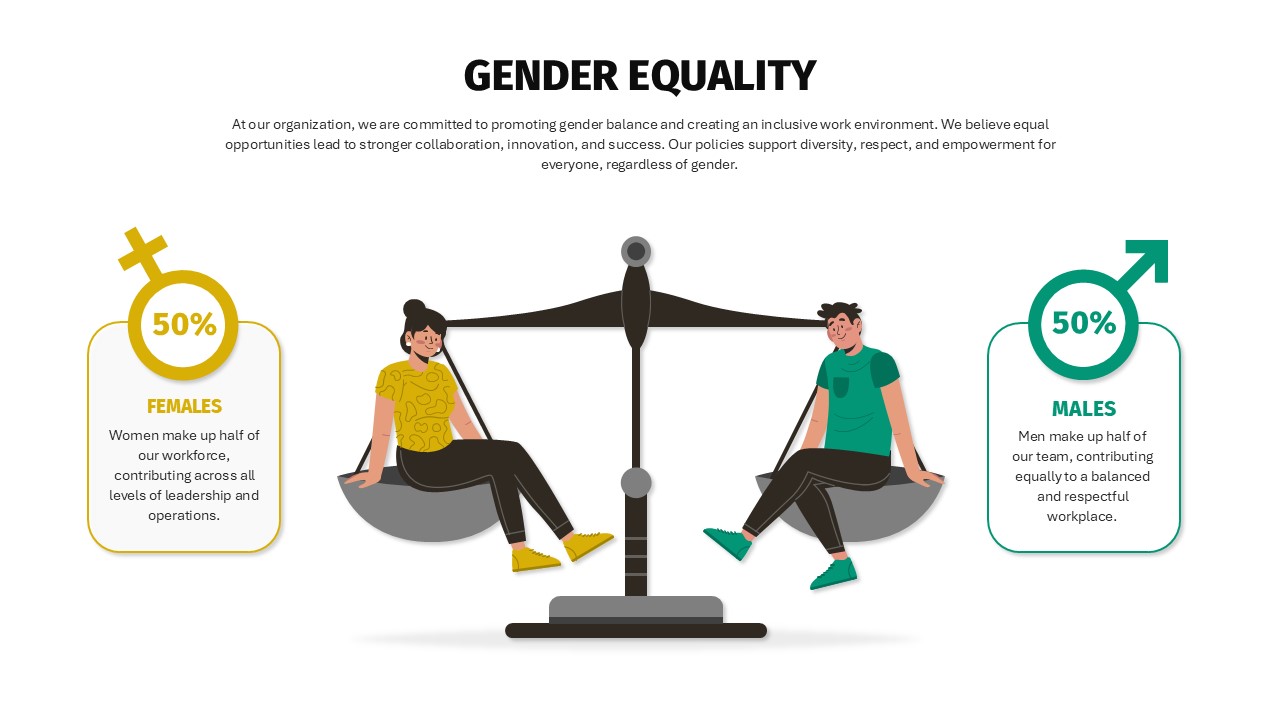
Balanced Gender Equality Scale Infographic Template for PowerPoint & Google Slides
Comparison
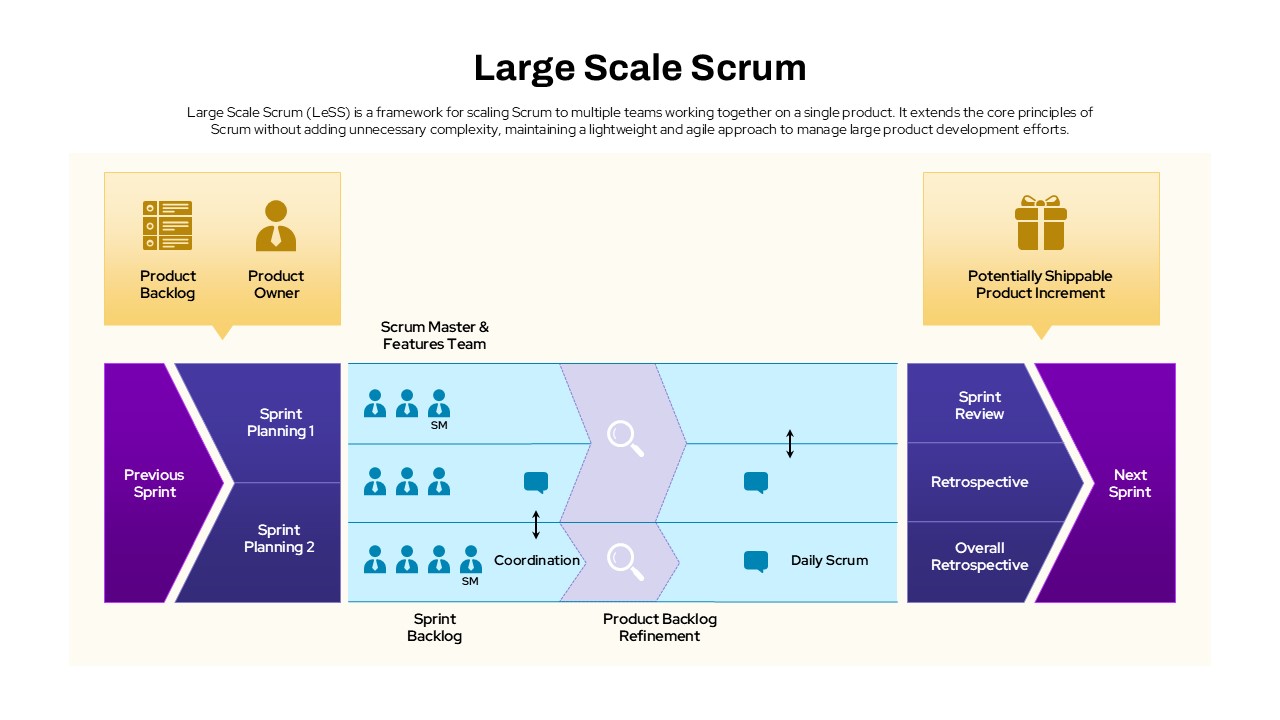
Large Scale Scrum Framework Process Template for PowerPoint & Google Slides
Scrum
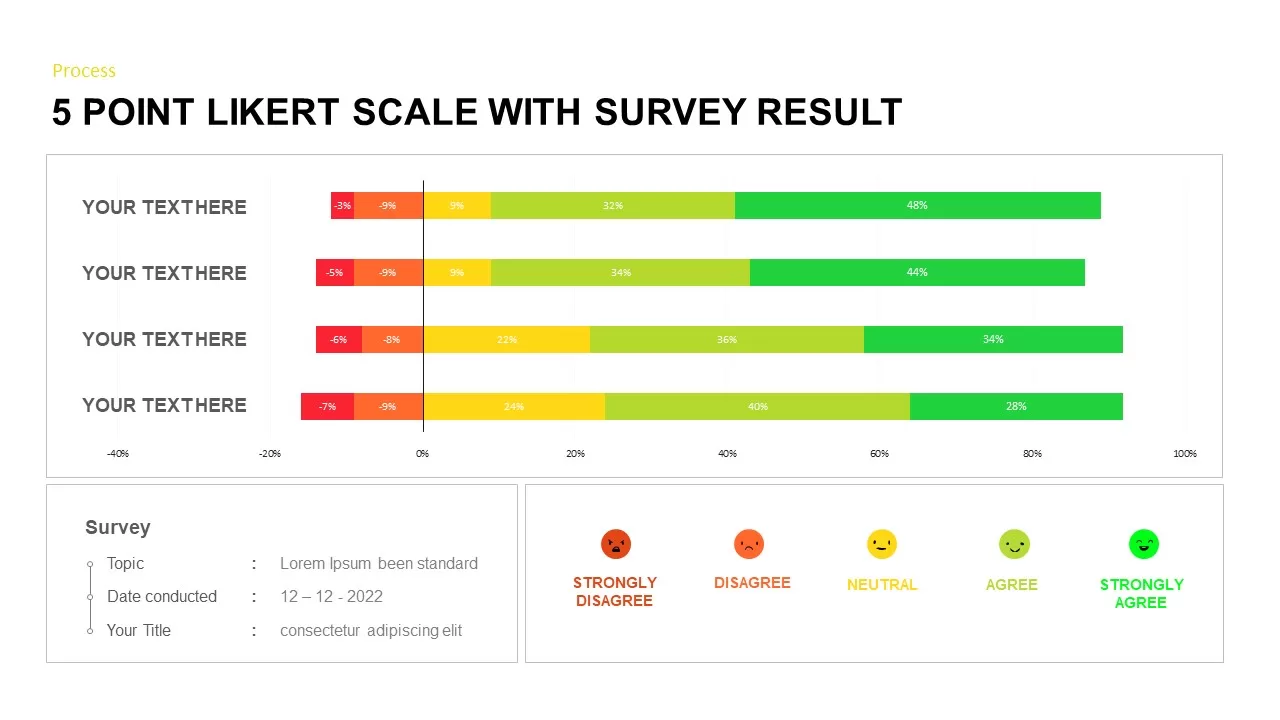
Likert Scale Survey Results infographic pack for PowerPoint & Google Slides
Business
Modern Circle SWOT Analysis Diagram Template for PowerPoint & Google Slides
SWOT
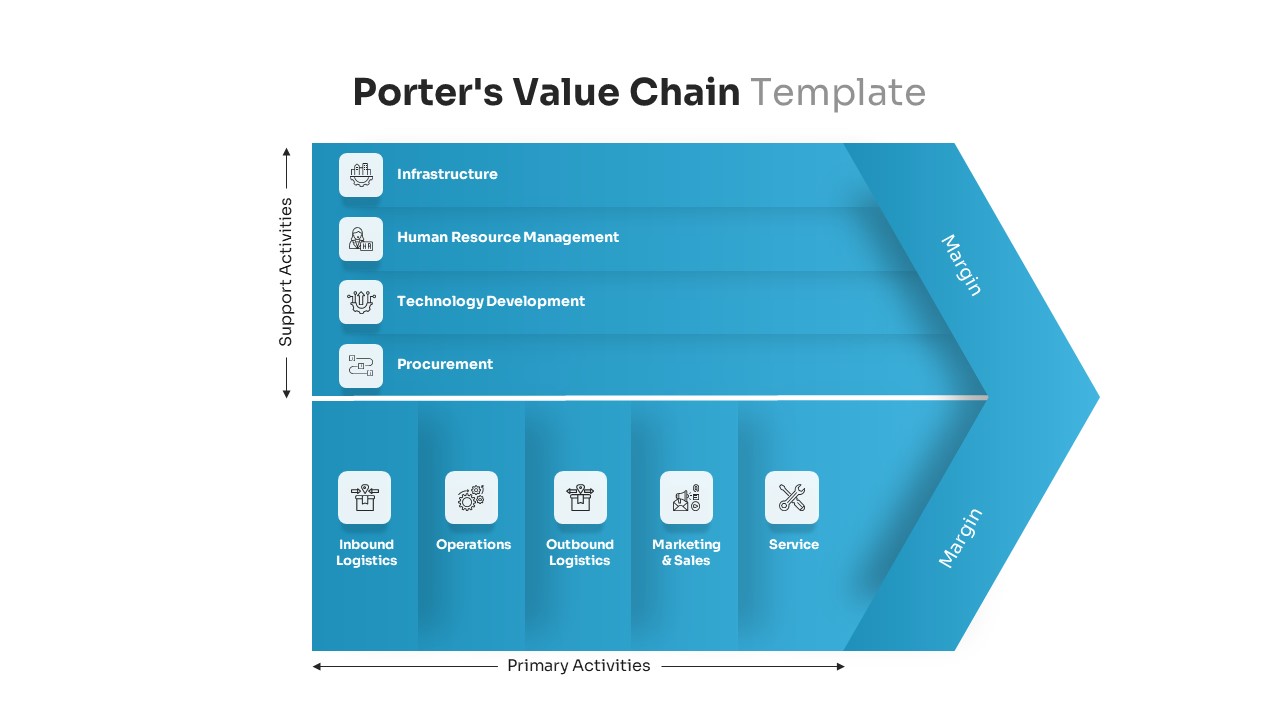
Porter’s Value Chain Analysis Diagram Template for PowerPoint & Google Slides
Business Strategy
Editable Force Field Analysis Diagram Template for PowerPoint & Google Slides
Business Plan

Professional PESTEL Analysis Diagram Template for PowerPoint & Google Slides
PEST
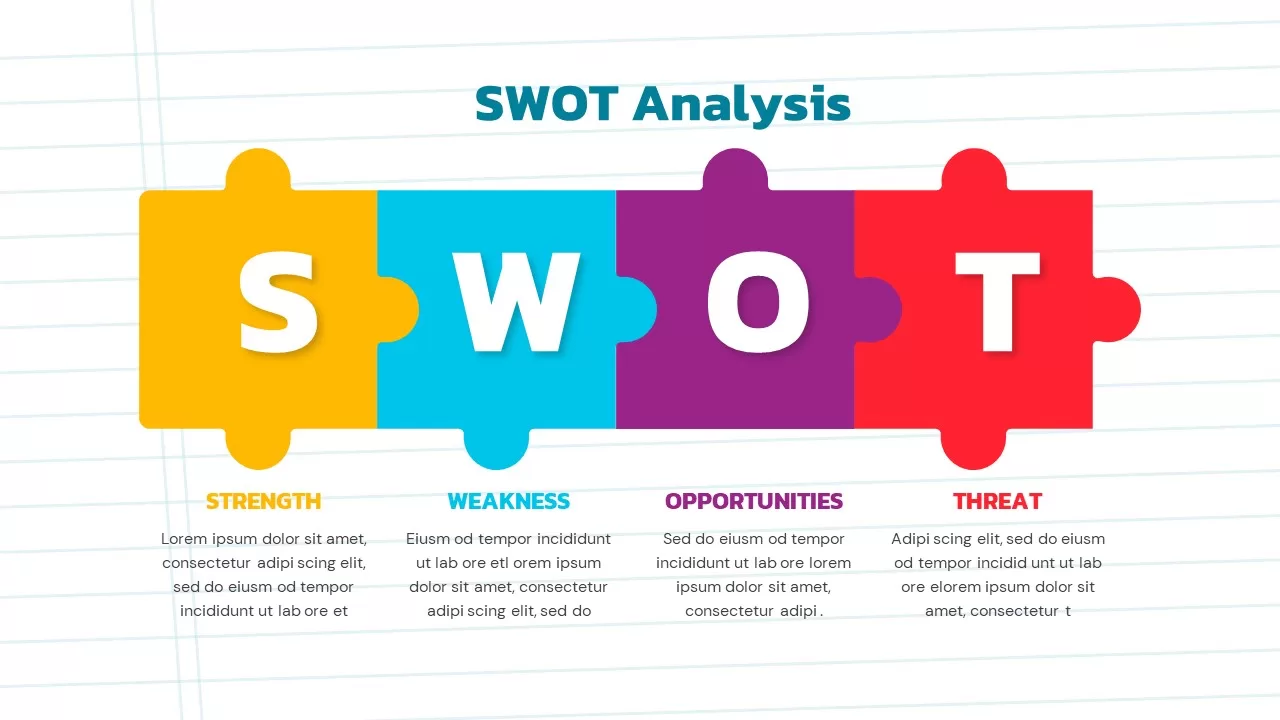
Puzzle-Style SWOT Analysis Table Diagram Template for PowerPoint & Google Slides
SWOT
PEST Analysis Circular Diagram Template for PowerPoint & Google Slides
PEST
PESTLE Analysis Table Layout Diagram Template for PowerPoint & Google Slides
PEST
SWOT Analysis Gear Diagram Slide Template for PowerPoint & Google Slides
SWOT

Interactive Gap Analysis Puzzle Diagram Template for PowerPoint & Google Slides
Gap
Cluster Analysis Infographic Diagram Template for PowerPoint & Google Slides
Business
Fishbone Diagram Analysis Template for PowerPoint & Google Slides
Flow Charts
Four-Quadrant SWOT Analysis Diagram Template for PowerPoint & Google Slides
SWOT
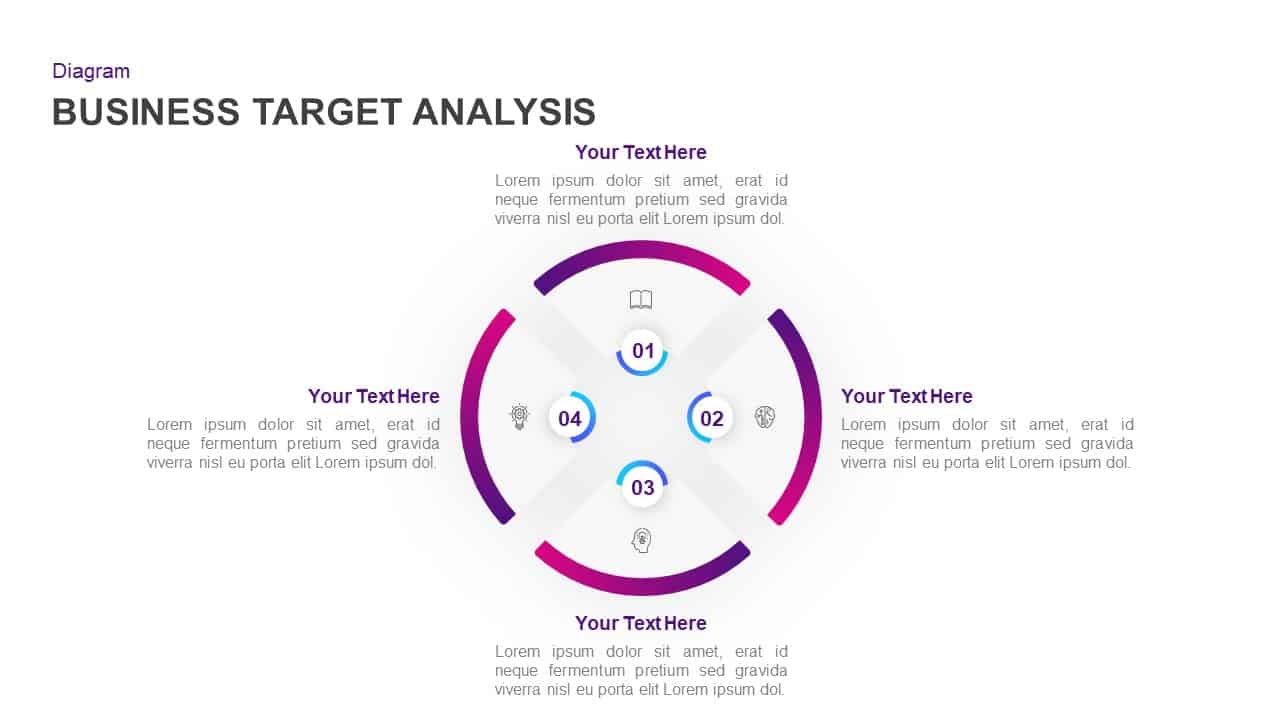
Business Target Analysis Diagram Template for PowerPoint & Google Slides
Circular
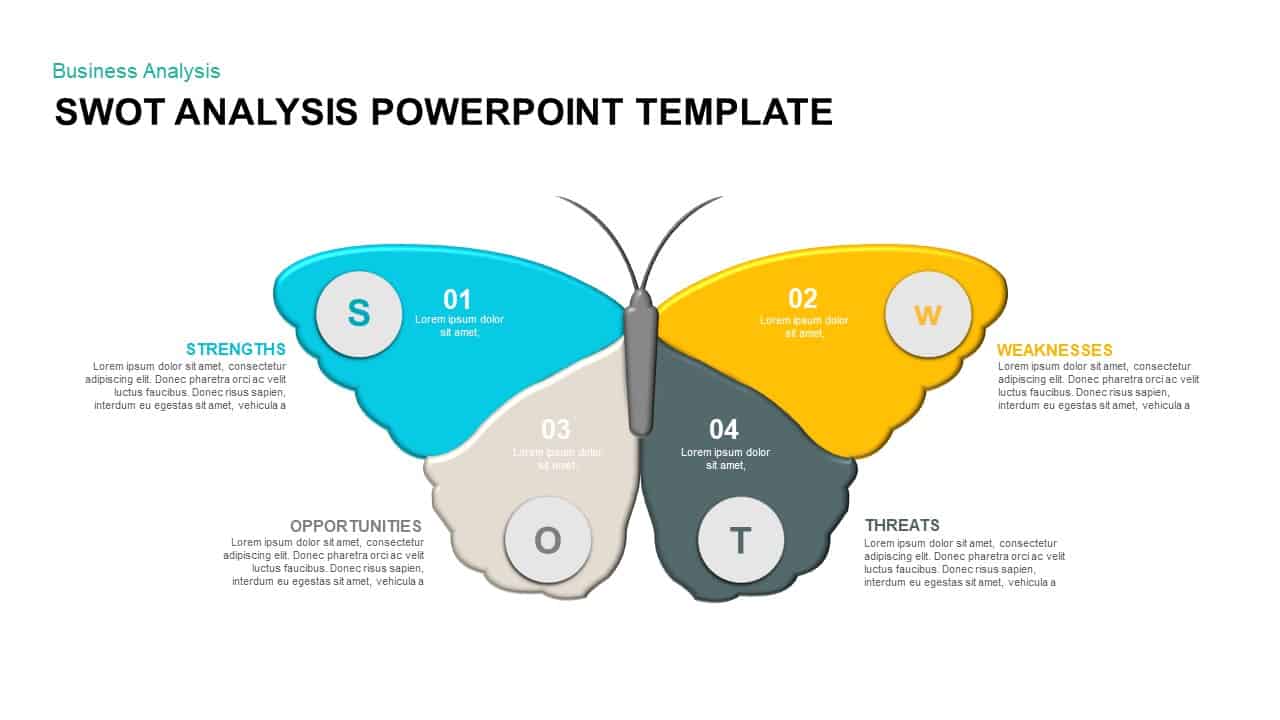
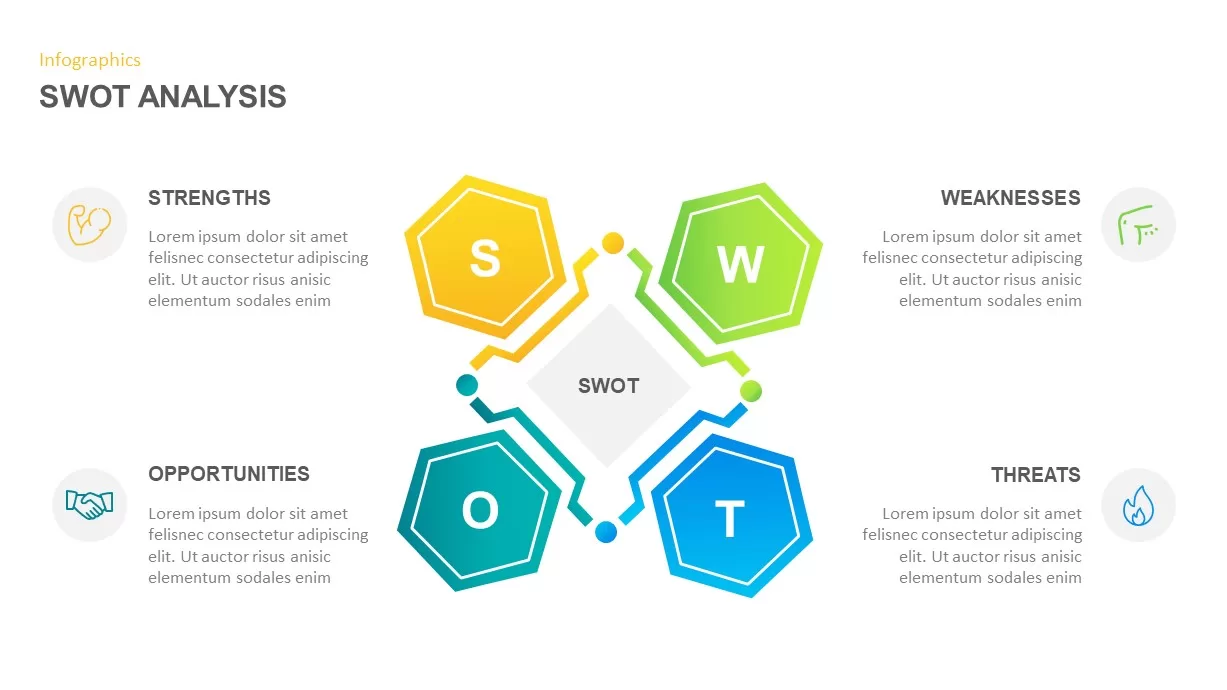
Butterfly SWOT Analysis Diagram Template for PowerPoint & Google Slides
SWOT
Four-Part SWOT Analysis Diagram Template for PowerPoint & Google Slides
SWOT
Fishbone Cause Analysis Diagram Template for PowerPoint & Google Slides
Process

SWOT Analysis Infographic Diagram Template for PowerPoint & Google Slides
SWOT
Puzzle Piece SWOT Analysis Diagram Template for PowerPoint & Google Slides
Opportunities Challenges
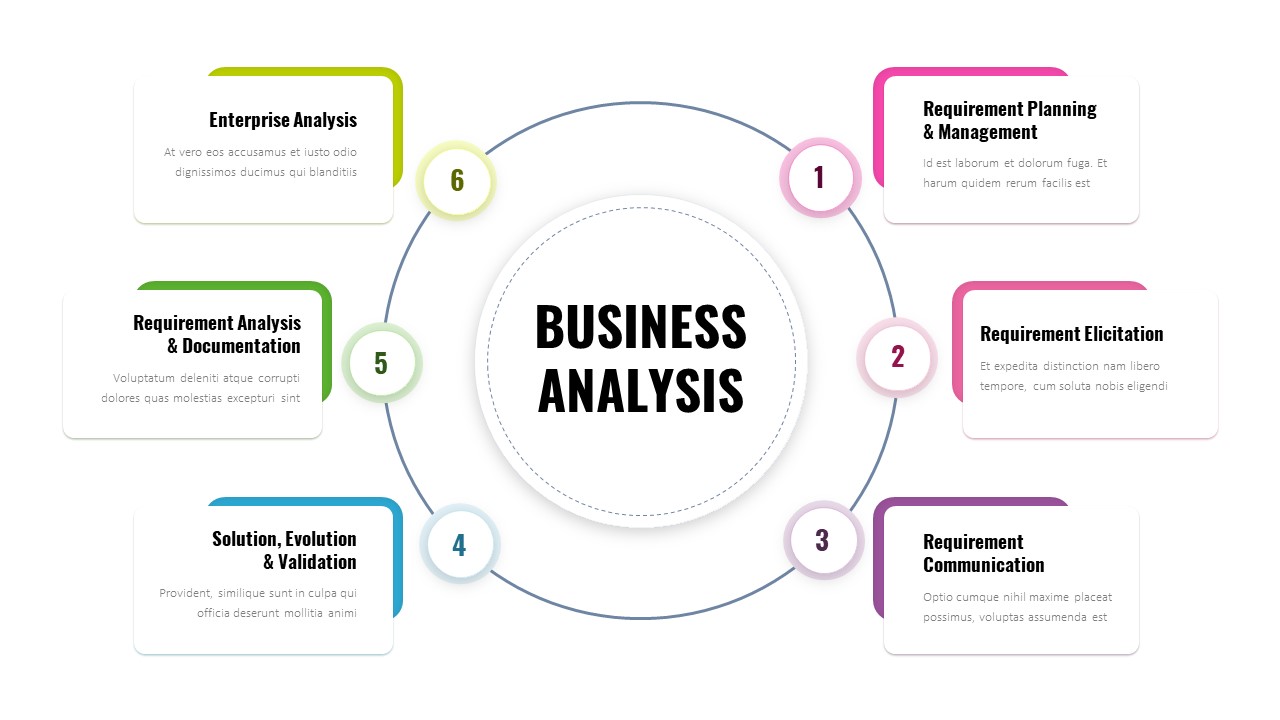
Six-Step Business Analysis Diagram template for PowerPoint & Google Slides
Circular
Business Process Analysis Cycle Diagram Template for PowerPoint & Google Slides
Business Strategy
Free Root Cause Analysis Fishbone Diagram Template for PowerPoint & Google Slides
Process
Free
Experience Curve Analysis Diagram Template for PowerPoint & Google Slides
Business Strategy
Cost-Volume-Profit Analysis Diagram Template for PowerPoint & Google Slides
Finance
Colorful SWOT Analysis Diagram Template for PowerPoint & Google Slides
SWOT
Bottleneck Process Analysis Diagram Template for PowerPoint & Google Slides
Process
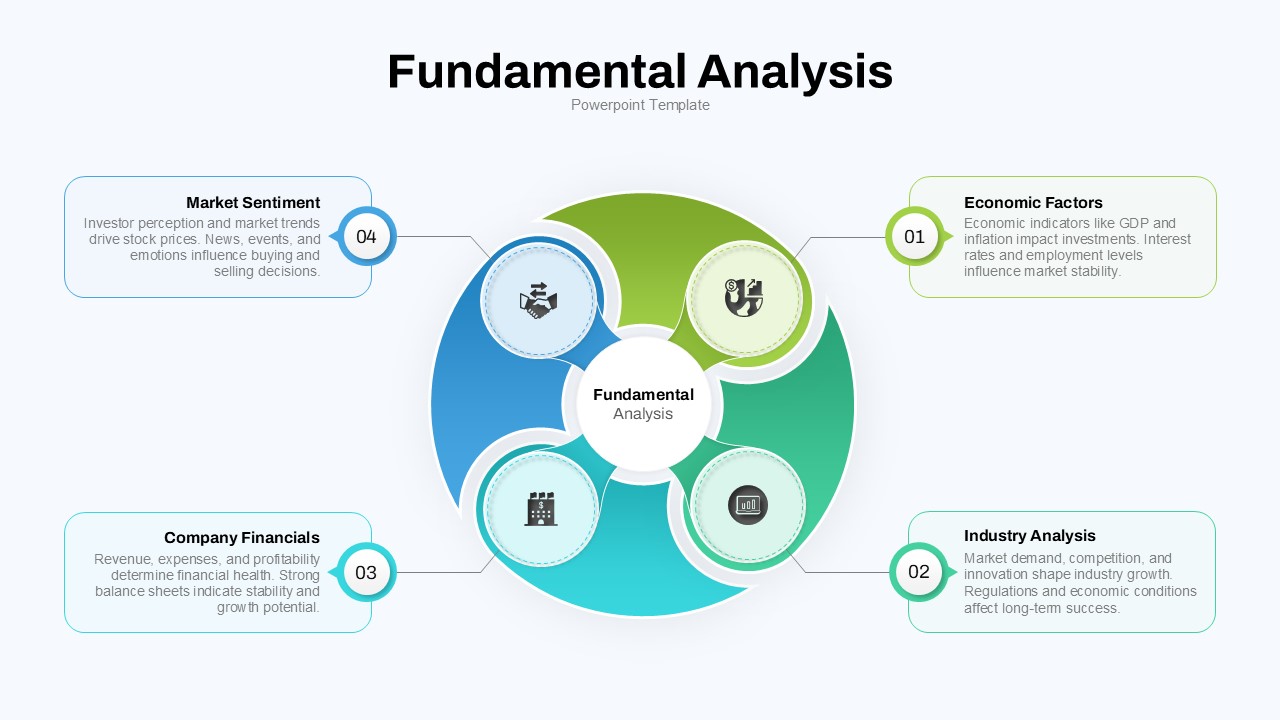
Fundamental Analysis Circular Diagram Template for PowerPoint & Google Slides
Circular
Cultural Web Analysis Circular Diagram Template for PowerPoint & Google Slides
Circular
DESTEP Marketing Analysis Diagram Template for PowerPoint & Google Slides
Circular
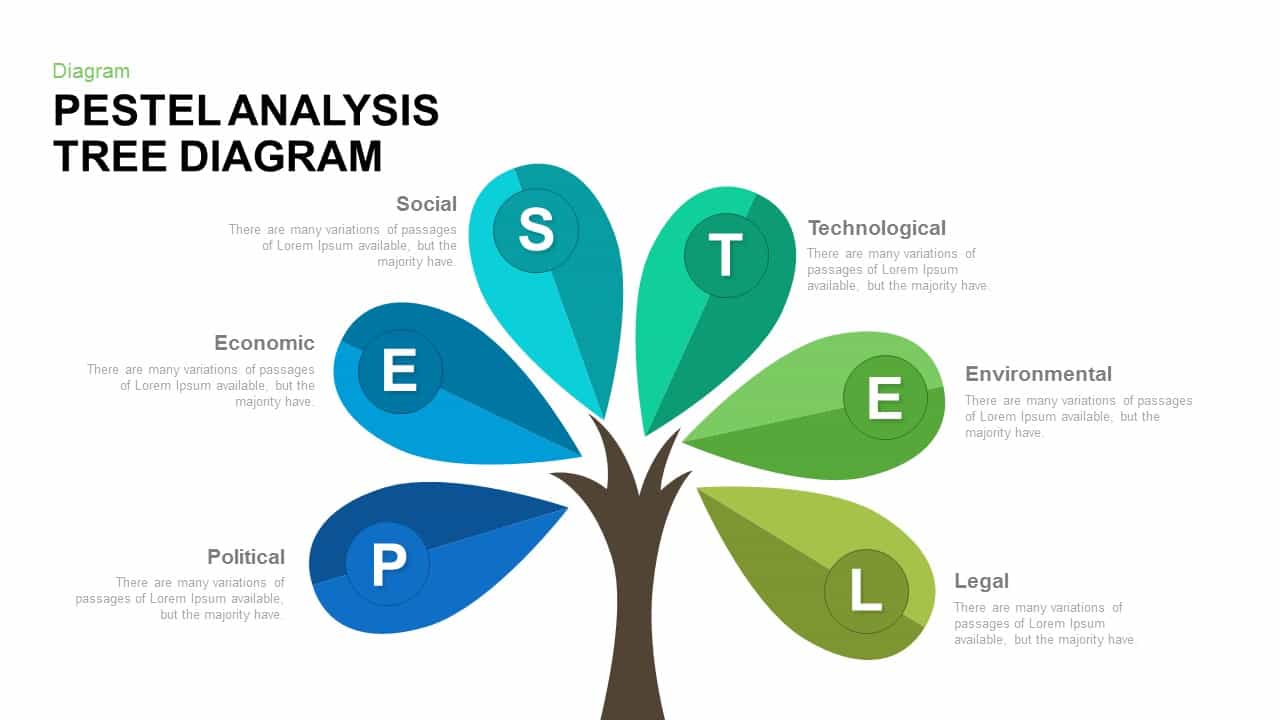
PESTEL Analysis Tree Diagram for PowerPoint & Google Slides
Process
5 Why Fishbone Diagram for Root Cause Analysis in PowerPoint & Google Slides
Process
PEST Analysis PowerPoint Template for PowerPoint & Google Slides
Business Strategy
Mobile Data Analysis Chart template for PowerPoint & Google Slides
Charts
Creative Data Analysis Bar Chart template for PowerPoint & Google Slides
Bar/Column
Line Graph Analysis template for PowerPoint & Google Slides
Charts
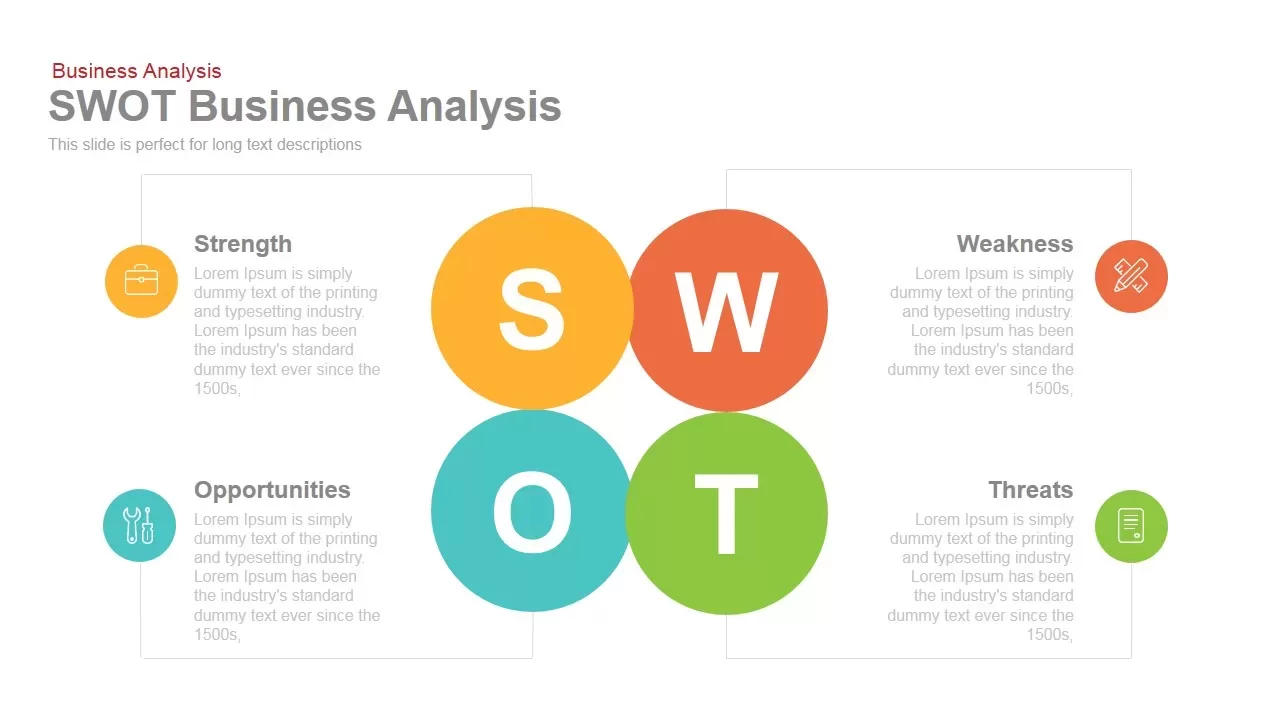
SWOT Business Analysis template for PowerPoint & Google Slides
SWOT
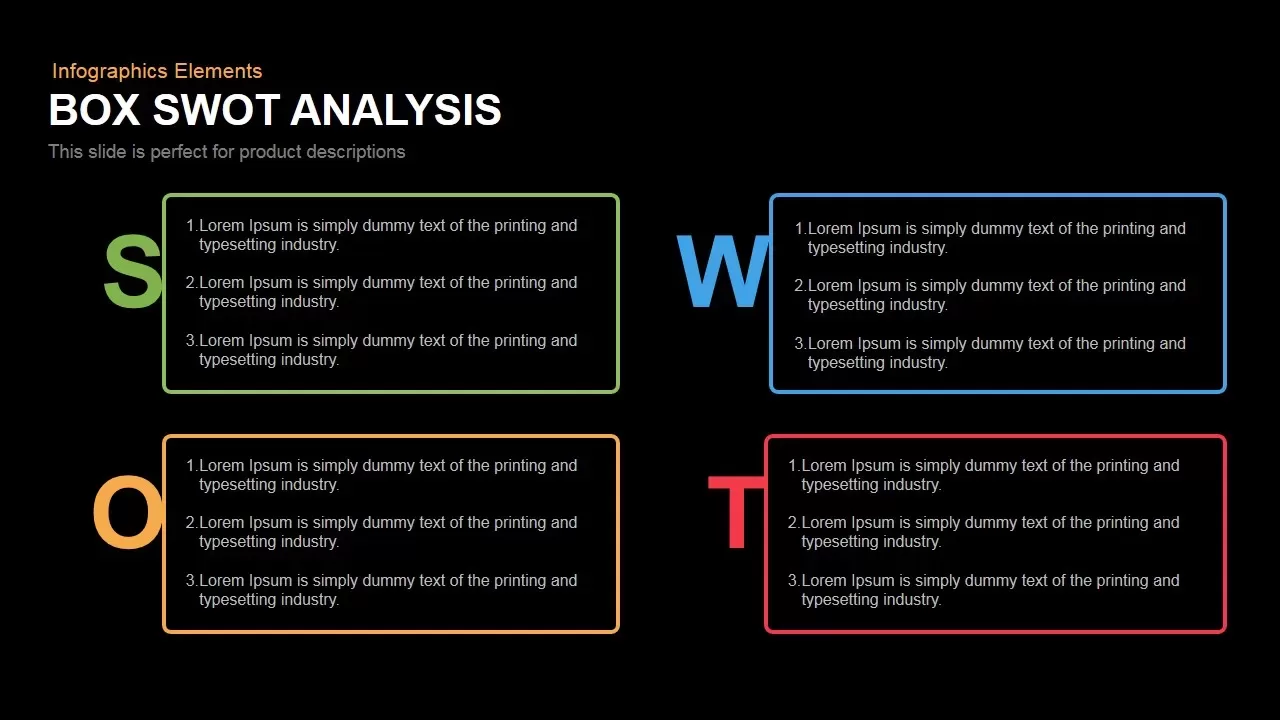
Box SWOT Analysis Infographic Template for PowerPoint & Google Slides
SWOT
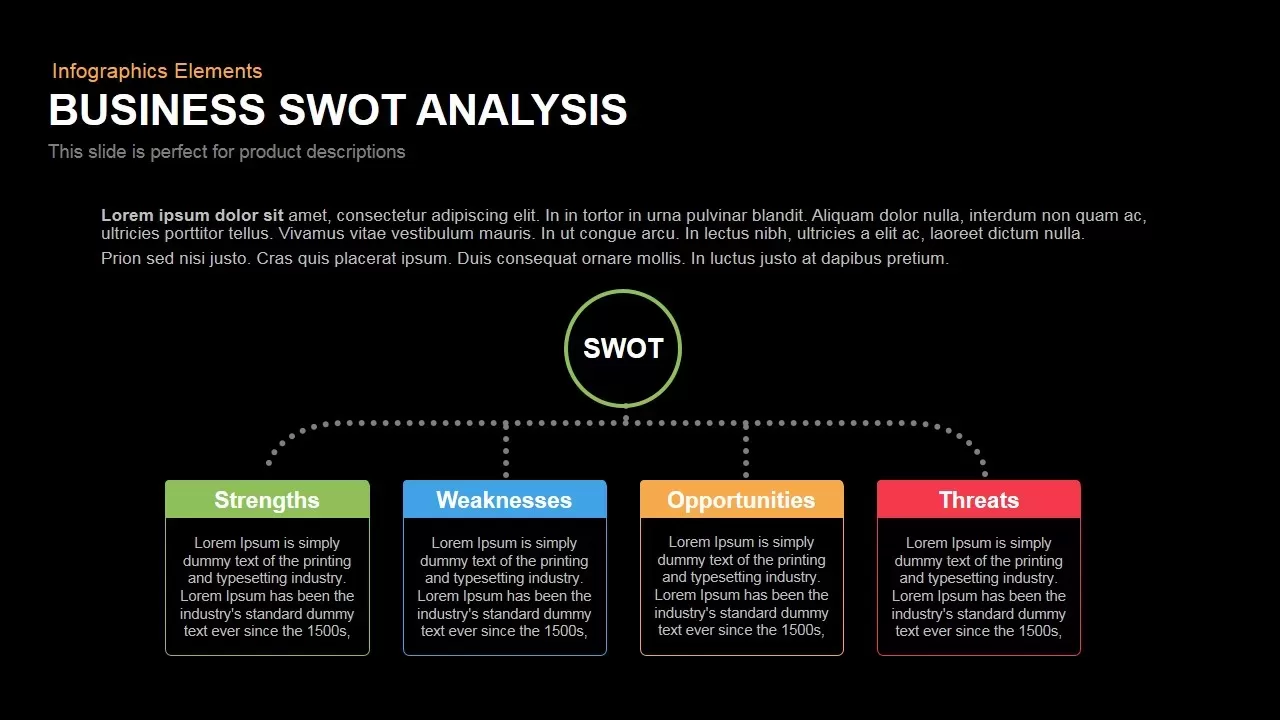
Box Business SWOT Analysis Template for PowerPoint & Google Slides
SWOT
Employee Skill Analysis Dashboard Template for PowerPoint & Google Slides
Employee Performance
Interactive 3D Puzzle SWOT Analysis Slide Template for PowerPoint & Google Slides
SWOT
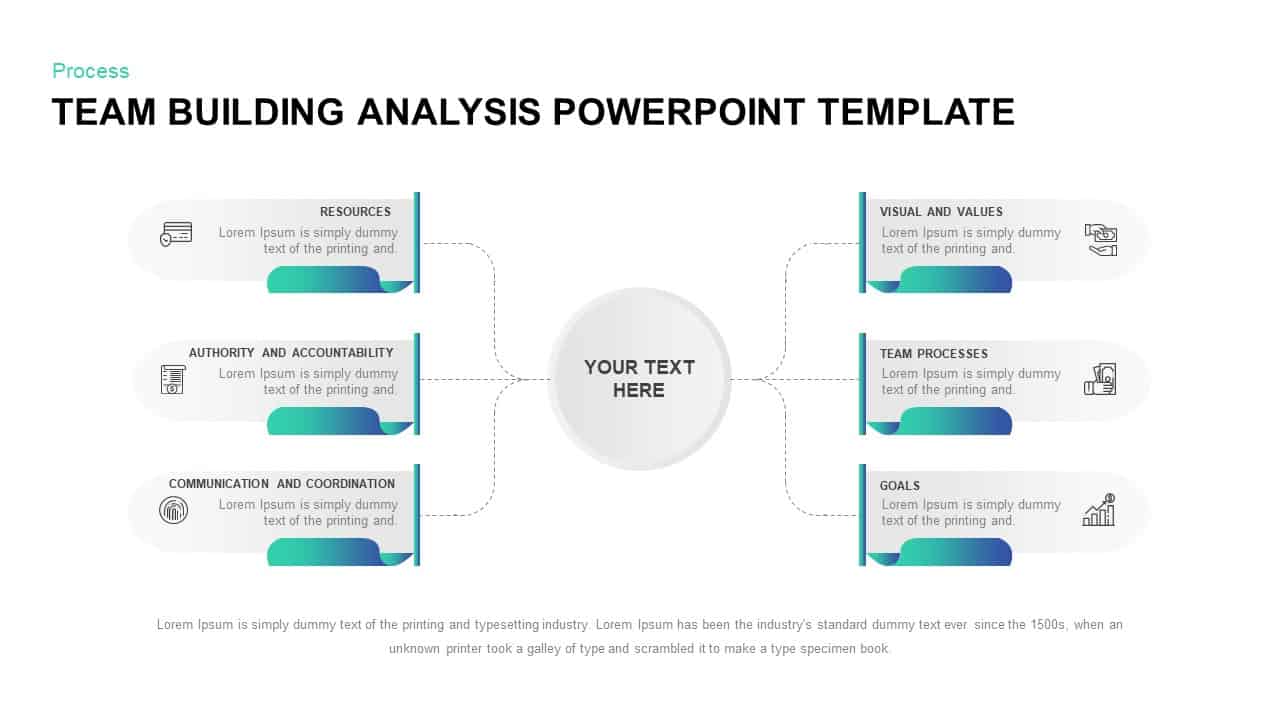
Team Building Hub-and-Spoke Analysis Template for PowerPoint & Google Slides
Process
Versatile SWOT Analysis Slide Collection Template for PowerPoint & Google Slides
SWOT
Illustrated Business SWOT Analysis Template for PowerPoint & Google Slides
SWOT
3D Cube SWOT Analysis Infographic Template for PowerPoint & Google Slides
SWOT
PESTLE and PEST Strategic Analysis Diagrams Template for PowerPoint & Google Slides
Business Strategy
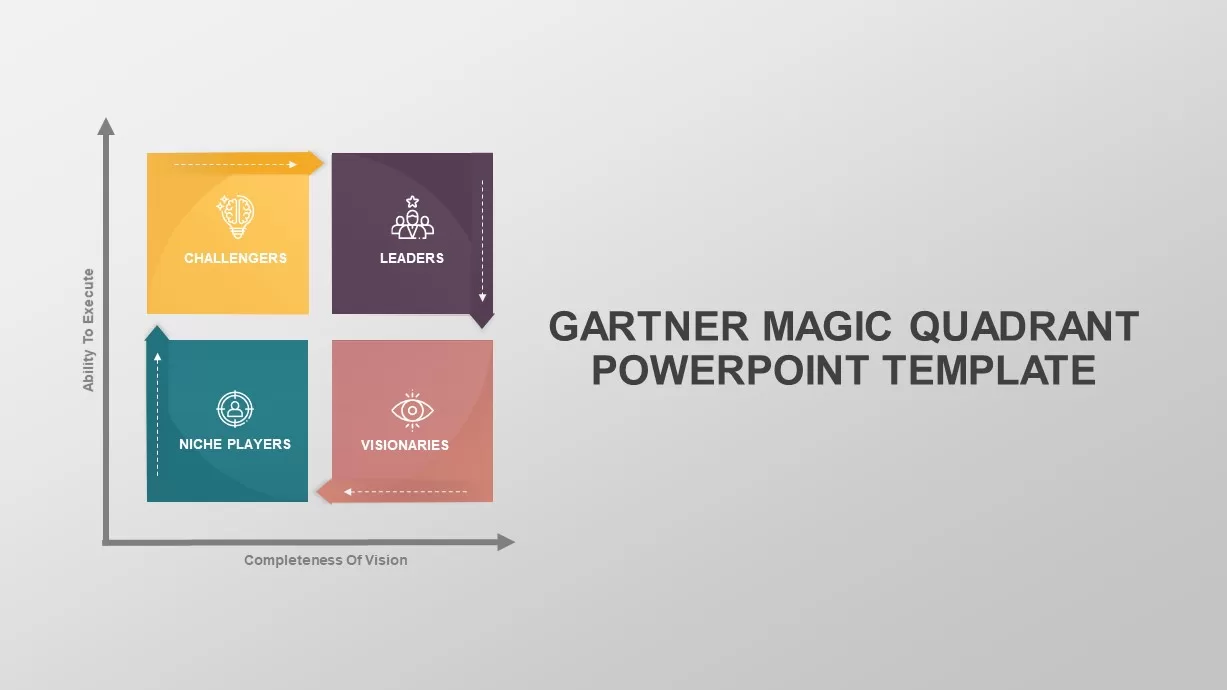
Gartner Magic Quadrant Analysis Template for PowerPoint & Google Slides
Business
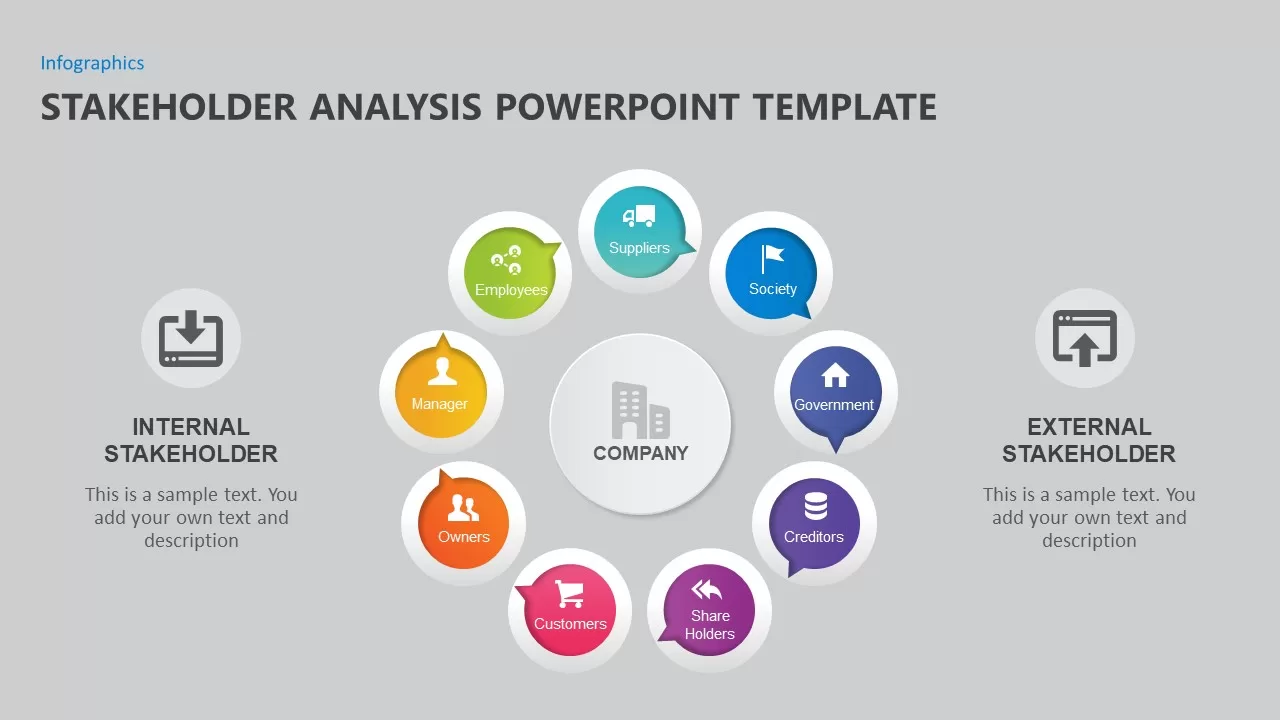
Stakeholder Analysis Template for PowerPoint & Google Slides
Business
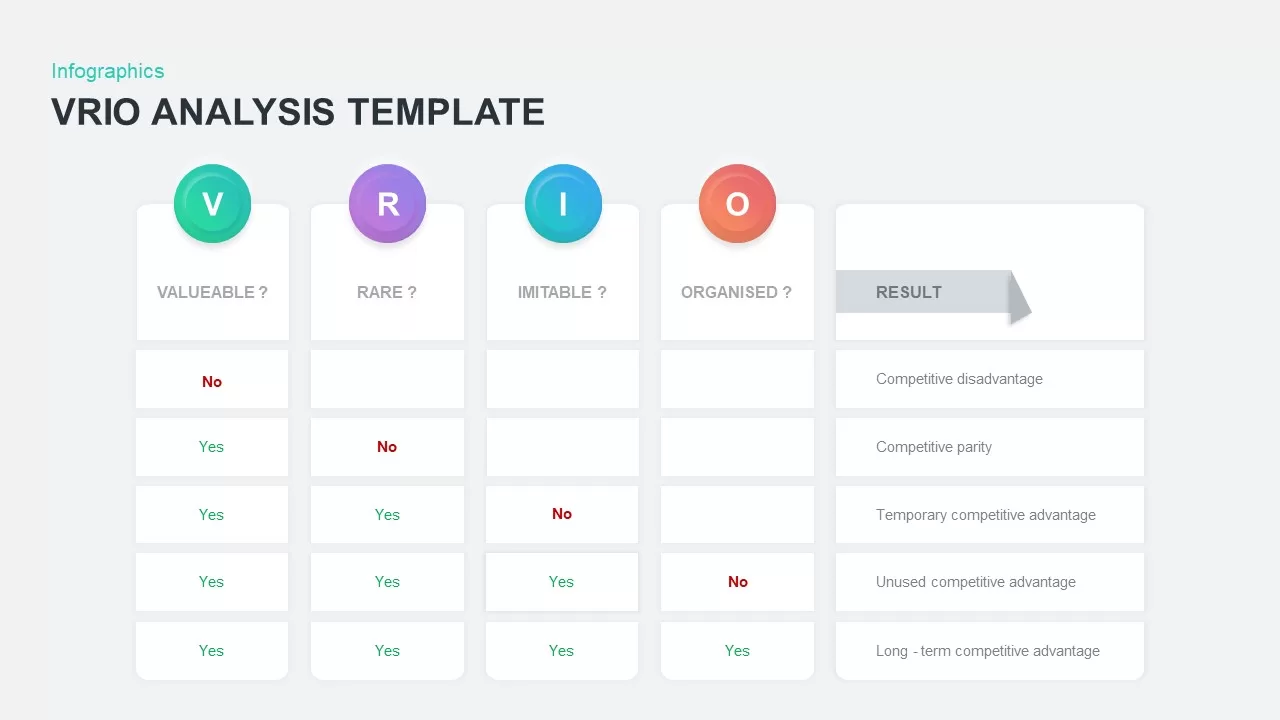
VRIO Analysis Infographic Template for PowerPoint & Google Slides
Business Strategy
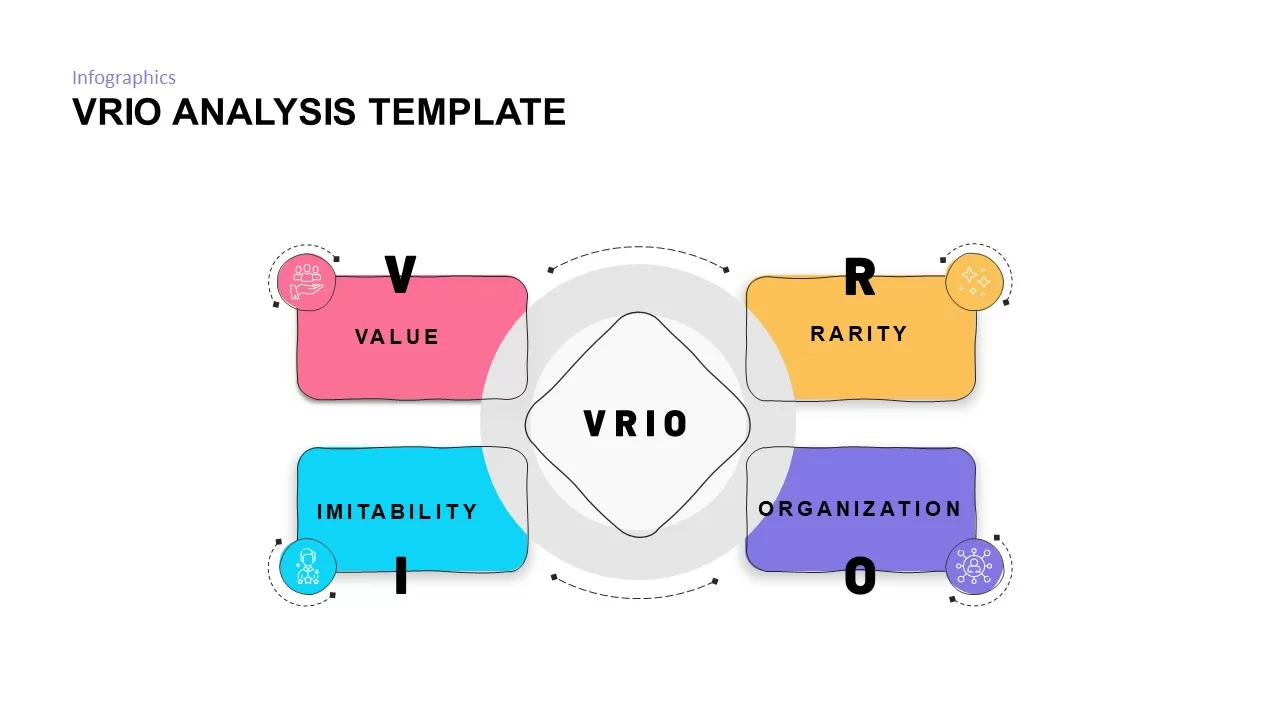
VRIO Analysis Framework template for PowerPoint & Google Slides
Business Strategy
SWOT Analysis Grid Infographic Template for PowerPoint & Google Slides
SWOT
Circular SWOT Analysis Infographic Template for PowerPoint & Google Slides
SWOT
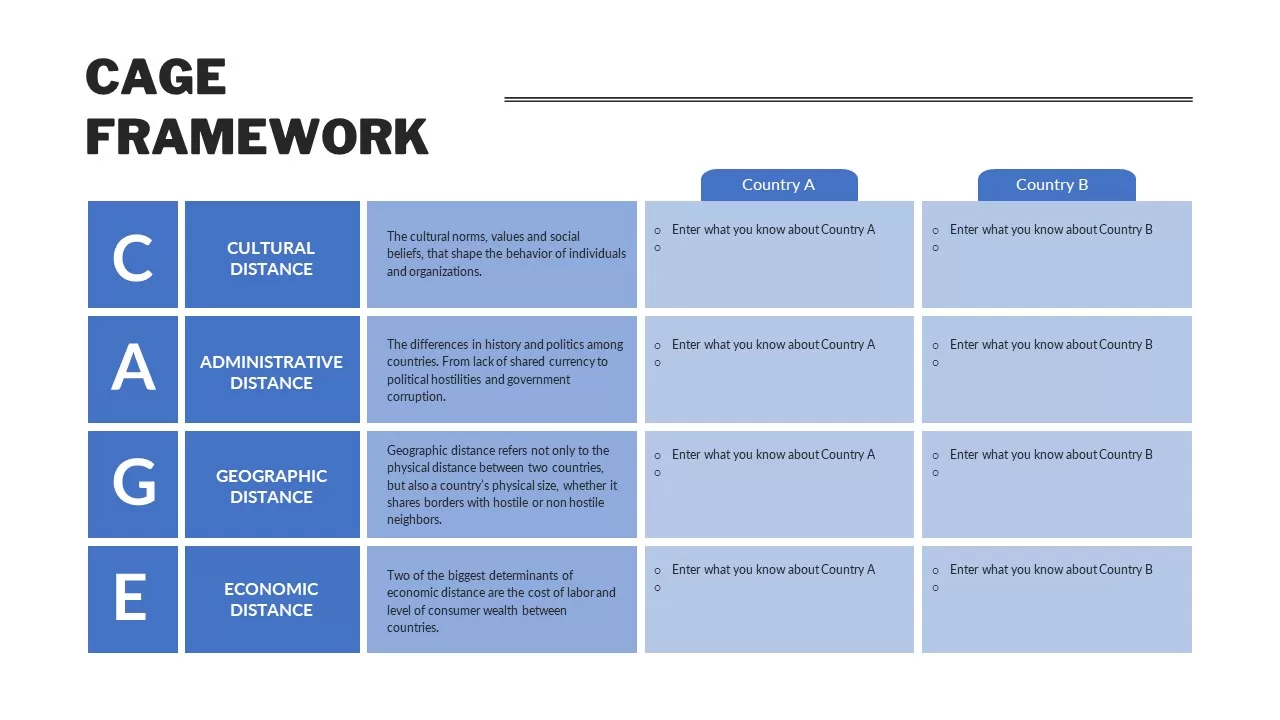
CAGE Distance Analysis Framework Template for PowerPoint & Google Slides
Competitor Analysis
Modern Colorful SWOT Quadrant Analysis Template for PowerPoint & Google Slides
SWOT
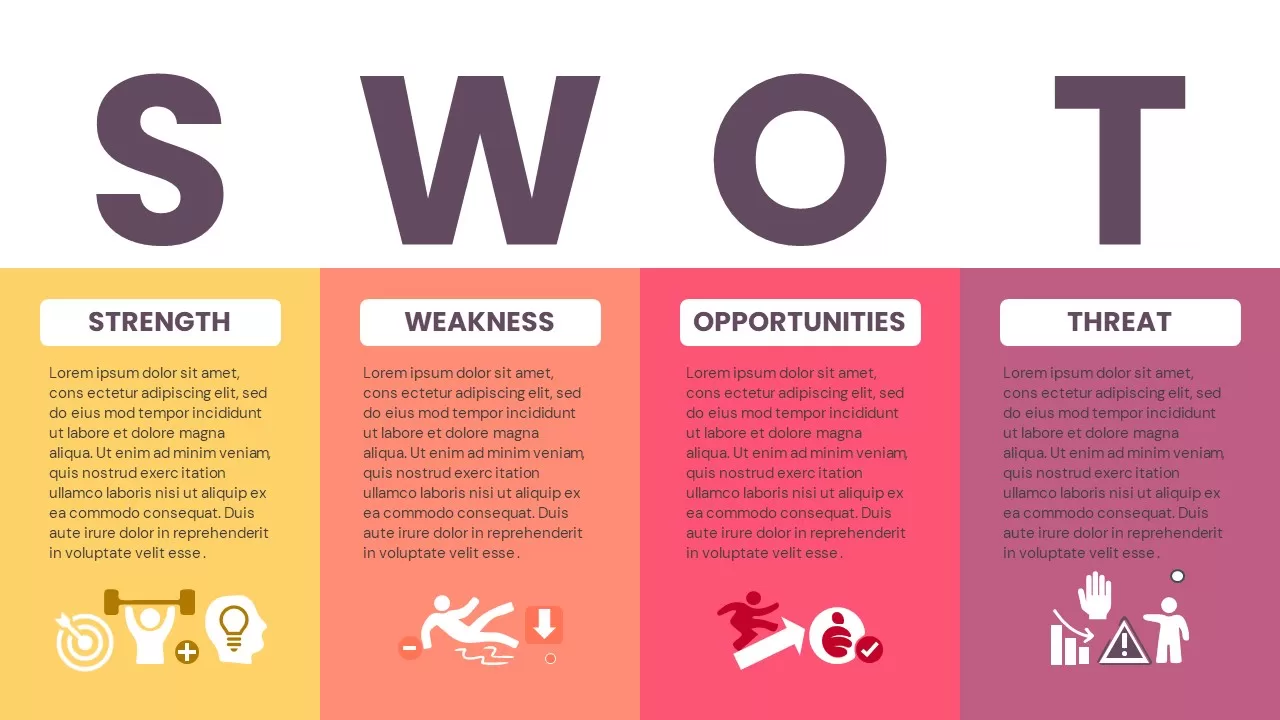
Colorful SWOT Analysis Quadrant Template for PowerPoint & Google Slides
SWOT
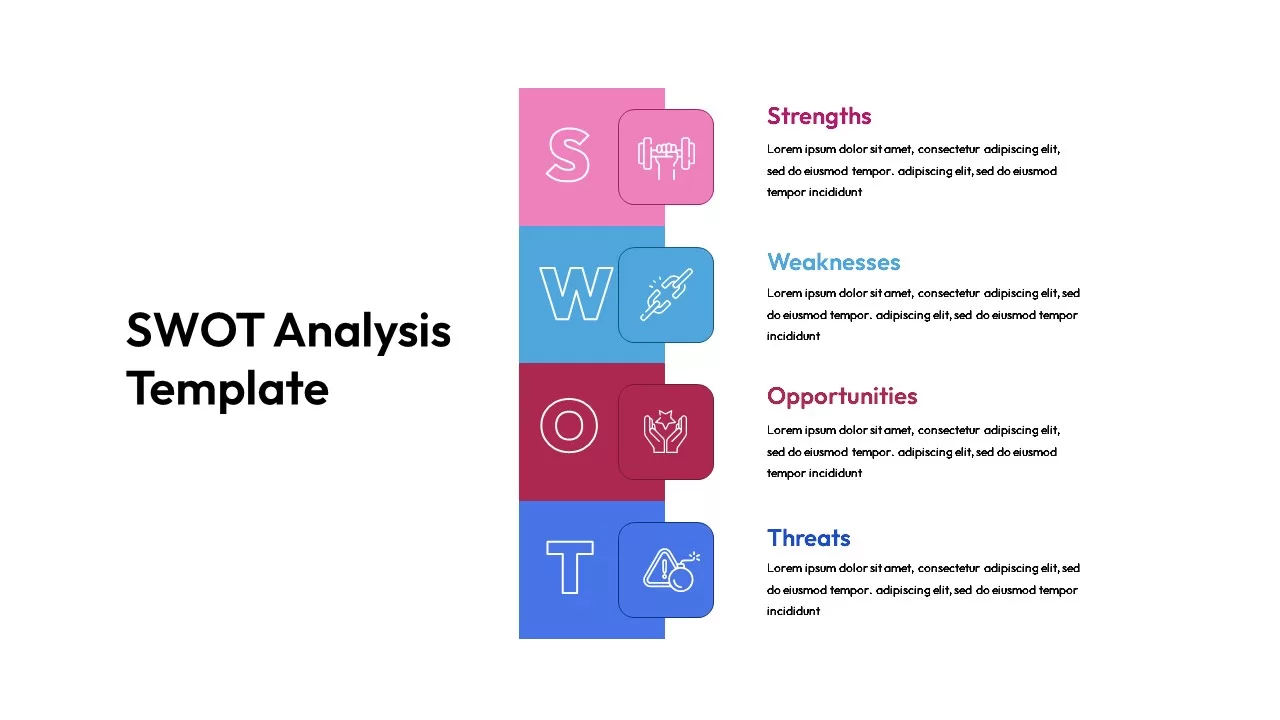
Colorful Vertical SWOT Analysis Layout Template for PowerPoint & Google Slides
SWOT
SWOT Analysis Framework template for PowerPoint & Google Slides
SWOT
SWOT Analysis Overview template for PowerPoint & Google Slides
Business
SWOT Analysis Quadrant template for PowerPoint & Google Slides
Business Strategy
SWOT Analysis Blocks template for PowerPoint & Google Slides
Business Strategy
SWOT Analysis Template for PowerPoint & Google Slides
Business Strategy
Free SWOT Analysis Template for PowerPoint & Google Slides
SWOT
Free
SWOT Analysis template for PowerPoint & Google Slides
SWOT
Photo Personal SWOT Analysis Callouts Template for PowerPoint & Google Slides
SWOT
Current vs Future State Analysis template for PowerPoint & Google Slides
Comparison
Cost Benefit Analysis Comparison Template for PowerPoint & Google Slides
Comparison
Six-Step Business Analysis Template for PowerPoint & Google Slides
Process
Vendor Comparison Analysis template for PowerPoint & Google Slides
Comparison Chart
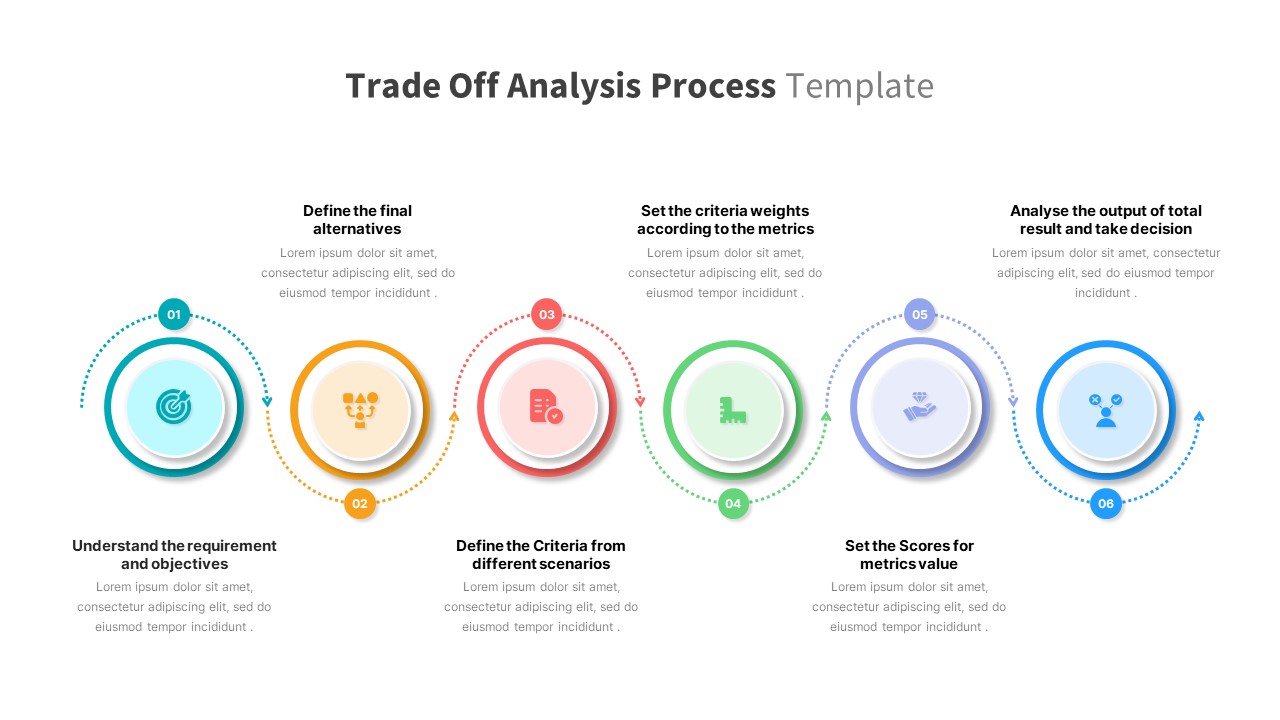
Trade Off Analysis Process template for PowerPoint & Google Slides
Process
Simple Scatter Chart Analysis Template for PowerPoint & Google Slides
Comparison Chart
Simple Area Chart Data Trends Analysis Template for PowerPoint & Google Slides
Comparison Chart
Waterfall Bar Chart Analysis Template for PowerPoint & Google Slides
Bar/Column
Expanding Margins Analysis Bar Chart Template for PowerPoint & Google Slides
Charts
Annual Growth Trend Analysis Chart template for PowerPoint & Google Slides
Business Report
Dynamic Financial Analysis Line Chart Template for PowerPoint & Google Slides
Finance
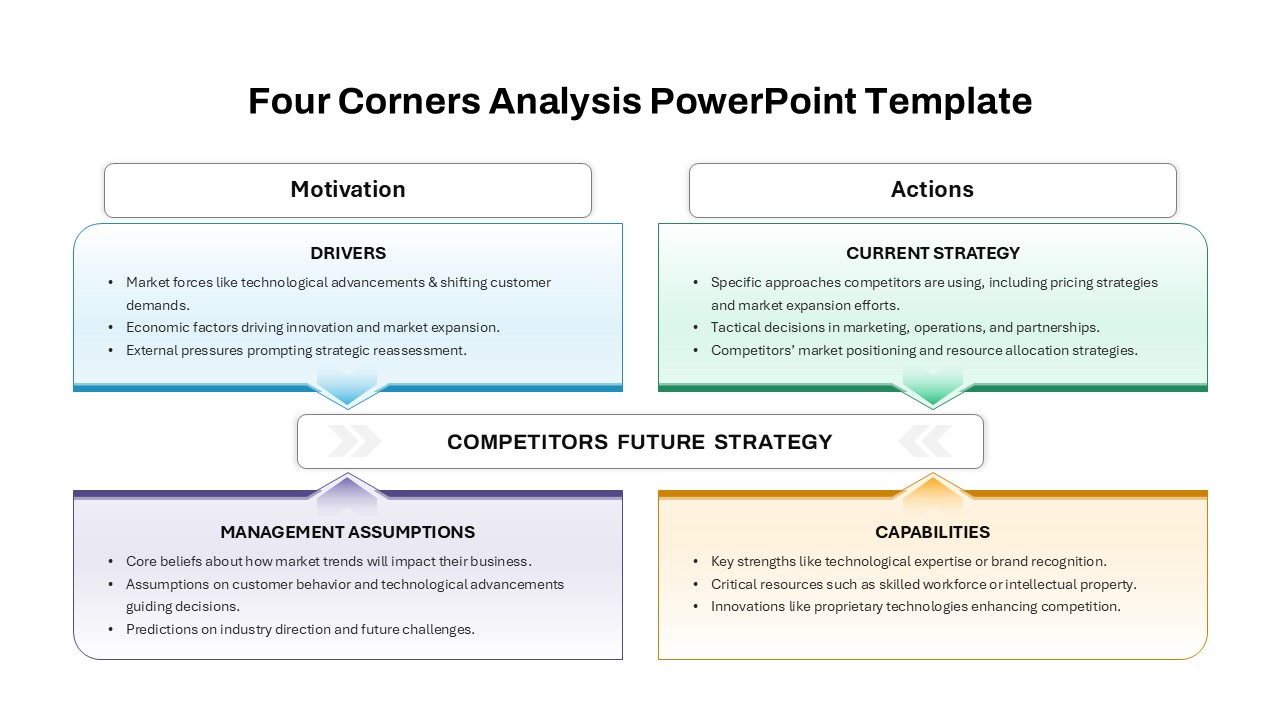
Four-Corners Strategic Analysis Quadrant Template for PowerPoint & Google Slides
SWOT
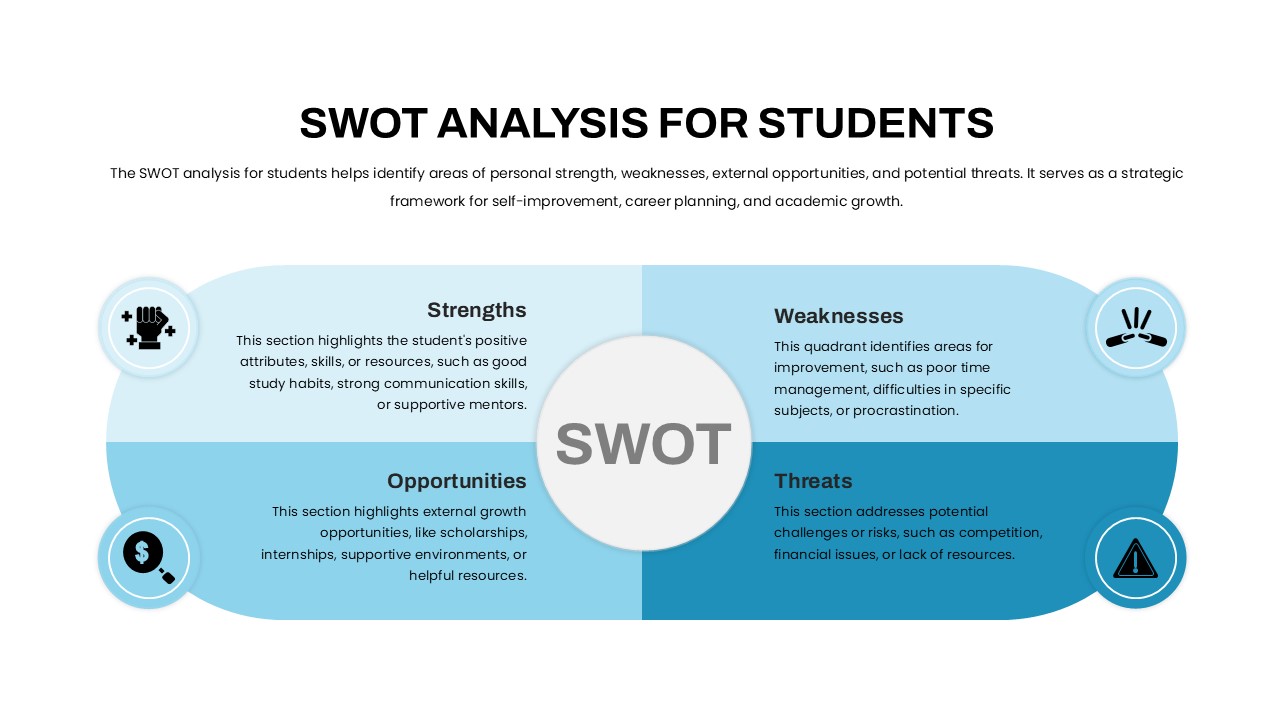
Student SWOT Analysis Framework Template for PowerPoint & Google Slides
SWOT
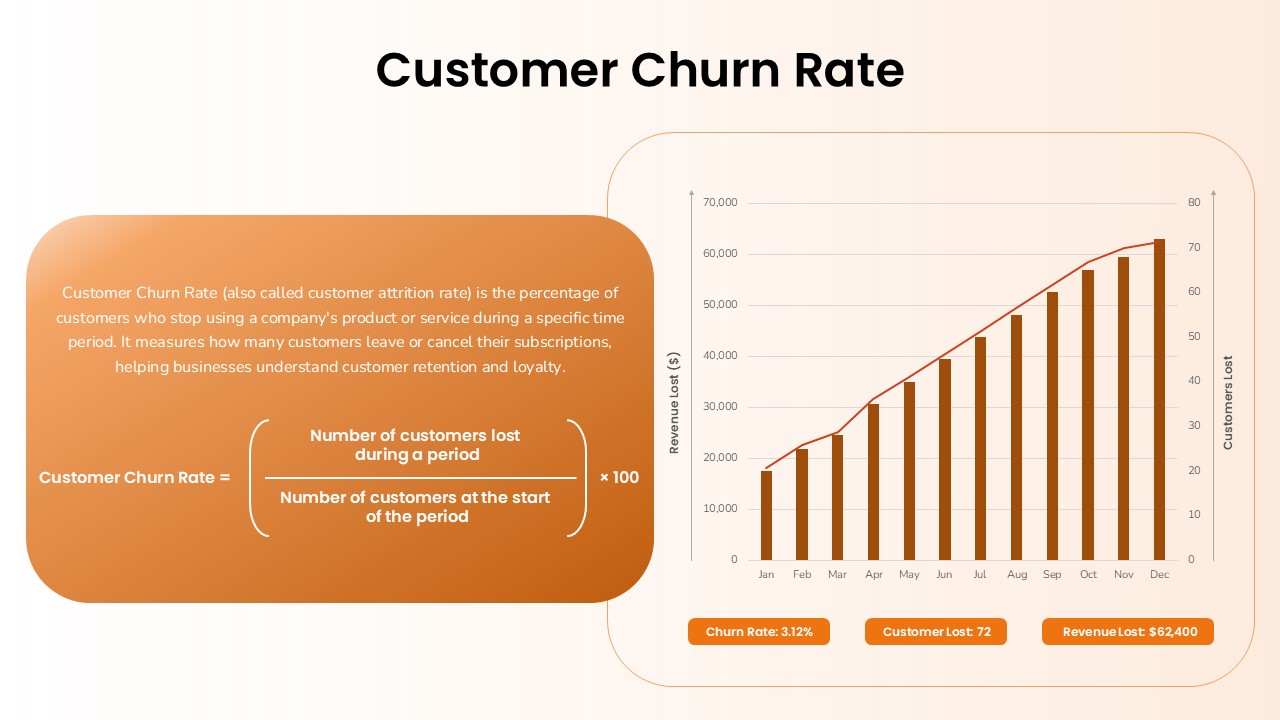
Customer Churn Rate Analysis template for PowerPoint & Google Slides
Business Report
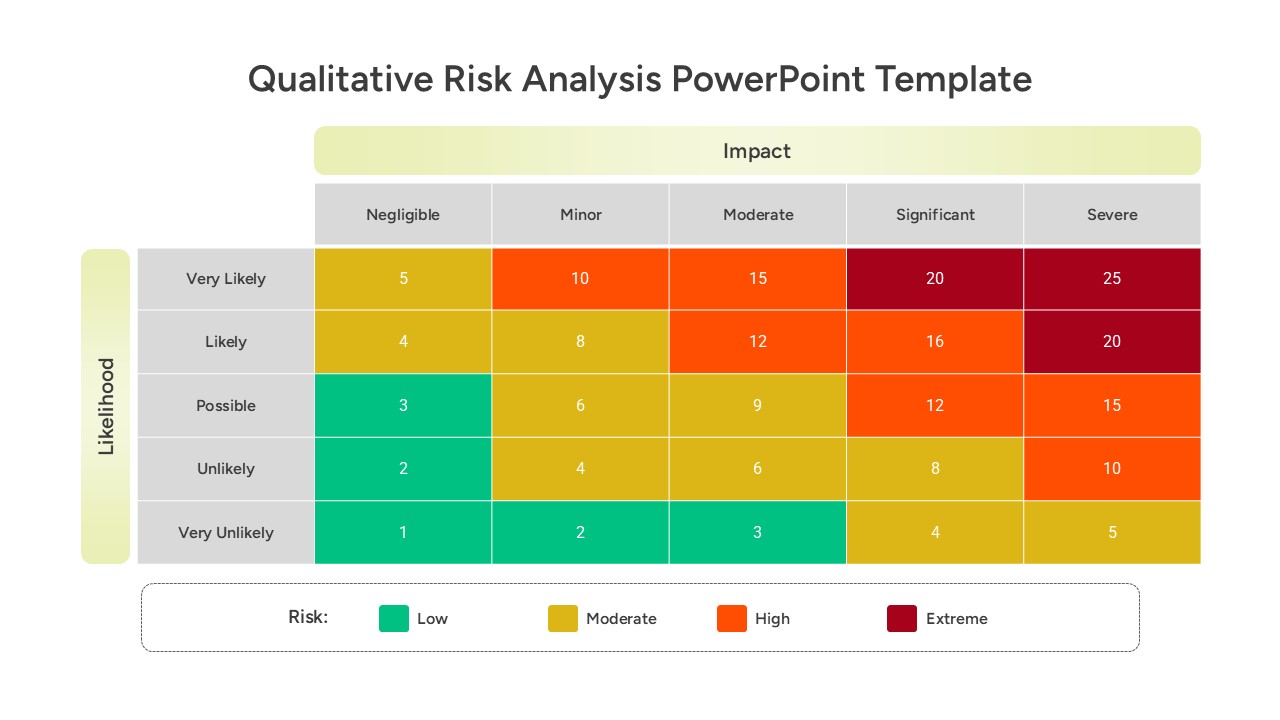
Qualitative Risk Analysis template for PowerPoint & Google Slides
Business
Quantitative Risk Analysis Matrix template for PowerPoint & Google Slides
Risk Management
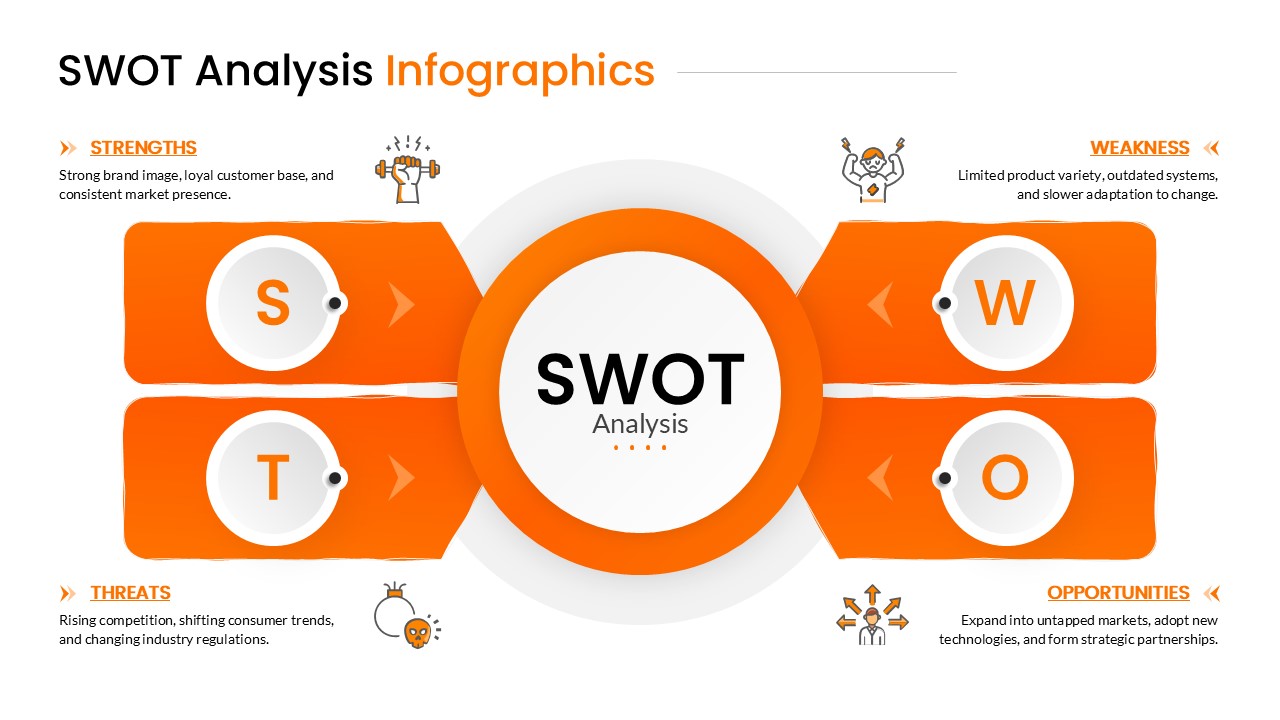
SWOT Analysis Infographic with Circular Icons Template for PowerPoint & Google Slides
SWOT
Multi Color SWOT Analysis Quadrant Template for PowerPoint & Google Slides
SWOT
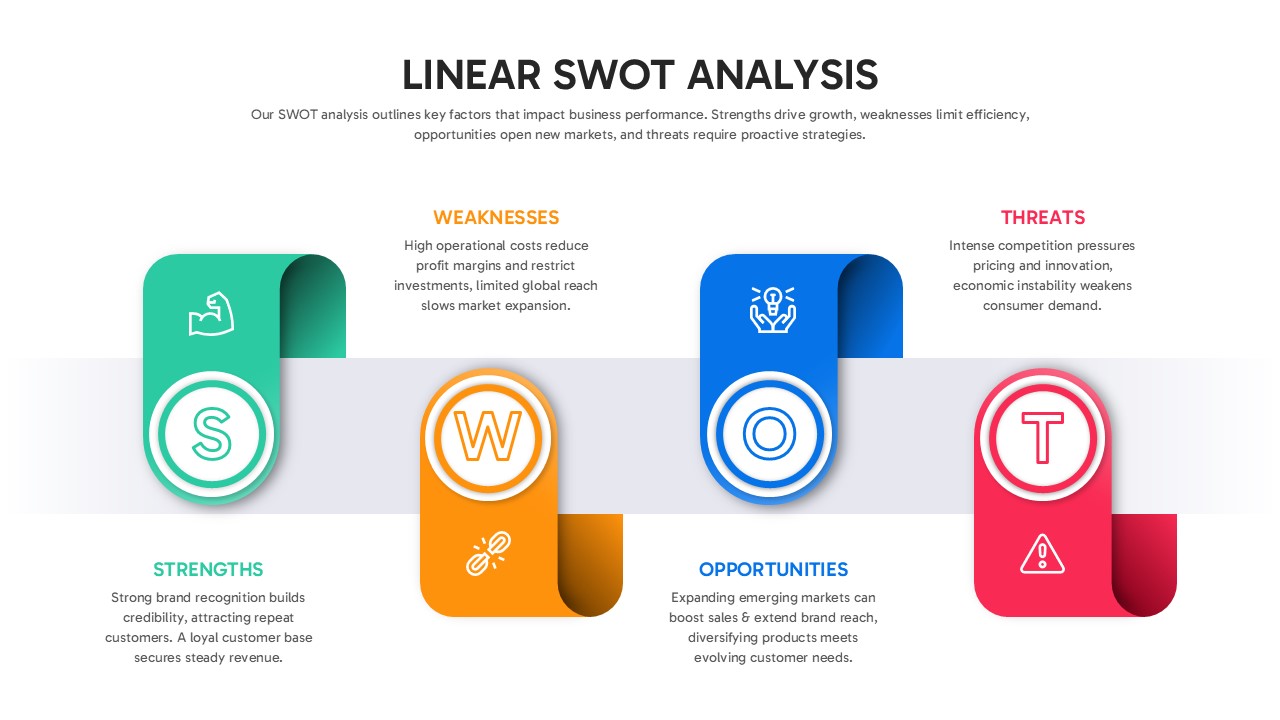
Linear SWOT Analysis Slide Template for PowerPoint & Google Slides
SWOT
Personal SWOT Analysis Matrix Cards Template for PowerPoint & Google Slides
SWOT
Orange SWOT Analysis Infographic Template for PowerPoint & Google Slides
SWOT
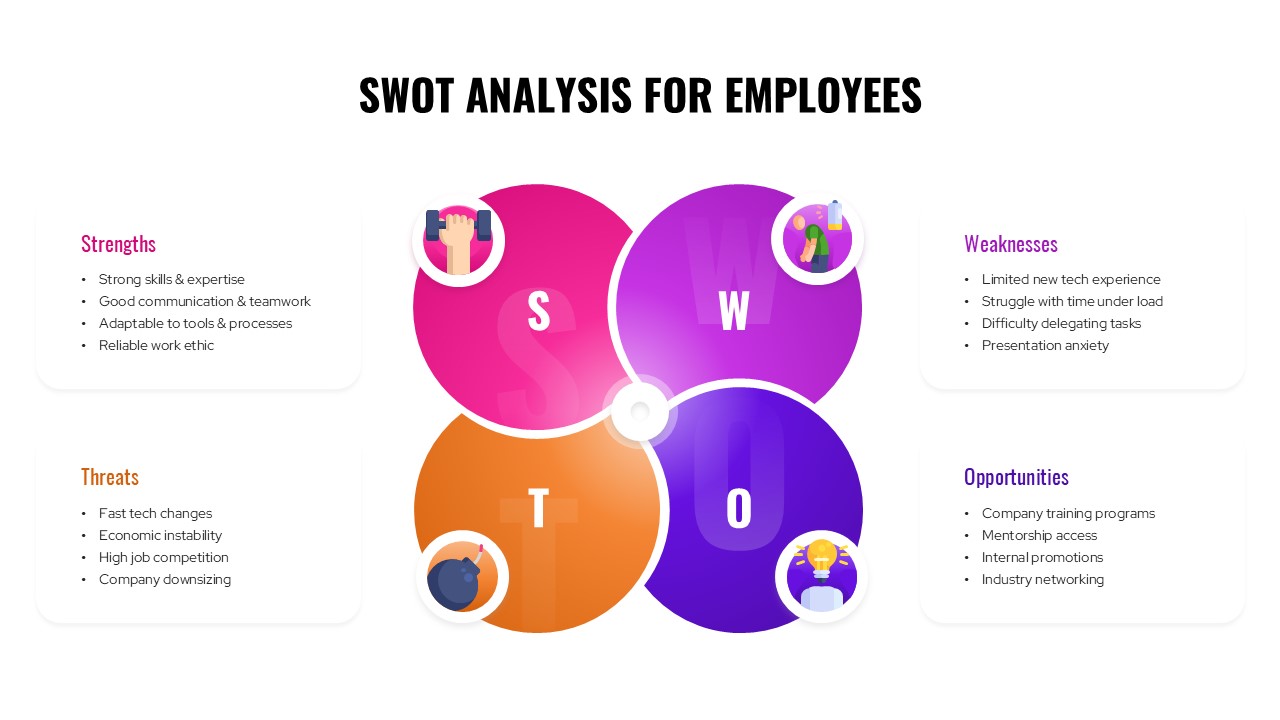
SWOT Analysis For Employees Template for PowerPoint & Google Slides
SWOT
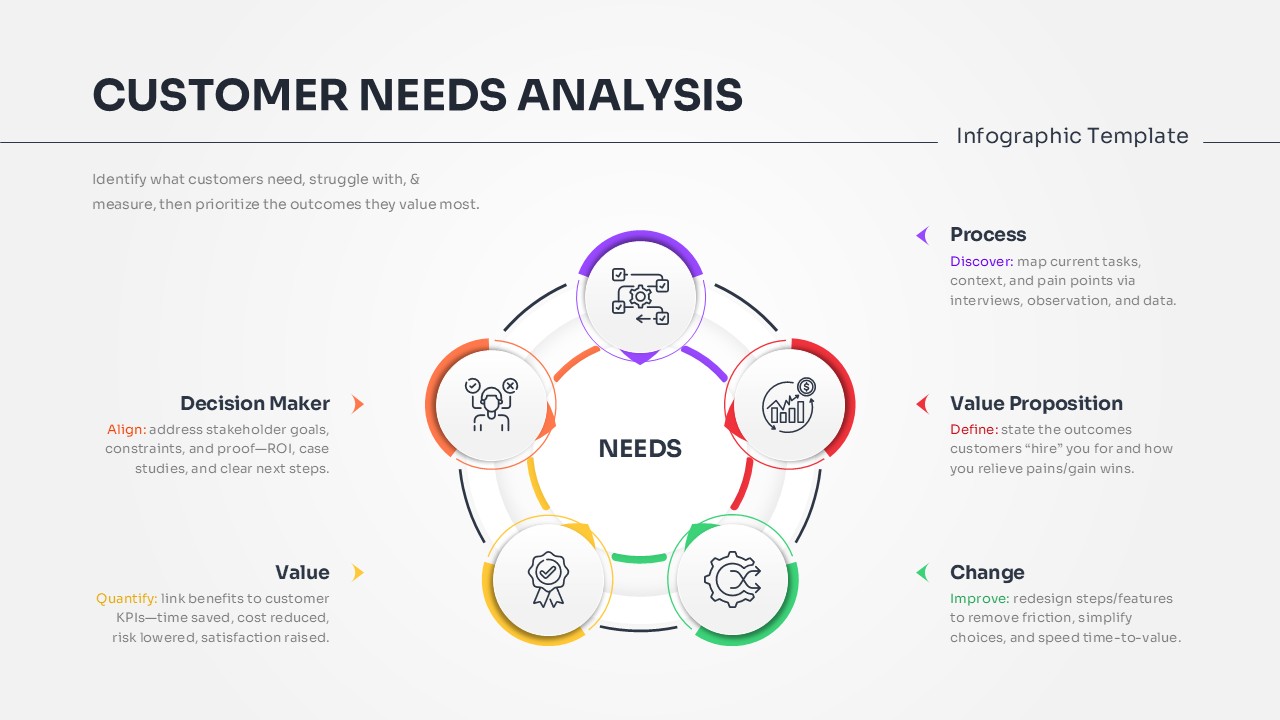
Customer Needs Analysis Template for PowerPoint & Google Slides
Customer Experience
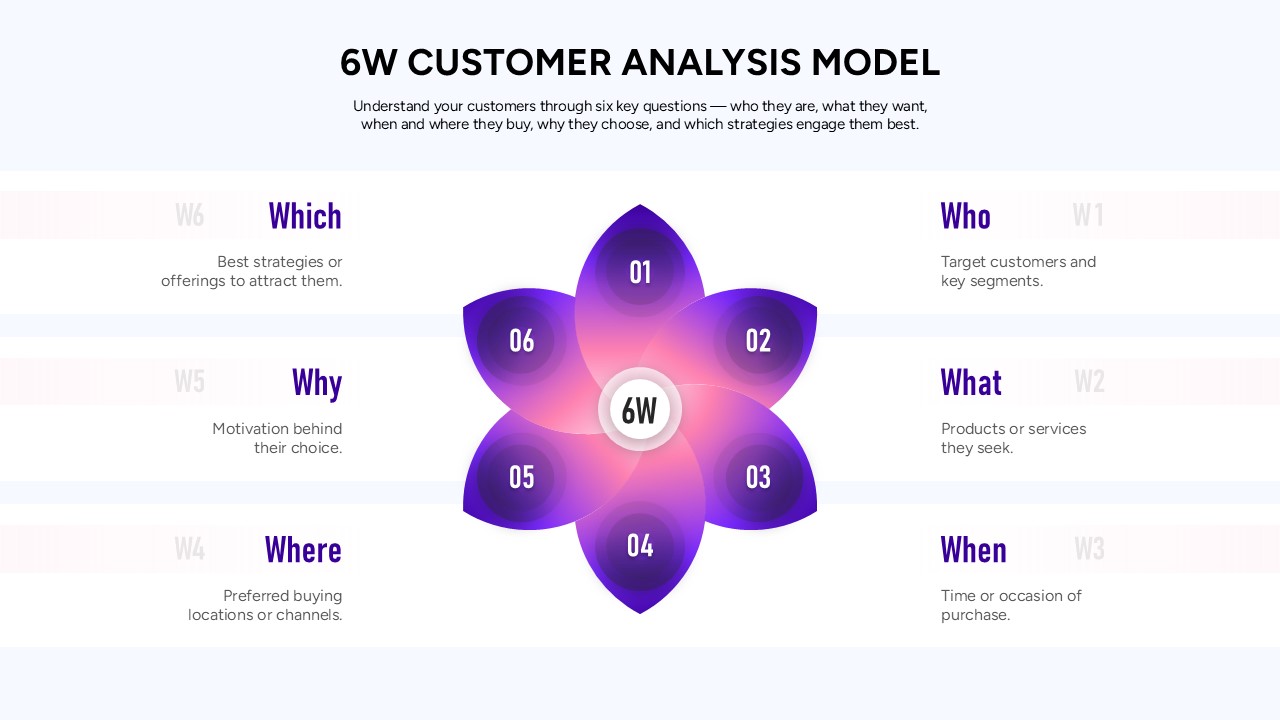
6W Customer Analysis Model Template for PowerPoint & Google Slides
Customer Experience
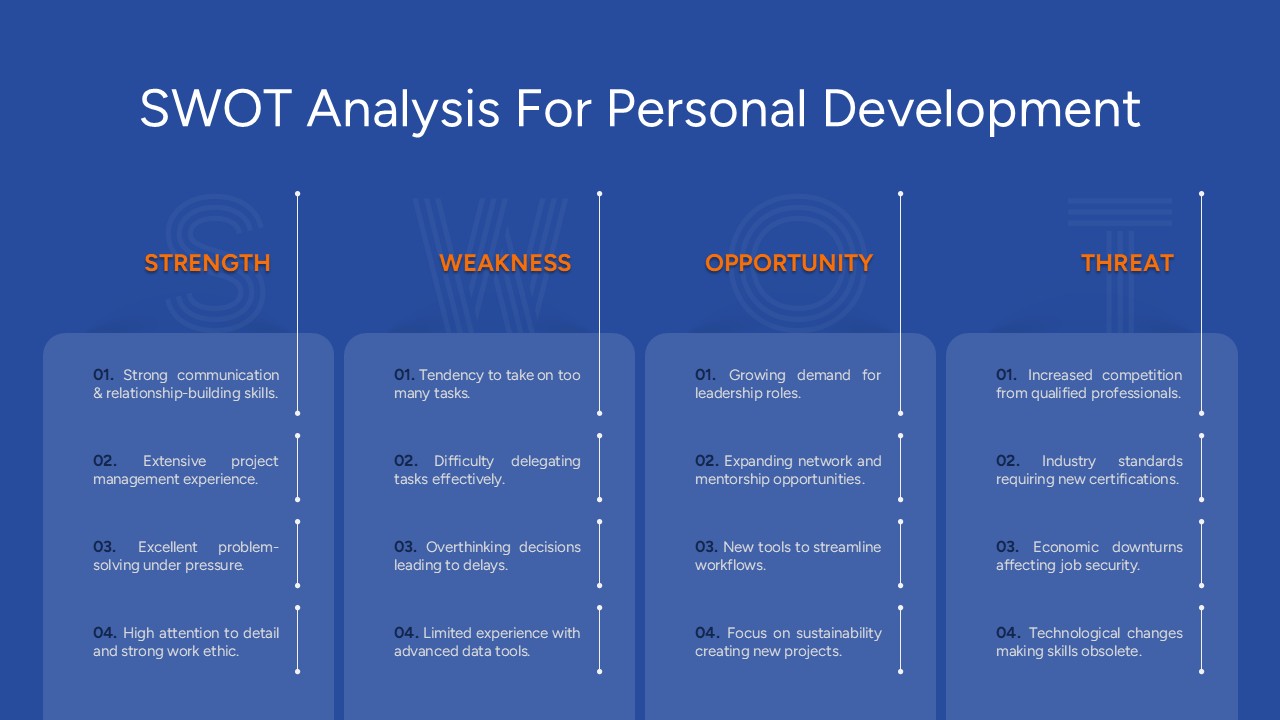
Free SWOT Analysis for Personal Development Template for PowerPoint & Google Slides
SWOT
Free