Integrative Thinking Comparison Diagram Template for PowerPoint & Google Slides


Description
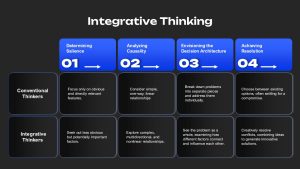
Use this Integrative Thinking infographic slide to contrast two distinct problem-solving mindsets across four sequential stages. At the top, four bold rectangular cards in blue are numbered 01 through 04, labeled Determining Salience, Analyzing Causality, Envisioning the Decision Architecture, and Achieving Resolution. Beneath, a two-row matrix juxtaposes Conventional Thinkers—who focus solely on obvious features, simple linear relationships, piecemeal breakdowns, and compromise—with Integrative Thinkers—who identify less obvious but critical factors, explore multidirectional and nonlinear connections, view problems holistically, and craft innovative resolutions. The clean table structure, featuring light-gray header cells and crisp white content areas, ensures maximum readability and visual hierarchy.
Editable elements such as vector shapes, text placeholders, and color fills allow finance professionals, strategists, or educators to quickly customize labels, swap colors, and resize components without losing fidelity. Master slide integration maintains consistent typography, spacing, and branding across your deck, reducing formatting errors and simplifying updates. The slide’s modular design supports swift duplication for scenario comparisons, side-by-side case studies, or extended frameworks, enabling presenters to adapt the layout for various audiences or topics.
This template enhances comprehension of complex decision-making processes by providing a clear pathway through each thought stage. Whether in corporate strategy meetings, leadership workshops, MBA lectures, or executive briefings, the slide promotes dynamic discussions around prioritization, causality mapping, architectural envisioning, and creative conflict resolution. Seamless performance in both PowerPoint and Google Slides guarantees consistent appearance across devices and platforms.
With support for high-resolution graphics and built-in accessibility features, this slide adheres to best practices for inclusive design, ensuring that color contrast, font size, and structure meet corporate compliance standards. The neutral background and minimal distractions keep attention focused on content, while the bold blue accents reinforce brand identity or thematic consistency. Simply adjust the table’s scale or swap the header labels to reflect alternative frameworks or custom methodologies, making this template a versatile asset across industries.
Who is it for
Business leaders, consultants, executive coaches, trainers, and educators who facilitate strategic planning, decision analysis, and leadership development sessions.
Other Uses
Adapt this slide for risk assessment workshops, design thinking exercises, process mapping, organizational assessments, or any context requiring side-by-side comparison of methodologies or frameworks.
Login to download this file

Item ID
SB04837
Related Templates

Funnel and Flywheel Thinking Comparison template for PowerPoint & Google Slides
Infographics
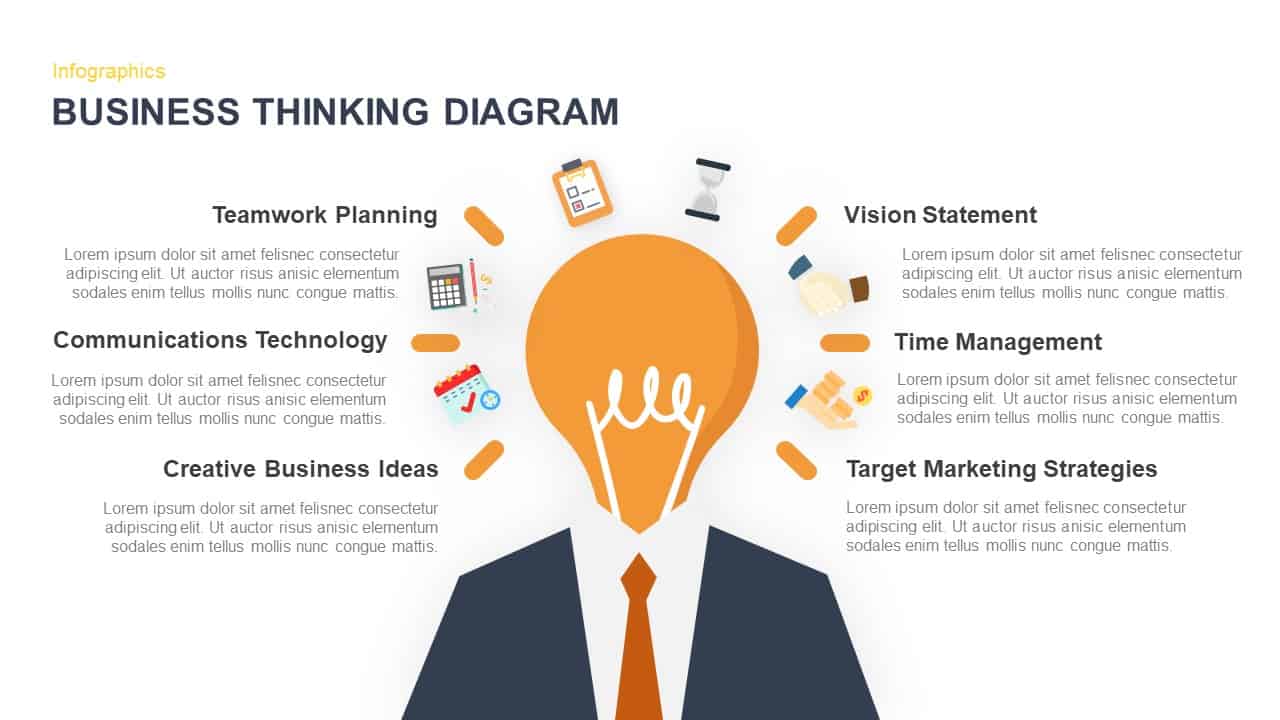
Business Thinking Concept Diagram Template for PowerPoint & Google Slides
Business Strategy
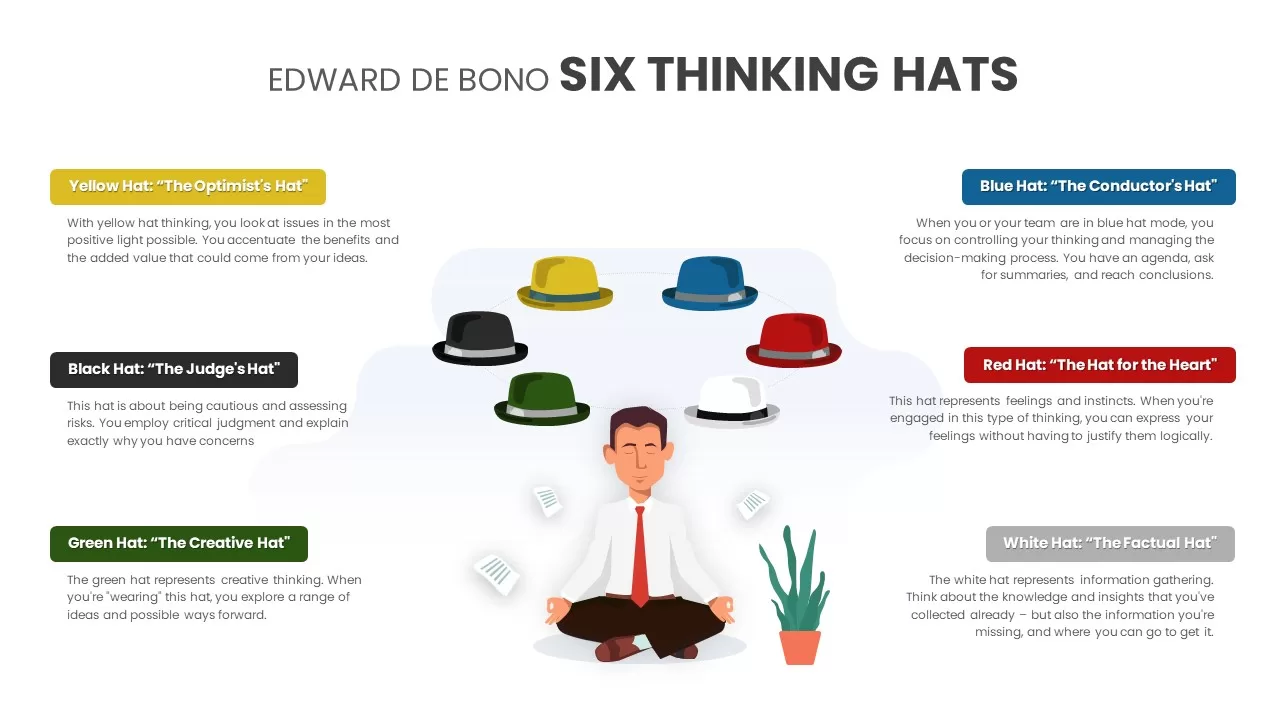
Six Thinking Hats Diagram Presentation Template for PowerPoint & Google Slides
Infographics
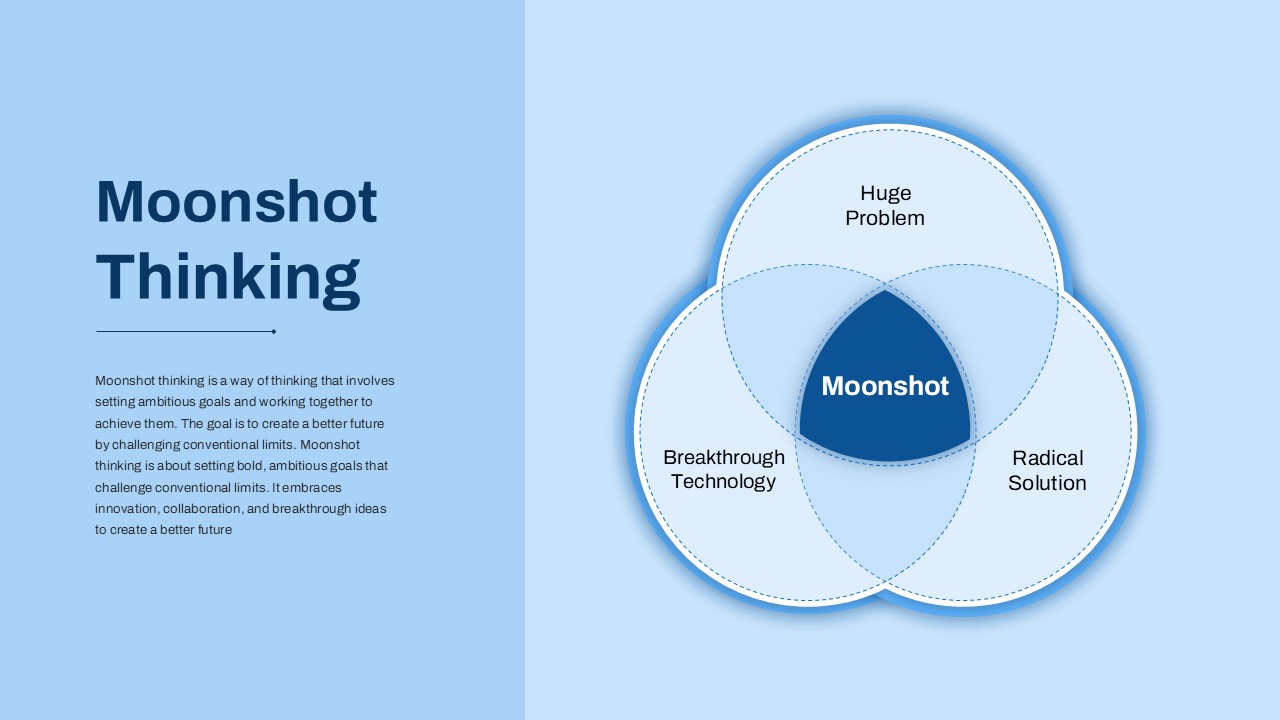
Bold Moonshot Thinking Venn Diagram Template for PowerPoint & Google Slides
Circular

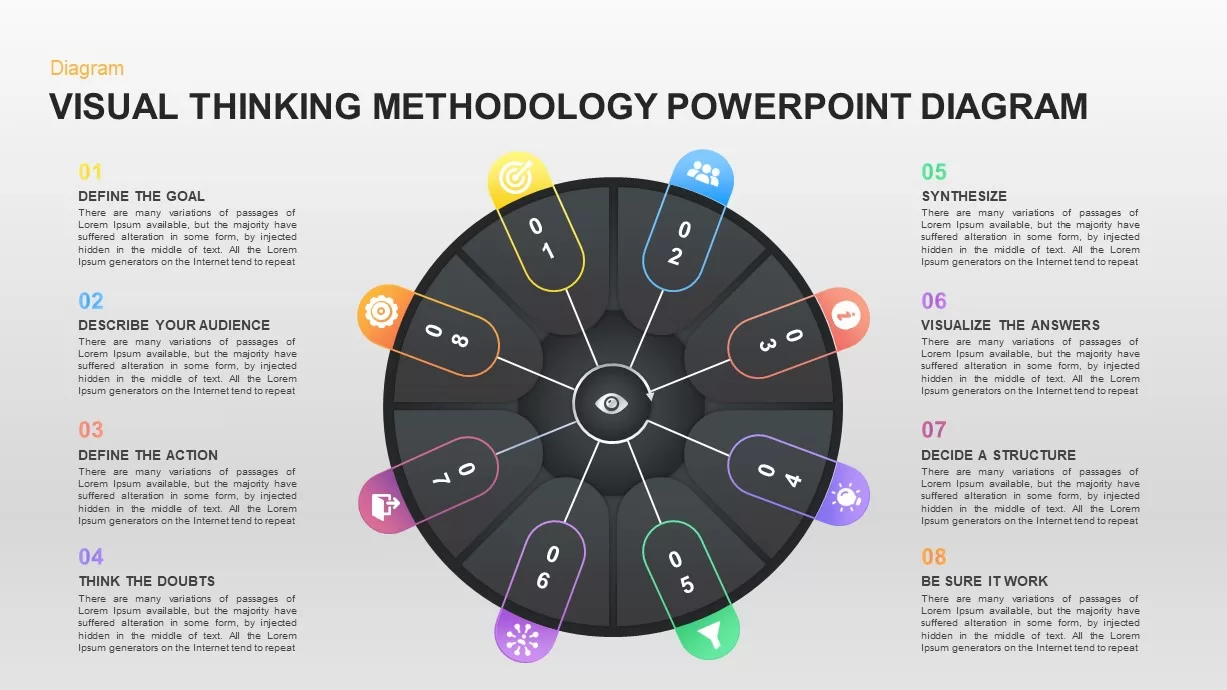
Visual Thinking Methodology diagram for PowerPoint & Google Slides
Process
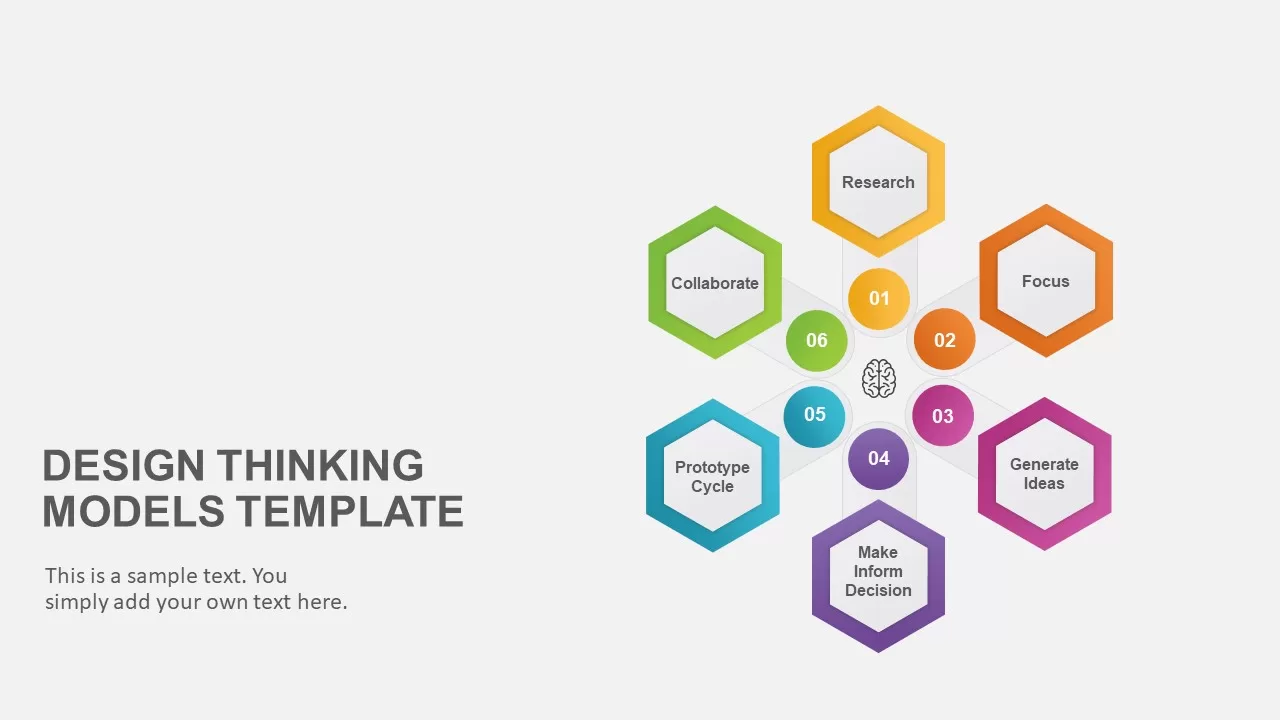
Six-Step Hexagon Design Thinking Models Template for PowerPoint & Google Slides
Circular
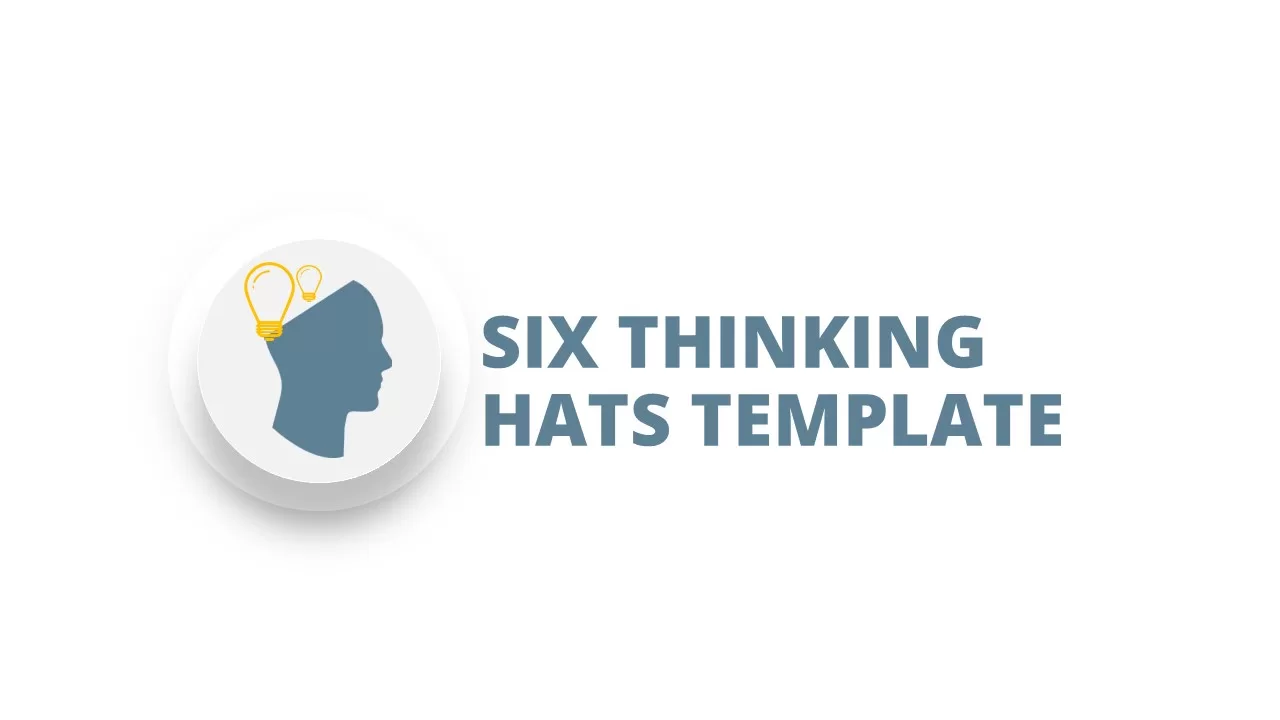
Six Thinking Hats Template for PowerPoint & Google Slides
Business Strategy
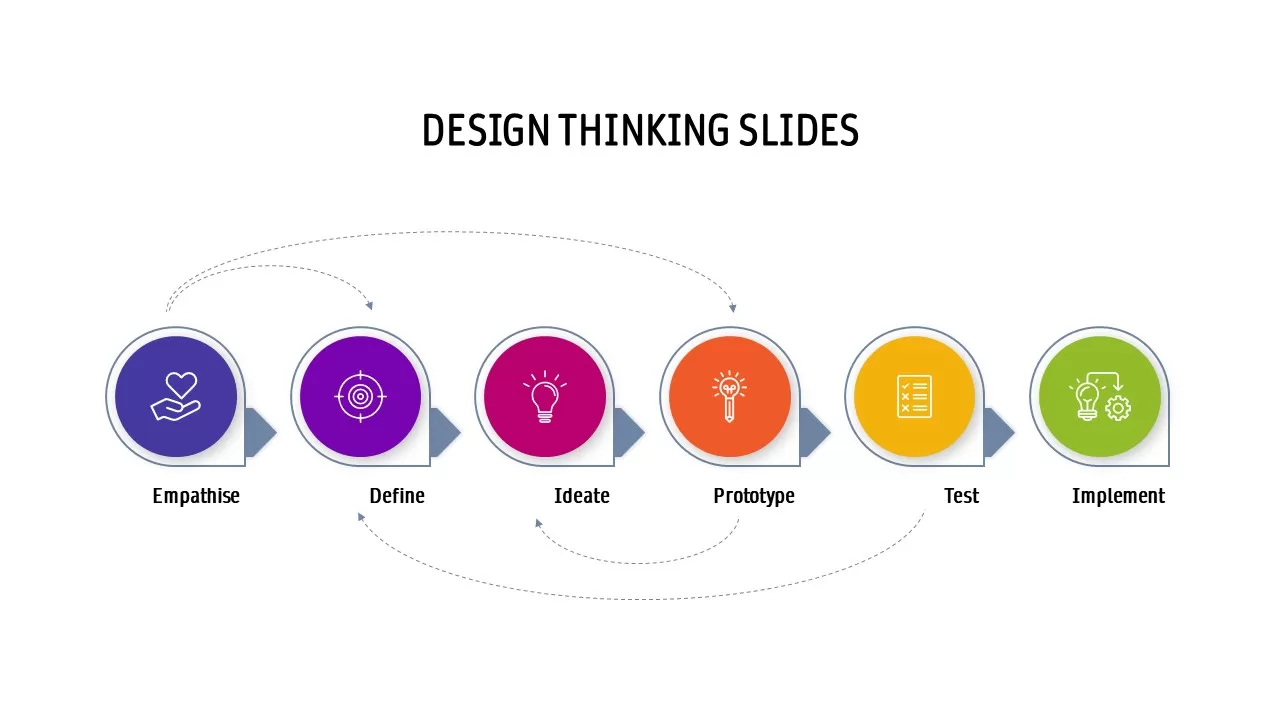
Design Thinking Process Cycle Slide Template for PowerPoint & Google Slides
Process
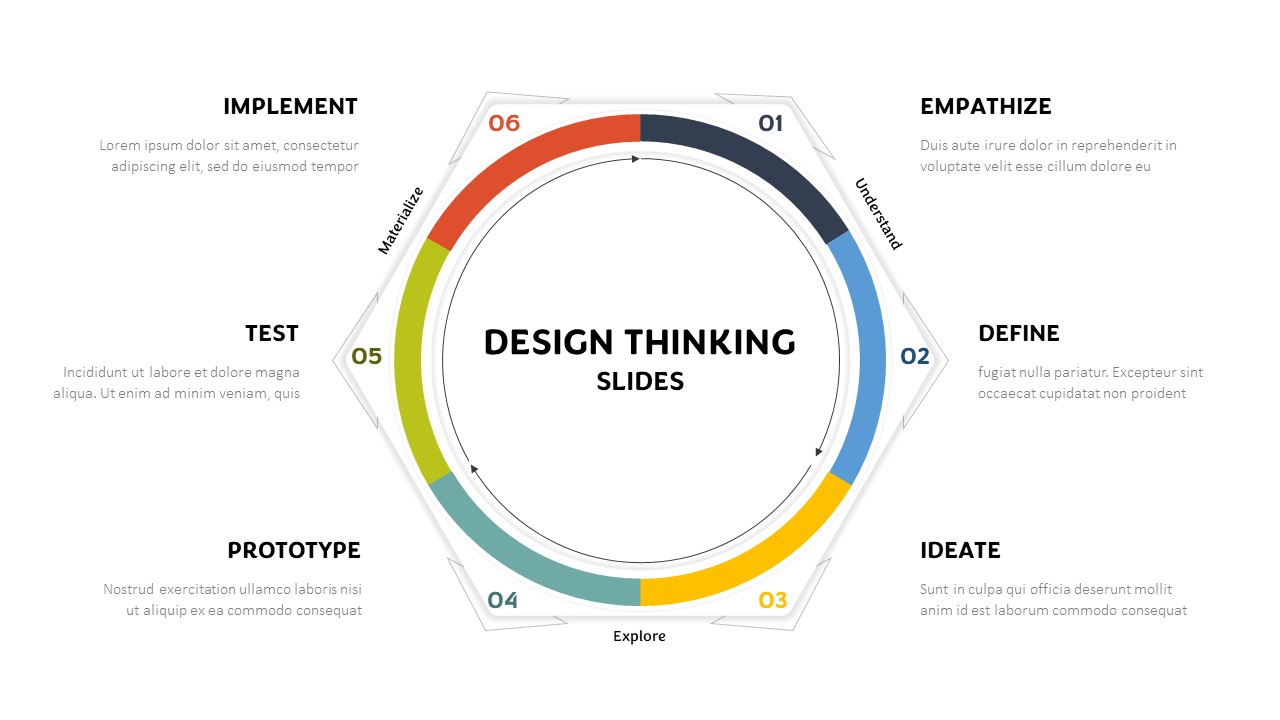
Hexagonal Design Thinking Cycle Template for PowerPoint & Google Slides
Process
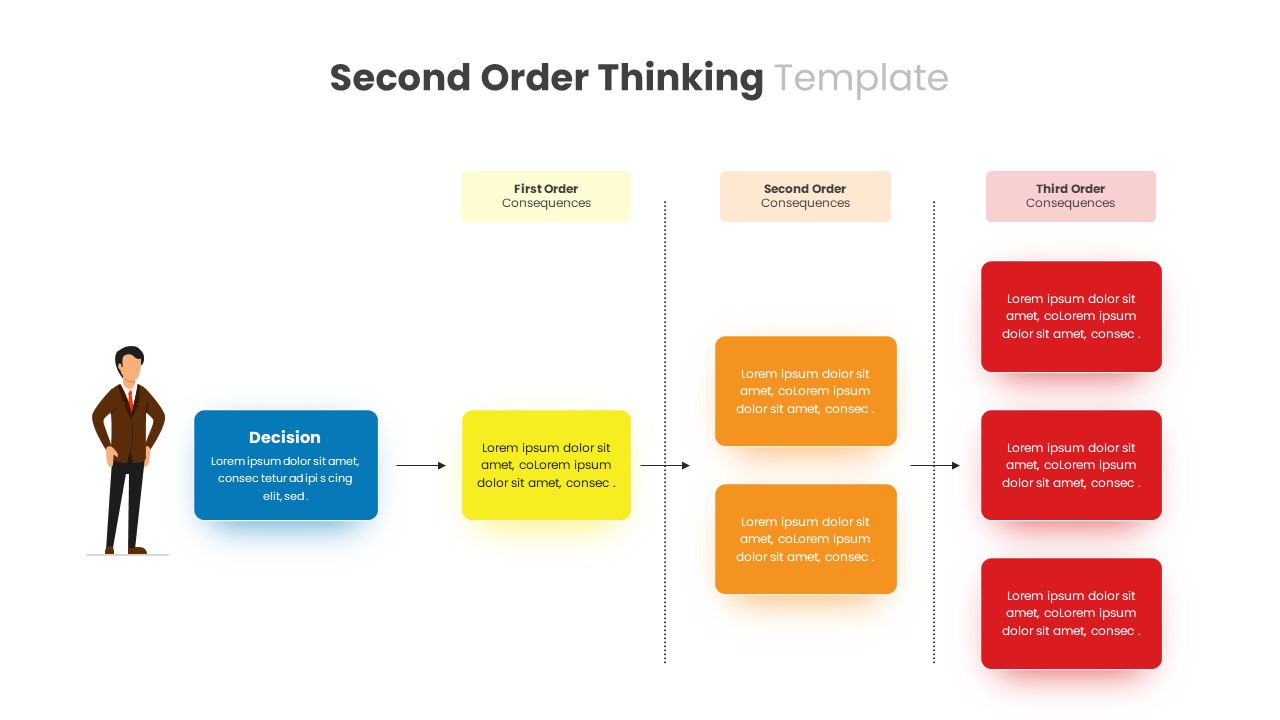
Second Order Thinking Framework template for PowerPoint & Google Slides
Business
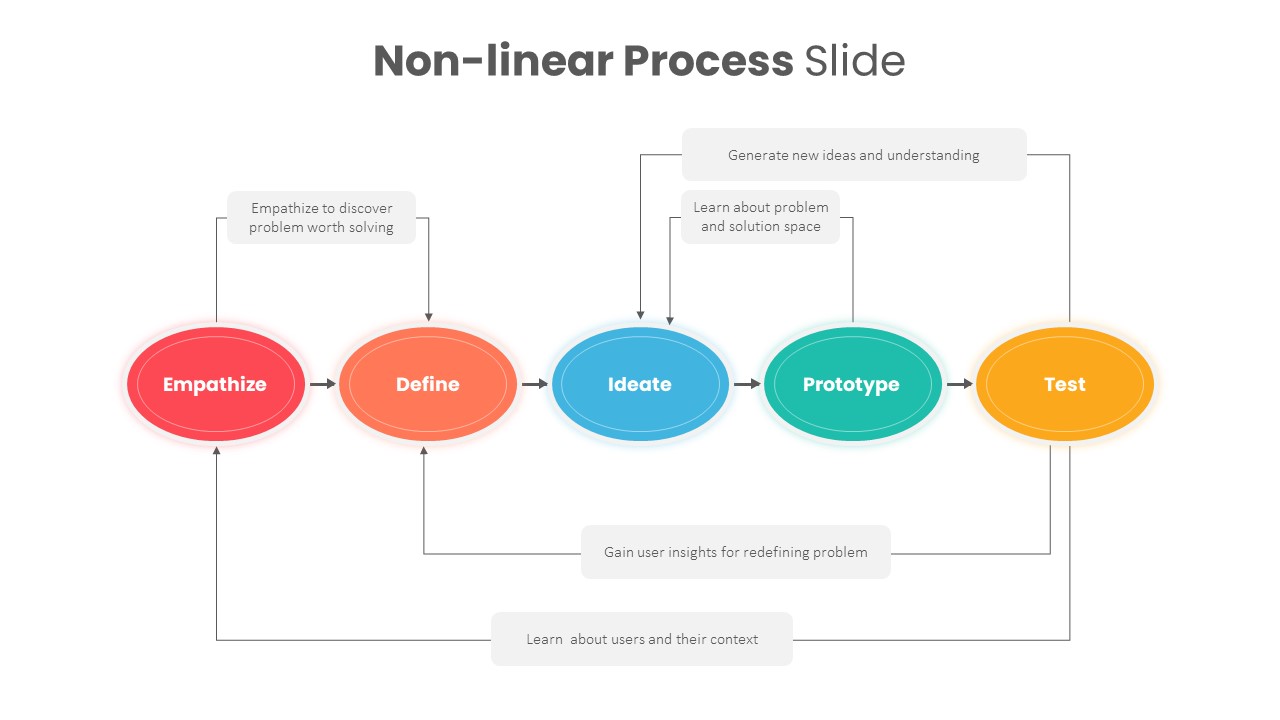
Non-linear Design Thinking Process Template for PowerPoint & Google Slides
Process
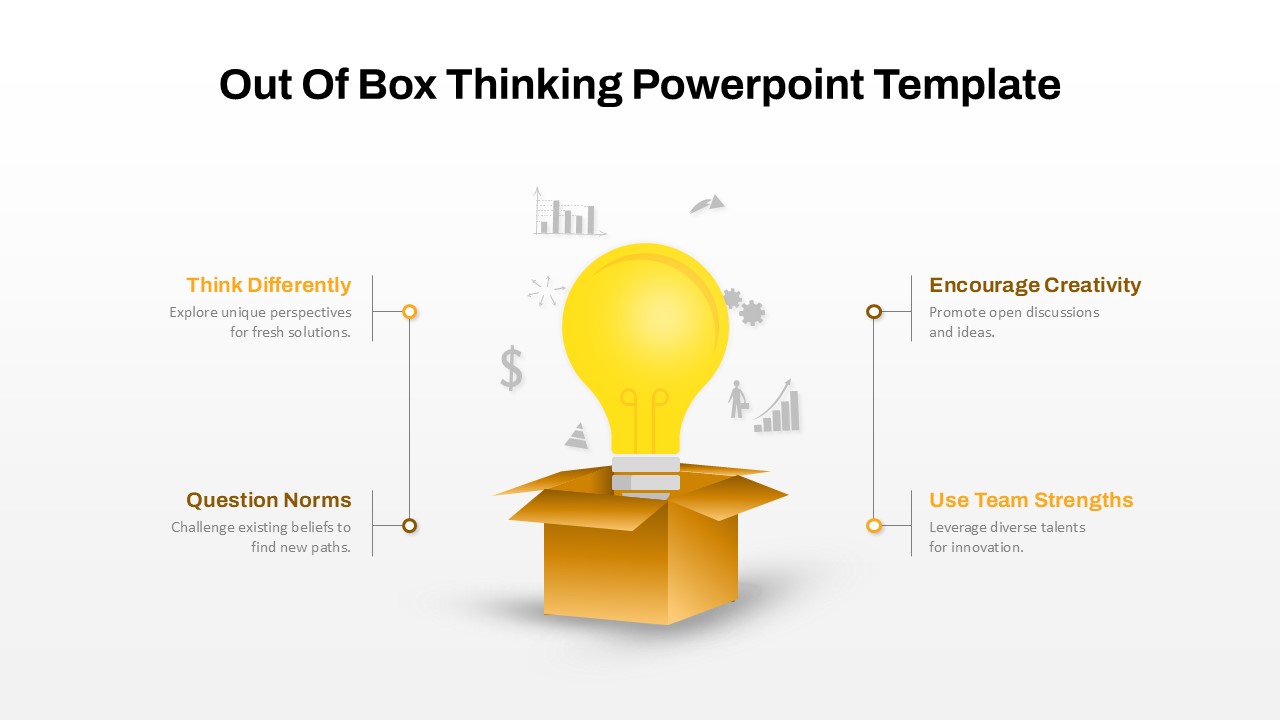
Out of the Box Thinking template for PowerPoint & Google Slides
Business Strategy
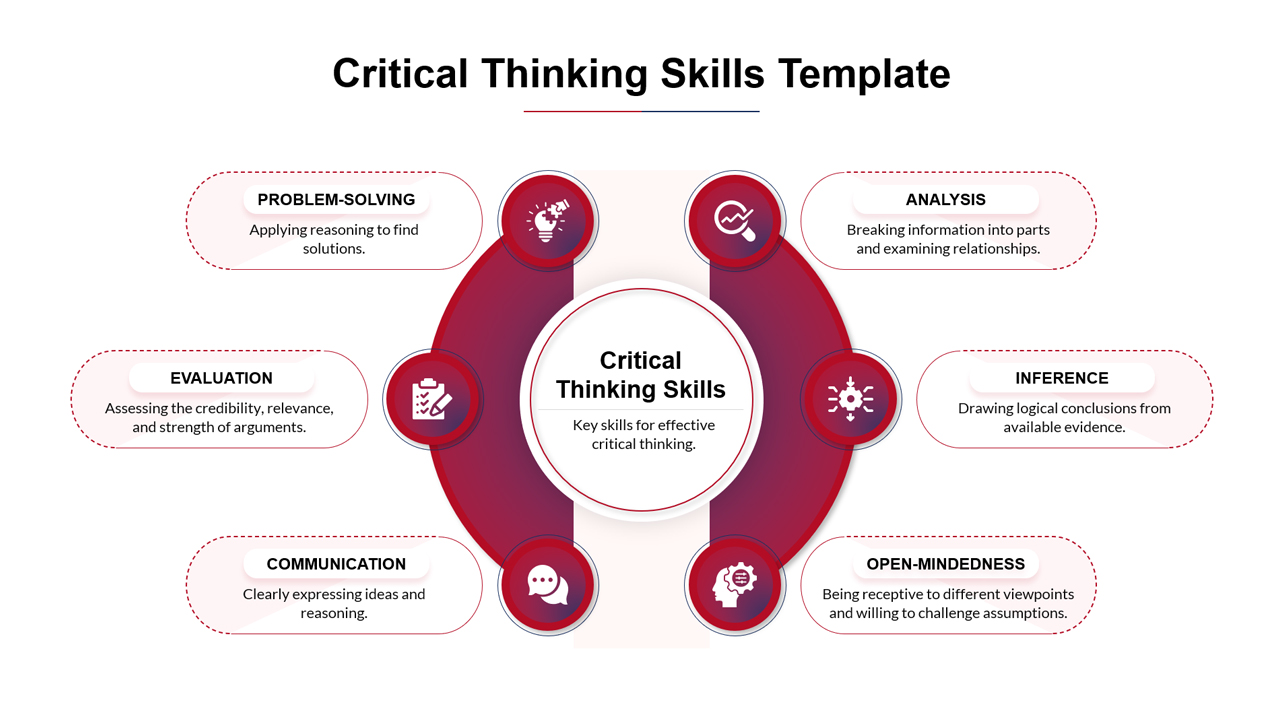
Critical Thinking Skills Template for PowerPoint & Google Slides
Process
Four Section Comparison Chart Diagram Template for PowerPoint & Google Slides
Infographics

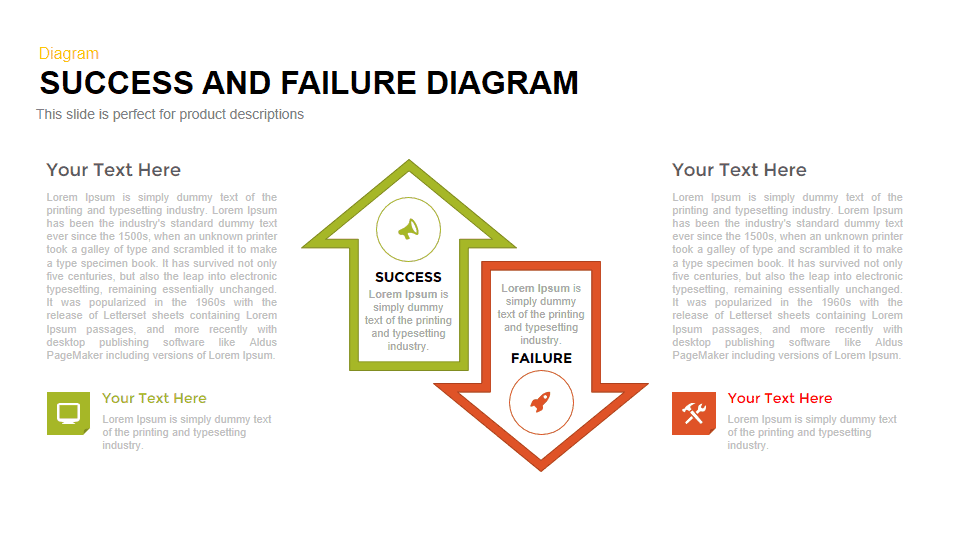
Success vs Failure Comparison Diagram Template for PowerPoint & Google Slides
Comparison
Four Business Structure Types Comparison Diagram Template for PowerPoint & Google Slides
Business Strategy
Isometric 3D Block Comparison Diagram Template for PowerPoint & Google Slides
Comparison
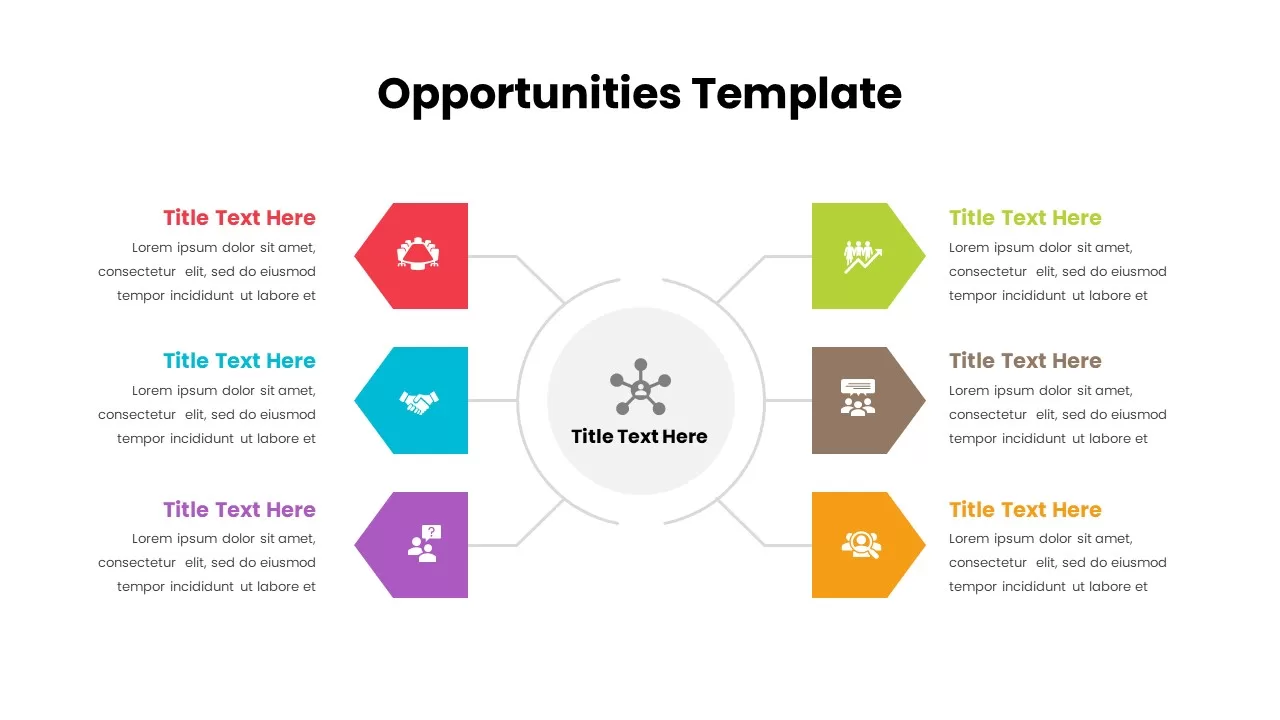
Opportunities Hub-and-Spoke Comparison Diagram Template for PowerPoint & Google Slides
Opportunities Challenges
Market Share Comparison Diagram Template for PowerPoint & Google Slides
Comparison Chart
Two-Sided Coin Comparison Diagram Template for PowerPoint & Google Slides
Comparison
Attribution Models Comparison Diagram Template for PowerPoint & Google Slides
Comparison
Operating Channels Comparison Diagram Template for PowerPoint & Google Slides
Business Models
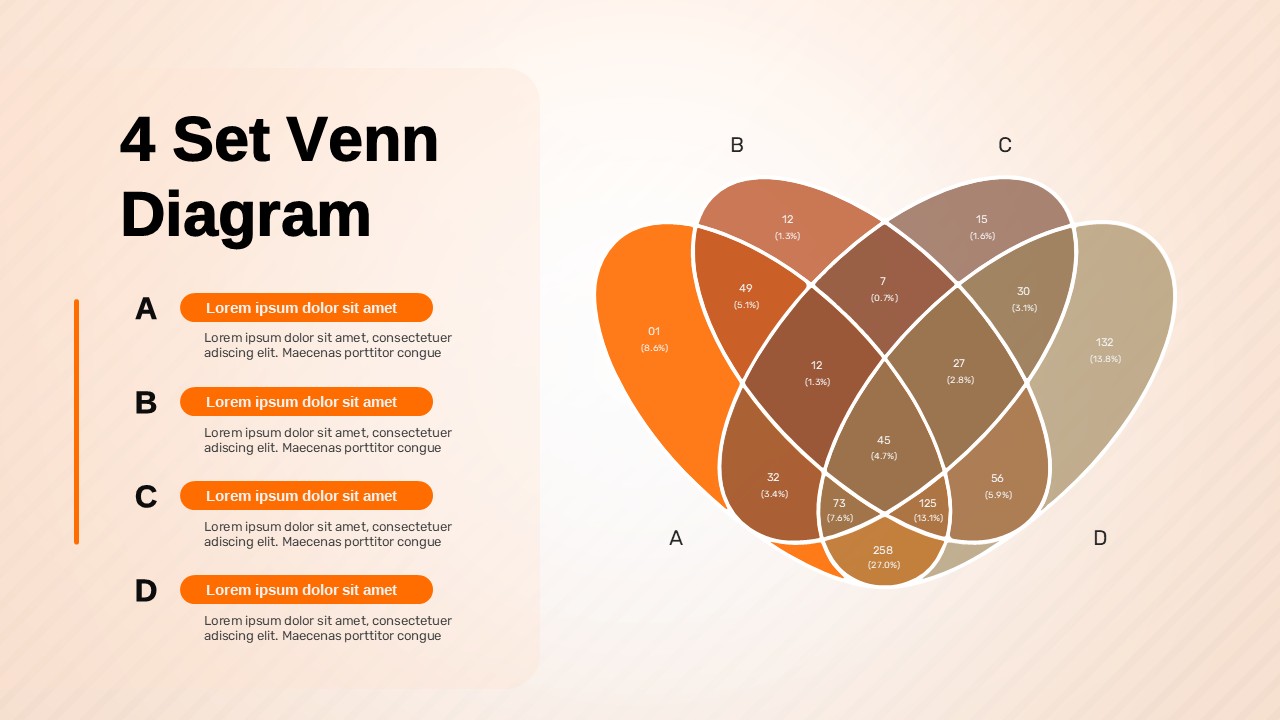
4 Set Venn Diagram Comparison Template for PowerPoint & Google Slides
Comparison
Service Zoom Feature Slides Comparison template for PowerPoint & Google Slides
Process
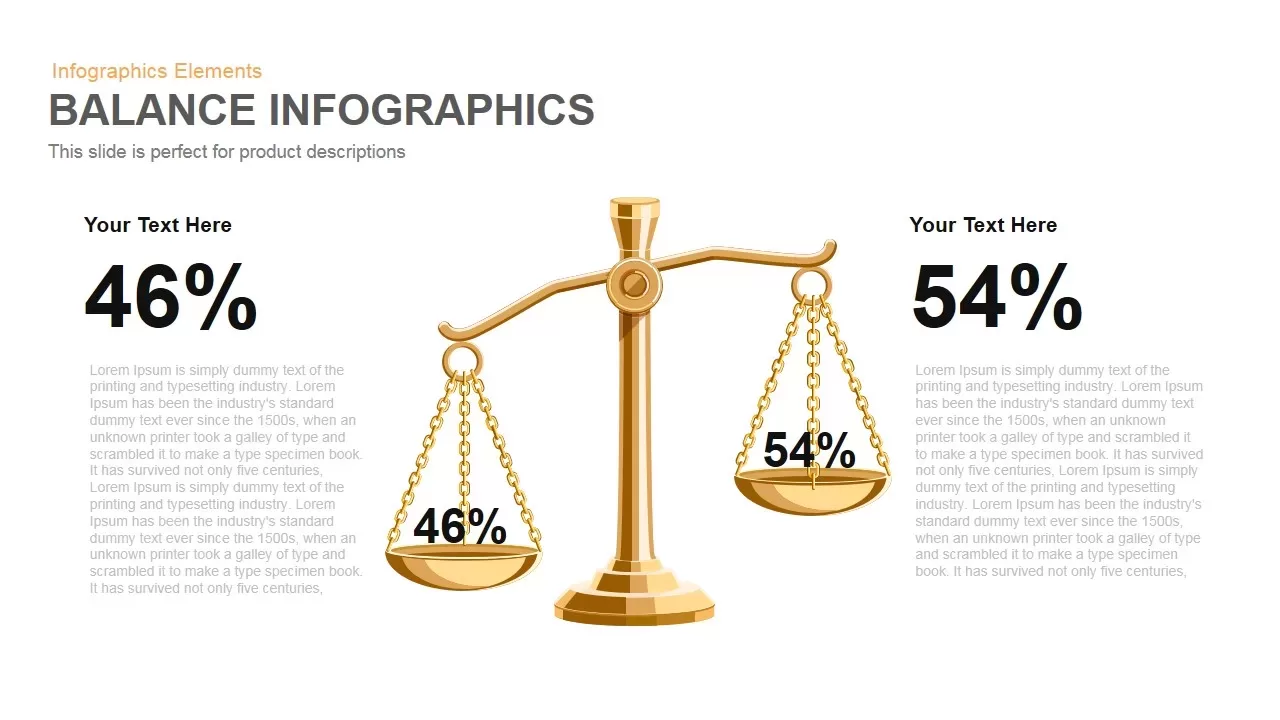
Gold Scales Balance Comparison Template for PowerPoint & Google Slides
Comparison
Four-Tier Pricing Comparison Table Template for PowerPoint & Google Slides
Comparison
Comparison Bar Chart template for PowerPoint & Google Slides
Comparison Chart
3-Column Comparison template for PowerPoint & Google Slides
Comparison

A/B Testing Comparison Infographic template for PowerPoint & Google Slides
Comparison
Scale Metaphor Metrics Comparison Template for PowerPoint & Google Slides
Charts
Four-Plan Pricing Table Comparison Template for PowerPoint & Google Slides
Comparison
Dual Percentage Comparison Metaphor Template for PowerPoint & Google Slides
Comparison
Interactive Product Comparison Bar Chart Template for PowerPoint & Google Slides
Bar/Column
Gender Comparison People Infographic Template for PowerPoint & Google Slides
Comparison
Comparison Chart Overview template for PowerPoint & Google Slides
Comparison Chart
Dynamic Multicolor Comparison Table Template for PowerPoint & Google Slides
Comparison
Interactive Pricing Plan Comparison Template for PowerPoint & Google Slides
Comparison
Five-Option Text Boxes Table Comparison Template for PowerPoint & Google Slides
Business Report
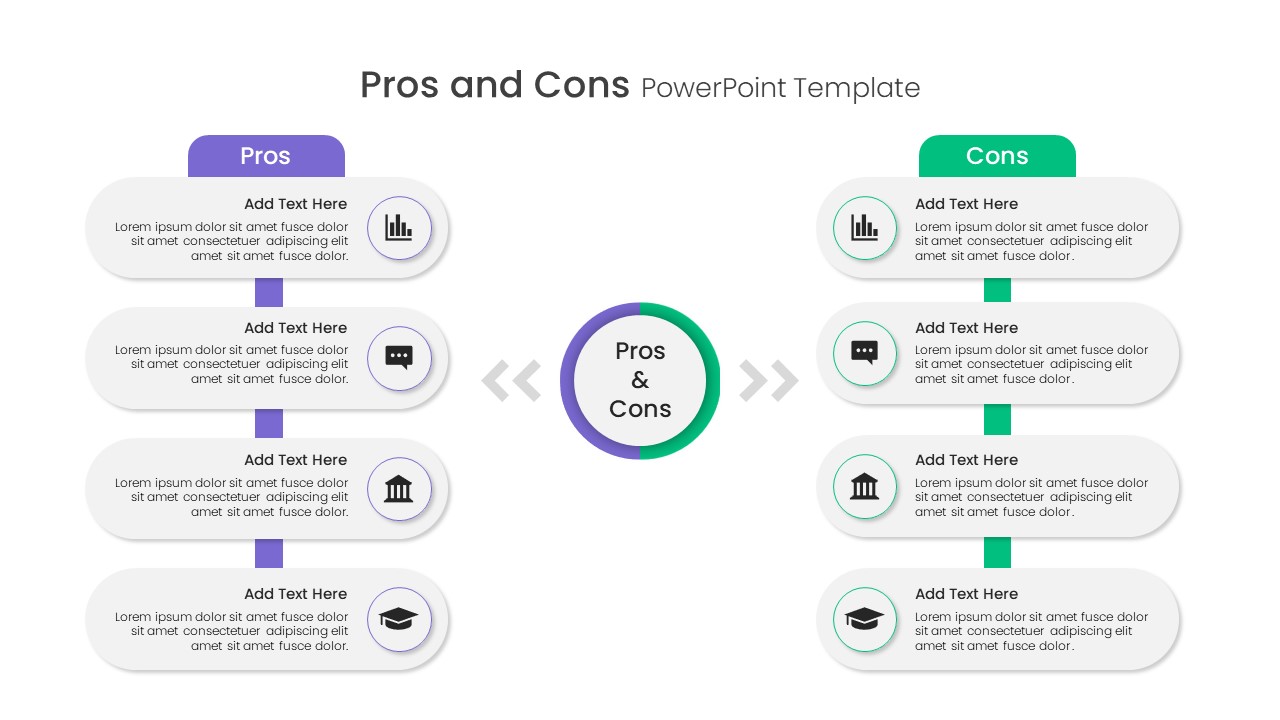
Pros and Cons Comparison Slide Template for PowerPoint & Google Slides
Comparison
Seller Portals Comparison Infographic Template for PowerPoint & Google Slides
Process
Fact and Figures Comparison Slide Template for PowerPoint & Google Slides
Business Report
BMI Category Comparison Chart Template for PowerPoint & Google Slides
Comparison
Generations Comparison Infographic Template for PowerPoint & Google Slides
Timeline
Circular Product Comparison Chart Template for PowerPoint & Google Slides
Comparison Chart
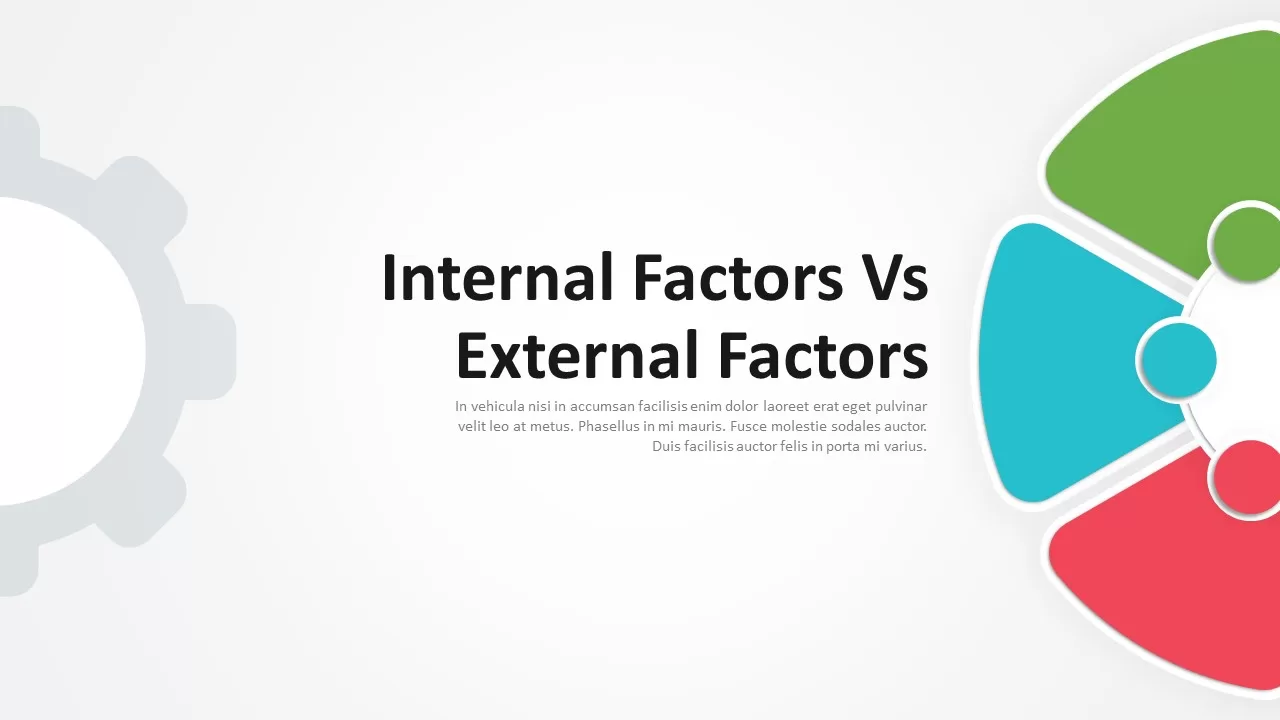
Internal vs External Factors Comparison Template for PowerPoint & Google Slides
Comparison
Theory X and Theory Y Comparison Template for PowerPoint & Google Slides
Comparison
Competitive Landscape Comparison Template Pack for PowerPoint & Google Slides
Comparison
Before and After Comparison Infographics Template for PowerPoint & Google Slides
Comparison
Current vs Future State Comparison Slide Template for PowerPoint & Google Slides
Comparison Chart
Before and After Comparison Infographic Template for PowerPoint & Google Slides
Comparison
Free
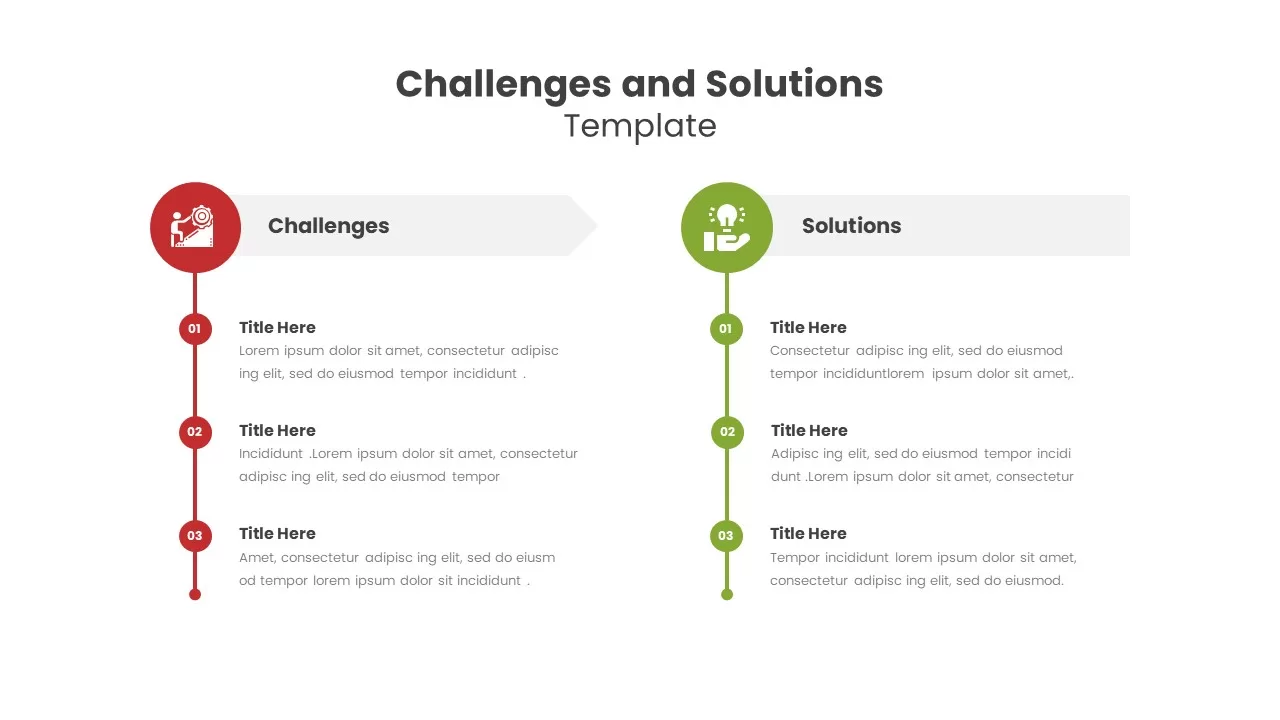
Challenges and Solutions Comparison Template for PowerPoint & Google Slides
Opportunities Challenges
Dynamic Benchmarking Comparison Chart Template for PowerPoint & Google Slides
Comparison Chart
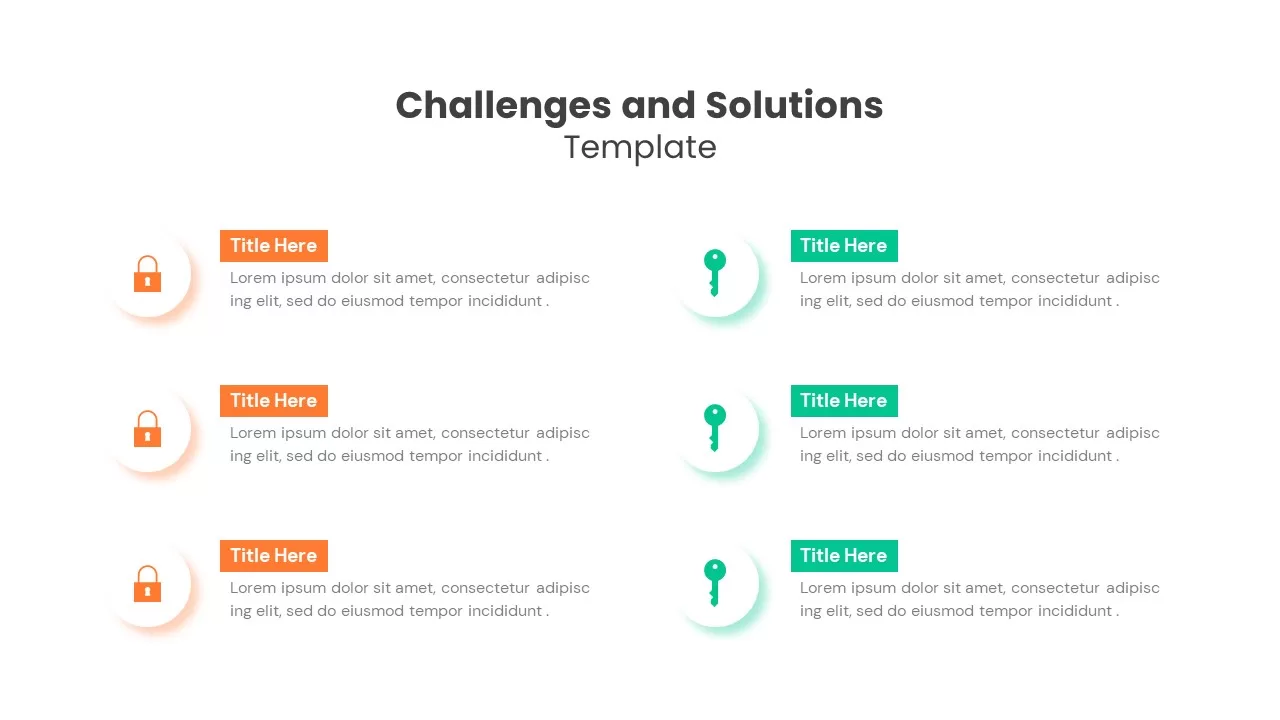
Challenges & Solutions Comparison Template for PowerPoint & Google Slides
Opportunities Challenges
Cost Benefit Analysis Comparison Template for PowerPoint & Google Slides
Comparison
Adam’s Equity Theory Scale Comparison Template for PowerPoint & Google Slides
Comparison
Risk Heatmap Comparison Template for PowerPoint & Google Slides
Maps
Heatmap Comparison Template for PowerPoint & Google Slides
Maps
Vendor Comparison Analysis template for PowerPoint & Google Slides
Comparison Chart
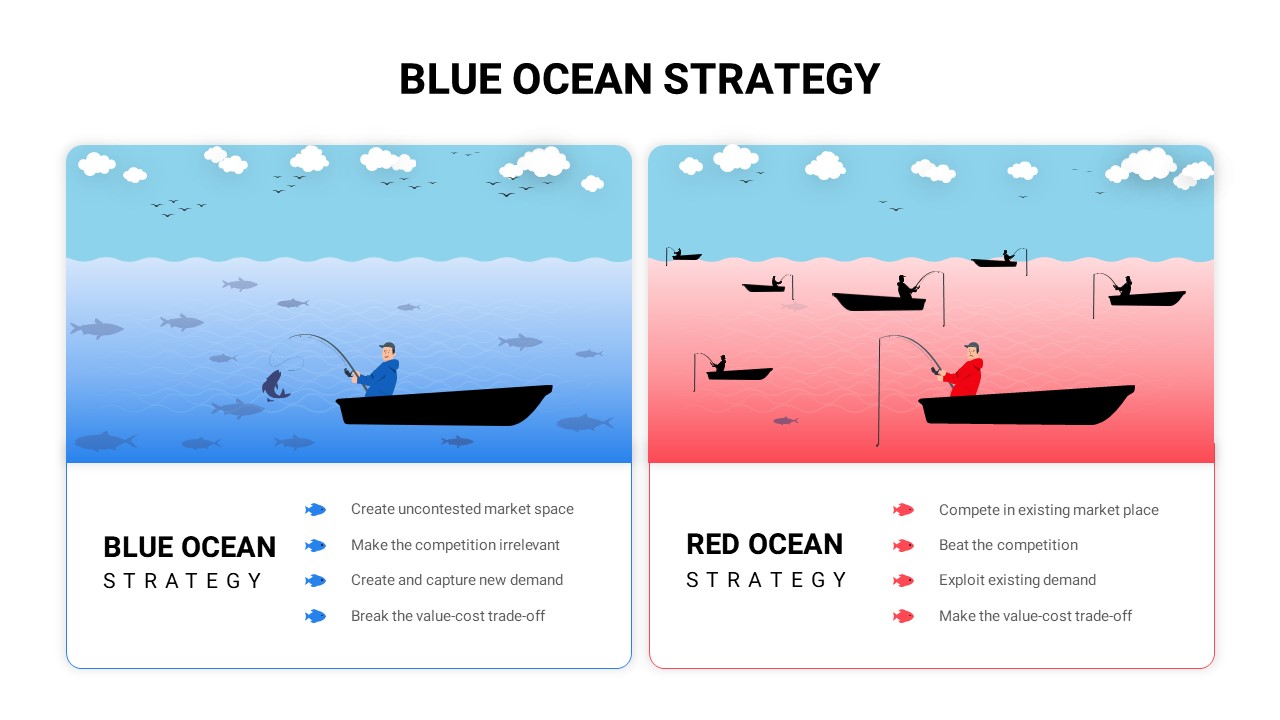
Blue vs Red Ocean Strategy Comparison Template for PowerPoint & Google Slides
Business Strategy
People Demographic Comparison Chart Template for PowerPoint & Google Slides
Comparison
Conflict Infographics Comparison Template for PowerPoint & Google Slides
Infographics
Clustered Bar Chart Comparison Template for PowerPoint & Google Slides
Bar/Column
Business Timeline Comparison Bar Chart Template for PowerPoint & Google Slides
Comparison Chart
Grouped Column Chart Comparison Template for PowerPoint & Google Slides
Bar/Column
Multiple Line Chart Comparison Template for PowerPoint & Google Slides
Comparison Chart
Mirror Bar Chart Comparison Template for PowerPoint & Google Slides
Bar/Column
Interactive Multi-Use Cost Comparison Template for PowerPoint & Google Slides
Comparison
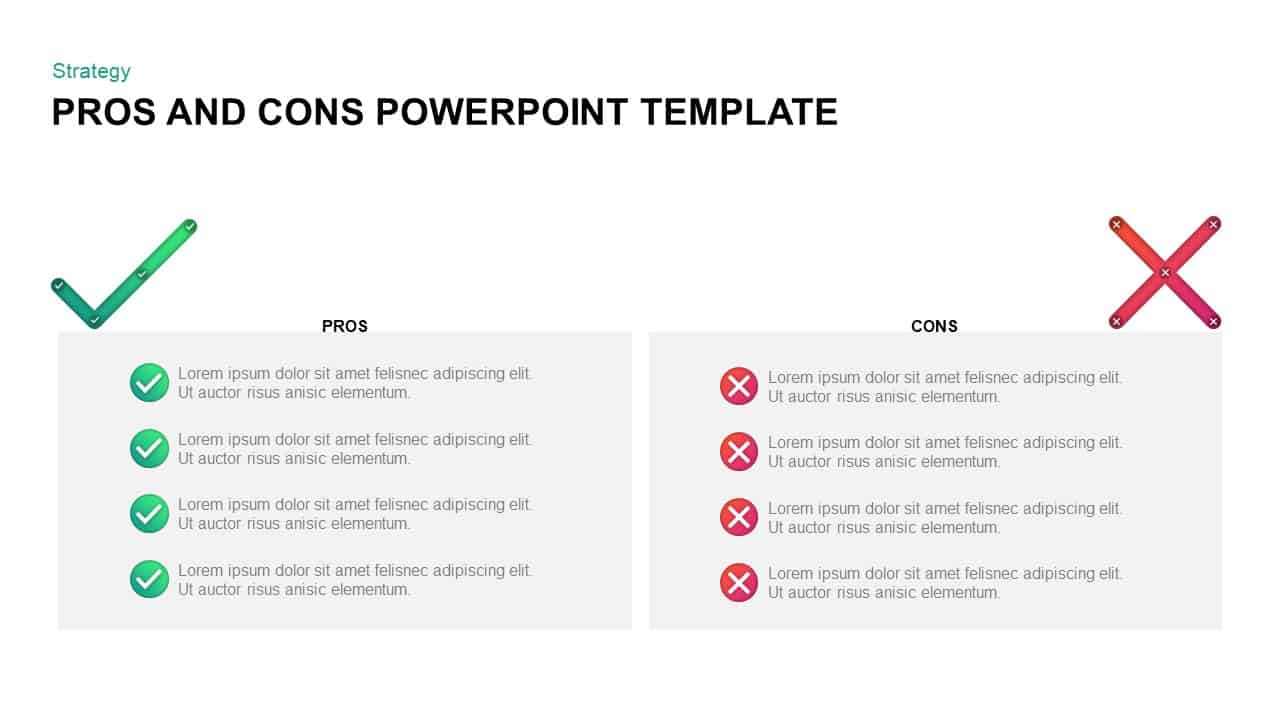
Free Pros and Cons Comparison Template for PowerPoint & Google Slides
Comparison
Free
Free Global Warming Infographic Comparison Template for PowerPoint & Google Slides
Comparison Chart
Free
Dynamic Bar-of-Pie Chart Comparison Template for PowerPoint & Google Slides
Pie/Donut
Types of AI Comparison Infographic Template for PowerPoint & Google Slides
AI
ESG Initiatives Comparison Chart Template for PowerPoint & Google Slides
Business
Economies of Scale Cost Curve Comparison Template for PowerPoint & Google Slides
Comparison Chart
Regional Revenue Comparison Overview Template for PowerPoint & Google Slides
Comparison
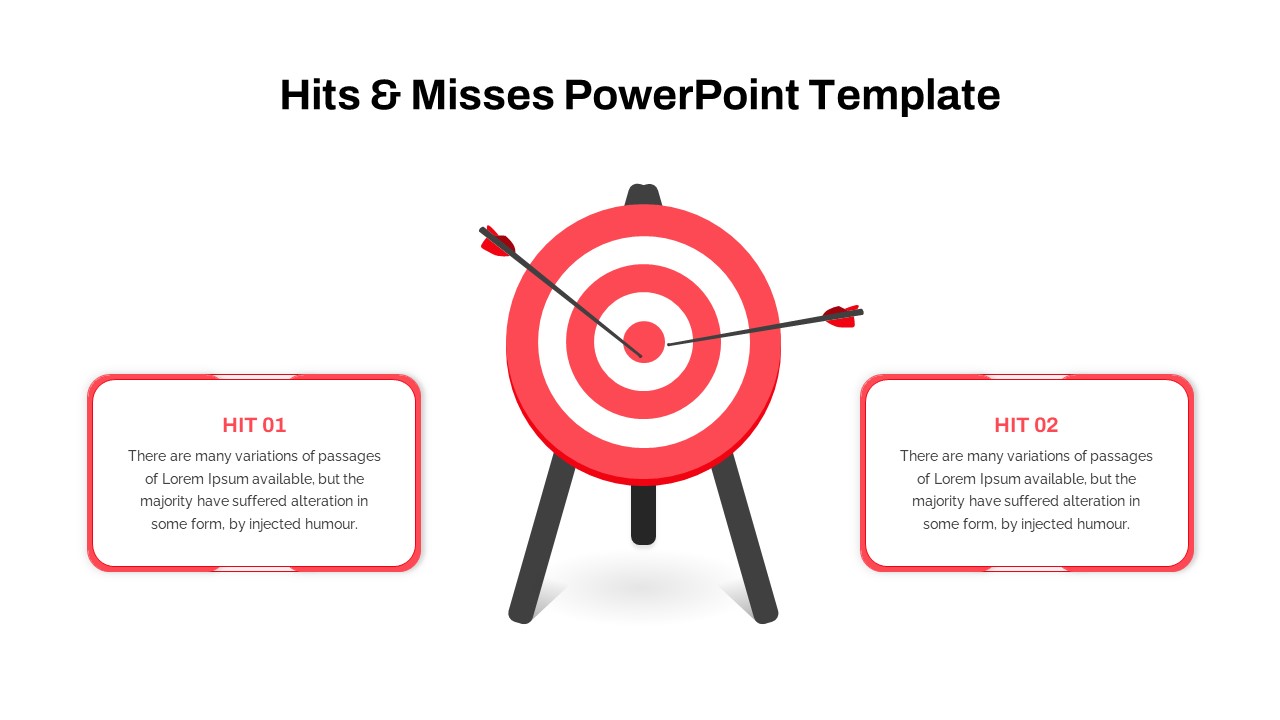
Hits & Misses Comparison Infographic Template for PowerPoint & Google Slides
Pitch Deck
Pricing Model Types Comparison Infographic Template for PowerPoint & Google Slides
Pitch Deck
Risk Level Gauge Comparison Dashboard Template for PowerPoint & Google Slides
Comparison
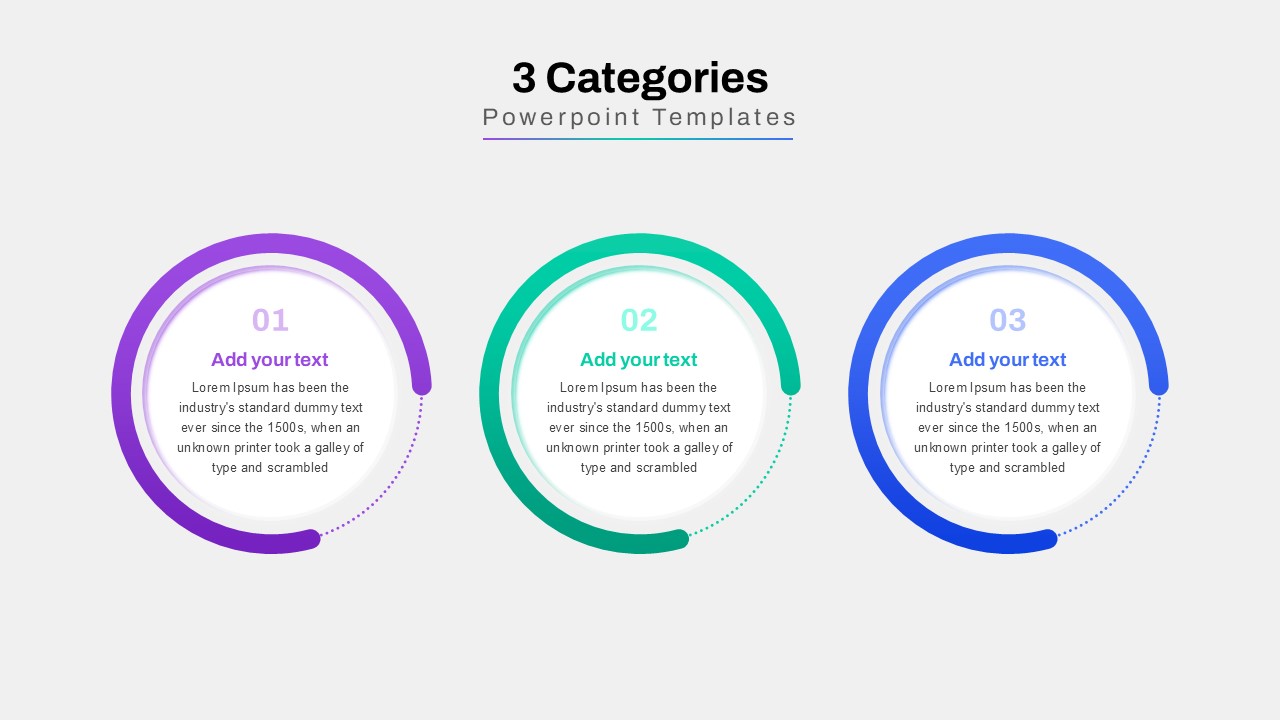
Three-Category Comparison Template for PowerPoint & Google Slides
Comparison
Profile Comparison Chart template for PowerPoint & Google Slides
Comparison Chart
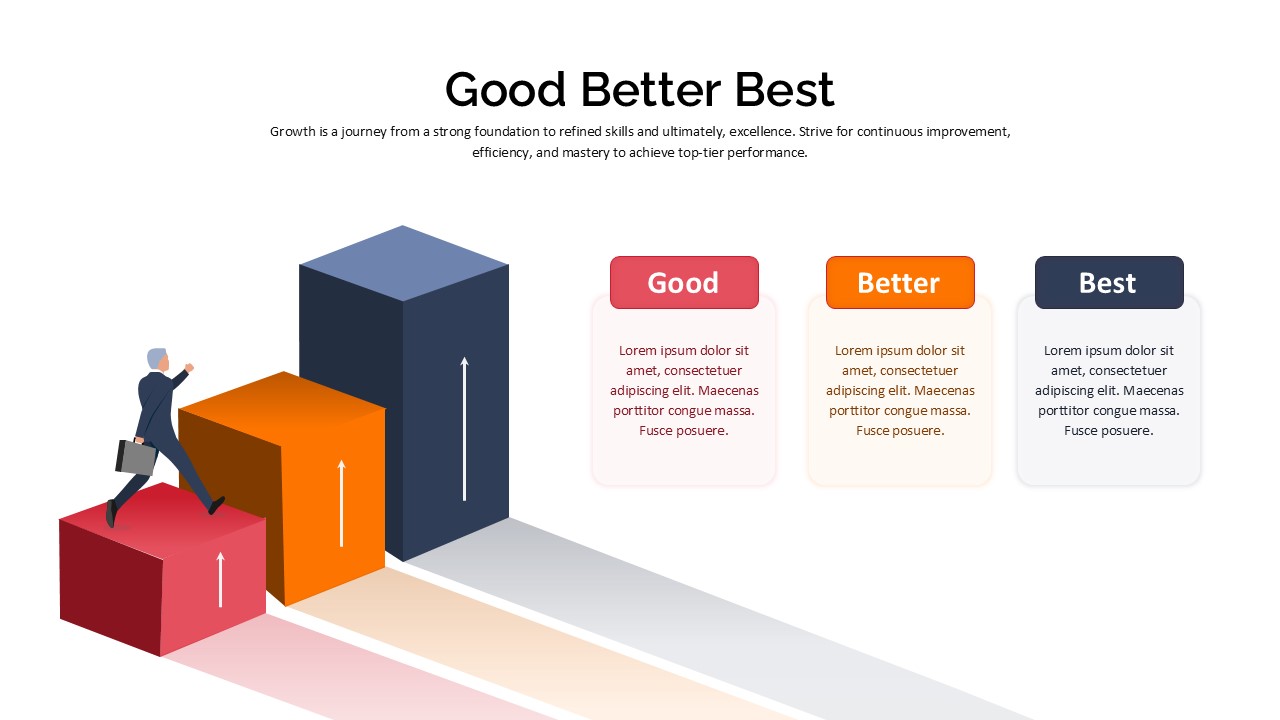
Good Better Best Comparison template for PowerPoint & Google Slides
Comparison
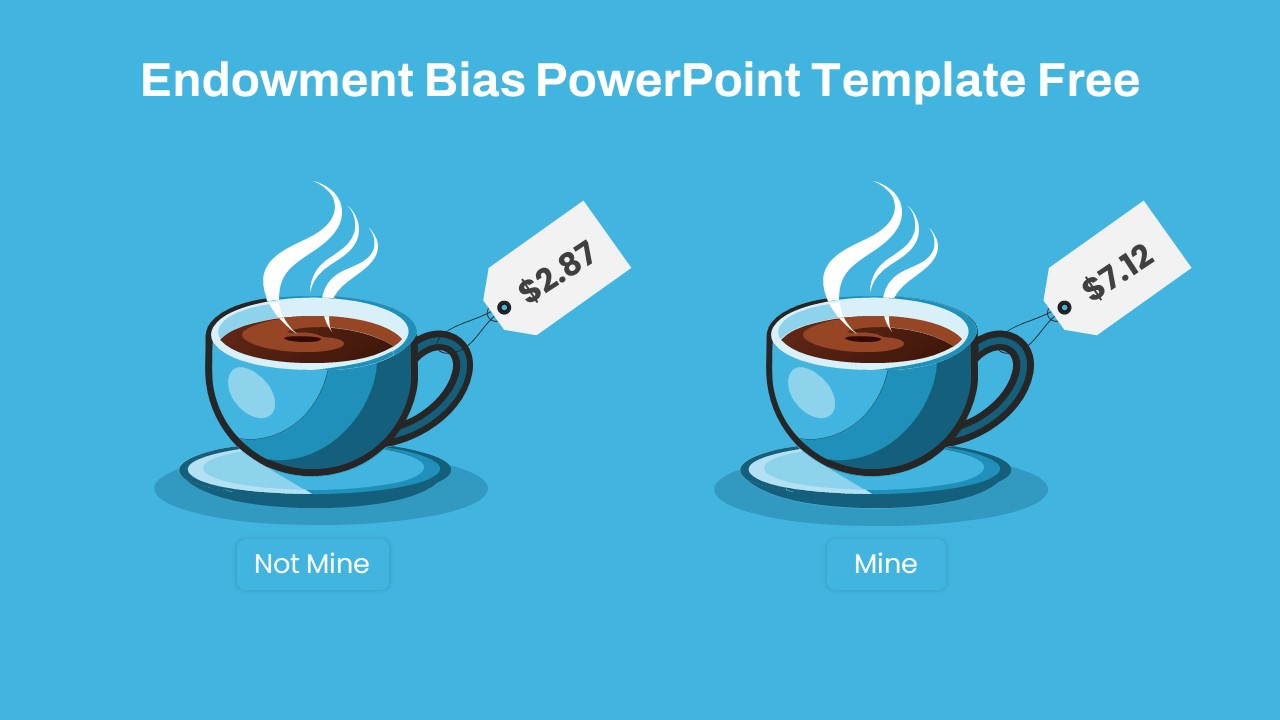
Endowment Bias Coffee Price Comparison Template for PowerPoint & Google Slides
Comparison
Free
Sales Growth Comparison Chart & Table Template for PowerPoint & Google Slides
Bar/Column
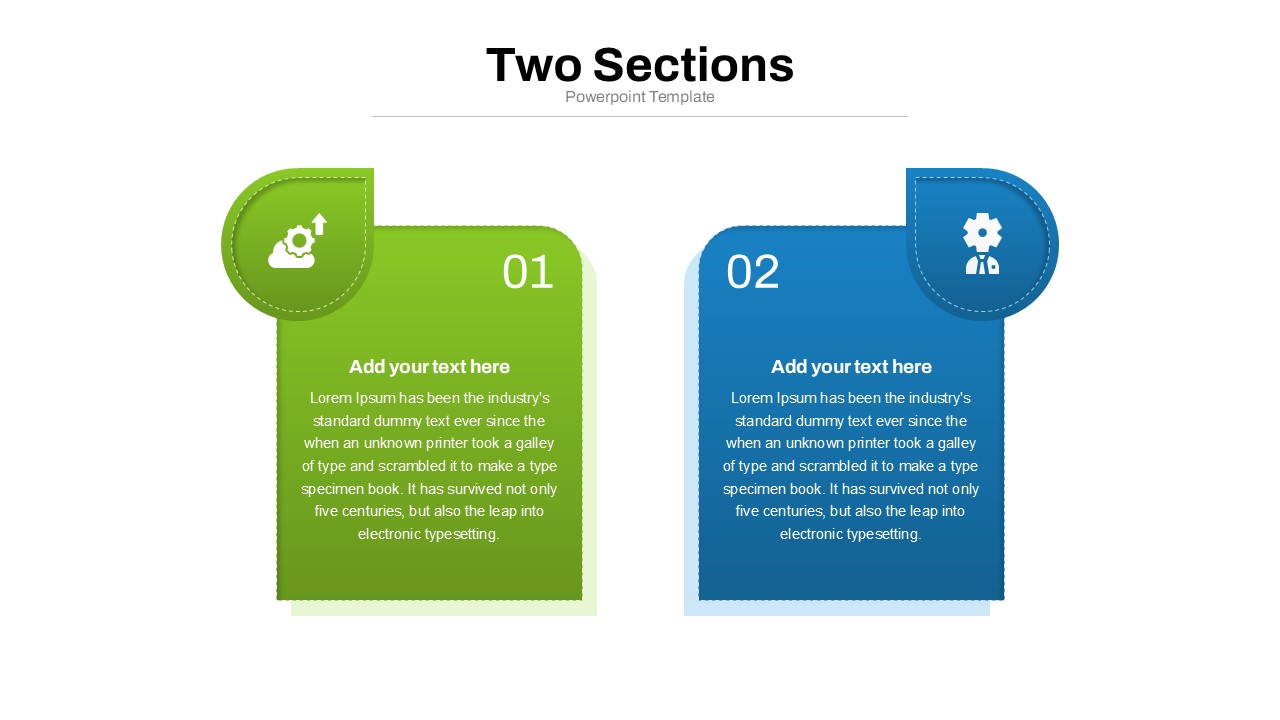
Two Section Comparison template for PowerPoint & Google Slides
Business Proposal
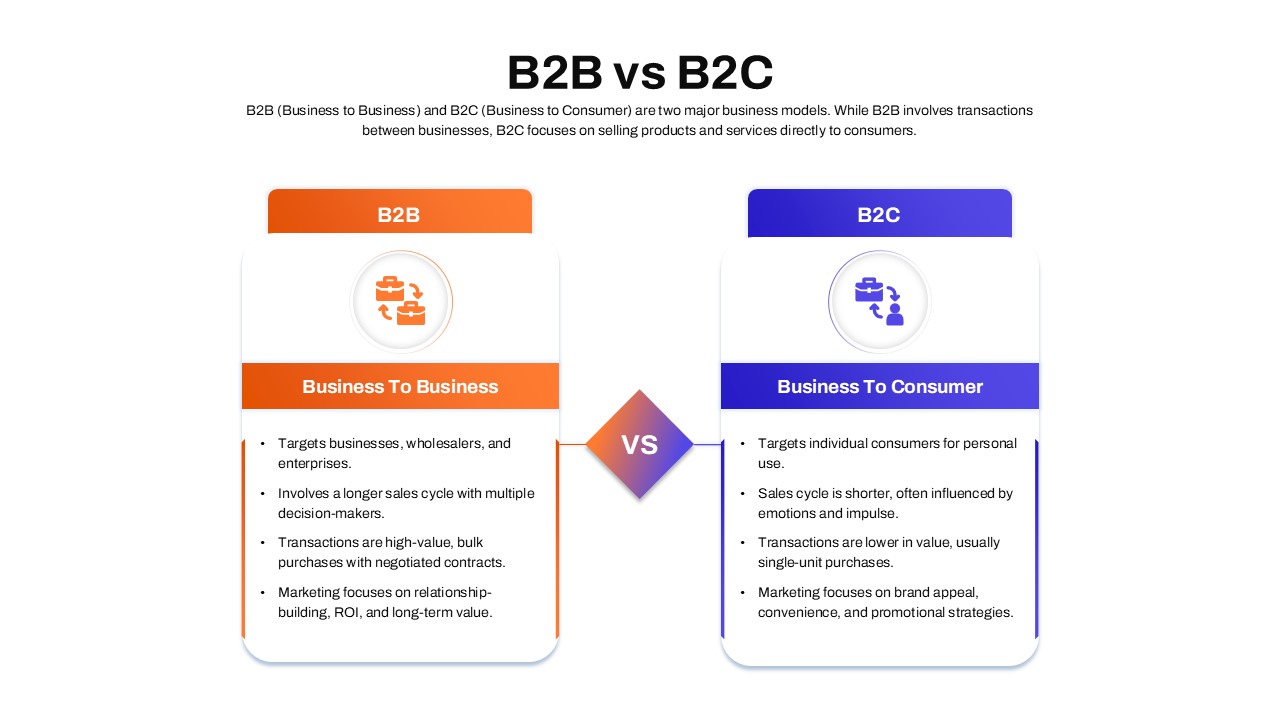
B2B vs B2C Comparison template for PowerPoint & Google Slides
Business Models
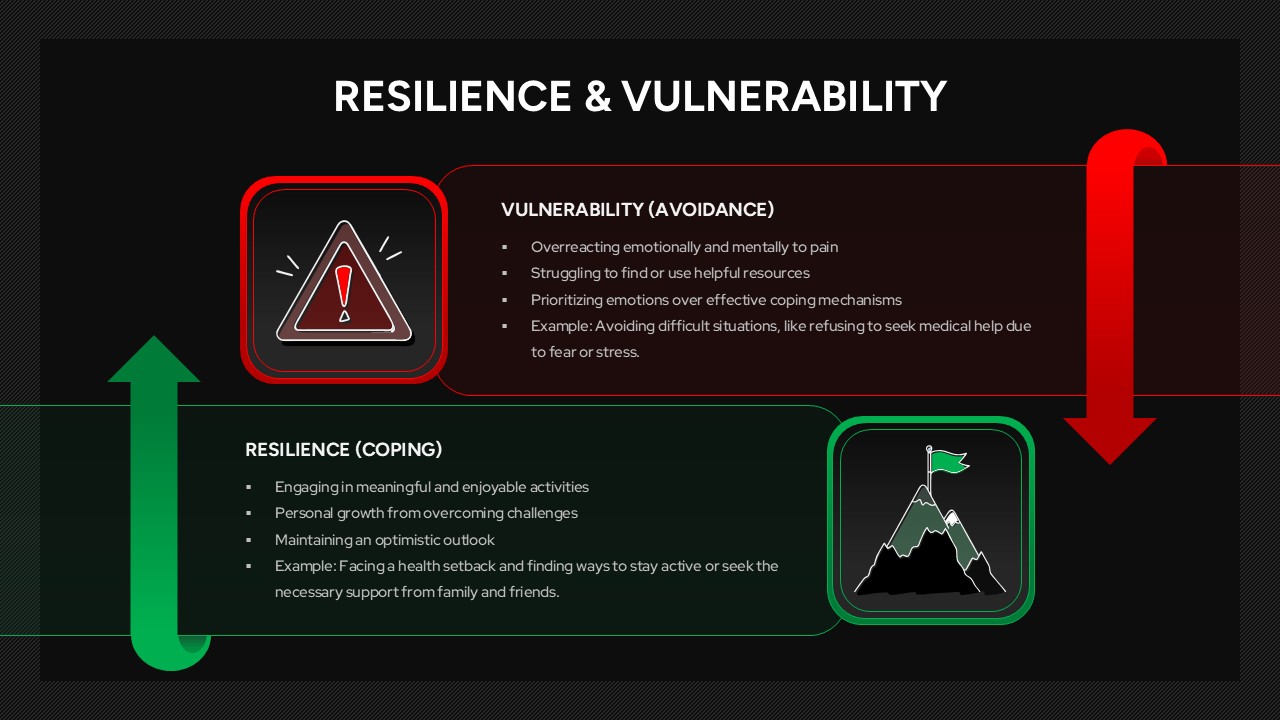
Resilience & Vulnerability Comparison Template for PowerPoint & Google Slides
Comparison
Skills Gap Analysis Comparison Chart Template for PowerPoint & Google Slides
Gap
Category Analysis Comparison Infographic Template for PowerPoint & Google Slides
Comparison
Feasibility Matrix Comparison Chart Template for PowerPoint & Google Slides
Comparison Chart
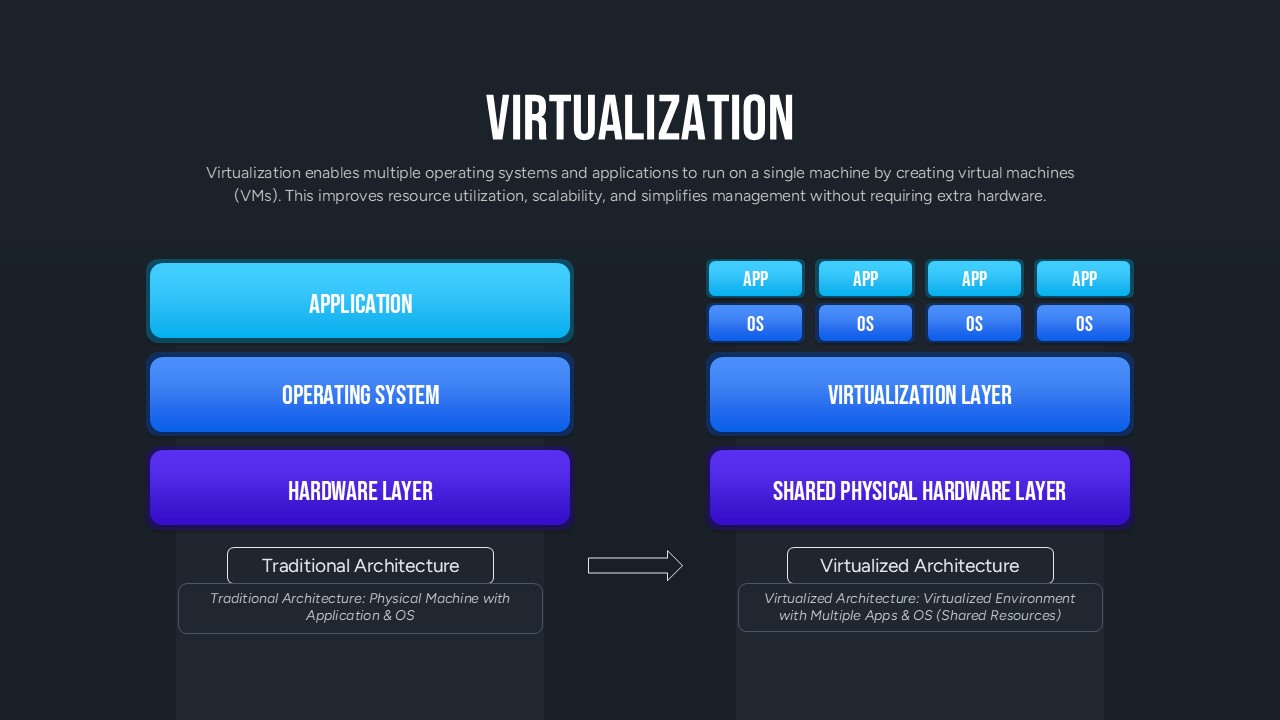
Virtualization Architecture Comparison Template for PowerPoint & Google Slides
Comparison Chart
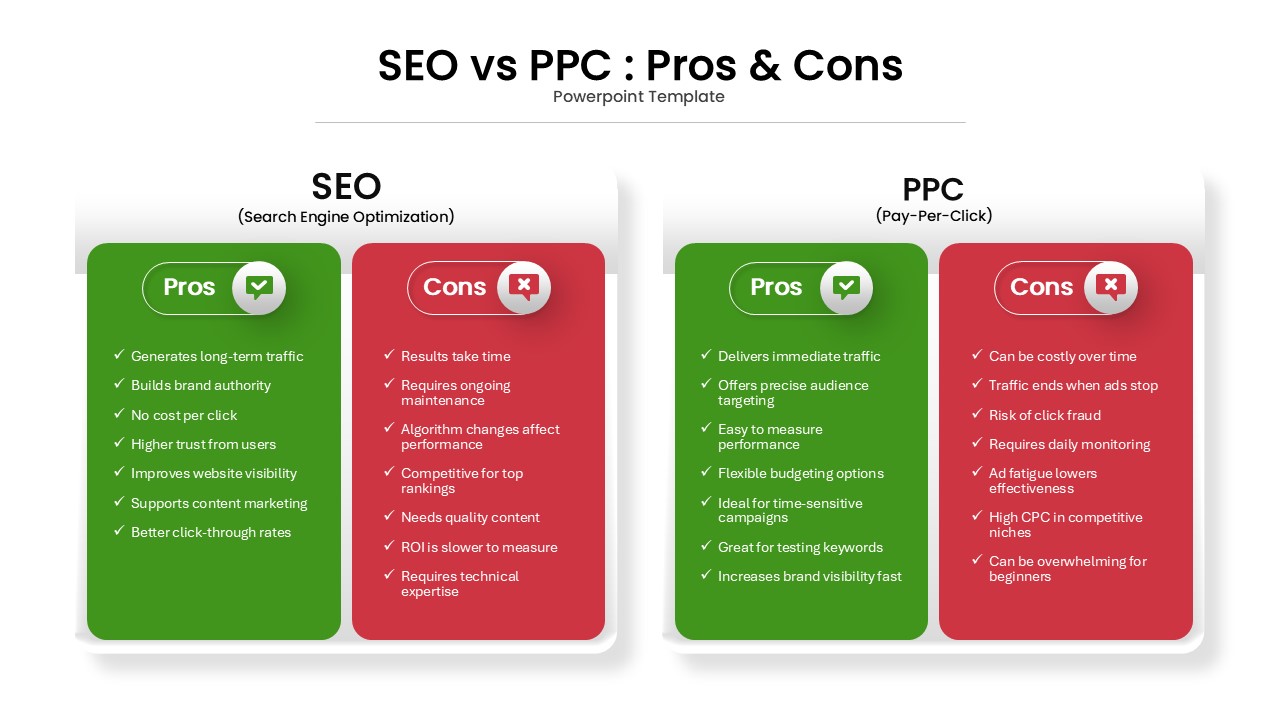
SEO vs PPC: Pros & Cons Comparison Template for PowerPoint & Google Slides
Comparison
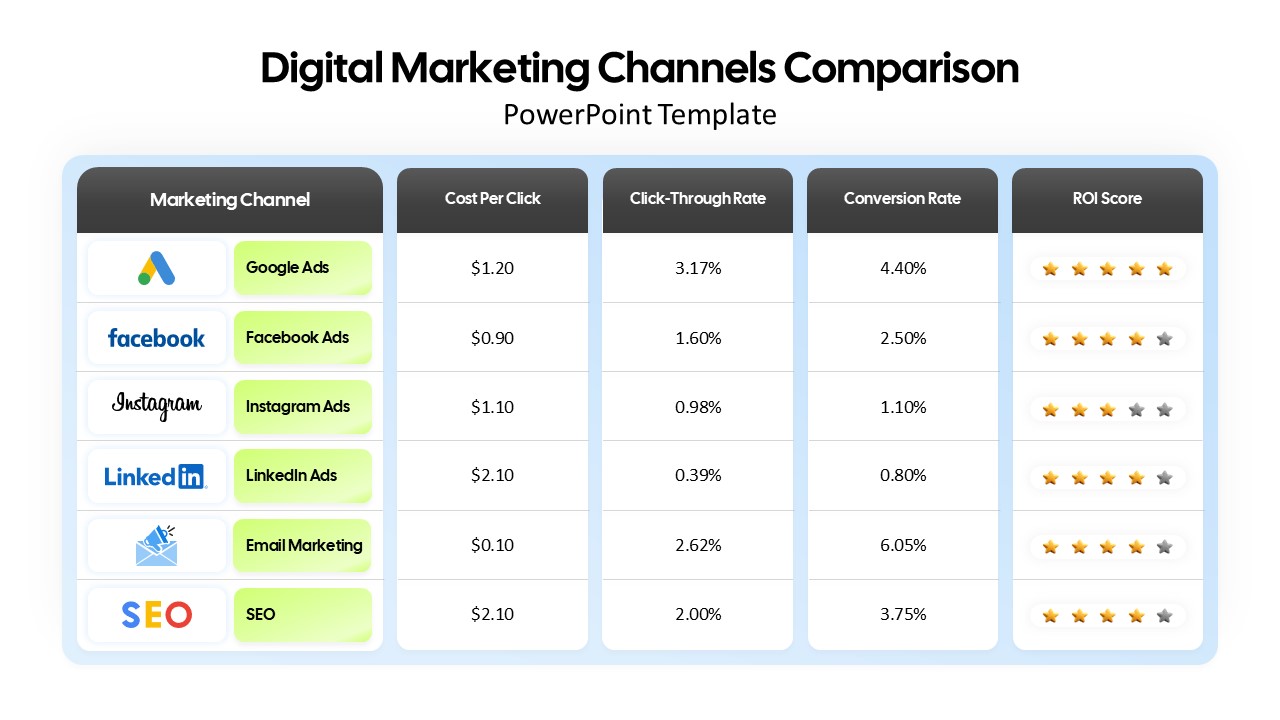
Digital Marketing Channels Comparison template for PowerPoint & Google Slides
Business
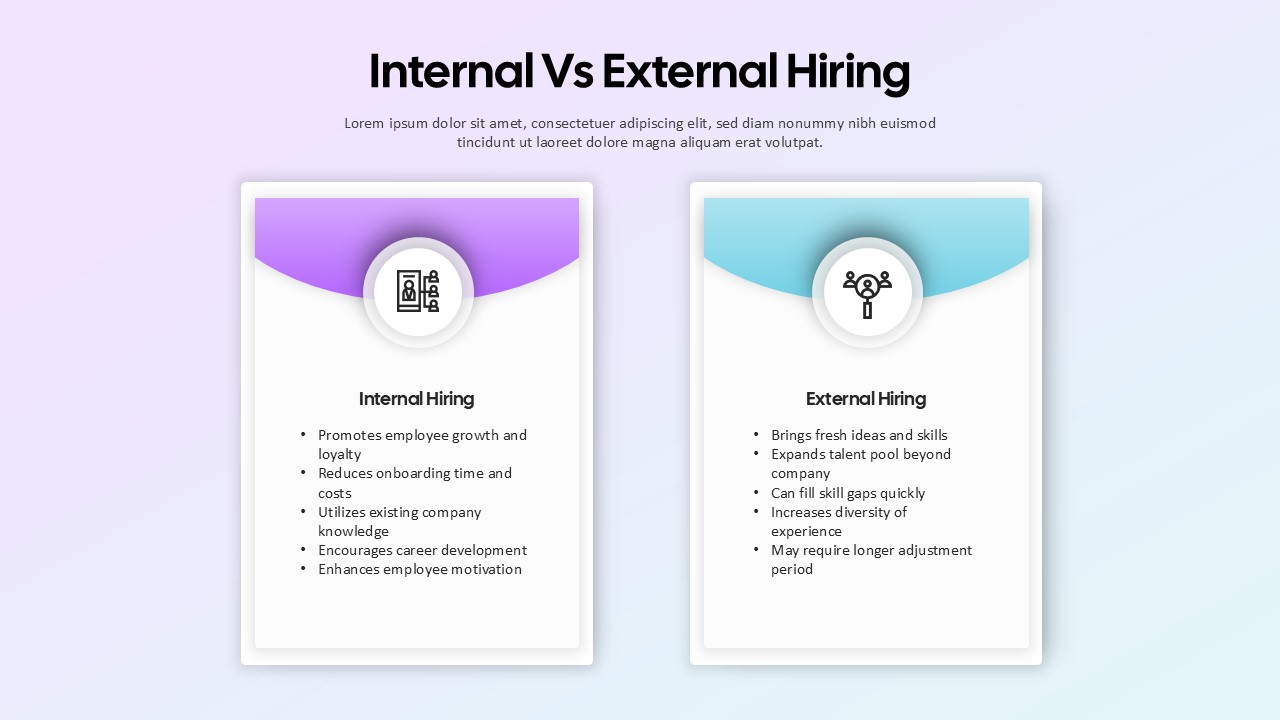
Internal vs External Hiring Comparison Template for PowerPoint & Google Slides
Comparison
Five Column Comparison Table Layout Template for PowerPoint & Google Slides
Comparison
Quarterly Comparison Pie Chart Template for PowerPoint & Google Slides
Pie/Donut
Pros and Cons Comparison Table Template for PowerPoint & Google Slides
Comparison Chart
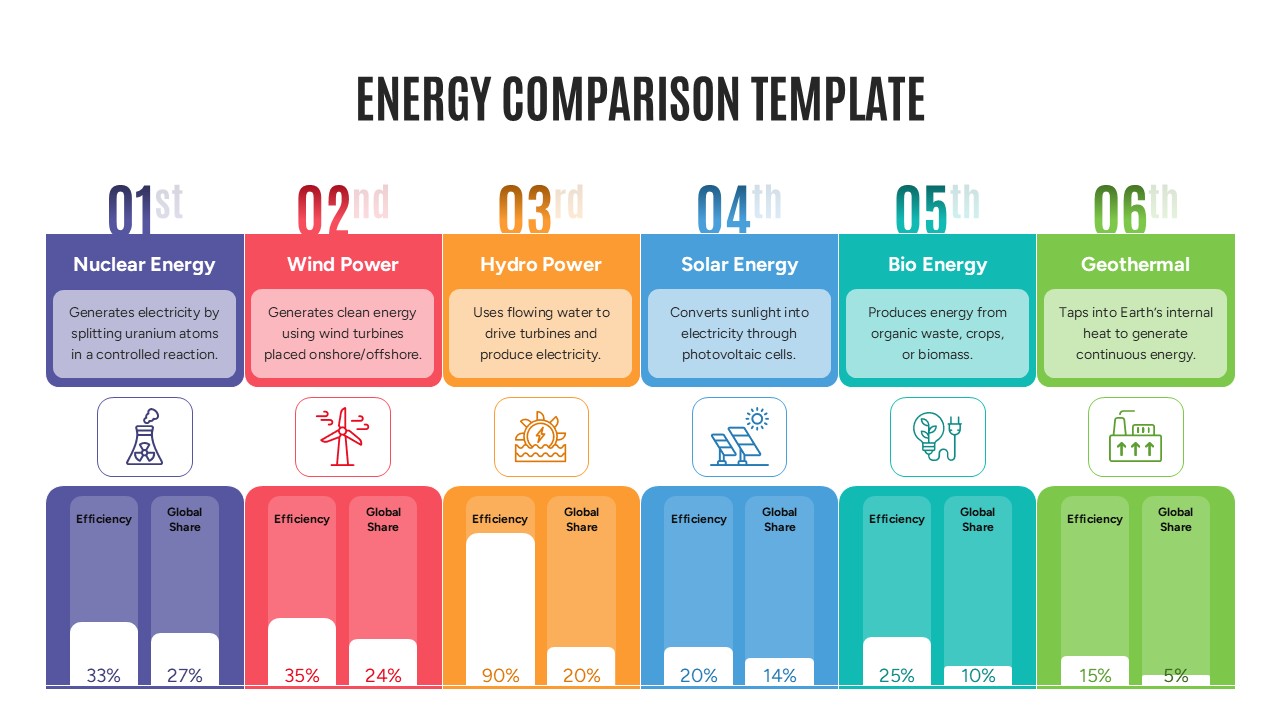
Energy Comparison Template for PowerPoint & Google Slides
Comparison
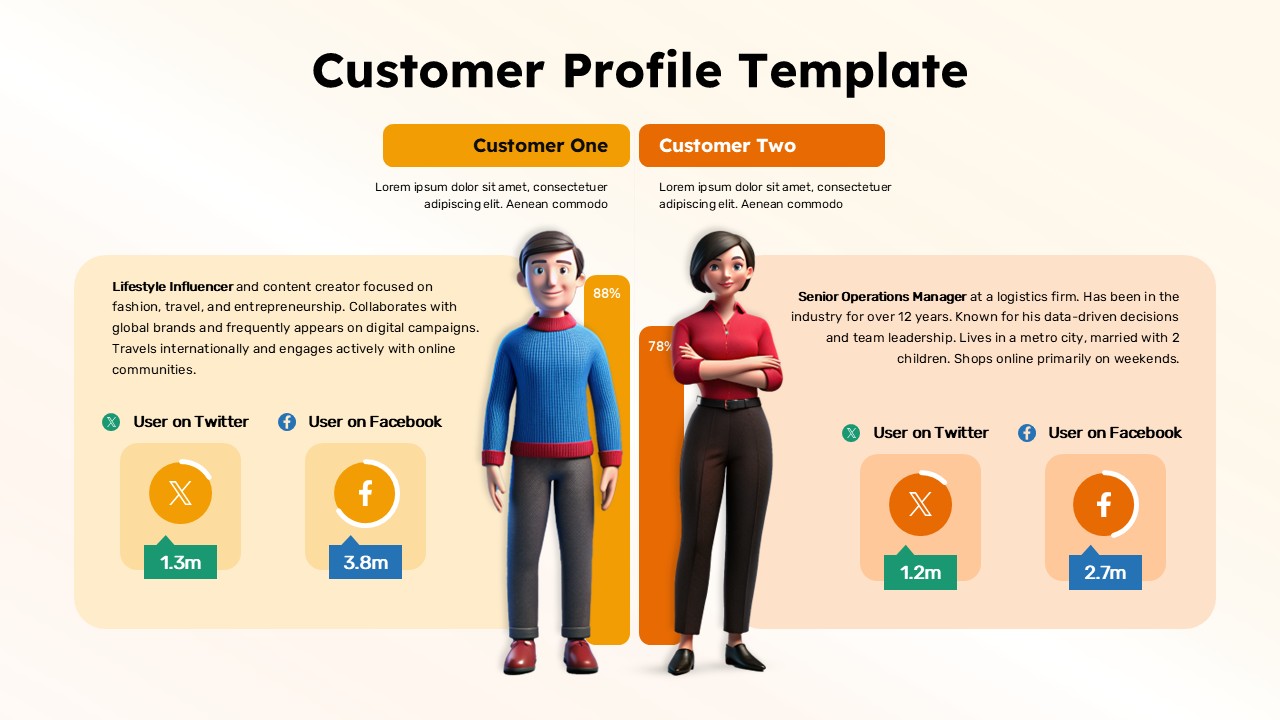
Customer Persona Comparison Profile Template for PowerPoint & Google Slides
Business
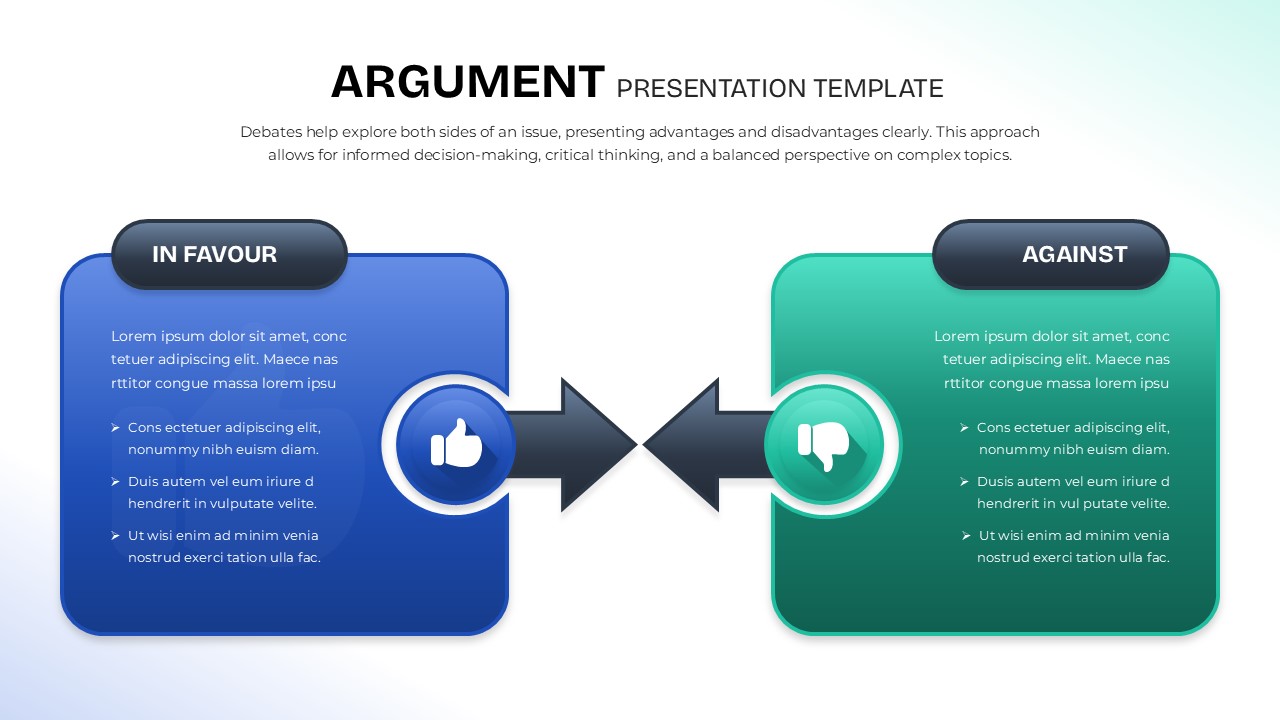
Argument Comparison Template for PowerPoint & Google Slides
Comparison
Year-over-Year Performance Comparison Template for PowerPoint & Google Slides
Comparison Chart
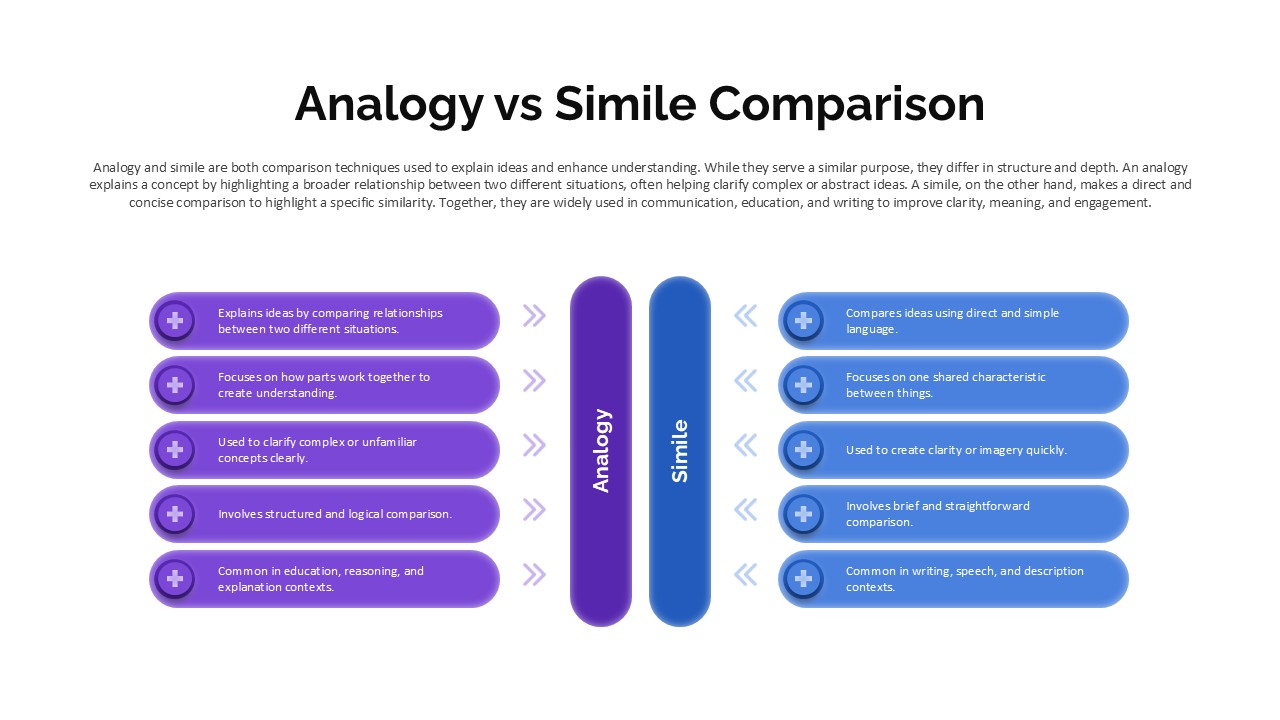
Analogy vs Simile Comparison Template for PowerPoint & Google Slides
Comparison