HR Report Dashboard Template for PowerPoint & Google Slides


Description
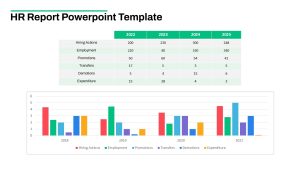
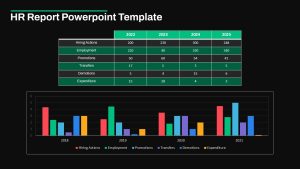
Leverage this HR Report Dashboard slide to present key workforce metrics in a clear, data-driven layout. The top half features an editable table for headcounts, hiring actions, promotions, transfers, demotions, and HR expenditure across multiple years. Below, a clustered bar chart visualizes trends over time, with color-coded series for each category to facilitate comparisons. The design uses a clean grid background, subtle shading, and a cohesive green accent palette to maintain professional consistency.
Built on master slides, this template allows you to update table values, adjust chart data ranges, and customize colors or fonts in seconds. Drag-and-drop chart placeholders ensure seamless integration of your own data, while built-in gridlines and alignment guides maintain visual balance. The slide preserves full-resolution clarity in both PowerPoint and Google Slides, eliminating formatting issues and supporting real-time collaboration with version control.
Ideal for monthly HR reviews, executive briefings, and board presentations, this dashboard keeps stakeholders aligned on workforce trends and resource allocations. Use the table to highlight year-over-year changes or spotlight anomalies, and leverage the bar chart to underscore growth areas or identify potential challenges. Additional callout boxes or annotations can be added to emphasize key insights, such as turnover spikes or budgeting opportunities.
Whether you’re tracking headcount evolution, promotion rates, or HR costs, this HR Report Dashboard slide simplifies complex data into accessible visuals. The modular layout also supports repurposing for finance reports, sales performance dashboards, or project status updates—simply relabel headers and swap data series to fit any context.
Who is it for
HR managers, talent acquisition leads, compensation analysts, CFOs, and executive teams can leverage this dashboard to monitor workforce dynamics, inform staffing decisions, and drive strategic planning.
Other Uses
Repurpose this layout for financial reporting, sales performance reviews, operational scorecards, or departmental KPIs by updating table categories and chart series.
Login to download this file

Item ID
SB04680
Related Templates

Modern Project Status Report Dashboard Template for PowerPoint & Google Slides
Project Status
Weekly Status Report Dashboard Template for PowerPoint & Google Slides
HR
One Pager Annual Report Dashboard Template for PowerPoint & Google Slides
Business Report
Project Status Dashboard Report Template for PowerPoint & Google Slides
Project Status

Employee Headcount Dashboard Report Template for PowerPoint & Google Slides
Employee Performance
Free KPI Dashboard PowerPoint Template for PowerPoint & Google Slides
Charts
Free
E-commerce Analytics Dashboard Template for PowerPoint & Google Slides
Bar/Column

Dynamic Data Dashboard Infographic Template for PowerPoint & Google Slides
Bar/Column
Product Usage Analytics Dashboard Chart Template for PowerPoint & Google Slides
Bar/Column
Data Analytics Dashboard Design template for PowerPoint & Google Slides
Bar/Column

Efficiency KPI Dashboard Metaphor Template for PowerPoint & Google Slides
Infographics
Business Dashboard Analytics & KPIs Template for PowerPoint & Google Slides
Bar/Column

Professional Team Efficiency Dashboard Template for PowerPoint & Google Slides
Business Report
Project Management Dashboard Template for PowerPoint & Google Slides
Project
Website Performance Dashboard template for PowerPoint & Google Slides
Charts
Sales Performance Dashboard template for PowerPoint & Google Slides
Business Report
Immigration Data Dashboard Template for PowerPoint & Google Slides
Bar/Column
Employee Skill Analysis Dashboard Template for PowerPoint & Google Slides
Employee Performance
Sales Growth Dashboard: KPI Gauge & Line Template for PowerPoint & Google Slides
Revenue
Social Media Performance Dashboard Template for PowerPoint & Google Slides
Bar/Column
Net Promoter Score Dashboard Template for PowerPoint & Google Slides
Customer Experience
Performance KPI Dashboard Slide Template for PowerPoint & Google Slides
Business Report
Bull and Bear Stock Market Dashboard Template for PowerPoint & Google Slides
Infographics
KPI Dashboard template for PowerPoint & Google Slides
Business Report
KPI Dashboard Overview template for PowerPoint & Google Slides
Finance
KPI Dashboard Data Visualization Template for PowerPoint & Google Slides
Bar/Column
KPI Dashboard Data Overview Slide Template for PowerPoint & Google Slides
Bar/Column
Professional Nurse Infographic Dashboard Template for PowerPoint & Google Slides
Nursing
Interactive Benchmarking Gauge Dashboard Template for PowerPoint & Google Slides
Pie/Donut
Heat Map Risk Matrix Dashboard Template for PowerPoint & Google Slides
Comparison Chart
Project Status Dashboard Table Template for PowerPoint & Google Slides
Project Status
Project Status Dashboard with Metrics Template for PowerPoint & Google Slides
Project Status
Colorful Project Status Dashboard Template for PowerPoint & Google Slides
Project Status
Weekly Update Schedule Dashboard Template for PowerPoint & Google Slides
Agenda
Project Status Dashboard Template for PowerPoint & Google Slides
Project Status
Free Metro UI Dashboard Infographic Template for PowerPoint & Google Slides
Business Report
Free
Website Performance Monitoring Dashboard Template for PowerPoint & Google Slides
Business Report
One Pager Project Status Dashboard Template for PowerPoint & Google Slides
Project Status
Social Media Analytics Dashboard Template for PowerPoint & Google Slides
Digital Marketing
Social Media Statistics 2023 Dashboard Template for PowerPoint & Google Slides
Comparison
Mastodon Metrics Infographic Dashboard Template for PowerPoint & Google Slides
Business Report
Soccer Match Stats Dashboard Slide Template for PowerPoint & Google Slides
Graphics
Employee Satisfaction Survey Dashboard Template for PowerPoint & Google Slides
Employee Performance
Customer Satisfaction KPI Dashboard Template for PowerPoint & Google Slides
Customer Experience
Weekly Project Status Dashboard Template for PowerPoint & Google Slides
Project Status
Freight Logistics Dashboard Infographic Template for PowerPoint & Google Slides
Comparison Chart
Free Quarterly Business Review Dashboard Template for PowerPoint & Google Slides
Business
Free
Cost Cutting Savings Dashboard Template for PowerPoint & Google Slides
Pie/Donut
Macroeconomic Indicators Dashboard Template for PowerPoint & Google Slides
PEST
Free Monthly Report PowerPoint Template for PowerPoint & Google Slides
Business Report
Free
Michigan County Map with KPI Dashboard Template for PowerPoint & Google Slides
World Maps
Quarterly Financial Summary Dashboard Template for PowerPoint & Google Slides
Business Report
Banking Financial Overview Dashboard Template for PowerPoint & Google Slides
Finance
Quarterly Business Review Dashboard Template for PowerPoint & Google Slides
Pitch Deck
Monthly Business Review Dashboard Deck Template for PowerPoint & Google Slides
Business Report
DevOps KPI Dashboard Performance Metrics Template for PowerPoint & Google Slides
Software Development
Purchasing KPI Metrics Dashboard Template for PowerPoint & Google Slides
Business Report
Procurement KPI Dashboard & Metrics Template for PowerPoint & Google Slides
Business Report
Project Progress Dashboard Pie Charts Template for PowerPoint & Google Slides
Project
Monthly Sales Performance Dashboard Template for PowerPoint & Google Slides
Charts
Budget Forecast Dashboard & Donut Charts Template for PowerPoint & Google Slides
Pie/Donut
Risk Level Gauge Comparison Dashboard Template for PowerPoint & Google Slides
Comparison
Inventory Management Dashboard Template for PowerPoint & Google Slides
Process
Digital Marketing KPIs Dashboard Dark Template for PowerPoint & Google Slides
Business Report
Employee Performance Metrics Dashboard Template for PowerPoint & Google Slides
Employee Performance
Turnover Analysis Dashboard Template for PowerPoint & Google Slides
Employee Performance
Project Tracking Dashboard Table Template for PowerPoint & Google Slides
Project Status
Action Items Management Dashboard Table Template for PowerPoint & Google Slides
Project Status
Electronic Health Records Dashboard template for PowerPoint & Google Slides
Health
Customer Interview Insights Dashboard Template for PowerPoint & Google Slides
Customer Experience
Account Overview Dashboard template for PowerPoint & Google Slides
Business
Project Status Update Dashboard Table Template for PowerPoint & Google Slides
Project Status
Cohort Analysis Retention Dashboard Template for PowerPoint & Google Slides
Comparison Chart
Project Status Dashboard Template for PowerPoint & Google Slides
Project Status
Dashboard Project Status Template for PowerPoint & Google Slides
Project Status
Project Status Template Dashboard with Gauge for PowerPoint & Google Slides
Project Status
Task Completion Rate Dashboard Template for PowerPoint & Google Slides
Business
Project Status Dashboard with RAG Legend Template for PowerPoint & Google Slides
Project Status
End of Year Review Dashboard Template for PowerPoint & Google Slides
Business Report
Construction Project Dashboard Template for PowerPoint & Google Slides
Project
4DX Scoreboard KPI Gauge Dashboard Template for PowerPoint & Google Slides
Business Strategy
Dashboard Templates for PowerPoint & Google Slides
Bar/Column
Free Infographic Statistics Dashboard Slide for PowerPoint & Google Slides
Bar/Column
Free
Engineering Maintenance Dashboard Slide for PowerPoint & Google Slides
Software Development
Incident Tracking Dashboard for PowerPoint & Google Slides
Business Plan
Patient-Satisfaction KPI Dashboard for PowerPoint & Google Slides
Business
MVP Product Roadmap Delivery Dashboard for PowerPoint & Google Slides
Roadmap
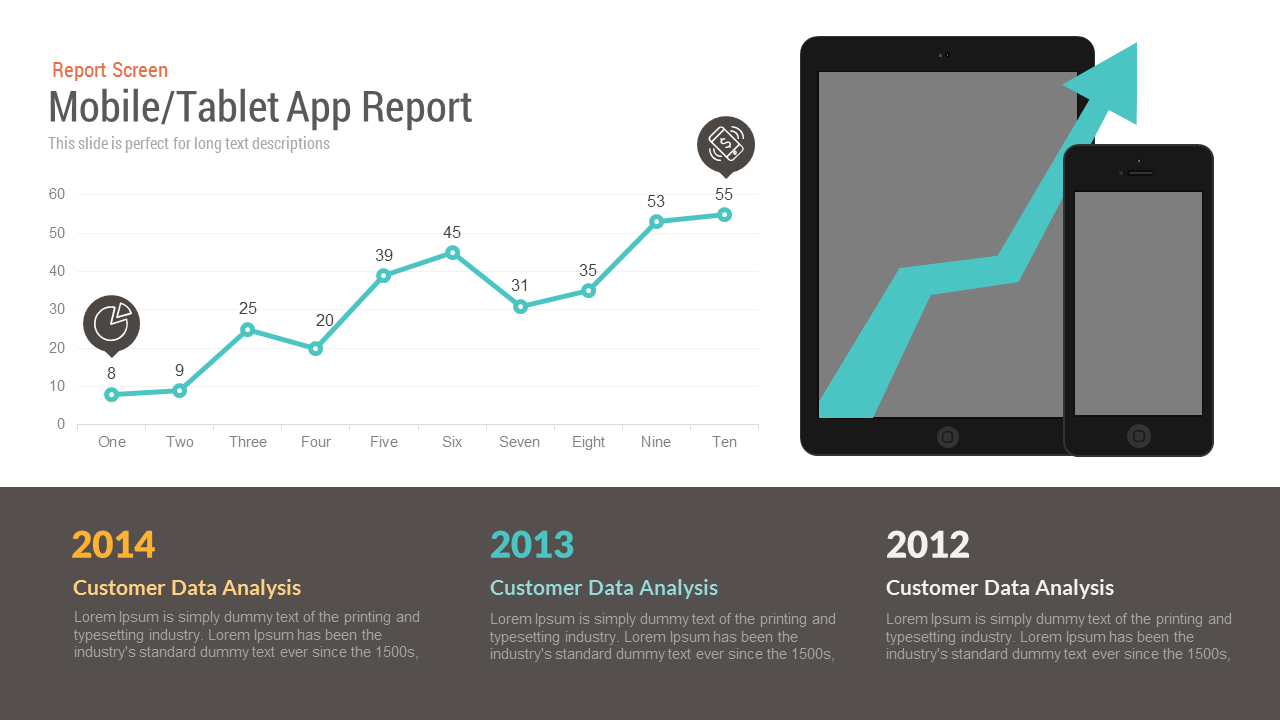
Mobile/Tablet App Report template for PowerPoint & Google Slides
Charts
Free

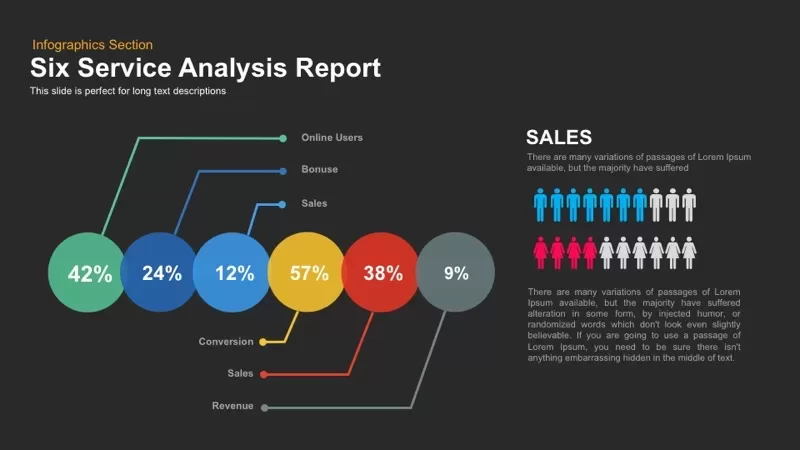
Six Service Analysis Report template for PowerPoint & Google Slides
Infographics
E-Learning Report Analysis Template for PowerPoint & Google Slides
Infographics
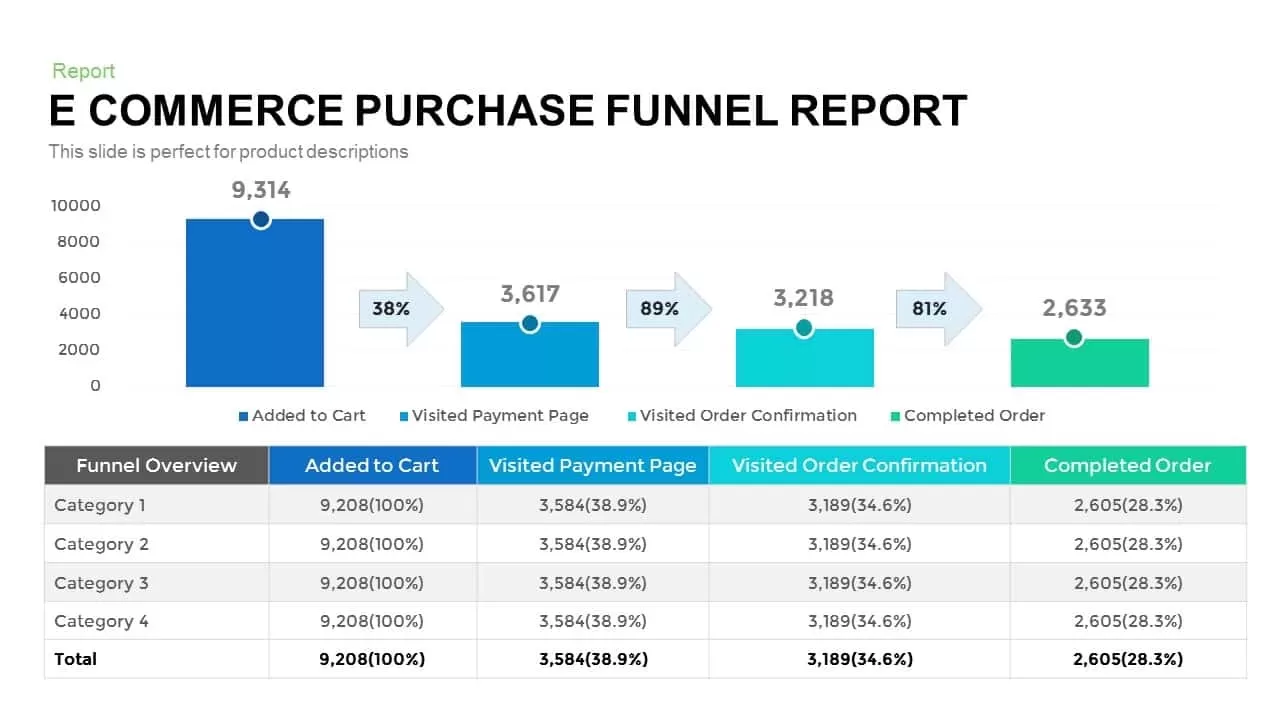
E-commerce Purchase Funnel Report template for PowerPoint & Google Slides
Funnel

Digital Marketing Report Deck Template for PowerPoint & Google Slides
Pitch Deck
Professional Sales Performance Report Template for PowerPoint & Google Slides
Business Report
Annual Report Overview Template for PowerPoint & Google Slides
Decks
Comprehensive Recruitment Metrics Report Template for PowerPoint & Google Slides
Recruitment
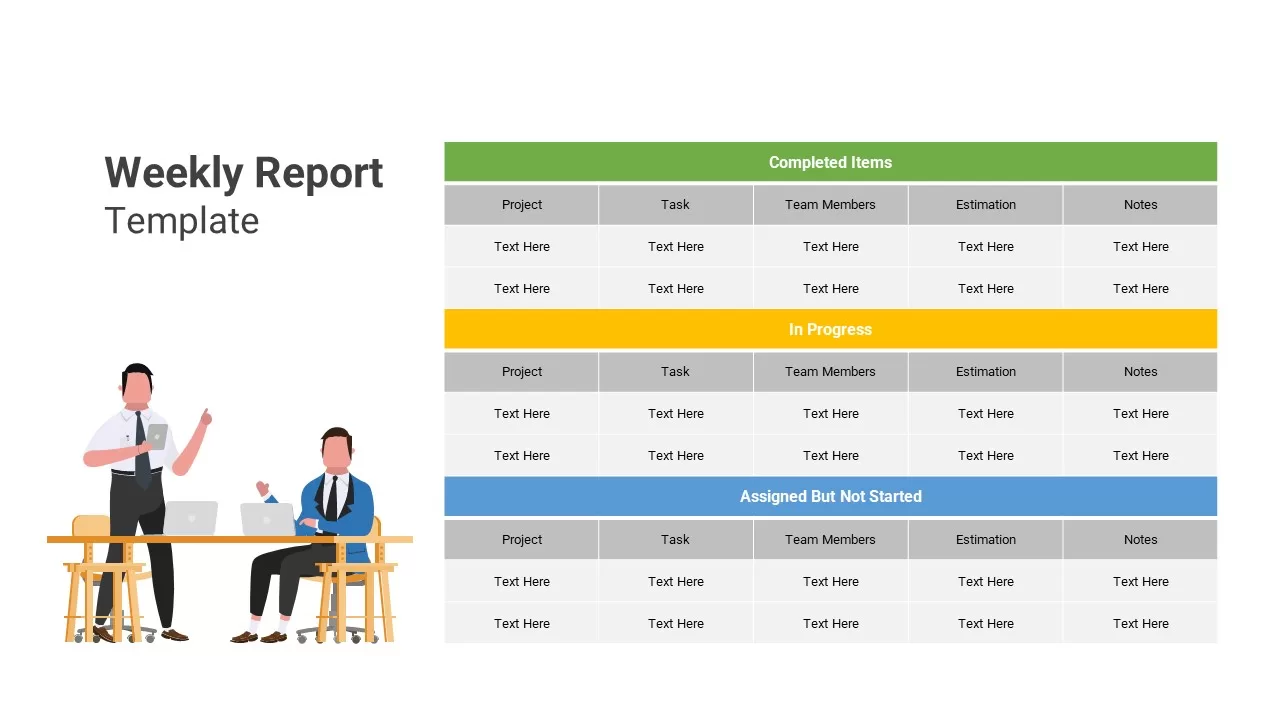
Weekly Report template for PowerPoint & Google Slides
Infographics
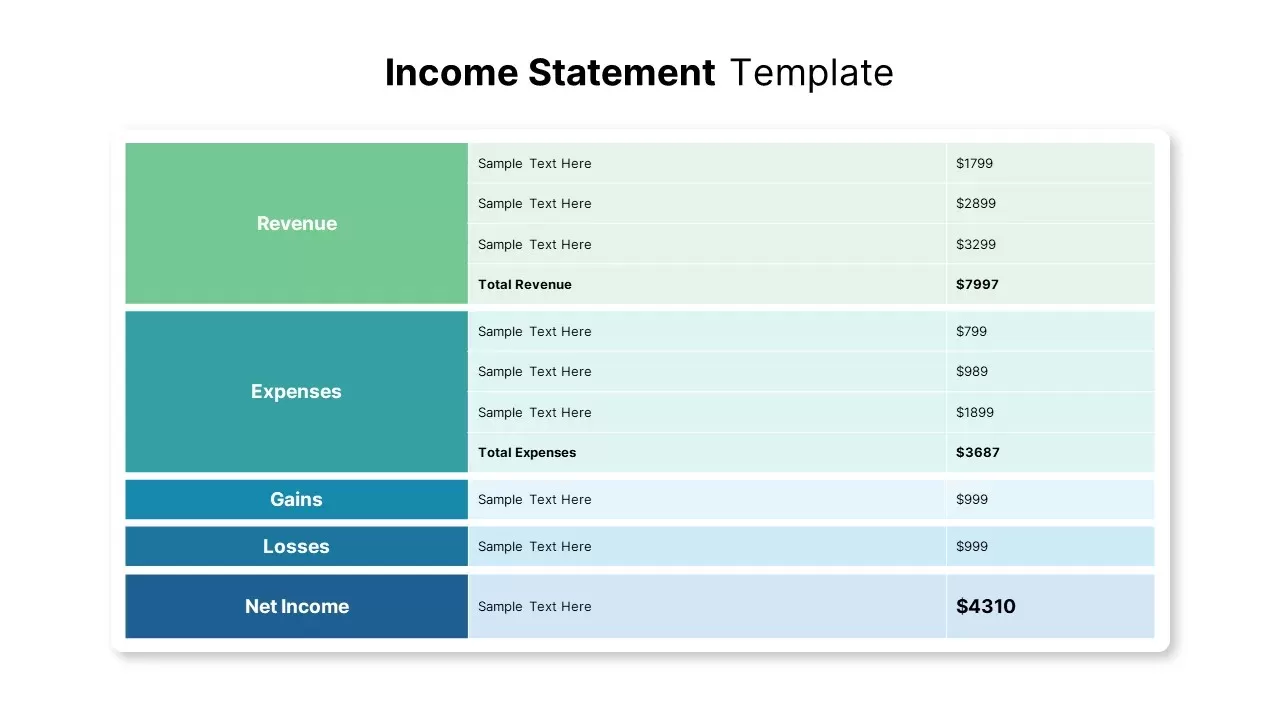
Income Statement Financial Report Template for PowerPoint & Google Slides
Business Report
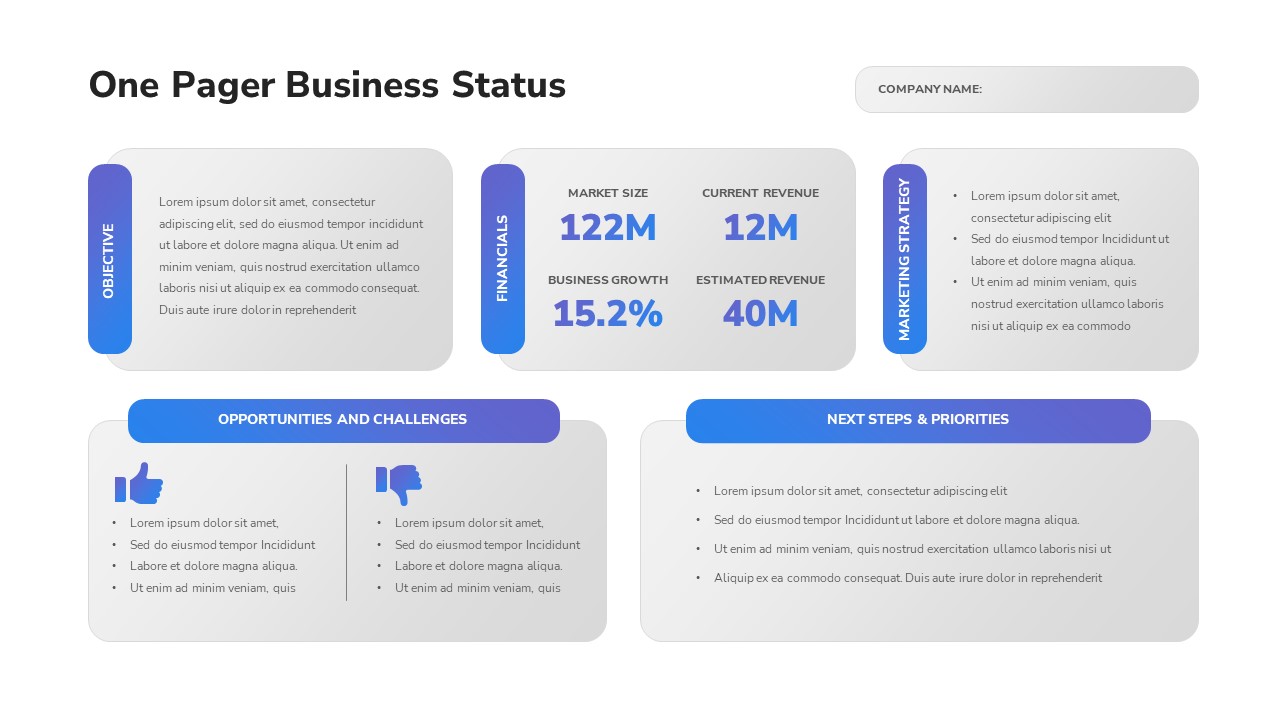
One-Pager Business Status Report Slide Template for PowerPoint & Google Slides
Business Report
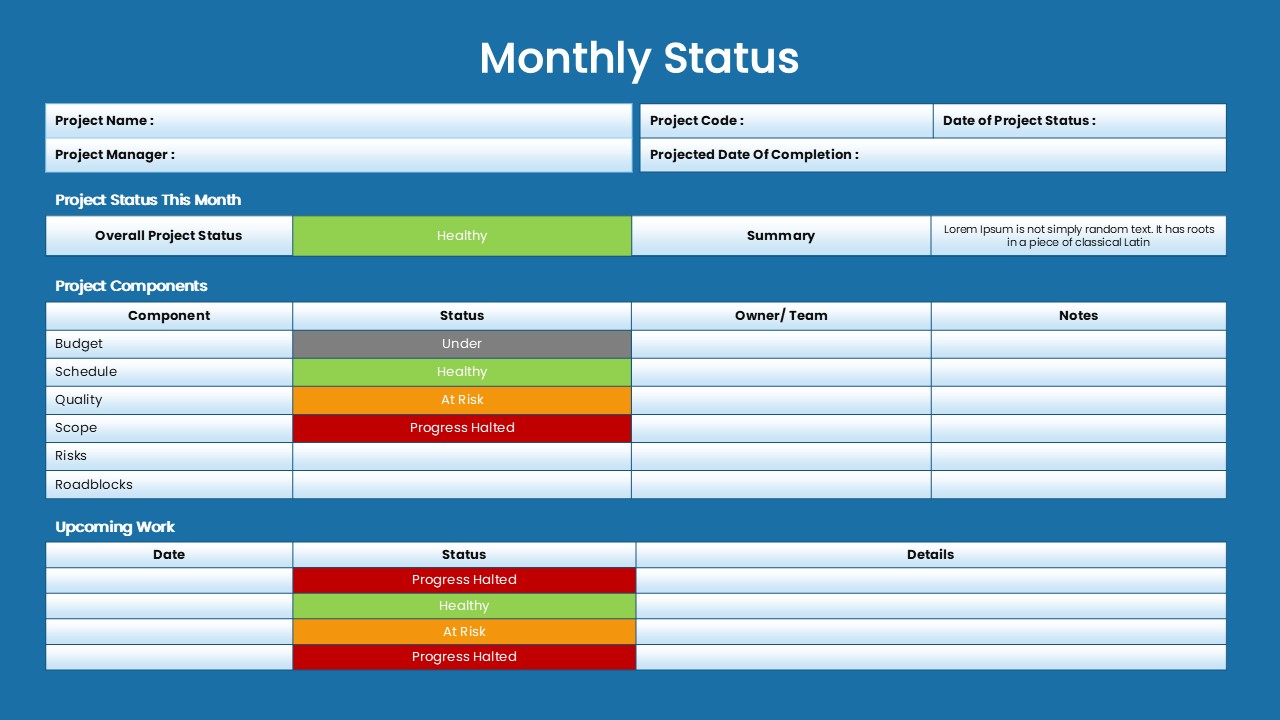
Monthly Status Report Template for PowerPoint & Google Slides
Project Status
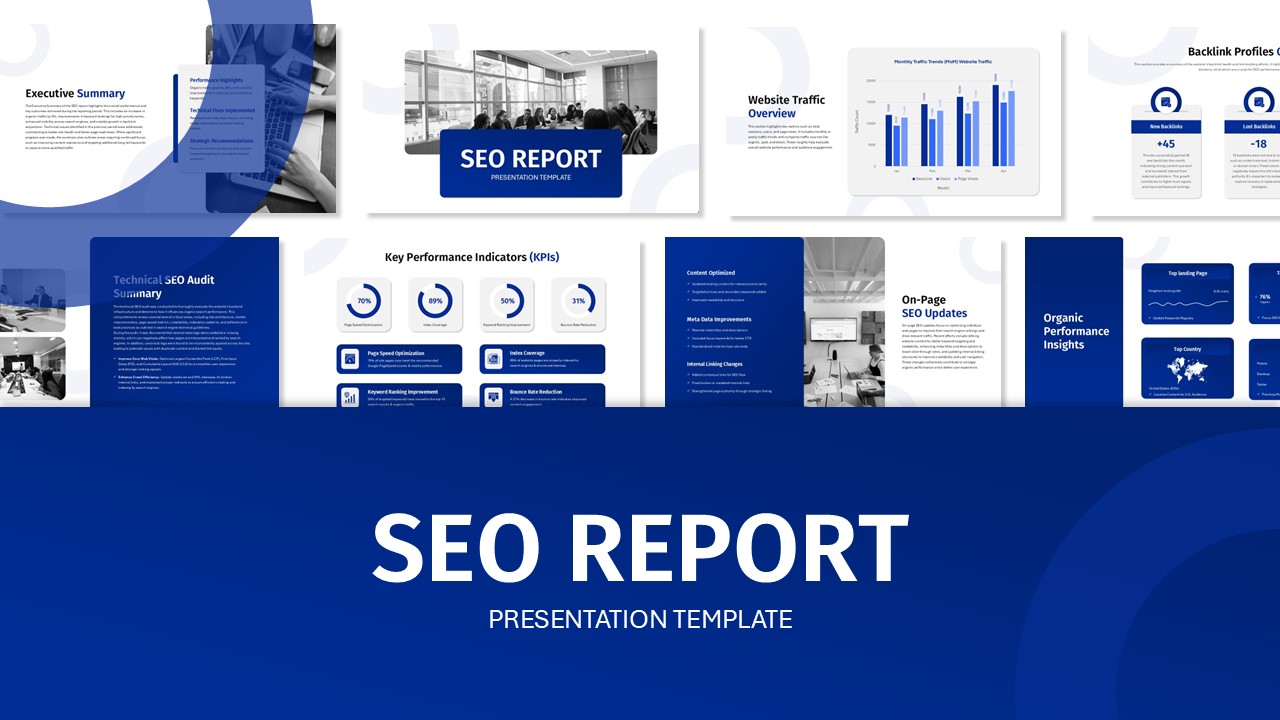
SEO Performance Report Overview template for PowerPoint & Google Slides
Digital Marketing