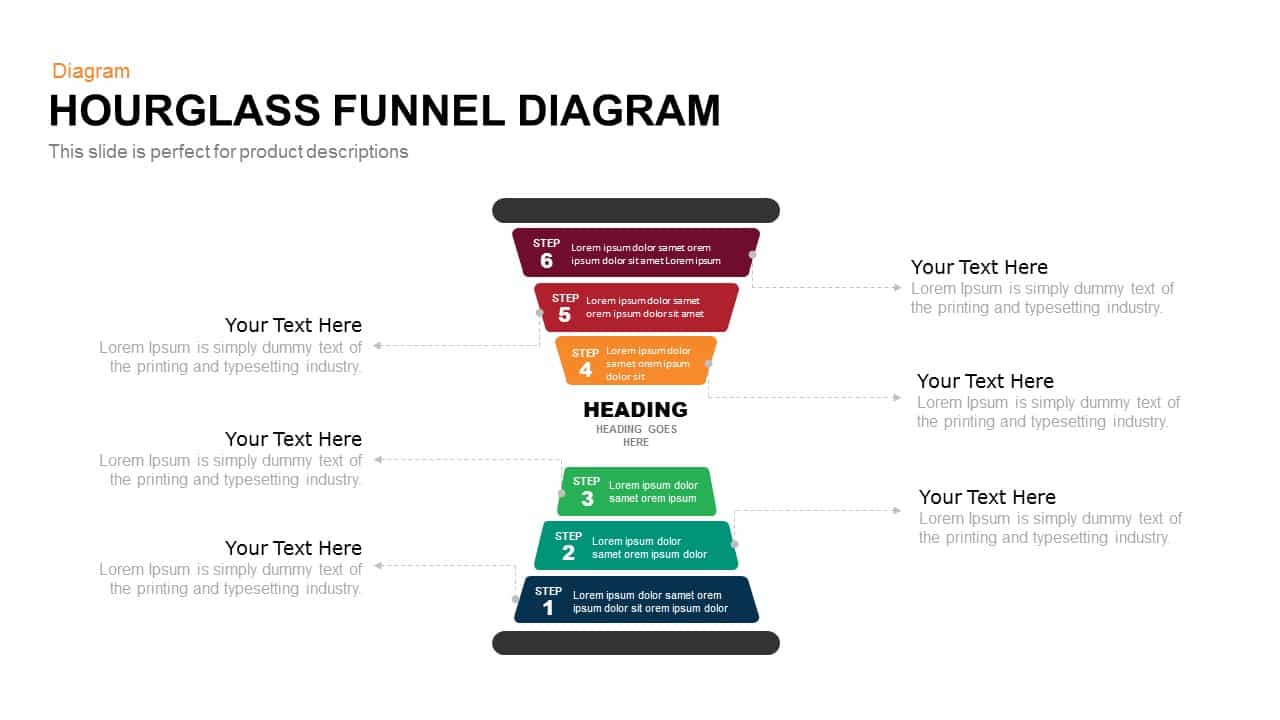
Hourglass Funnel Diagram Process Template for PowerPoint & Google Slides
Description
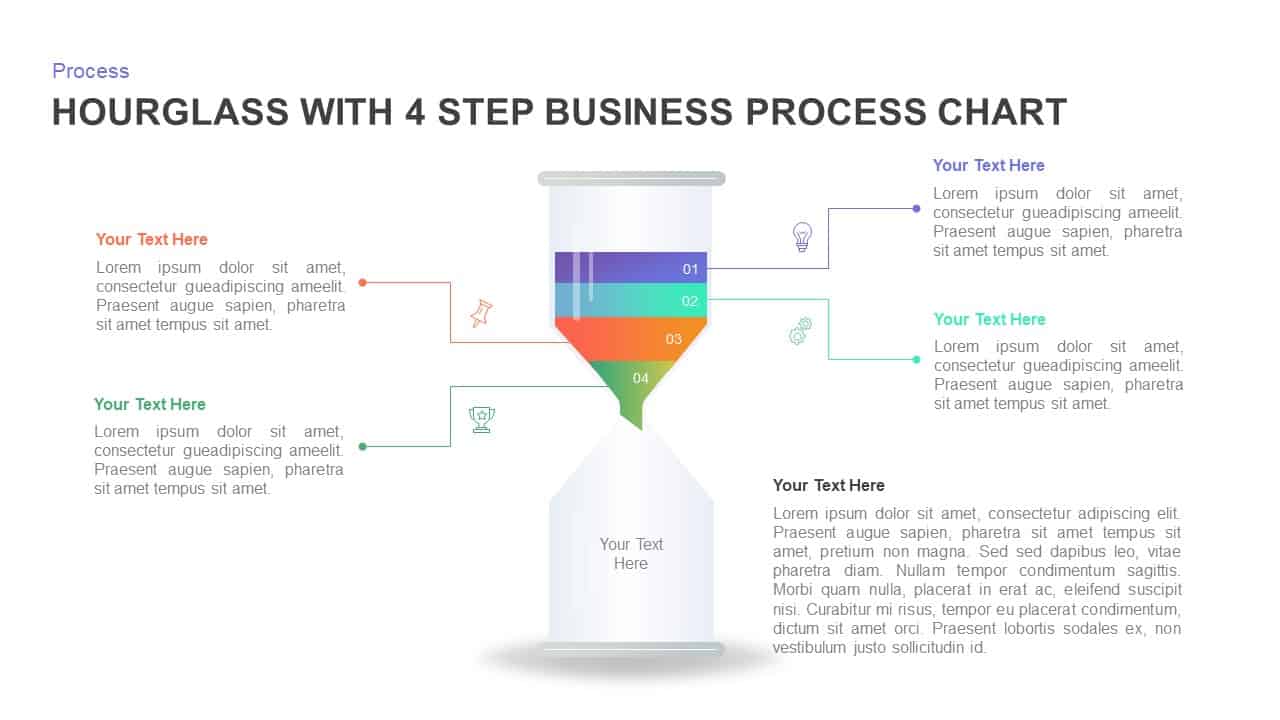
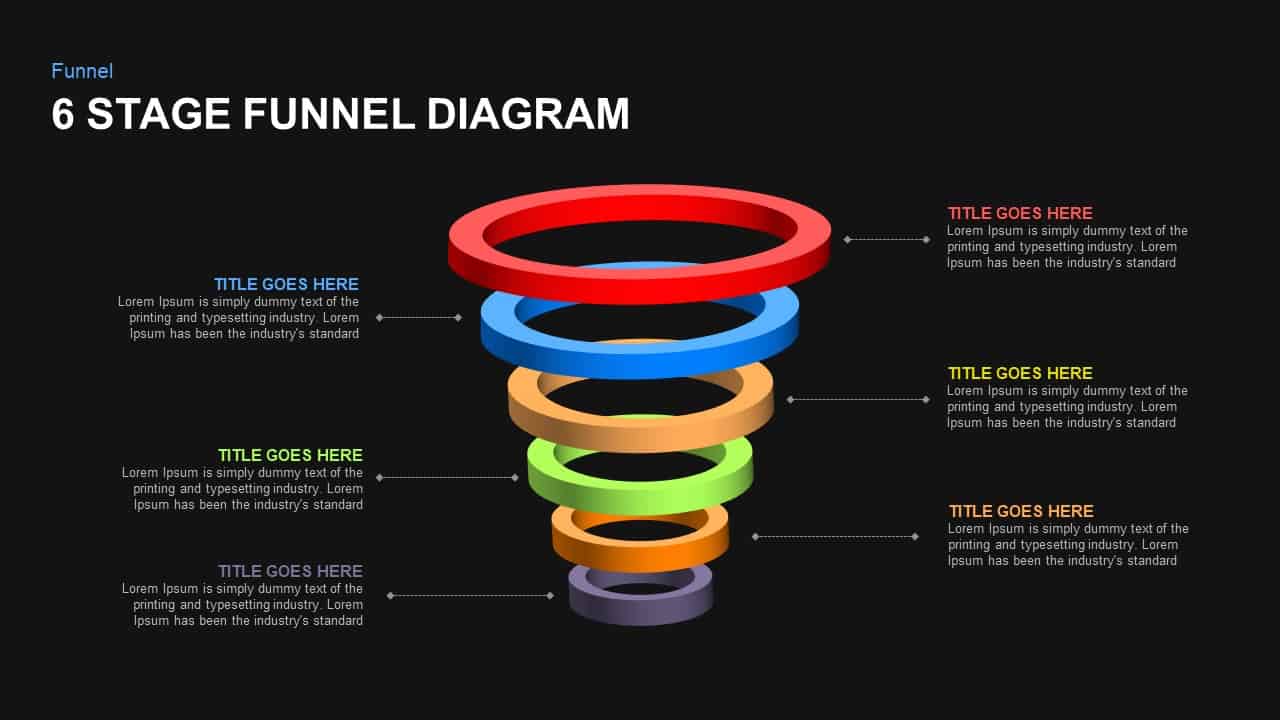
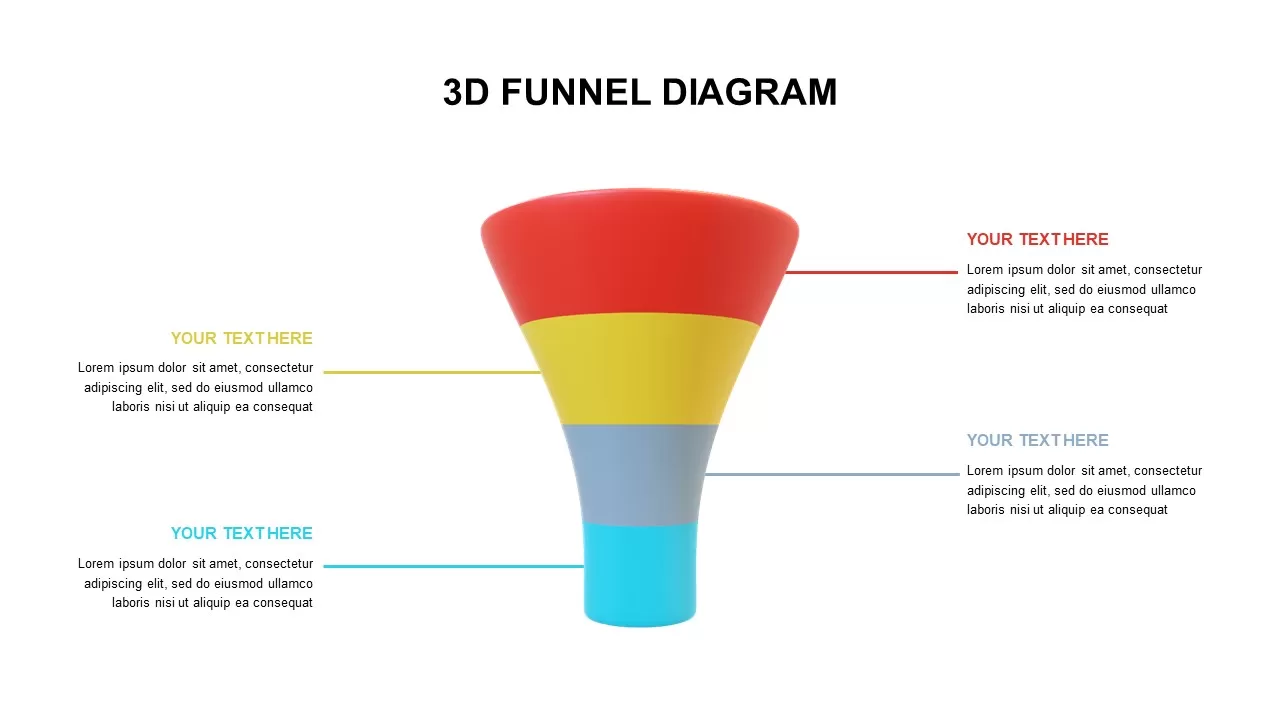
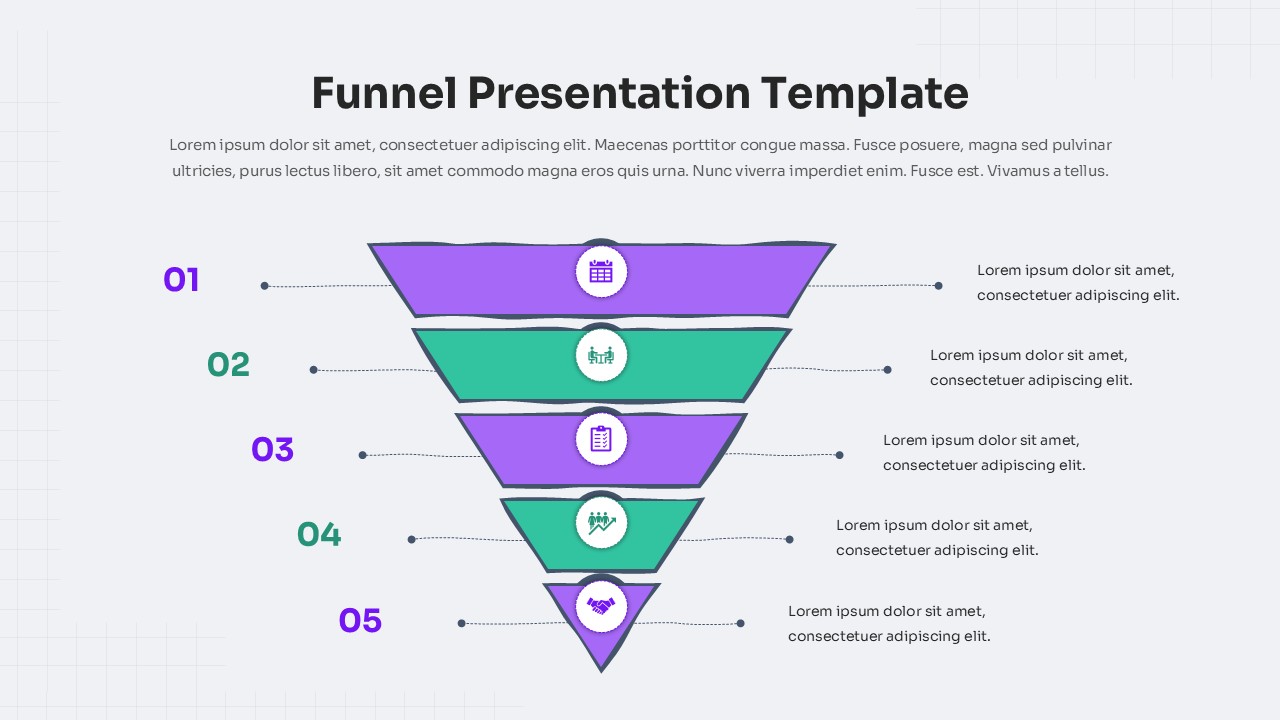
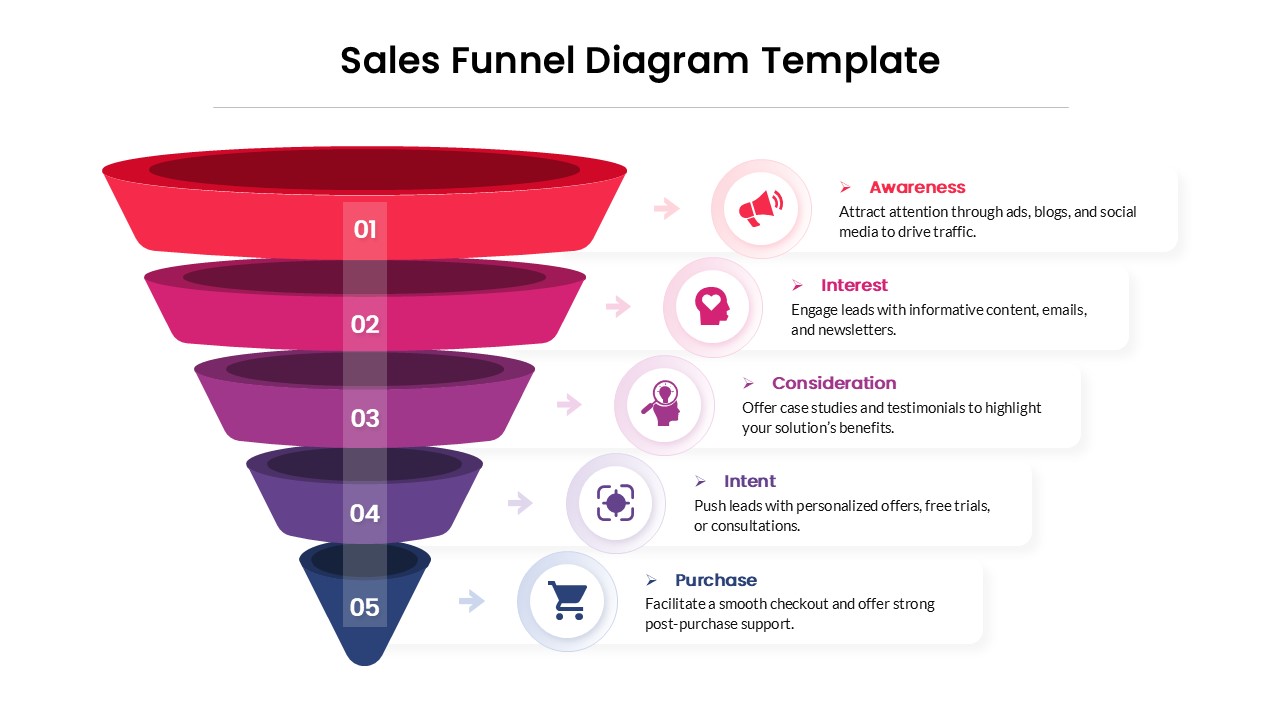
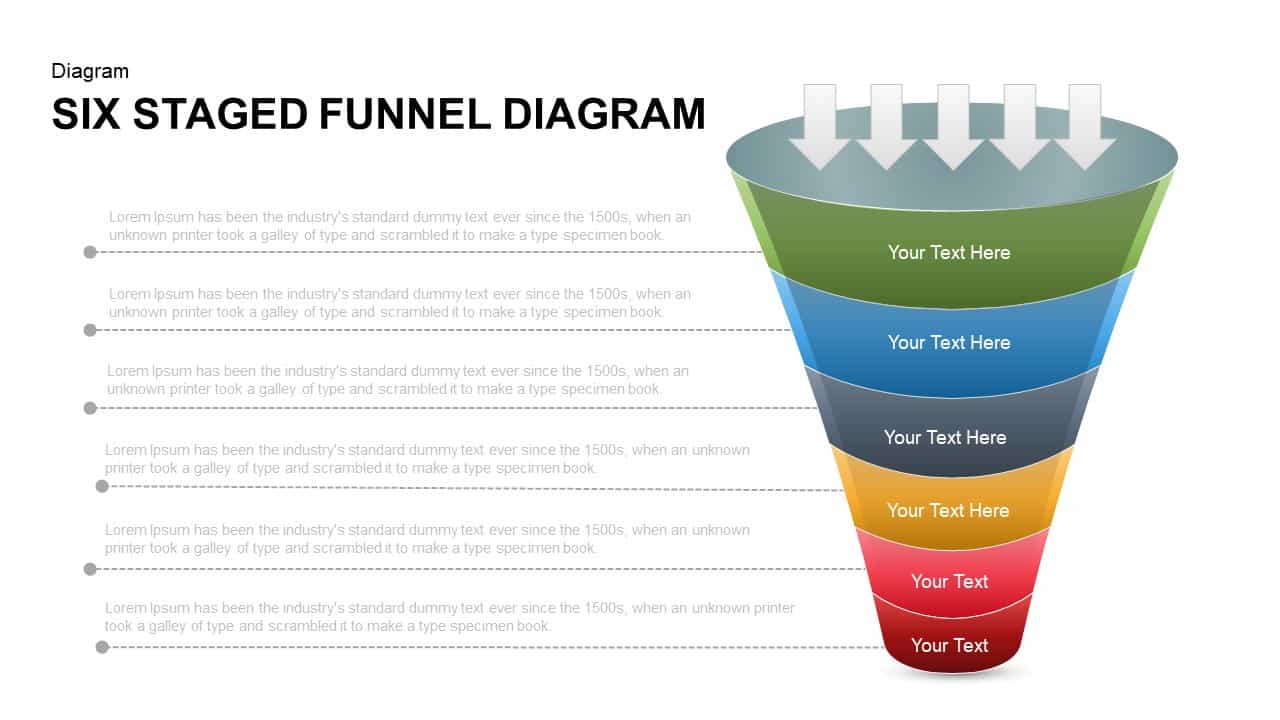
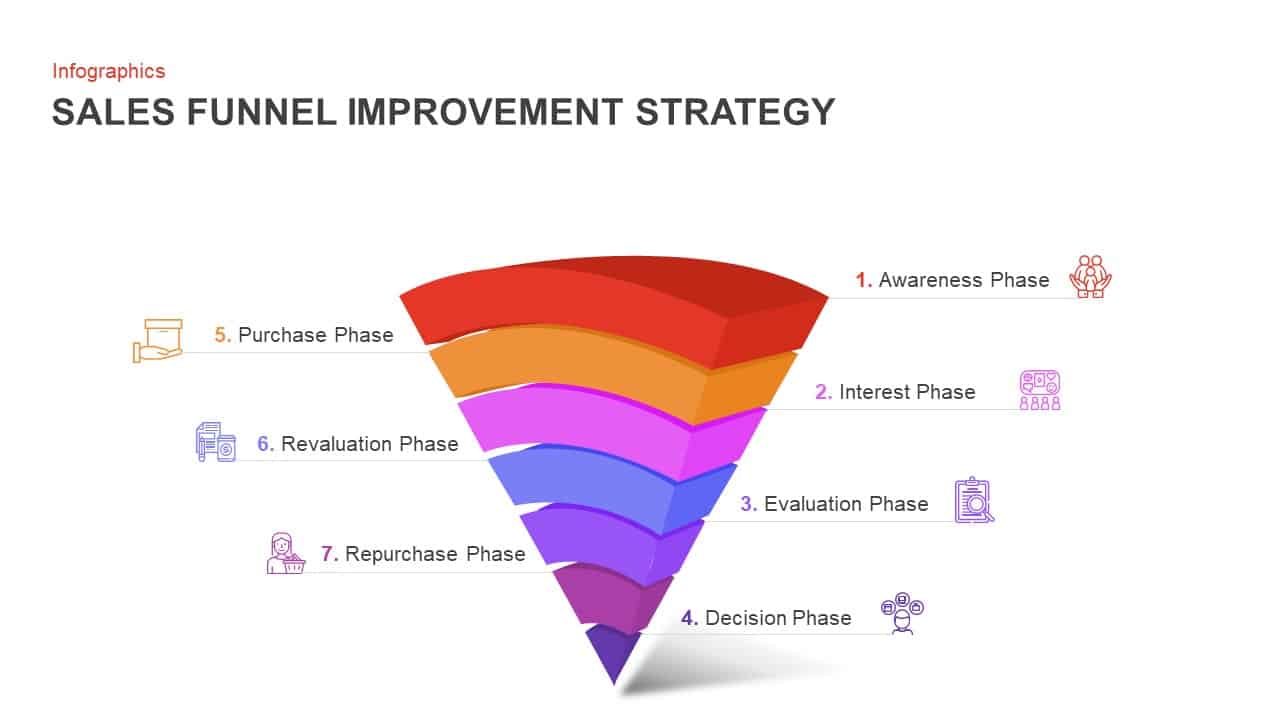
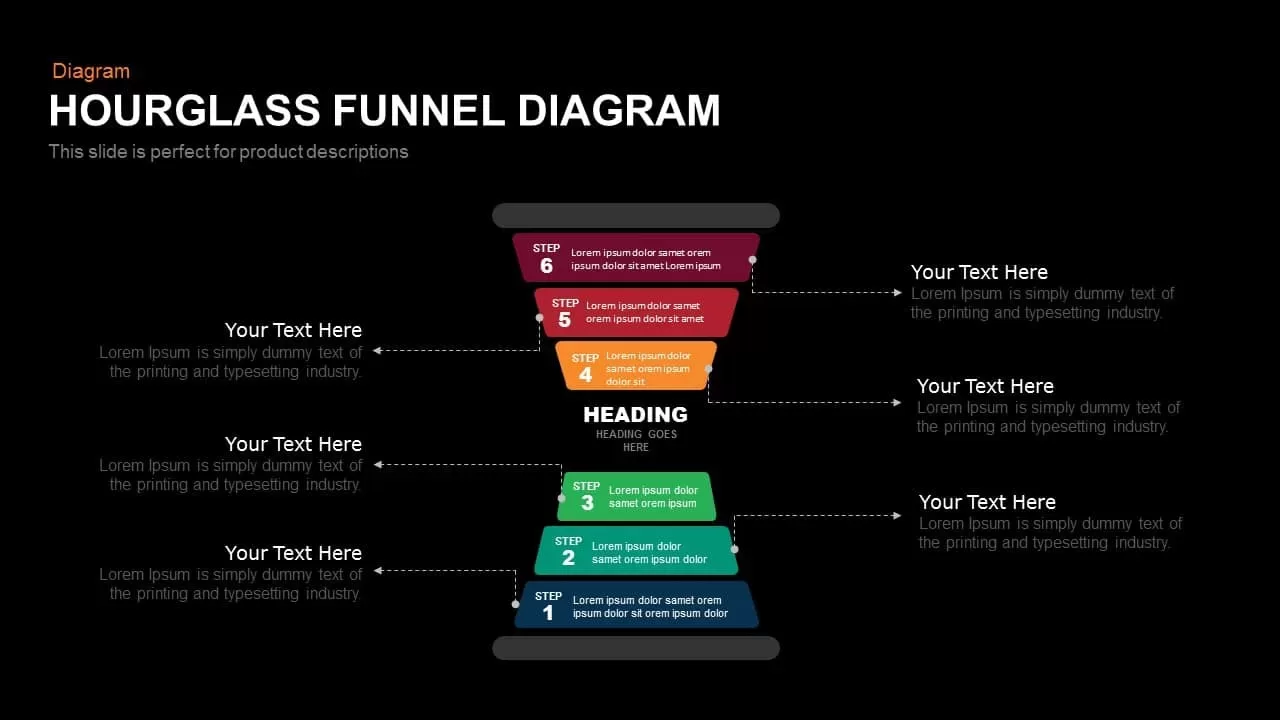
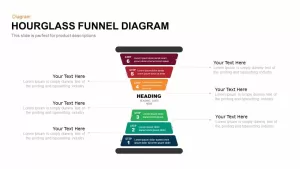
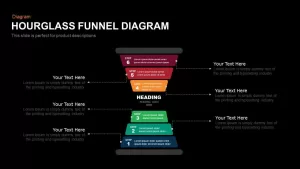
Leverage this dynamic hourglass funnel diagram slide to illustrate two-stage processes and data flows with visual precision. A vector-based hourglass shape features seven stacked trapezoidal segments—three in the top funnel (dark red, red, orange) and four in the bottom funnel (green, teal, blue, navy)—anchored by a central heading placeholder. From each segment, dashed connector lines extend to text callouts on the left and right, offering space for concise labels, statistics, or brief descriptions. A spacious title area at the top sets the context, while semi-transparent gradient arrows on the slide margins hint at guided, carousel-style navigation.
Built on fully editable master slides, every element is a scalable vector shape that you can customize in seconds. Adjust segment colors to match your brand palette, update the central heading, swap connector styles, or edit callout text without disrupting layout alignment. The clean white background and minimalist typography ensure maximum readability, while balanced white space maintains a professional aesthetic. Whether you’re mapping sales conversion stages, lead-nurturing funnels, or phased project roadmaps, this infographic streamlines complex sequences into a single, cohesive visual asset.
Intuitive placeholders accelerate collaboration by enabling team members to insert new segment titles, adjust connector paths, or replace trapezoid shapes with alternate icons. Duplicate or remove funnel tiers to accommodate varying process lengths, and apply custom color themes to reinforce corporate branding. The design’s vector-driven fidelity guarantees pixel-perfect clarity on both PowerPoint and Google Slides, eliminating formatting headaches and version-control issues during remote or in-person presentations.
Who is it for
Marketing managers, sales executives, product strategists, and project leads will leverage this hourglass funnel diagram to present conversion metrics, process workflows, or project phases in stakeholder briefings, executive reviews, or team workshops.
Other Uses
Repurpose this slide for customer journey mapping, resource allocation overviews, risk-assessment models, or training program milestones. Replace callouts and segment colors to visualize survey results, feature prioritization, or phased rollout plans with clarity and impact.
Login to download this file

Item ID
SB00500
Related Templates

Four-Step Hourglass Business Process Template for PowerPoint & Google Slides
Process
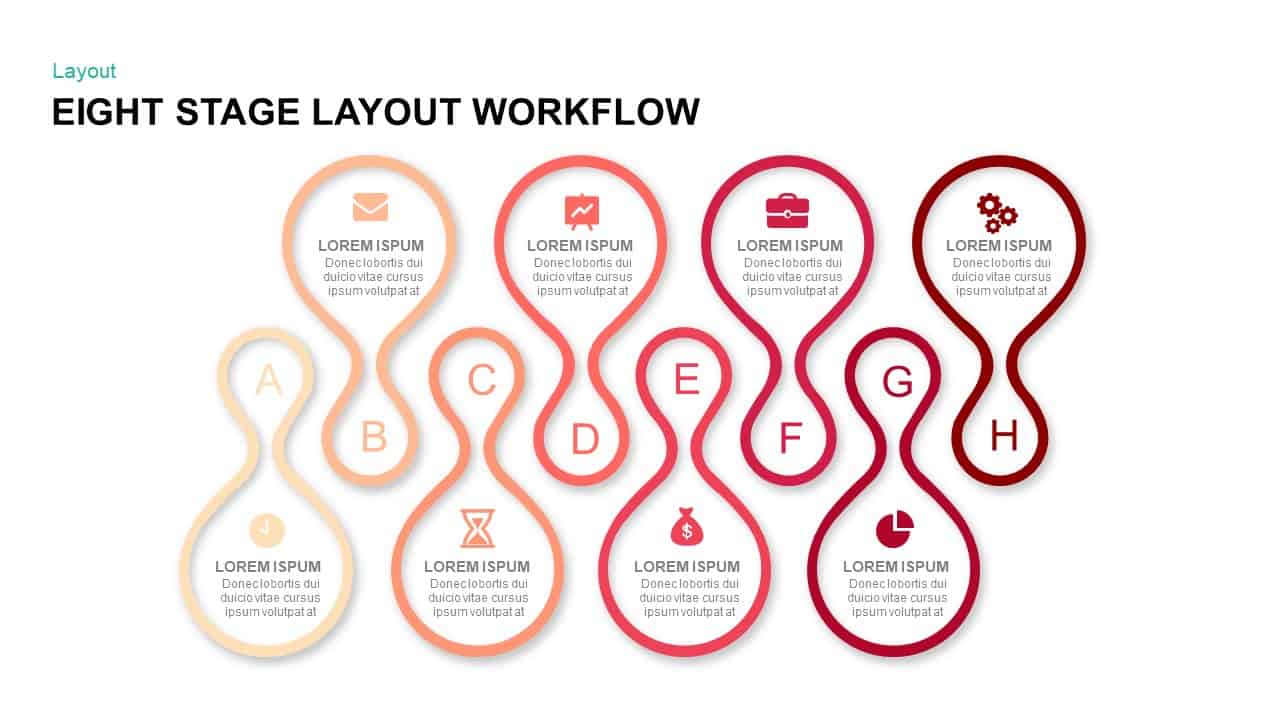
Eight Stage Hourglass Workflow Diagram Template for PowerPoint & Google Slides
Process
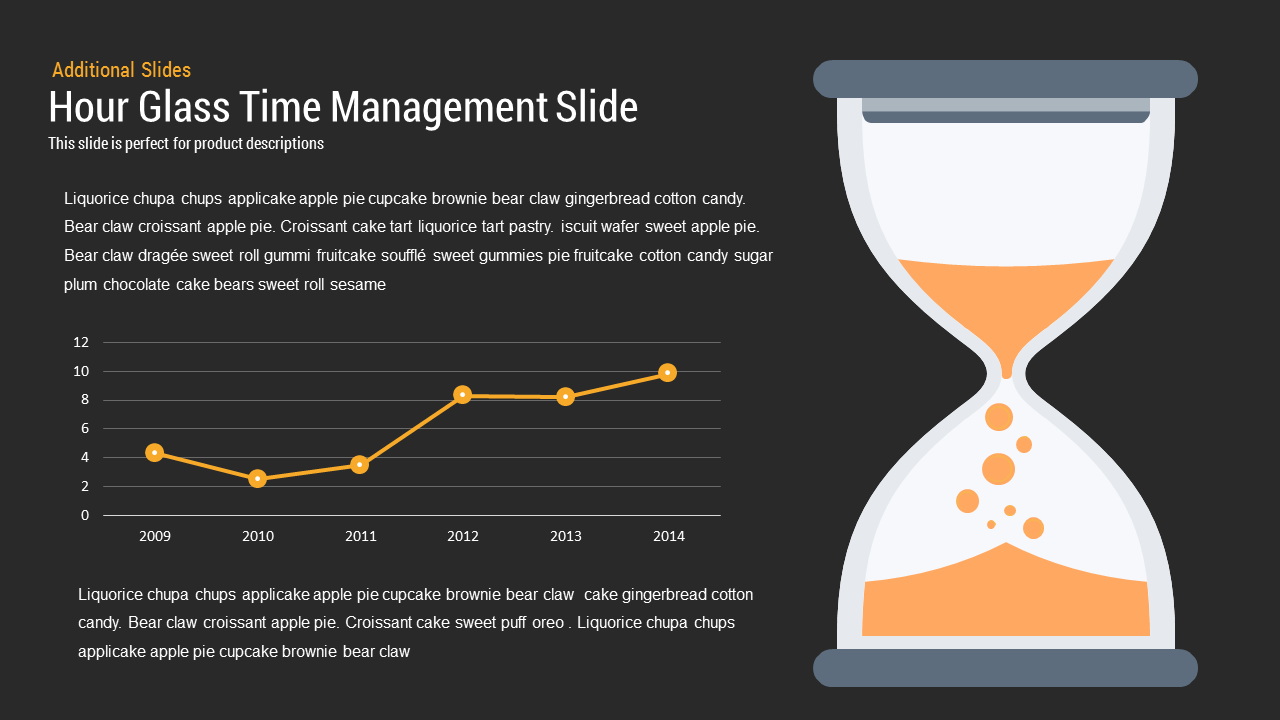
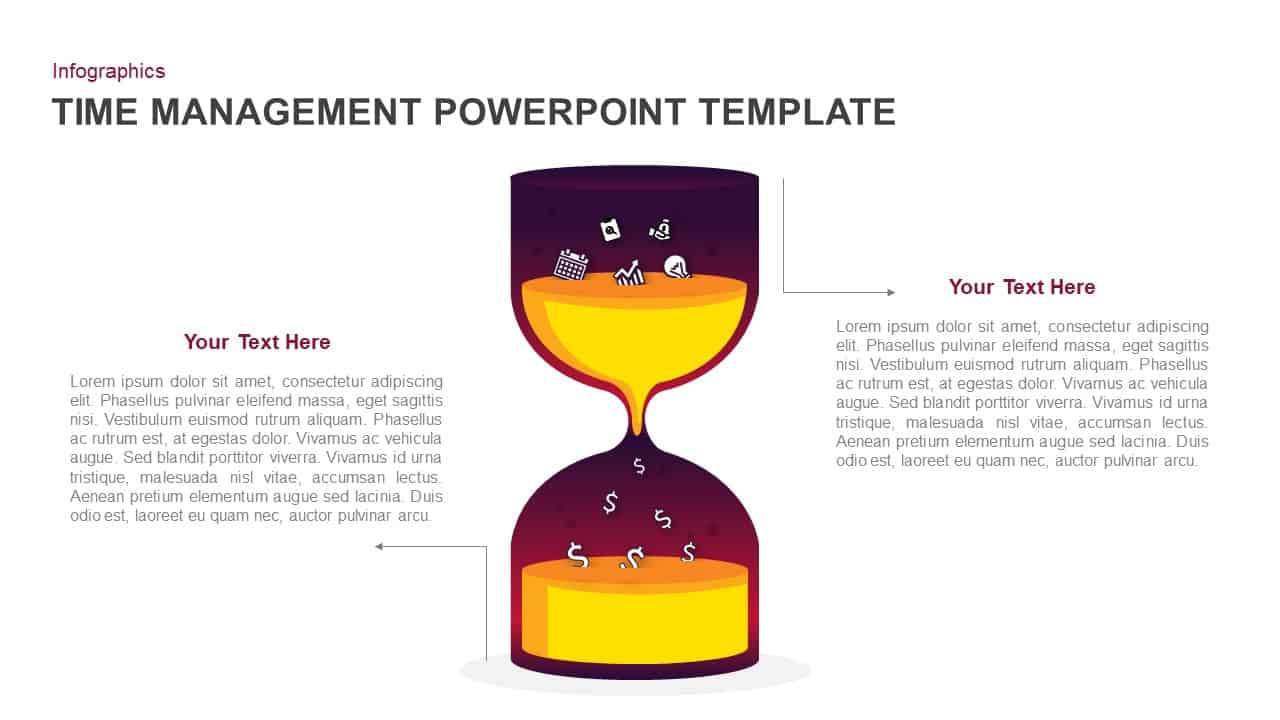
Hourglass Time Mgmt template for PowerPoint & Google Slides
Infographics

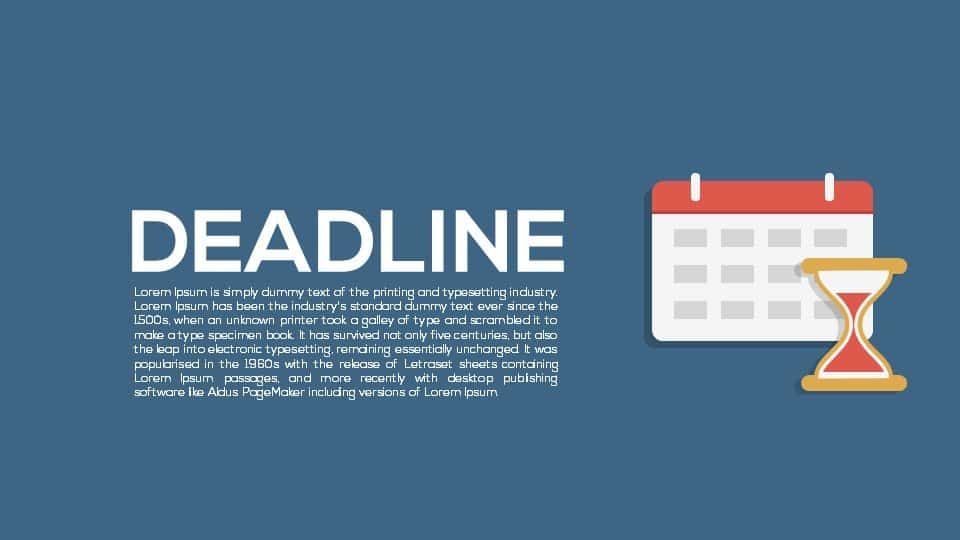
Deadline Metaphor Timeline & Hourglass Template for PowerPoint & Google Slides
Project
Time Management Hourglass Infographic Template for PowerPoint & Google Slides
Business
Sales Process Workflow Funnel Diagram PowerPoint Template for PowerPoint & Google Slides
Funnel
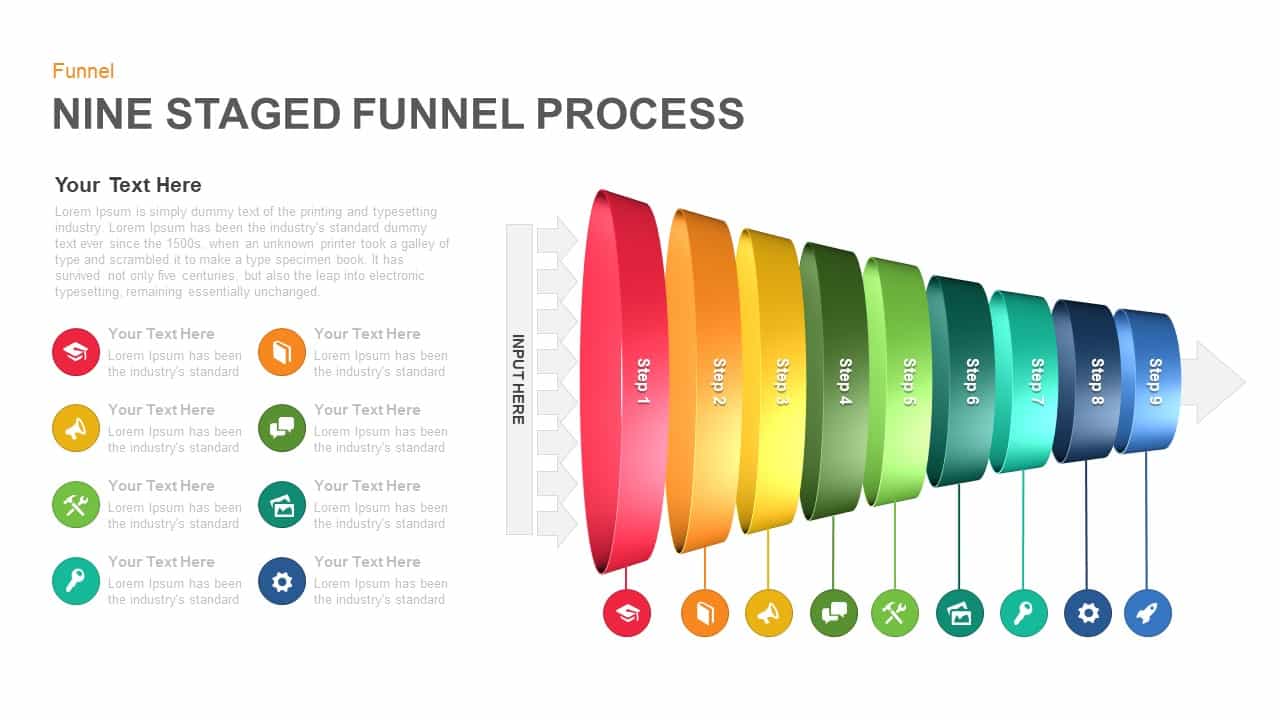
Nine-Stage 3D Funnel Process Diagram Template for PowerPoint & Google Slides
Funnel
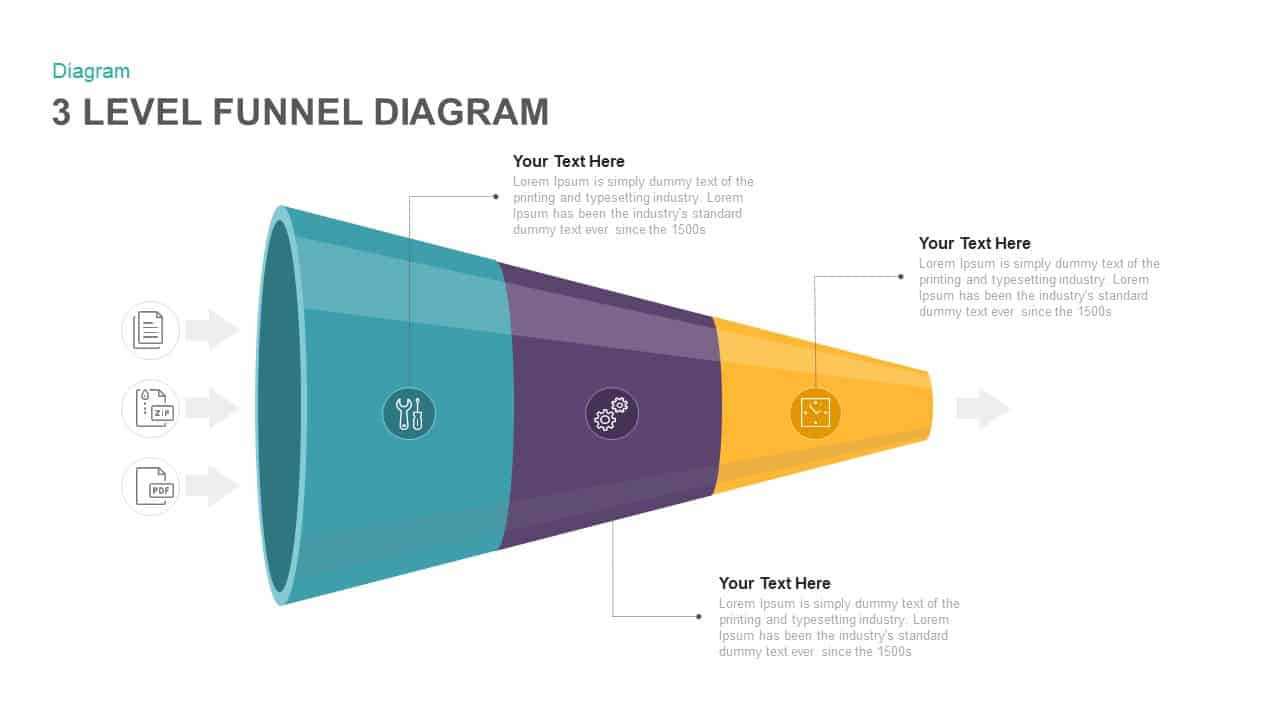
Three Level Funnel Process Diagram Template for PowerPoint & Google Slides
Funnel
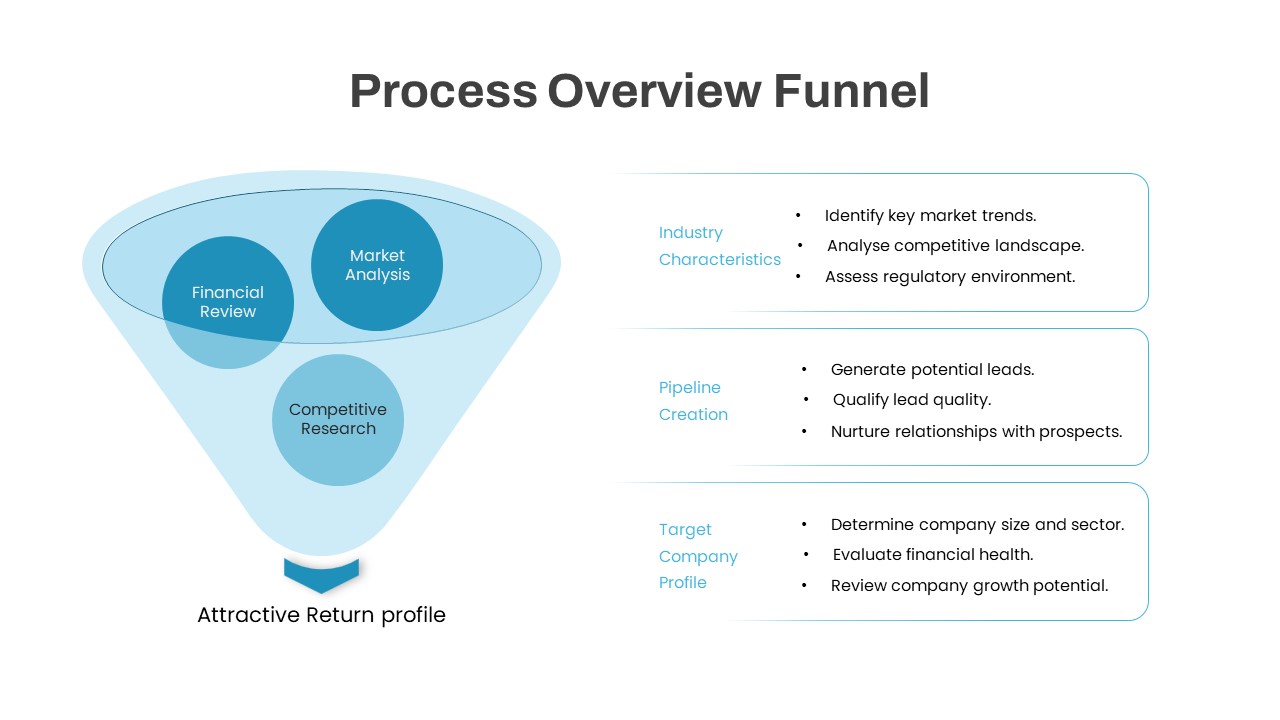
Process Overview Funnel Diagram Template for PowerPoint & Google Slides
Funnel
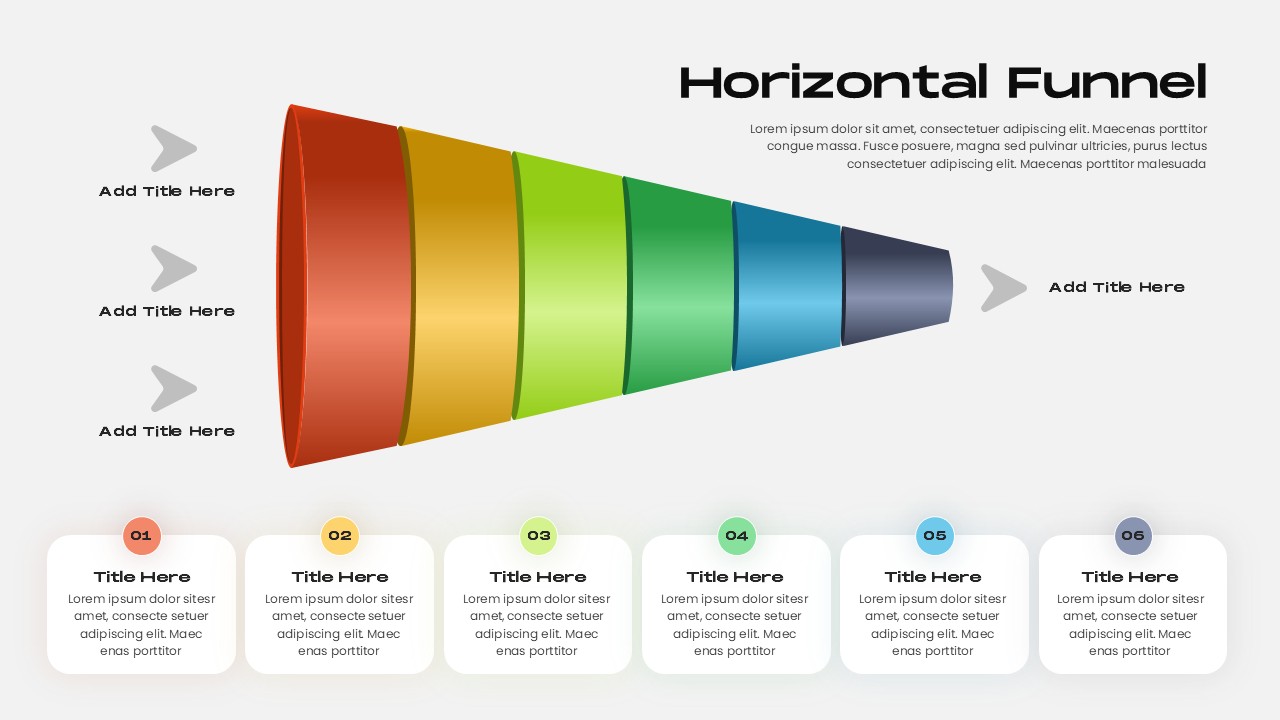
Horizontal Funnel Diagram Process Template for PowerPoint & Google Slides
Funnel
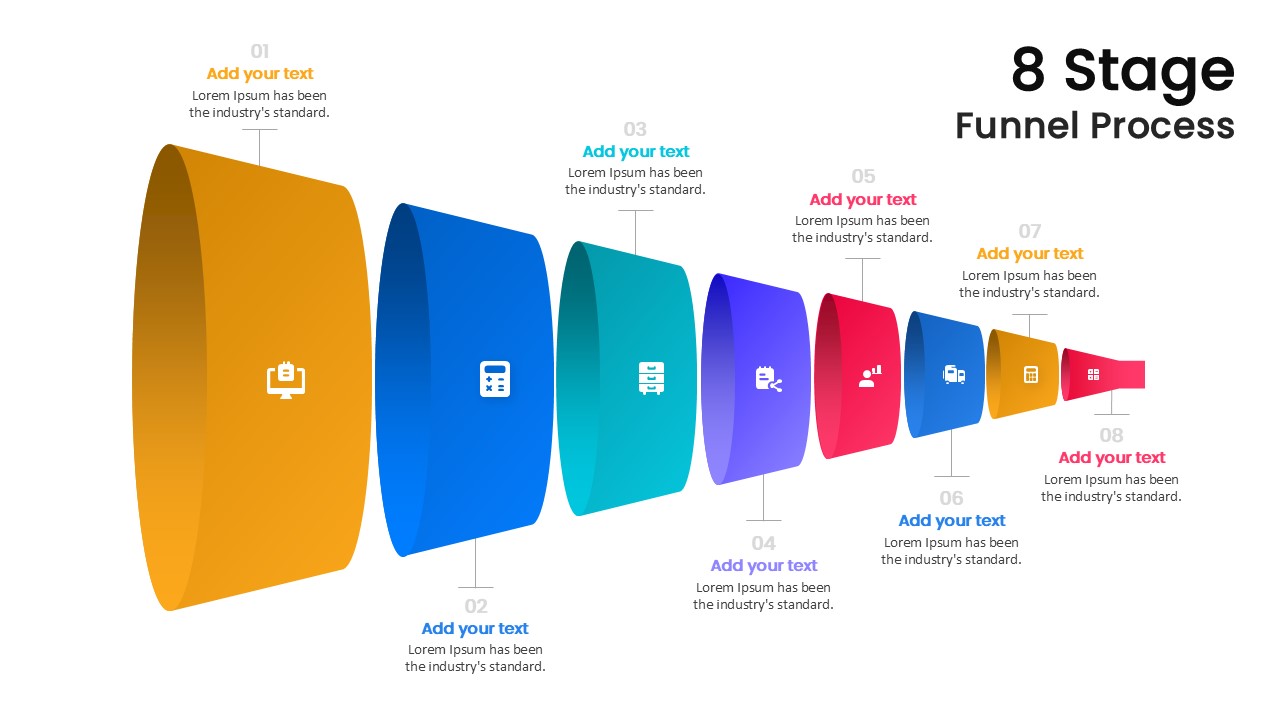
Modern 8-Stage Funnel Process Diagram Template for PowerPoint & Google Slides
Funnel
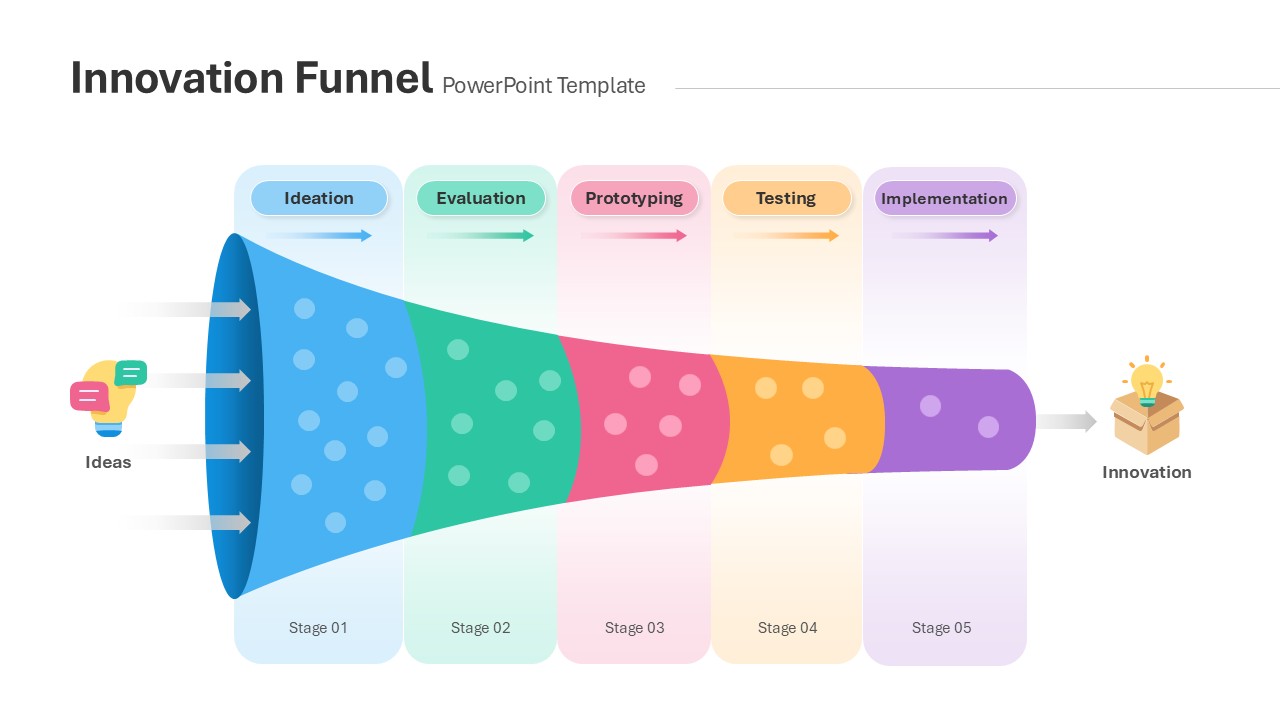
Innovation Funnel Process Diagram Template for PowerPoint & Google Slides
Funnel
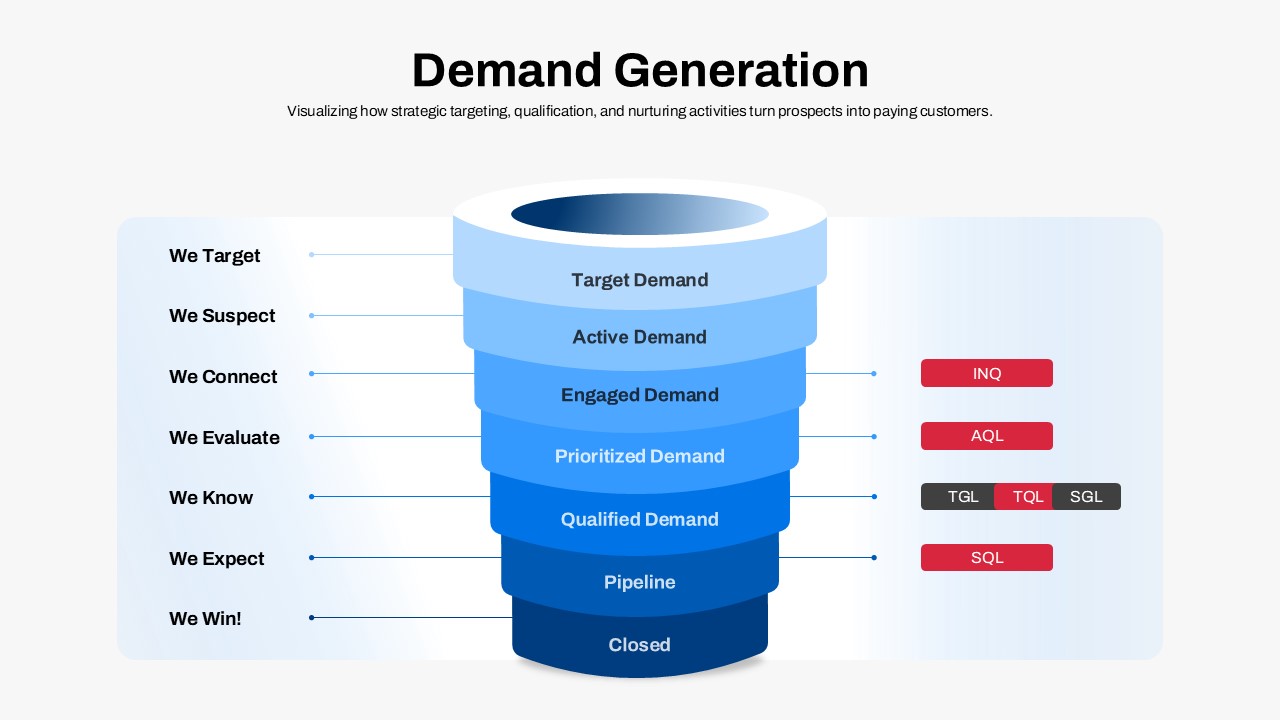
Demand Generation Funnel Process Diagram Template for PowerPoint & Google Slides
Funnel
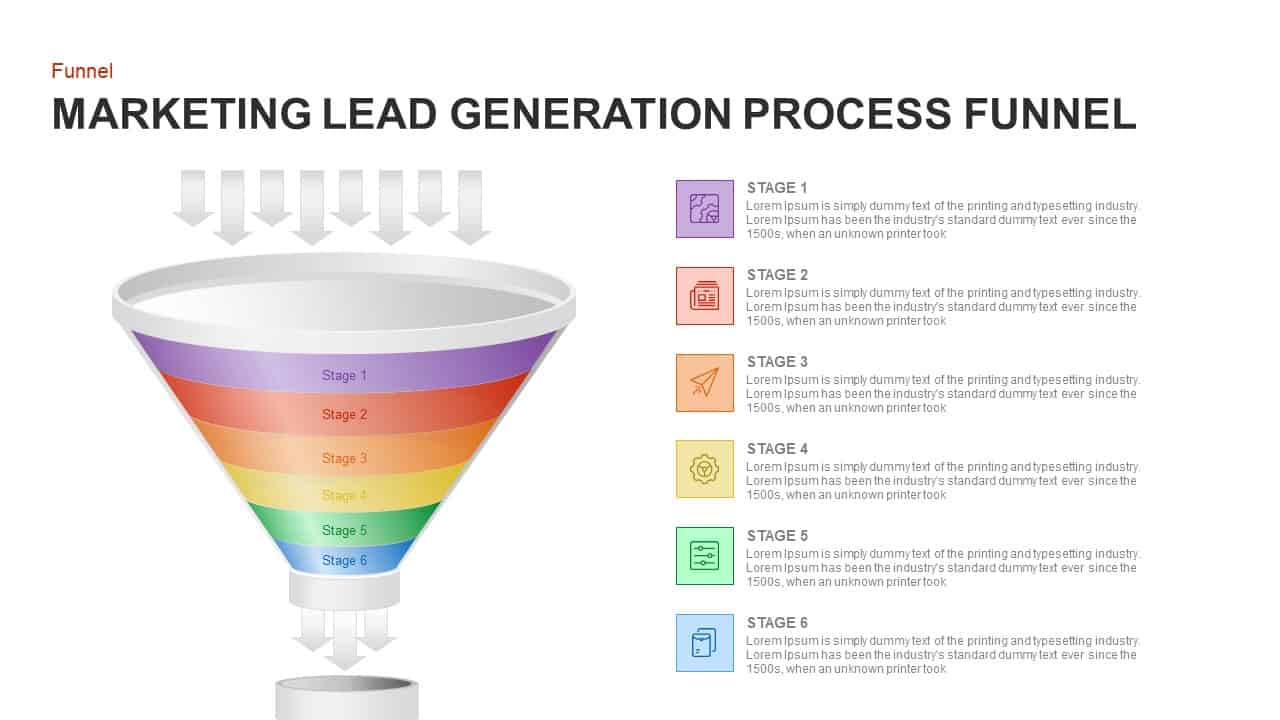
Marketing Lead Generation Process Funnel PowerPoint Template for PowerPoint & Google Slides
Funnel
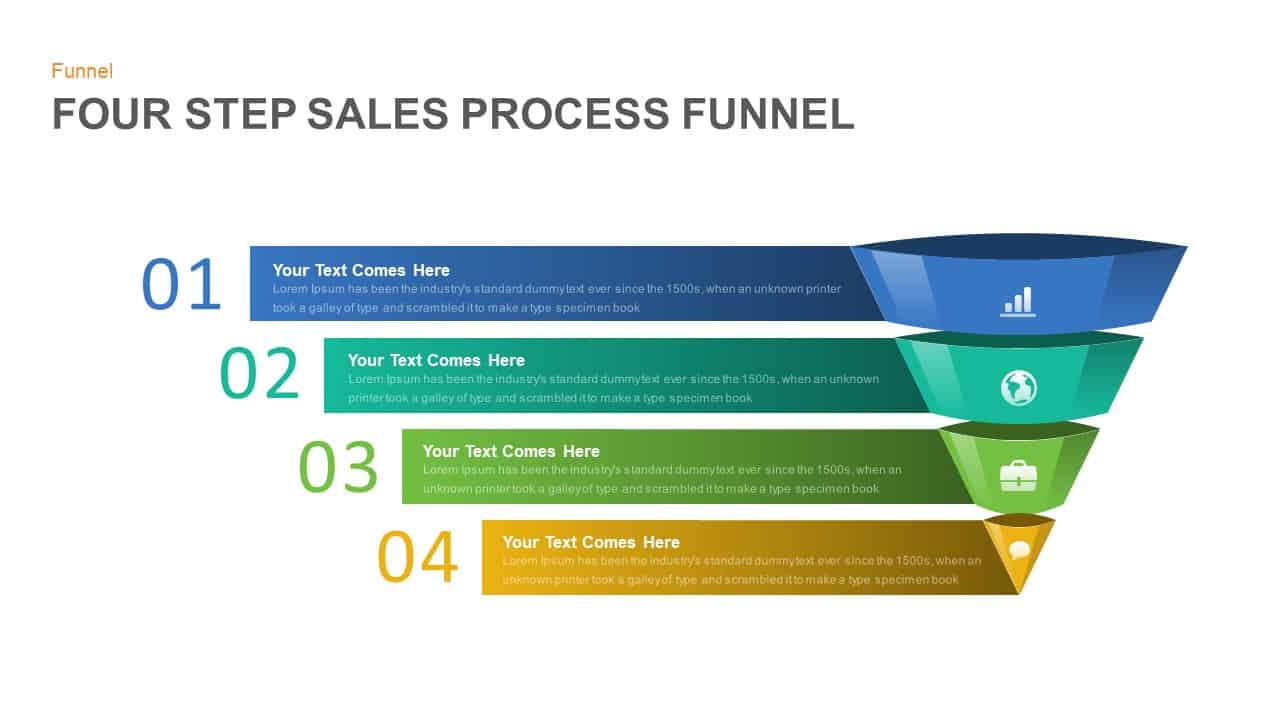
Four Step Sales Process Funnel Template for PowerPoint & Google Slides
Funnel
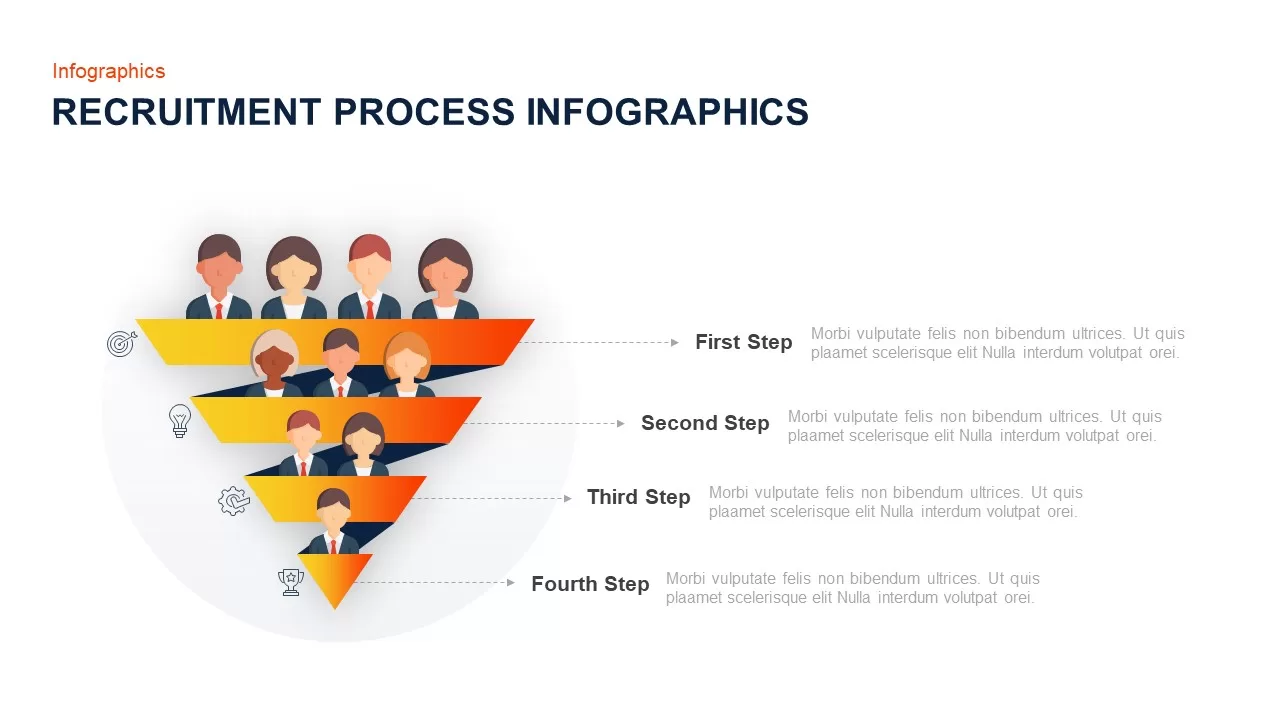
Recruitment Process Funnel Infographics Template for PowerPoint & Google Slides
Recruitment
8 Stage Funnel Process template for PowerPoint & Google Slides
Funnel
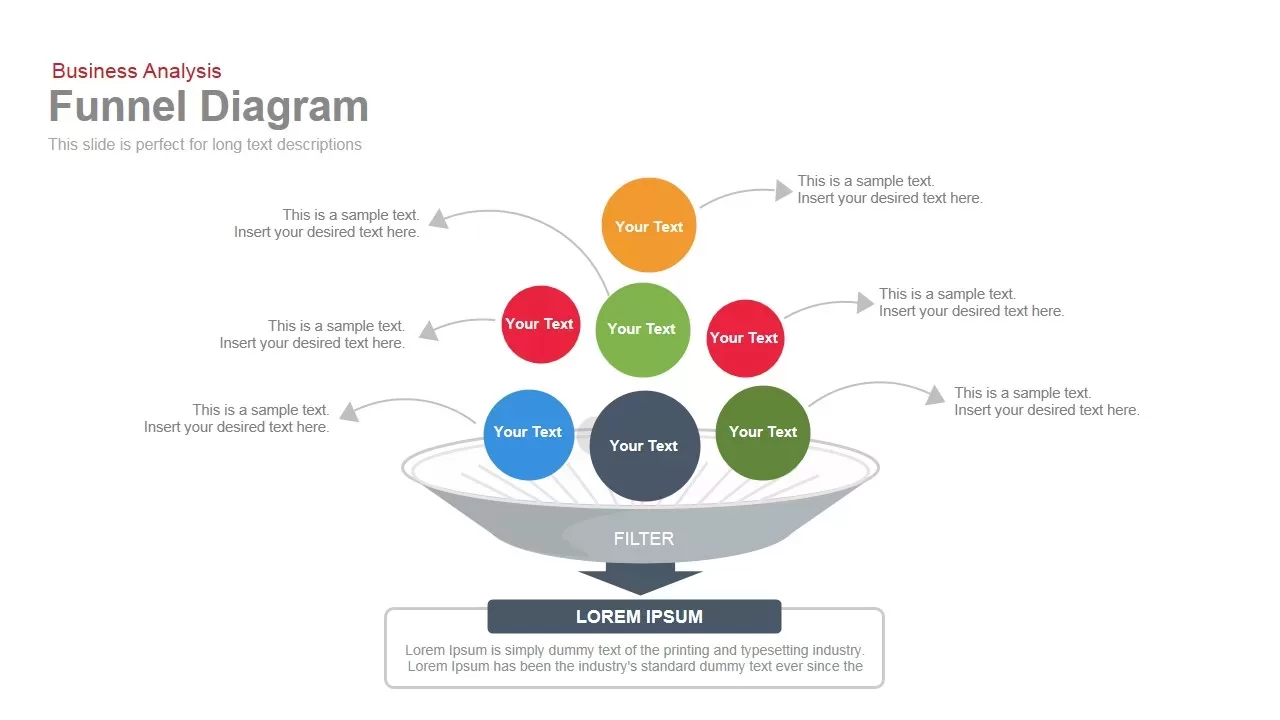
Business Funnel Diagram template for PowerPoint & Google Slides
Funnel
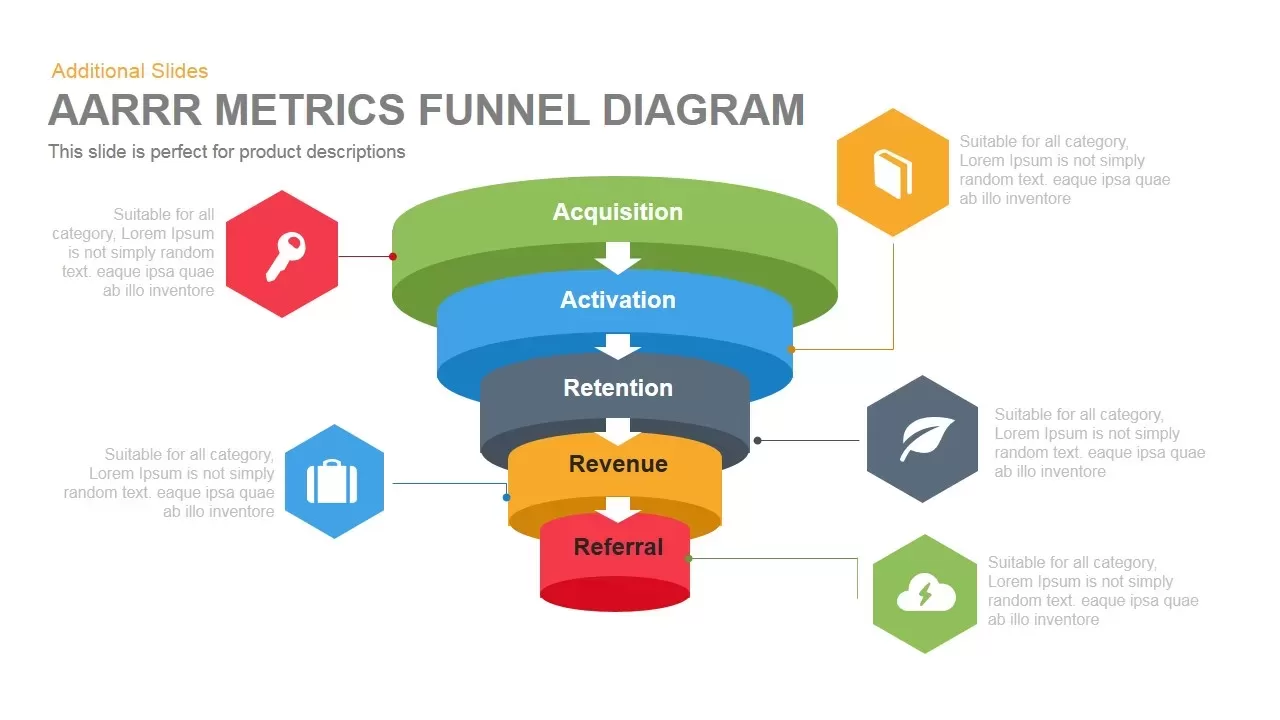
AARRR Funnel Diagram template for PowerPoint & Google Slides
Funnel
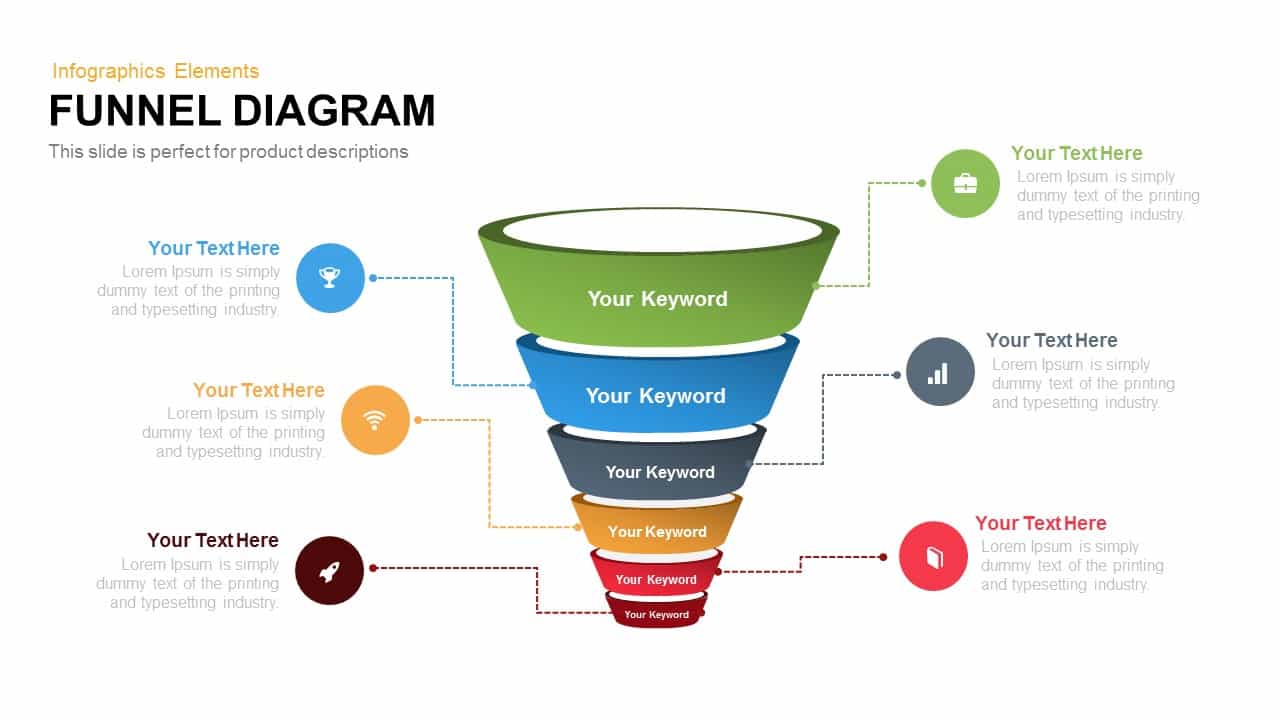
Funnel Diagram Template for PowerPoint & Google Slides
Infographics
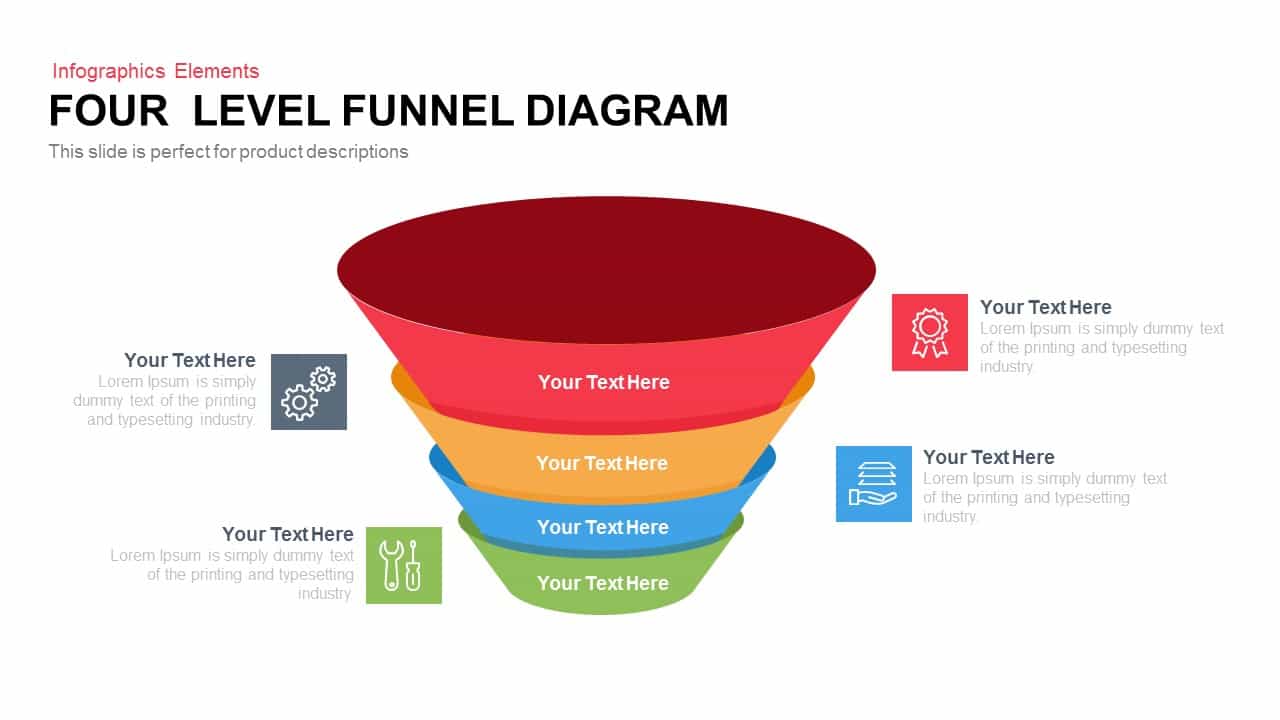
4 Level Funnel Diagram Template for PowerPoint & Google Slides
Funnel
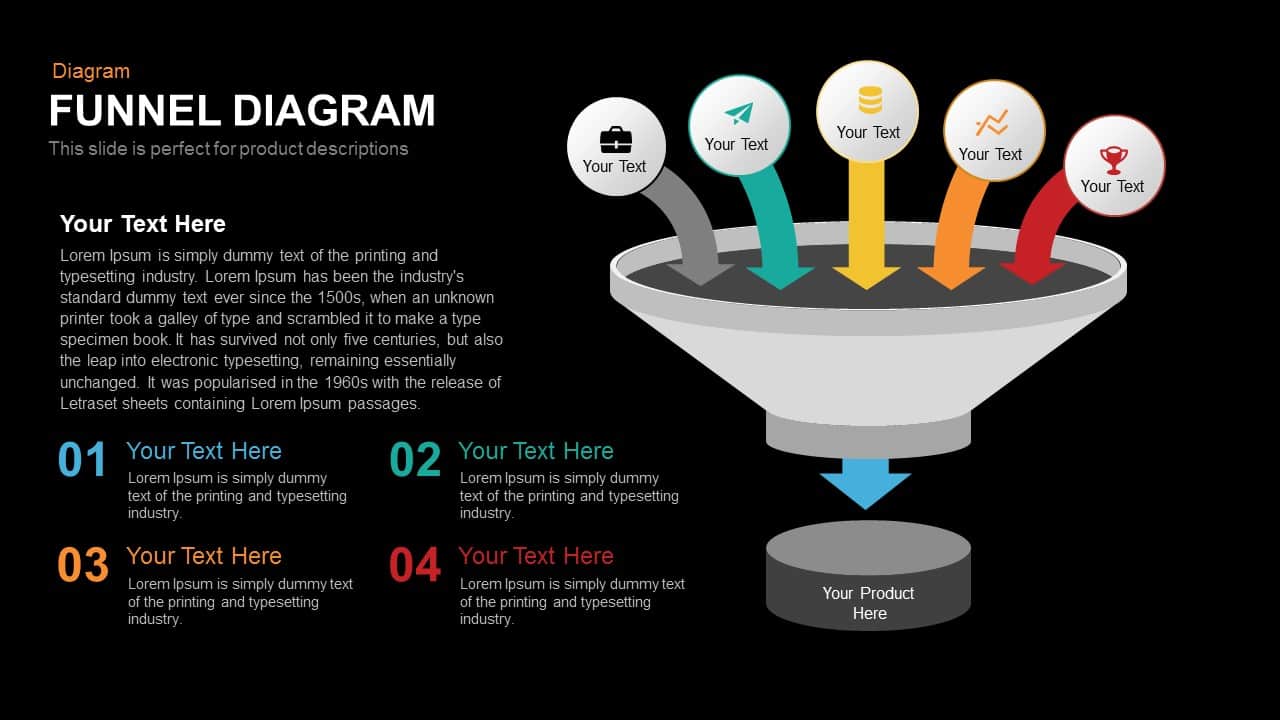
Funnel Diagram template for PowerPoint & Google Slides
Funnel
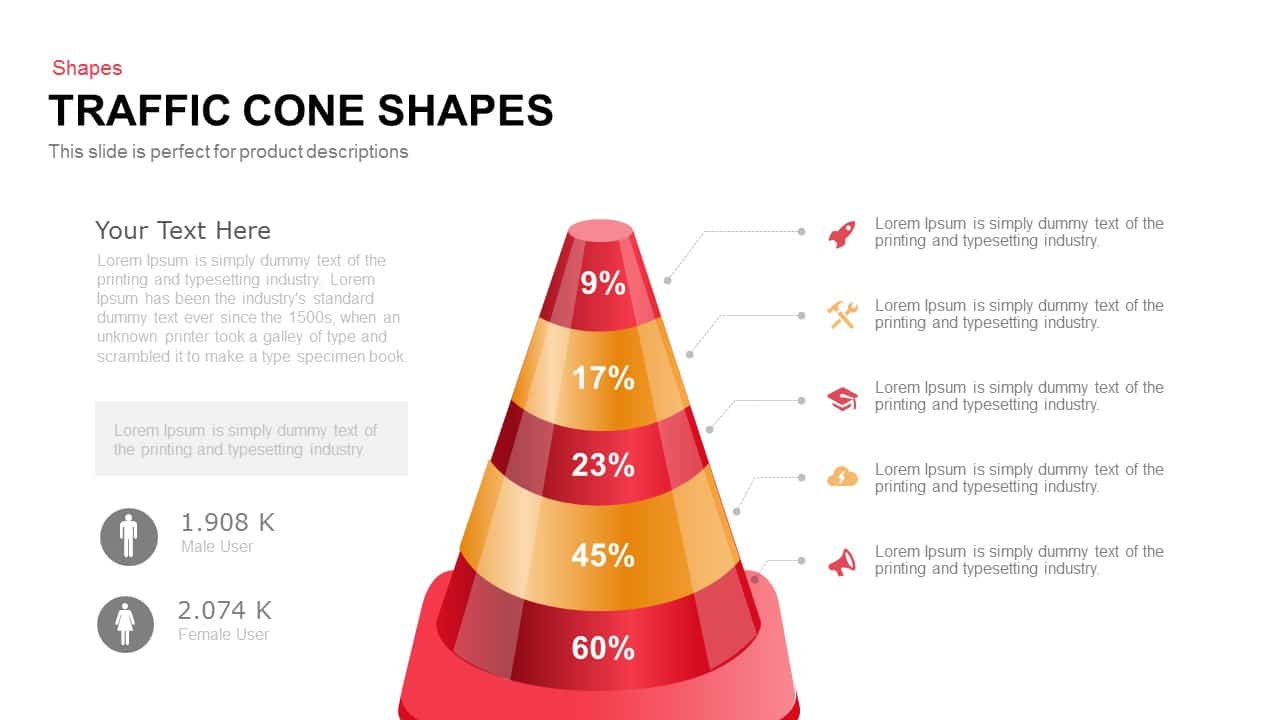
Traffic Cone Funnel Diagram Slide Template for PowerPoint & Google Slides
Funnel
Professional Four-Stage Funnel Diagram Template for PowerPoint & Google Slides
Funnel
Four and Five-Stage Funnel Diagram Template for PowerPoint & Google Slides
Funnel
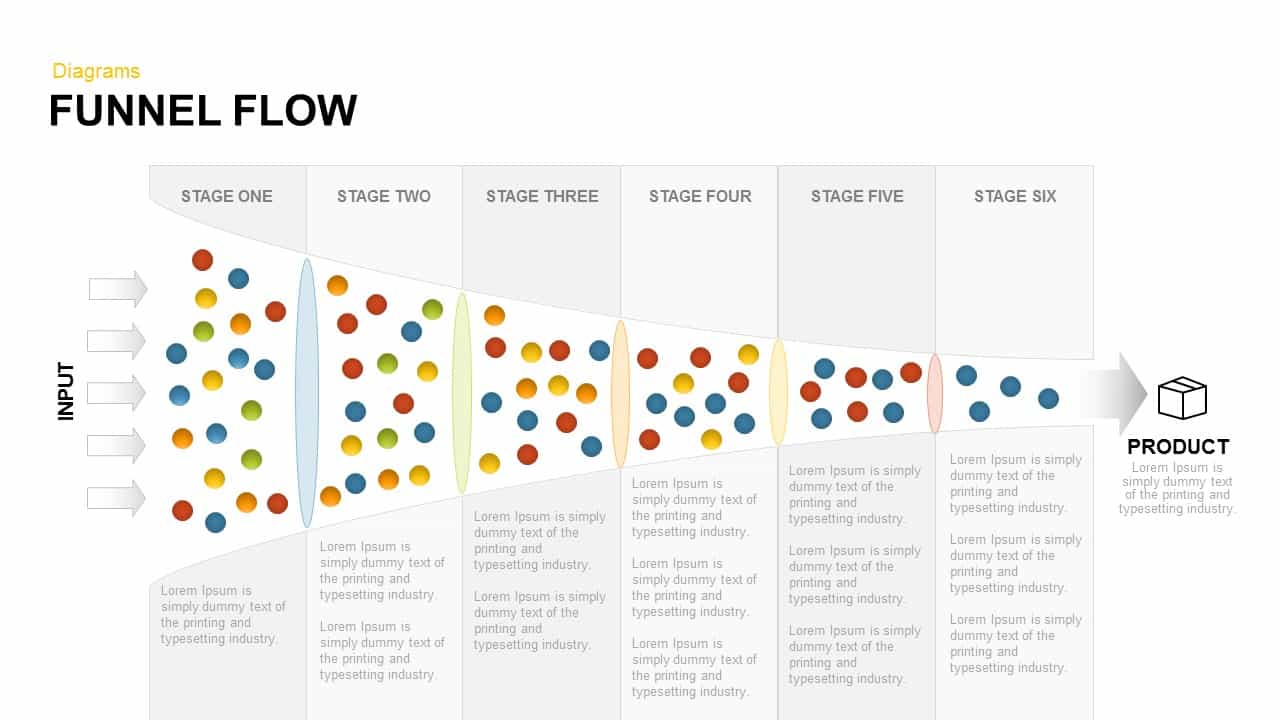
Funnel Flow Diagram template for PowerPoint & Google Slides
Funnel

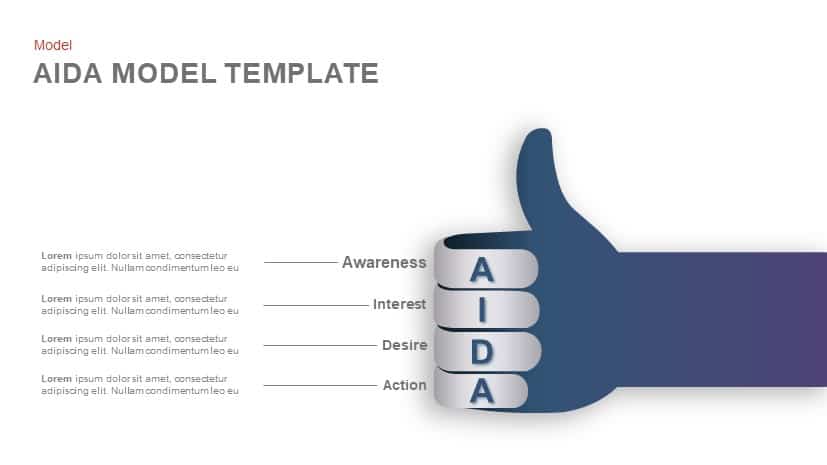
AIDA Model Funnel Thumb Diagram Template for PowerPoint & Google Slides
Process
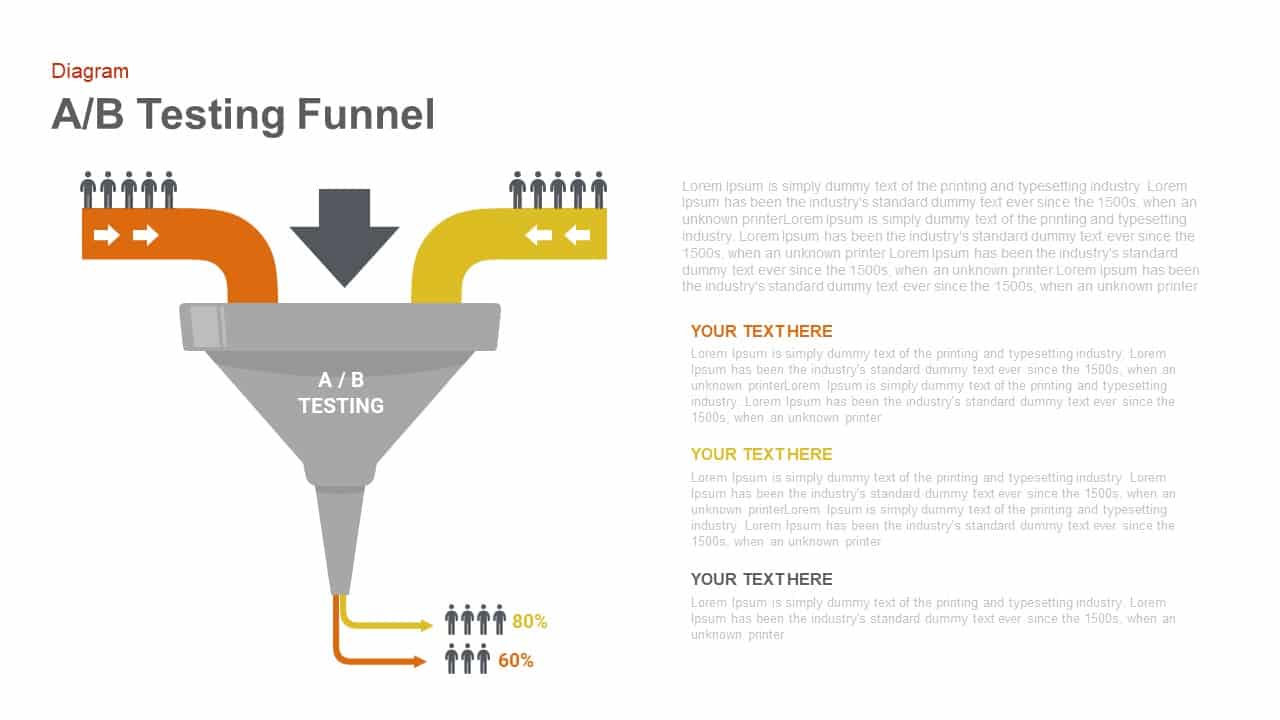
A/B Testing Funnel Diagram Template for PowerPoint & Google Slides
Digital Marketing
6-Stage Funnel Diagram Infographic Template for PowerPoint & Google Slides
Funnel
3D Conversion Funnel Diagram Infographic Template for PowerPoint & Google Slides
Funnel
Animated Recruiting Funnel Diagram Template for PowerPoint & Google Slides
Funnel
Professional Sales Funnel Diagram Template for PowerPoint & Google Slides
Funnel
Five-Step Gradient Blue Funnel Diagram Template for PowerPoint & Google Slides
Funnel
Four-Stage Funnel Diagram Infographic Template for PowerPoint & Google Slides
Funnel
Four-Step Spiral Funnel Diagram Template for PowerPoint & Google Slides
Funnel
5-Step Colorful Funnel Diagram Template for PowerPoint & Google Slides
Funnel
Four-Stage Funnel Diagram Infographic Template for PowerPoint & Google Slides
Funnel
Sales Funnel Infographic Diagram Template for PowerPoint & Google Slides
Funnel
Free 4-Step 3D Funnel Diagram Template for PowerPoint & Google Slides
Funnel
Free
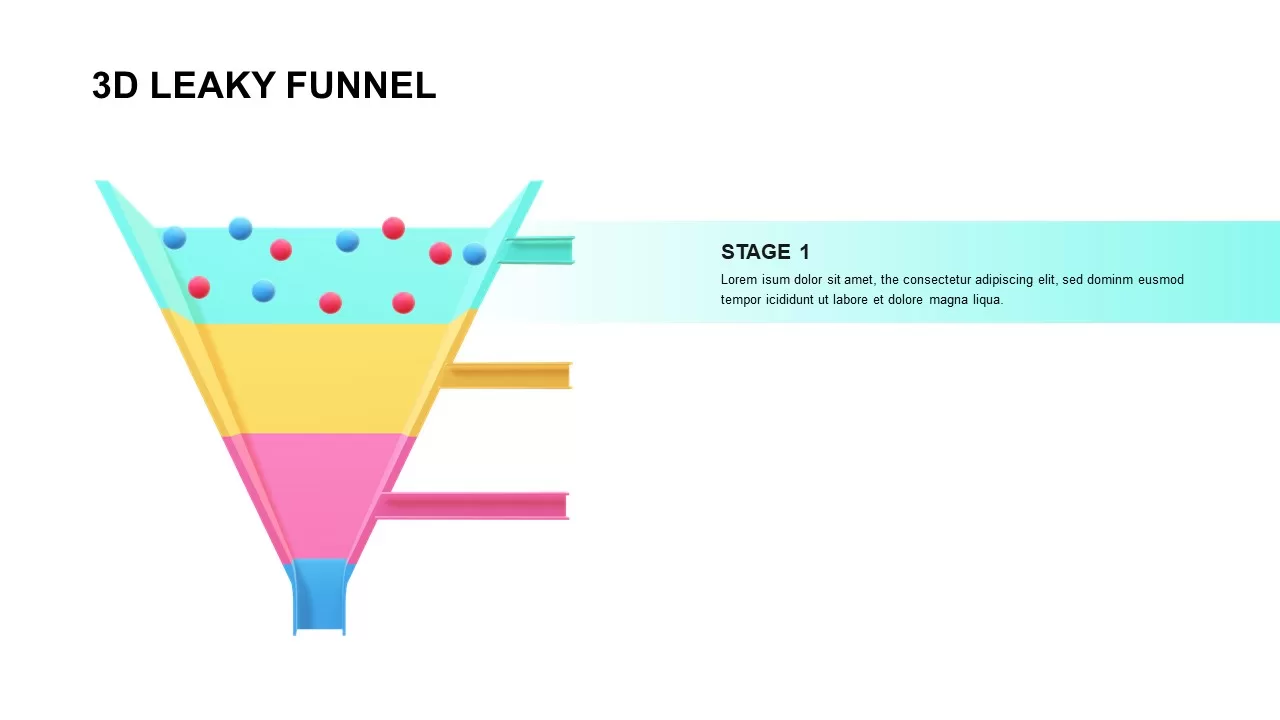
3D Leaky Funnel Diagram template for PowerPoint & Google Slides
Funnel
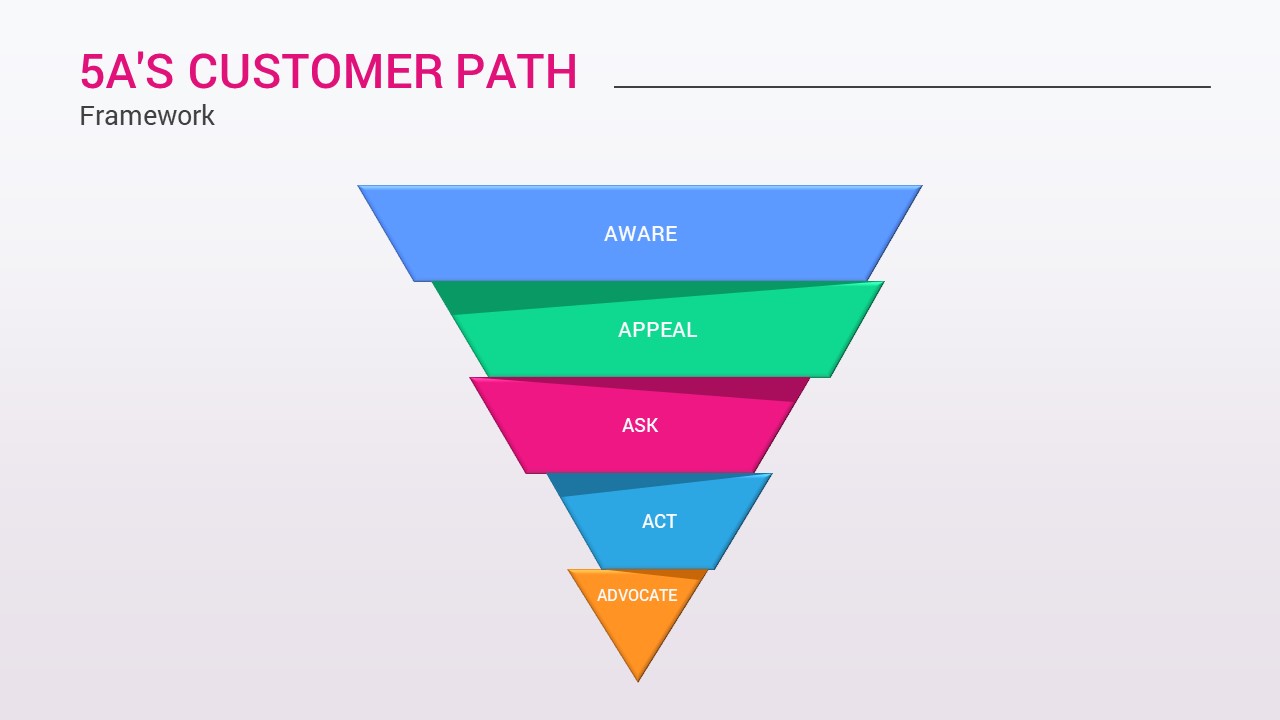
5A’s Customer Path Funnel Diagram Template for PowerPoint & Google Slides
Funnel
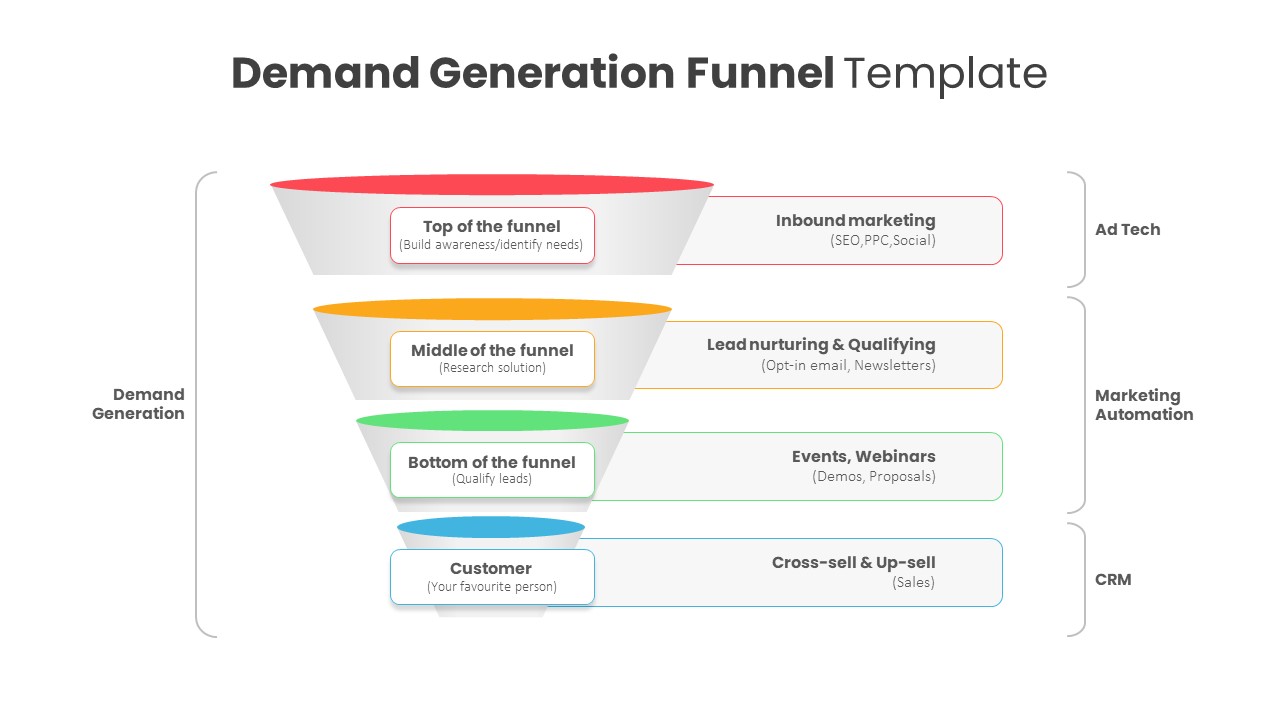
Demand Generation Funnel Diagram Template for PowerPoint & Google Slides
Funnel
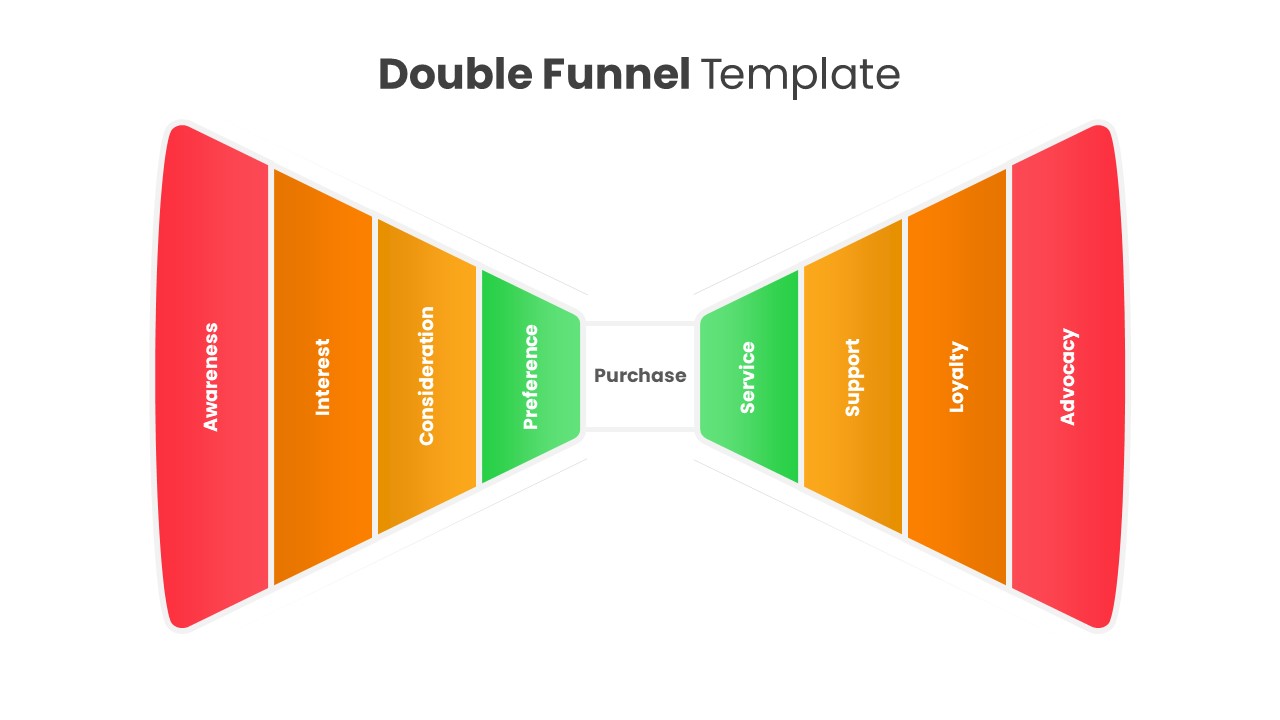
Double Funnel Lifecycle Diagram Template for PowerPoint & Google Slides
Funnel
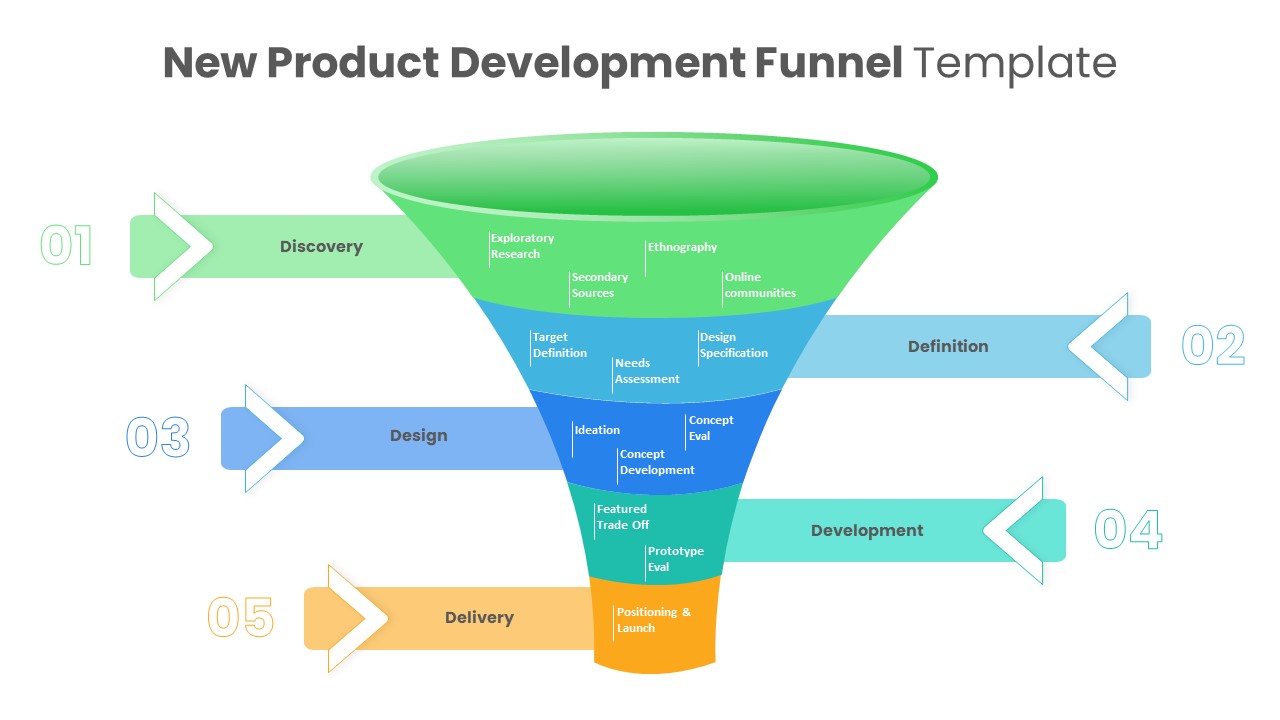
New Product Development Funnel Diagram Template for PowerPoint & Google Slides
Funnel
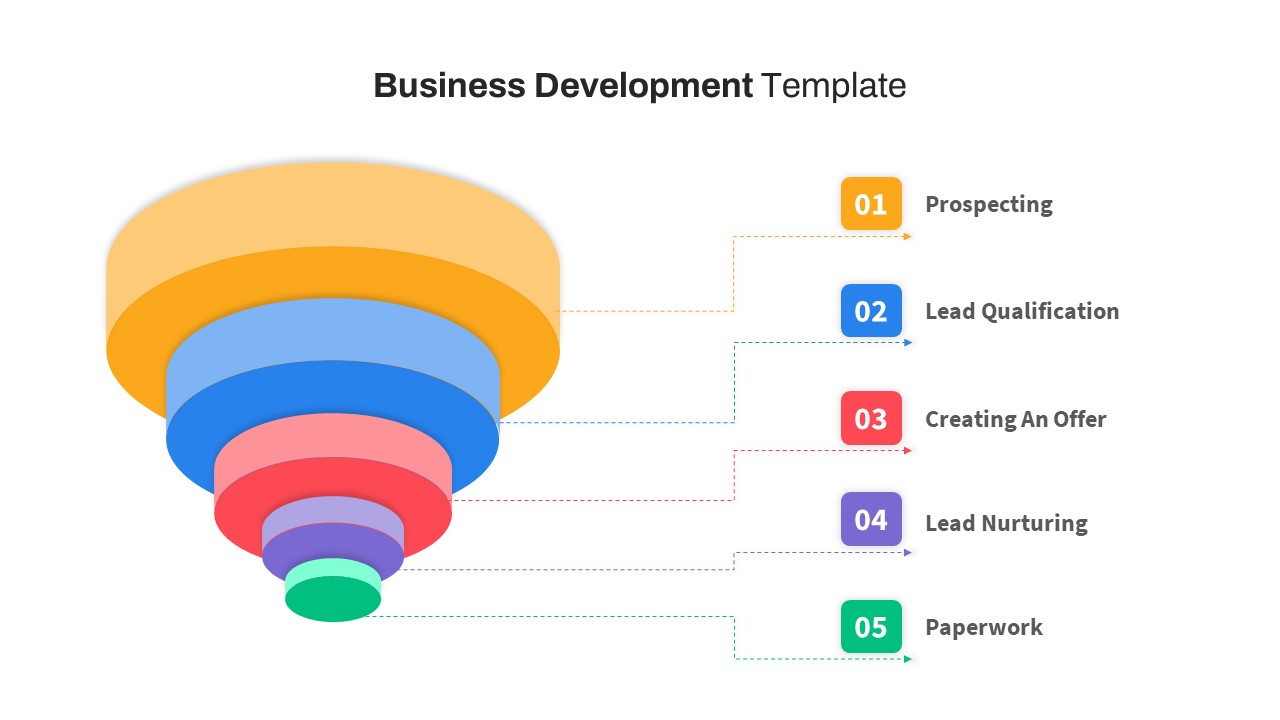
Free Business Development Funnel Diagram Template for PowerPoint & Google Slides
Marketing Funnel
Free
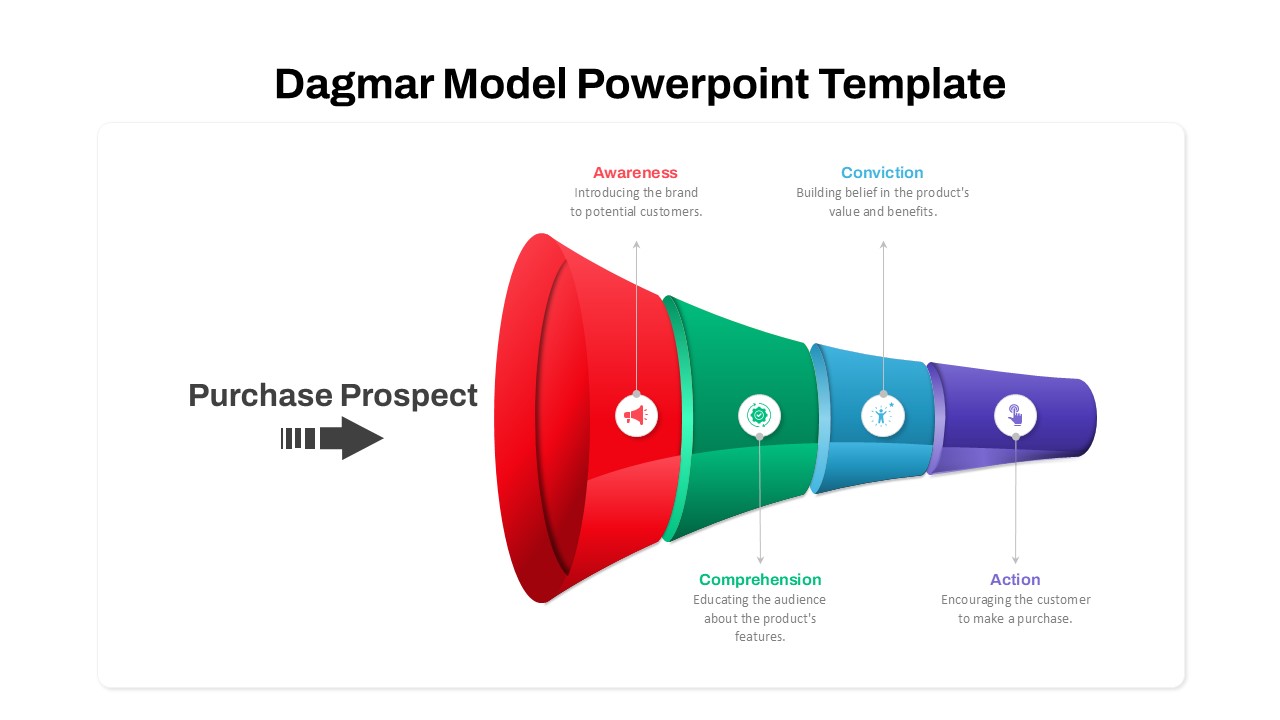
Dagmar Model Marketing Funnel Diagram Template for PowerPoint & Google Slides
Funnel
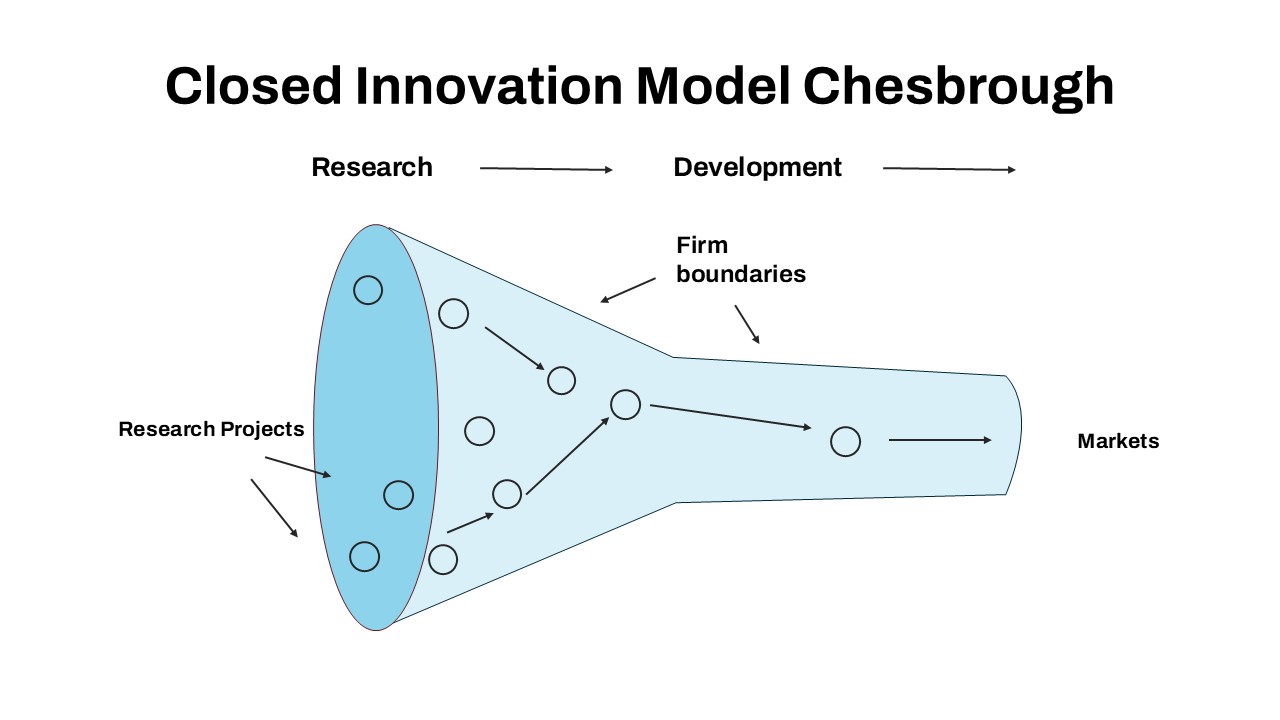
Closed Innovation Model Funnel Diagram Template for PowerPoint & Google Slides
Funnel
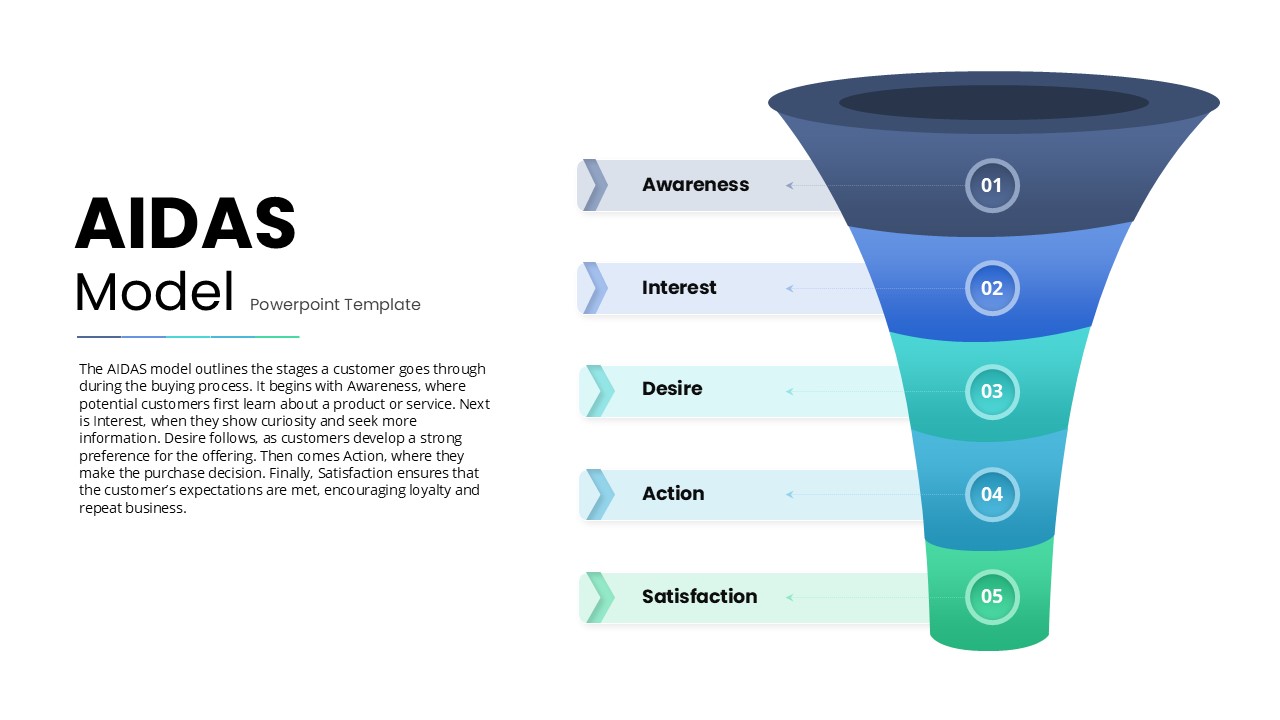
AIDAS Customer Journey Funnel Diagram Template for PowerPoint & Google Slides
Marketing Funnel
Five-Step Modern Funnel Diagram Template for PowerPoint & Google Slides
Funnel
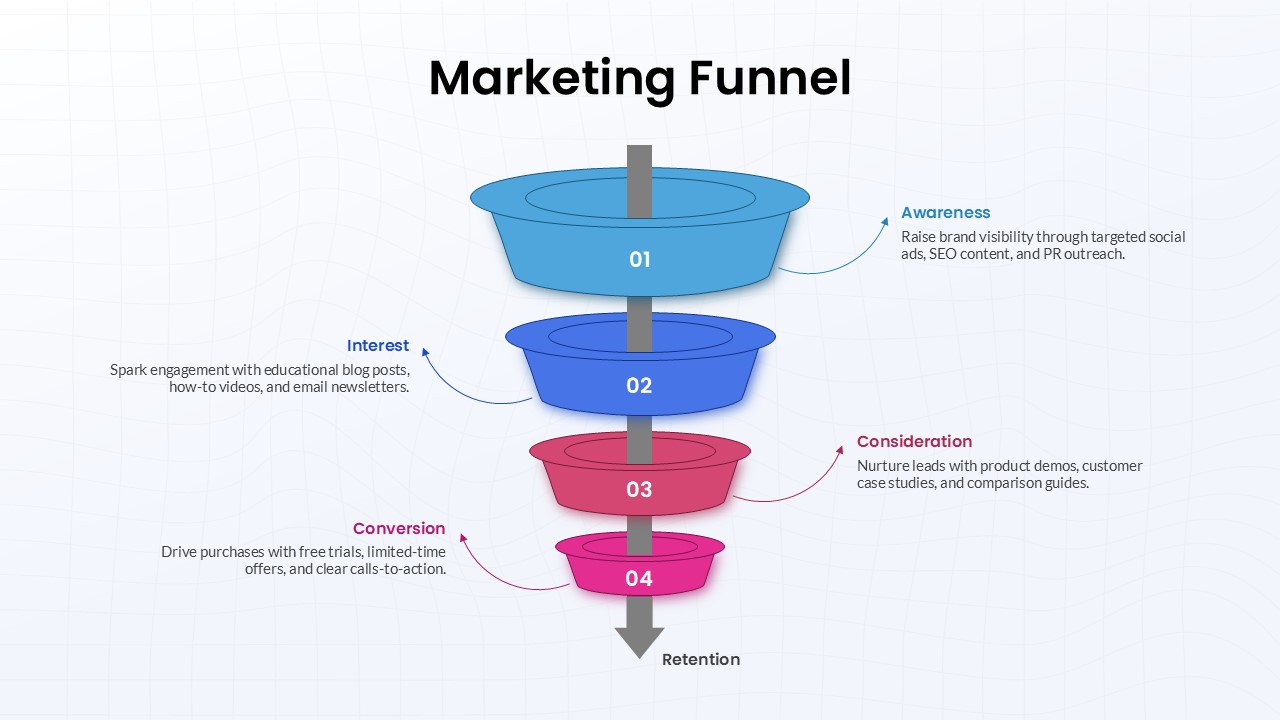
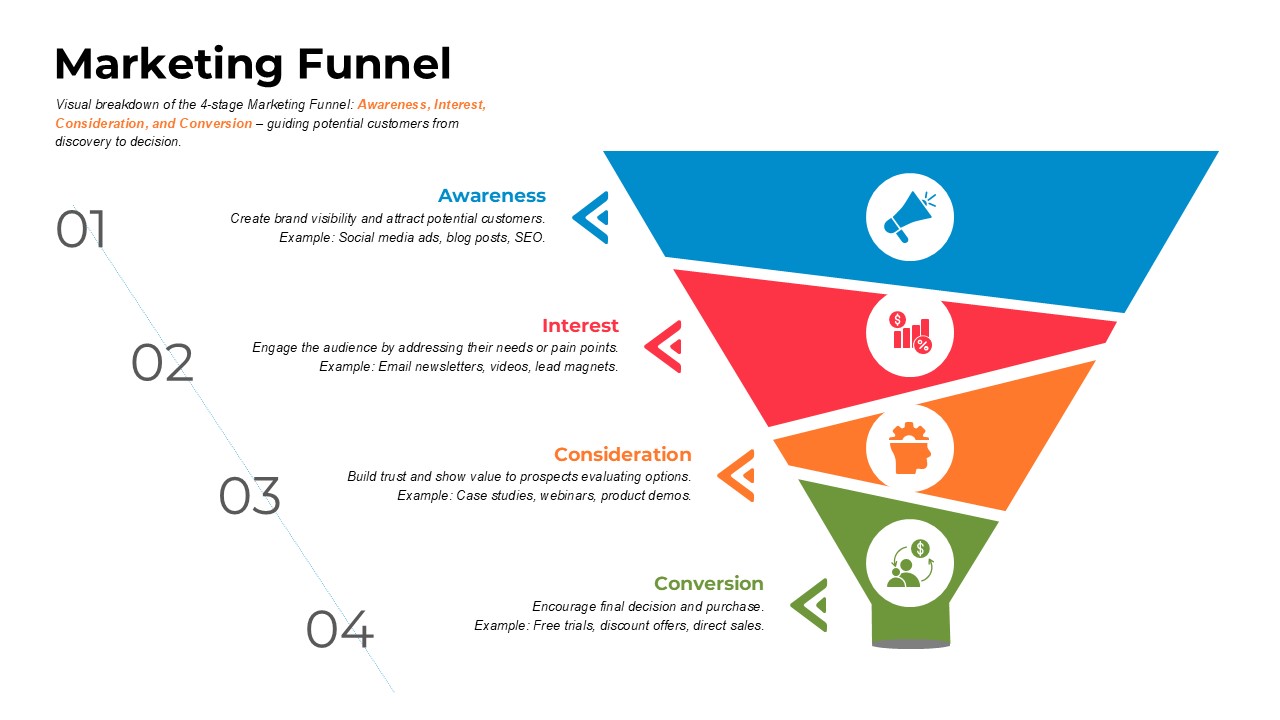
Four-Stage Marketing Funnel Diagram Template for PowerPoint & Google Slides
Marketing Funnel
5 Stage Sales Funnel Diagram Template for PowerPoint & Google Slides
Funnel
Sales Funnel Diagram for PowerPoint & Google Slides
Marketing Funnel
Funnel Filter Diagram for PowerPoint & Google Slides
Funnel
Five Staged Funnel Diagram for PowerPoint & Google Slides
Funnel
Six Staged Funnel Diagram for PowerPoint & Google Slides
Funnel
4 Level Sales Funnel Diagram Design for PowerPoint & Google Slides
Marketing Funnel
3D Funnel Diagram Infographics for PowerPoint & Google Slides
Funnel
Sales Enablement Funnel diagram for PowerPoint & Google Slides
Funnel

Innovation Ambition Matrix & Funnel Strategy Slides for PowerPoint & Google Slides
Process
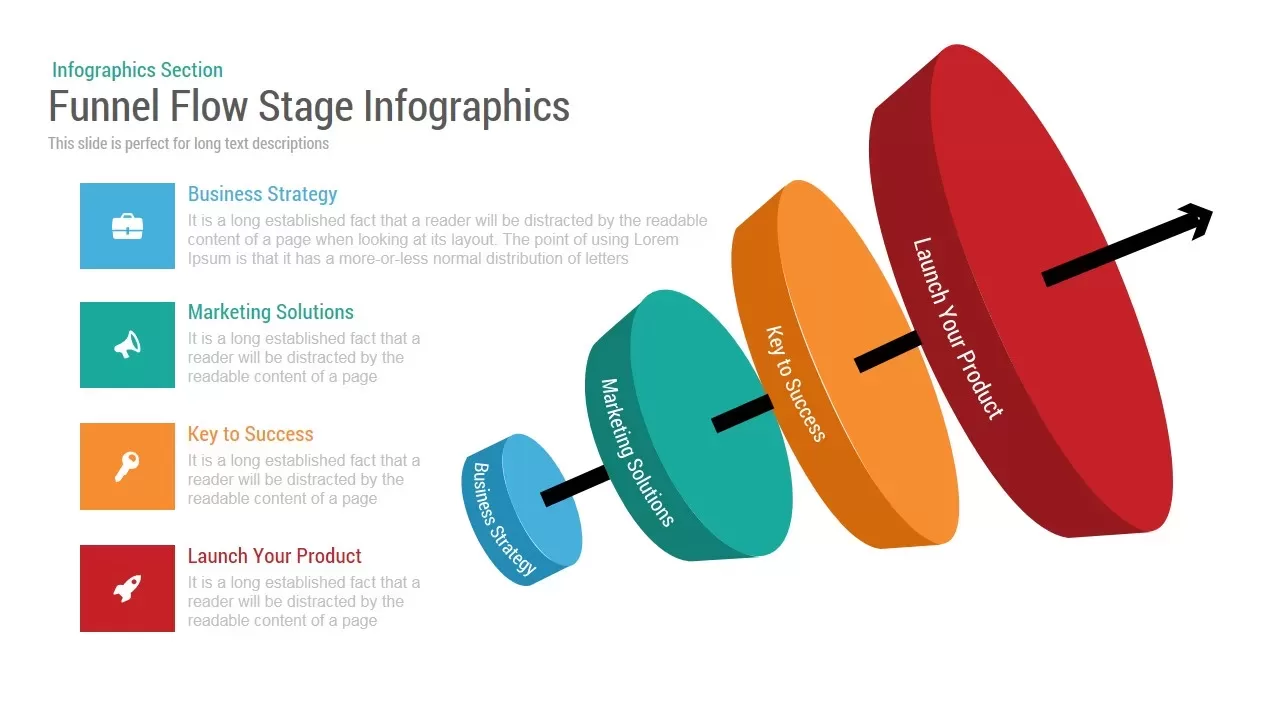
Funnel Flow Stage Infographics template for PowerPoint & Google Slides
Funnel
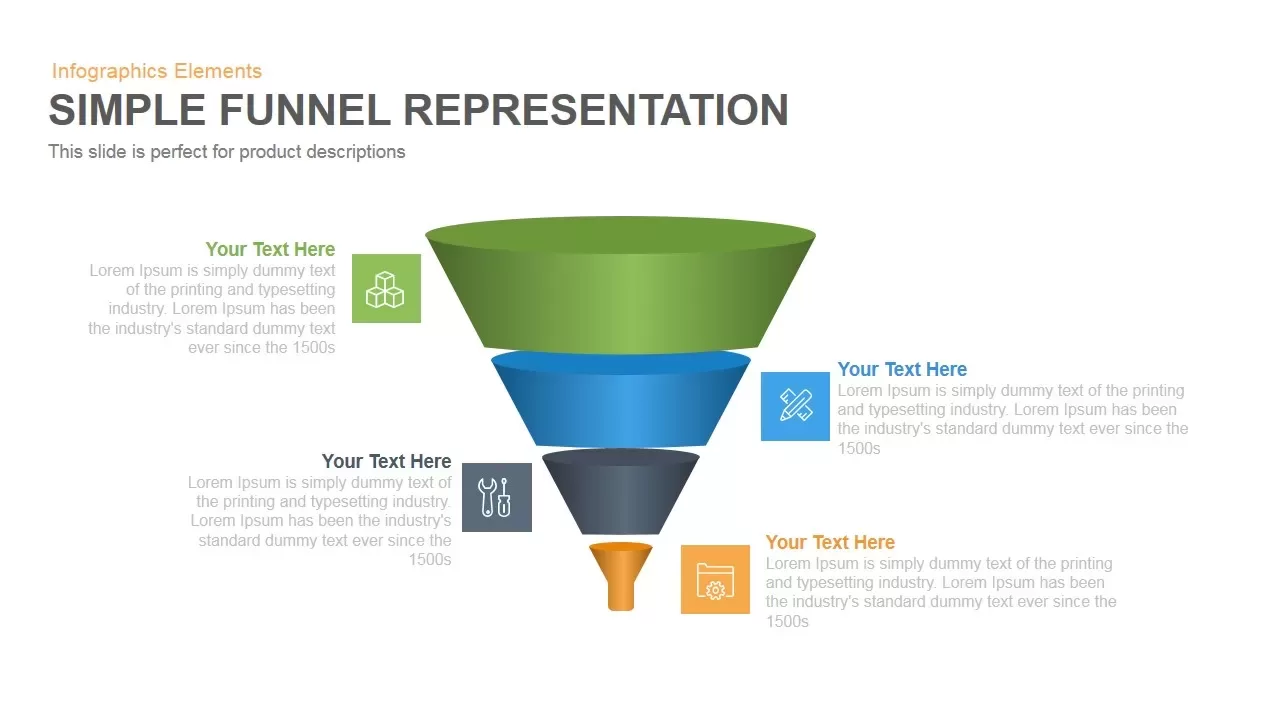
Professional 3D Funnel Infographic Template for PowerPoint & Google Slides
Funnel
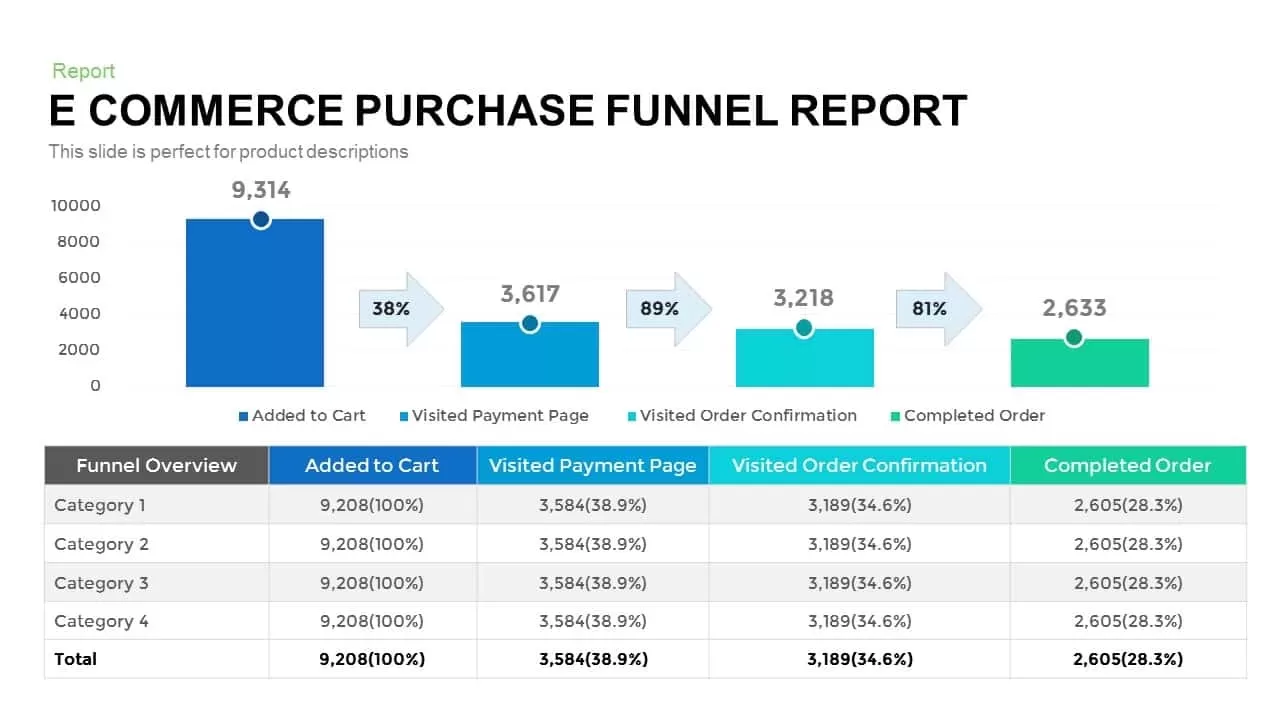
E-commerce Purchase Funnel Report template for PowerPoint & Google Slides
Funnel
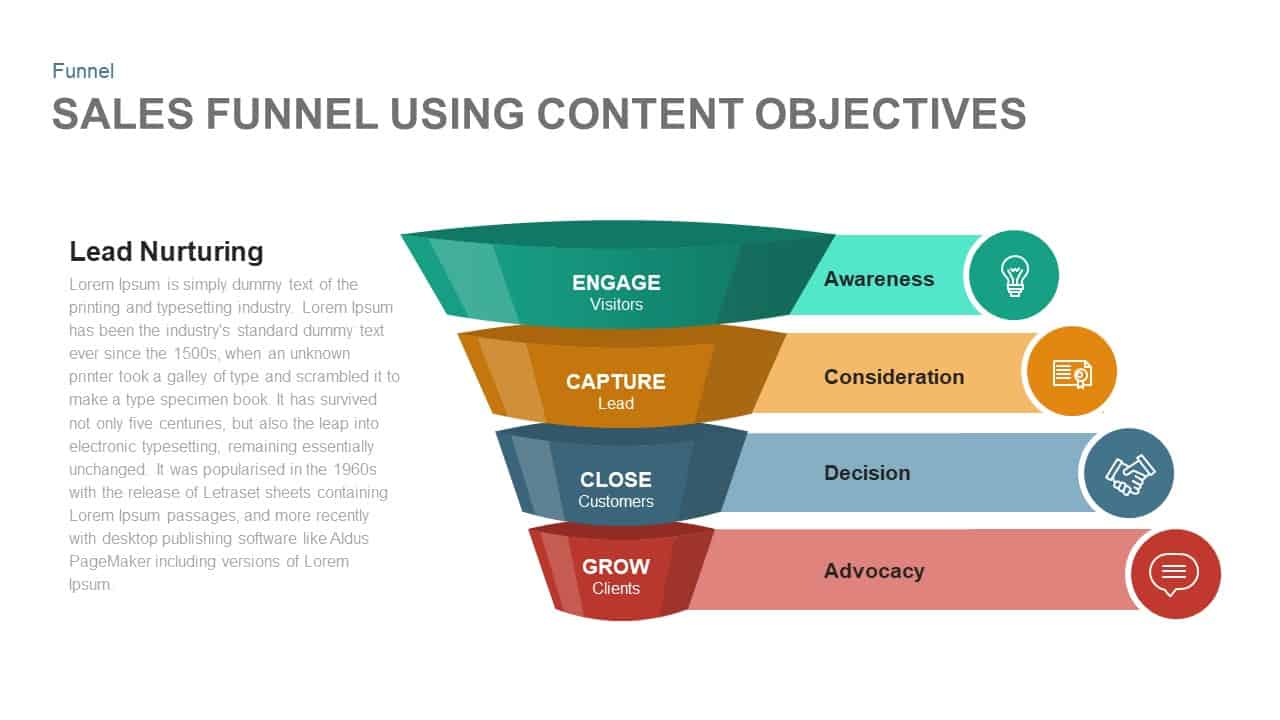
Sales Funnel Using Content Objectives Template for PowerPoint & Google Slides
Funnel
7-Step Sales Funnel Improvement Strategy Template for PowerPoint & Google Slides
Infographics
AIDA Marketing Funnel Model Template for PowerPoint & Google Slides
Marketing
Gradient 5-Stage Funnel Infographic Template for PowerPoint & Google Slides
Funnel
Five-Stage Marketing Funnel Infographic Template for PowerPoint & Google Slides
Funnel
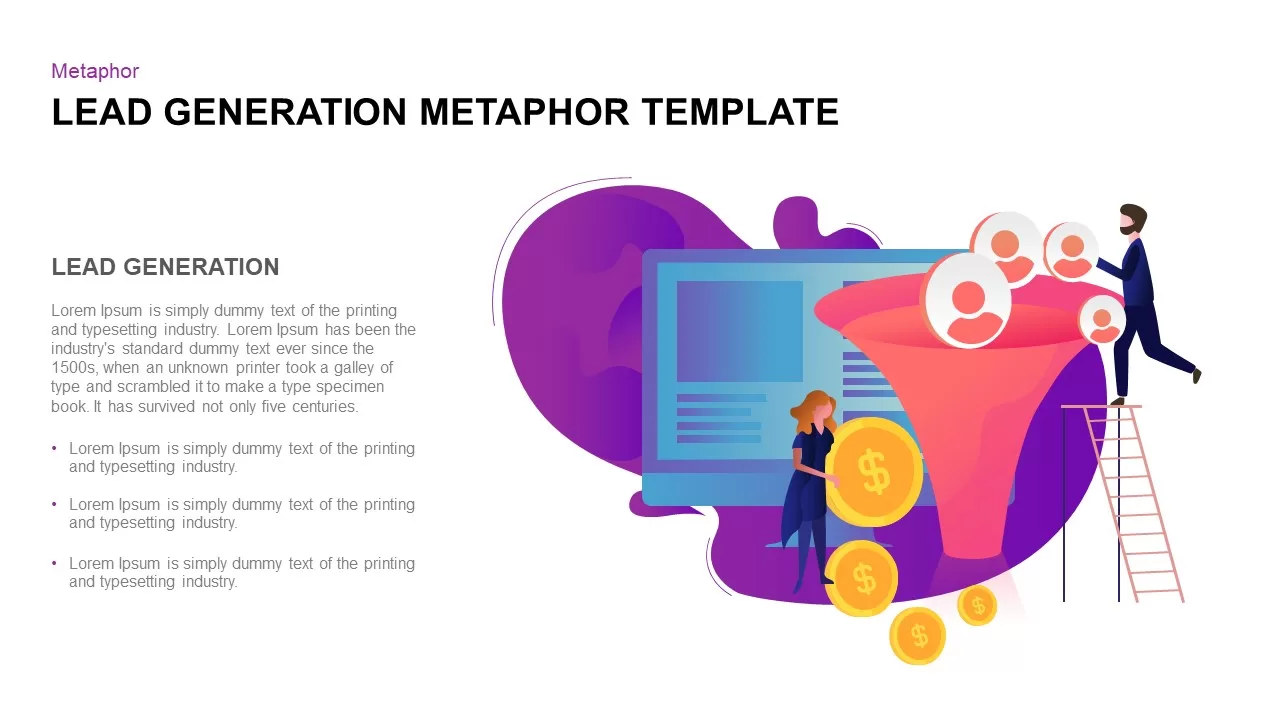
Lead Generation Funnel Metaphor Template for PowerPoint & Google Slides
Marketing Funnel
Four-Step Funnel Infographic Pack Template for PowerPoint & Google Slides
Funnel
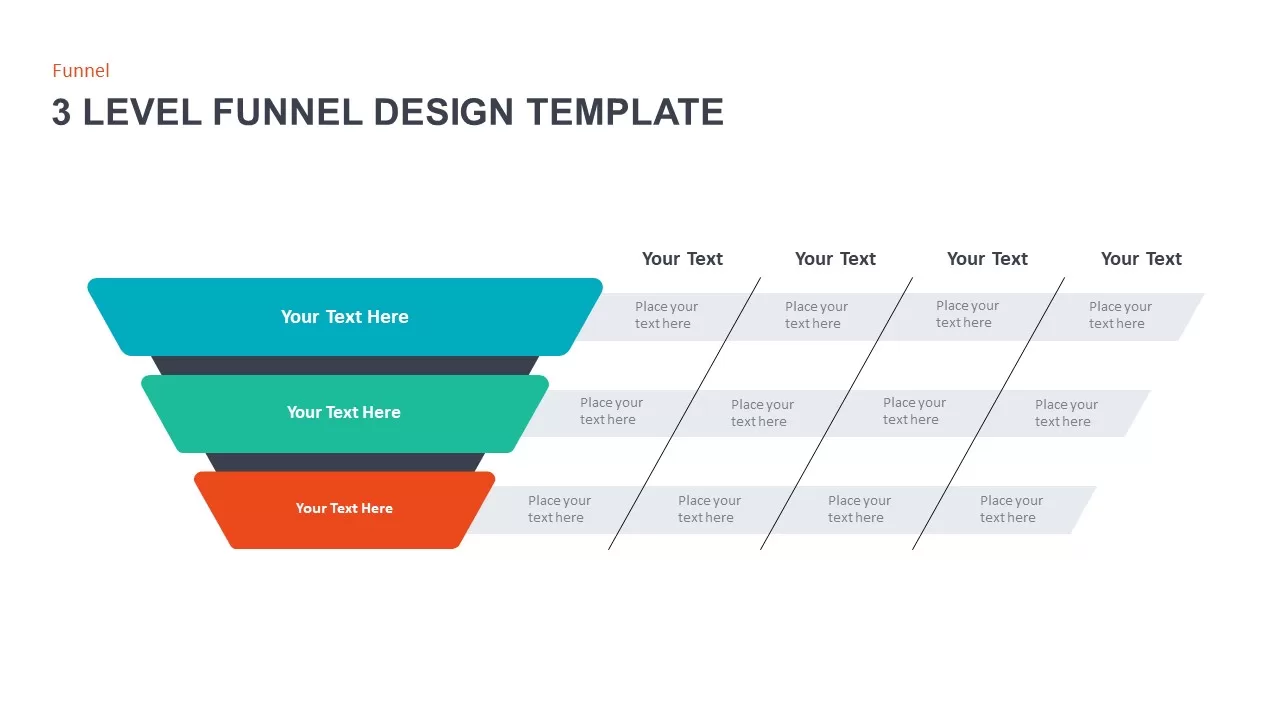
3 Level Funnel Design Visualization Template for PowerPoint & Google Slides
Funnel
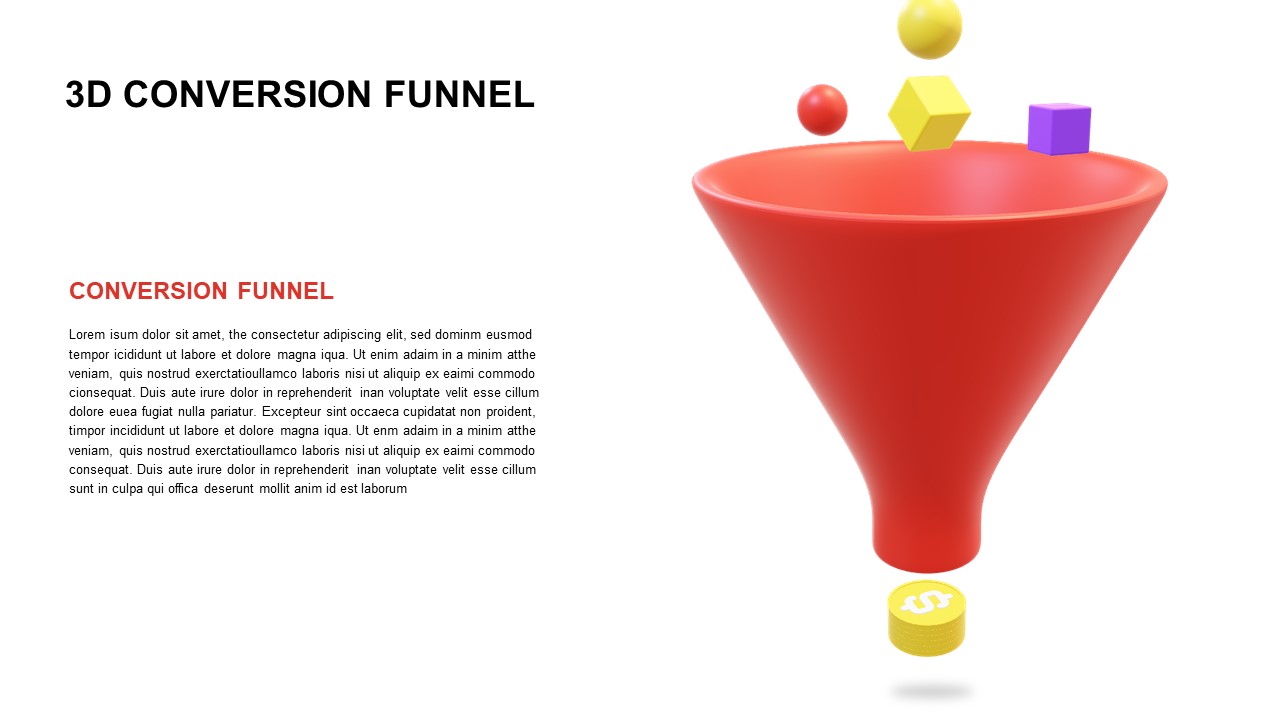
Free 3D Conversion Funnel Overview template for PowerPoint & Google Slides
Funnel
Free
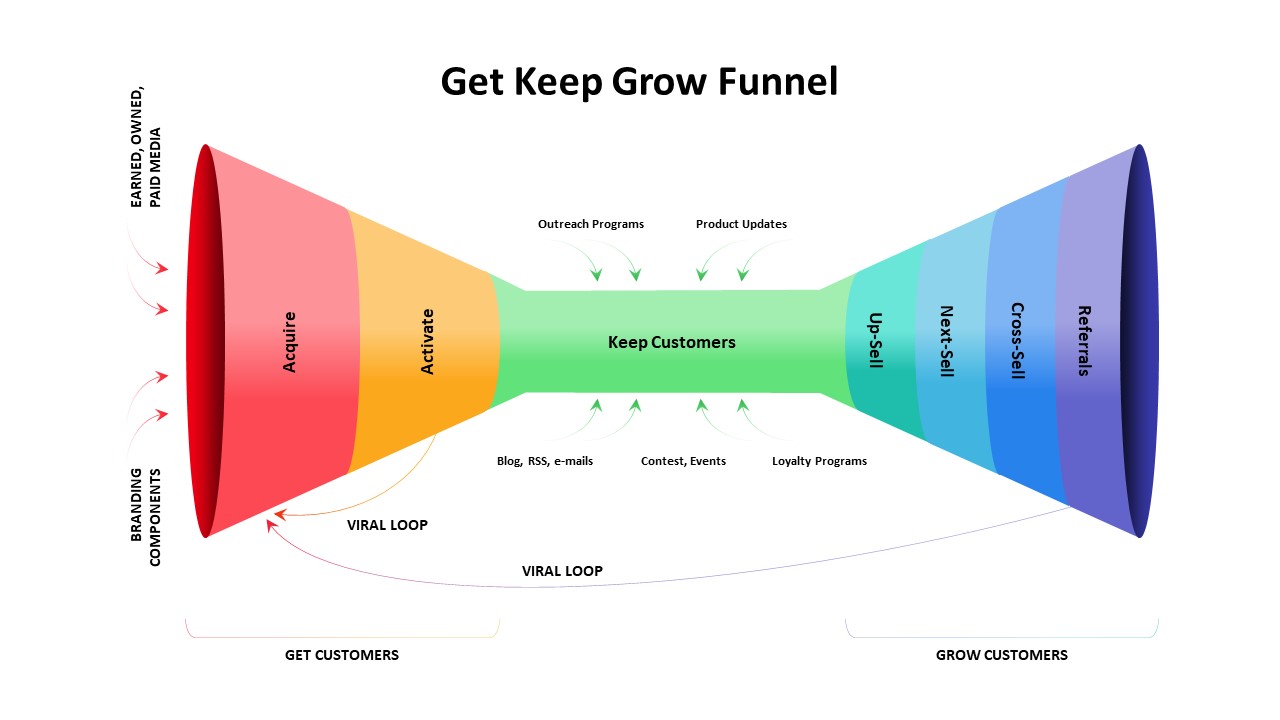
Get Keep Grow Customer Funnel Lifecycle Template for PowerPoint & Google Slides
Funnel
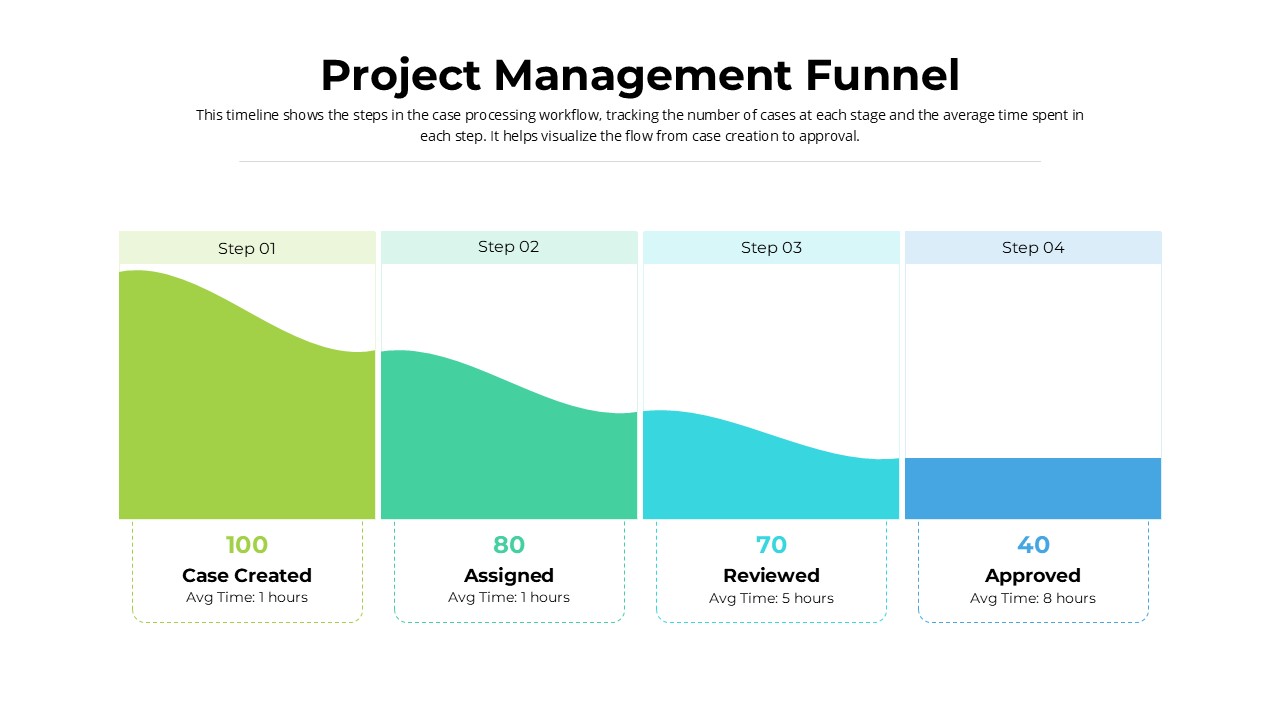
Project Management Funnel template for PowerPoint & Google Slides
Project
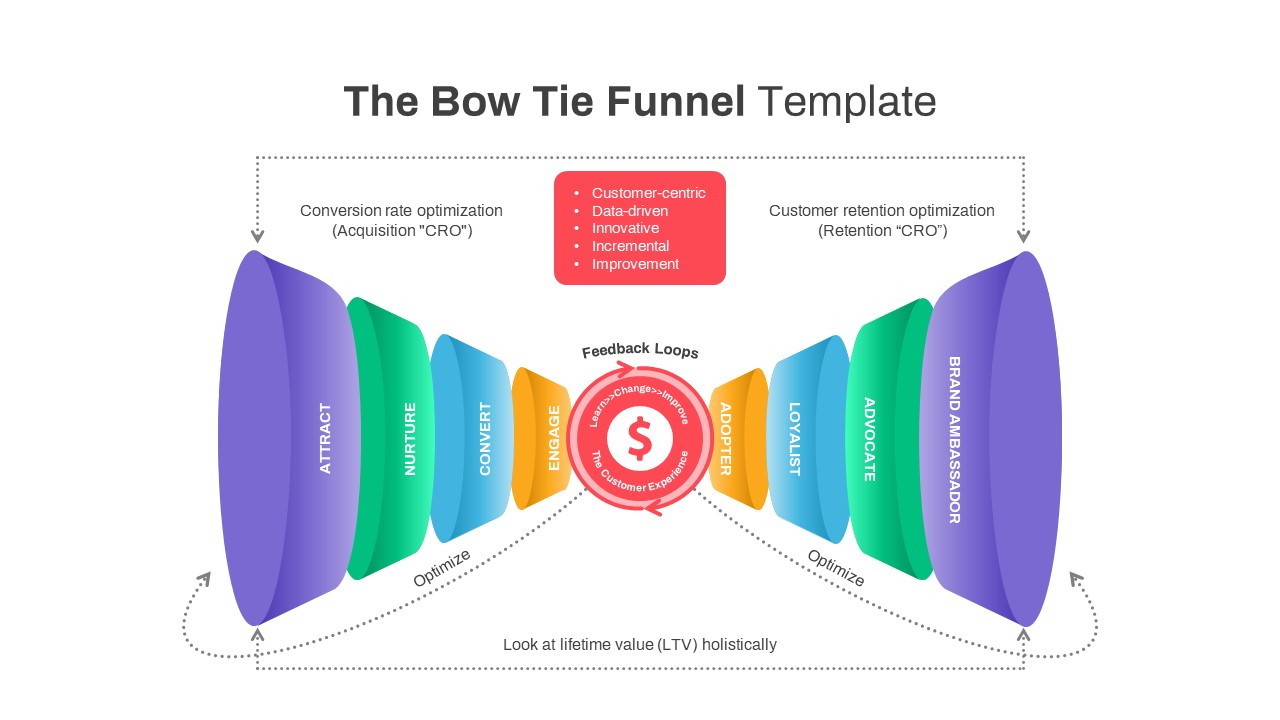
Bow Tie Customer Funnel Presentation Template for PowerPoint & Google Slides
Funnel
Free Multi-Step Funnel Infographic Slide Pack Template for PowerPoint & Google Slides
Funnel
Free
Inverted Sales Funnel Marketing Stages Template for PowerPoint & Google Slides
Marketing Funnel
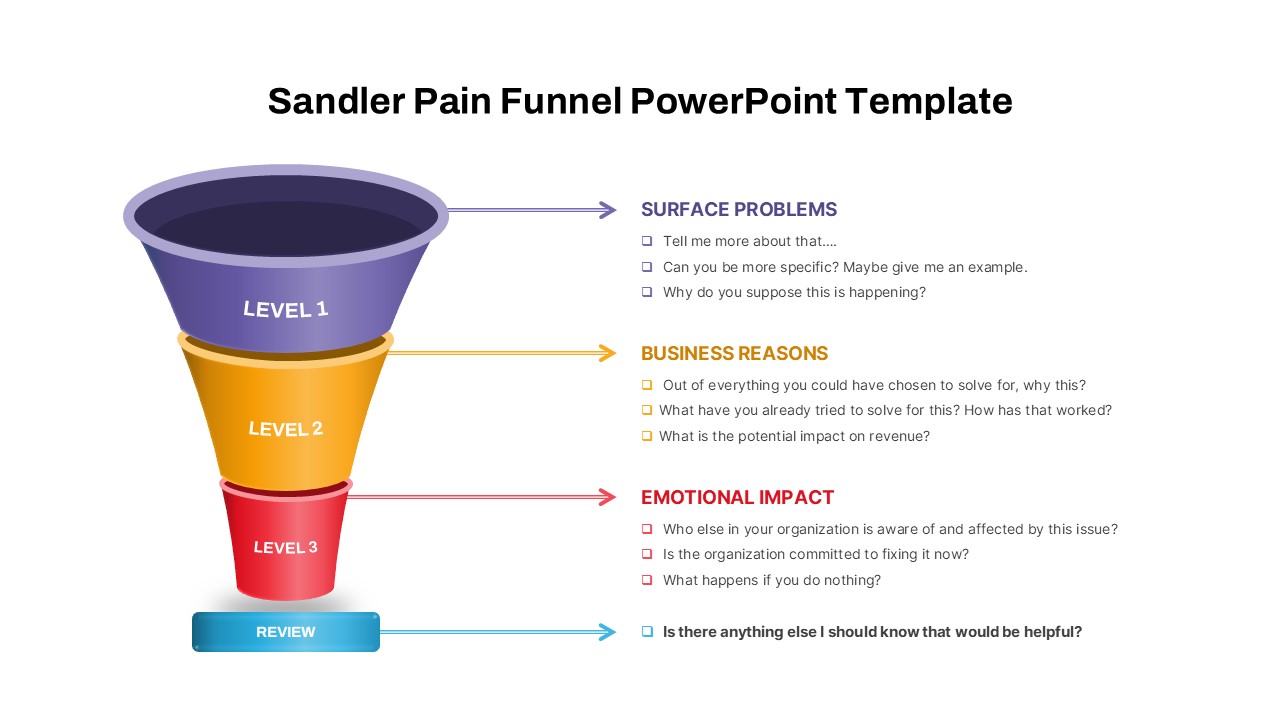
Sandler Pain Funnel Sales Qualification Template for PowerPoint & Google Slides
Funnel
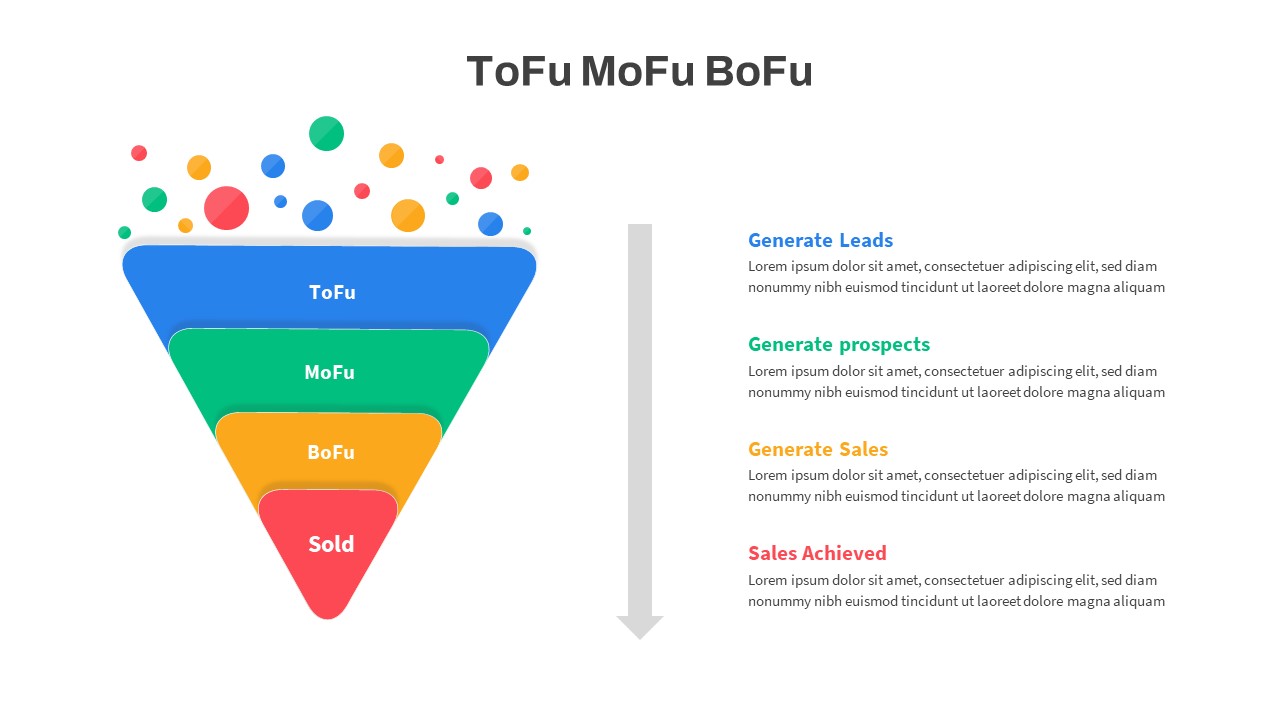
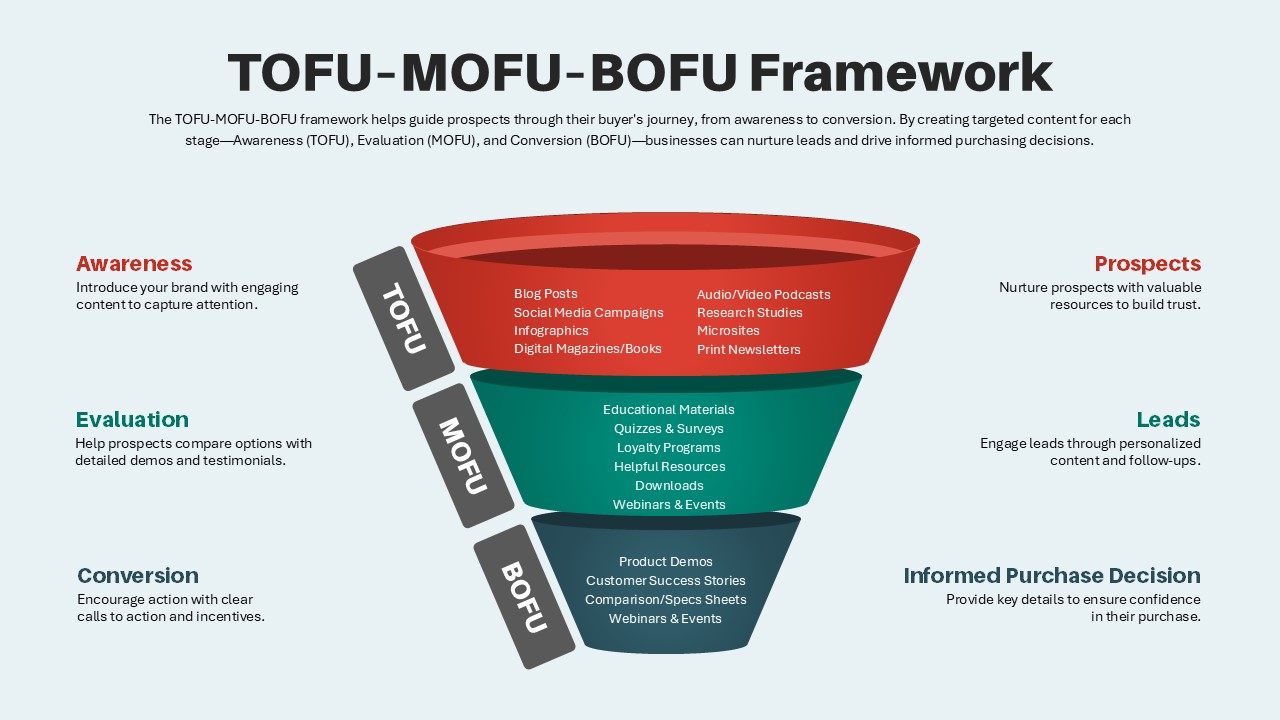
TOFU-MOFU-BOFU Marketing Funnel Template for PowerPoint & Google Slides
Funnel
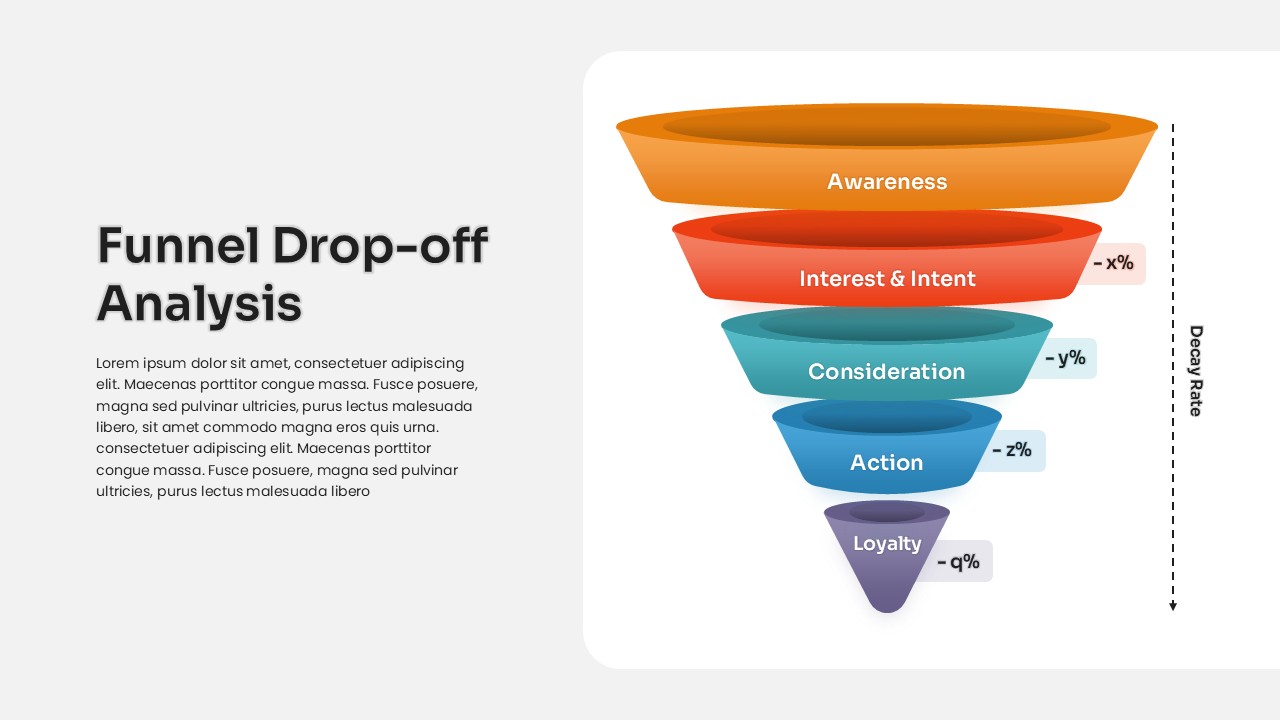
Funnel Drop-off Analysis template for PowerPoint & Google Slides
Business
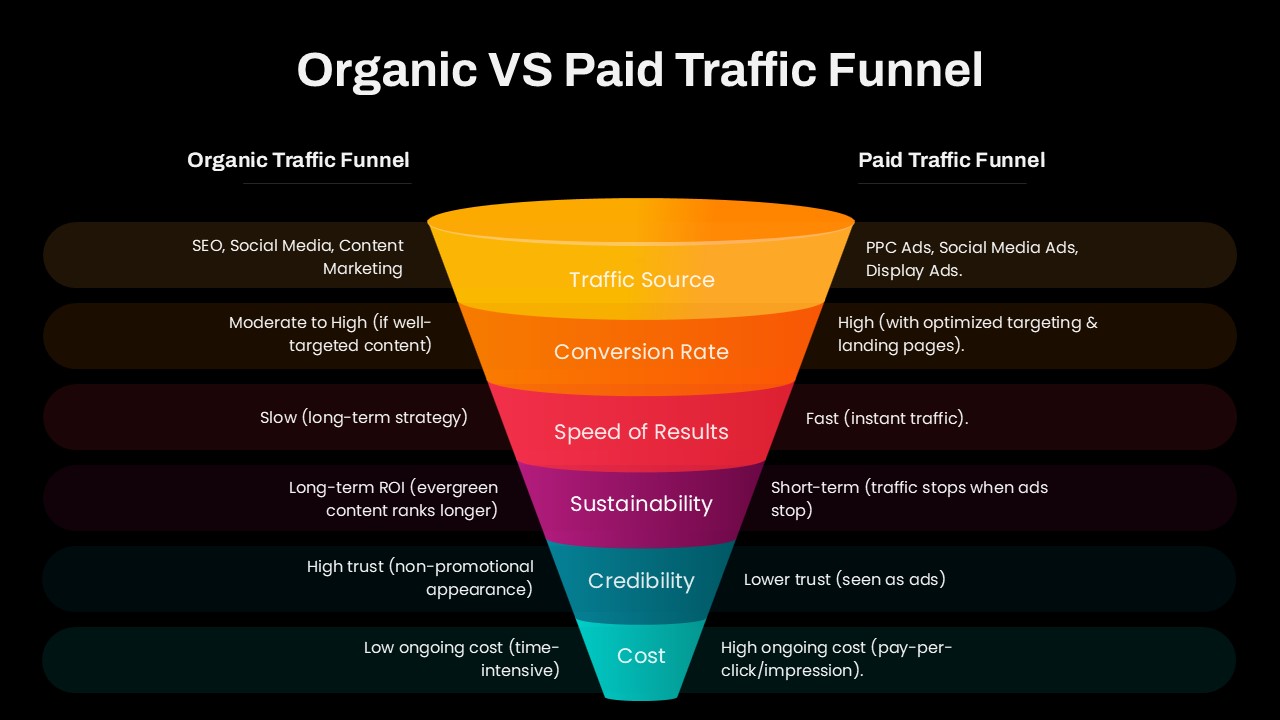
Organic vs Paid Traffic Funnel Template for PowerPoint & Google Slides
Marketing Funnel

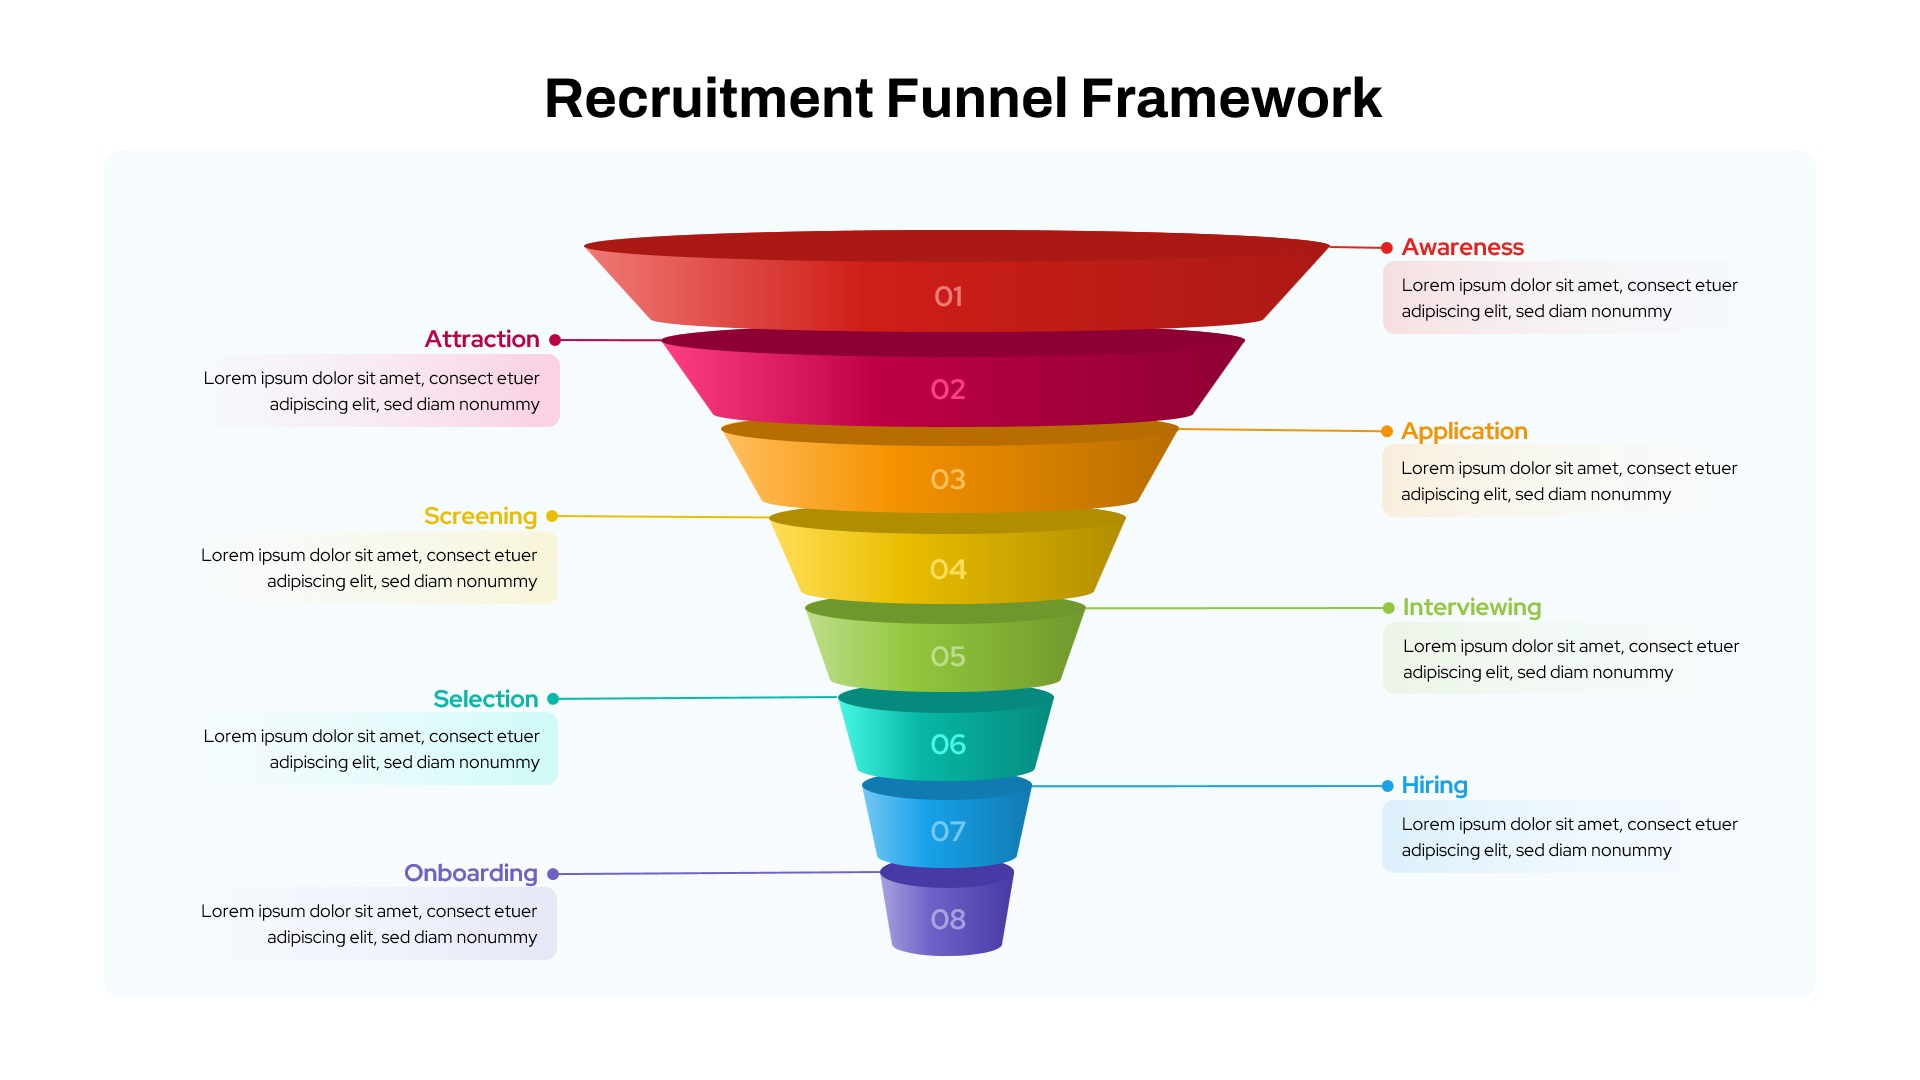
Recruitment Funnel Framework template for PowerPoint & Google Slides
Recruitment
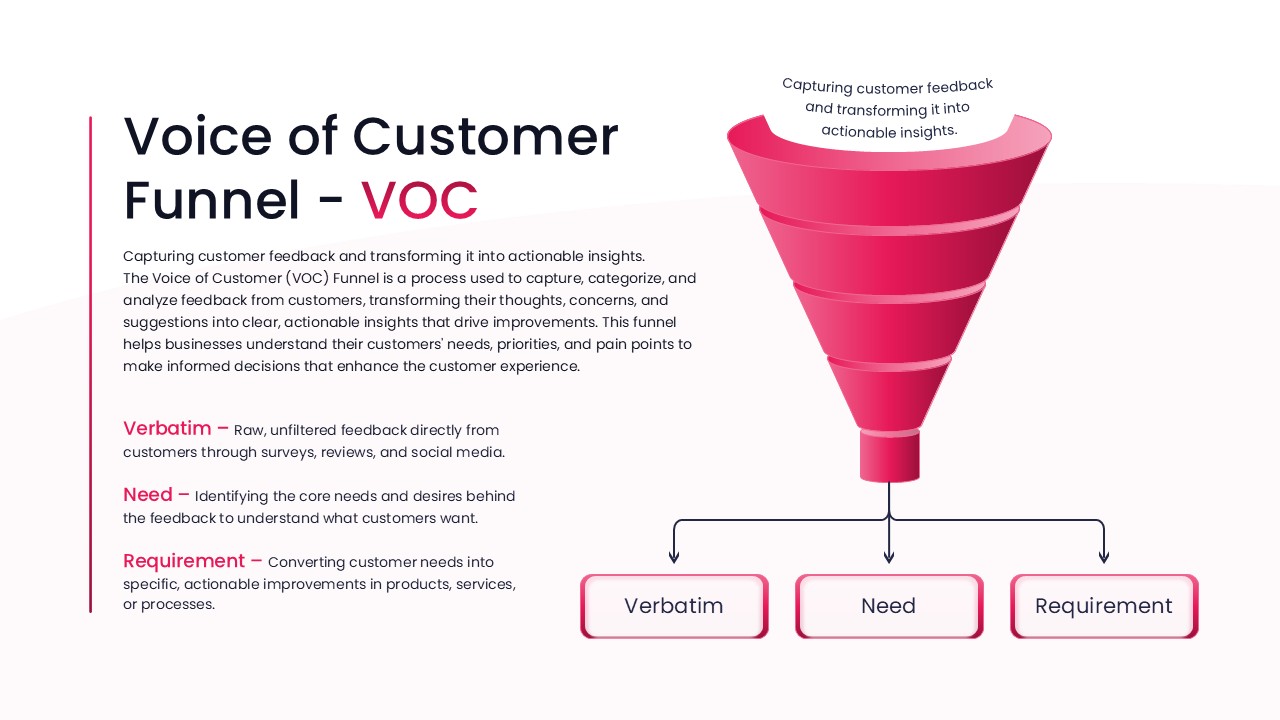
Voice of Customer Funnel (VOC) template for PowerPoint & Google Slides
Marketing
Pirate Metrics AARRR Funnel Framework Template for PowerPoint & Google Slides
Funnel
Funnel and Flywheel Thinking Comparison template for PowerPoint & Google Slides
Infographics
Project Management Funnel Template for PowerPoint & Google Slides
Funnel
Hiring Funnel Timeline with Six Phases Template for PowerPoint & Google Slides
Recruitment
Four-Stage Marketing Funnel Template for PowerPoint & Google Slides
Marketing Funnel
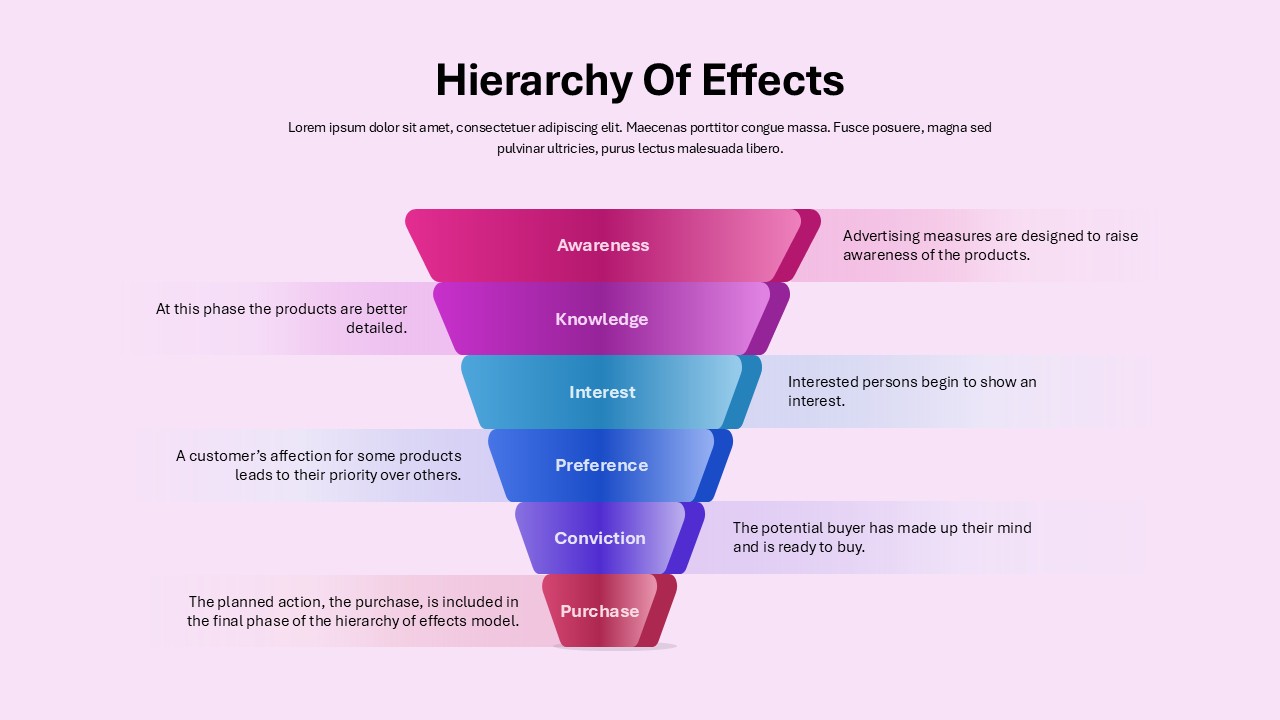
Marketing Funnel Hierarchy of Effects Template for PowerPoint & Google Slides
Marketing Funnel
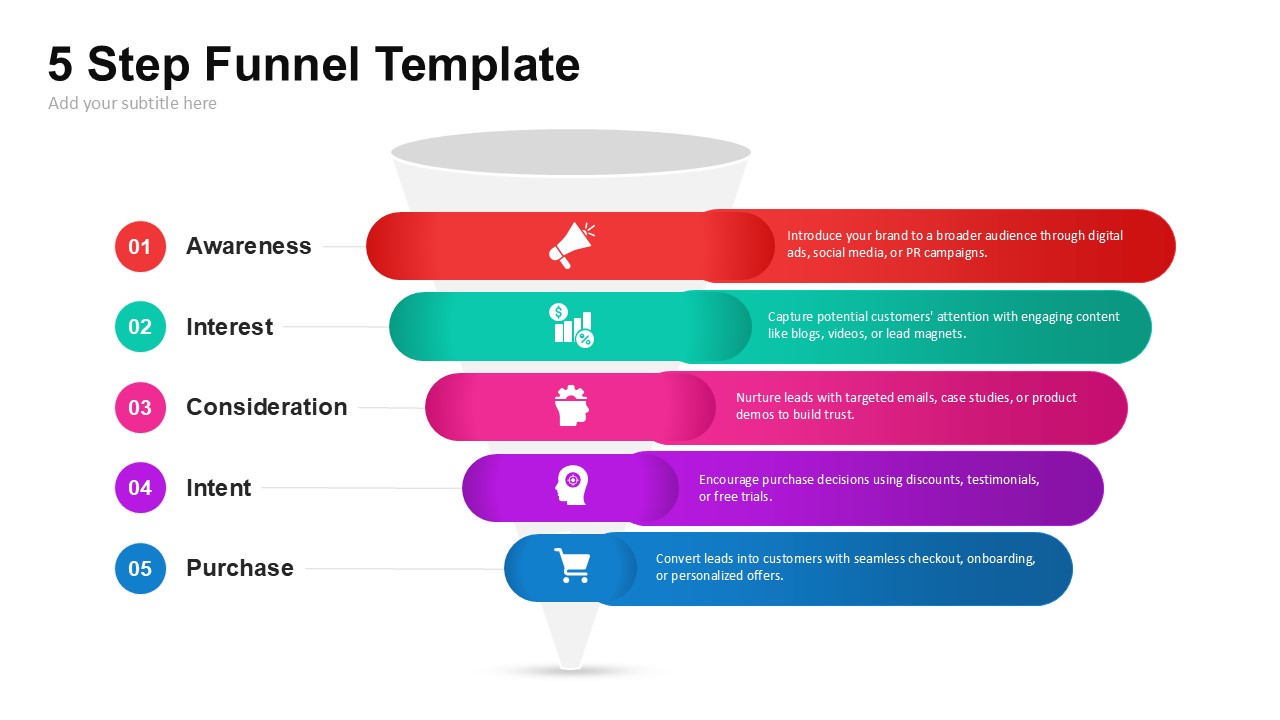
5-Step Marketing Funnel Template for PowerPoint & Google Slides
Marketing Funnel
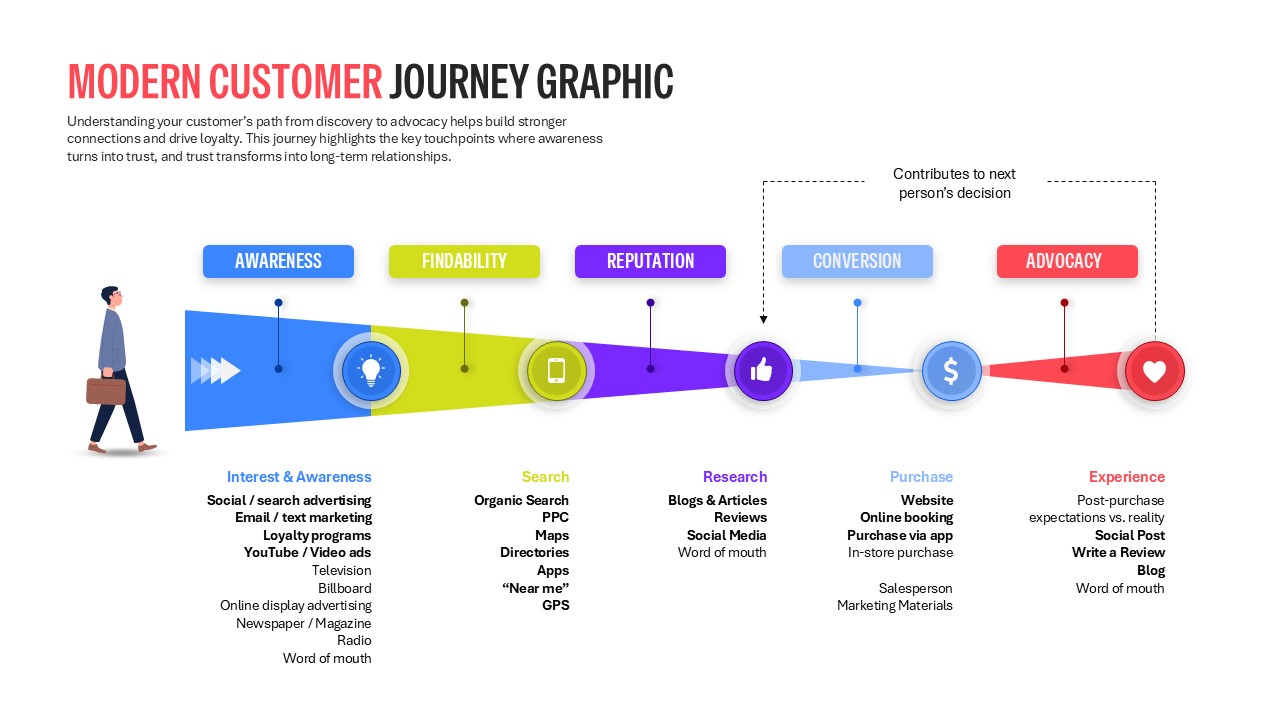
Modern Customer Journey Graphic Funnel Template for PowerPoint & Google Slides
Customer Journey
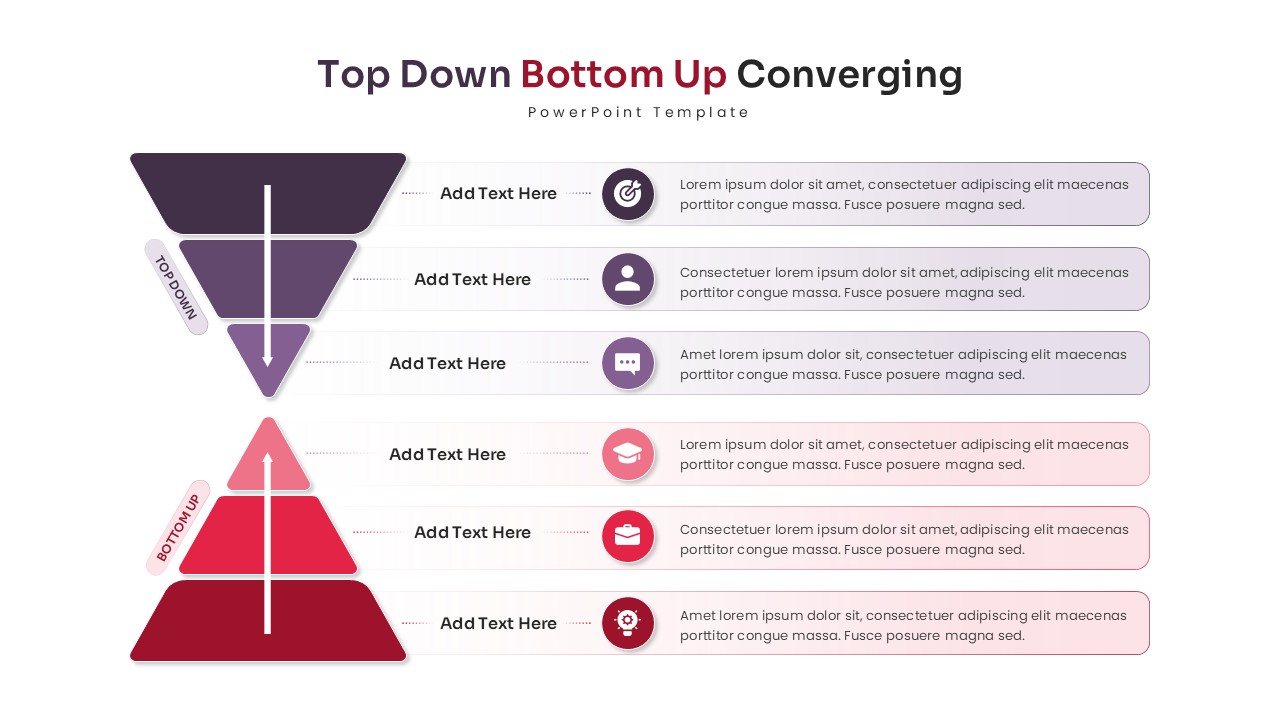
Top Down Bottom Up Converging Funnel for PowerPoint & Google Slides
Funnel
Gear Process Diagram PowerPoint Template for PowerPoint & Google Slides
Process
Six-Stage Zig-Zag Process Flow Diagram Template for PowerPoint & Google Slides
Process
Circular Improvement Process Diagram Template for PowerPoint & Google Slides
Process
Two-Path Idea-to-Goal Process Diagram Template for PowerPoint & Google Slides
Infographics
Minimal Process Flow Diagram Infographic Template for PowerPoint & Google Slides
Process
Project Stage Gate Process Diagram Template for PowerPoint & Google Slides
Process
Business Process Reengineering Diagram Template for PowerPoint & Google Slides
Circular
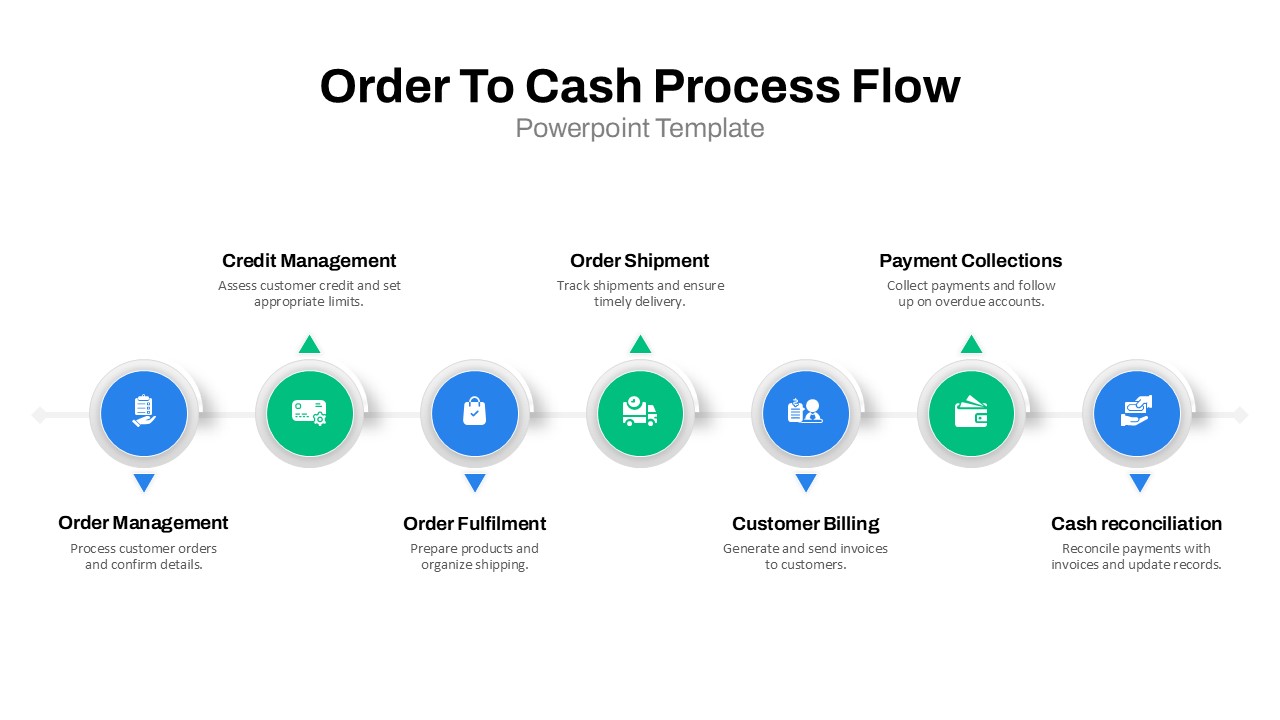
Order to Cash Process Flow Diagram Template for PowerPoint & Google Slides
Process
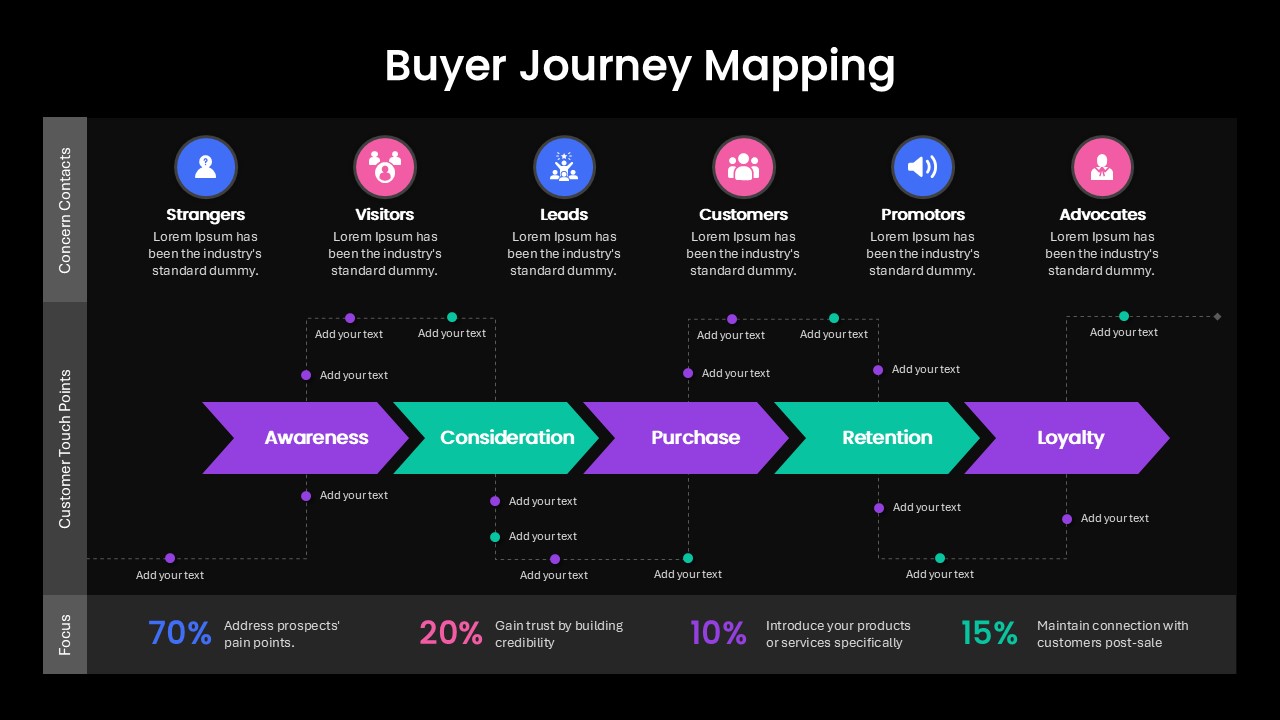
Buyer Journey Mapping Process Diagram Template for PowerPoint & Google Slides
Process