Flow Chart Diagram Template for PowerPoint & Google Slides

Description
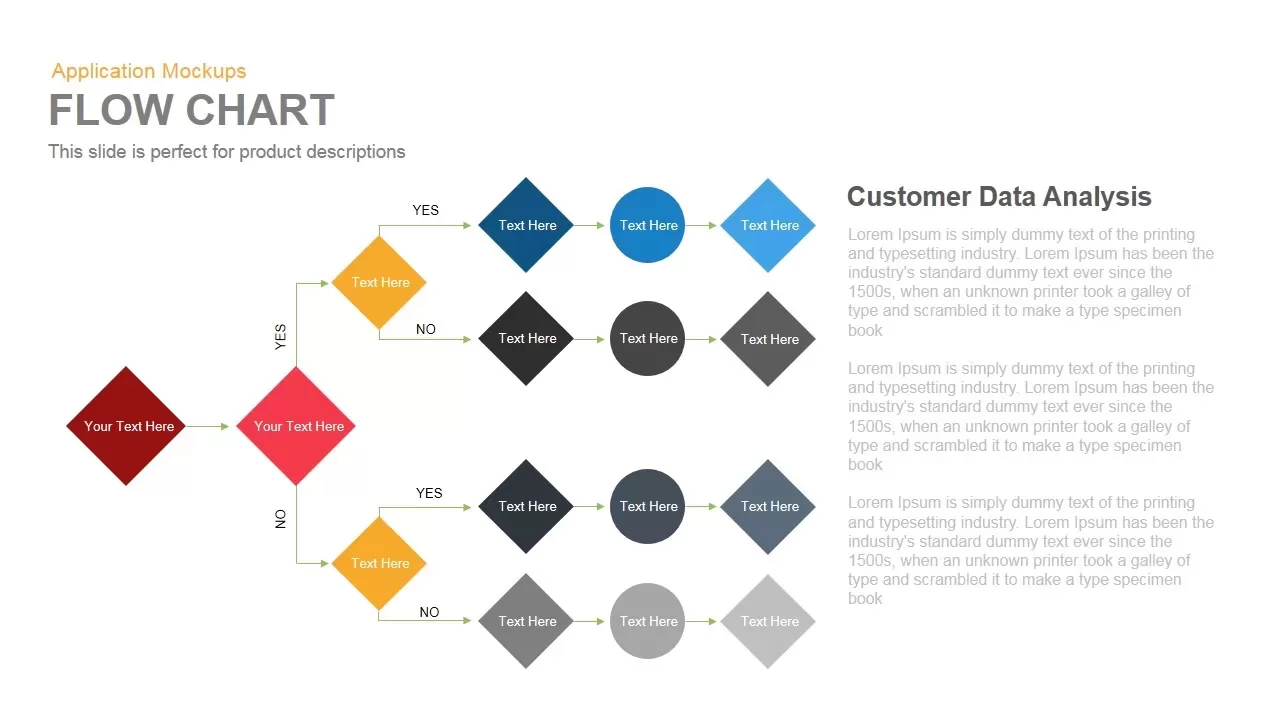
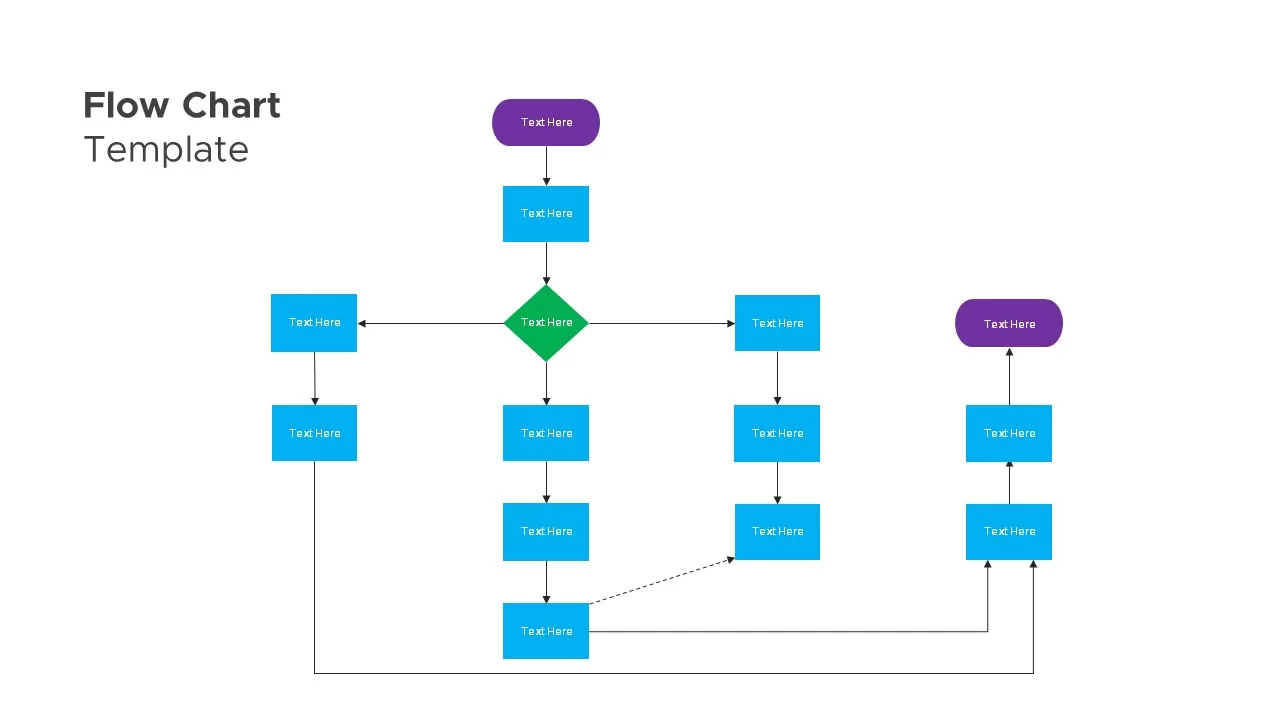
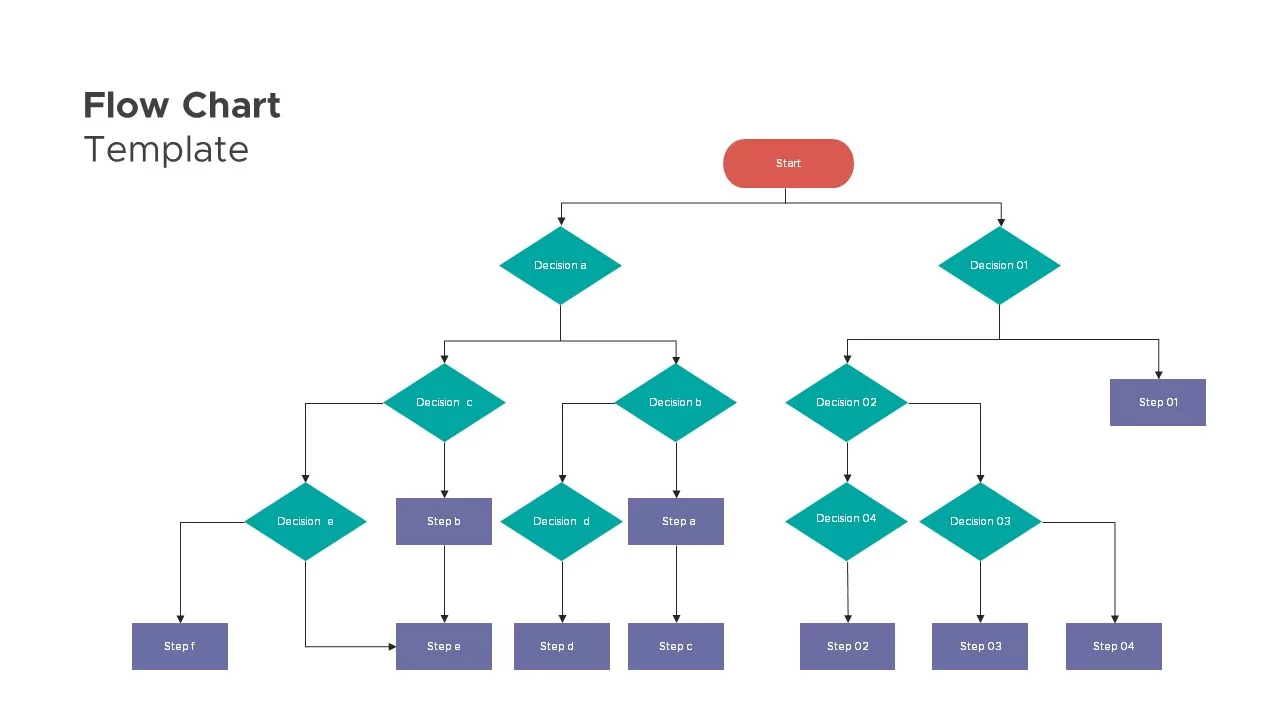
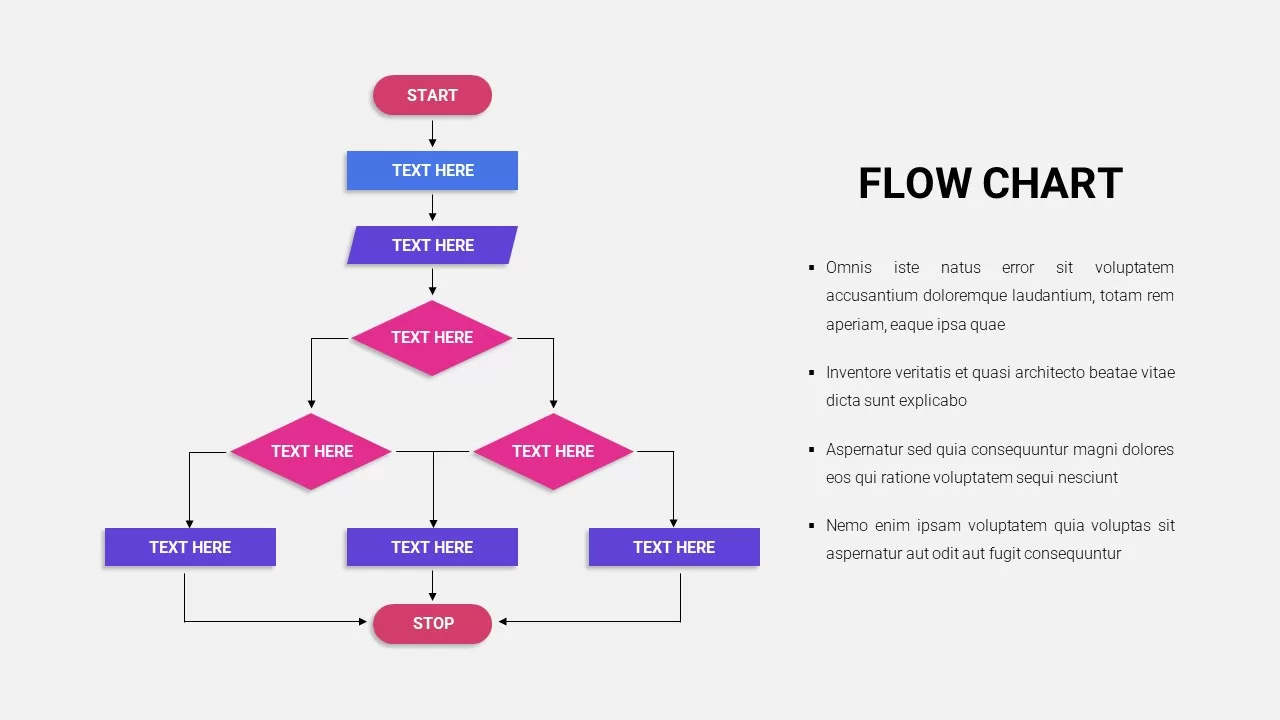
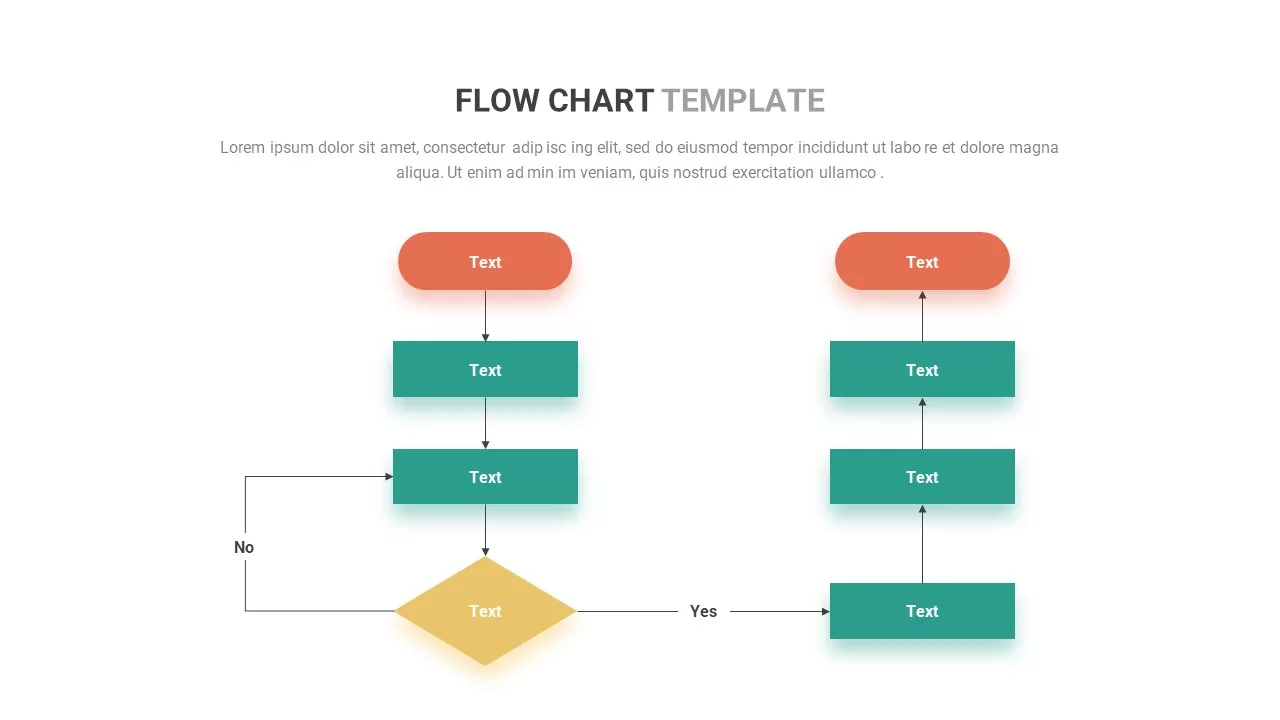
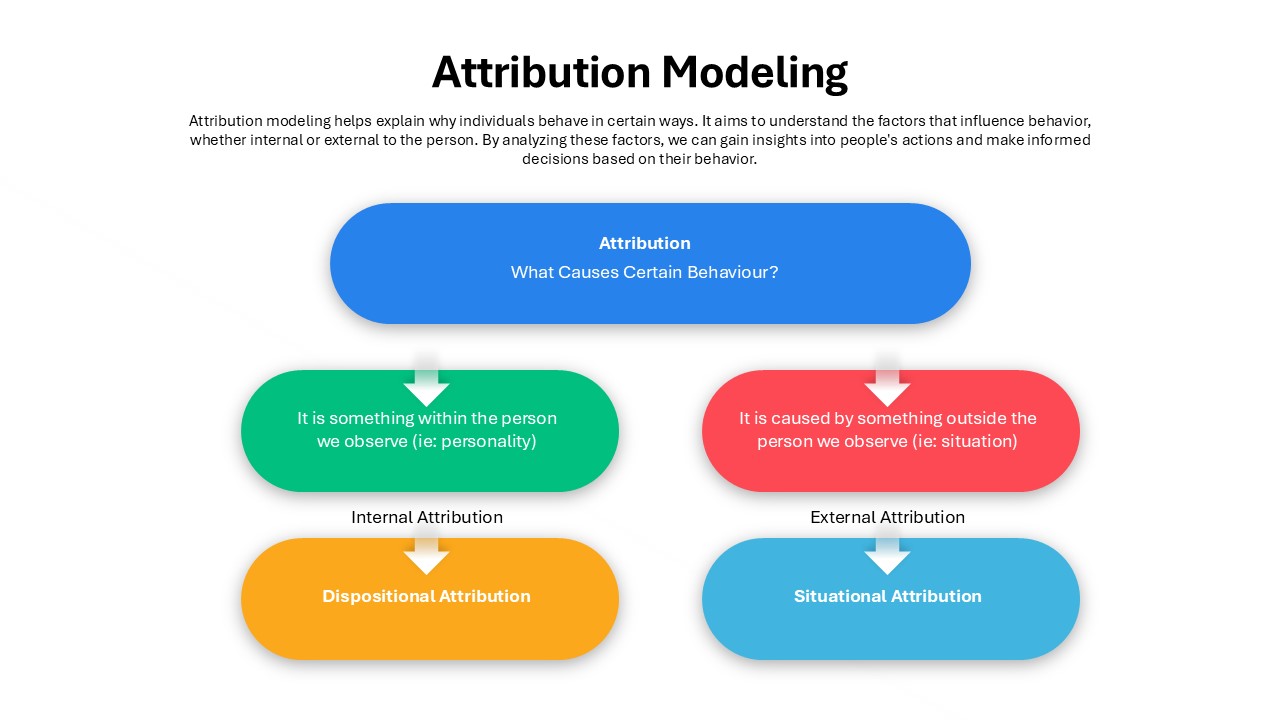
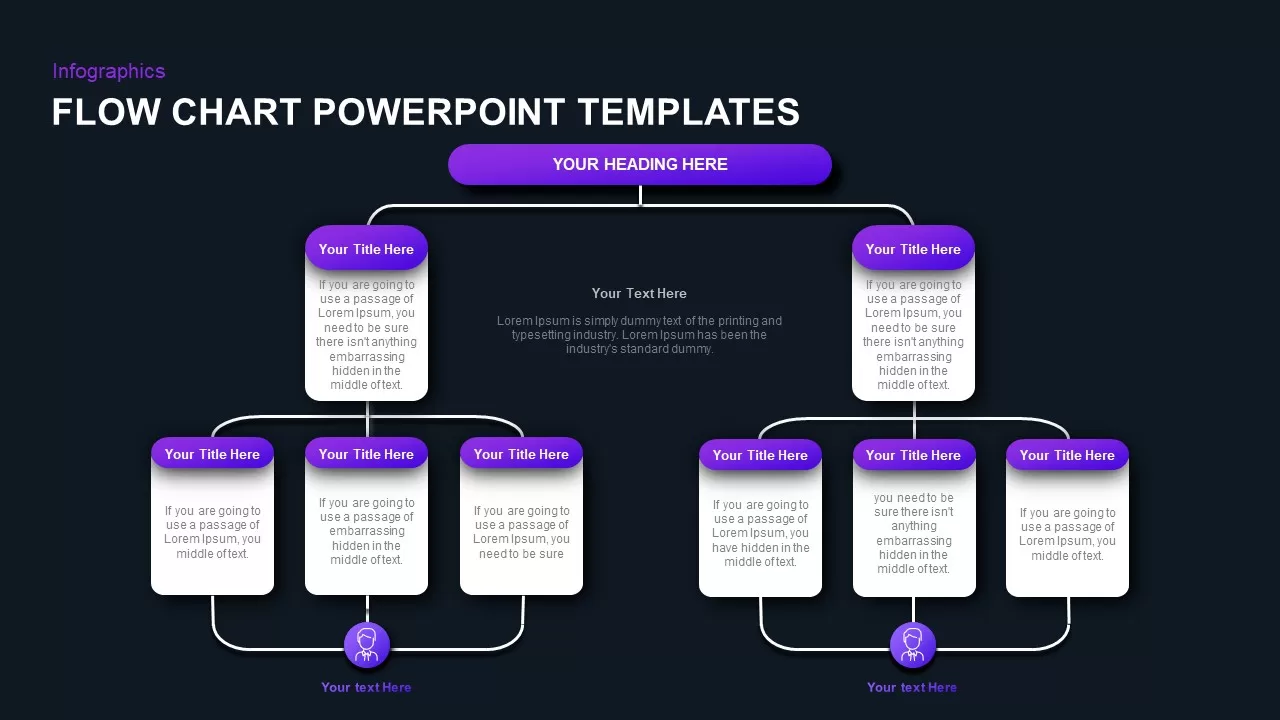
Illuminate complex organizational structures and multi-level processes with this hierarchical flow chart infographic slide. A bold purple gradient header pill anchors the diagram at the top, branching into two second-tier nodes before cascading down to six bottom-level modules. Each node features a crisp icon placeholder and a clear text box for succinct stage titles or descriptions. Smooth vector-based connectors trace the flow between levels, guiding viewers through decision points without clutter. Set against a clean white backdrop, the flat design aesthetic balances modern style with professional polish, ensuring maximal legibility on projectors and high-resolution screens alike.
Built for both PowerPoint and Google Slides, the slide leverages master layouts and theme controls to streamline bulk edits across your deck. Swap out icons, relabel text fields, and adjust segment colors with a single click to align with any brand palette. All elements are constructed from vector shapes, enabling lossless scaling and precise repositioning. Logical grouping of layers simplifies the addition of entrance and exit animations, allowing you to reveal each node in sequence. The editable connectors adjust automatically when you move modules, saving time on manual adjustments and ensuring consistent alignment.
Ideal for mapping organizational charts, project workflows, decision trees, or customer journey maps, this hierarchical flow chart delivers clarity to complex frameworks. Consultants, project managers, and team leaders can illustrate branching processes, escalate decision points, or outline approval paths with ease. Duplicate, reorganize, or collapse branches to tailor the diagram for five, seven, or more levels, supporting dynamic content updates and iterative planning sessions. Perfect for boardroom presentations, training workshops, or status updates, the slide ensures your audiences follow each step logically. With this versatile asset, you can transform abstract concepts into engaging, intuitive visuals that foster alignment and drive action.
Who is it for
Project managers, consultants, and business analysts will leverage this infographic slide to present process overviews, implementation roadmaps, and decision frameworks. Trainers and educators can also use it to break down multi-stage lessons or research methodologies.
Other Uses
Repurpose this layout for quarterly milestones, product development sprints, or marketing funnels by relabeling segments and swapping icons. Adapt the central hub to feature your core objective or KPI, and use the surrounding steps to illustrate supporting initiatives, risk factors, or stakeholder roles.
Login to download this file

Item ID
SB01978
Related Templates

Vertical Split Flow Chart Diagram Template for PowerPoint & Google Slides
Flow Charts
Flow Chart Diagram template for PowerPoint & Google Slides
Flow Charts
Free Circular Multi-Step Flow Chart Diagram Template for PowerPoint & Google Slides
Flow Charts
Free
Flow Chart template for PowerPoint & Google Slides
Flow Charts
Flow Chart Template for PowerPoint & Google Slides
Flow Charts
Flow Chart Template for PowerPoint & Google Slides
Flow Charts
Flow Chart Decision Tree Template for PowerPoint & Google Slides
Flow Charts
Flow Chart Template for PowerPoint & Google Slides
Flow Charts
Flow Chart template for PowerPoint & Google Slides
Flow Charts
Flow Chart template for PowerPoint & Google Slides
Flow Charts
Comprehensive Hiring Process Flow Chart Template for PowerPoint & Google Slides
Flow Charts
Cross Functional Swimlane Flow Chart Template for PowerPoint & Google Slides
Flow Charts
Wastewater Treatment Process Flow Chart Template for PowerPoint & Google Slides
Flow Charts
Animated Process Flow Chart Template for PowerPoint & Google Slides
Infographics
Attribution Modeling Flow Chart Template for PowerPoint & Google Slides
Flow Charts
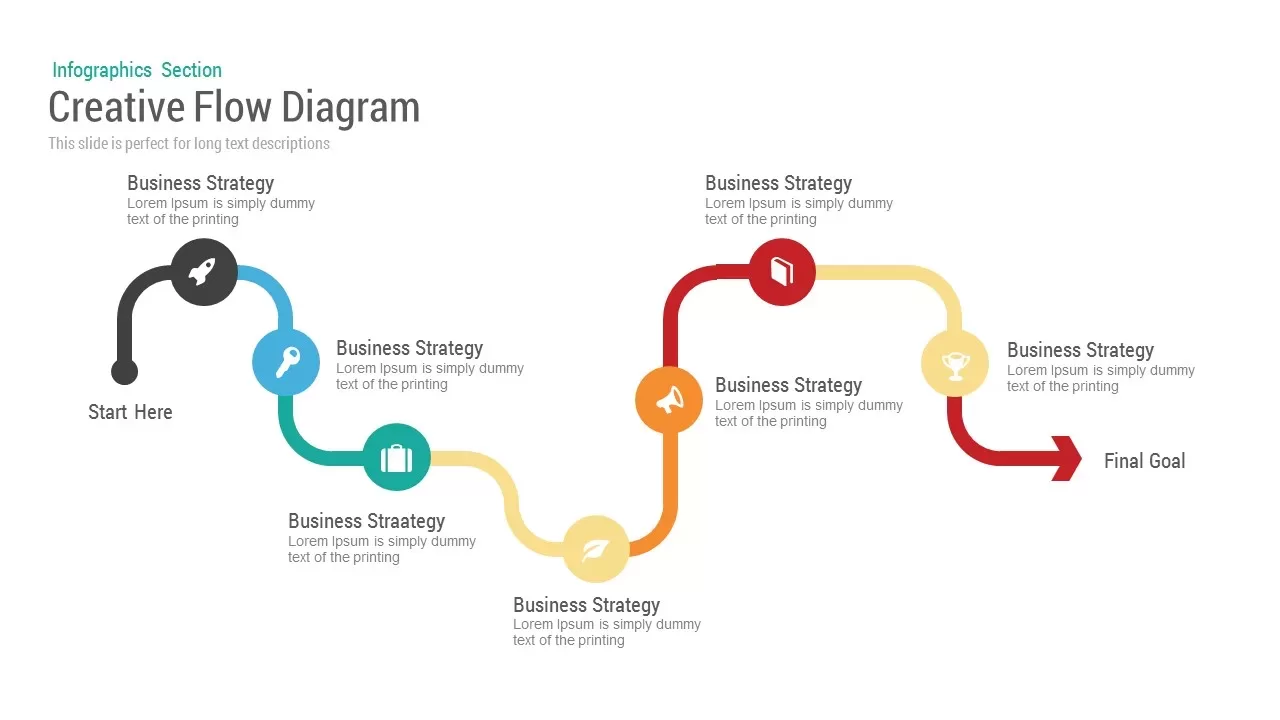
Creative flow diagram template for PowerPoint & Google Slides
Process
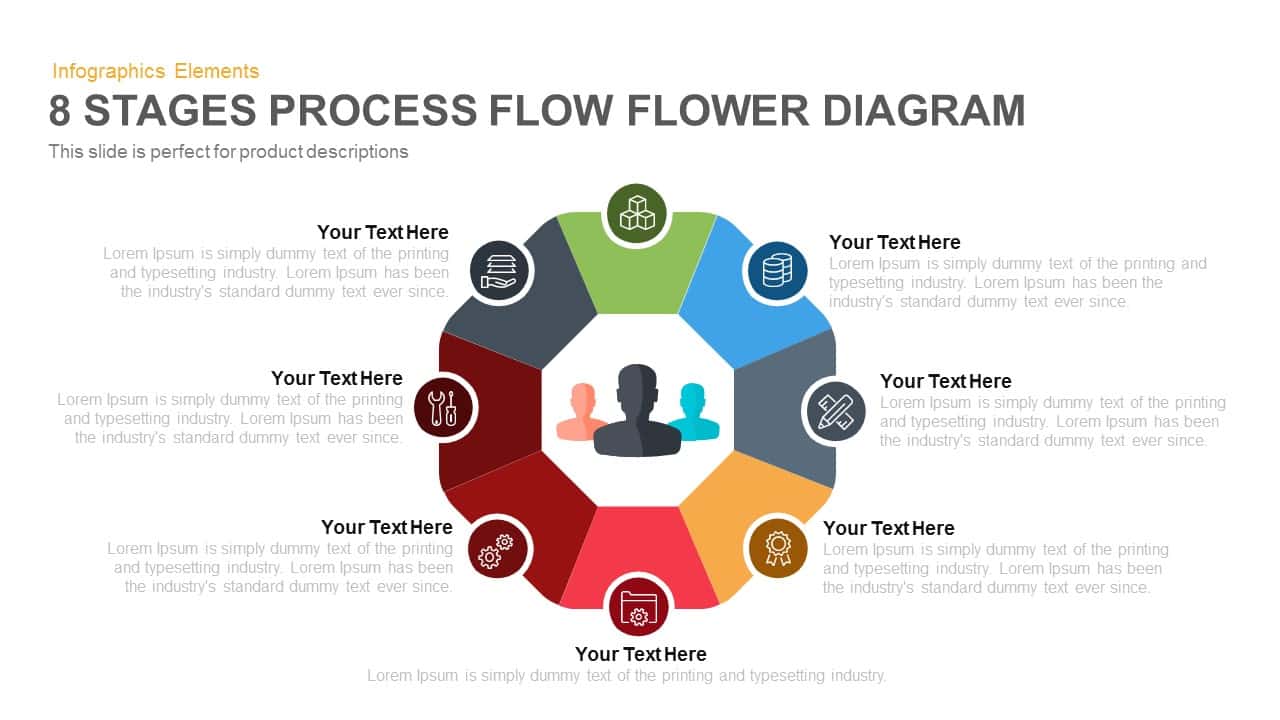
8-Stage Process Flow Flower Diagram Template for PowerPoint & Google Slides
Infographics
Circular Flow Diagram Template for PowerPoint & Google Slides
Infographics
4 Section Pipe Diagram Process Flow Template for PowerPoint & Google Slides
Process
Dynamic Shield Process Flow Diagram template for PowerPoint & Google Slides
Process
Six Hexagon Stages Process Flow Diagram Template for PowerPoint & Google Slides
Process
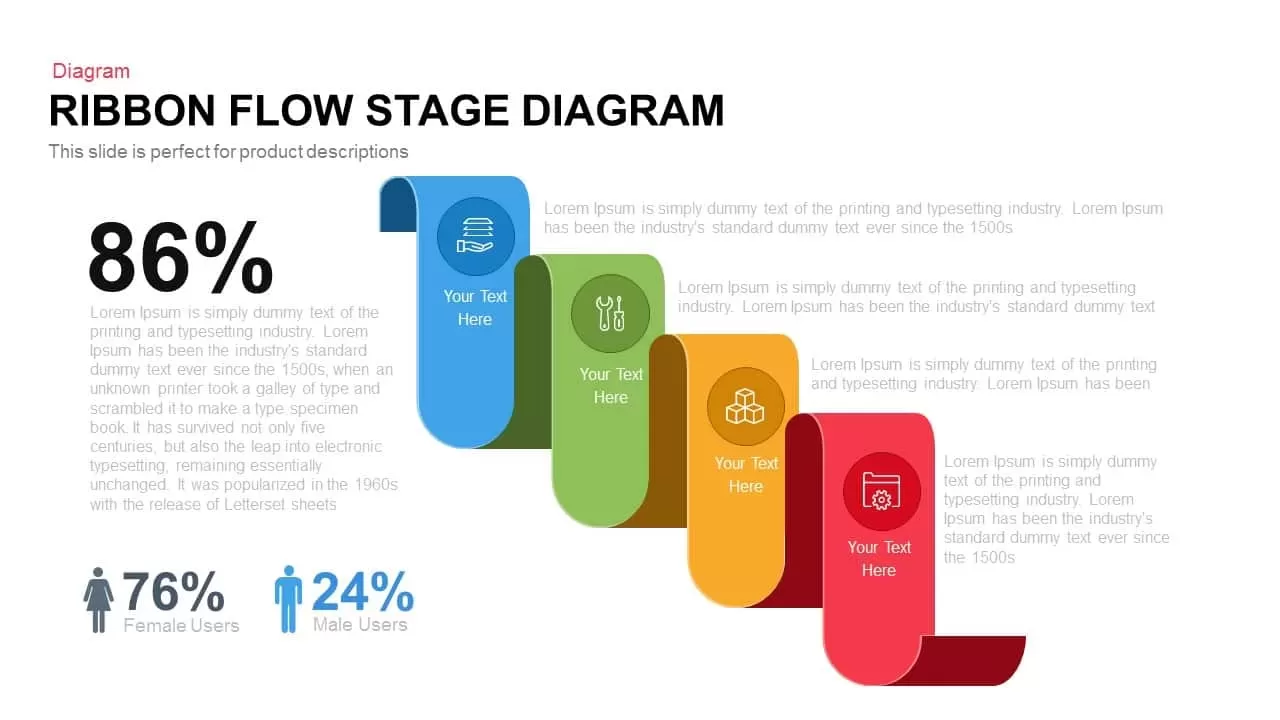
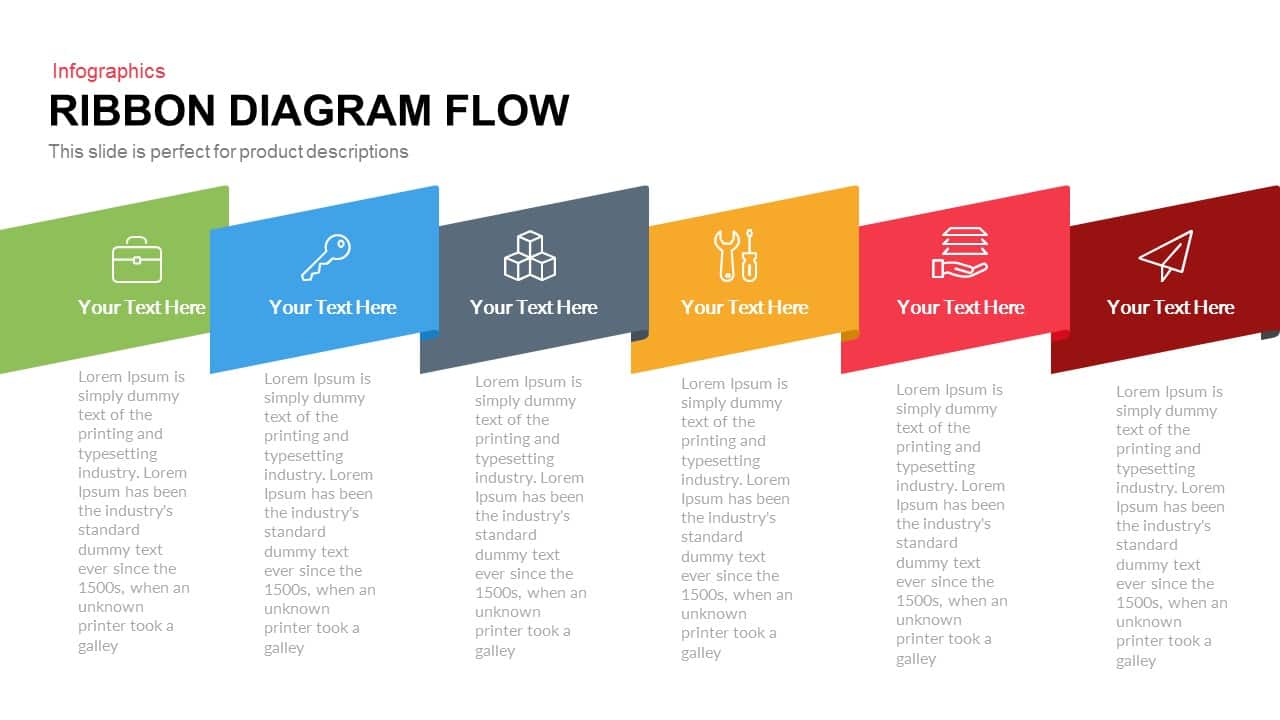
Ribbon Flow Diagram template for PowerPoint & Google Slides
Process
Ribbon Diagram Flow template for PowerPoint & Google Slides
Process
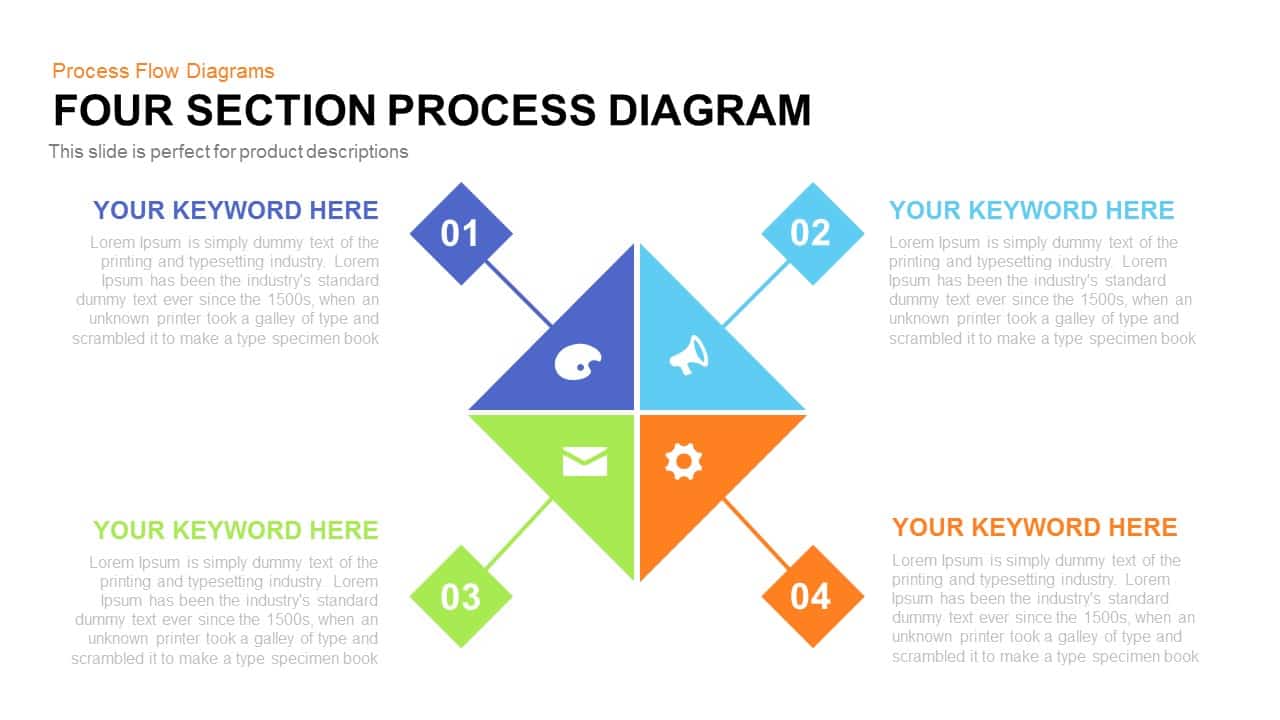
Process Flow Diagram template for PowerPoint & Google Slides
Infographics

15-Step Process Flow Diagram Template for PowerPoint & Google Slides
Process
3D Shape Linear Process Flow Diagram Template for PowerPoint & Google Slides
Process

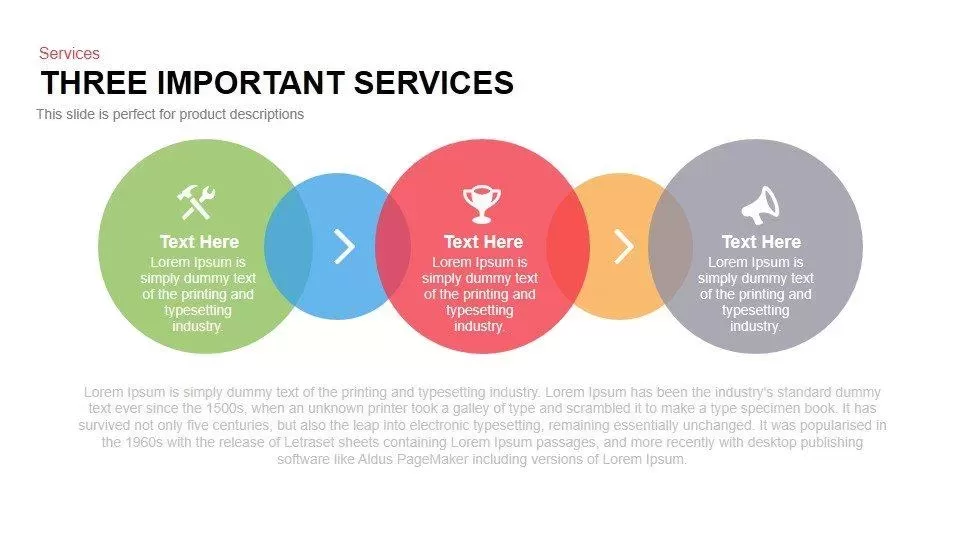
Three Important Services Flow Diagram Template for PowerPoint & Google Slides
Process
Linear Process Flow Circles Diagram Template for PowerPoint & Google Slides
Process
Six-Stage Zig-Zag Process Flow Diagram Template for PowerPoint & Google Slides
Process
Vertical Business Process Flow Diagram Template for PowerPoint & Google Slides
Process
Six-Sided Shutter Diagram Process Flow Template for PowerPoint & Google Slides
Process
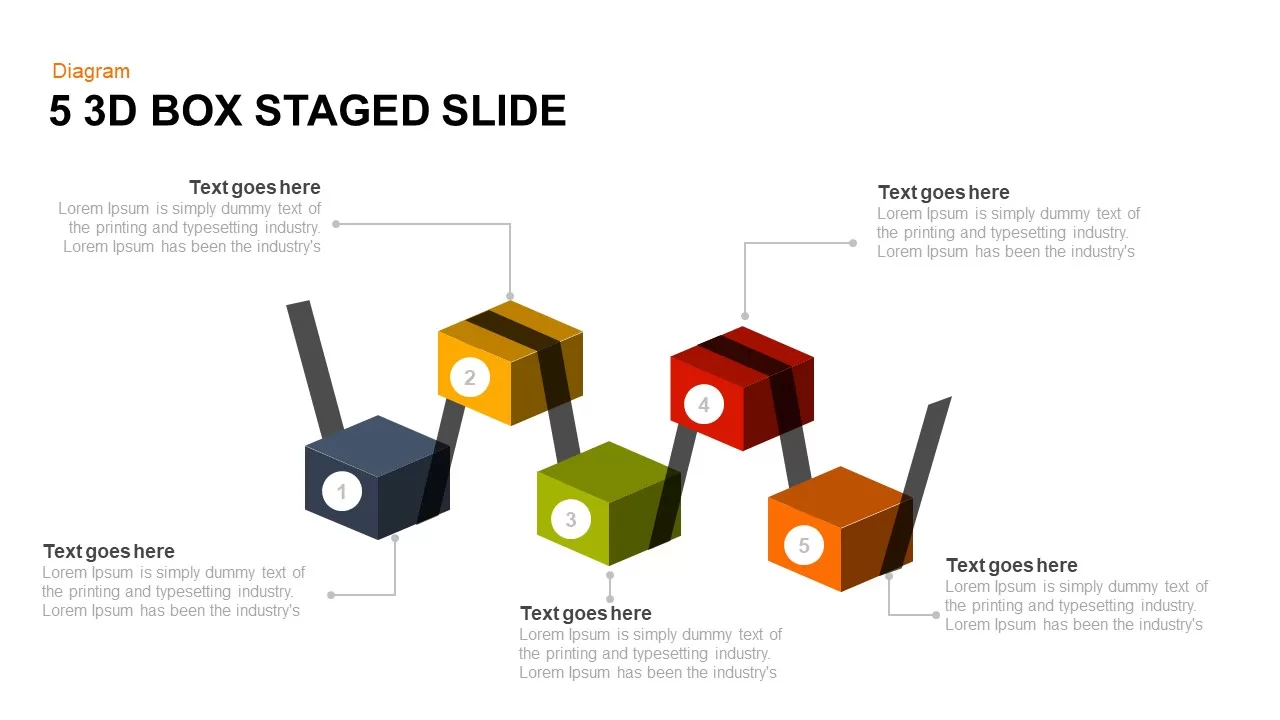
Five-Stage 3D Box Flow Diagram Template for PowerPoint & Google Slides
Process
10 Stages Business Flow Process Diagram template for PowerPoint & Google Slides
Business
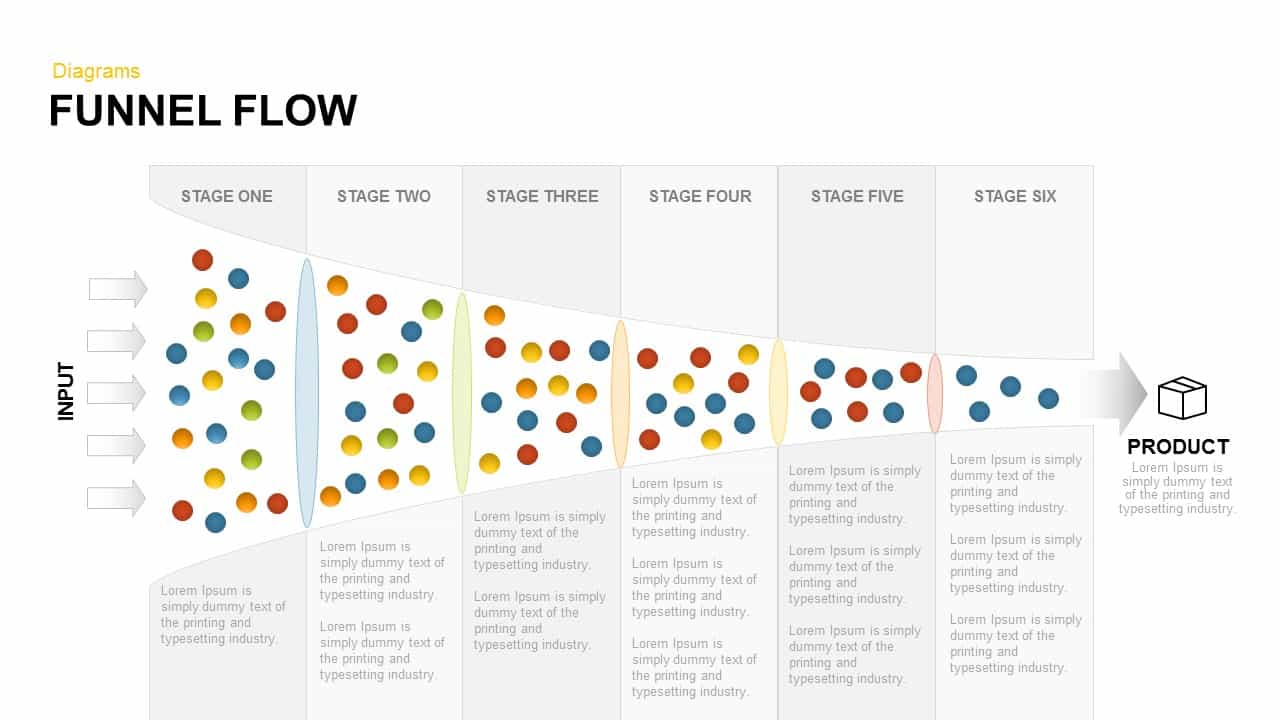
Funnel Flow Diagram template for PowerPoint & Google Slides
Funnel
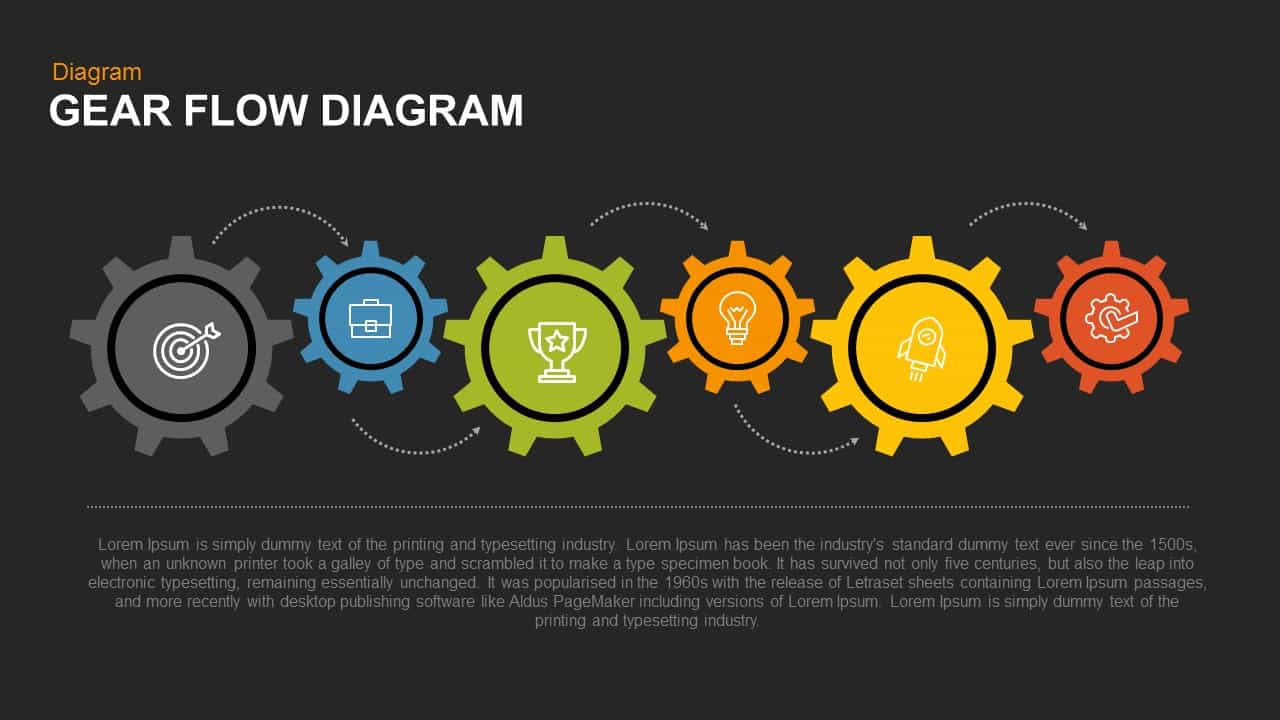
Gear Flow Diagram template for PowerPoint & Google Slides
Process

Eight-Stage Radial Process Flow Diagram Template for PowerPoint & Google Slides
Process
Four-Plus Process Flow Diagram Template for PowerPoint & Google Slides
Process
4 Step Revenue Growth Flow Diagram Template for PowerPoint & Google Slides
Process
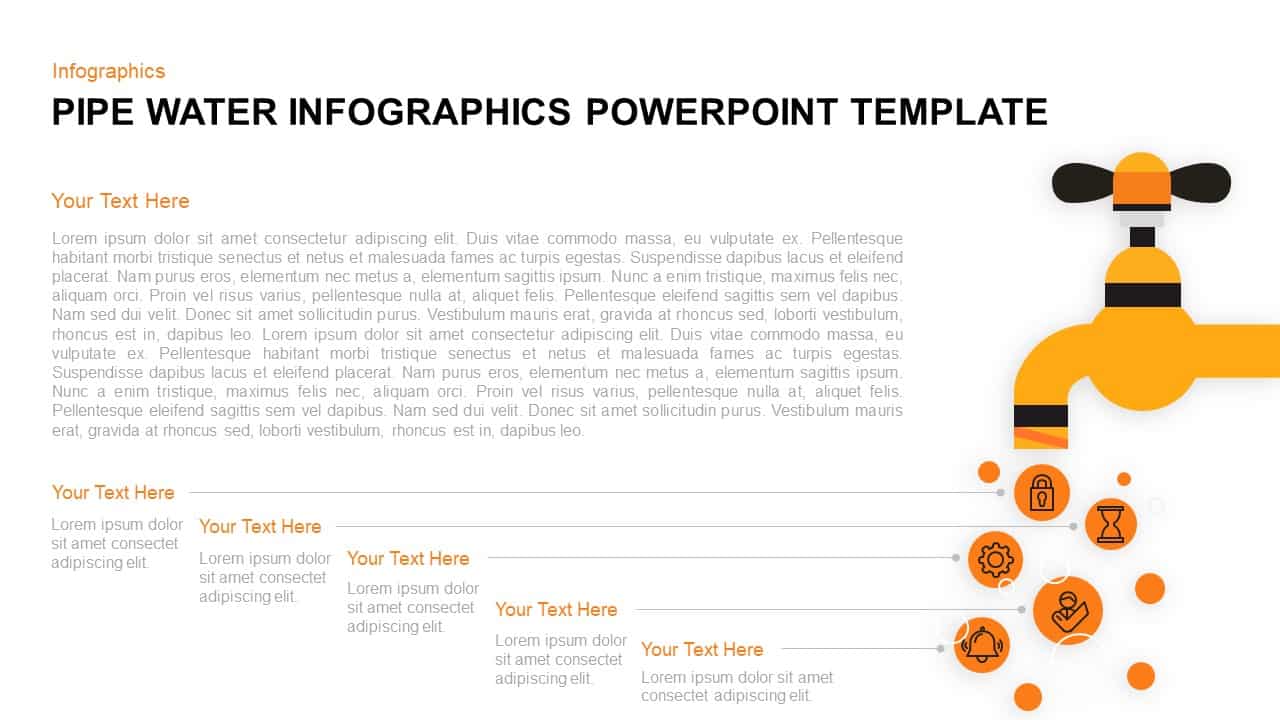
Pipe Water Infographics Flow Diagram Template for PowerPoint & Google Slides
Process
Five Stage Linear Process Flow Diagram Template for PowerPoint & Google Slides
Process
Five-Stage Linear Process Flow Diagram Template for PowerPoint & Google Slides
Process
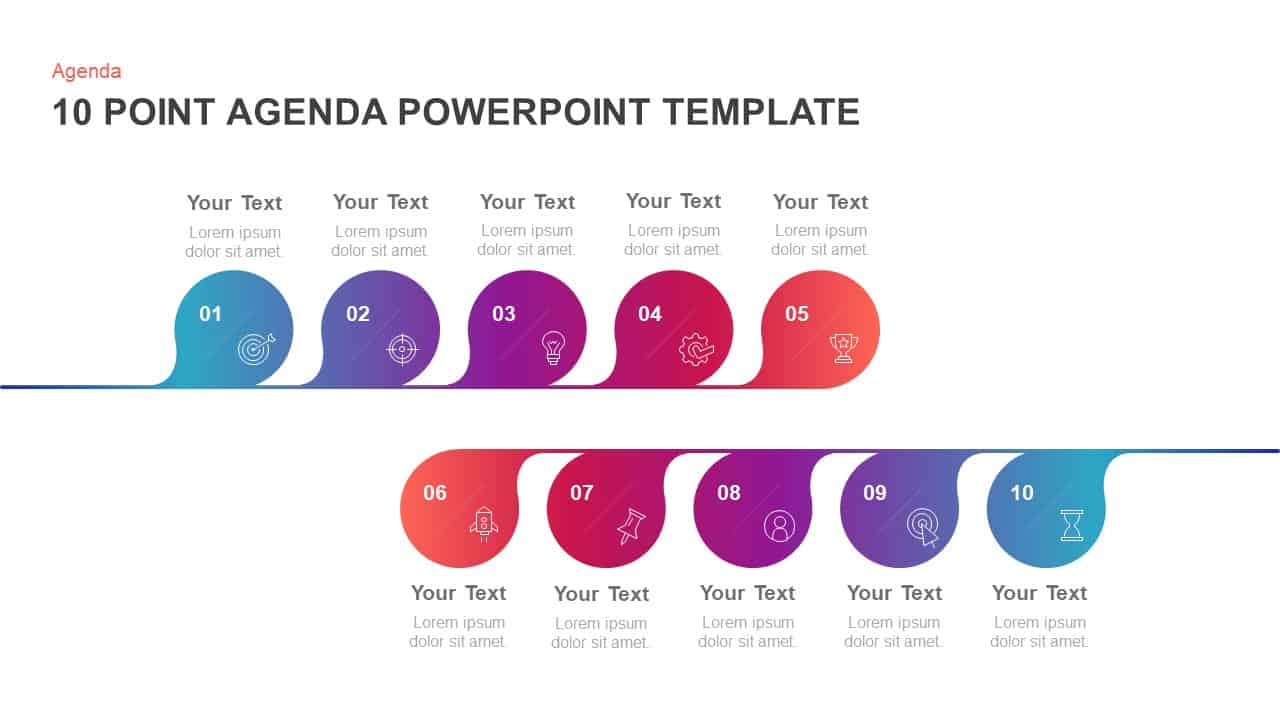
10-Point Gradient Agenda Flow Diagram Template for PowerPoint & Google Slides
Agenda
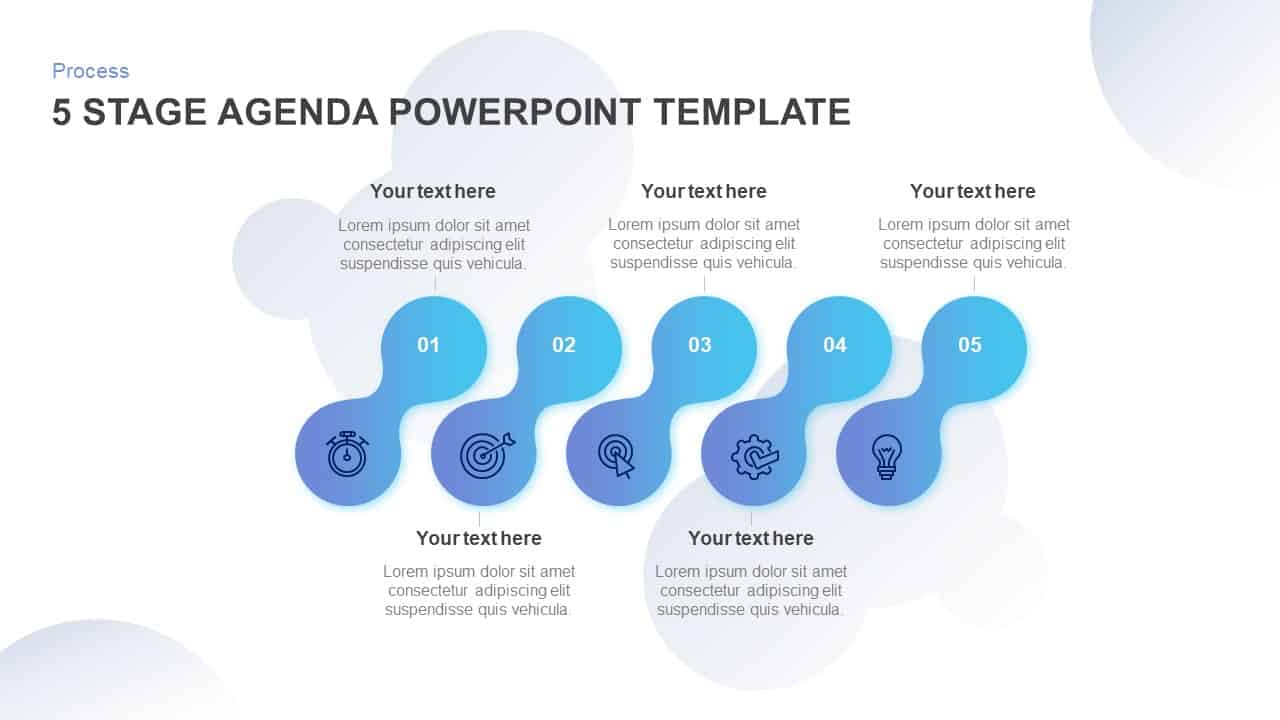
Five-Stage Agenda Flow Diagram Template for PowerPoint & Google Slides
Agenda
Six-Step Hexagon Process Flow Diagram Template for PowerPoint & Google Slides
Process
Five-Stage Circular Process Flow Diagram Template for PowerPoint & Google Slides
Circular
Five-Stage Circular Flow Diagram Template for PowerPoint & Google Slides
Circular
5-Stage Gear Process Flow Diagram Template for PowerPoint & Google Slides
Process
3D Seven-Stage Process Flow Diagram Template for PowerPoint & Google Slides
Process
Four-Stage Linear Process Flow Diagram Template for PowerPoint & Google Slides
Process
Four-Stage Circular Flow Diagram Template for PowerPoint & Google Slides
Circular
5-Stage Linear Process Flow Diagram Template for PowerPoint & Google Slides
Process
5 Stage Linear Process Flow Diagram Template for PowerPoint & Google Slides
Process
Five-Stage Process Flow Diagram Template for PowerPoint & Google Slides
Process
4 Stage Linear Process Flow Diagram Template for PowerPoint & Google Slides
Process
7 Stage Linear Process Flow Diagram Template for PowerPoint & Google Slides
Process
8 Step Circular Process Flow Diagram Template for PowerPoint & Google Slides
Process
4 Stage Linear Process Flow Diagram Template for PowerPoint & Google Slides
Process
6-Step Business Process Flow Diagram Template for PowerPoint & Google Slides
Process
6-Step Circular Process Flow Diagram Template for PowerPoint & Google Slides
Process
Six-Stage Circular Flow Diagram Template for PowerPoint & Google Slides
Circular
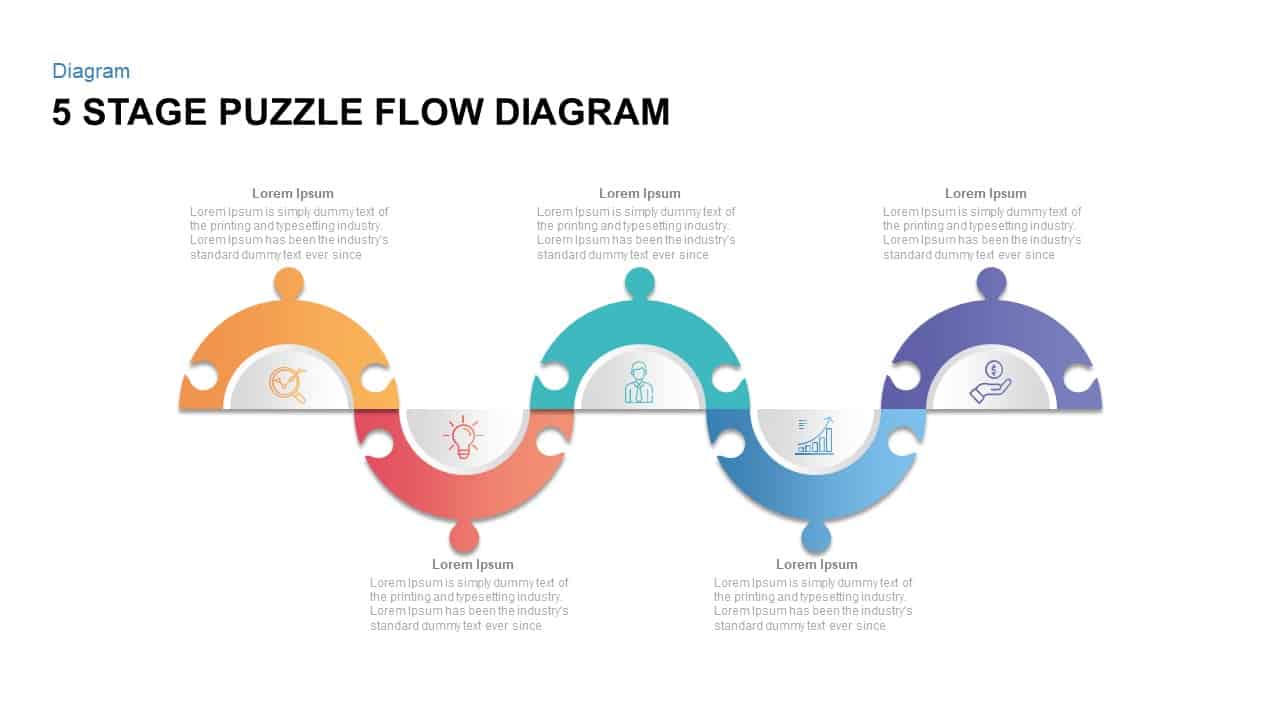
Five Stage Puzzle Flow Diagram Template for PowerPoint & Google Slides
Process
4-Stage Linear Process Flow Diagram Template for PowerPoint & Google Slides
Process
Financial Agreement Signing Flow Diagram Template for PowerPoint & Google Slides
Process
4-Step Linear Process Flow Diagram Template for PowerPoint & Google Slides
Process
Business Process Management Flow Diagram Template for PowerPoint & Google Slides
Process
Colorful 8-Stage Droplet Process Flow Diagram Template for PowerPoint & Google Slides
Process
Minimal Process Flow Diagram Infographic Template for PowerPoint & Google Slides
Process
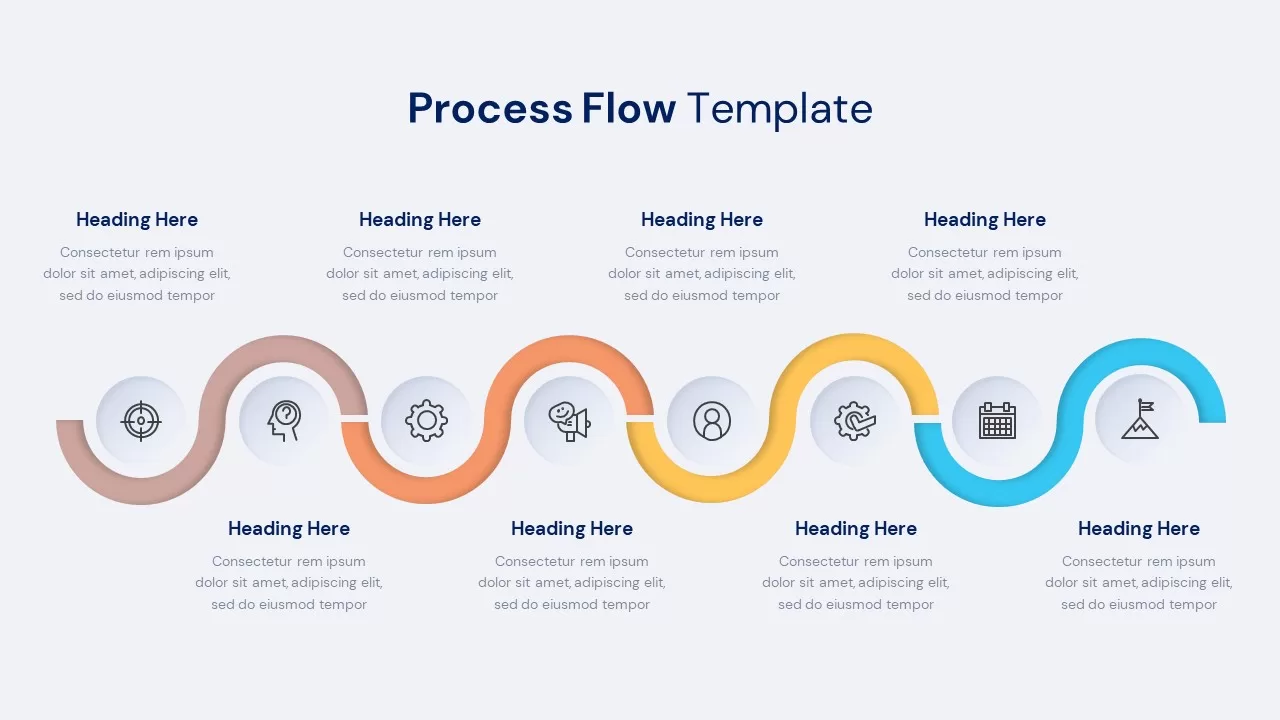
Process Flow Diagram template for PowerPoint & Google Slides
Process
Curved Arrow Process Flow Diagram Template for PowerPoint & Google Slides
Process
Curved Arrow Process Flow Diagram Template for PowerPoint & Google Slides
Arrow
Curved Arrow Flow Diagram template for PowerPoint & Google Slides
Business
3D Conveyor Belt Process Flow Diagram Template for PowerPoint & Google Slides
Process
E-Waste Management Process Flow Diagram Template for PowerPoint & Google Slides
Process
Comprehensive Process Flow Diagram Template for PowerPoint & Google Slides
Process
Animated Gears Process Flow Diagram Template for PowerPoint & Google Slides
Process
Advanced Data Flow Diagram Pack Template for PowerPoint & Google Slides
Flow Charts
Capital Investments Process Flow Diagram Template for PowerPoint & Google Slides
Process
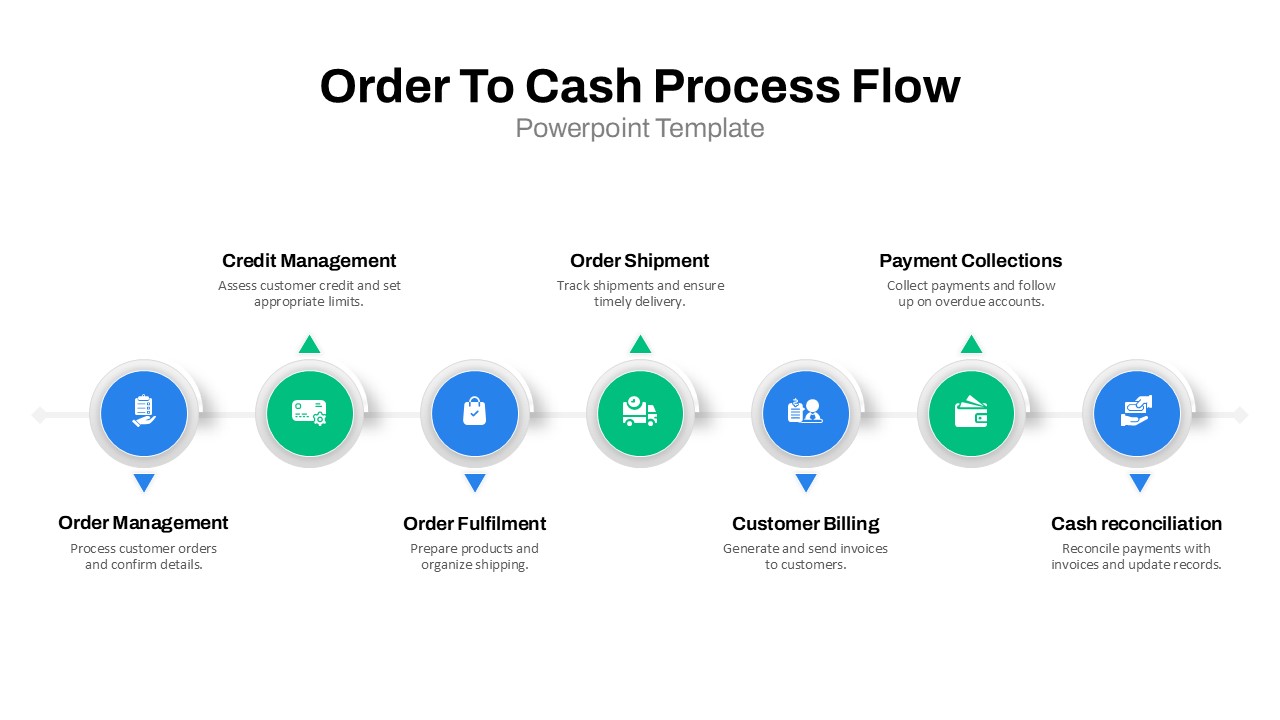
Order to Cash Process Flow Diagram Template for PowerPoint & Google Slides
Process
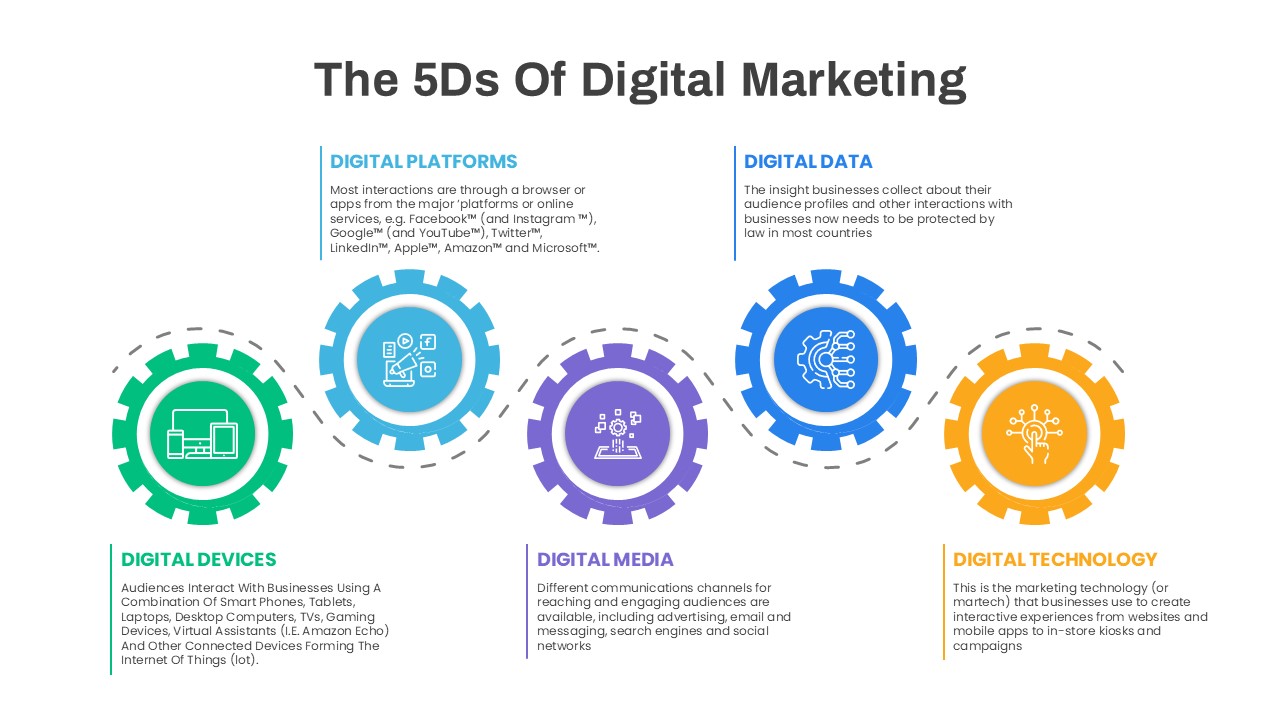
5D Digital Marketing Flow Diagram Template for PowerPoint & Google Slides
Digital Marketing
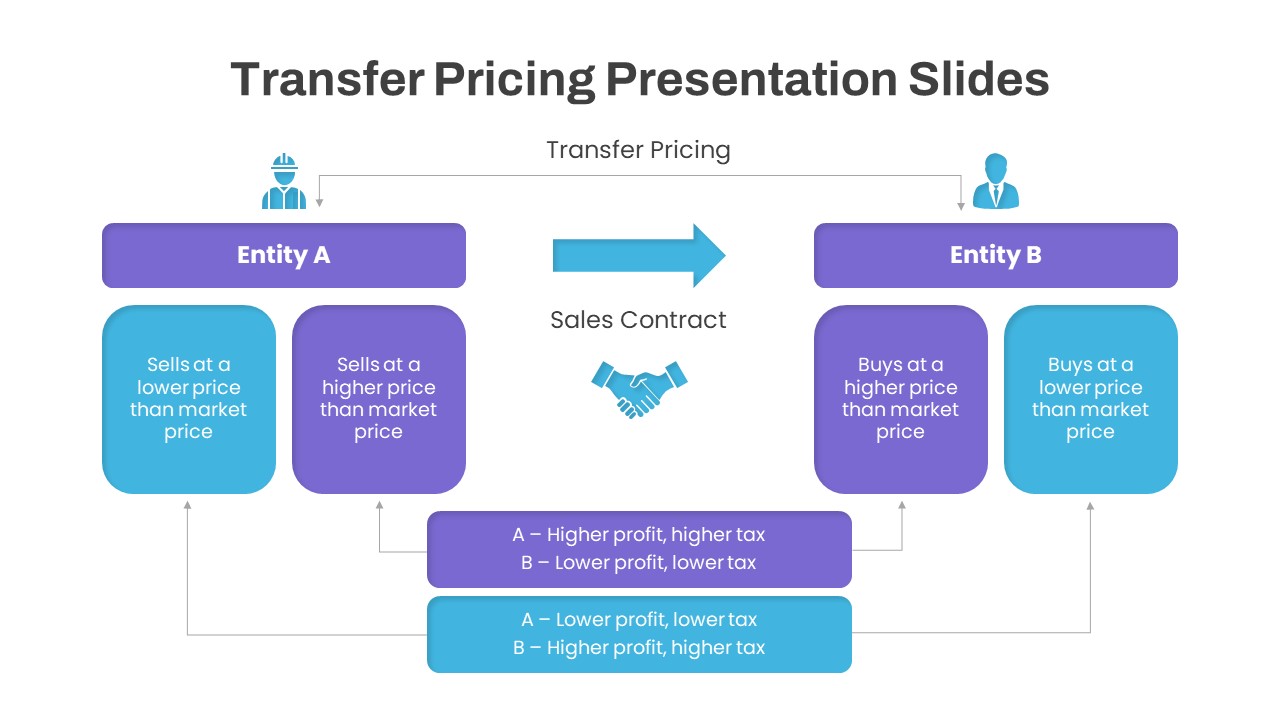
Dynamic Transfer Pricing Flow Diagram Template for PowerPoint & Google Slides
Finance
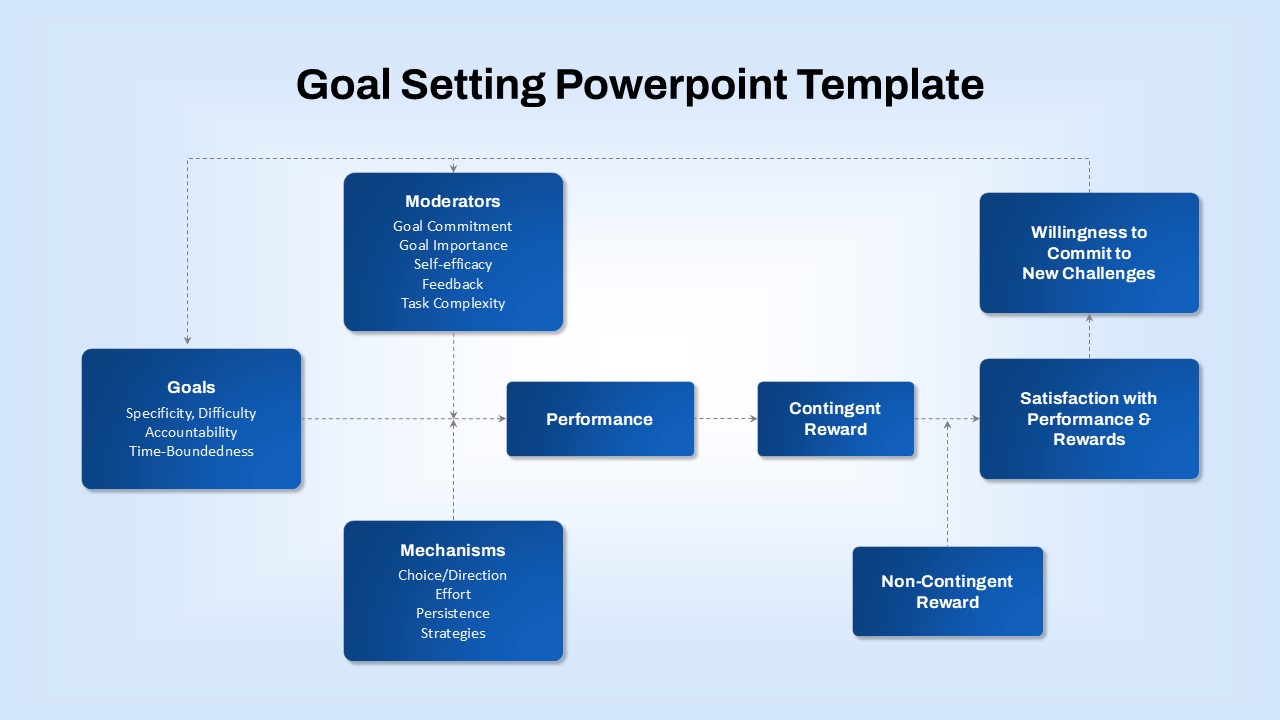
Goal-Setting Process Flow Diagram Template for PowerPoint & Google Slides
Goals
Semi-Supervised Learning Flow Diagram Template for PowerPoint & Google Slides
Machine Learning
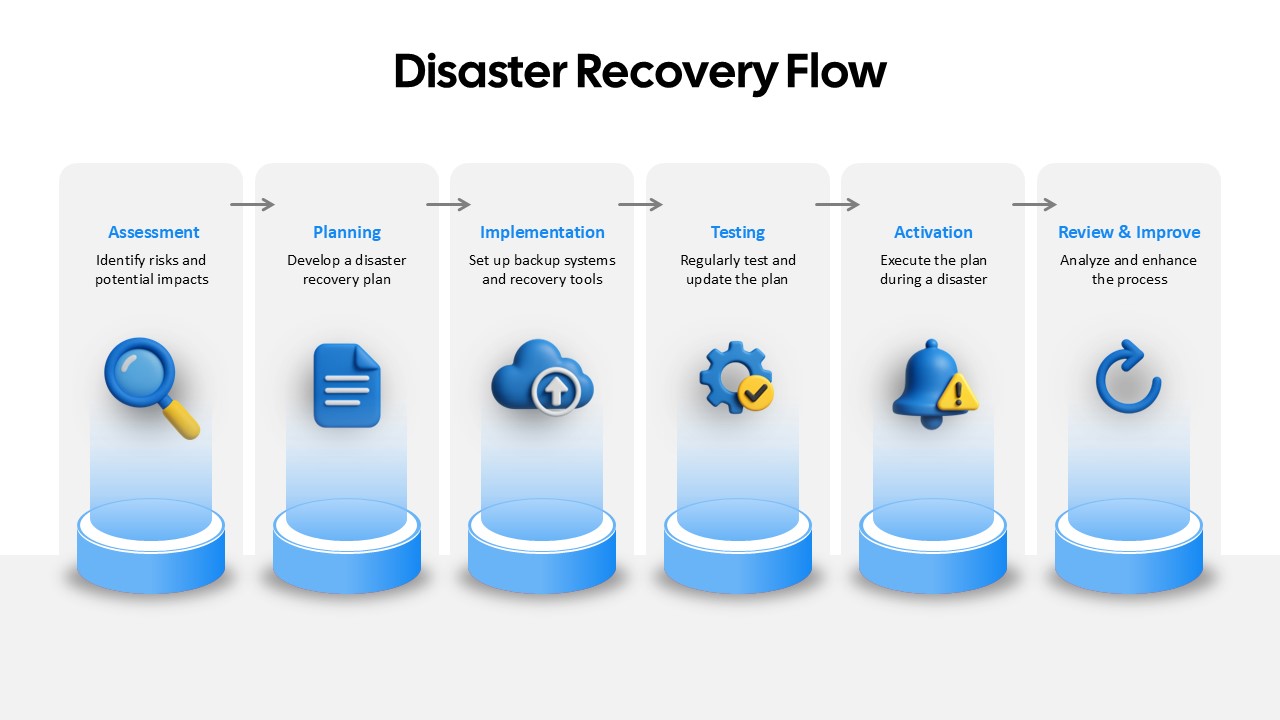
Disaster Recovery Flow Diagram Template for PowerPoint & Google Slides
Process
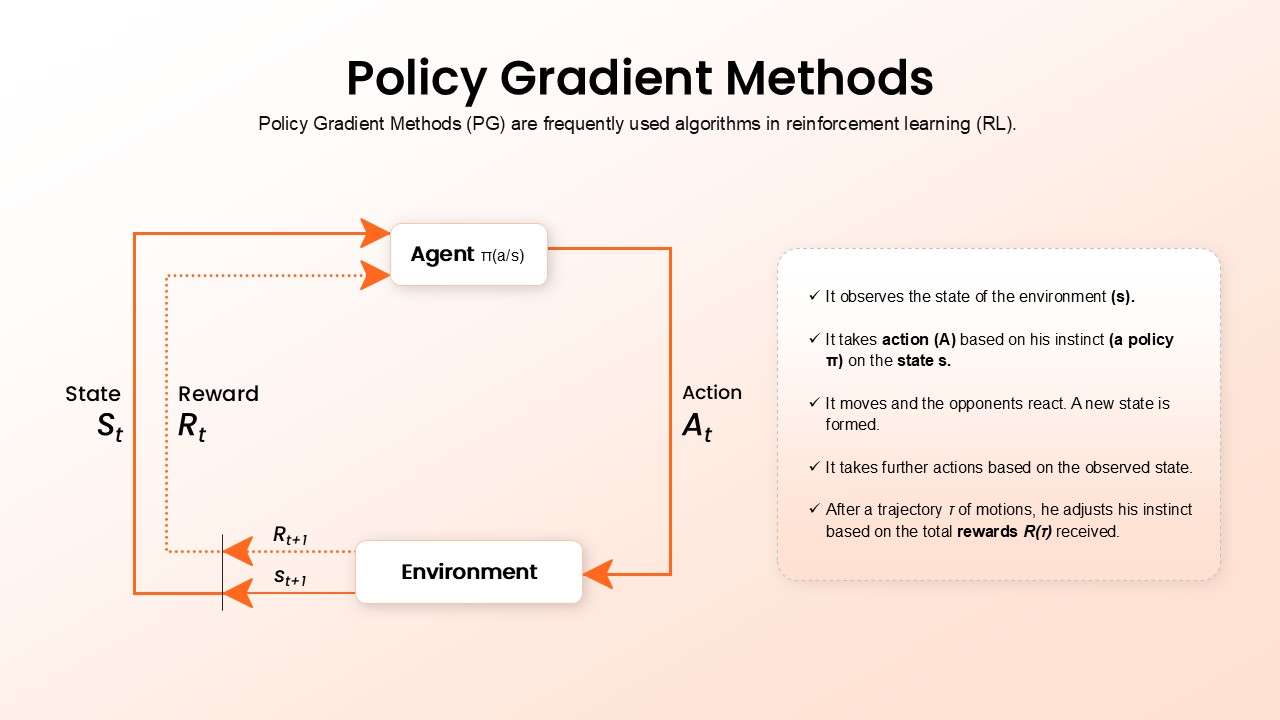
Policy Gradient Methods Flow Diagram Template for PowerPoint & Google Slides
AI
Resume Screening Process Flow Diagram Template for PowerPoint & Google Slides
Process
Q-Learning Process Flow Diagram Template for PowerPoint & Google Slides
Process
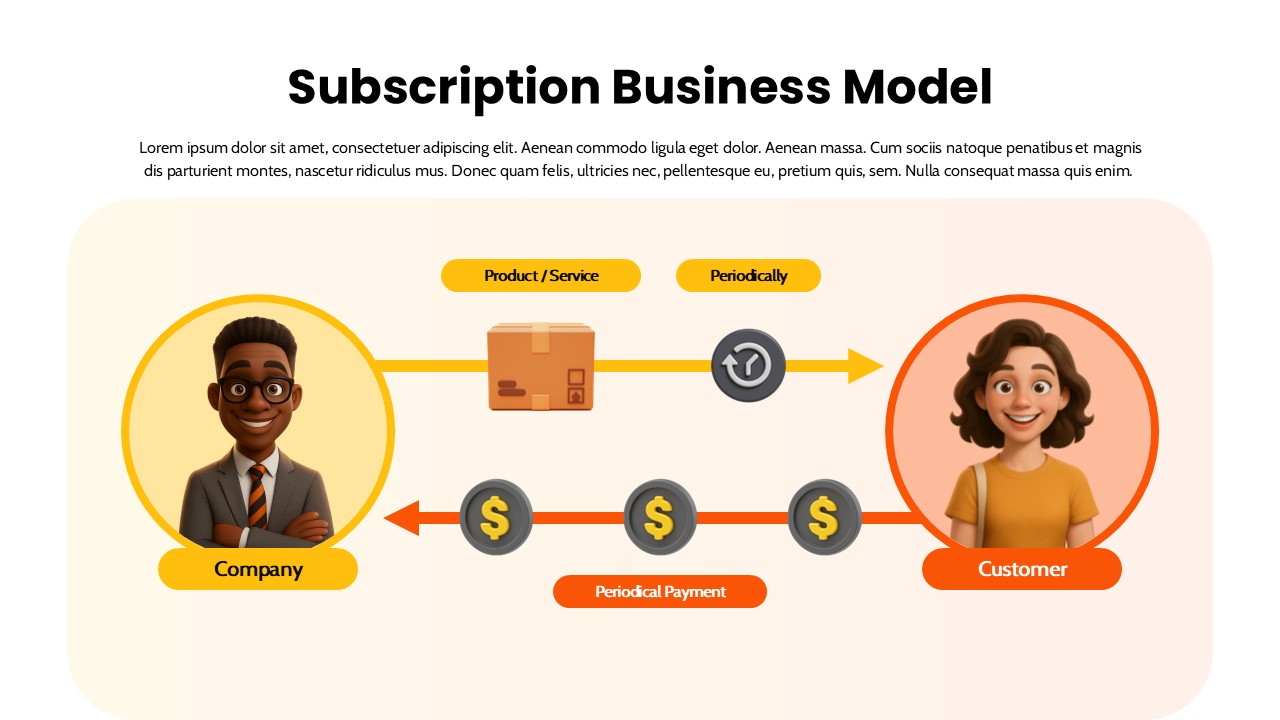
Subscription Business Model Flow Diagram Template for PowerPoint & Google Slides
Business Models
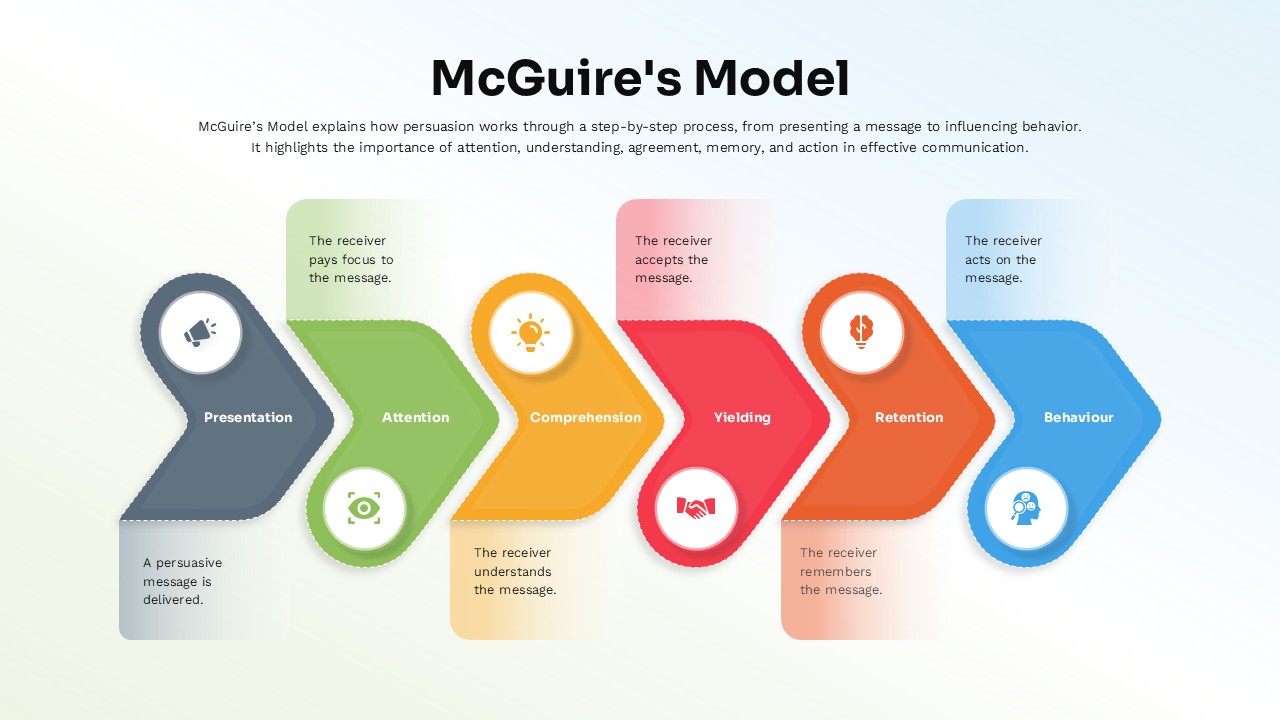
McGuire’s Persuasion Process Flow Diagram Template for PowerPoint & Google Slides
Marketing
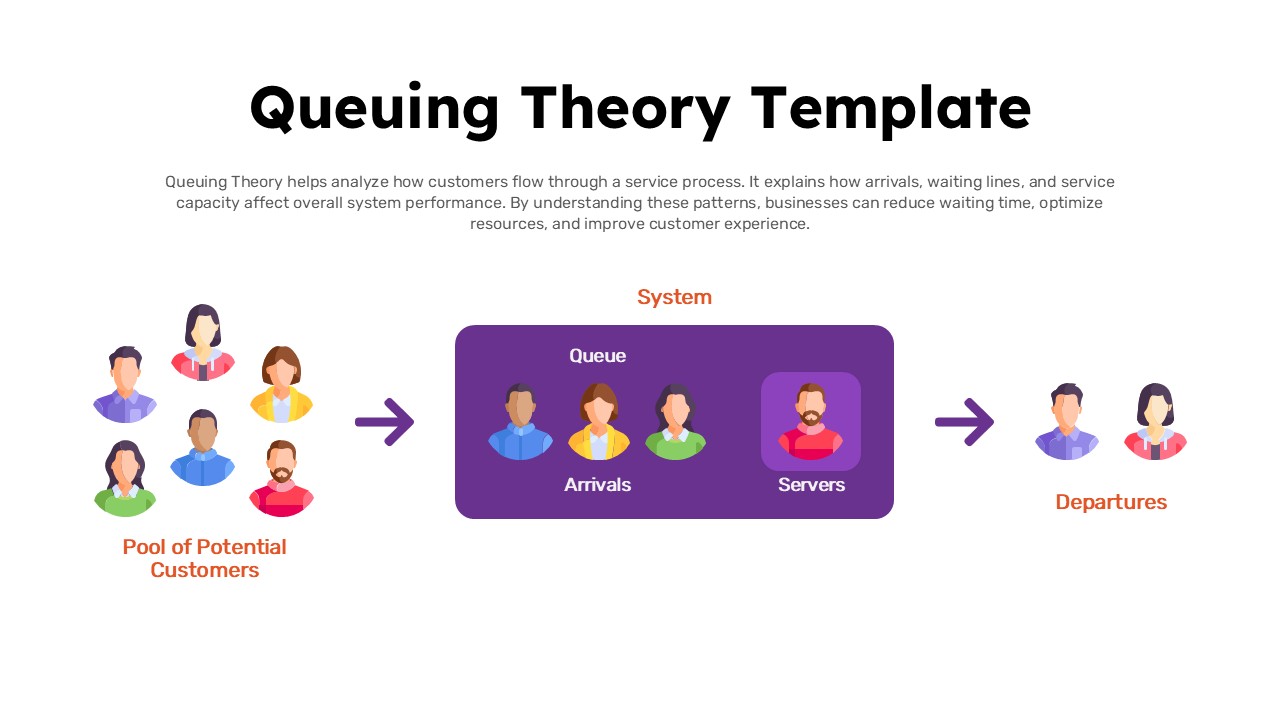
Queuing Theory System Flow Diagram Template for PowerPoint & Google Slides
Process
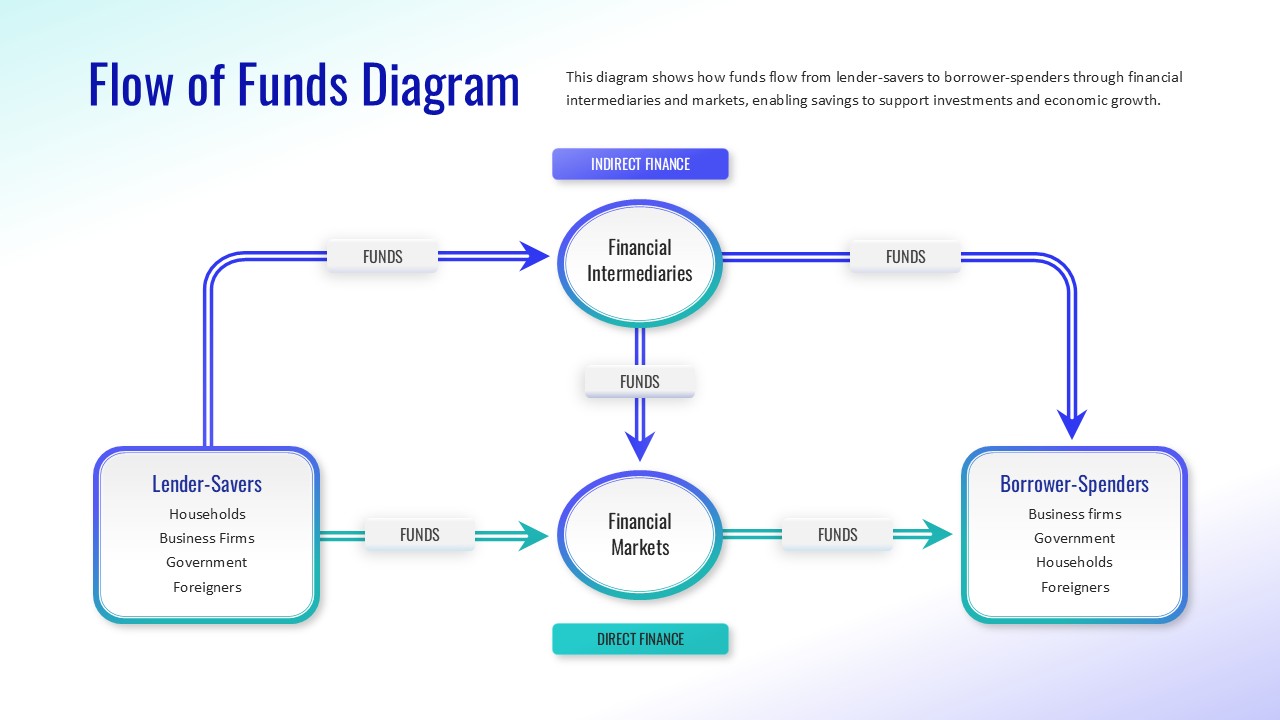
Flow of Funds Financial System Diagram Template for PowerPoint & Google Slides
Finance
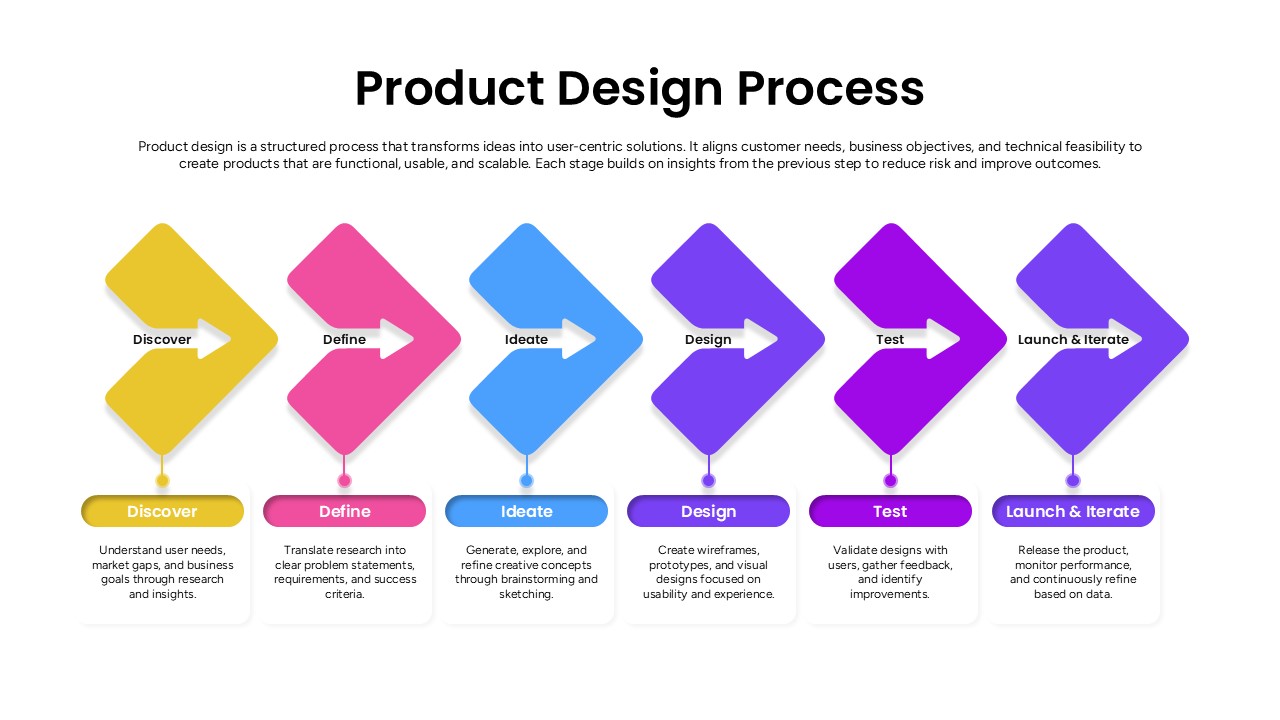
Product Design Process Flow Diagram Template for PowerPoint & Google Slides
Process
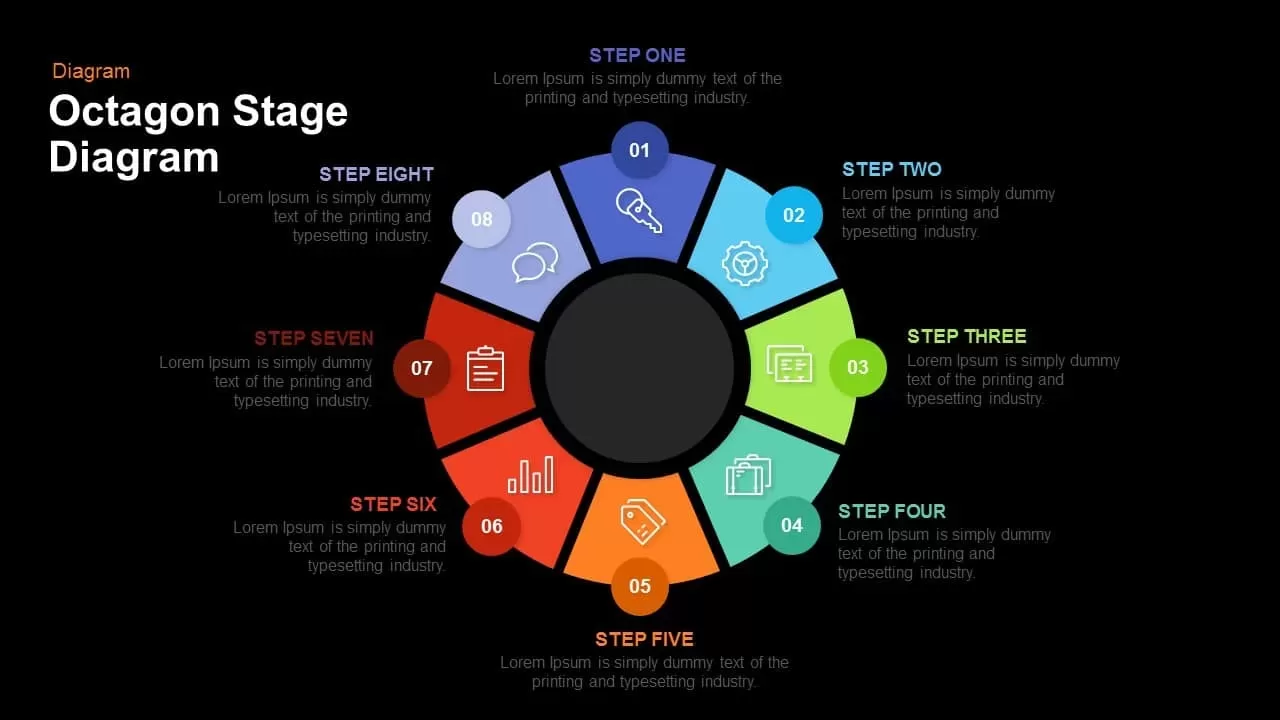
Octagon Stage Process Flow Diagram for PowerPoint & Google Slides
Process
Arrow Circle Flow Diagram for PowerPoint & Google Slides
Infographics
Five Circular Flow Arrow Diagram for PowerPoint & Google Slides
Arrow
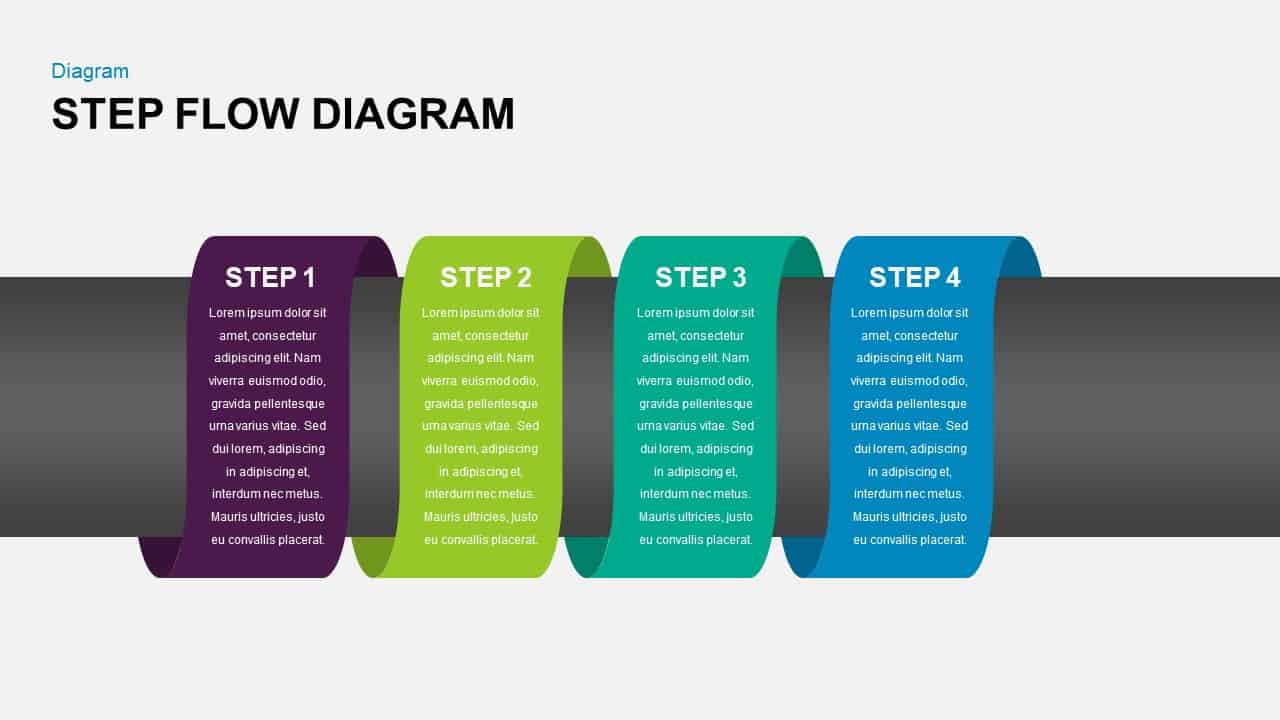
Step Flow Diagram for PowerPoint & Google Slides
Process
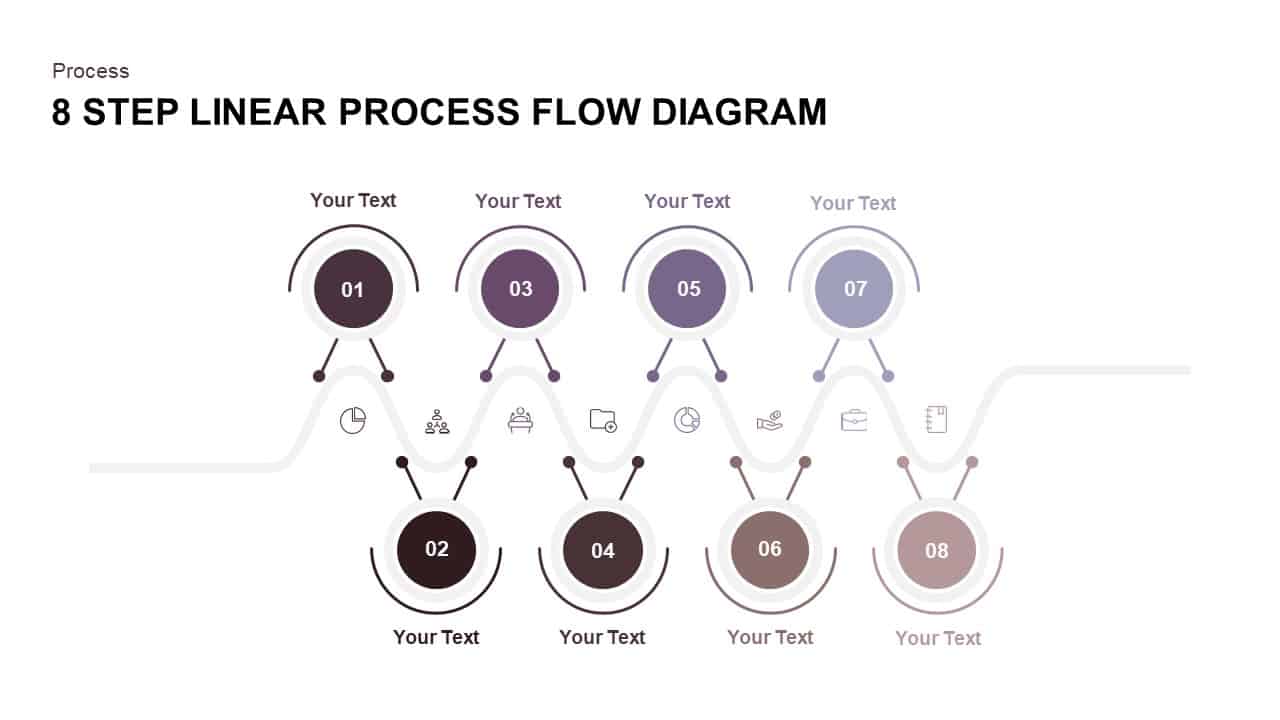
8 Step Linear Process Flow Diagram for PowerPoint & Google Slides
Process
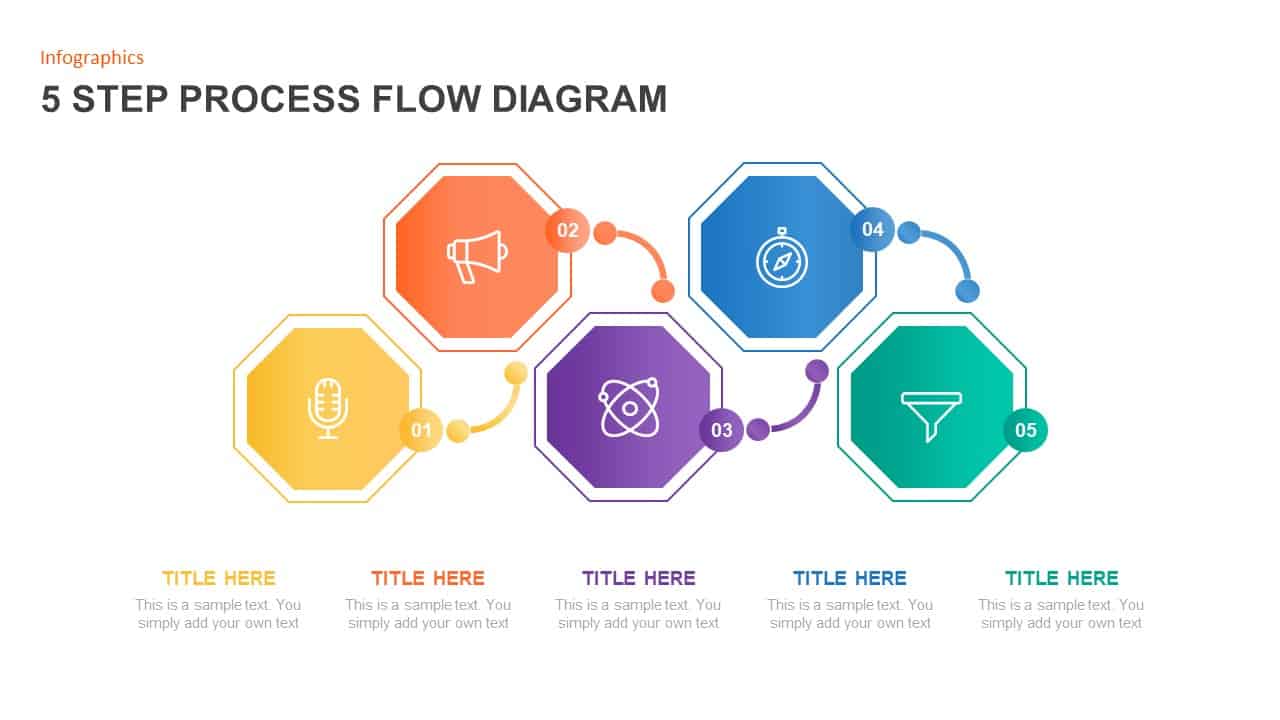
5 Step Process Flow Diagram for PowerPoint & Google Slides
Process

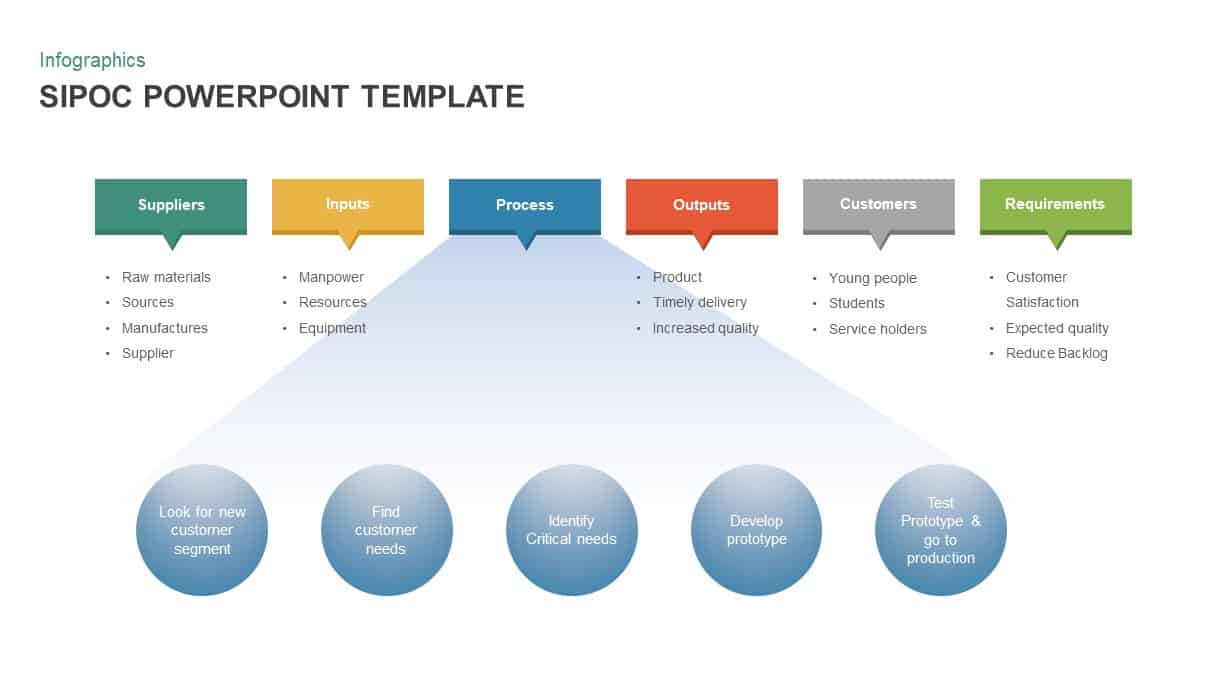
Color-Coded SIPOC Diagram with Process Flow for PowerPoint & Google Slides
Process
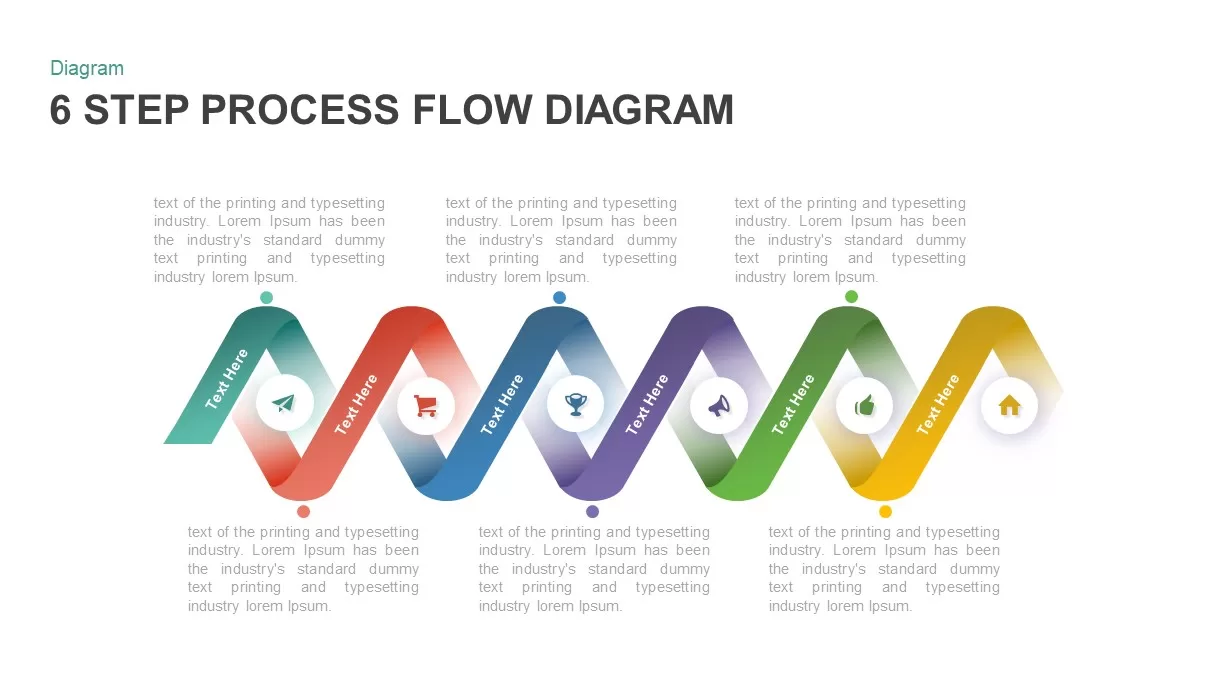
6 Step Process Flow Diagram for PowerPoint & Google Slides
Charts
5 Steps Linear Process Flow Diagram template
Process