Phase-Wise Project Estimate Table Template for PowerPoint & Google Slides

Description
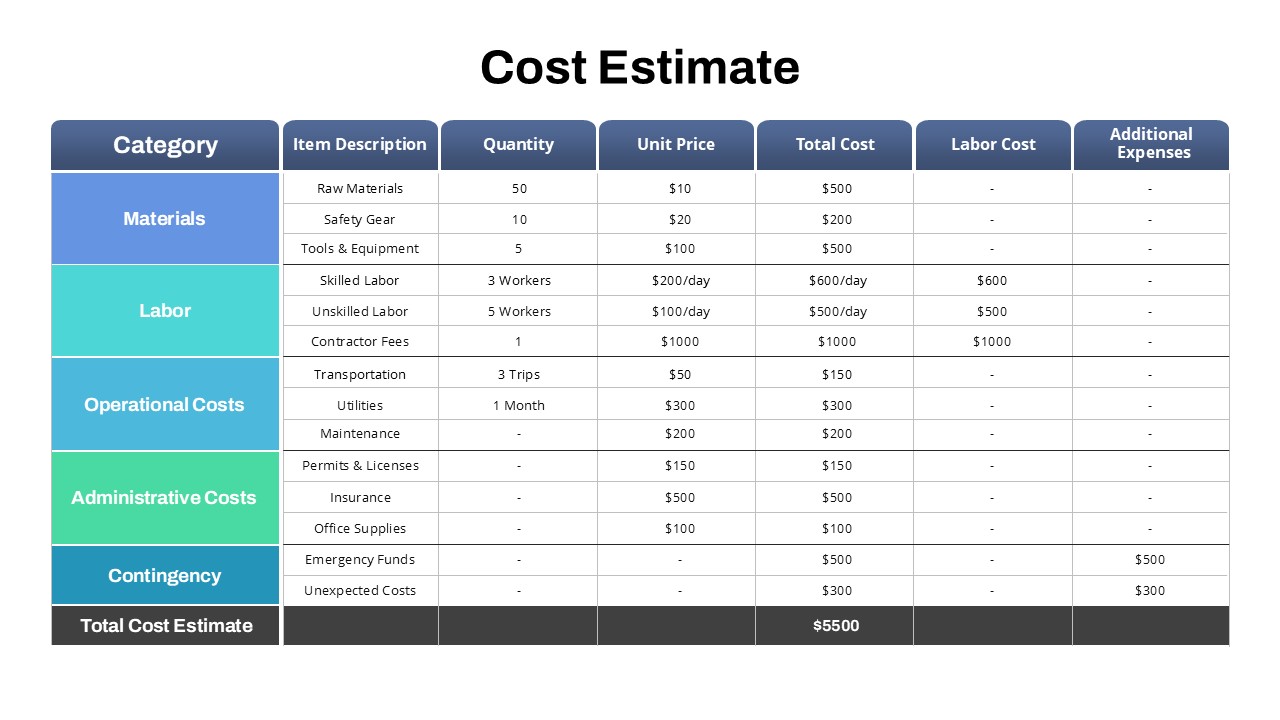
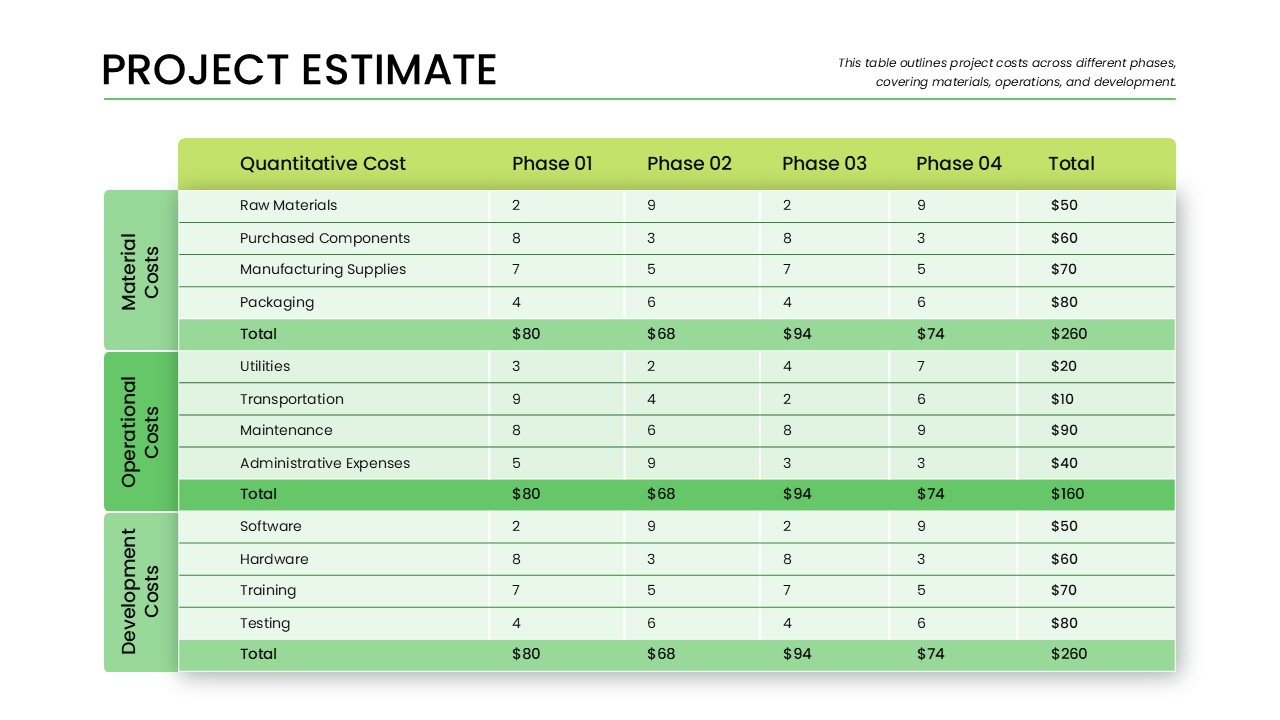
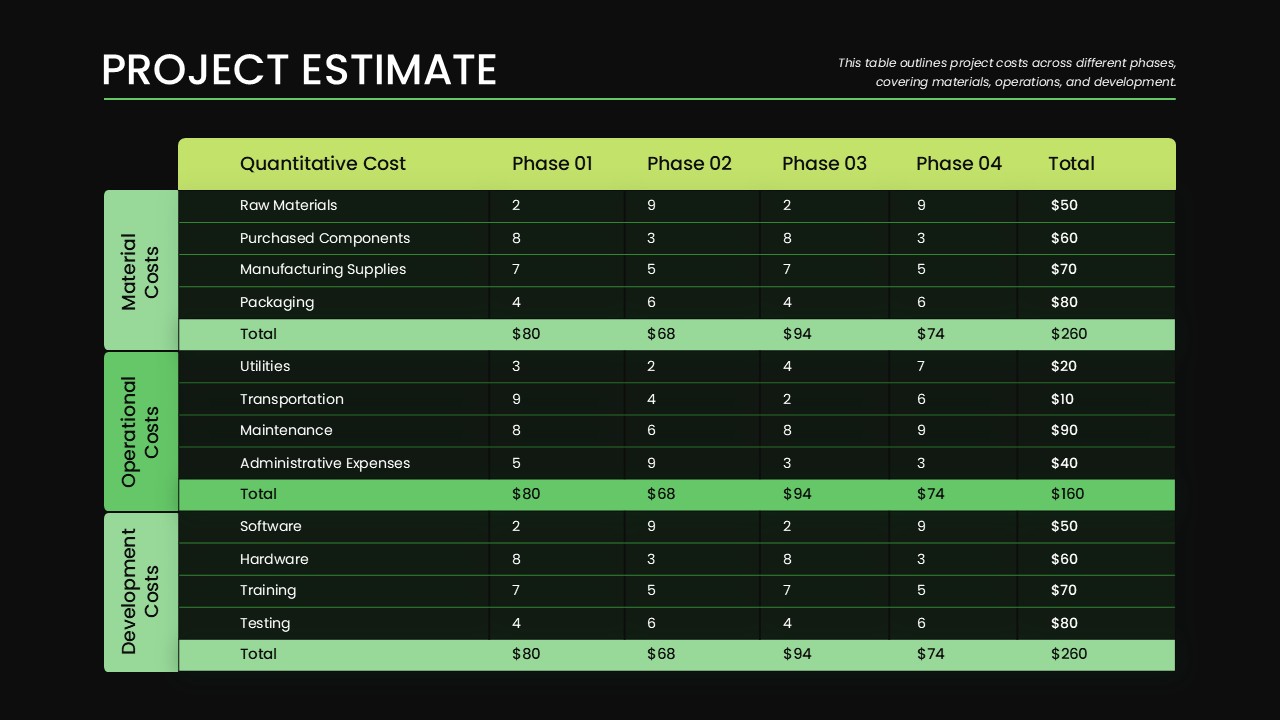
Leverage this versatile project estimate slide to detail phase-wise quantitative costs across hardware, software, and operations. The customizable two-tone green table features five columns (Phase 01–Phase 04 and Total) and grouped rows for line items such as Servers, Network Components, Packaging, Software Licenses, Transportation, Telecommunication, and Maintenance. Alternating row shading, a bold header band, and precision snap-to-grid alignment enhance clarity and professionalism. Built on master slides with fully editable vector shapes, you can adjust row counts, add new phases or cost categories, swap icons, modify typography, or recolor to match corporate branding without losing fidelity. Customize cell formatting or apply conditional highlighting to flag budget variances, and leverage integrated formula placeholders to calculate totals automatically. Use the subtitle area to document estimate assumptions, data sources, or scope details, and apply built-in table styles for instant light or dark theme variants.
Optimized for both PowerPoint and Google Slides, the slide preserves high-definition clarity across devices and supports collaborative cloud-based editing. Intuitive placeholders streamline data entry and real-time updates, while locked guides ensure consistent layout during rapid deck assembly. Whether you need to include markup columns, insert currency symbols, adjust row heights for readability, or reorganize categories for vendor comparisons, the modular design adapts effortlessly to your project requirements. Perfect for client proposals, internal budget reviews, stakeholder workshops, or executive briefings, this project estimate table accelerates decision-making by presenting complex cost data in a structured, easy-to-interpret format. The slide’s responsive layout also supports adding visual data callouts—such as mini bar indicators or heatmap cells—to emphasize areas requiring attention, making it ideal for risk analysis and performance tracking.
Who is it for
Project managers, financial analysts, operations leads, and consultants will benefit from this table when presenting budget forecasts, cost breakdowns, or resource allocations in executive briefings, client proposals, and stakeholder workshops.
Other Uses
Beyond cost estimation, repurpose this layout for vendor bid comparisons, ROI analyses, expense tracking, project funding requests, quarterly financial reviews, or performance-metric dashboards. Adapt the table to display milestone schedules or capacity-planning data to suit diverse presentation needs.
Login to download this file

Item ID
SB04733
Related Templates

Project Detailed Cost Estimate Table Template for PowerPoint & Google Slides
Project
Five-Phase and Three-Phase Phases Chart Template for PowerPoint & Google Slides
Charts
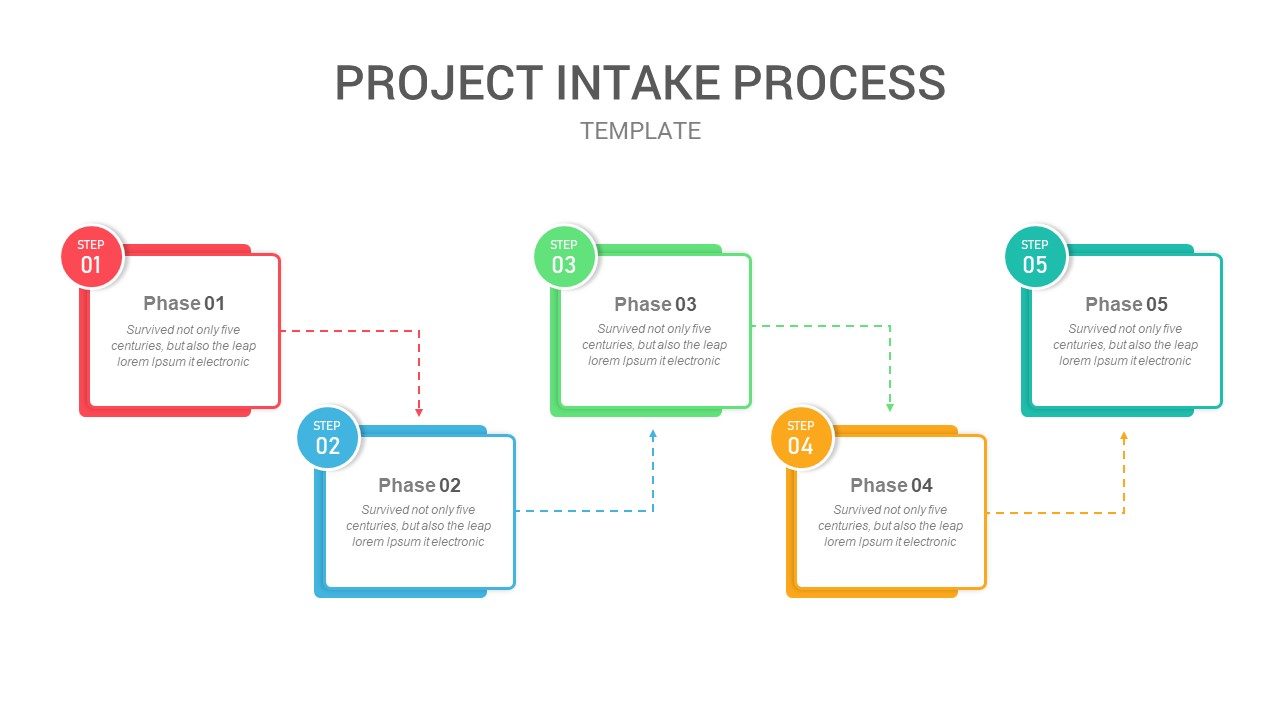
Five-Phase Project Intake Process Flow Template for PowerPoint & Google Slides
Process
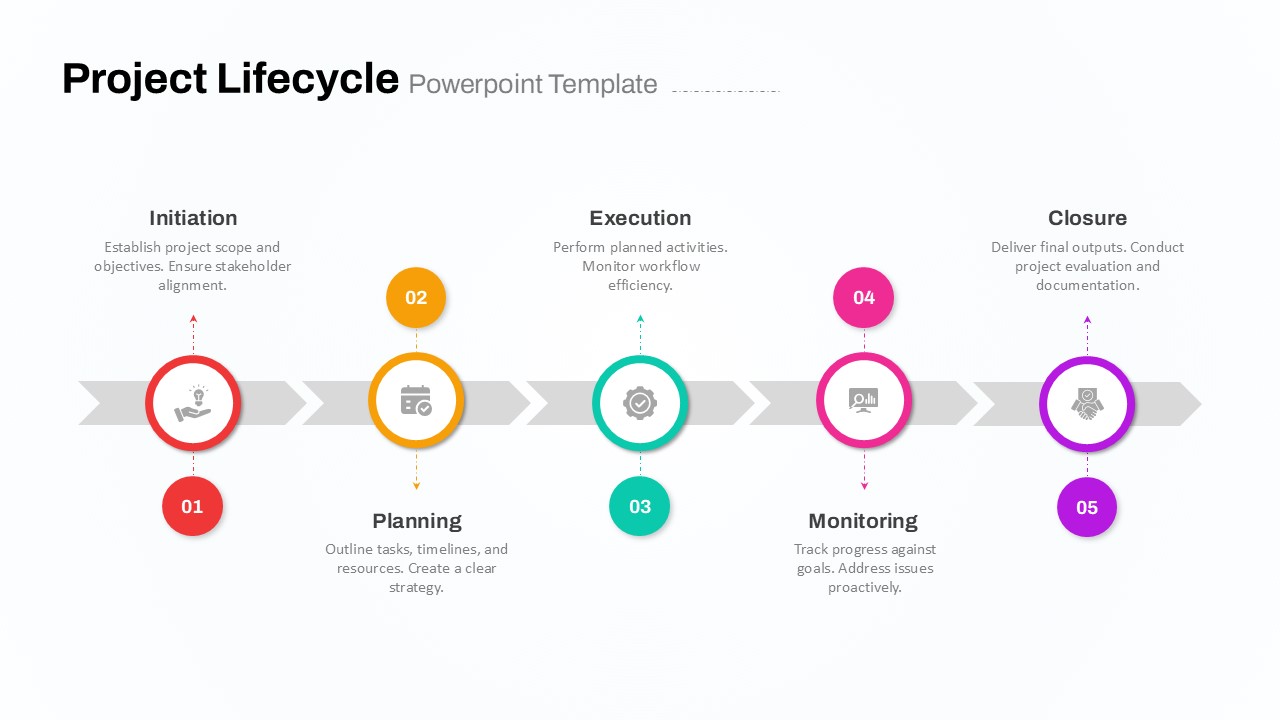
Five-Phase Project Lifecycle Diagram Template for PowerPoint & Google Slides
Infographics
Gear Process Phase Diagram template for PowerPoint & Google Slides
Process
Greiner Growth Model Six-Phase Diagram Template for PowerPoint & Google Slides
Business Models

Four-Phase Maturity Model Diagram Template for PowerPoint & Google Slides
Process
Three-Phase Planning Gear Infographic Template for PowerPoint & Google Slides
Process
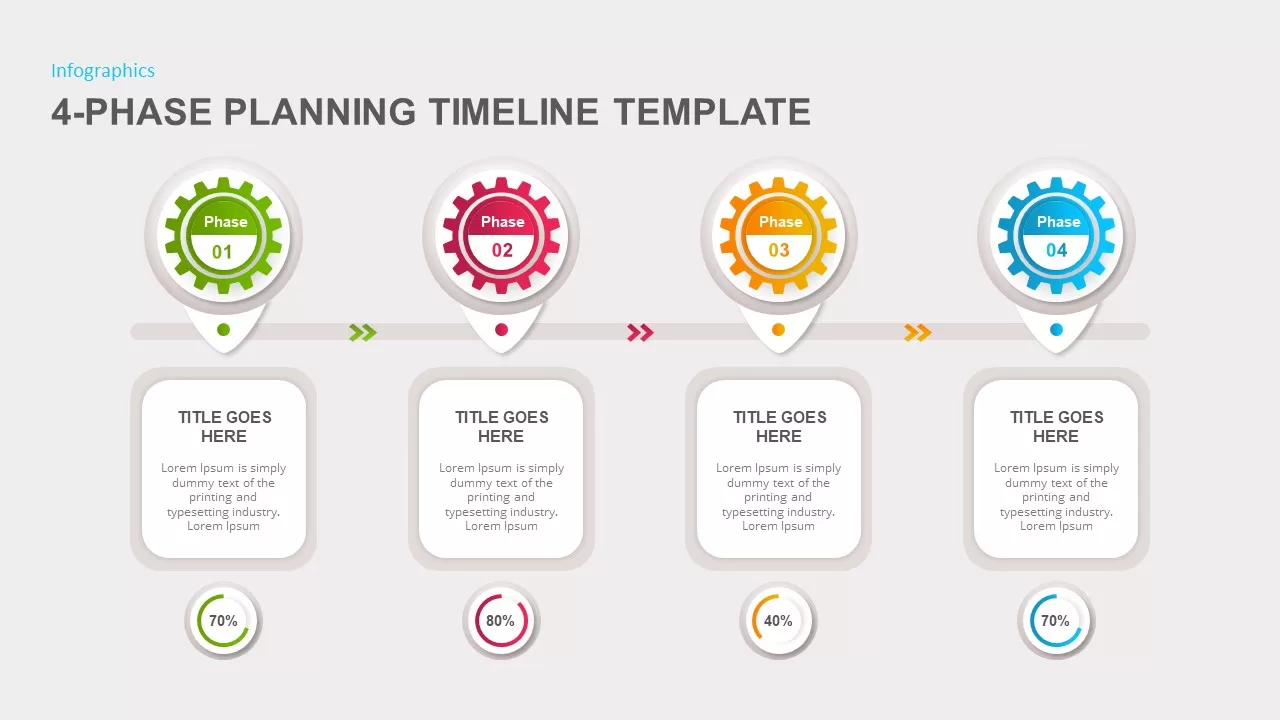
4-Phase Planning Timeline template for PowerPoint & Google Slides
Infographics
Five-Phase Strategy Timeline Diagram Template for PowerPoint & Google Slides
Timeline
Five-Phase Horizontal Timeline Chart Template for PowerPoint & Google Slides
Timeline
Multi-Team Multi-Phase Release Timeline Template for PowerPoint & Google Slides
Timeline
Multi-Phase Research Roadmap Infographic Template for PowerPoint & Google Slides
Roadmap
Free Six-Phase Market Research Process Template for PowerPoint & Google Slides
Process
Free
Three-Phase Triangle Cycle Diagram Template for PowerPoint & Google Slides
Infographics
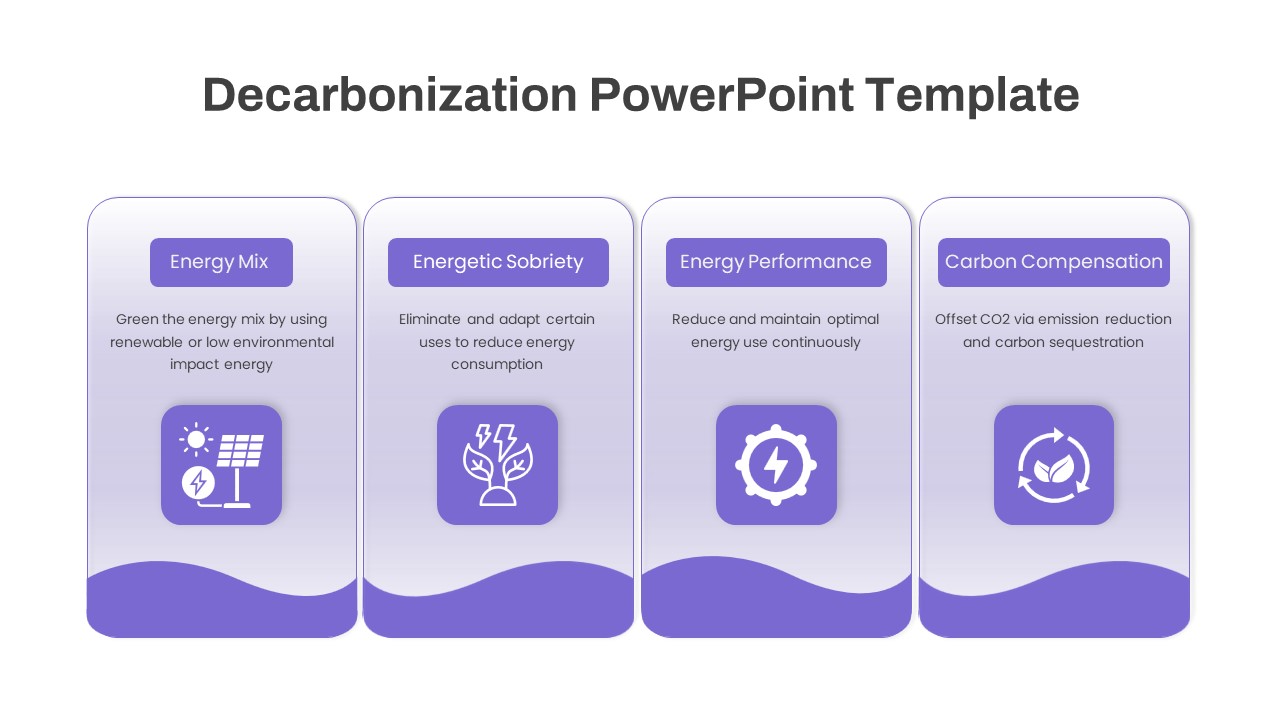
Four-Phase Decarbonization Diagram Template for PowerPoint & Google Slides
Process
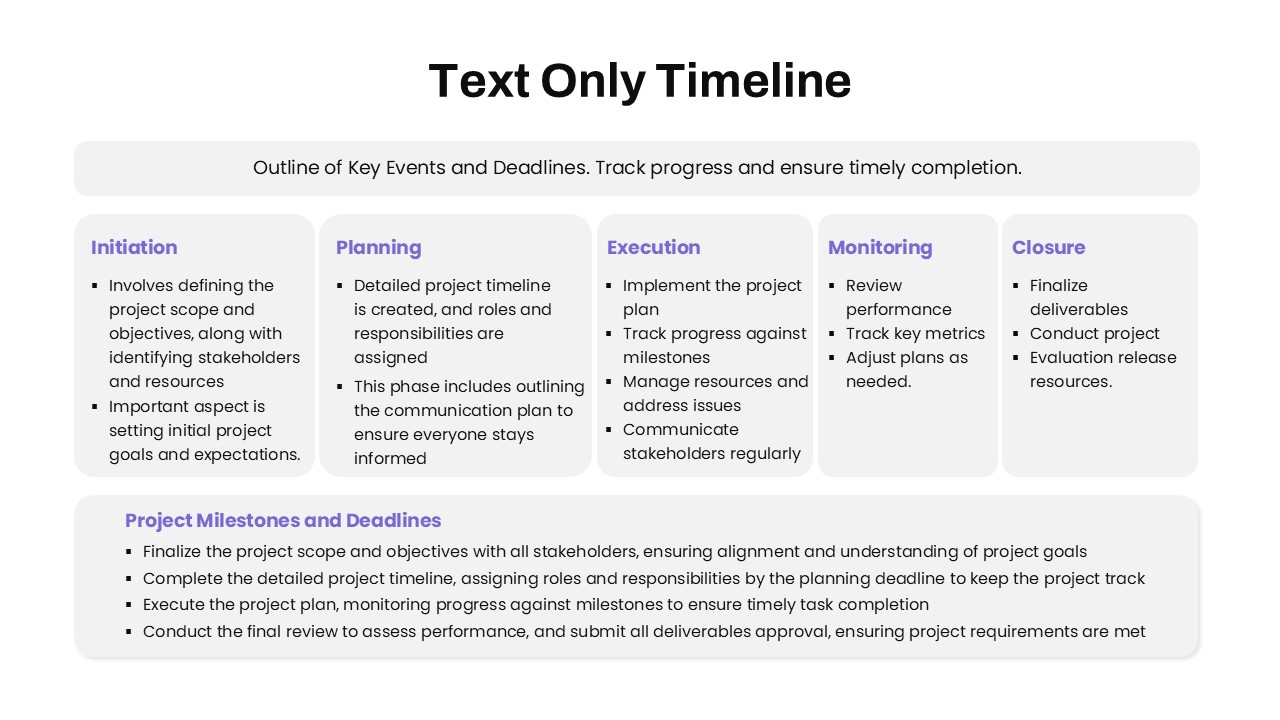
Text-Only Five-Phase Timeline Template for PowerPoint & Google Slides
Timeline

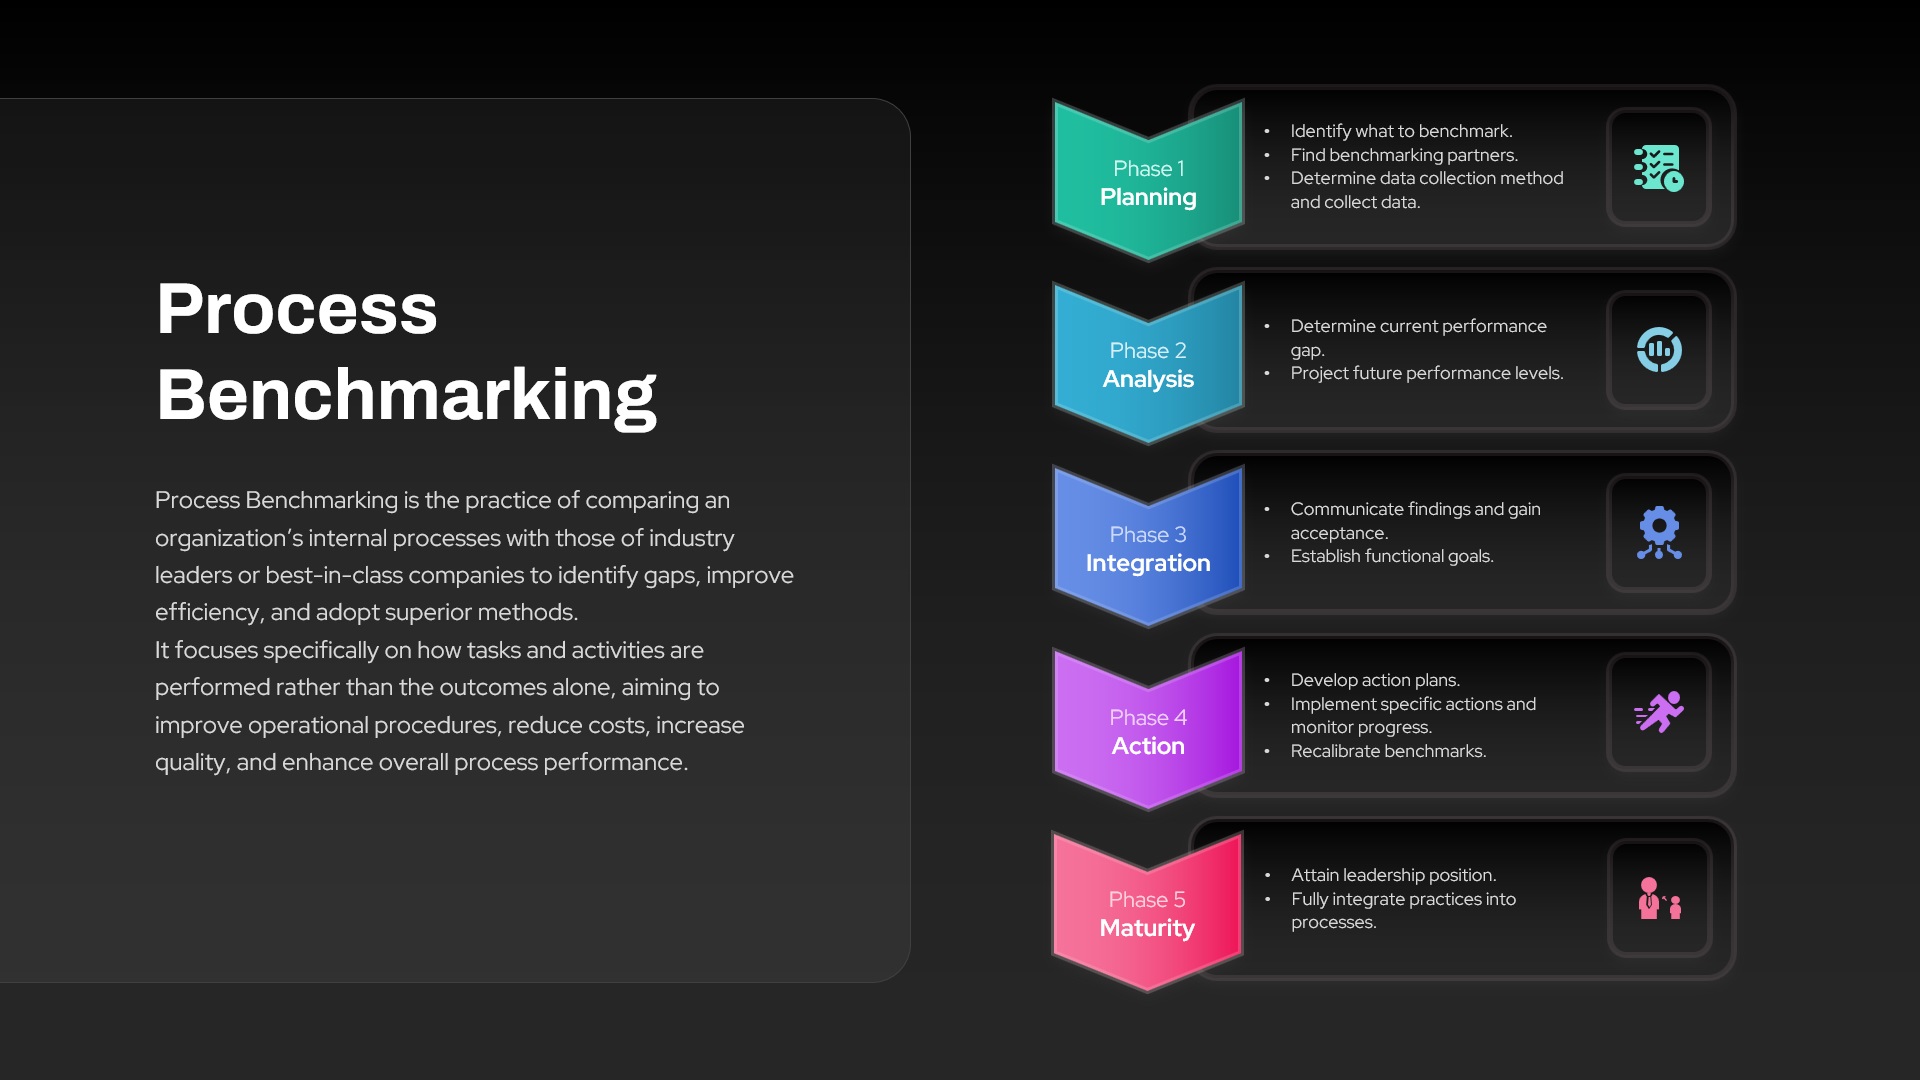
Process Benchmarking Five-Phase Framework Template for PowerPoint & Google Slides
Process
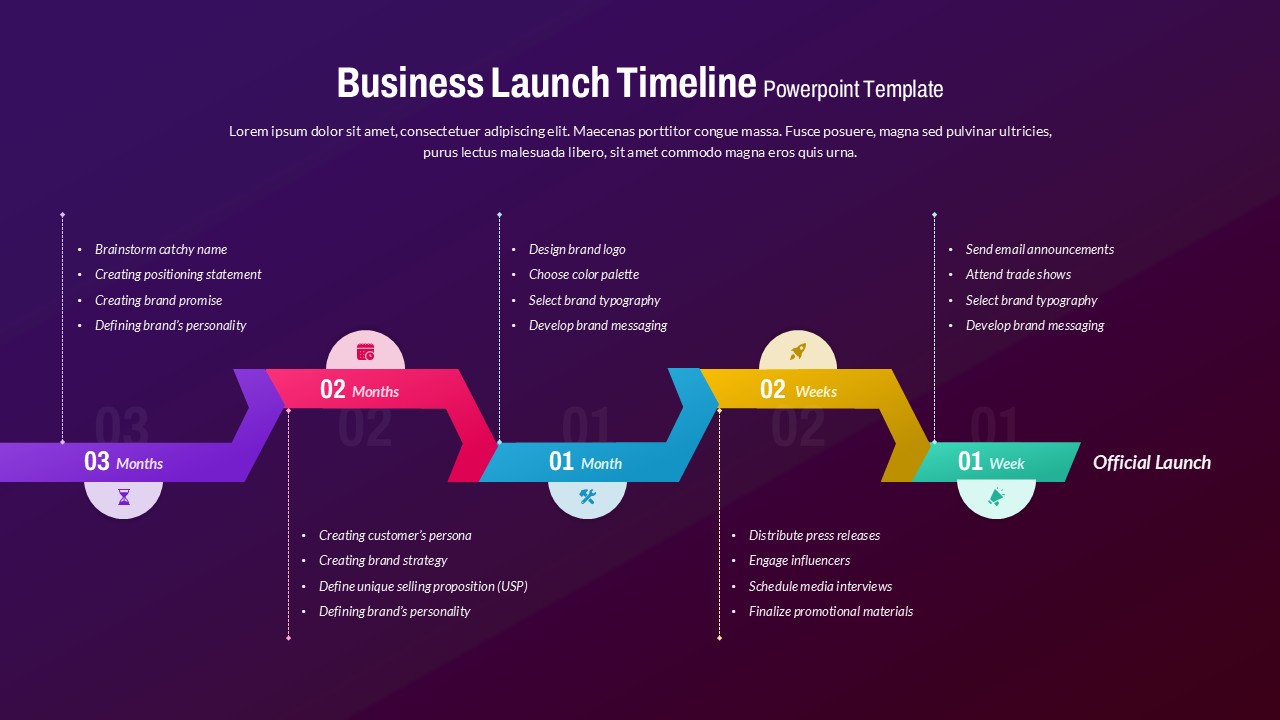
Business Launch Timeline Roadmap 5-Phase Template for PowerPoint & Google Slides
Business
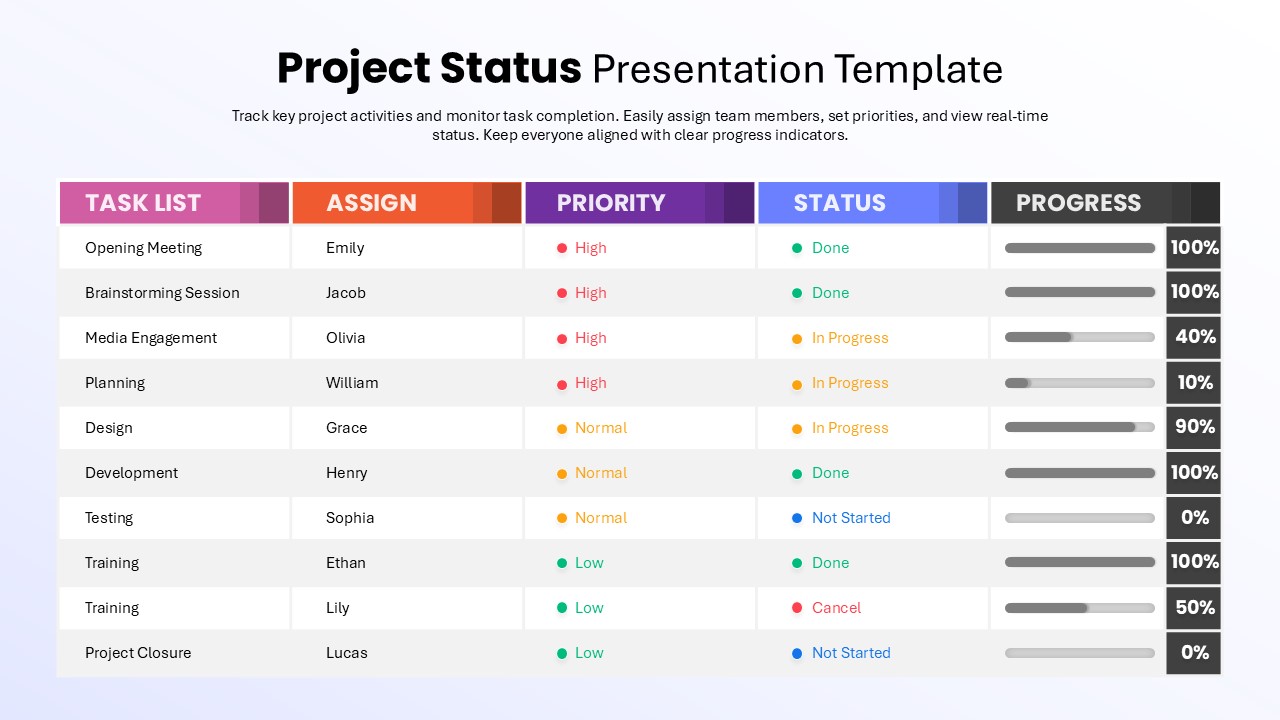
Project Status Dashboard Table Template for PowerPoint & Google Slides
Project Status
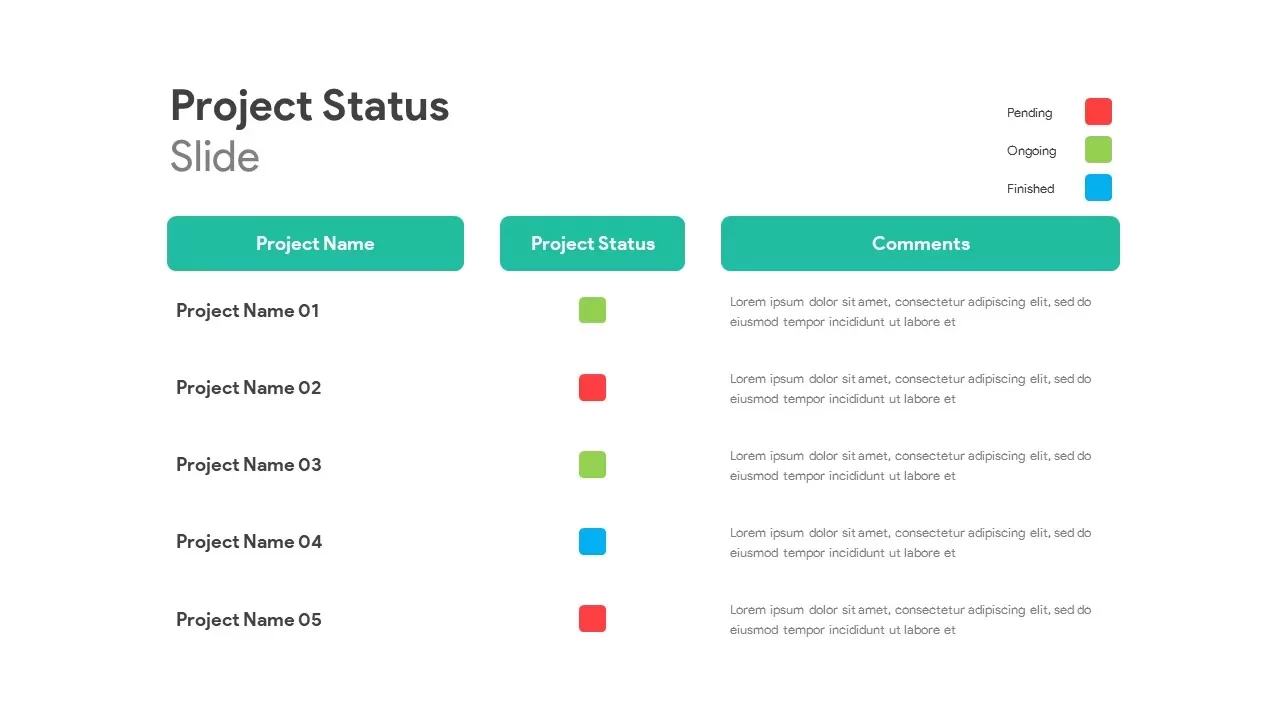
Project Status Table Template for PowerPoint & Google Slides
Project Status
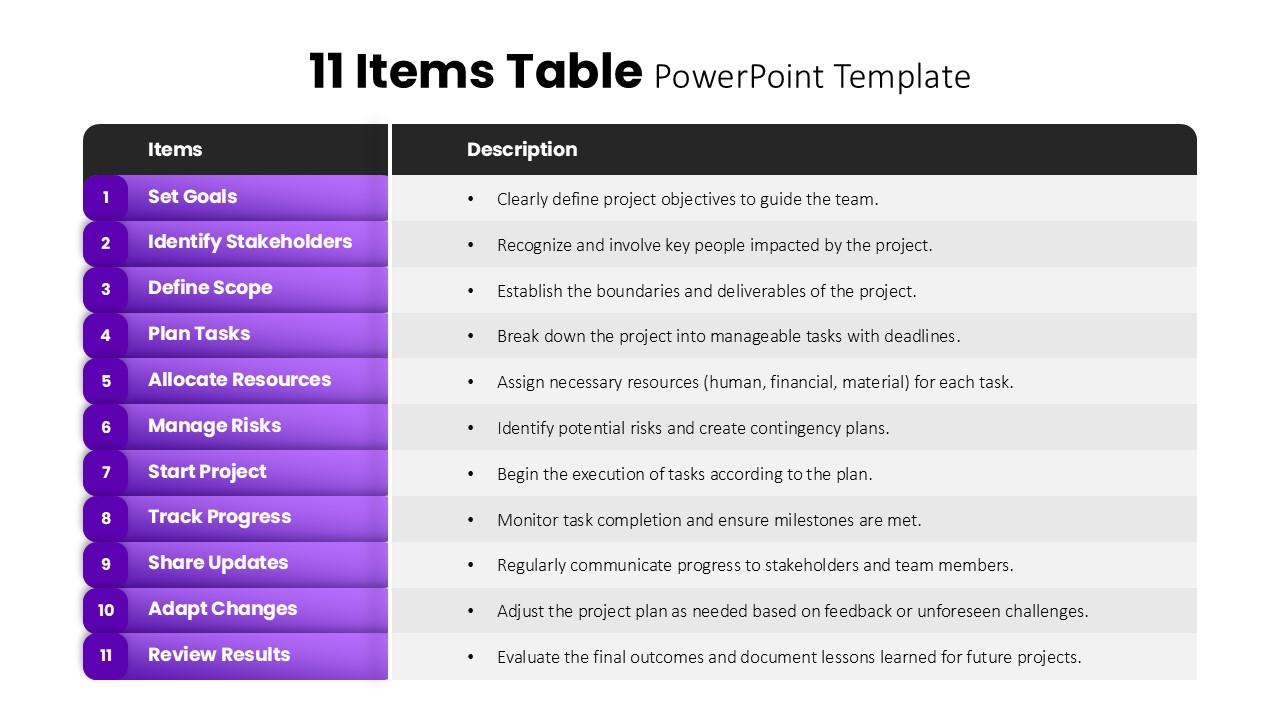
11 Items Table Project Planning Steps template for PowerPoint & Google Slides
Business
Project Tracking Dashboard Table Template for PowerPoint & Google Slides
Project Status
Dynamic Project Status Tracking Table Template for PowerPoint & Google Slides
Project Status
Project Status Update Dashboard Table Template for PowerPoint & Google Slides
Project Status
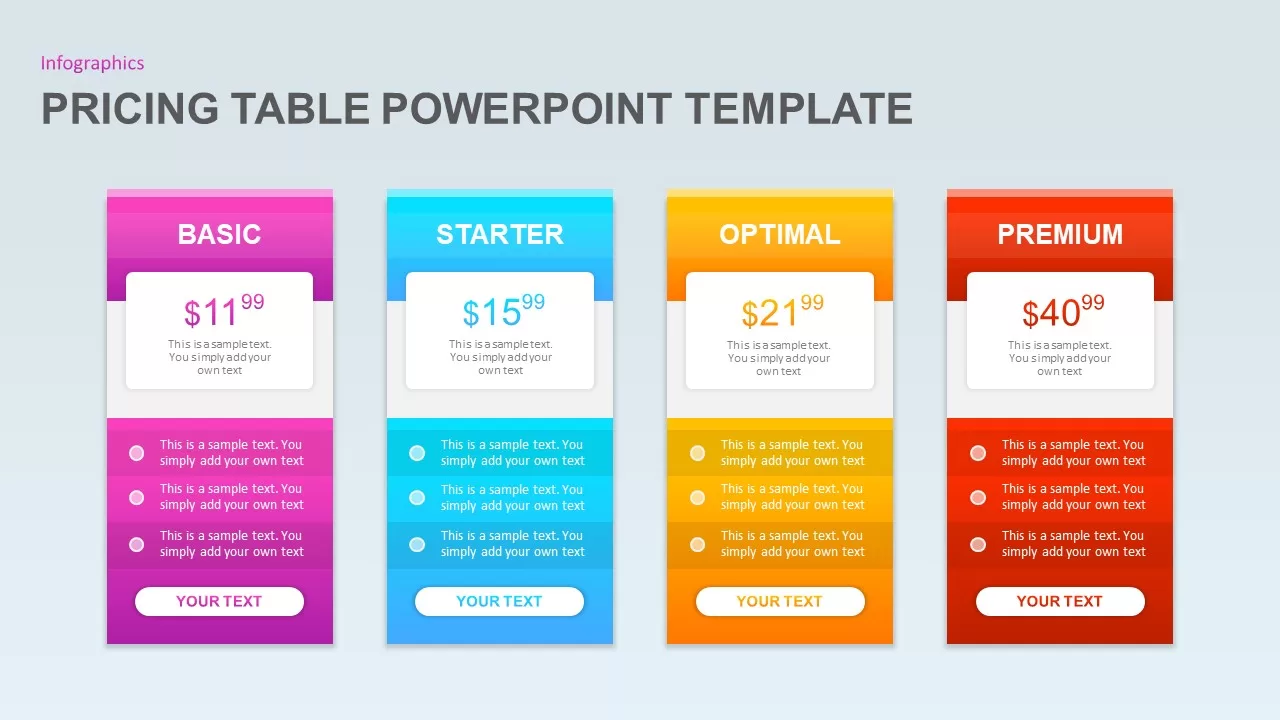
Pricing Table PowerPoint Template for PowerPoint & Google Slides
Infographics
Simple Comparison Table Template for PowerPoint & Google Slides
Comparison
Three-Tier Pricing Table Slide Template for PowerPoint & Google Slides
Comparison
Four-Tier Pricing Comparison Table Template for PowerPoint & Google Slides
Comparison
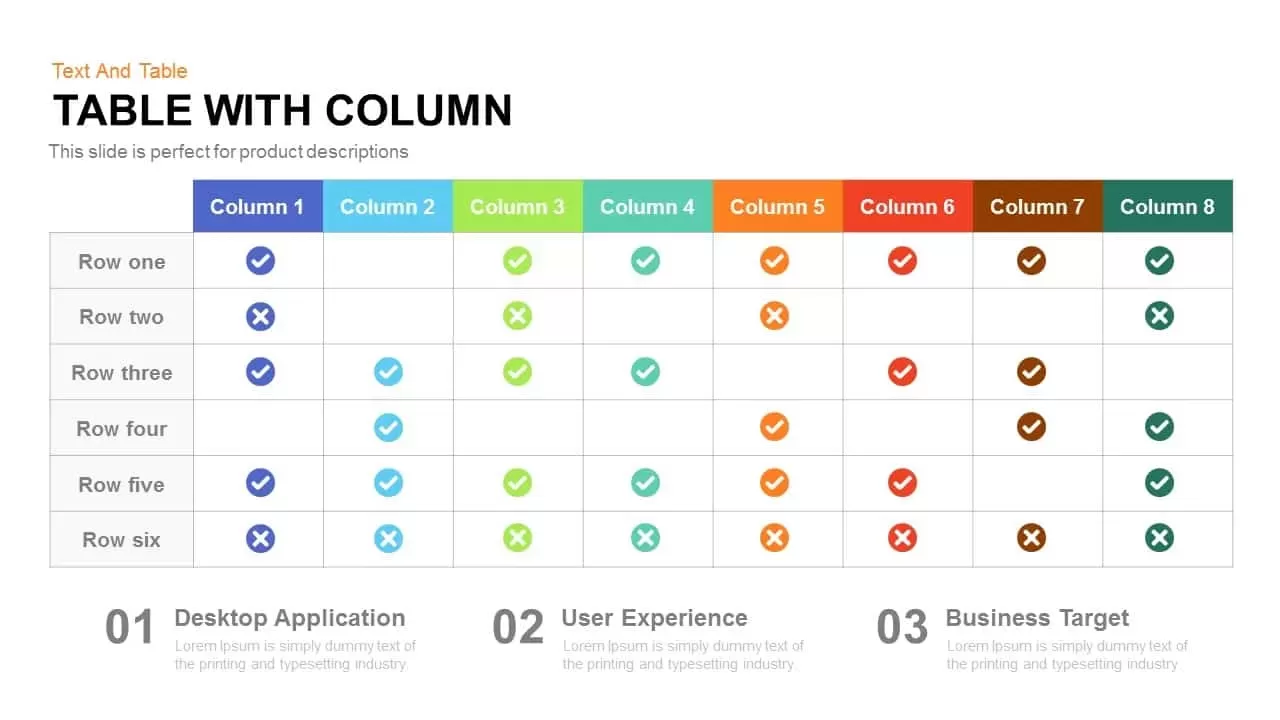
Table with Columns template for PowerPoint & Google Slides
Comparison Chart
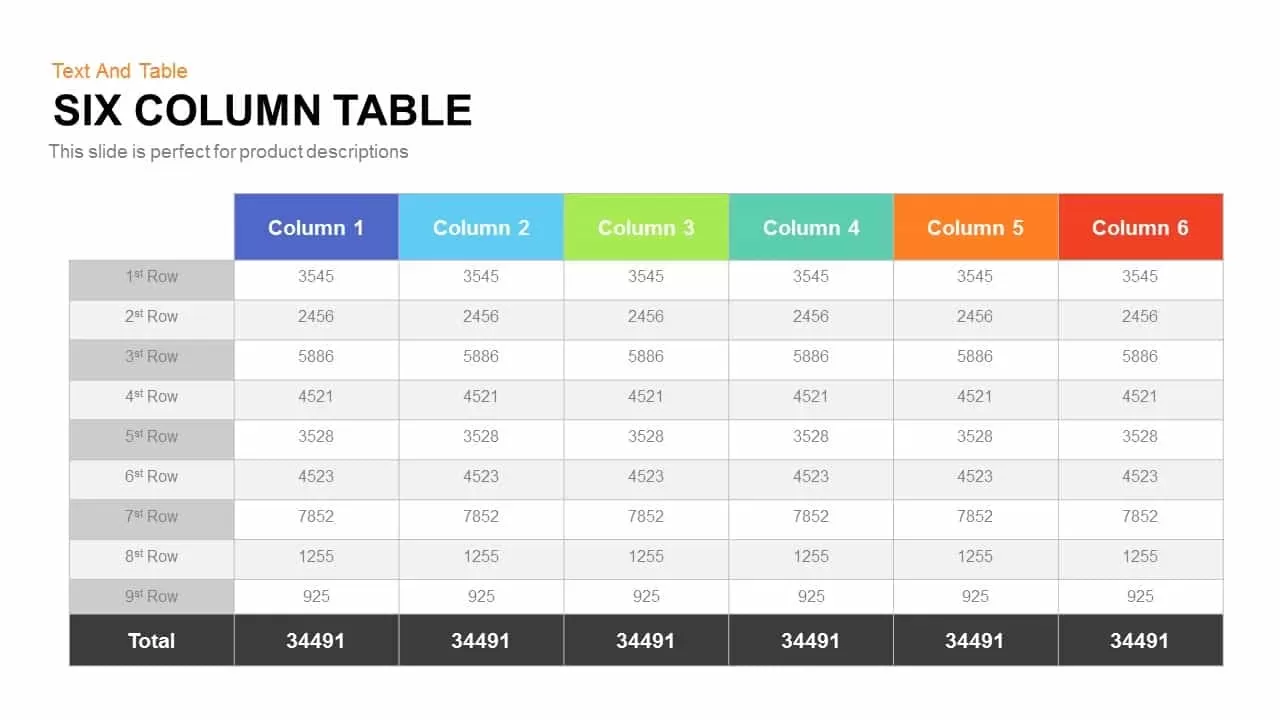
Six Column Table template for PowerPoint & Google Slides
Table
Four-Plan Pricing Table Comparison Template for PowerPoint & Google Slides
Comparison

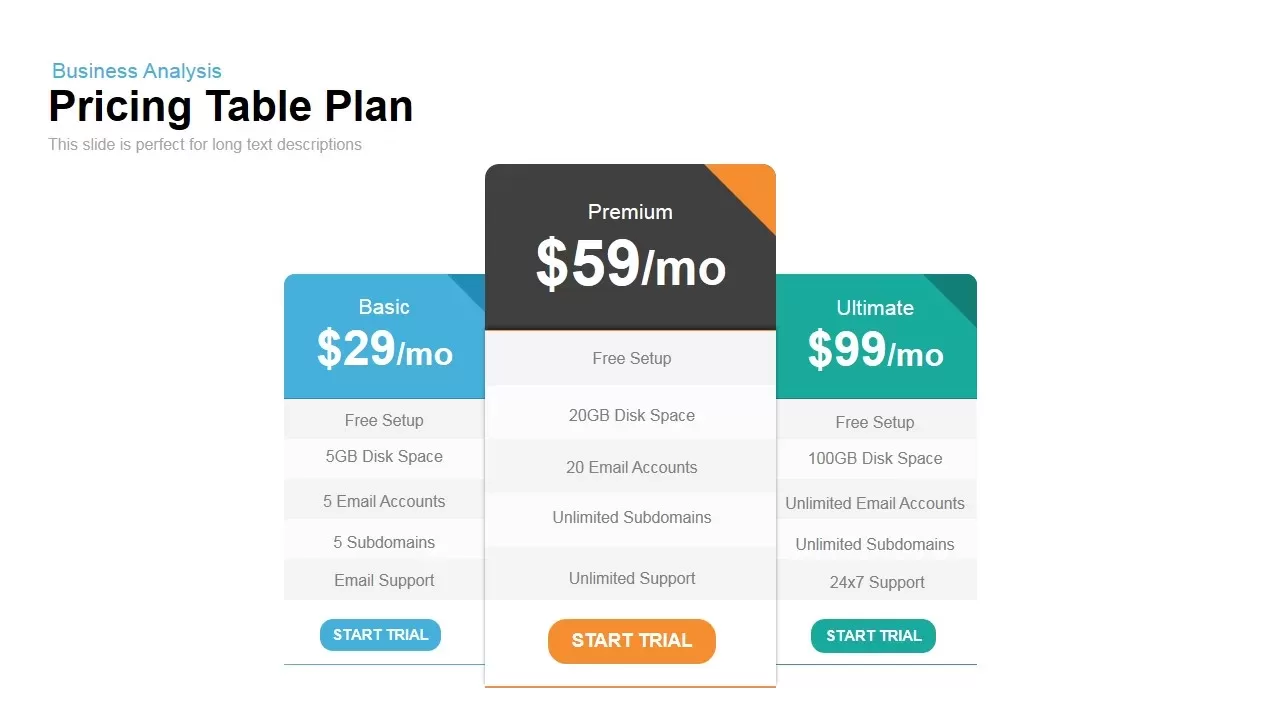
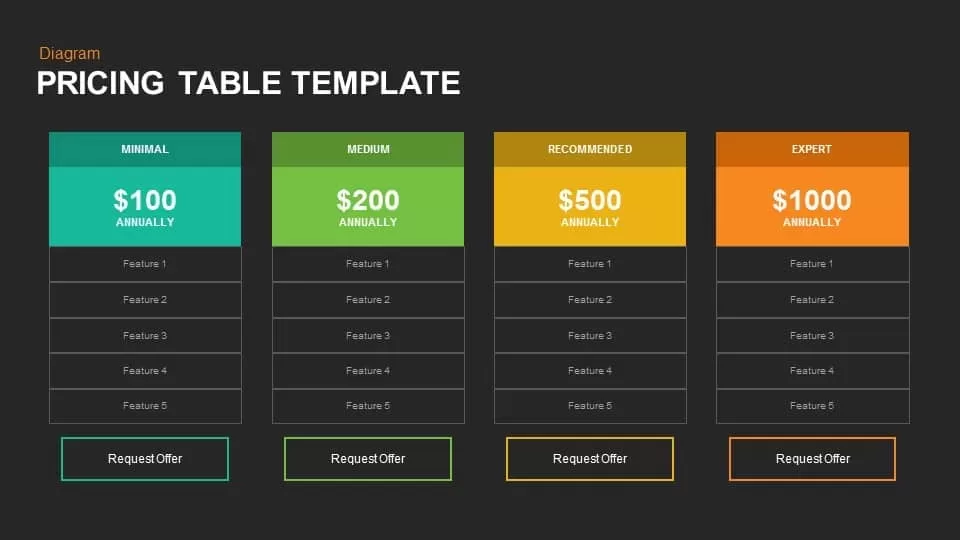
Pricing Table Template for PowerPoint & Google Slides
Business Proposal
Dynamic Multicolor Comparison Table Template for PowerPoint & Google Slides
Comparison
Puzzle-Style SWOT Analysis Table Diagram Template for PowerPoint & Google Slides
SWOT

Comparison Pricing Table Infographic Template for PowerPoint & Google Slides
Comparison Chart
PESTLE Analysis Table Layout Diagram Template for PowerPoint & Google Slides
PEST
Clean Three-Four Column Table Slide Template for PowerPoint & Google Slides
Business Report
Five-Option Text Boxes Table Comparison Template for PowerPoint & Google Slides
Business Report
Four-Stage Business Planning Table Template for PowerPoint & Google Slides
Business Plan
30 60 90 Day Plan Matrix Table Template for PowerPoint & Google Slides
Timeline
30-60-90 Business Plan Table Template for PowerPoint & Google Slides
Timeline
Table of Contents Presentation template for PowerPoint & Google Slides
Agenda
Six-Step Color-Coded Table of Contents Template for PowerPoint & Google Slides
Agenda
Table of Contents Infographic Slide template for PowerPoint & Google Slides
Agenda
Six-Step Table of Contents Infographic Template for PowerPoint & Google Slides
Agenda
Eight-Step Colorful Table of Contents Template for PowerPoint & Google Slides
Infographics
Four-Section Table of Contents Template for PowerPoint & Google Slides
Agenda
Four-Part Table of Contents Infographic Template for PowerPoint & Google Slides
Agenda
Five-Step Table of Contents Presentation Template for PowerPoint & Google Slides
Agenda
Four-Step Numbered Table of Contents Template for PowerPoint & Google Slides
Agenda
Four-Step Table of Contents Presentation Template for PowerPoint & Google Slides
Agenda
Chevron Table of Contents Presentation Template for PowerPoint & Google Slides
Agenda
Four-Step Agenda Table of Contents Template for PowerPoint & Google Slides
Agenda
Modern Four-Step Table of Contents Template for PowerPoint & Google Slides
Agenda
Four-Step Strategic Table of Contents Template for PowerPoint & Google Slides
Agenda
Table of Contents Infographics template for PowerPoint & Google Slides
Company Profile
Income Statement Overview Table Template for PowerPoint & Google Slides
Finance
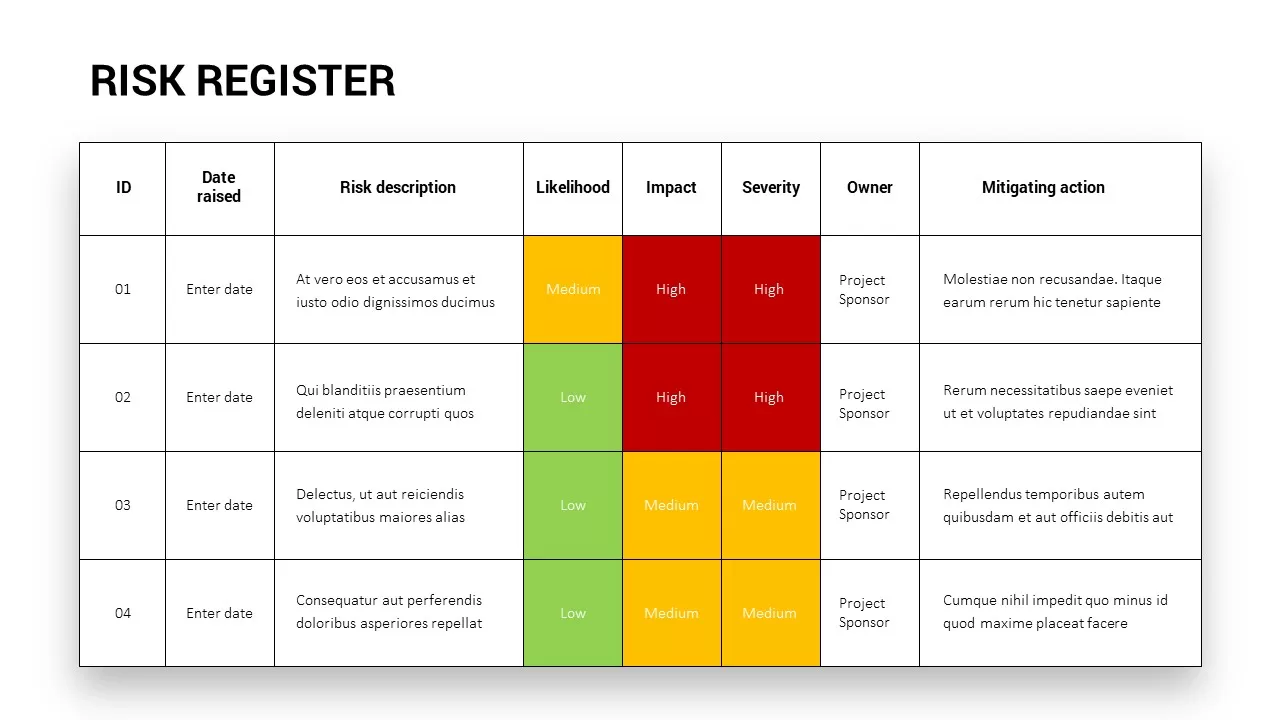
Comprehensive Risk Register Table Template for PowerPoint & Google Slides
Risk Management
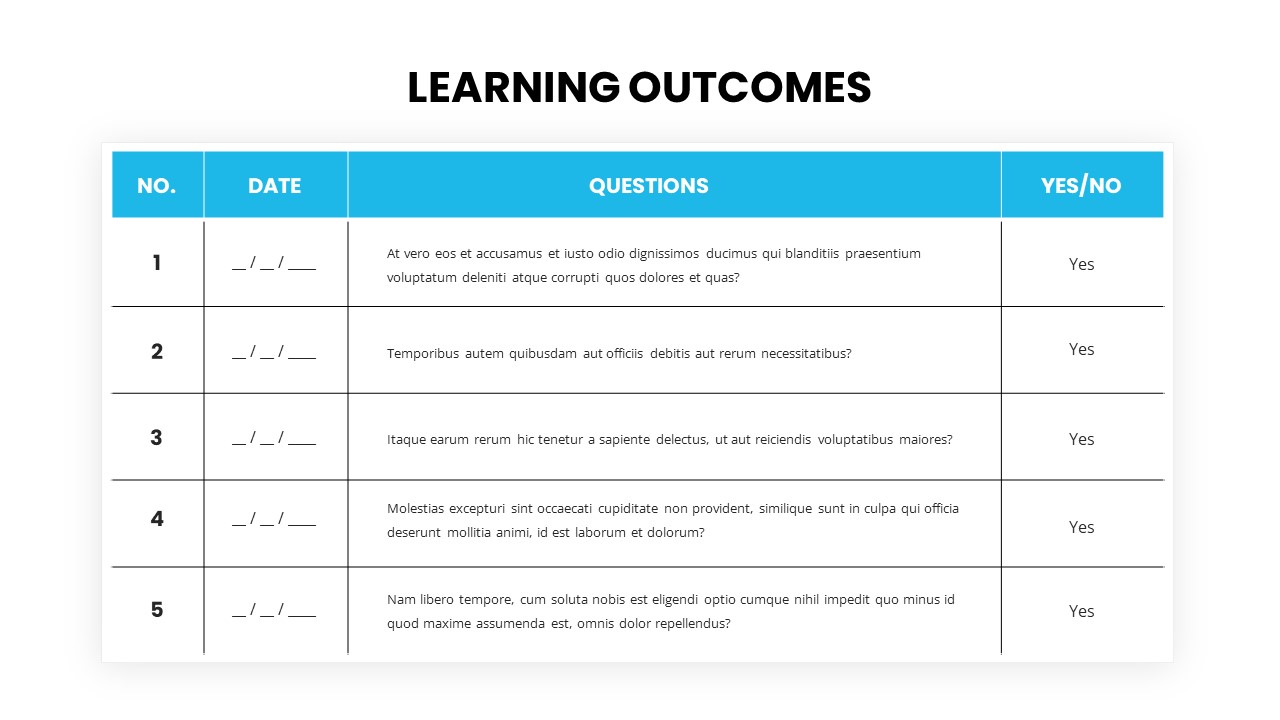
Learning Outcomes table template for PowerPoint & Google Slides
Charts
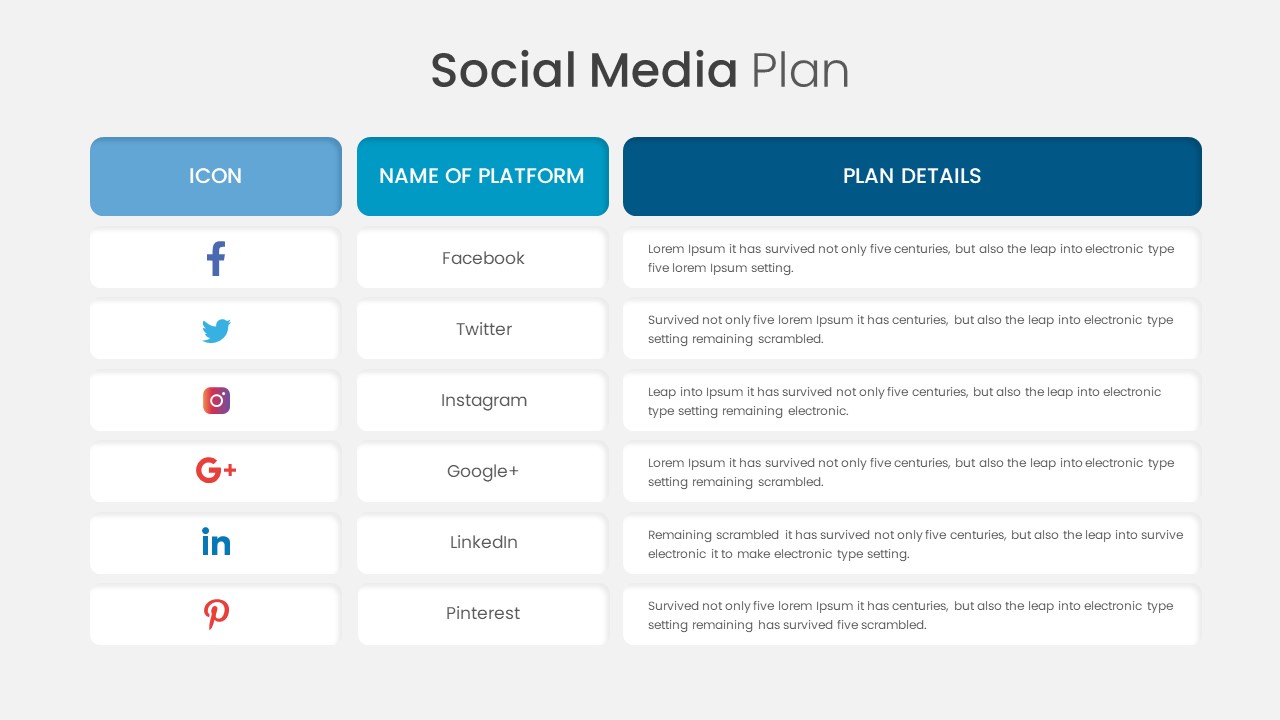
Social Media Plan Table Slide Deck Template for PowerPoint & Google Slides
Process
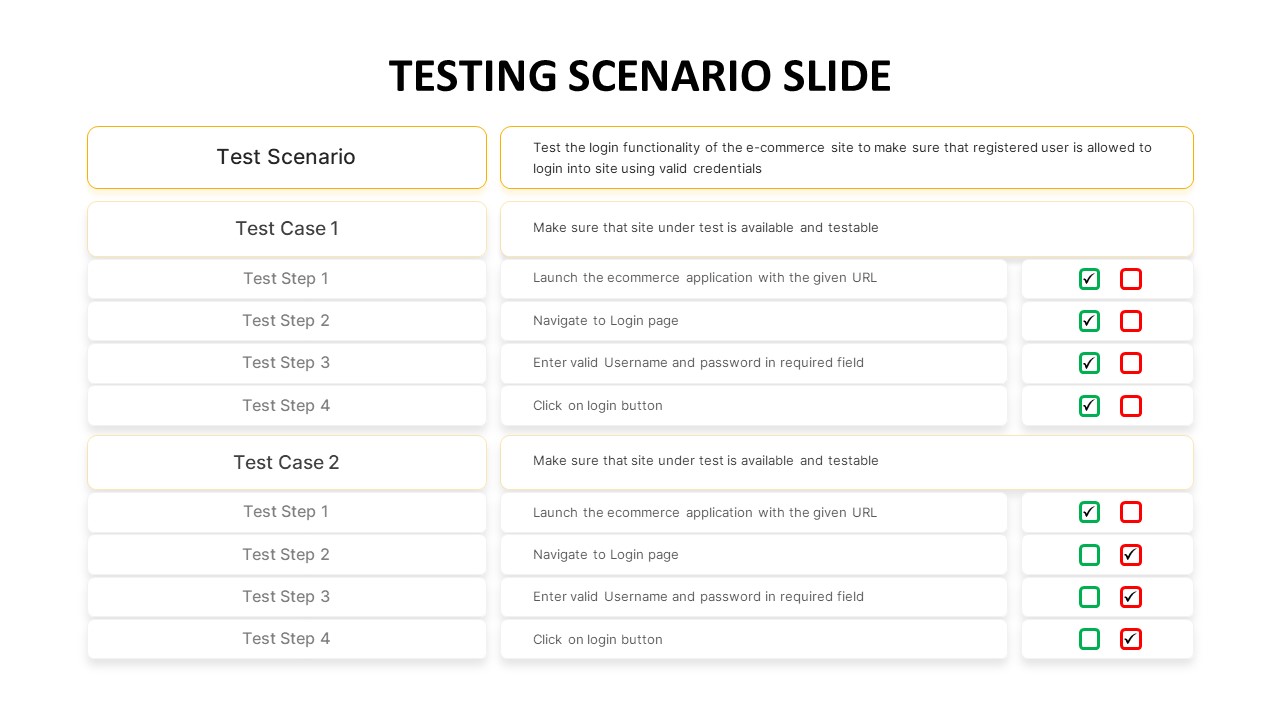
Testing Scenario Table Template for PowerPoint & Google Slides
Business Requirements
Comprehensive Resource Planning Table Template for PowerPoint & Google Slides
Project
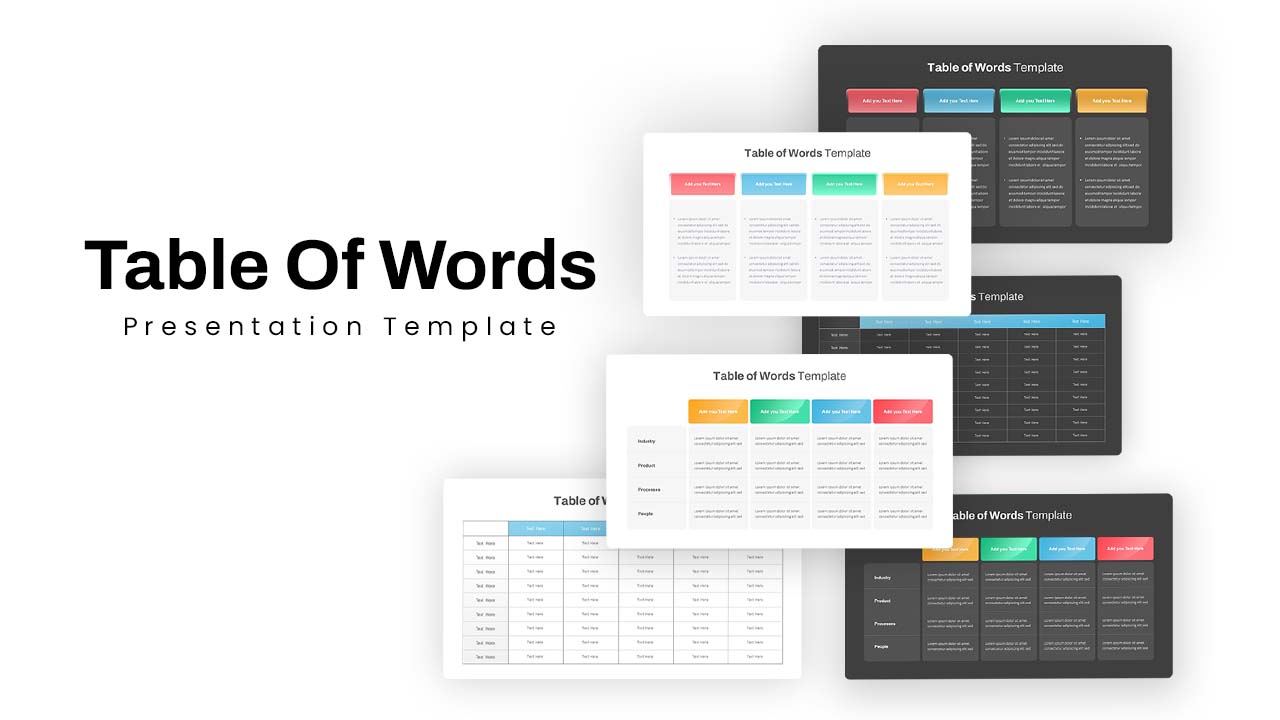
Versatile Table of Words Layout Template for PowerPoint & Google Slides
Table
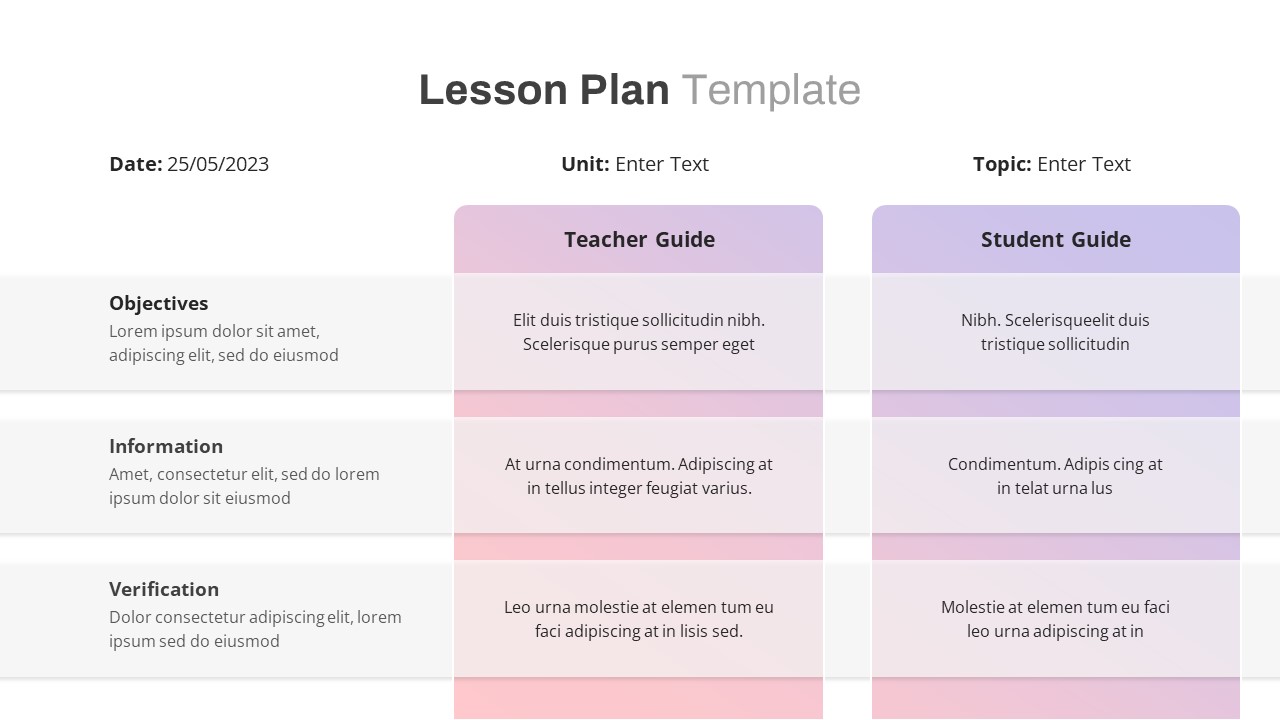
Free Lesson Plan Table Slide Template for PowerPoint & Google Slides
Agenda
Free
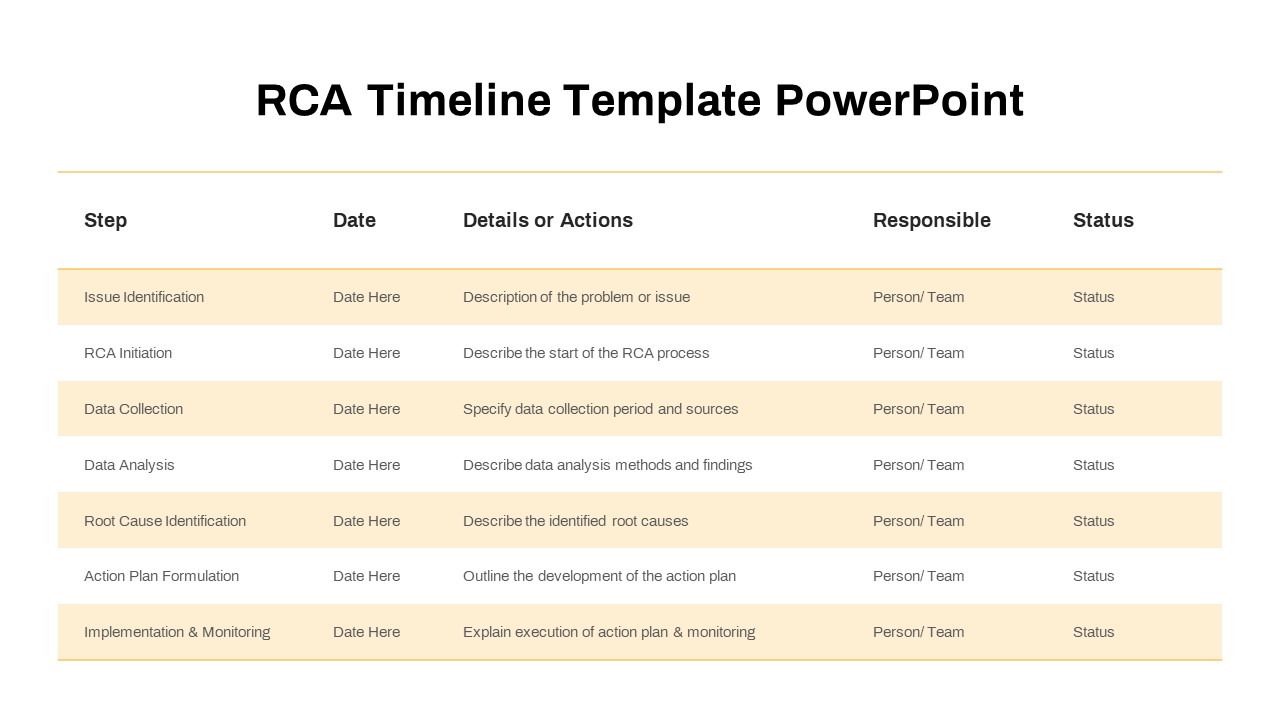
RCA Process Timeline Table Slide Template for PowerPoint & Google Slides
Timeline
Free Minimal Multi-Color Table of Contents Template for PowerPoint & Google Slides
Agenda
Free
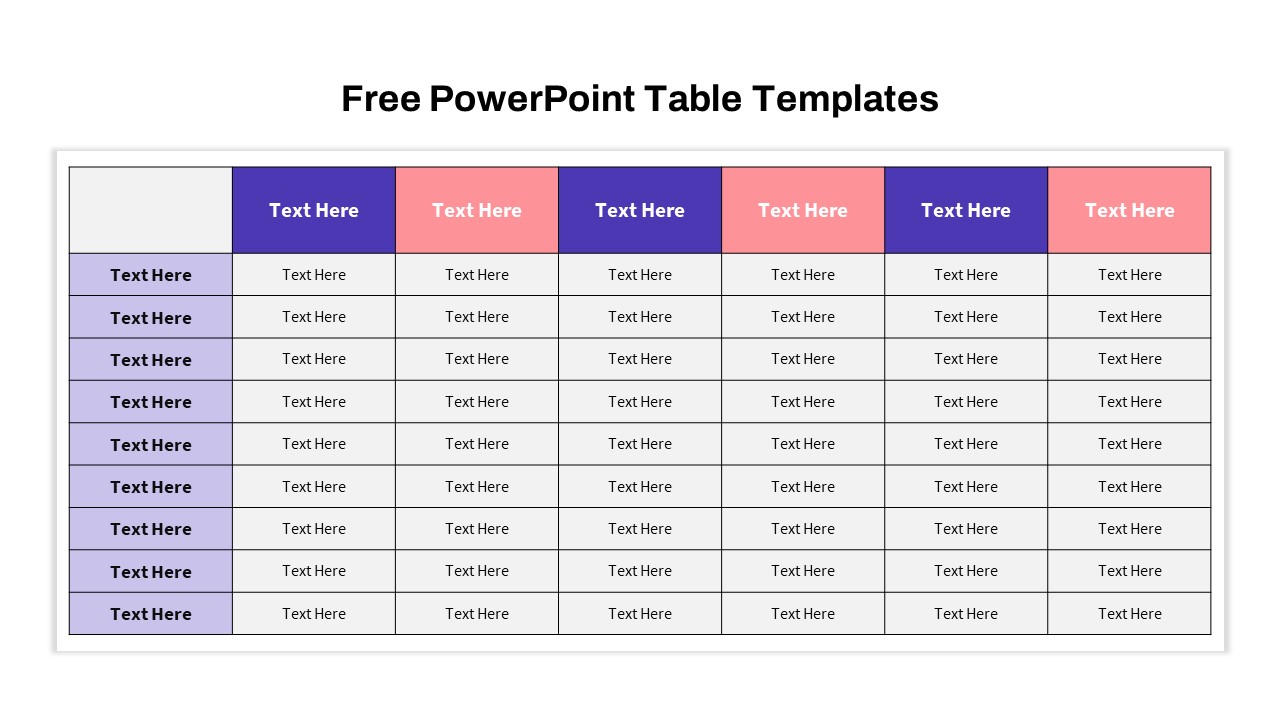
Free Versatile Table Collection Template for PowerPoint & Google Slides
Pitch Deck
Free
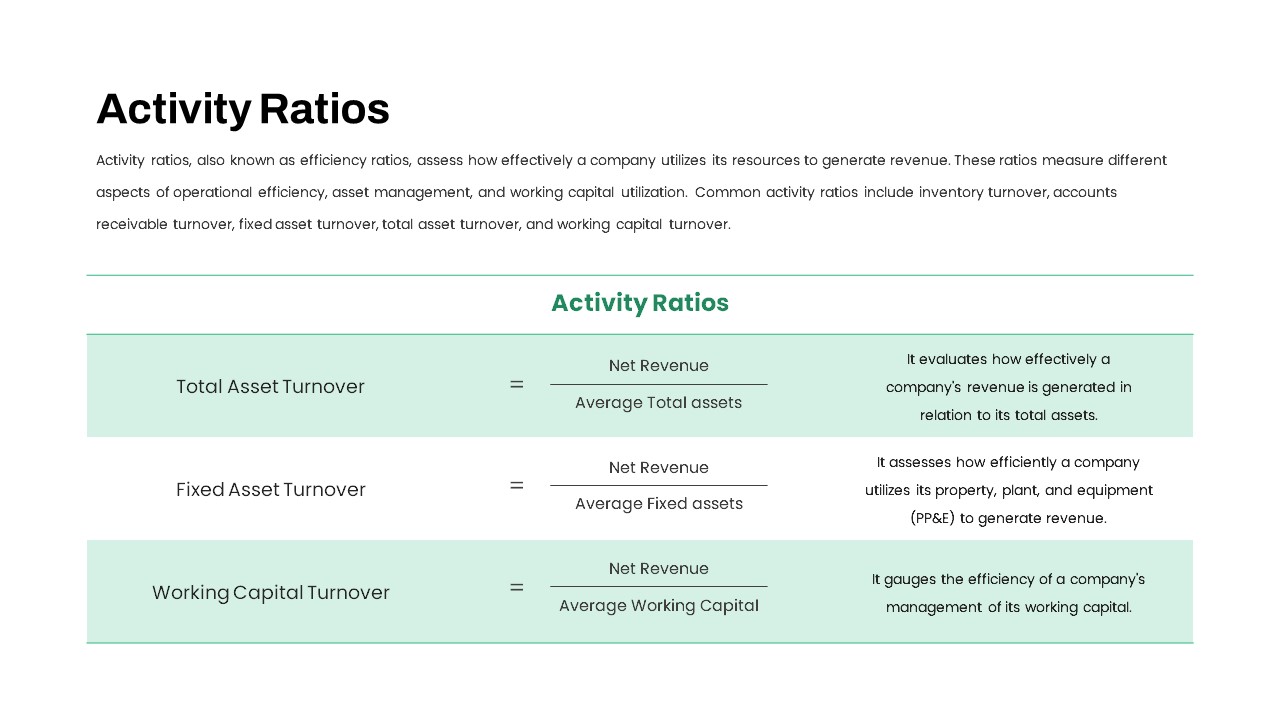
Activity Ratios Formula Table Slide Template for PowerPoint & Google Slides
Comparison Chart
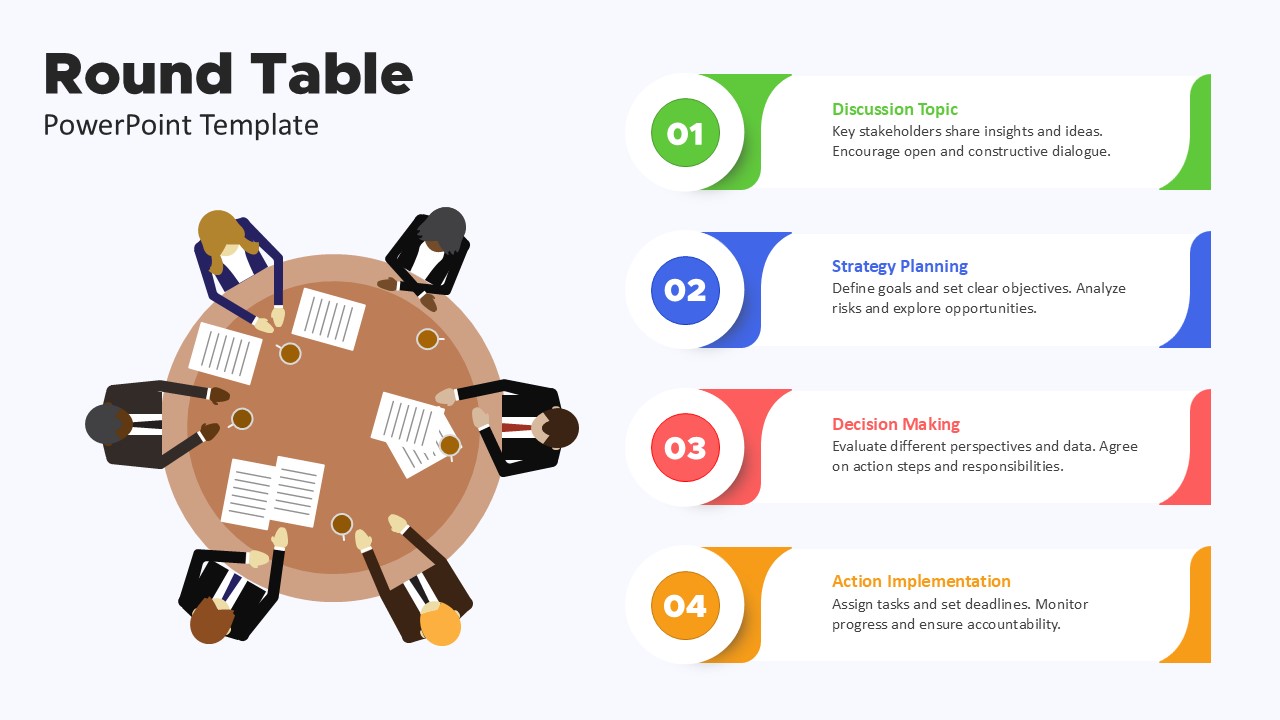
Title: Round Table Meeting Discussion Process Template for PowerPoint & Google Slides
Process
Professional Table of Organization Chart Template for PowerPoint & Google Slides
Org Chart
Two-Option Bar Chart Comparison Table Template for PowerPoint & Google Slides
Comparison
Progression Track Milestone Table Template for PowerPoint & Google Slides
Project Status
Product Feature Comparison Table Template for PowerPoint & Google Slides
Comparison Chart
Sales Growth Comparison Chart & Table Template for PowerPoint & Google Slides
Bar/Column
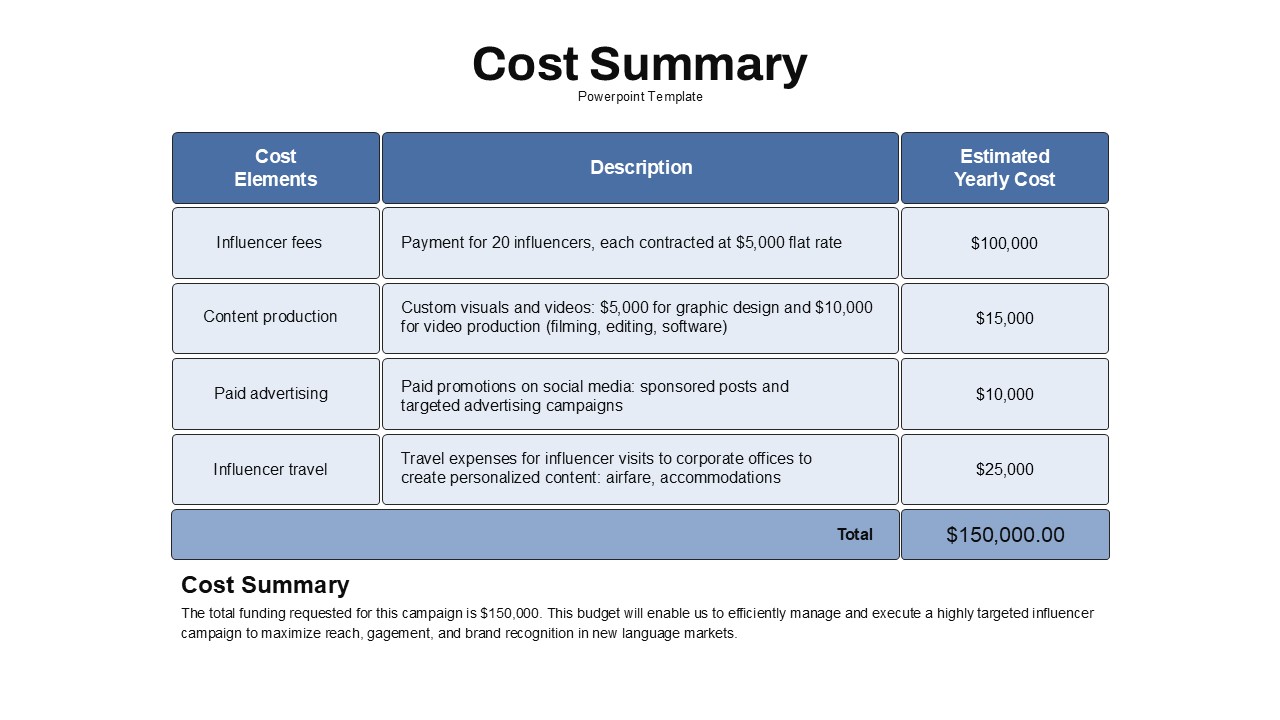
Cost Summary Table Template for PowerPoint & Google Slides
Business Report
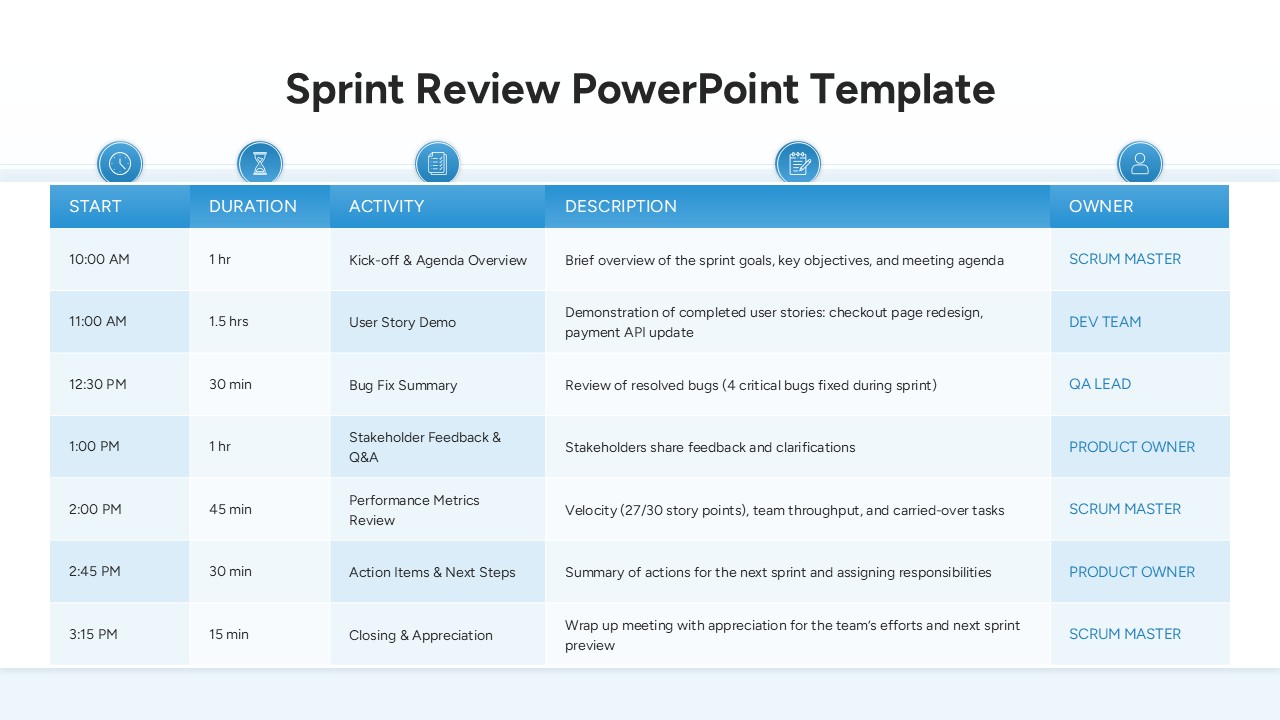
Sprint Review Meeting Agenda Table Template for PowerPoint & Google Slides
Agenda
Action Items Management Dashboard Table Template for PowerPoint & Google Slides
Project Status
Comprehensive Action Tracker Table Template for PowerPoint & Google Slides
Business
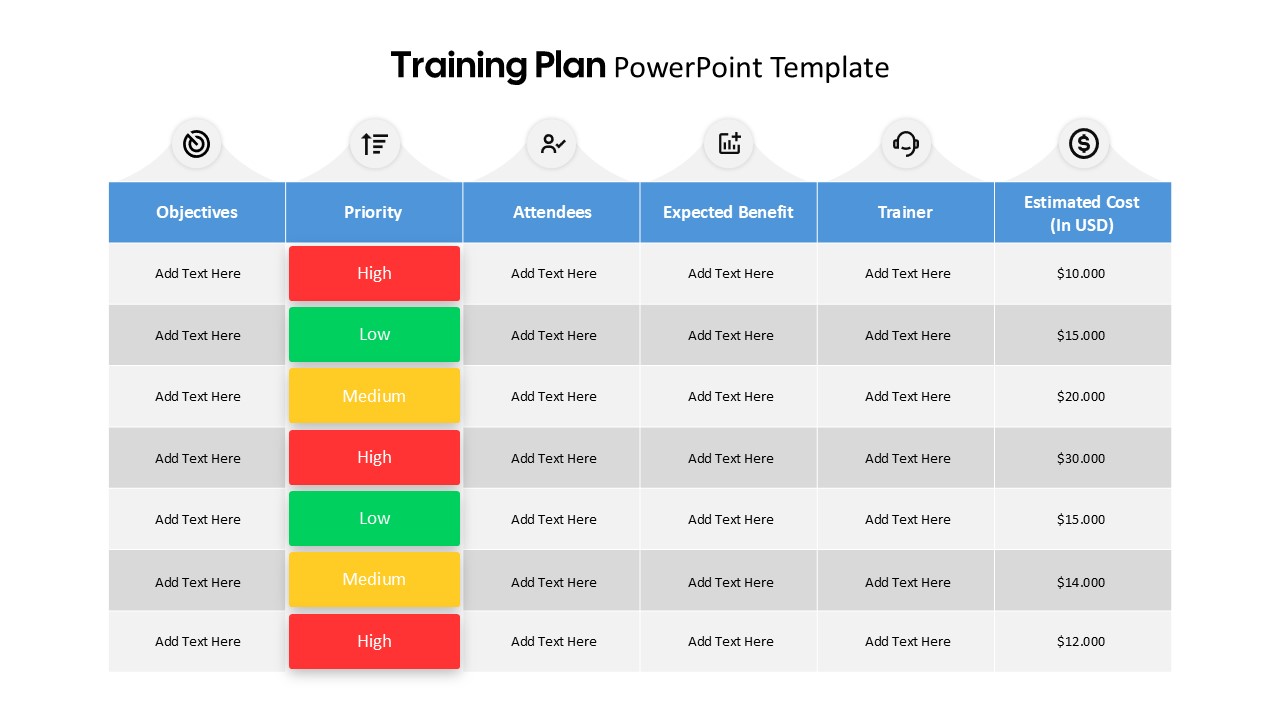
Training Plan Table Layout Template for PowerPoint & Google Slides
Employee Performance
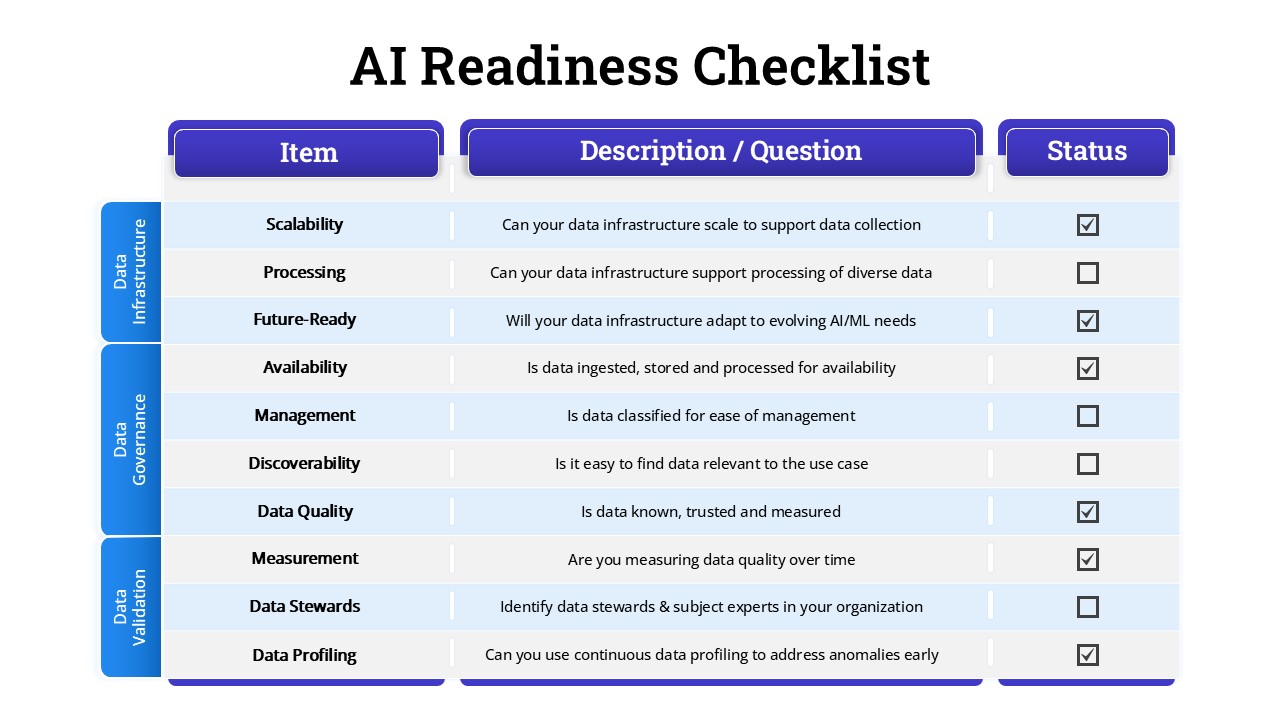
AI Readiness Checklist Table Slide Template for PowerPoint & Google Slides
Process
Business Data Table Template for PowerPoint & Google Slides
Table
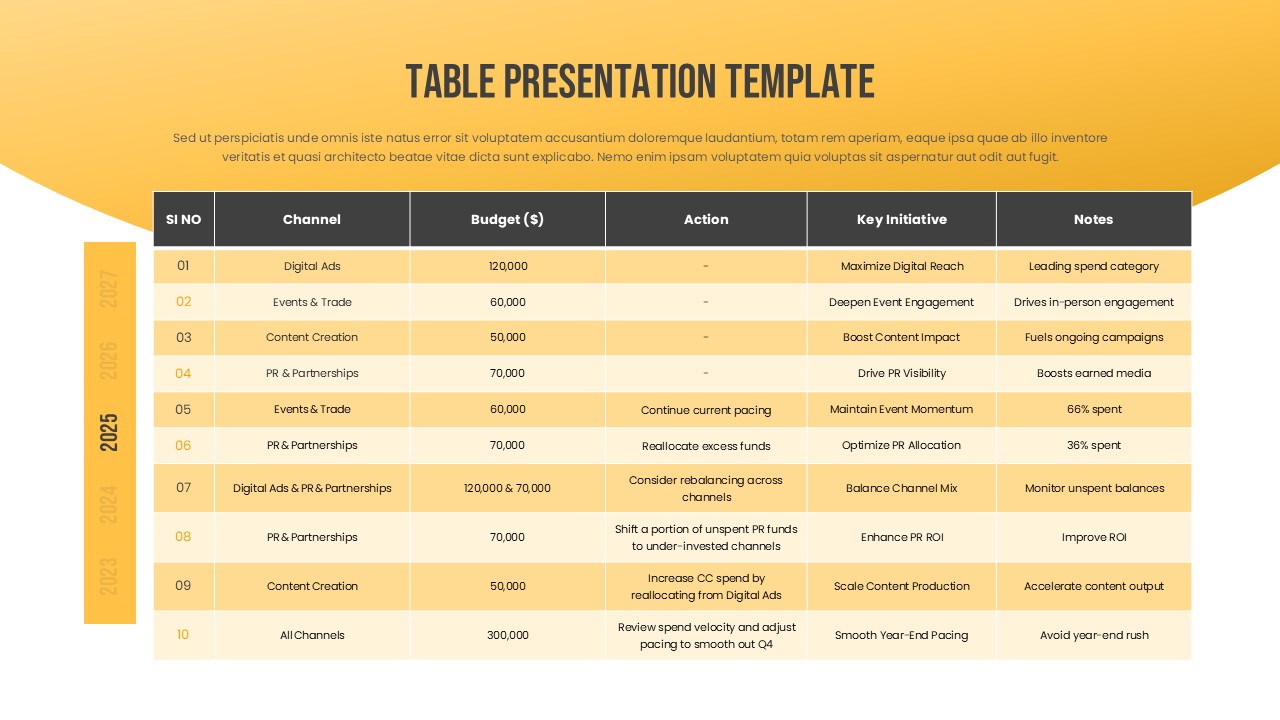
Multi-Column Table Presentation Template for PowerPoint & Google Slides
Table
Comparison Table Presentation Template for PowerPoint & Google Slides
Table
Marketing Budget Table Template for PowerPoint & Google Slides
Business
Six-Row Multi-Column Table Presentation Template for PowerPoint & Google Slides
Table
Colorful Comparison Table Presentation Template for PowerPoint & Google Slides
Table
Colorful Four-Column Table Layout Template for PowerPoint & Google Slides
Table
Colorful Business Data Comparison Table Template for PowerPoint & Google Slides
Table
Five Column Comparison Table Layout Template for PowerPoint & Google Slides
Comparison
Blank Table Template for PowerPoint & Google Slides
Table
Two-Column Table Presentation Template for PowerPoint & Google Slides
Table
Six Column Data Table Template for PowerPoint & Google Slides
Table
Colorful Table Presentation Template for PowerPoint & Google Slides
Table
Pros and Cons Comparison Table Template for PowerPoint & Google Slides
Comparison Chart
Creative Table Template for PowerPoint & Google Slides
Table

Pricing Plans Table for PowerPoint & Google Slides
Business Proposal
3D Column Chart with Data Table for PowerPoint & Google Slides
Bar/Column
Five Column Table Infographics for PowerPoint & Google Slides
Business
Modern Project Status Report Dashboard Template for PowerPoint & Google Slides
Project Status