Modern Gear Venn Diagram Infographic Template for PowerPoint & Google Slides

Description
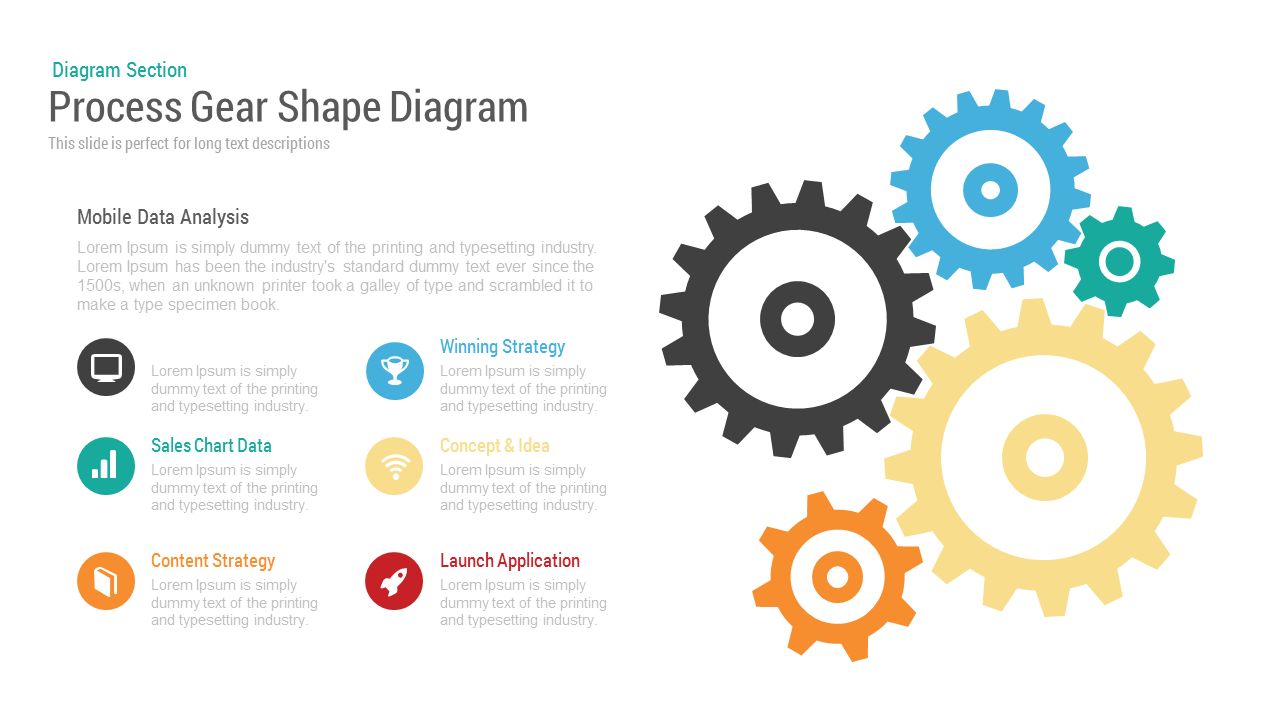
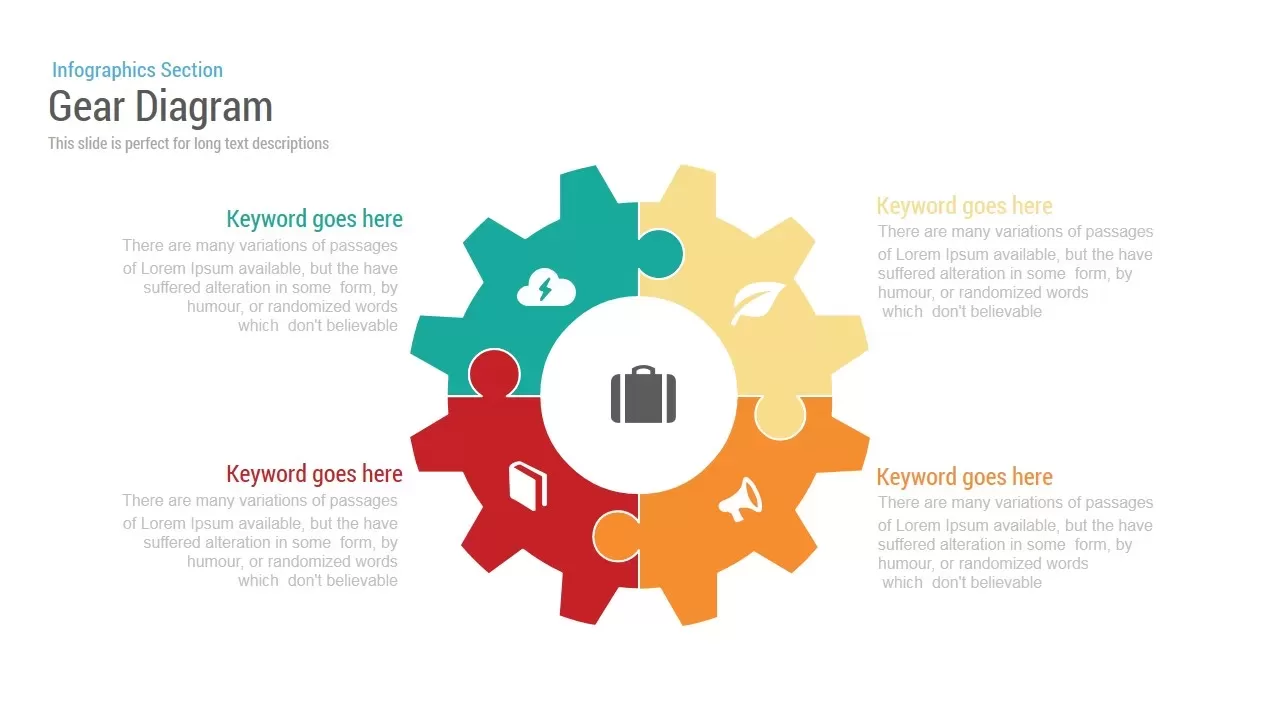
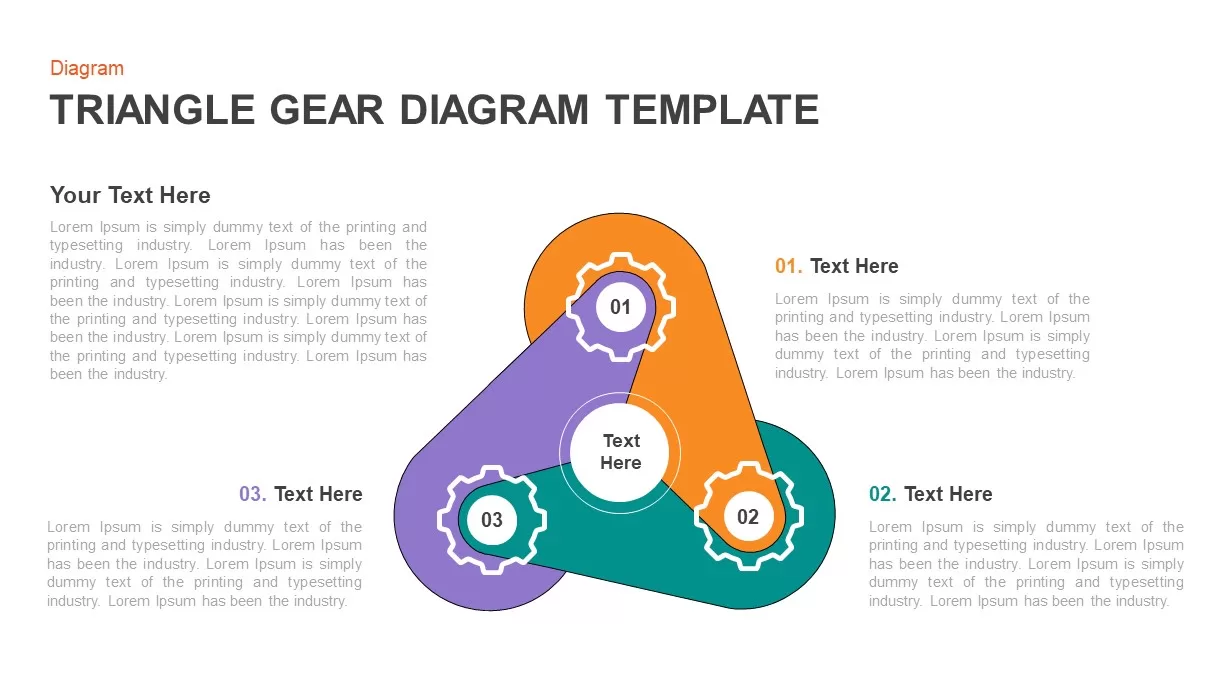
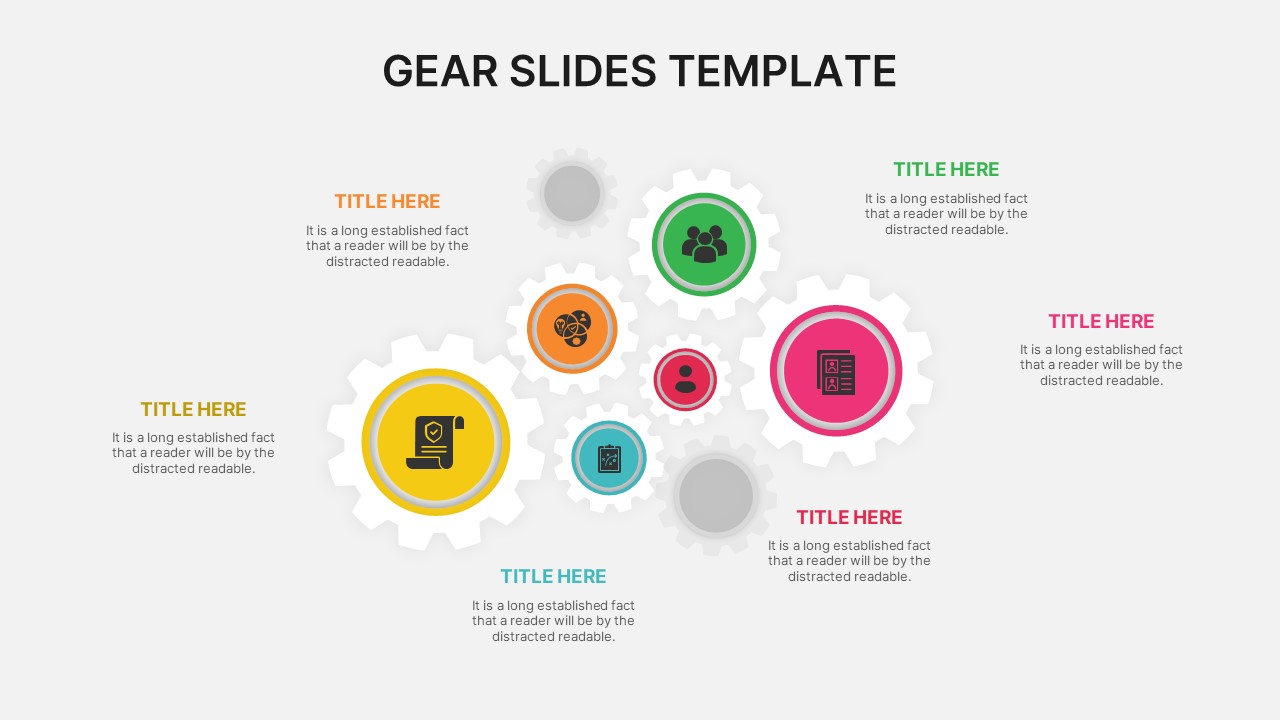
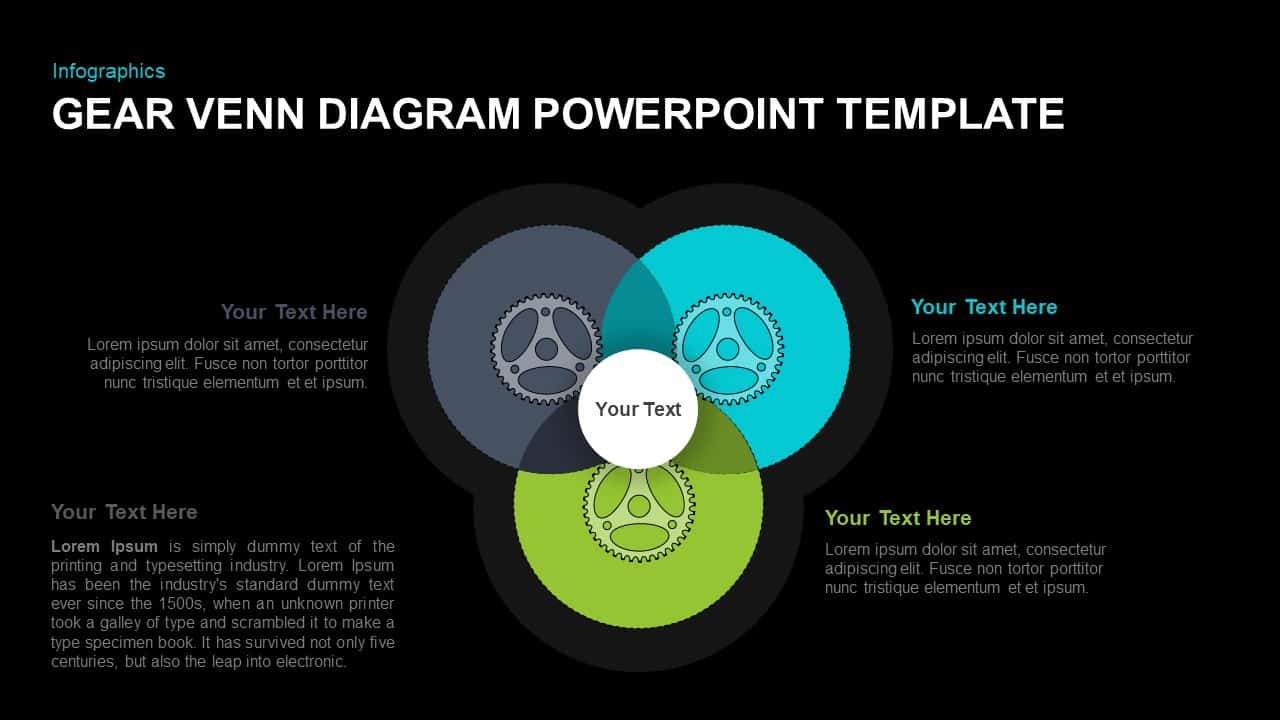
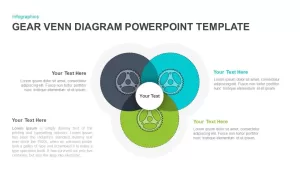
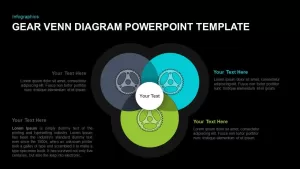
This modern gear Venn diagram infographic template visualizes the intersection of three core domains with interlocking, high-resolution vector gears. Each circle is shaded in a distinct hue—dark gray, cyan, and green—overlapping to create transparent blend areas that emphasize shared attributes or collaborative processes. A central white circle sits at the convergence point, serving as a placeholder for your main idea, KPI, or project name. Built on master slides, every element is fully editable: recolor the gear segments, rotate or resize shapes, adjust transparency levels, swap in custom icons, and update text placeholders without affecting alignment, thanks to integrated snap-to-grid guides and grouped layers.
Optimized for both PowerPoint and Google Slides, this infographic preserves crisp visuals across devices and supports seamless cloud collaboration. Use drag-and-drop functionality to import logos or photographs into each gear, or duplicate the slide to compare multiple Venn scenarios side by side. The minimalist white background and clean typography ensure your data remains front and center, while subtle shadows and fine outlines add depth without clutter. Whether you’re mapping product feature overlaps, stakeholder responsibilities, or cross-functional team capabilities, this template turns complex relationships into an engaging, easy-to-follow visual narrative.
Who is it for
Business analysts, project managers, marketing teams, and consultants who need to illustrate overlapping strategies, resource allocations, or shared objectives in executive briefings, workshops, or client presentations.
Other Uses
Repurpose this diagram for competitive analyses, risk-mitigation planning, service portfolio comparisons, organizational skill assessments, or educational frameworks that require clear depiction of intersecting elements.
Login to download this file

Item ID
SB01571
Related Templates

Modern Growth Hacking Venn Diagram Template for PowerPoint & Google Slides
Circular
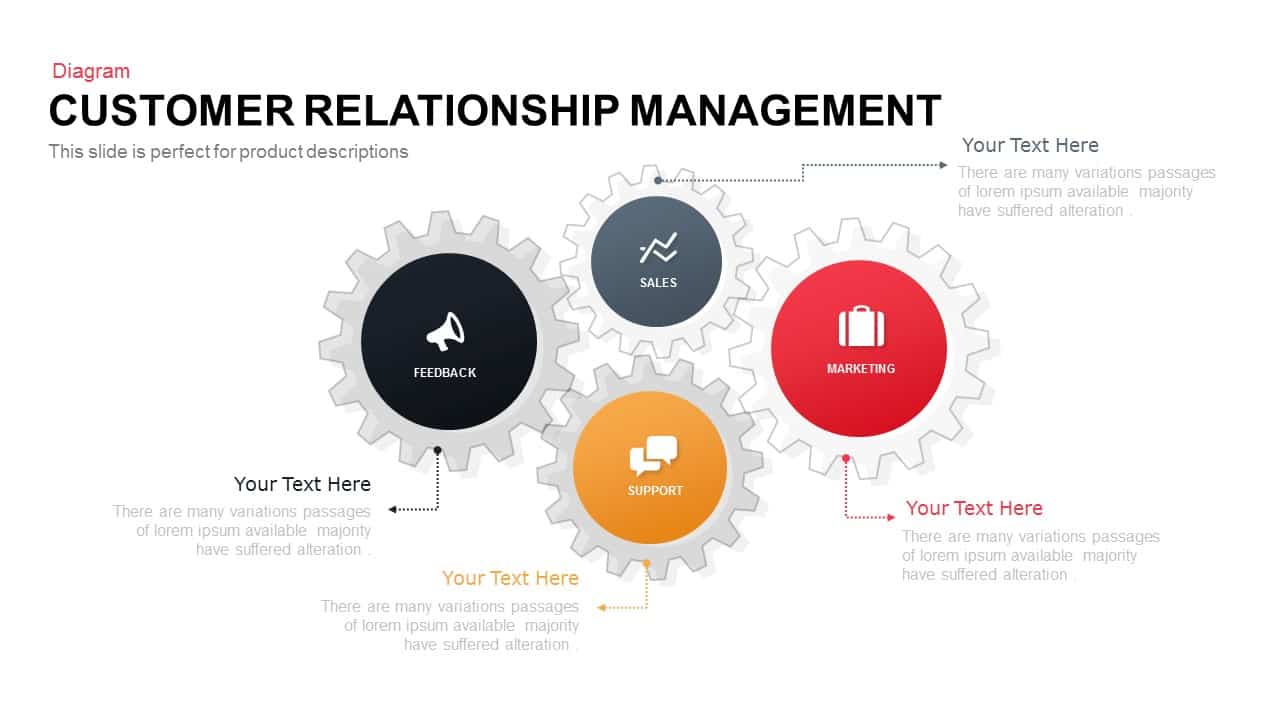
Colorful Modern CRM Gear Diagram Template for PowerPoint & Google Slides
Customer Experience

Modern Four Stage Gear Diagram Template for PowerPoint & Google Slides
Process
8 Circle Venn Diagram Infographic Design Template for PowerPoint & Google Slides
Circular
Salience Model Venn Diagram Infographic Template for PowerPoint & Google Slides
Circular
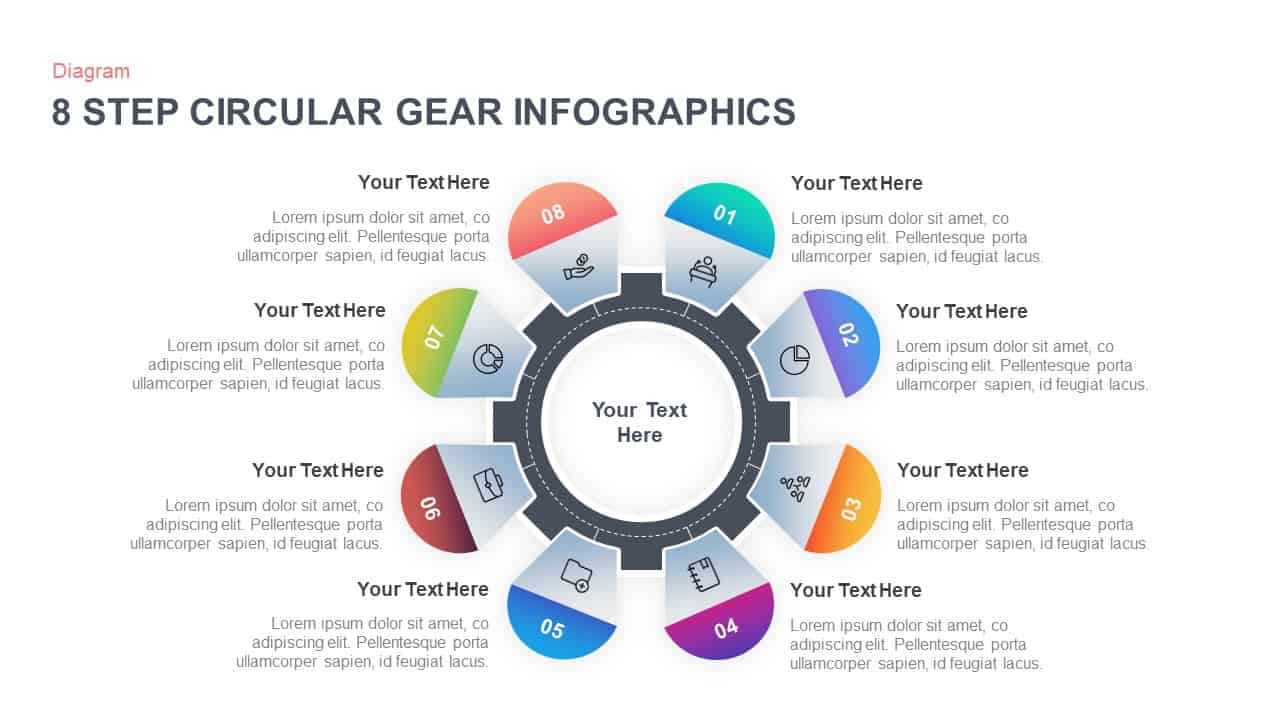
8-Step Circular Gear Infographic Diagram Template for PowerPoint & Google Slides
Circular
6-Part Circular Gear Infographic Diagram Template for PowerPoint & Google Slides
Process

Four-Circle Venn Process Diagram template for PowerPoint & Google Slides
Process
Venn Diagram Infographics Pack Template for PowerPoint & Google Slides
Circular
Creative Three-Circle Venn Diagram Template for PowerPoint & Google Slides
Comparison
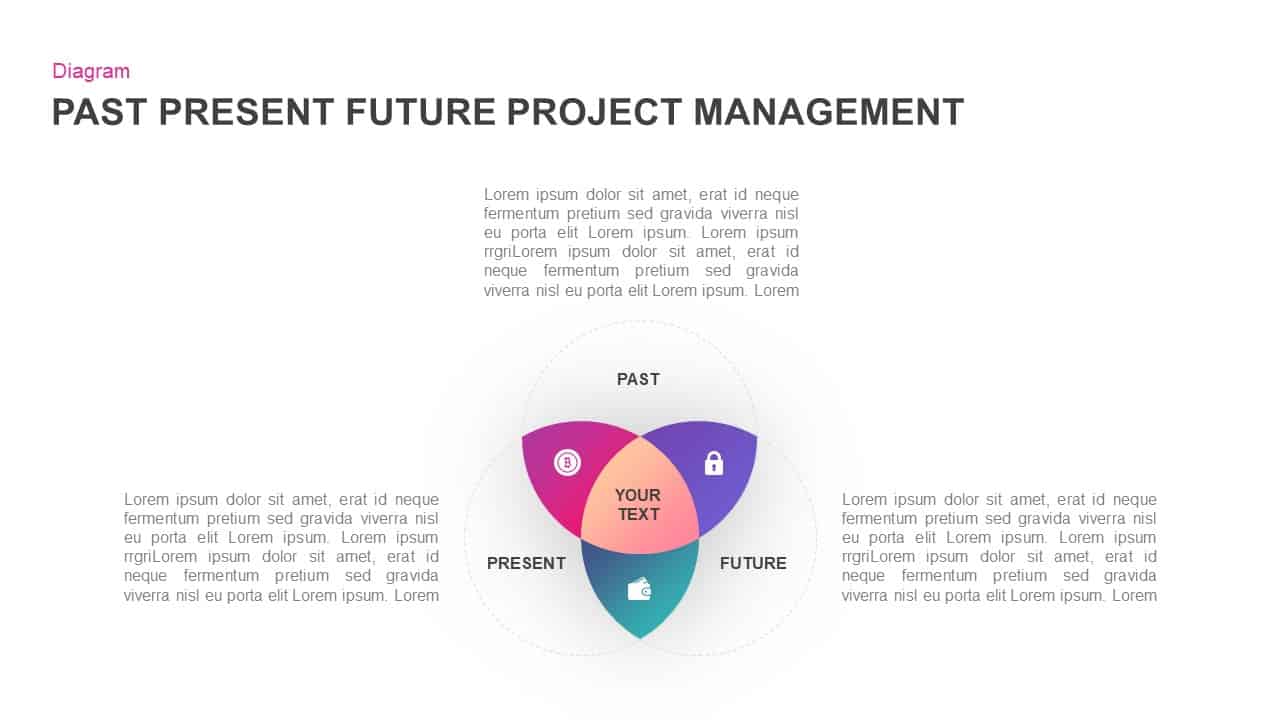
Past, Present & Future Venn Diagram Template for PowerPoint & Google Slides
Comparison
Colorful Venn Diagram Infographics Template for PowerPoint & Google Slides
Circular
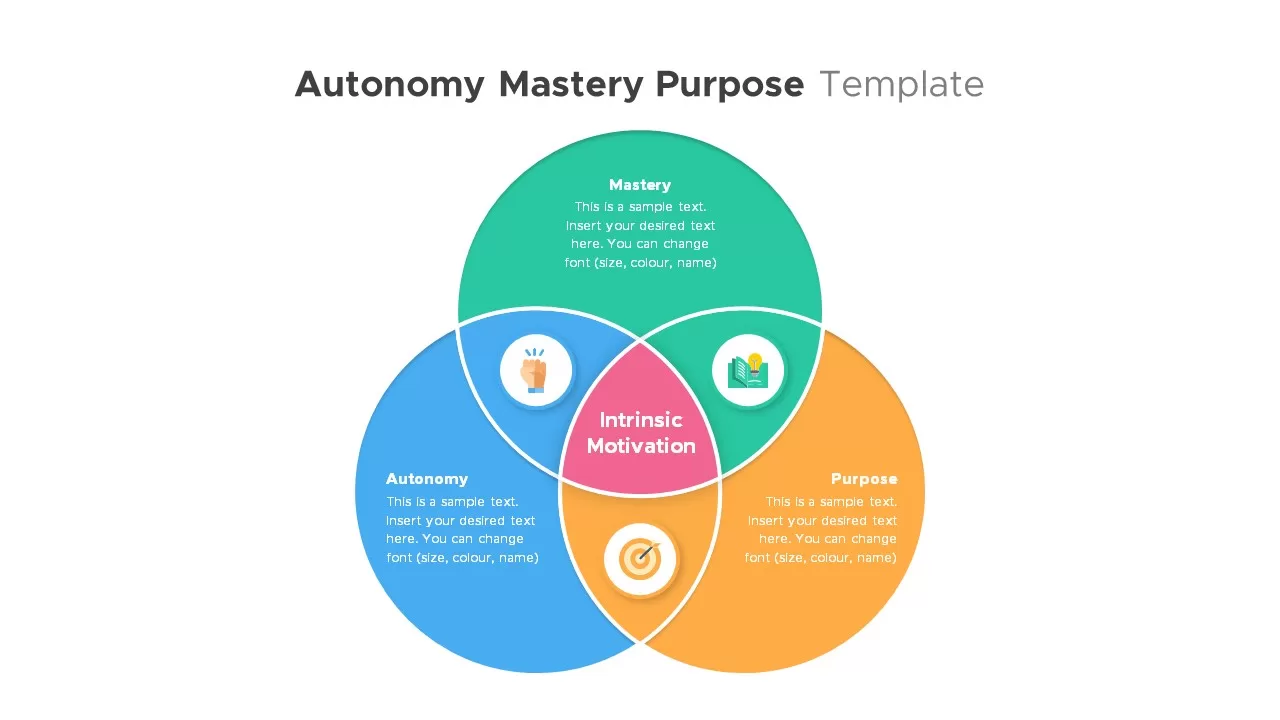
Autonomy, Mastery & Purpose Venn Diagram Template for PowerPoint & Google Slides
Circular
Free Simple Venn Diagram Overview template for PowerPoint & Google Slides
Comparison Chart
Free
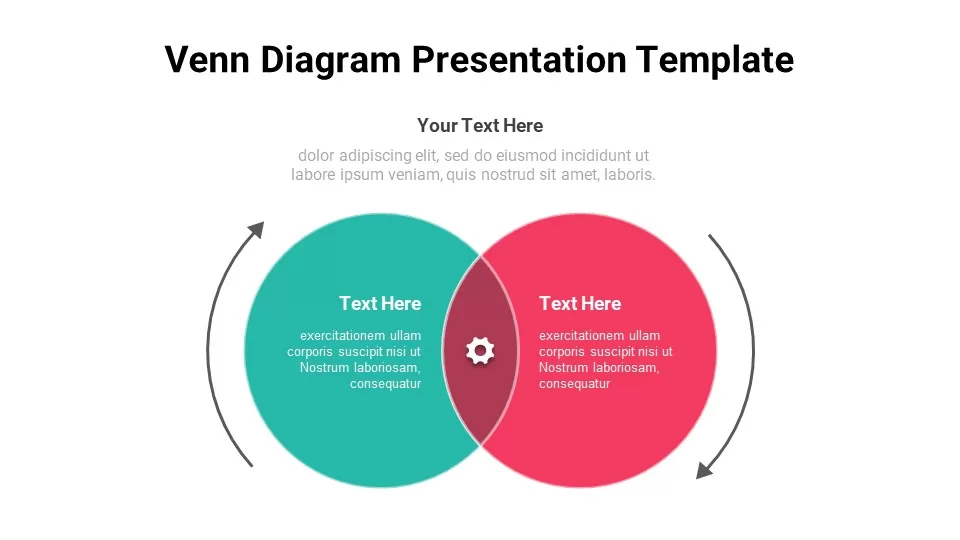
Free Venn Diagram template for PowerPoint & Google Slides
Charts
Free
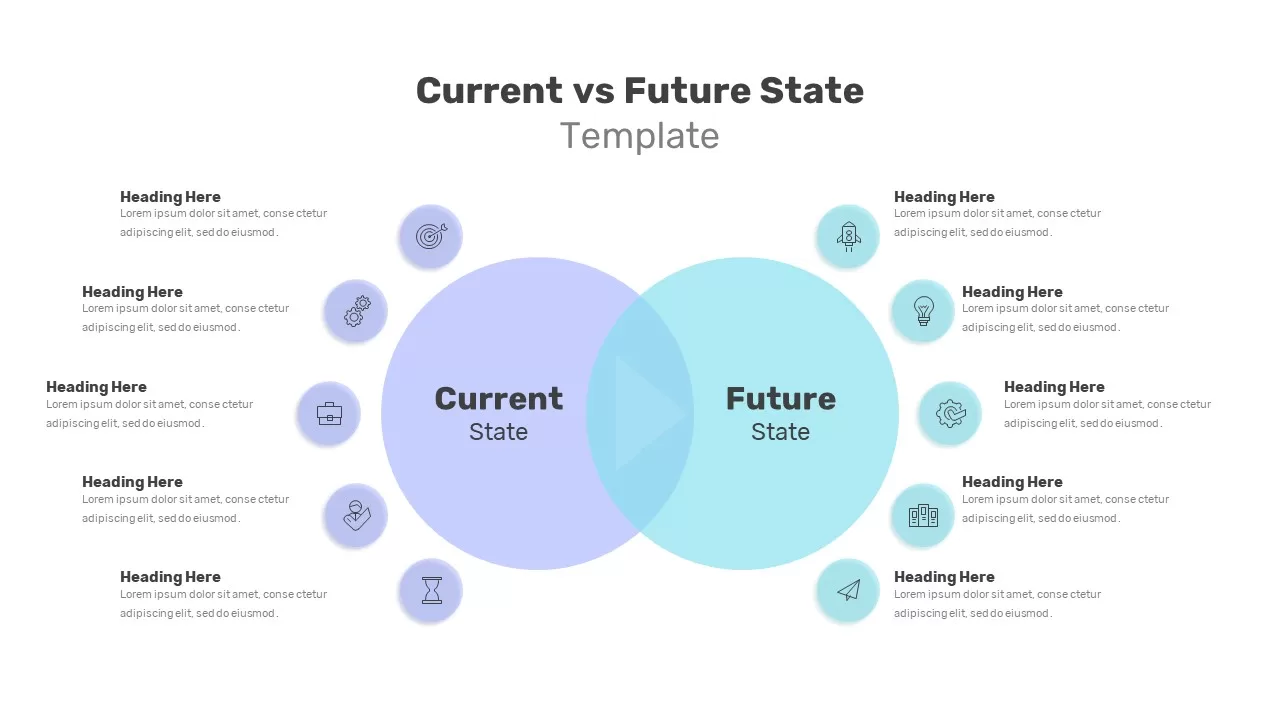
Current vs Future State Venn Diagram Template for PowerPoint & Google Slides
Comparison
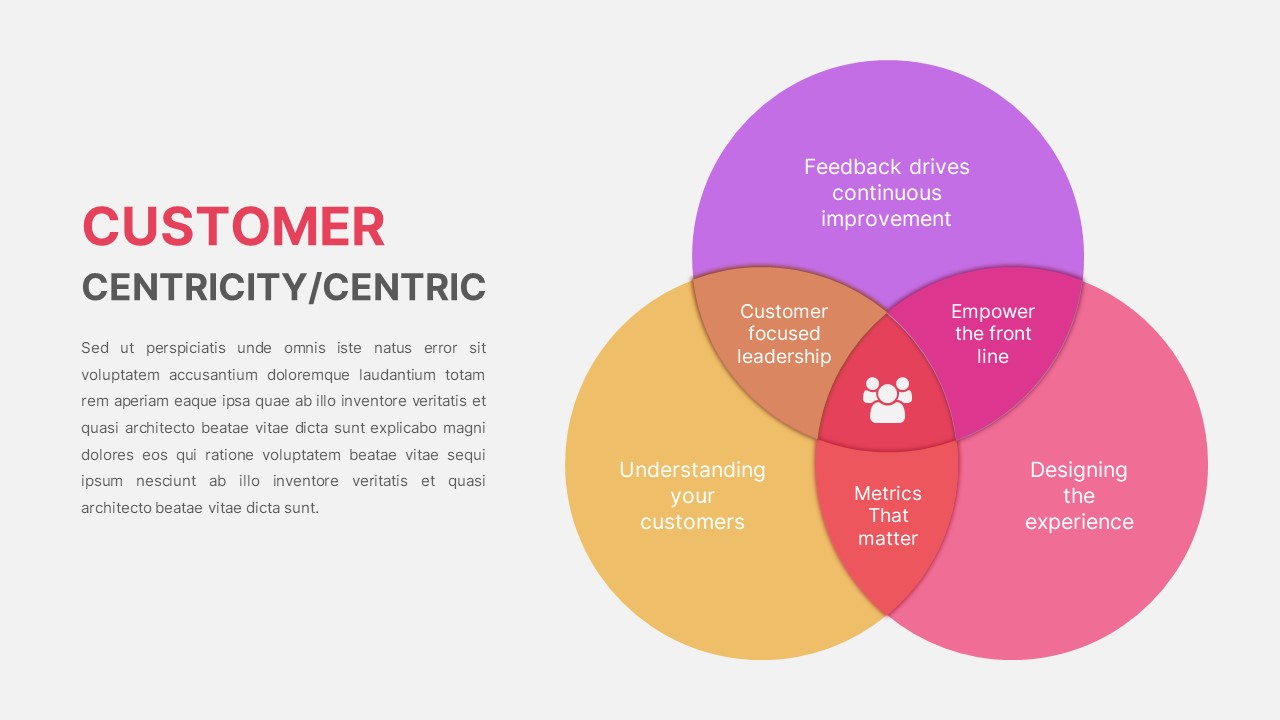
Customer Centricity Venn Diagram template for PowerPoint & Google Slides
Infographics
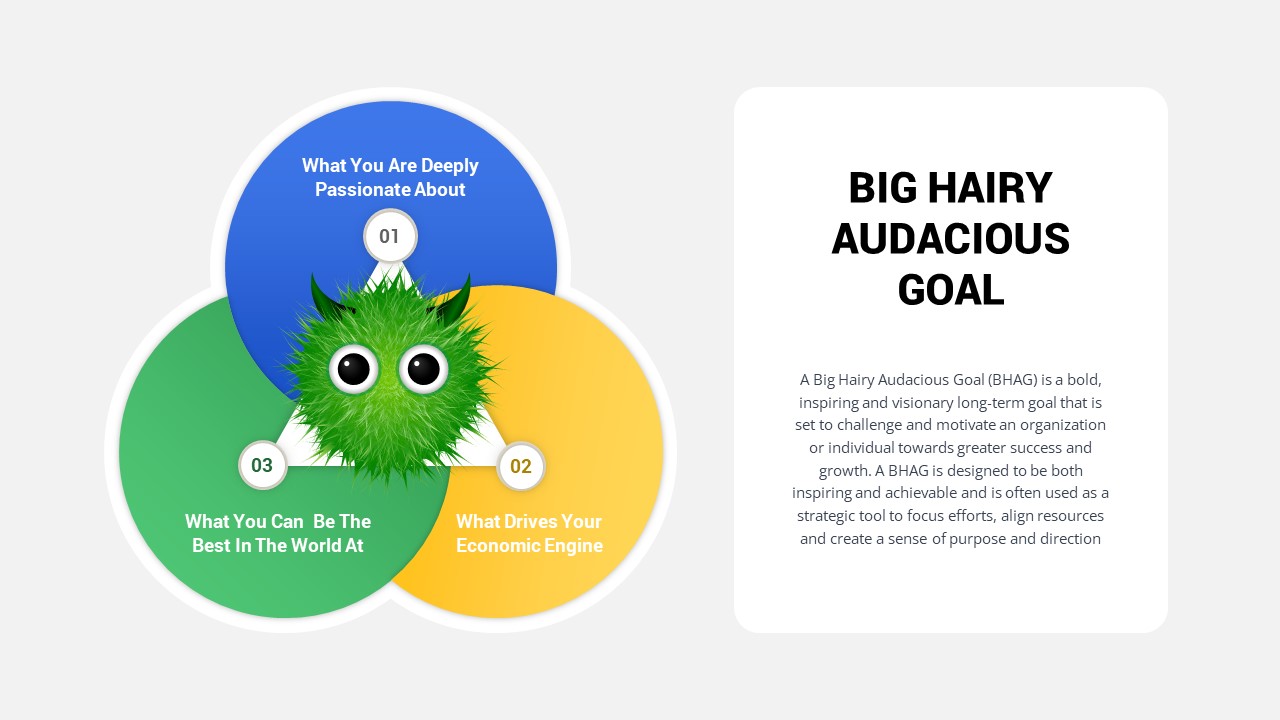
Big Hairy Audacious Goal Venn Diagram Template for PowerPoint & Google Slides
Circular
Five Circle Venn Diagram for Template for PowerPoint & Google Slides
Circular
Professional 6 Circle Venn Diagram Template for PowerPoint & Google Slides
Circular
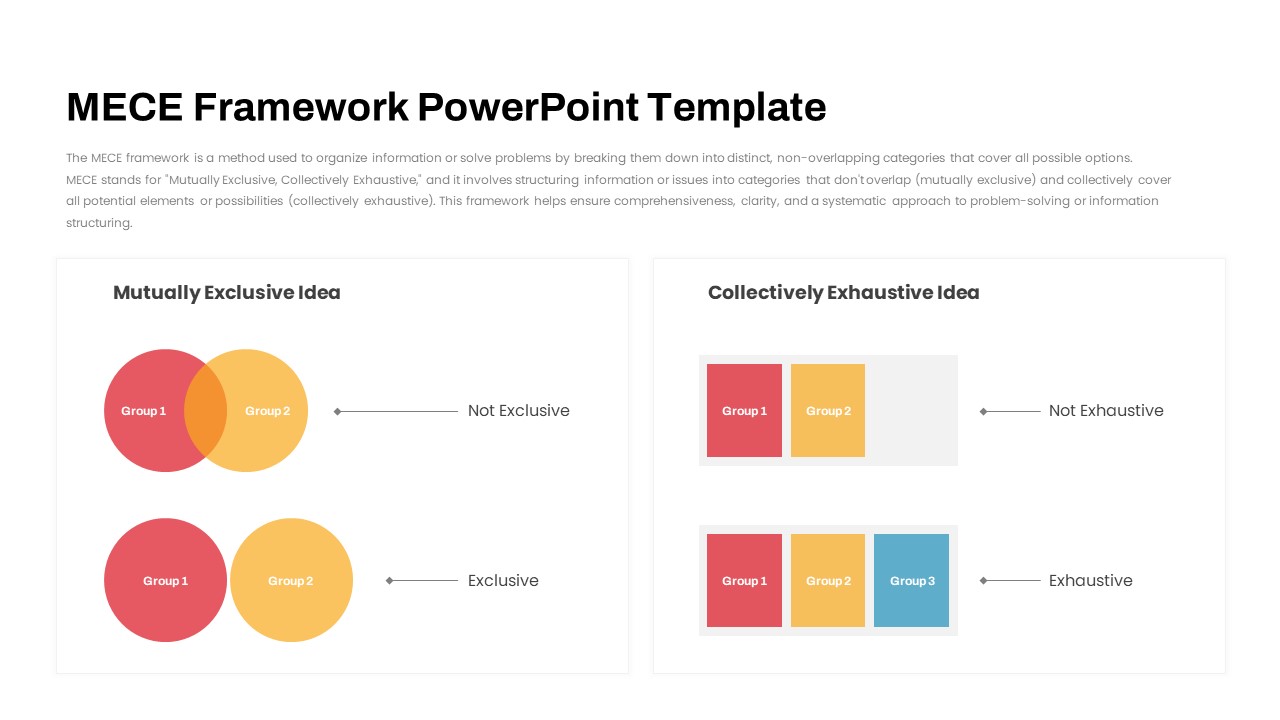
MECE Framework Venn & Block Diagram Template for PowerPoint & Google Slides
Comparison
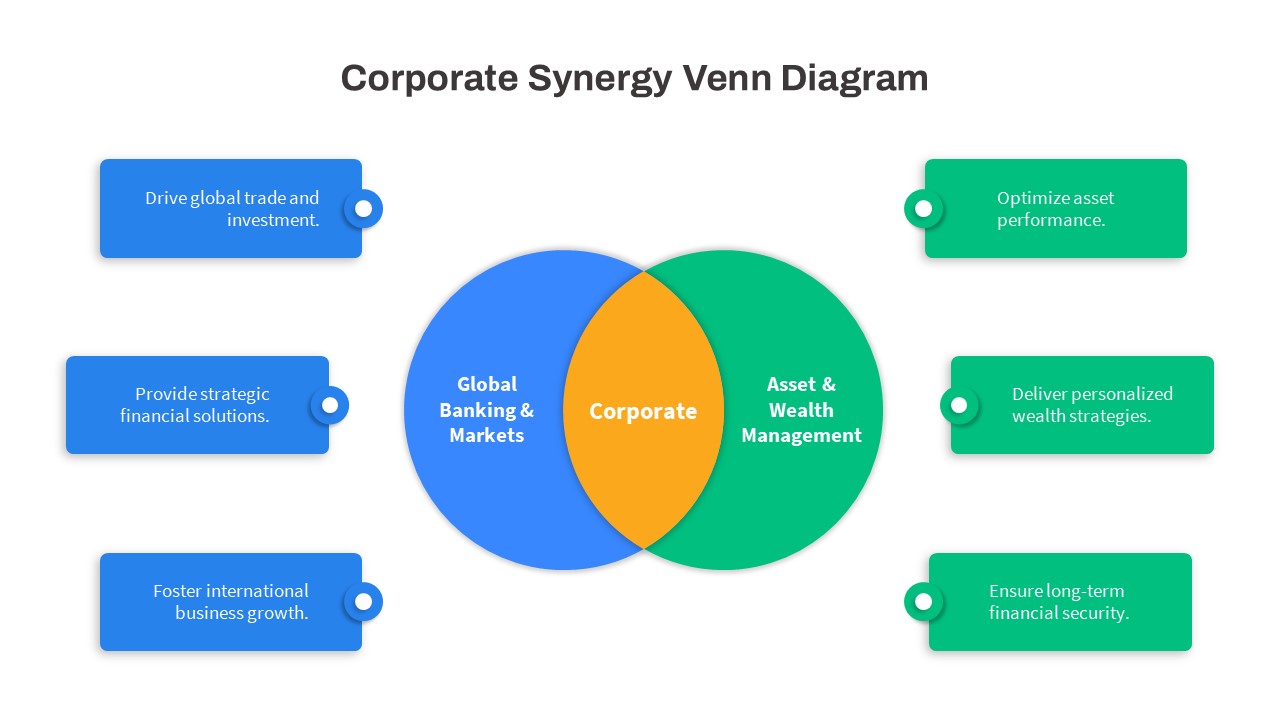
Corporate Synergy Venn Diagram Template for PowerPoint & Google Slides
Comparison
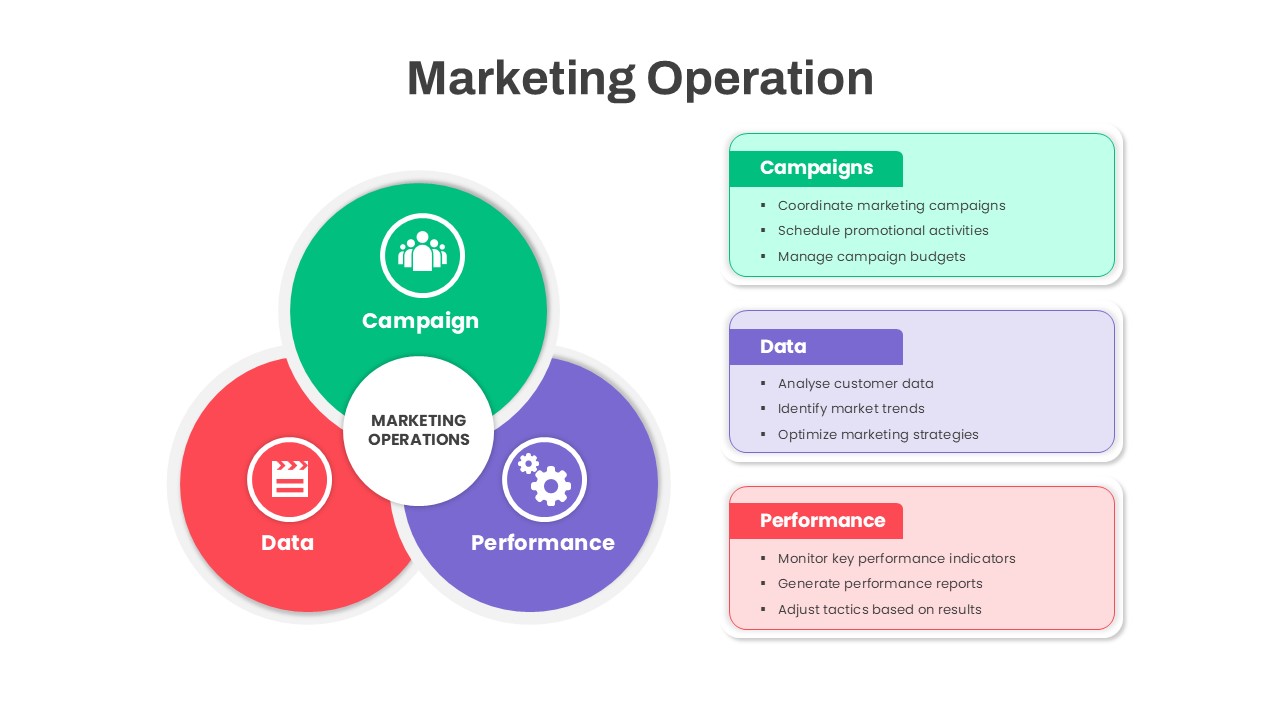
Marketing Operations Venn Diagram Template for PowerPoint & Google Slides
Circular
3Ps Triple Bottom Line Venn Diagram Template for PowerPoint & Google Slides
Circular
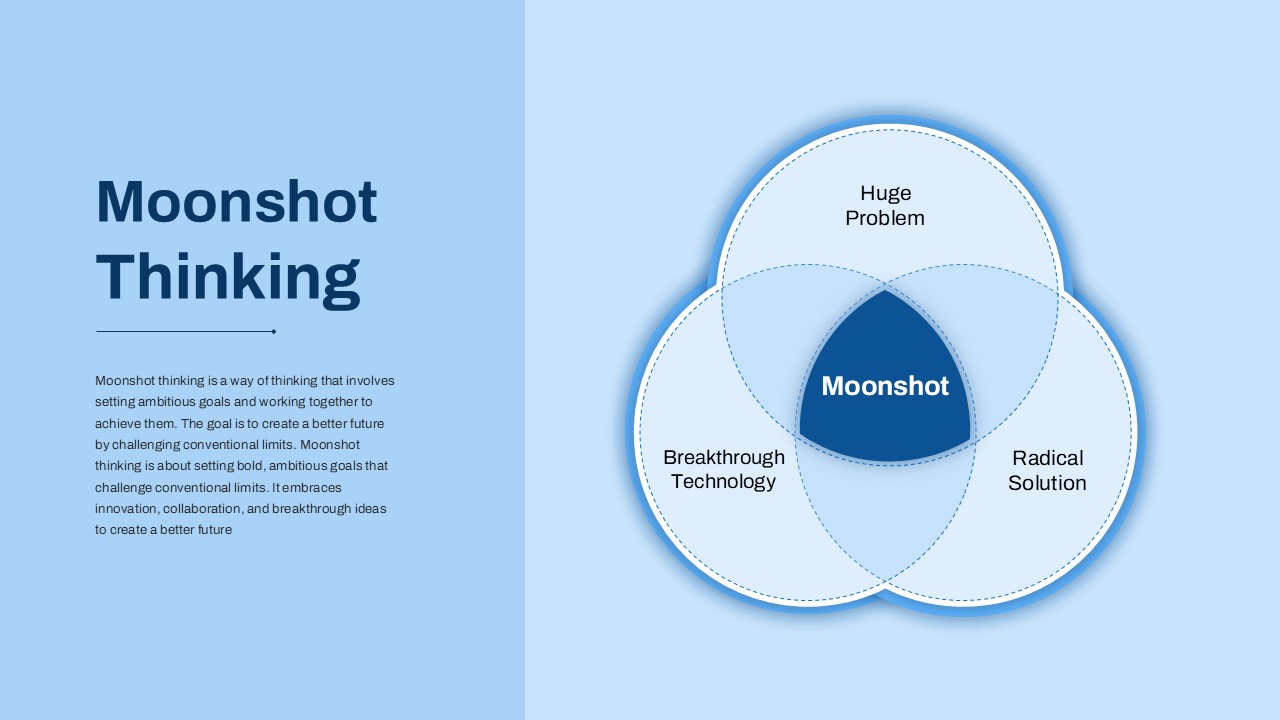
Bold Moonshot Thinking Venn Diagram Template for PowerPoint & Google Slides
Circular
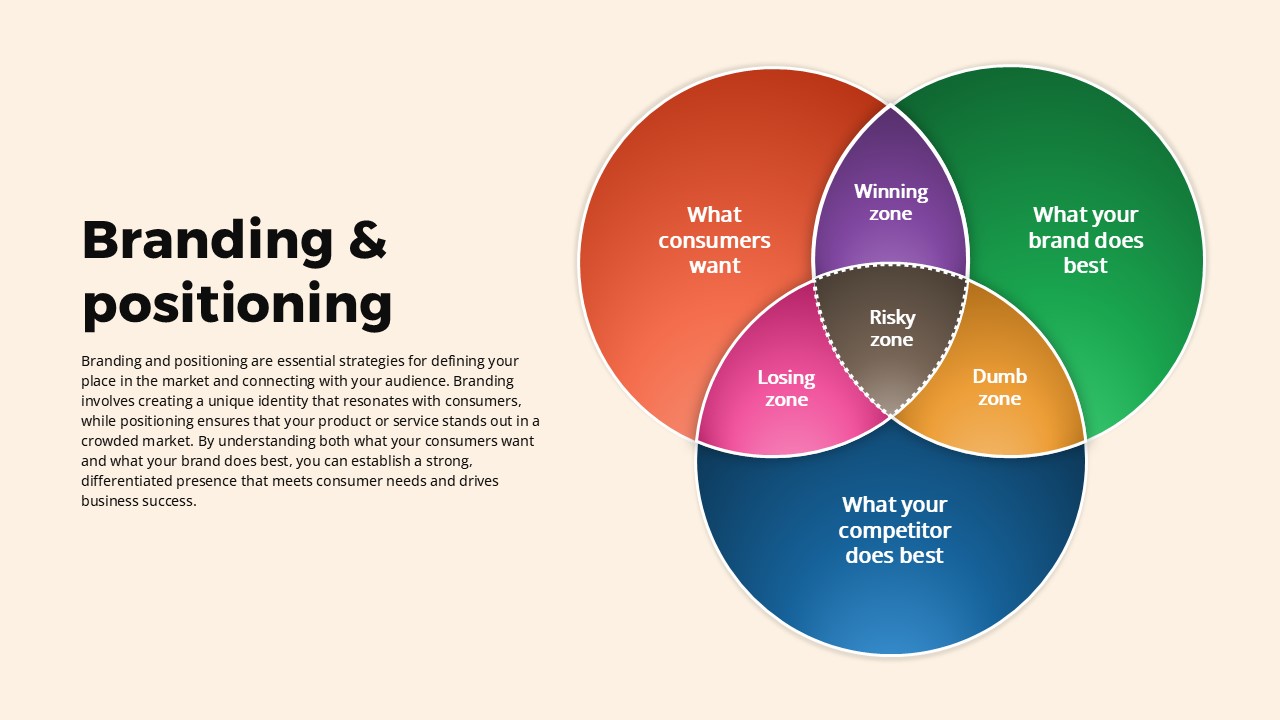
Branding and Positioning Venn Diagram Template for PowerPoint & Google Slides
Comparison
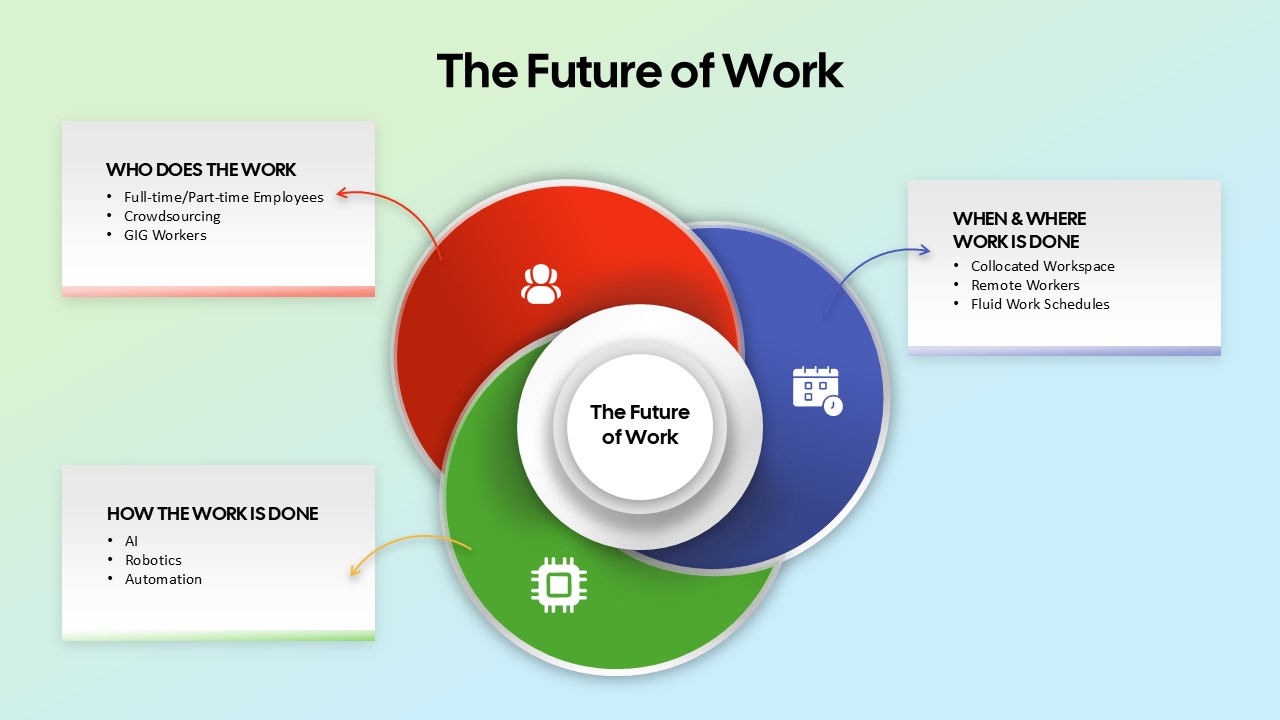
The Future of Work Venn Diagram Template for PowerPoint & Google Slides
Circular
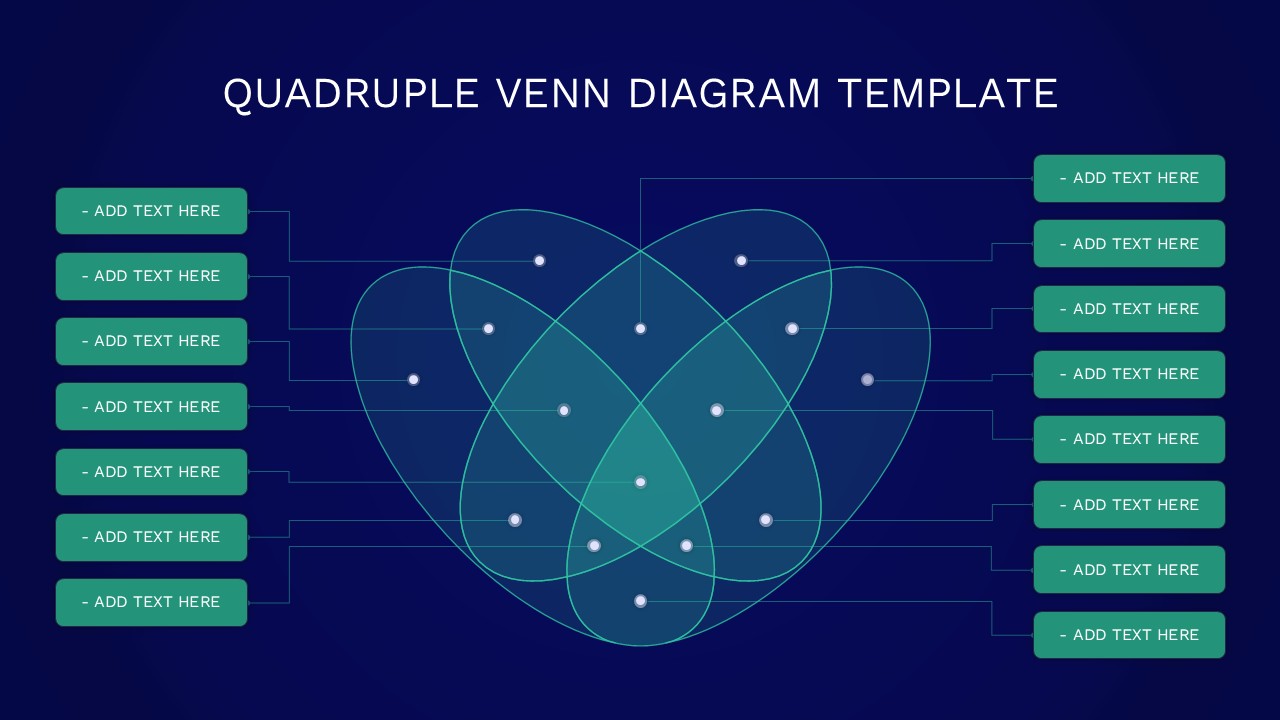
Quadruple Venn Diagram Template for PowerPoint & Google Slides
Circular
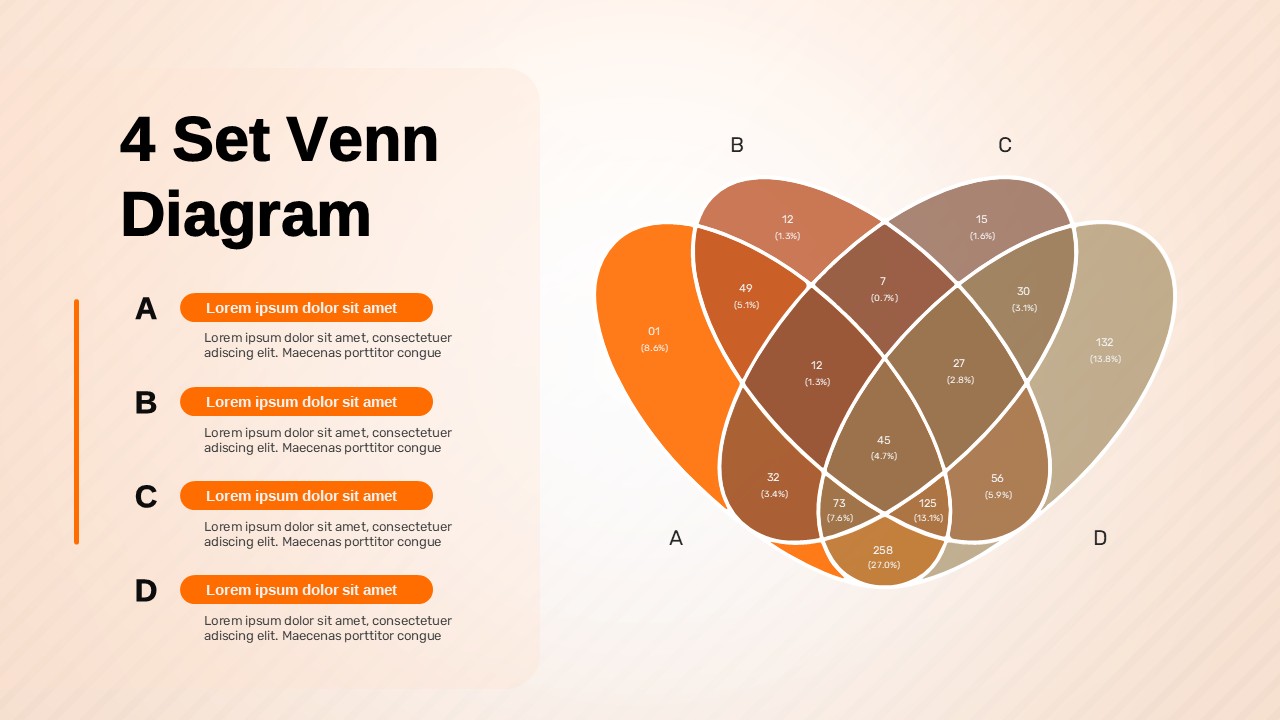
4 Set Venn Diagram Comparison Template for PowerPoint & Google Slides
Comparison
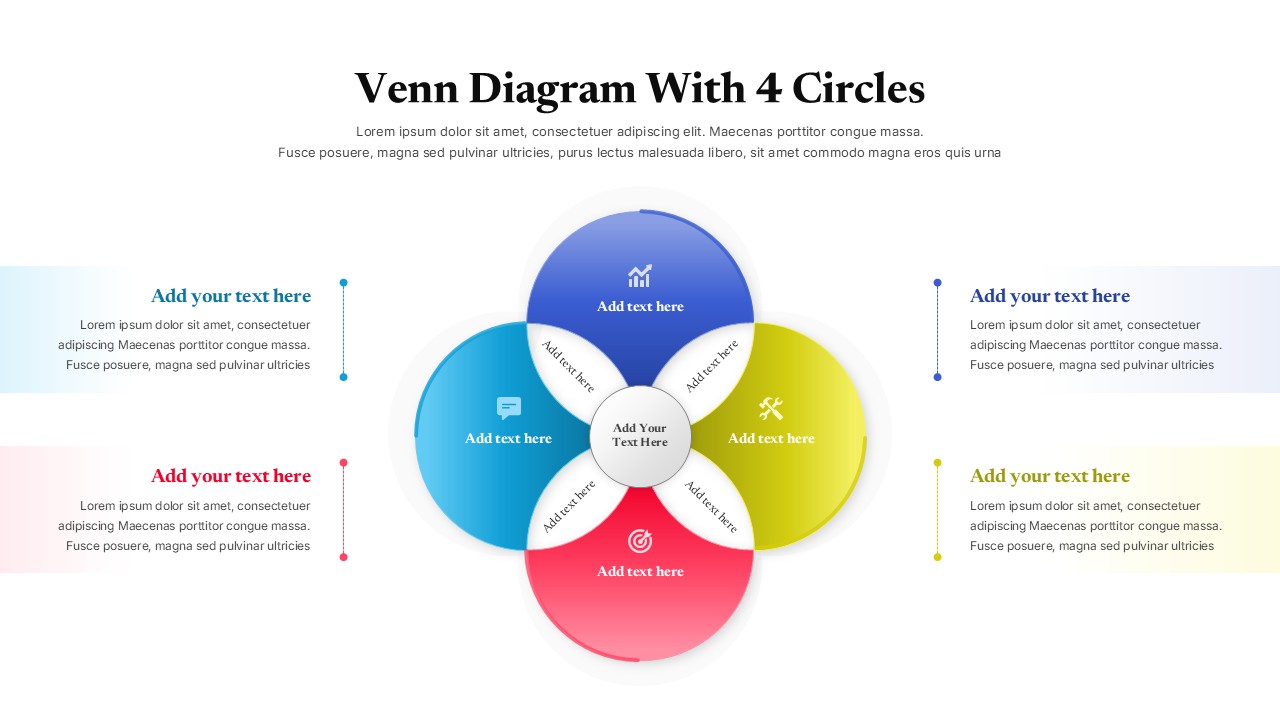
Colorful Venn Diagram with 4 Circle for PowerPoint & Google Slides
Circular
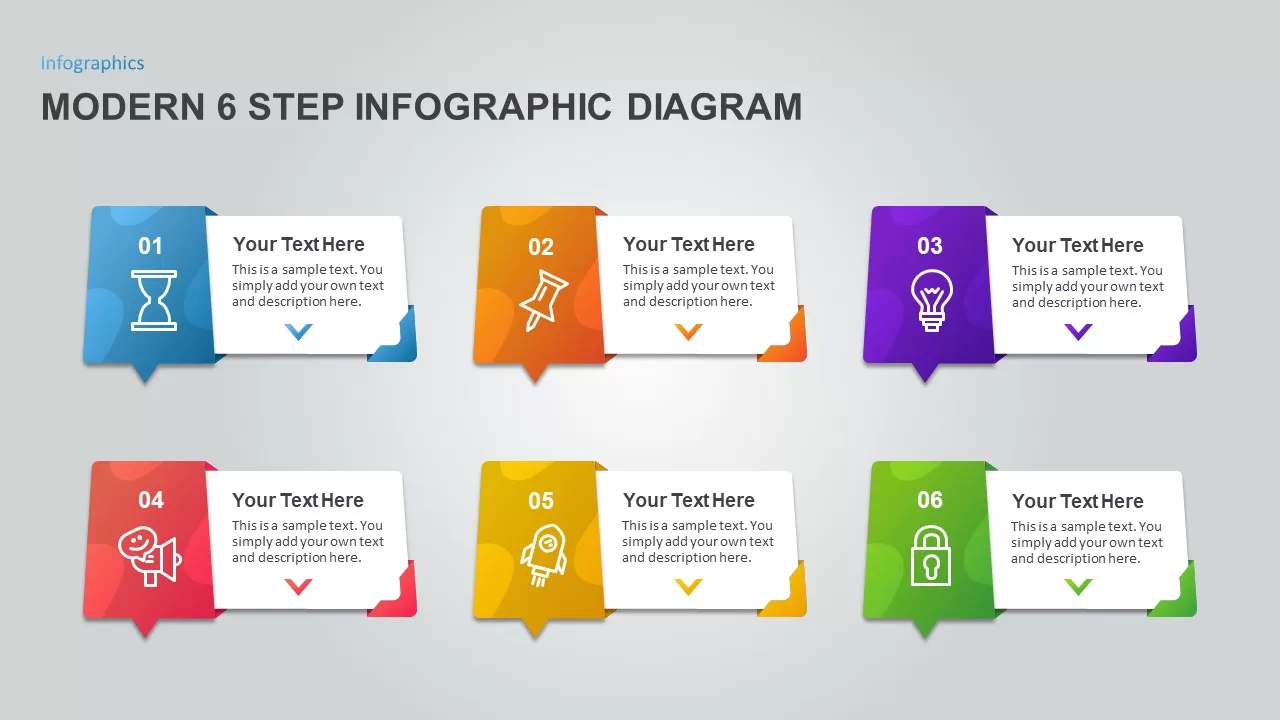
Modern 6 Step Infographic Diagram template for PowerPoint & Google Slides
Process
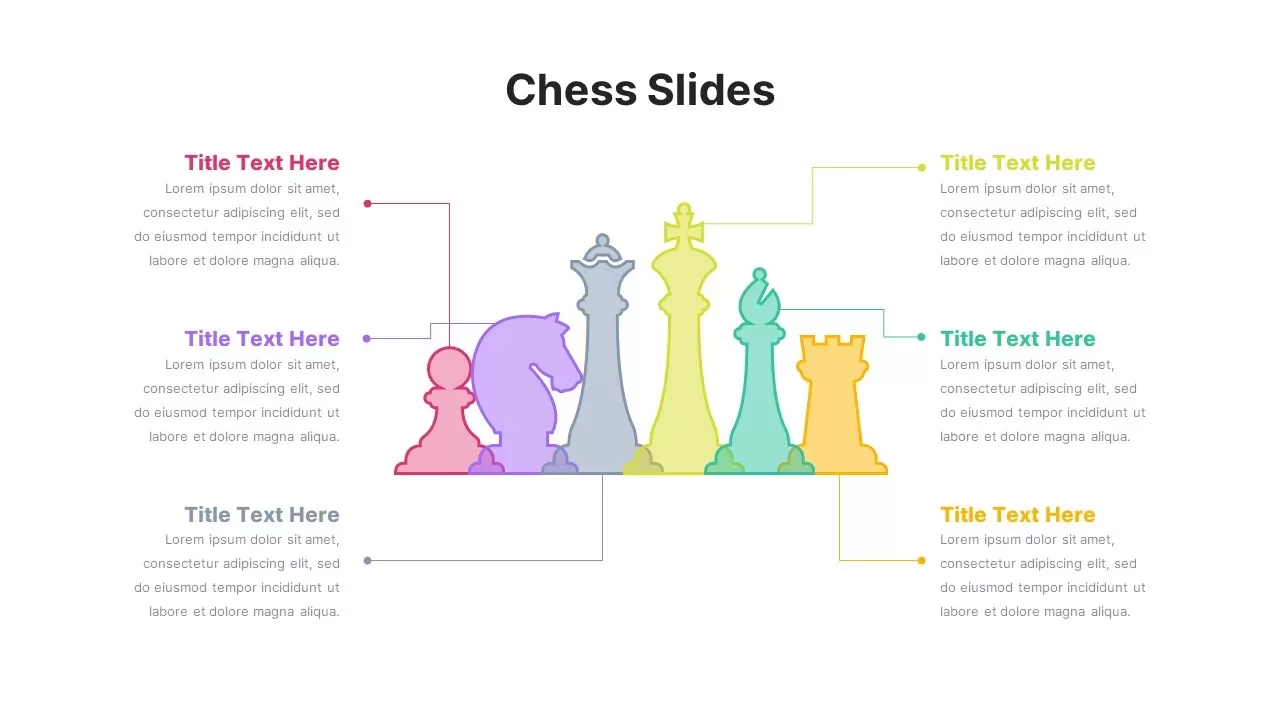
Modern Chess Infographic Diagram Template for PowerPoint & Google Slides
Comparison
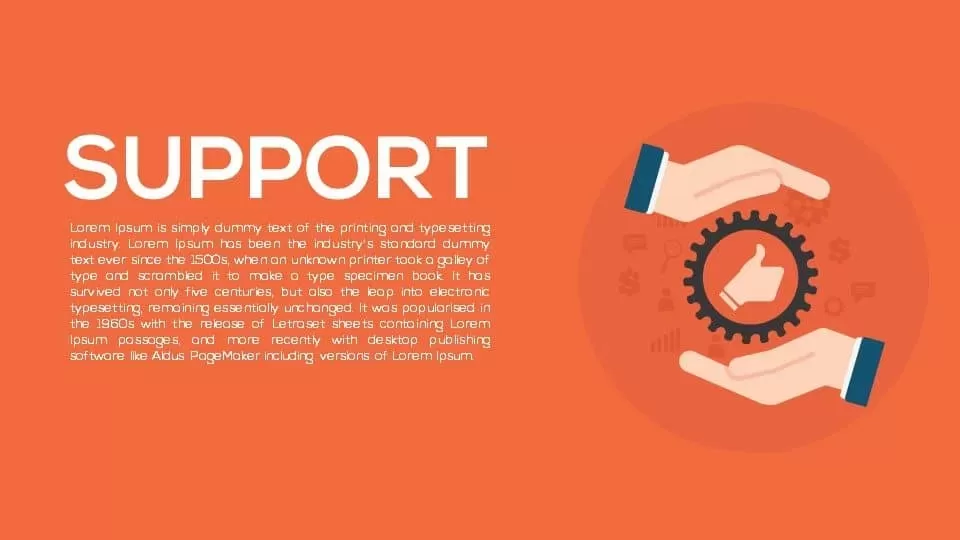
Support Services Gear Infographic Template for PowerPoint & Google Slides
Business

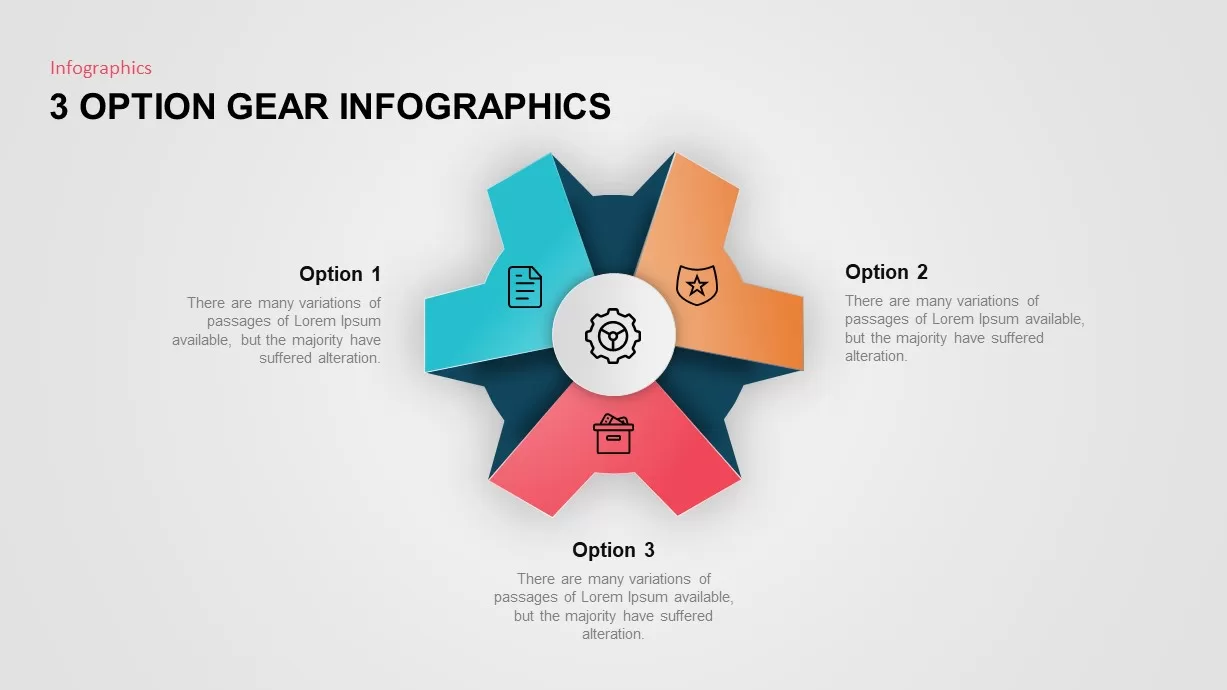
Three-Option Gear Infographic Pro Template for PowerPoint & Google Slides
Process
Three-Phase Planning Gear Infographic Template for PowerPoint & Google Slides
Process
Animated Multi-Gear Cluster Infographic Template for PowerPoint & Google Slides
Process
Six Colorful Gear Shapes Infographic Template for PowerPoint & Google Slides
Process
Free
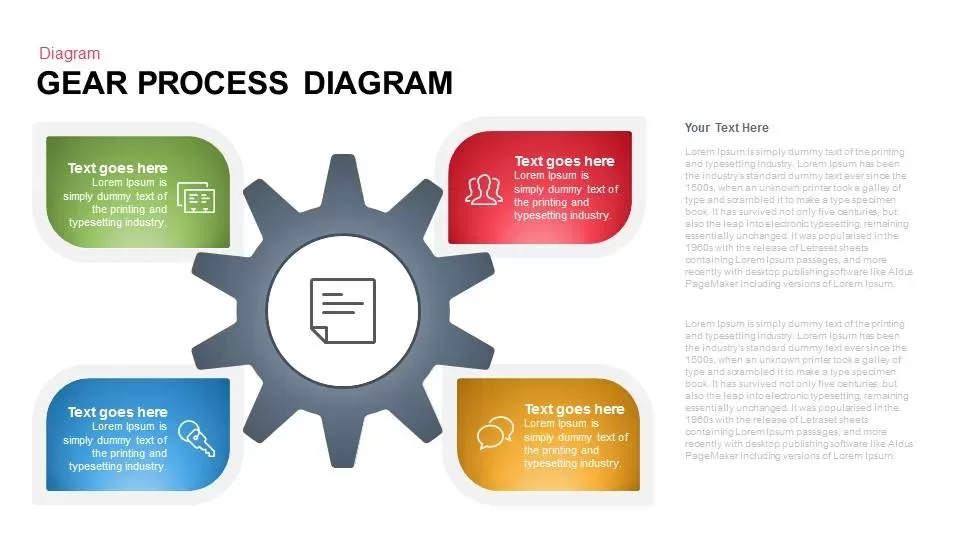
Gear Process Diagram PowerPoint Template for PowerPoint & Google Slides
Process
Gear Process Diagram template for PowerPoint & Google Slides
Process
Gear Diagram template for PowerPoint & Google Slides
Process
Professional 3D Gear Process Diagram Template for PowerPoint & Google Slides
Process
Gear Process Phase Diagram template for PowerPoint & Google Slides
Process

Five-Step Gear Process Diagram Template for PowerPoint & Google Slides
Process
Four Gear Section Diagram Template for PowerPoint & Google Slides
Circular

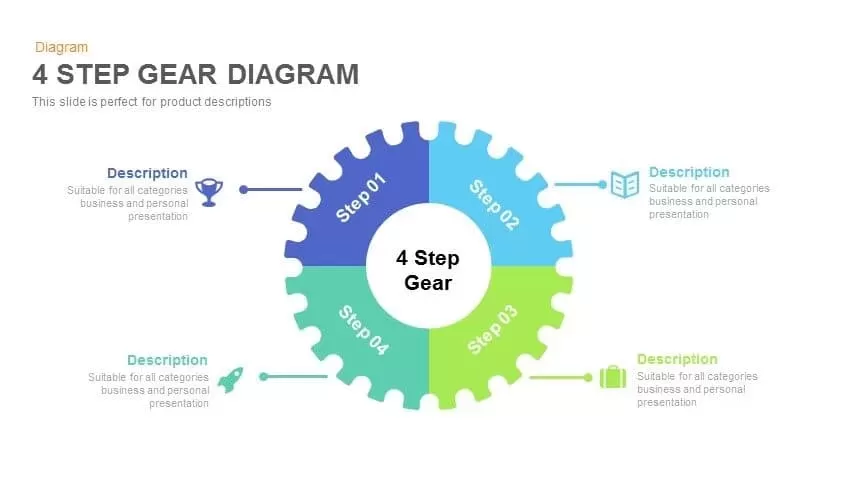
4 Step Gear Diagram Template for PowerPoint & Google Slides
Process
Dynamic 4 Gear Process Diagram Template for PowerPoint & Google Slides
Process
Gear Pie Diagram Data Visualization Template for PowerPoint & Google Slides
Pie/Donut
Six-Staged Gear Diagram Framework Template for PowerPoint & Google Slides
Process
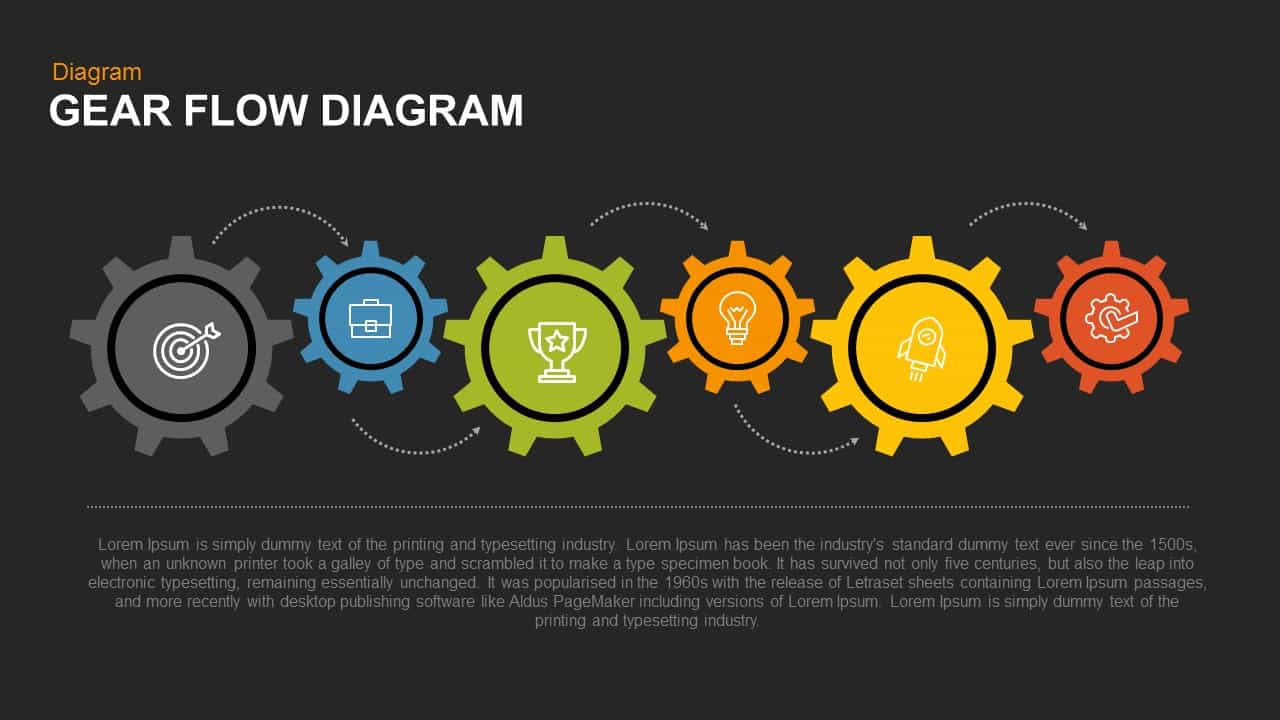
Gear Flow Diagram template for PowerPoint & Google Slides
Process
Artificial Intelligence Gear Diagram Template for PowerPoint & Google Slides
Process
Marketing Risk Management Gear Diagram Template for PowerPoint & Google Slides
Risk Management
SWOT Analysis Gear Diagram Slide Template for PowerPoint & Google Slides
SWOT
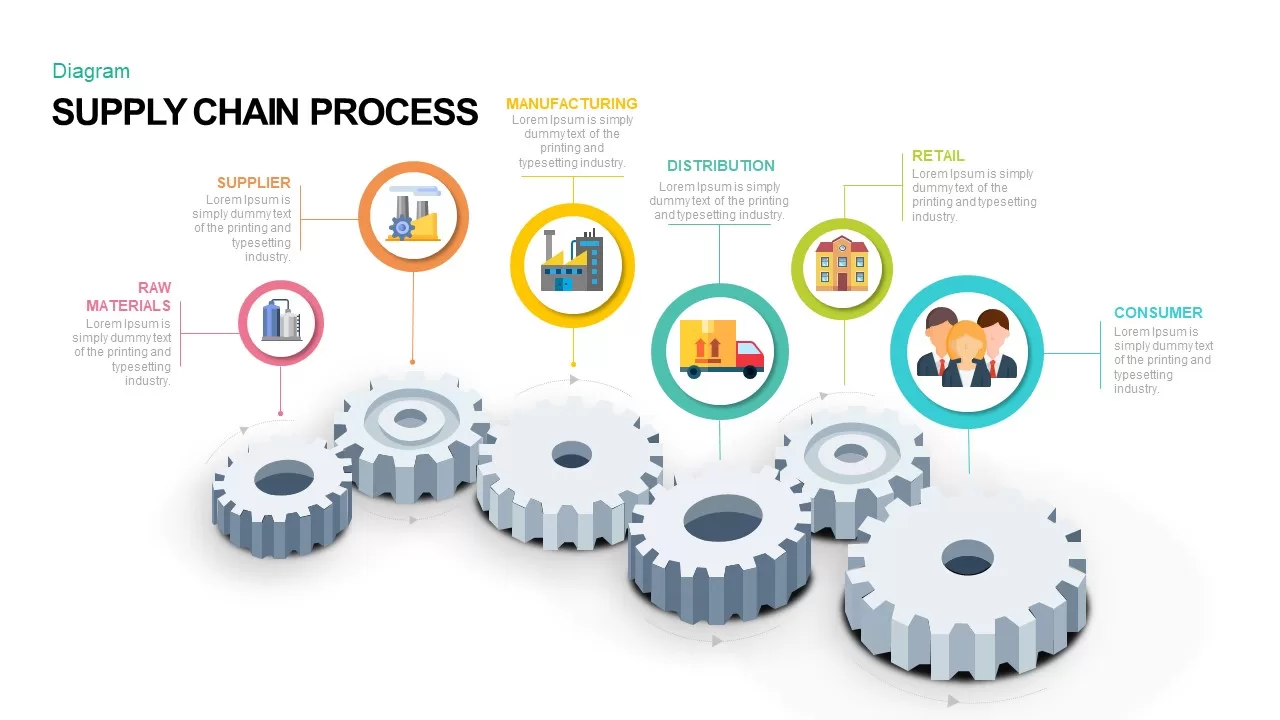
Supply Chain Process Gear Diagram Template for PowerPoint & Google Slides
Process
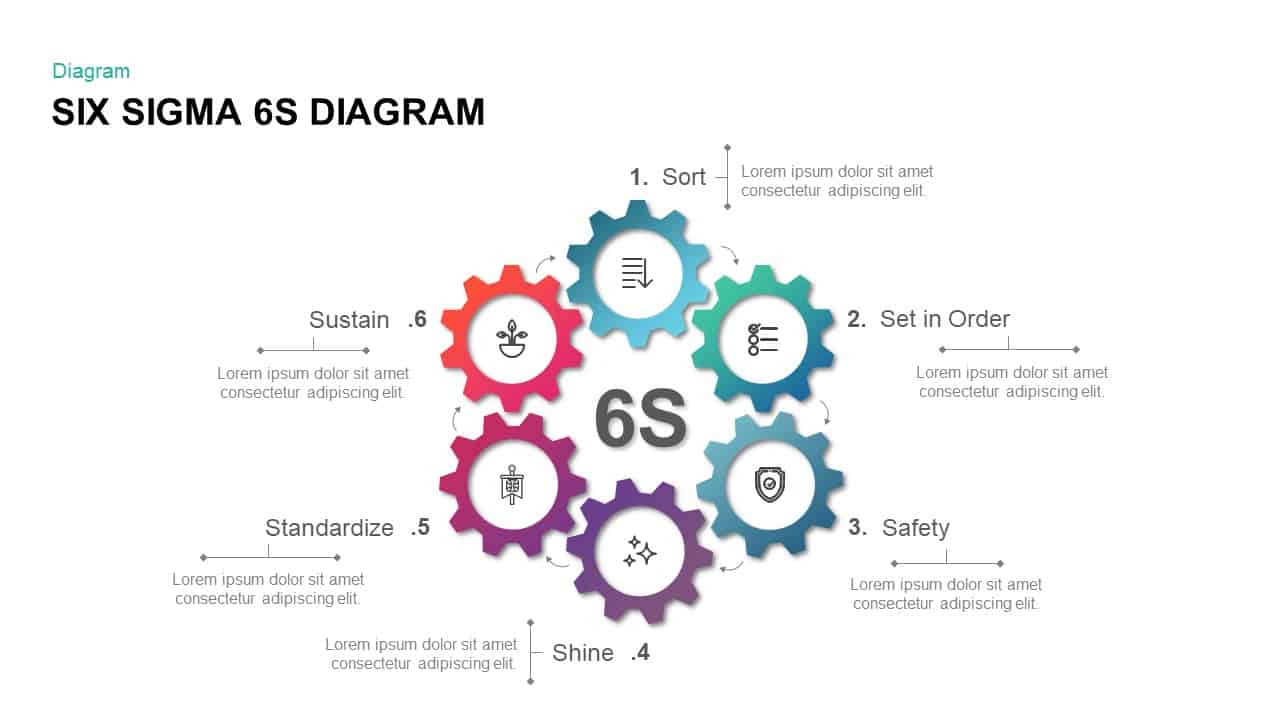
Six Sigma Gear Process Diagram Template for PowerPoint & Google Slides
Process
Six-Stage Gear Wheel Diagram Template for PowerPoint & Google Slides
Circular
Four-Stage Gear Process Diagram Template for PowerPoint & Google Slides
Process
5-Stage Gear Process Flow Diagram Template for PowerPoint & Google Slides
Process
Sales Process Improvement Gear Diagram Template for PowerPoint & Google Slides
Process
Eight-Stage Gear Diagram Process Template for PowerPoint & Google Slides
Process
Three-Step Triangular Gear Diagram Template for PowerPoint & Google Slides
Process
Dynamic Gear Diagram Infographics Template for PowerPoint & Google Slides
Process
Six-Option Gear Diagram Slide Template for PowerPoint & Google Slides
Circular
Gear Process Diagram Template for PowerPoint & Google Slides
Process
Gear Process Diagram Template for PowerPoint & Google Slides
Process
Cloud Gear Automation Diagram Template for PowerPoint & Google Slides
Cloud Computing
Gear Process Diagram for PowerPoint & Google Slides
Process
8-Step Circular Gear Infographics Diagram for PowerPoint & Google Slides
Process
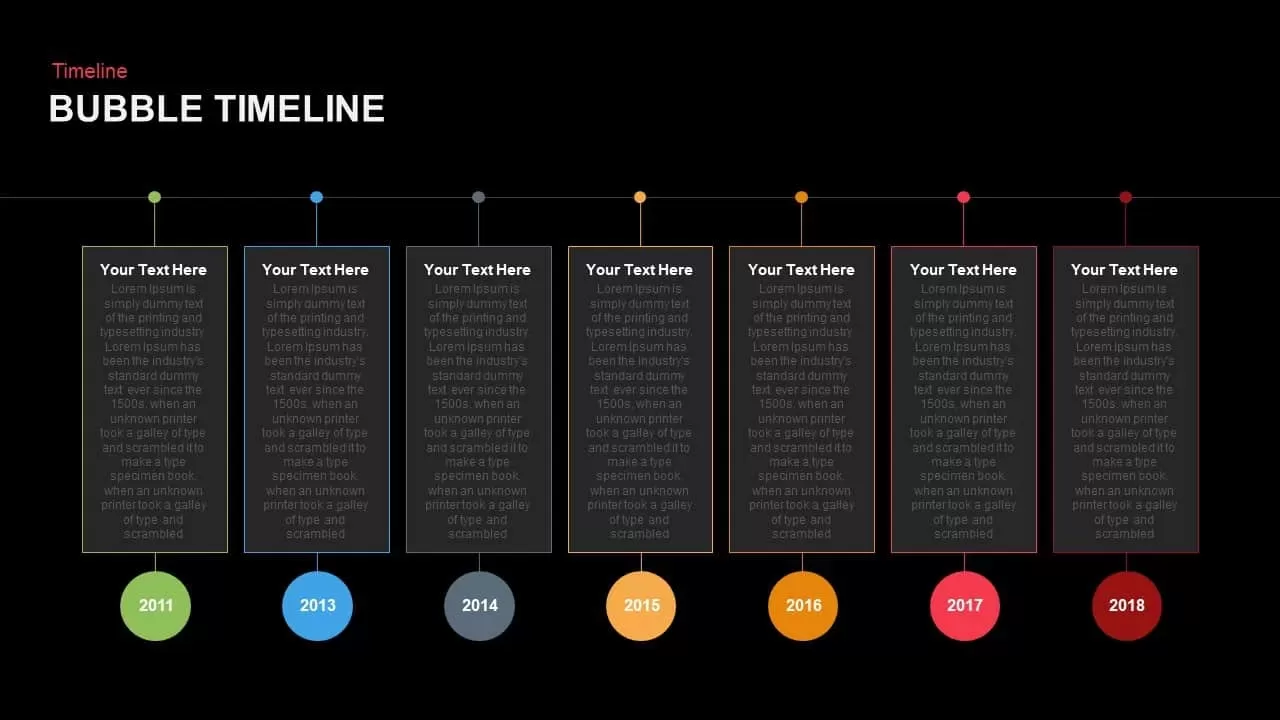
Modern Bubble Timeline Infographic Template for PowerPoint & Google Slides
Timeline
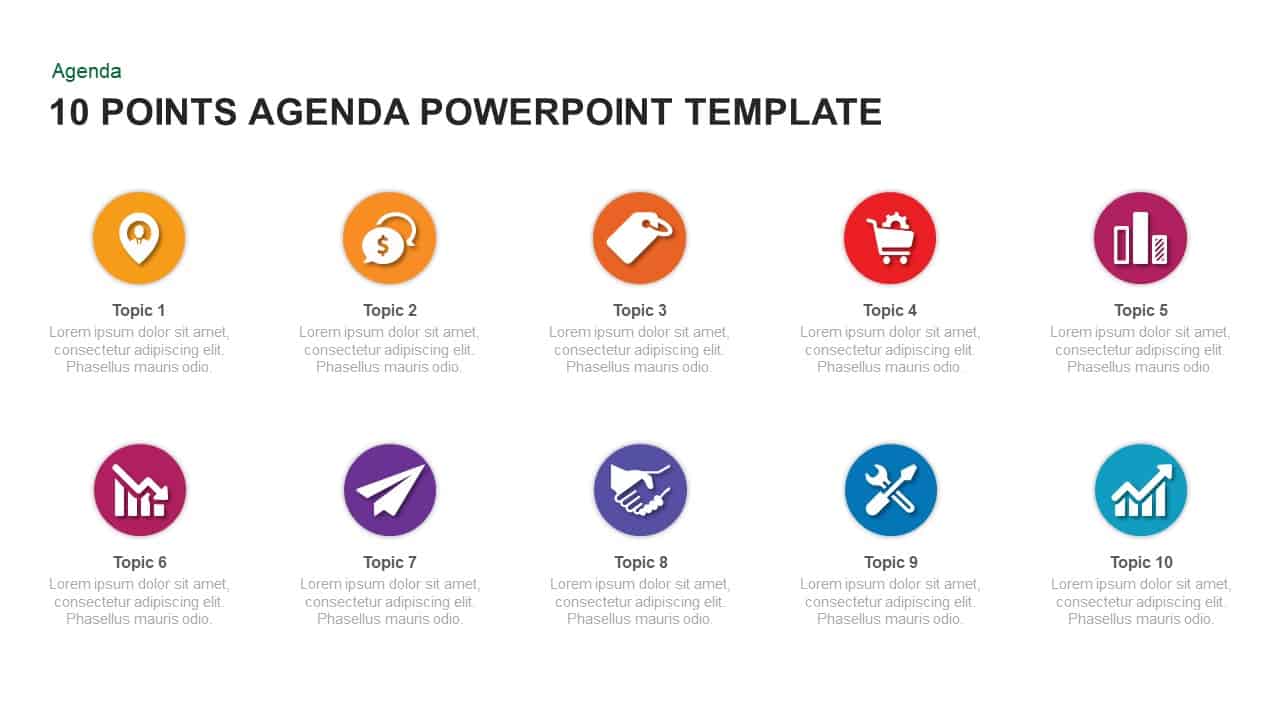
Modern 10-Point Agenda Infographic Template for PowerPoint & Google Slides
Agenda
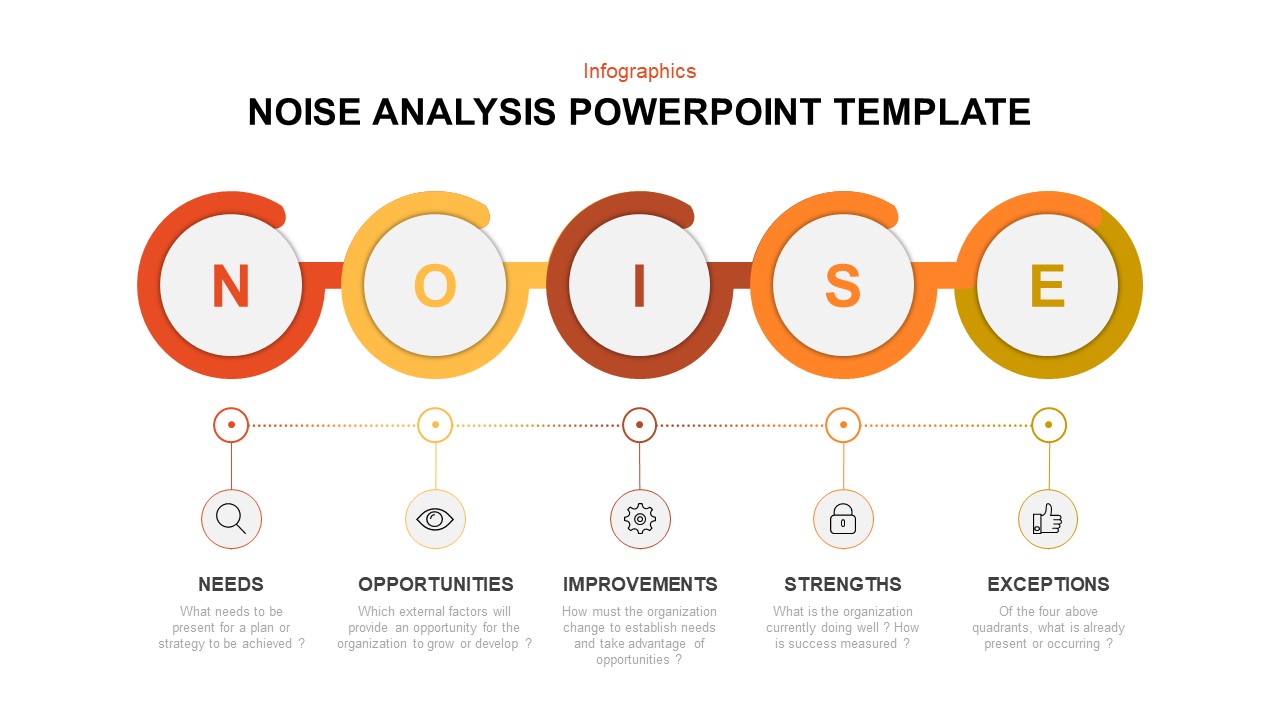
Modern Noise Analysis Infographic Template for PowerPoint & Google Slides
Process
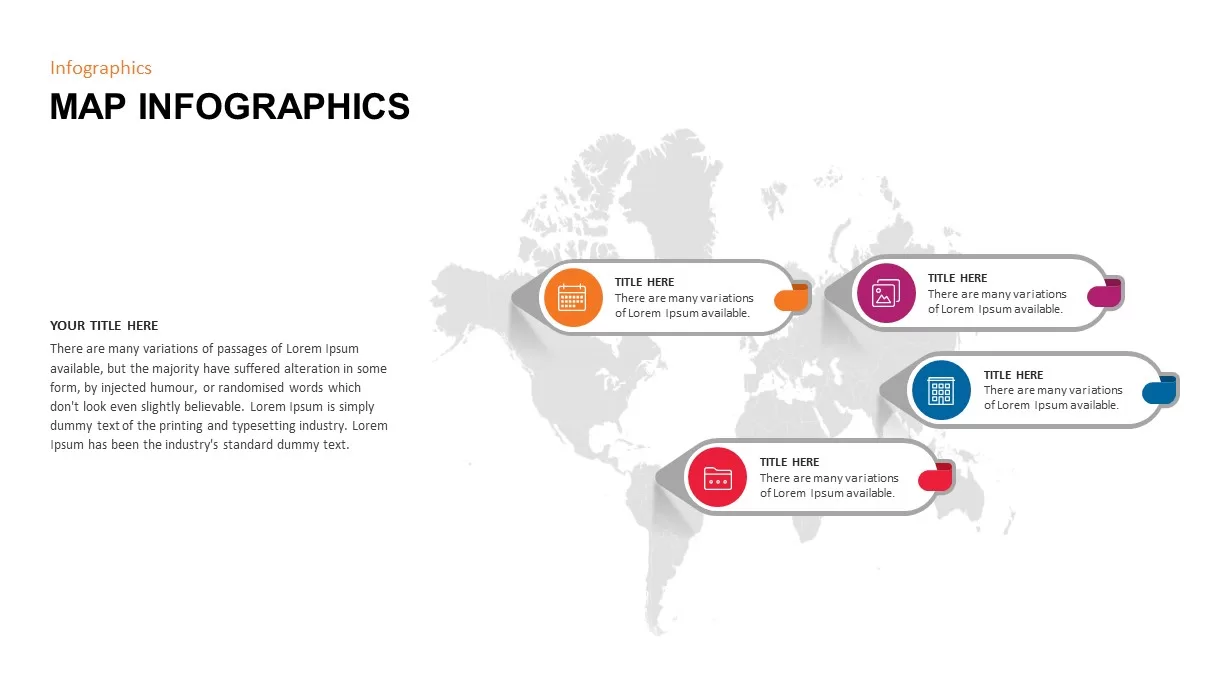
Modern World Map Callout Infographic Template for PowerPoint & Google Slides
World Maps
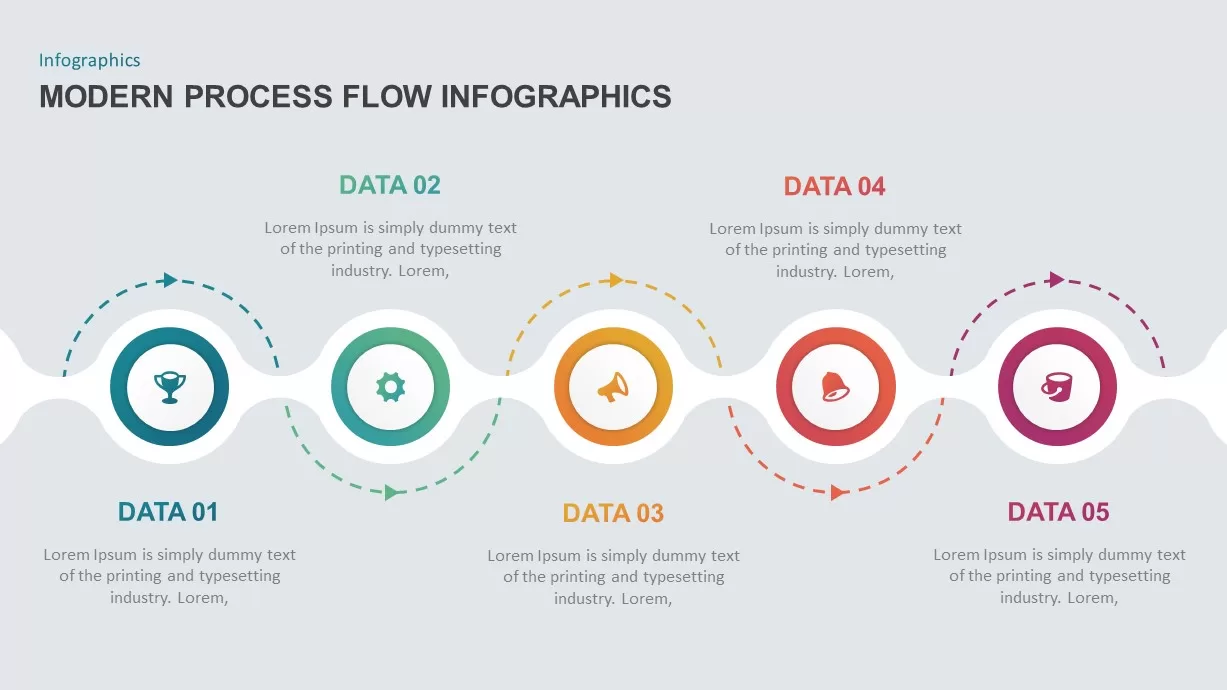
Modern 5-Step Process Flow Infographic Template for PowerPoint & Google Slides
Process
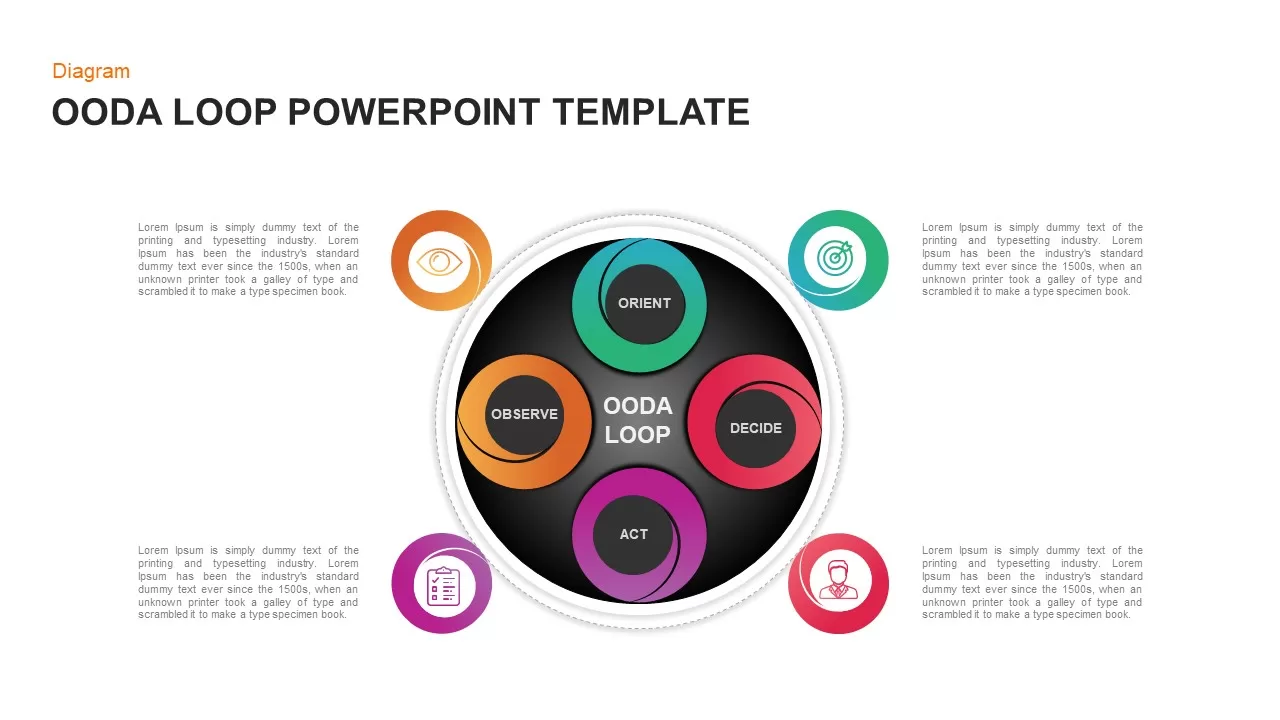
Modern Circular OODA Loop Infographic Template for PowerPoint & Google Slides
Circular
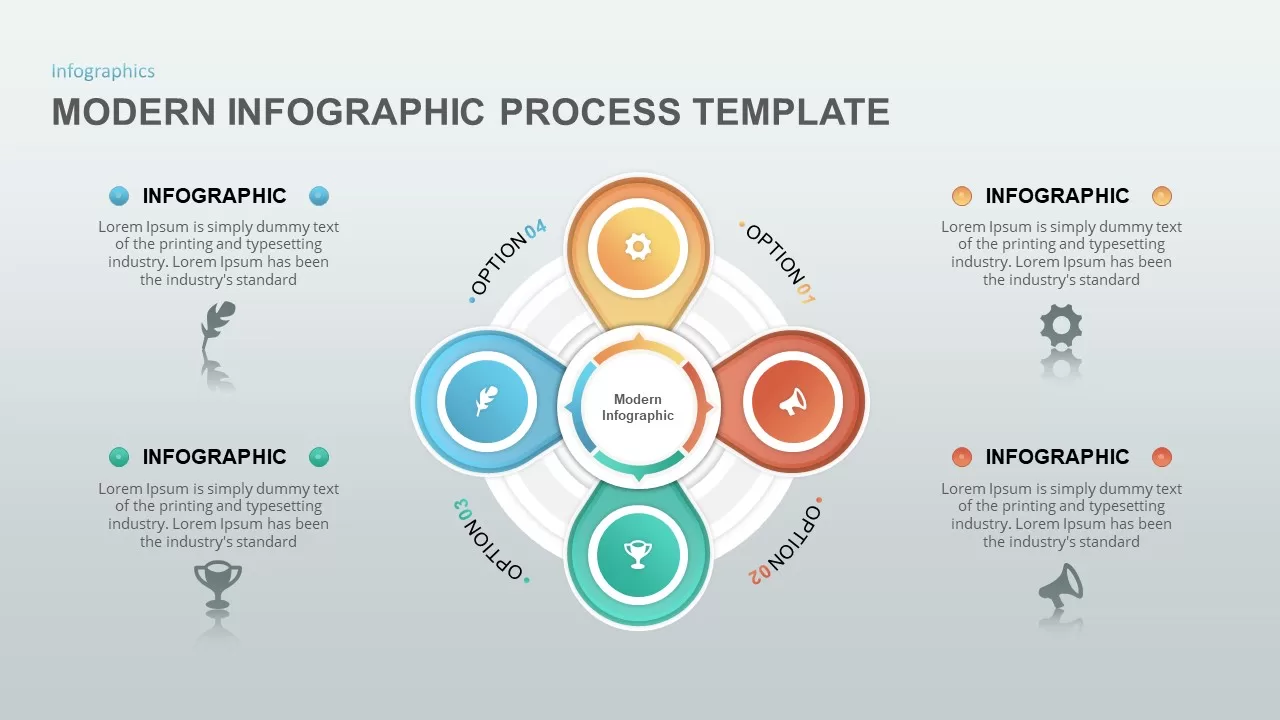
Modern Infographic Process template for PowerPoint & Google Slides
Infographics
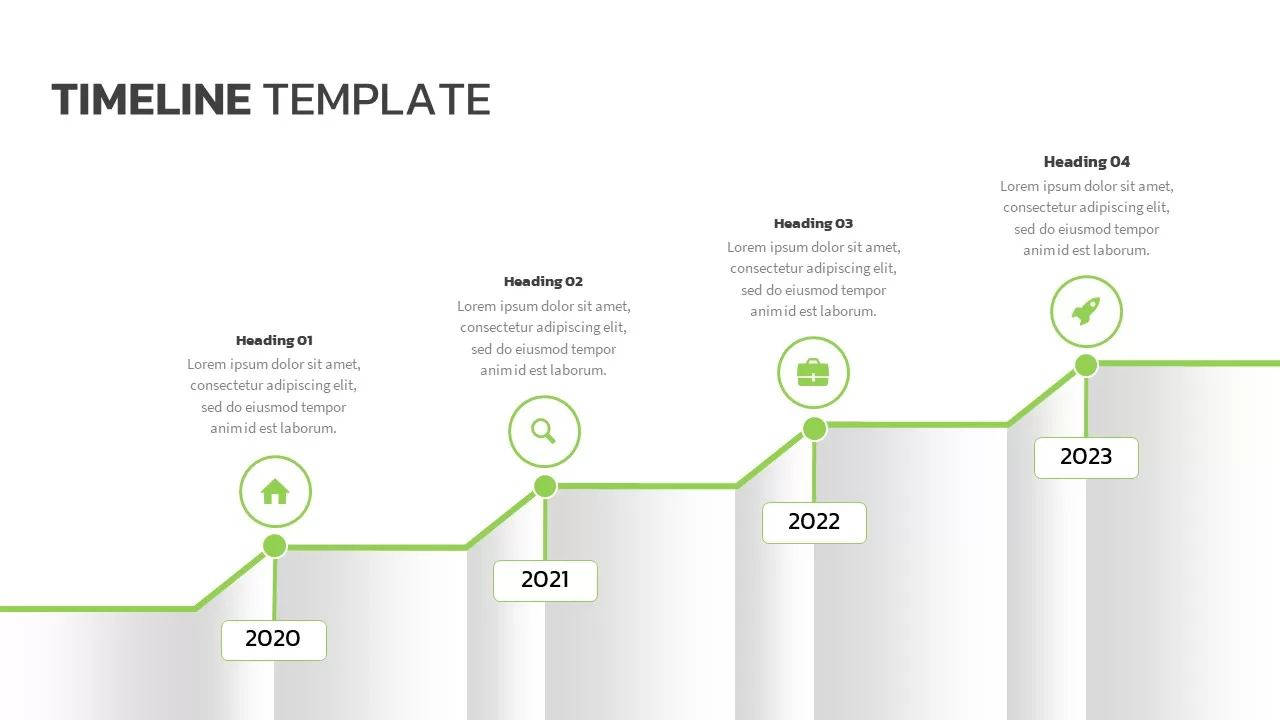
Modern Green Timeline Infographic Template for PowerPoint & Google Slides
Timeline
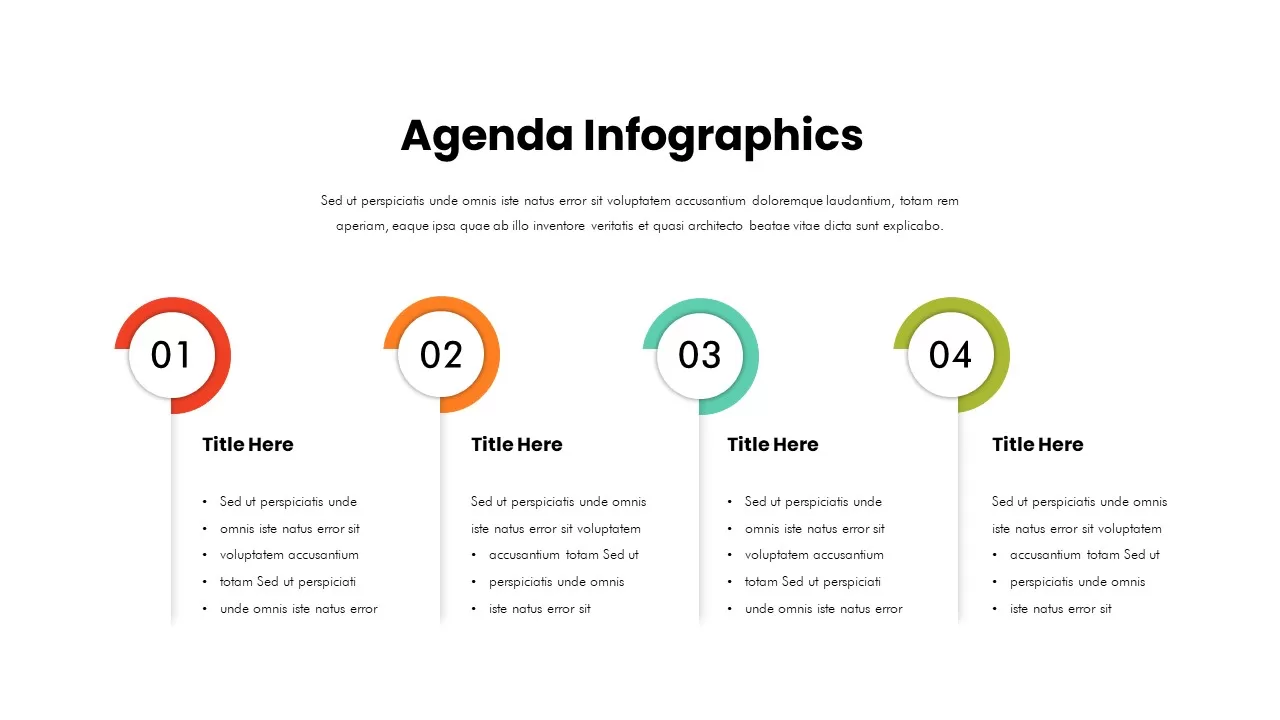
Free Modern Four-Step Agenda Infographic Template for PowerPoint & Google Slides
Agenda
Free
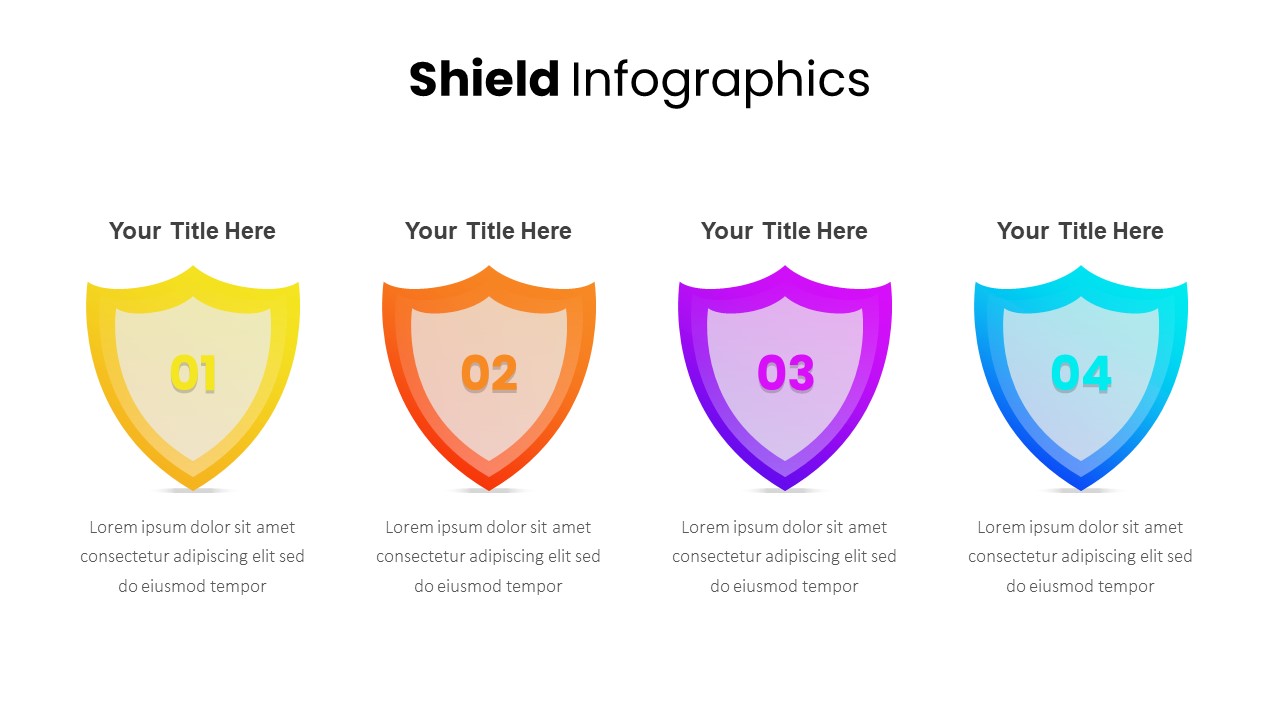
Modern Shield Infographic Steps Template for PowerPoint & Google Slides
Process

Modern Big Data Infographic Deck Template for PowerPoint & Google Slides
Decks
Modern Six-Point Timeline Infographic Template for PowerPoint & Google Slides
Timeline
Modern Semi Circle Infographic Template for PowerPoint & Google Slides
Circular
Modern Wave Infographic Process for PowerPoint & Google Slides
Infographics
Gear Slides for PowerPoint & Google Slides
Infographics
Modern Circle SWOT Analysis Diagram Template for PowerPoint & Google Slides
SWOT
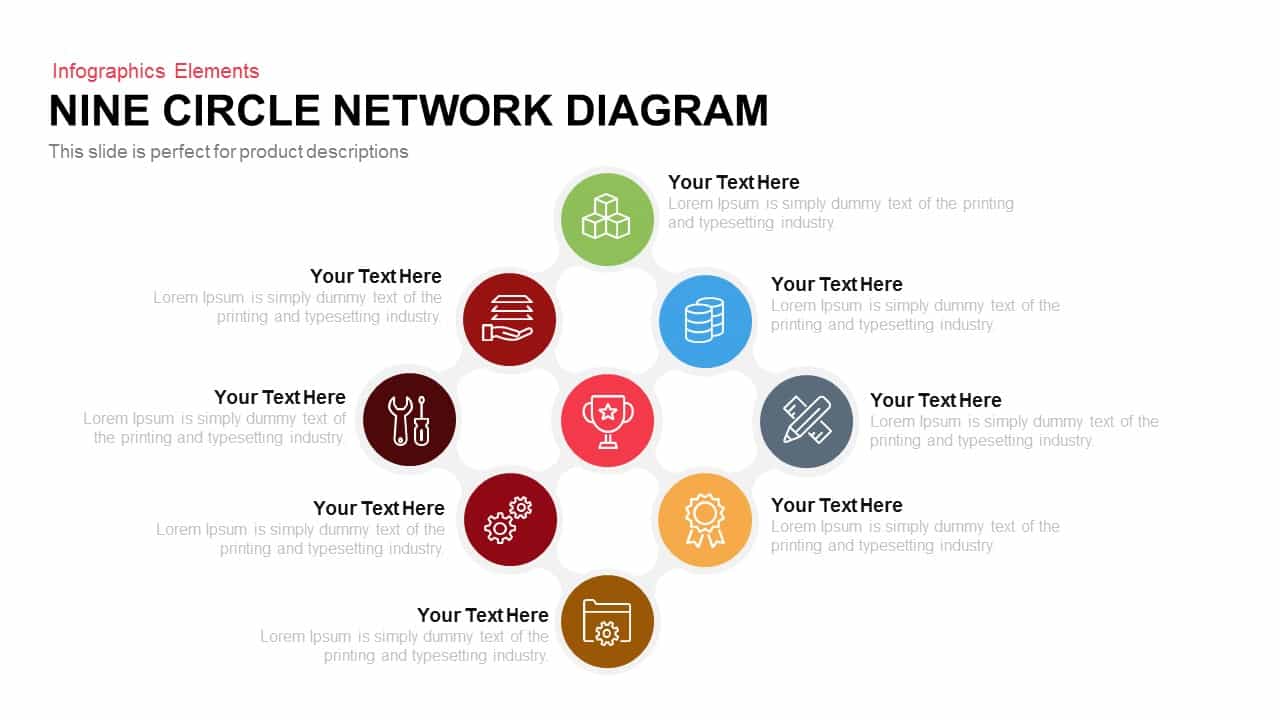
Modern Nine Circle Network Diagram Template for PowerPoint & Google Slides
Circular
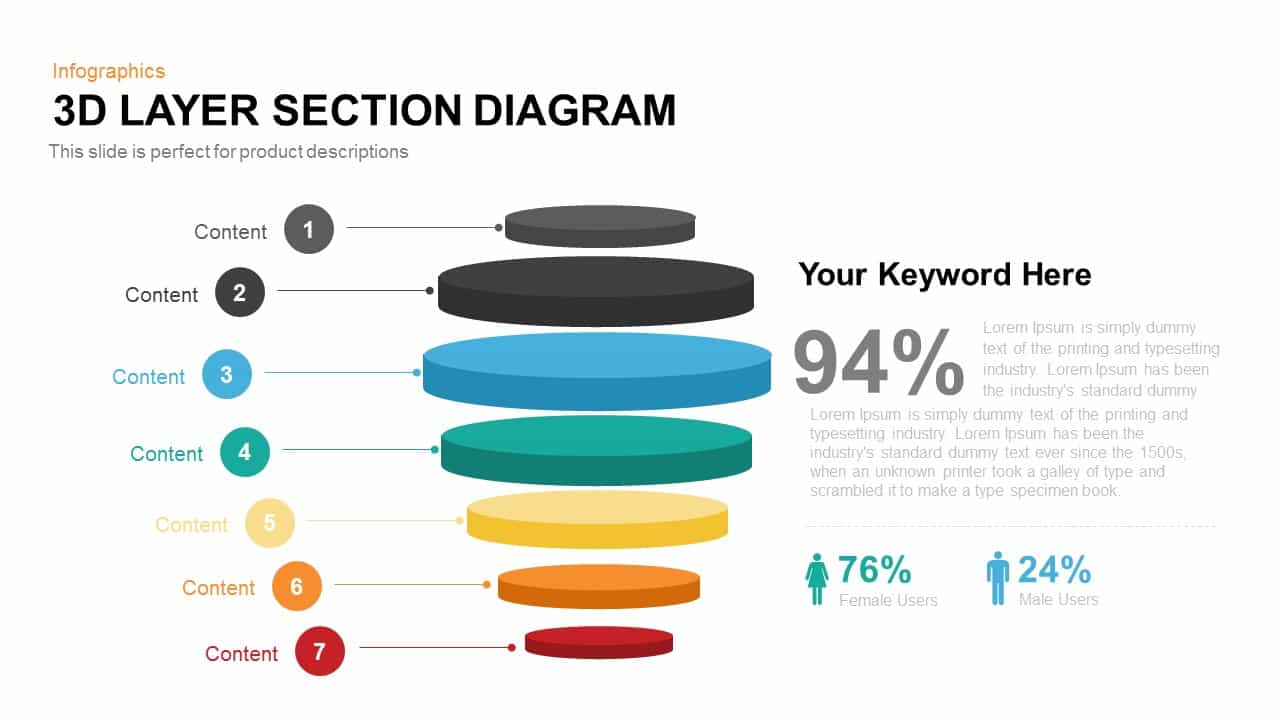
Modern 3D Layer Section Diagram Template for PowerPoint & Google Slides
Circular

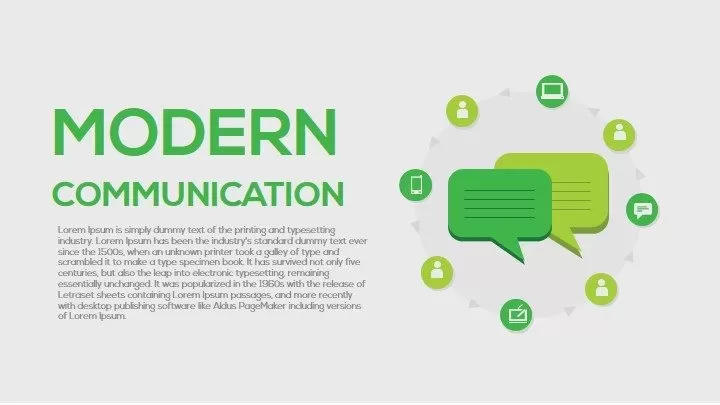
Modern Communication Process Diagram Template for PowerPoint & Google Slides
Process
Modern Five-Stage Cycle Process Diagram Template for PowerPoint & Google Slides
Process
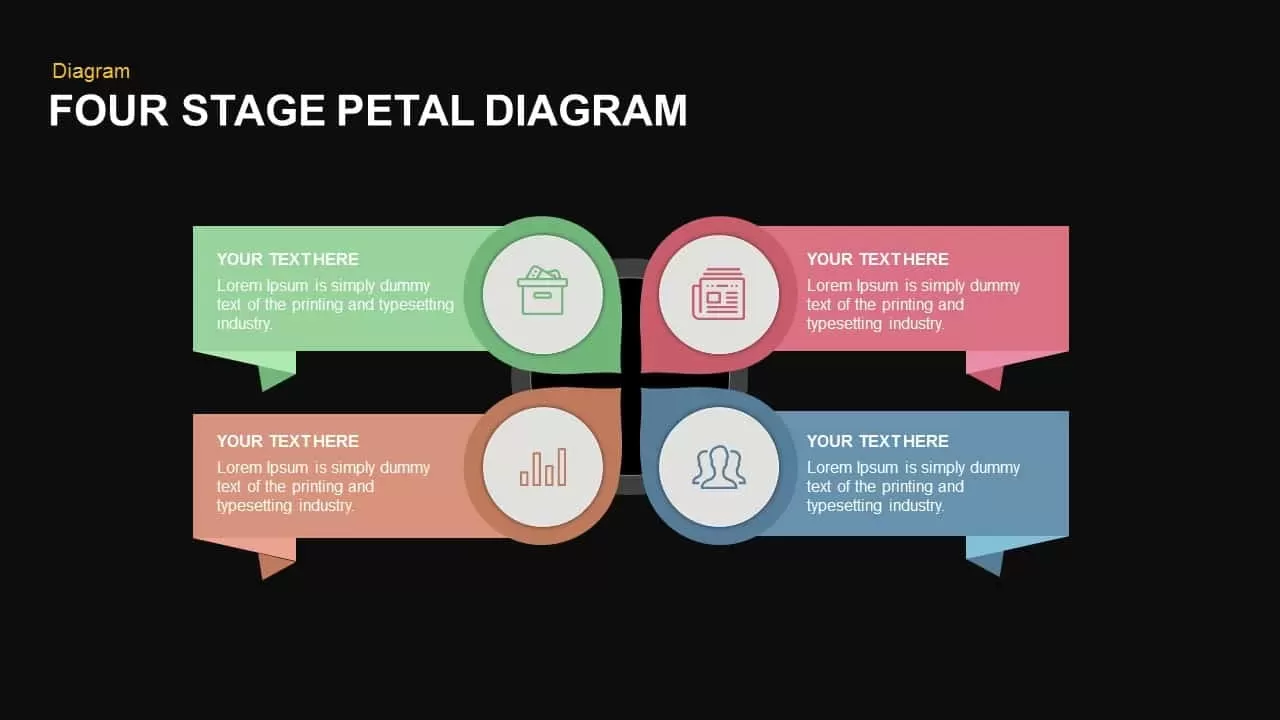
Modern Four-Stage Petal Diagram Template for PowerPoint & Google Slides
Circular
Modern Multi-Section Circle Diagram Template for PowerPoint & Google Slides
Circular
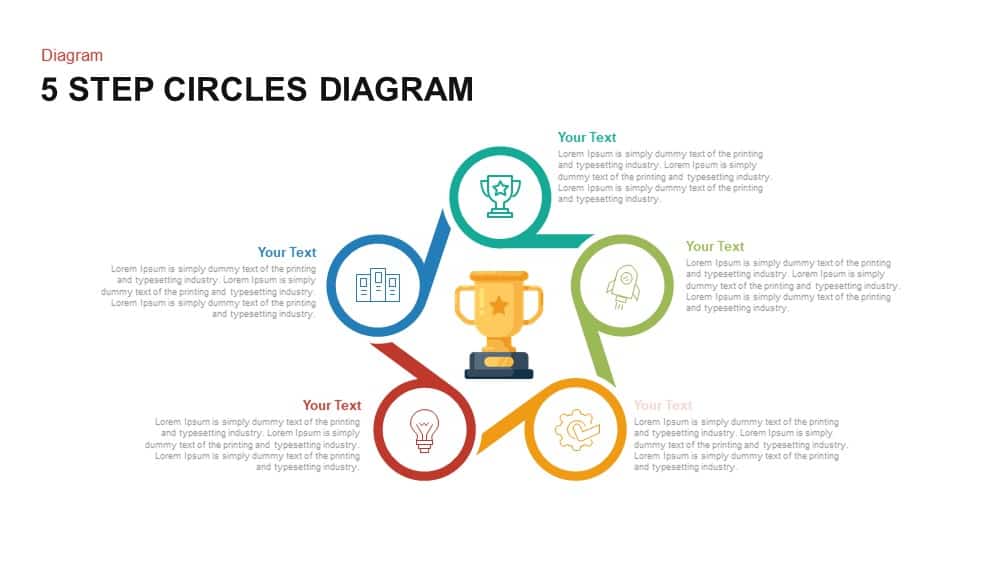
Modern Five-Step Circles Process Diagram Template for PowerPoint & Google Slides
Circular
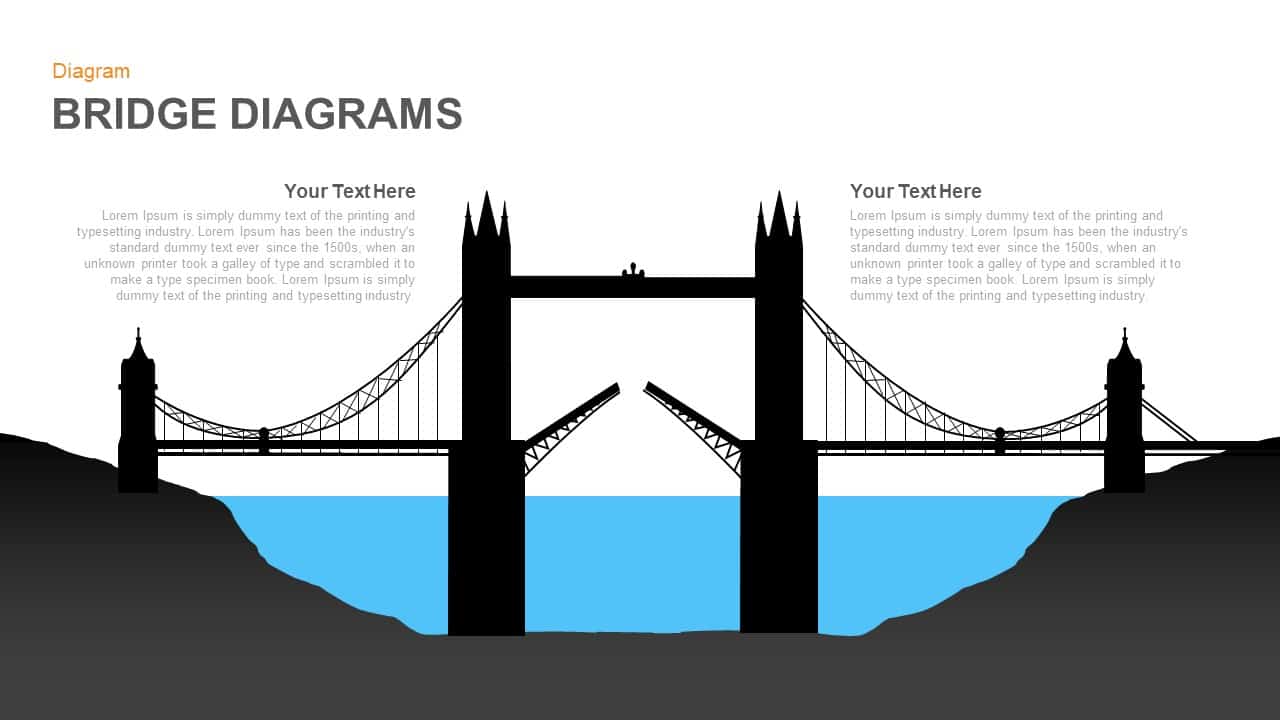
Modern Bridge Diagram Slide Design Template for PowerPoint & Google Slides
Process
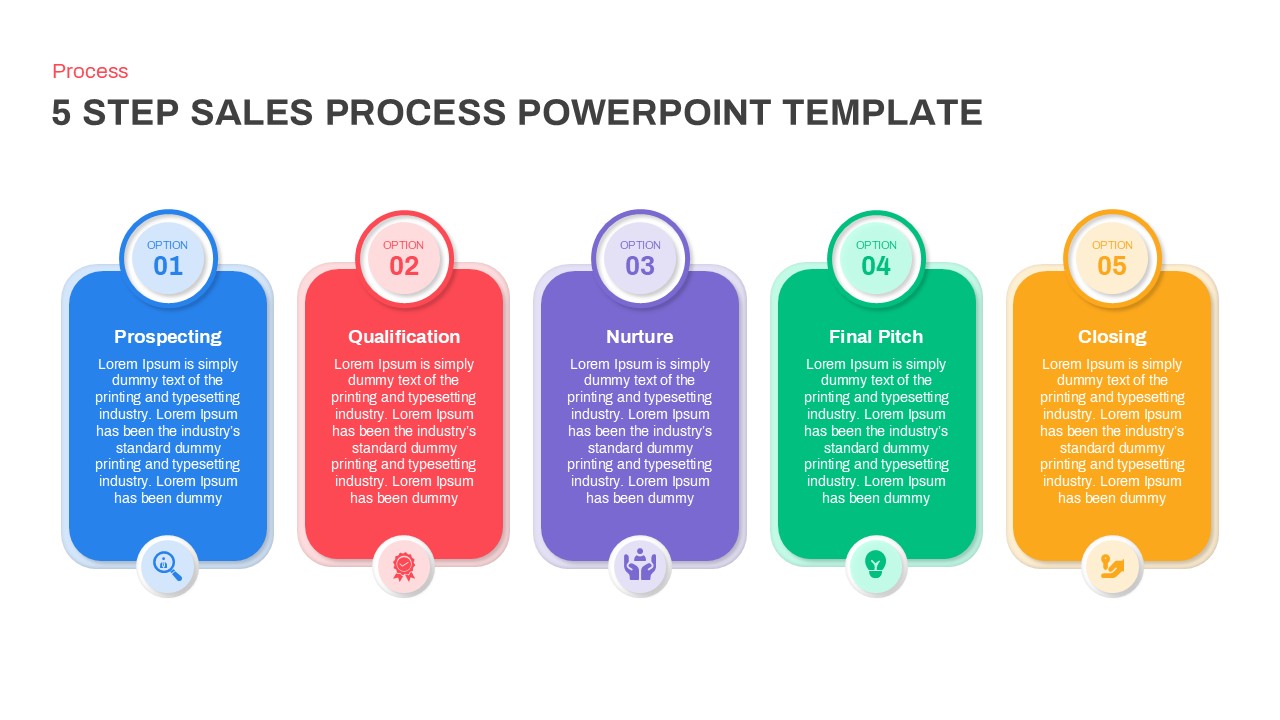
Modern 5-Step Sales Process Diagram Template for PowerPoint & Google Slides
Process
Modern 6-Step Cycle Diagram Slide Deck Template for PowerPoint & Google Slides
Process
Modern 4 Section Process Diagram Template for PowerPoint & Google Slides
Process
Modern Dunning Kruger Effect Diagram Template for PowerPoint & Google Slides
Business
Modern Organizational Hierarchy Diagram Template for PowerPoint & Google Slides
Org Chart
Modern Four-Level Pyramid Diagram Template for PowerPoint & Google Slides
Pyramid
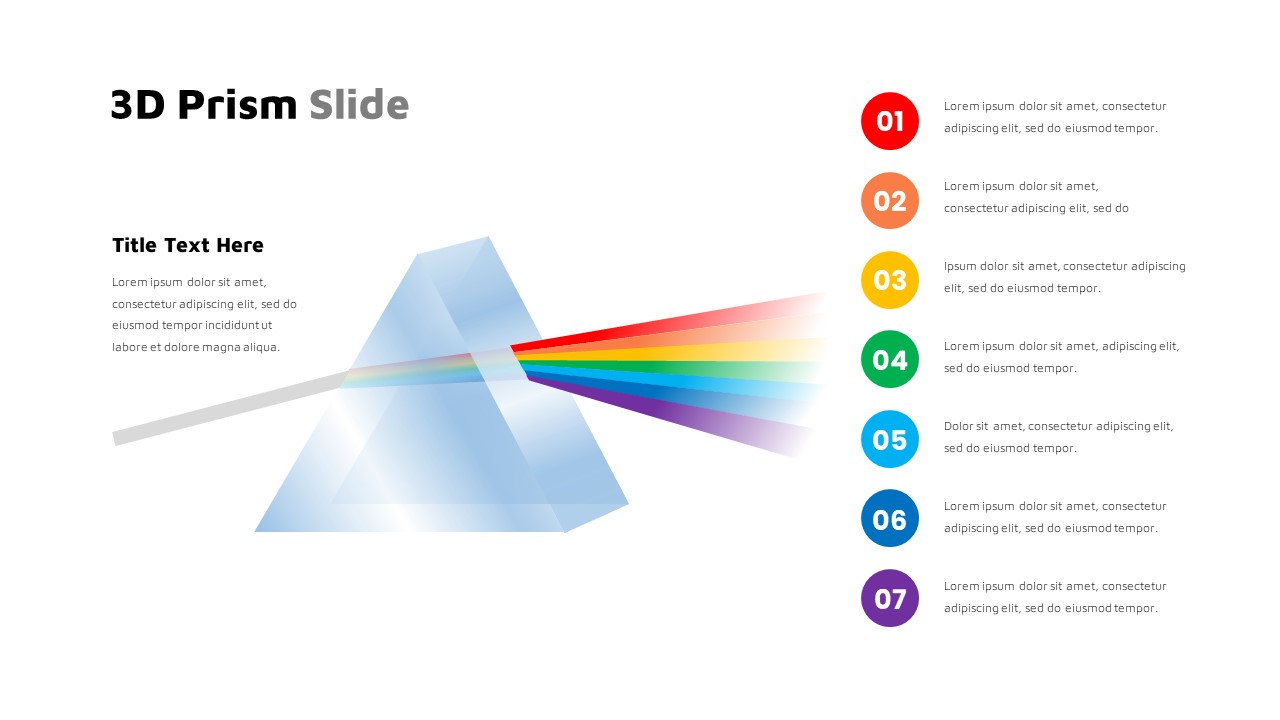
Modern Seven-Step 3D Prism Diagram Template for PowerPoint & Google Slides
Process
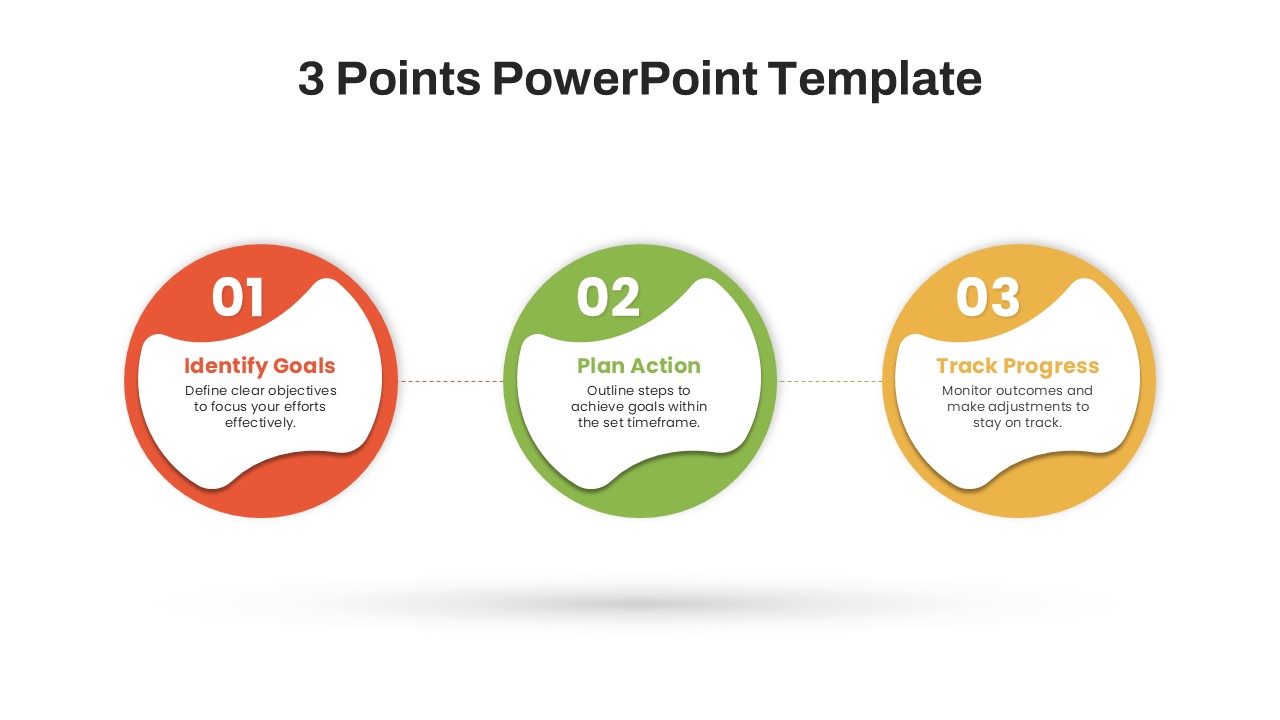
Modern Three-Point Process Diagram Template for PowerPoint & Google Slides
Process
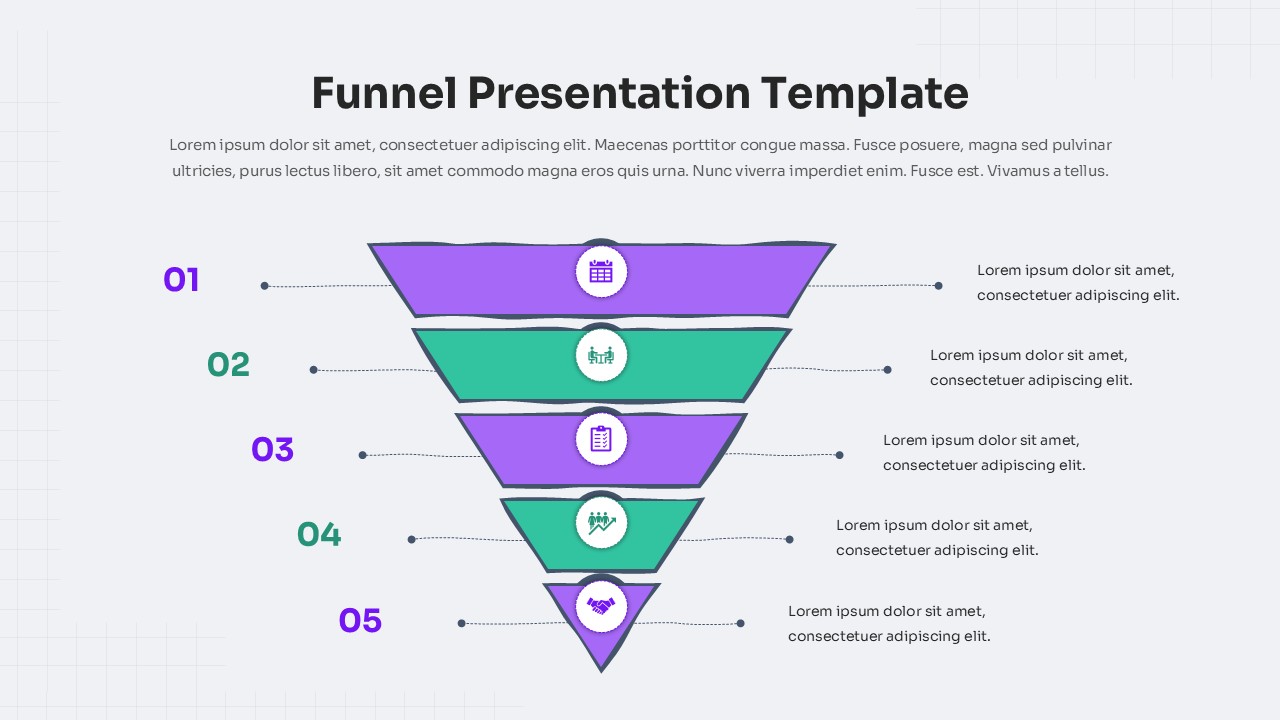
Five-Step Modern Funnel Diagram Template for PowerPoint & Google Slides
Funnel