Freight Logistics Dashboard Infographic Template for PowerPoint & Google Slides


Description
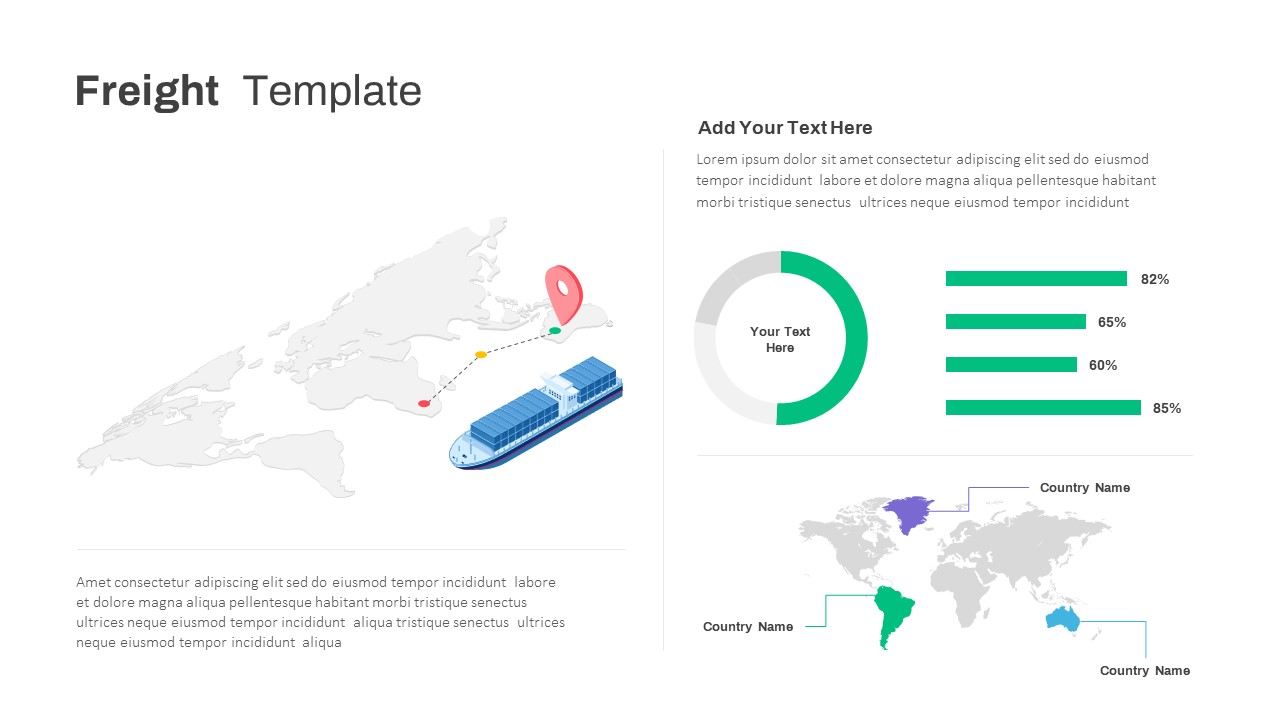
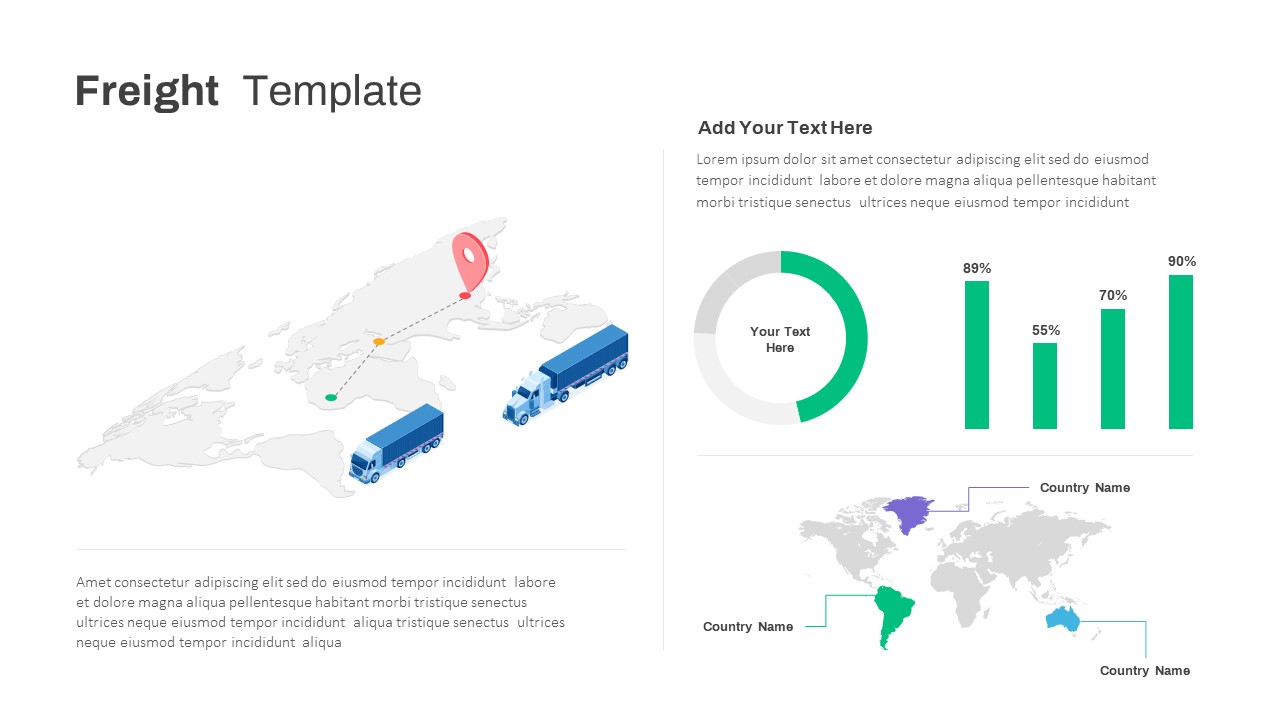
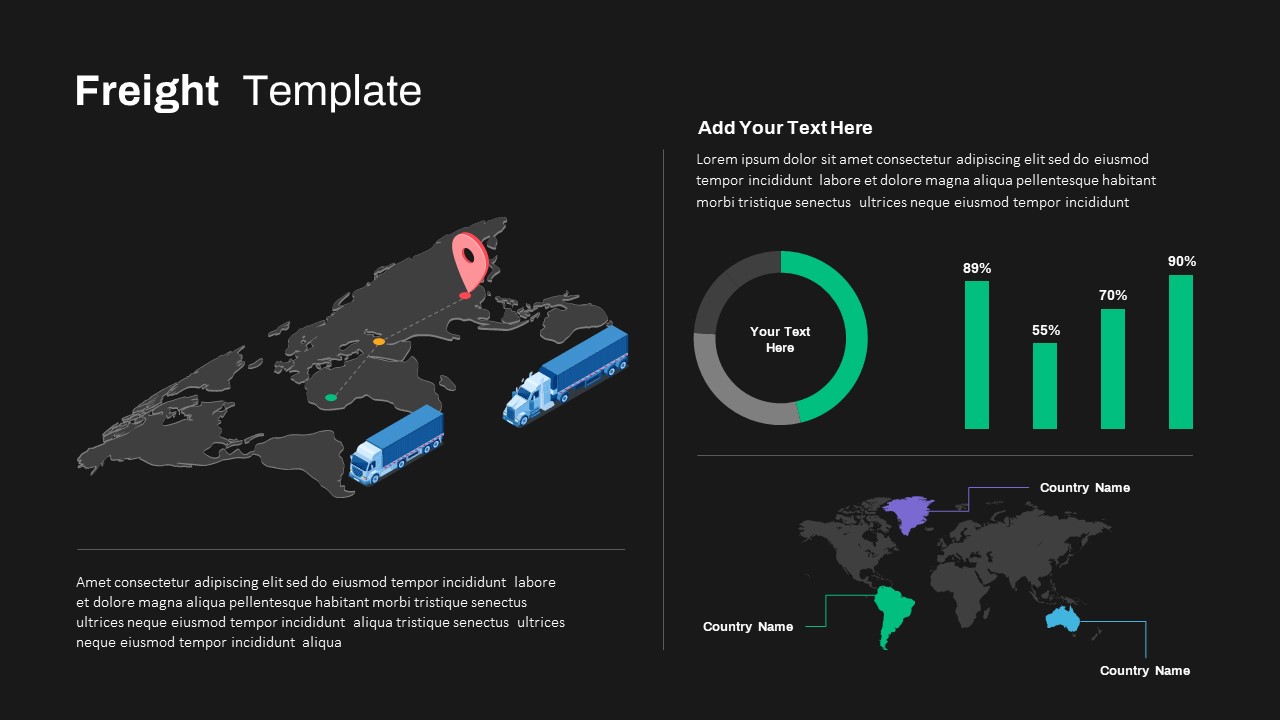
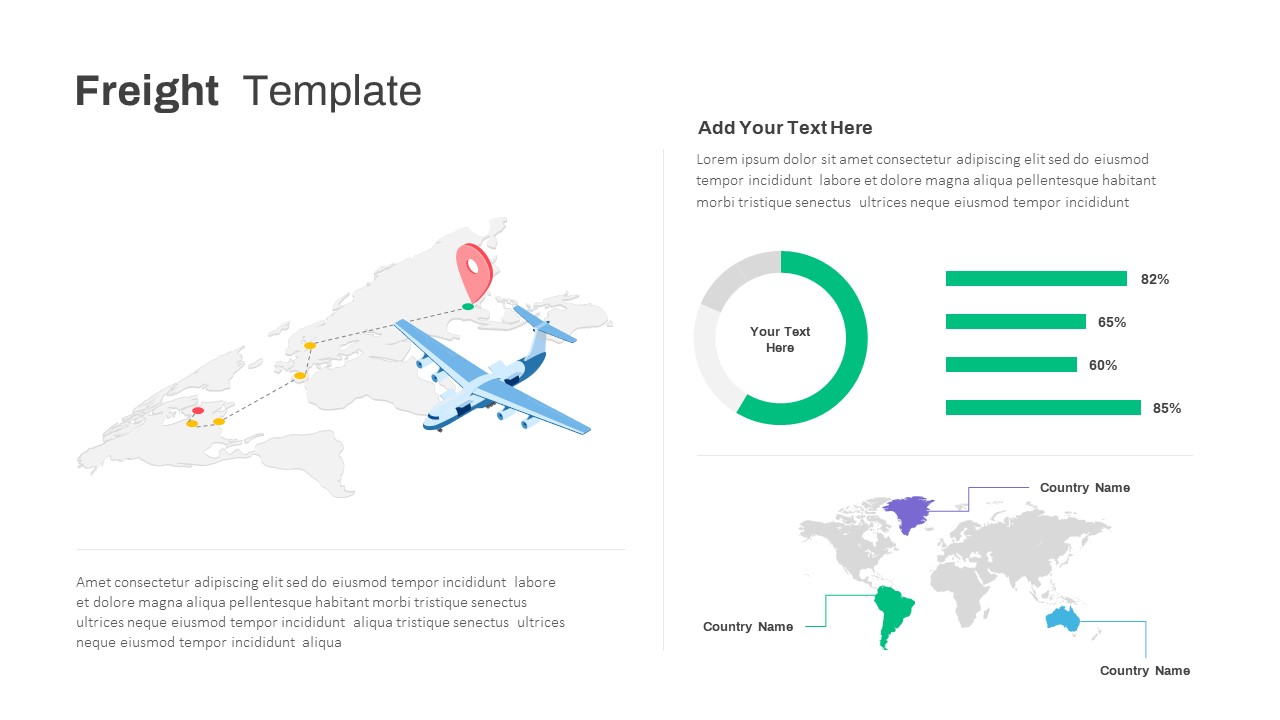
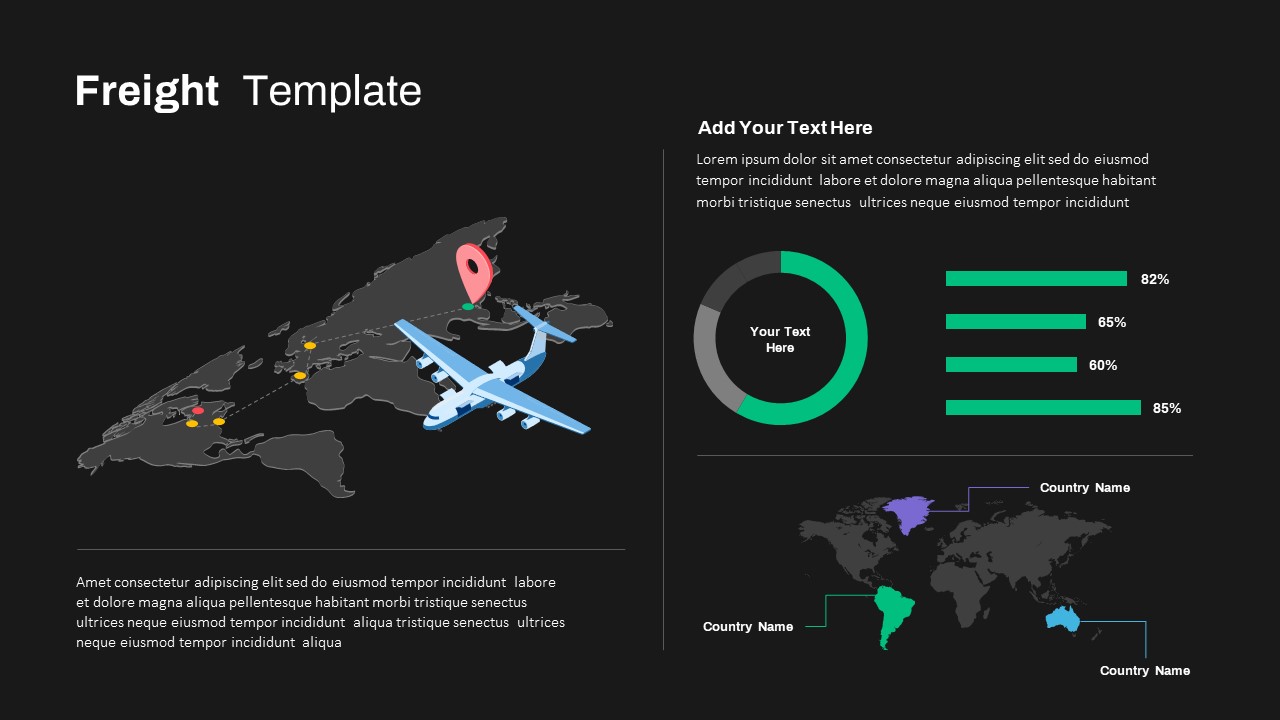
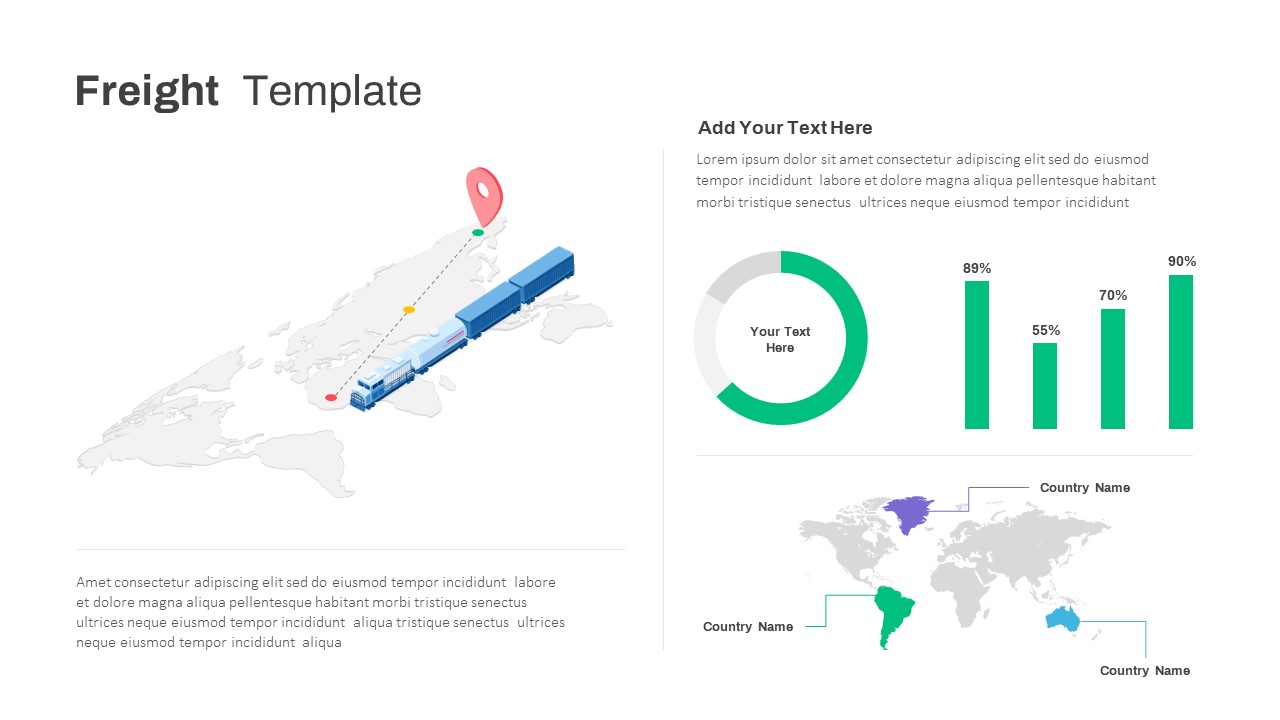
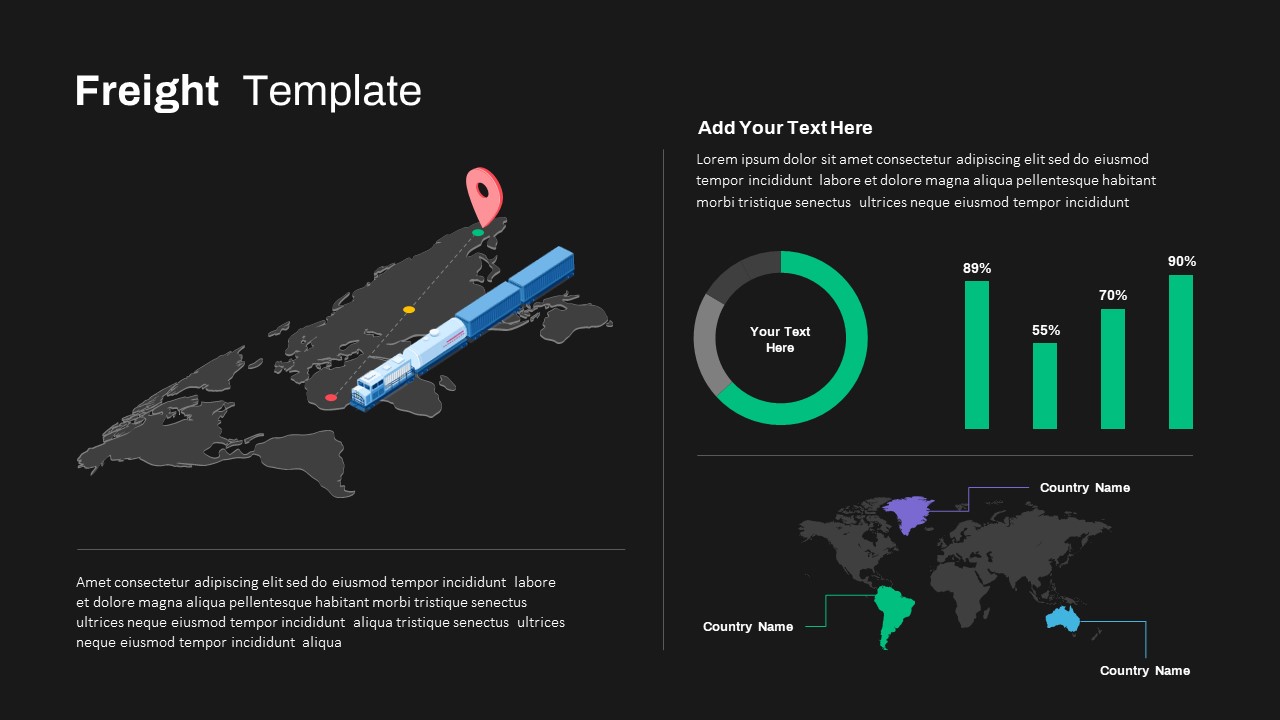
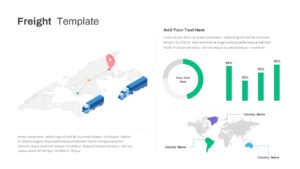
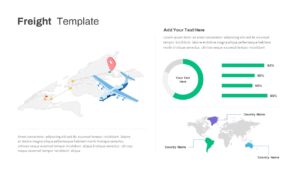
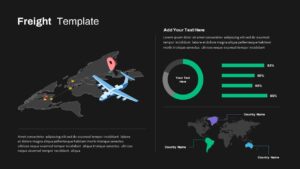
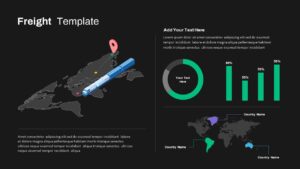
This Freight Logistics Dashboard Map slide merges geographic visualization with data-driven insights in a visually engaging, minimalist layout. The left half showcases a light-gray regional map adorned with colored location pins and dashed connector lines tracing cargo routes. Choose from three adjustable icons—a container truck, ocean cargo ship or cargo plane—to represent road, sea and air transportation modes. The right column features a dynamic ring chart in vivid green to highlight a key percentage value, complemented by vertical bar charts for comparative metric breakdowns. Below, a secondary world map highlights up to three countries in distinct accent colors (purple, teal, blue) with leader lines and text placeholders, enabling clear regional comparisons.
Built on master slides with editable placeholders, this template lets you customize map regions, swap icons, adjust data values, change color schemes and modify typography with ease. The balanced two-column design directs attention from spatial context to analytical details, ensuring audience focus and comprehension. Subtle shadows, crisp lines and ample white space reinforce a modern, professional aesthetic. Full compatibility with PowerPoint and Google Slides guarantees consistent formatting and high-resolution output across devices and platforms.
Who is it for
Supply chain managers, logistics coordinators, transportation planners, operations directors, business analysts, consultants and executive leadership teams will benefit from this slide when presenting route efficiency, shipment analytics, and regional performance metrics.
Other Uses
This versatile map dashboard can be repurposed for sales territory mapping, market entry strategies, import-export performance reviews, distribution network planning, KPI dashboards, product launch roadmaps or regional budgeting presentations—simply swap icons and data to adapt to any business scenario.
Login to download this file

Item ID
SB03667
Related Templates

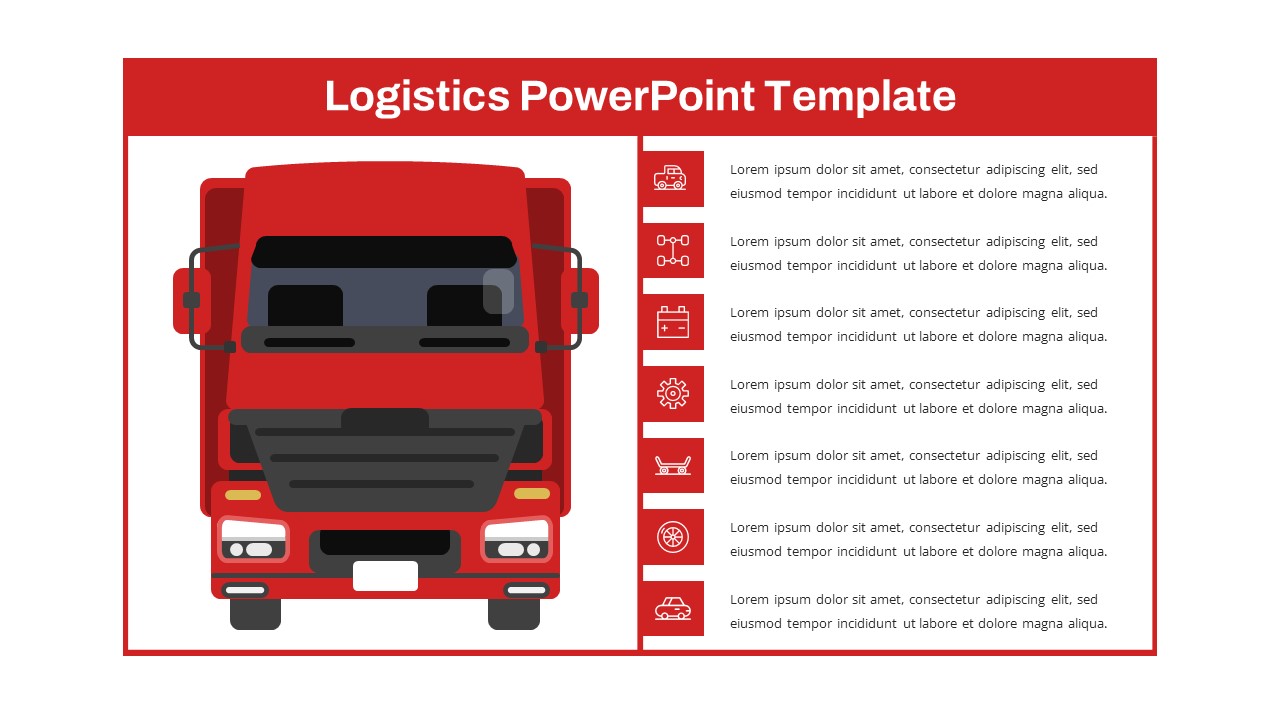
Logistics Truck Illustration Infographic Template for PowerPoint & Google Slides
Process
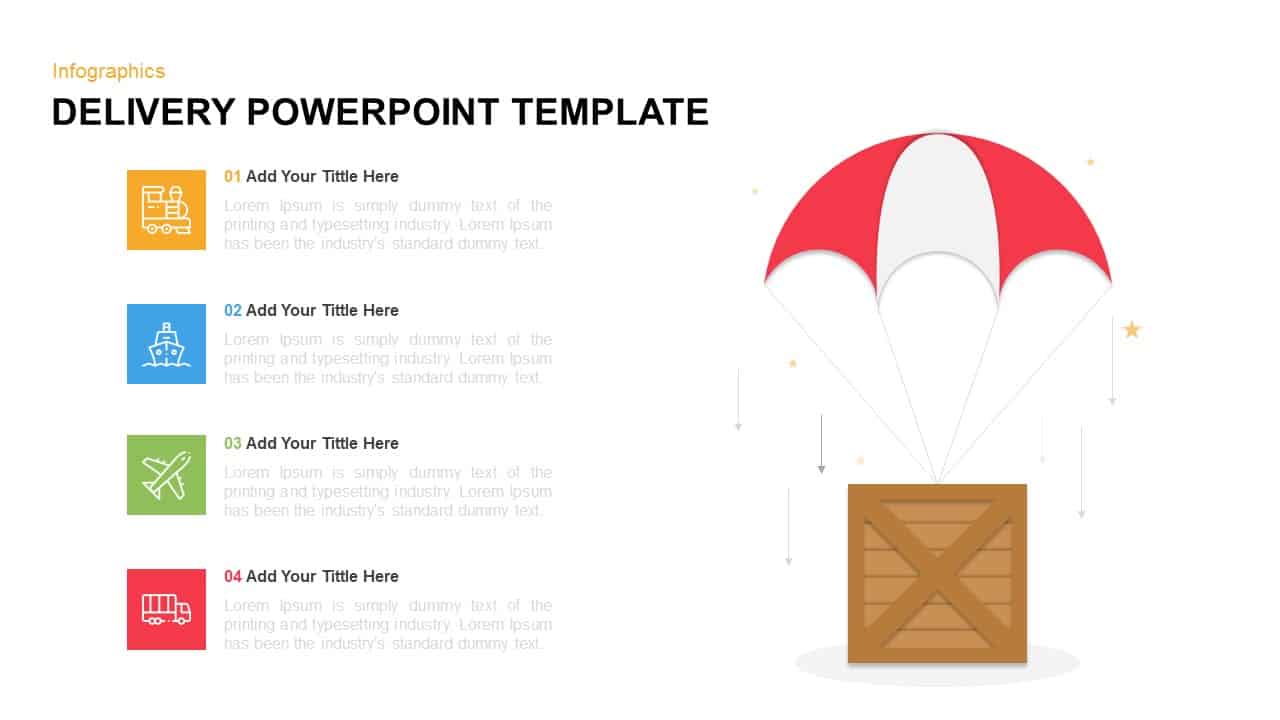
Delivery Logistics Infographic Visual Template for PowerPoint & Google Slides
Process
Transportation Logistics PowerPoint Diagram template for PowerPoint & Google Slides
Process
Logistics and Supply Chain Management Template for PowerPoint & Google Slides
Process
Supply Chain Management Logistics Cover Template for PowerPoint & Google Slides
Pitch Deck

Waterways Maritime Logistics Theme template for PowerPoint & Google Slides
Pitch Deck
Logistics Pitch Deck Template for PowerPoint & Google Slides
Manufacturing
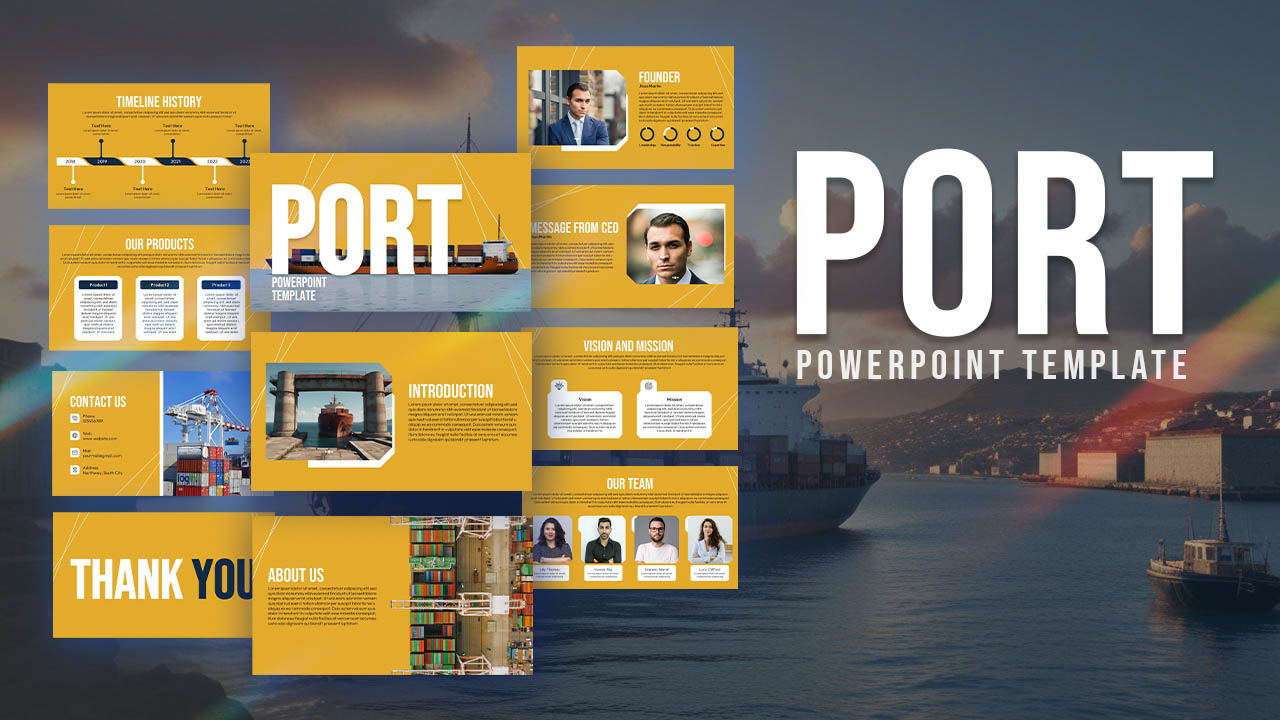
Port Logistics Presentation Template for PowerPoint & Google Slides
Company Profile
Free Red Truck Logistics Overview Slide for PowerPoint & Google Slides
Infographics
Free

Dynamic Data Dashboard Infographic Template for PowerPoint & Google Slides
Bar/Column
Professional Nurse Infographic Dashboard Template for PowerPoint & Google Slides
Nursing
Free Metro UI Dashboard Infographic Template for PowerPoint & Google Slides
Business Report
Free
Mastodon Metrics Infographic Dashboard Template for PowerPoint & Google Slides
Business Report
Free Infographic Statistics Dashboard Slide for PowerPoint & Google Slides
Bar/Column
Free
Free KPI Dashboard PowerPoint Template for PowerPoint & Google Slides
Charts
Free
E-commerce Analytics Dashboard Template for PowerPoint & Google Slides
Bar/Column
Product Usage Analytics Dashboard Chart Template for PowerPoint & Google Slides
Bar/Column
Data Analytics Dashboard Design template for PowerPoint & Google Slides
Bar/Column

Efficiency KPI Dashboard Metaphor Template for PowerPoint & Google Slides
Infographics
Business Dashboard Analytics & KPIs Template for PowerPoint & Google Slides
Bar/Column

Professional Team Efficiency Dashboard Template for PowerPoint & Google Slides
Business Report
Project Management Dashboard Template for PowerPoint & Google Slides
Project
Website Performance Dashboard template for PowerPoint & Google Slides
Charts
Sales Performance Dashboard template for PowerPoint & Google Slides
Business Report
Immigration Data Dashboard Template for PowerPoint & Google Slides
Bar/Column
Employee Skill Analysis Dashboard Template for PowerPoint & Google Slides
Employee Performance
Sales Growth Dashboard: KPI Gauge & Line Template for PowerPoint & Google Slides
Revenue
Social Media Performance Dashboard Template for PowerPoint & Google Slides
Bar/Column
Net Promoter Score Dashboard Template for PowerPoint & Google Slides
Customer Experience
Modern Project Status Report Dashboard Template for PowerPoint & Google Slides
Project Status
Performance KPI Dashboard Slide Template for PowerPoint & Google Slides
Business Report
Bull and Bear Stock Market Dashboard Template for PowerPoint & Google Slides
Infographics
KPI Dashboard template for PowerPoint & Google Slides
Business Report
KPI Dashboard Overview template for PowerPoint & Google Slides
Finance
KPI Dashboard Data Visualization Template for PowerPoint & Google Slides
Bar/Column
KPI Dashboard Data Overview Slide Template for PowerPoint & Google Slides
Bar/Column
Interactive Benchmarking Gauge Dashboard Template for PowerPoint & Google Slides
Pie/Donut
Heat Map Risk Matrix Dashboard Template for PowerPoint & Google Slides
Comparison Chart
Project Status Dashboard Table Template for PowerPoint & Google Slides
Project Status
Project Status Dashboard with Metrics Template for PowerPoint & Google Slides
Project Status
Colorful Project Status Dashboard Template for PowerPoint & Google Slides
Project Status
Weekly Update Schedule Dashboard Template for PowerPoint & Google Slides
Agenda
Project Status Dashboard Template for PowerPoint & Google Slides
Project Status
Weekly Status Report Dashboard Template for PowerPoint & Google Slides
HR
Website Performance Monitoring Dashboard Template for PowerPoint & Google Slides
Business Report
One Pager Project Status Dashboard Template for PowerPoint & Google Slides
Project Status
One Pager Annual Report Dashboard Template for PowerPoint & Google Slides
Business Report
Social Media Analytics Dashboard Template for PowerPoint & Google Slides
Digital Marketing
Social Media Statistics 2023 Dashboard Template for PowerPoint & Google Slides
Comparison
Soccer Match Stats Dashboard Slide Template for PowerPoint & Google Slides
Graphics
Employee Satisfaction Survey Dashboard Template for PowerPoint & Google Slides
Employee Performance
Customer Satisfaction KPI Dashboard Template for PowerPoint & Google Slides
Customer Experience
Weekly Project Status Dashboard Template for PowerPoint & Google Slides
Project Status
Free Quarterly Business Review Dashboard Template for PowerPoint & Google Slides
Business
Free
Cost Cutting Savings Dashboard Template for PowerPoint & Google Slides
Pie/Donut
Macroeconomic Indicators Dashboard Template for PowerPoint & Google Slides
PEST
Free Monthly Report PowerPoint Template for PowerPoint & Google Slides
Business Report
Free
Michigan County Map with KPI Dashboard Template for PowerPoint & Google Slides
World Maps
Quarterly Financial Summary Dashboard Template for PowerPoint & Google Slides
Business Report
Banking Financial Overview Dashboard Template for PowerPoint & Google Slides
Finance
Quarterly Business Review Dashboard Template for PowerPoint & Google Slides
Pitch Deck
Monthly Business Review Dashboard Deck Template for PowerPoint & Google Slides
Business Report
DevOps KPI Dashboard Performance Metrics Template for PowerPoint & Google Slides
Software Development
Purchasing KPI Metrics Dashboard Template for PowerPoint & Google Slides
Business Report
Procurement KPI Dashboard & Metrics Template for PowerPoint & Google Slides
Business Report
Project Progress Dashboard Pie Charts Template for PowerPoint & Google Slides
Project
Monthly Sales Performance Dashboard Template for PowerPoint & Google Slides
Charts
HR Report Dashboard Template for PowerPoint & Google Slides
Employee Performance
Budget Forecast Dashboard & Donut Charts Template for PowerPoint & Google Slides
Pie/Donut
Risk Level Gauge Comparison Dashboard Template for PowerPoint & Google Slides
Comparison
Inventory Management Dashboard Template for PowerPoint & Google Slides
Process
Digital Marketing KPIs Dashboard Dark Template for PowerPoint & Google Slides
Business Report
Employee Performance Metrics Dashboard Template for PowerPoint & Google Slides
Employee Performance
Turnover Analysis Dashboard Template for PowerPoint & Google Slides
Employee Performance
Project Tracking Dashboard Table Template for PowerPoint & Google Slides
Project Status
Action Items Management Dashboard Table Template for PowerPoint & Google Slides
Project Status
Electronic Health Records Dashboard template for PowerPoint & Google Slides
Health
Customer Interview Insights Dashboard Template for PowerPoint & Google Slides
Customer Experience
Account Overview Dashboard template for PowerPoint & Google Slides
Business
Project Status Dashboard Report Template for PowerPoint & Google Slides
Project Status
Project Status Update Dashboard Table Template for PowerPoint & Google Slides
Project Status
Cohort Analysis Retention Dashboard Template for PowerPoint & Google Slides
Comparison Chart
Project Status Dashboard Template for PowerPoint & Google Slides
Project Status
Dashboard Project Status Template for PowerPoint & Google Slides
Project Status
Project Status Template Dashboard with Gauge for PowerPoint & Google Slides
Project Status
Task Completion Rate Dashboard Template for PowerPoint & Google Slides
Business
Project Status Dashboard with RAG Legend Template for PowerPoint & Google Slides
Project Status
End of Year Review Dashboard Template for PowerPoint & Google Slides
Business Report
Construction Project Dashboard Template for PowerPoint & Google Slides
Project
Employee Headcount Dashboard Report Template for PowerPoint & Google Slides
Employee Performance
LinkedIn Performance Reporting Dashboard Template for PowerPoint & Google Slides
Digital Marketing
4DX Scoreboard KPI Gauge Dashboard Template for PowerPoint & Google Slides
Business Strategy
Quarterly Financial Report Dashboard Template for PowerPoint & Google Slides
Finance
Dashboard Templates for PowerPoint & Google Slides
Bar/Column
Engineering Maintenance Dashboard Slide for PowerPoint & Google Slides
Software Development
Incident Tracking Dashboard for PowerPoint & Google Slides
Business Plan
Patient-Satisfaction KPI Dashboard for PowerPoint & Google Slides
Business
MVP Product Roadmap Delivery Dashboard for PowerPoint & Google Slides
Roadmap

Free Data Analytics Dashboard Template for PowerPoint
Charts
Free
Google Ads Optimization & Performance Infographic Template for PowerPoint & Google Slides
Digital Marketing