Free Simple Venn Diagram Overview template for PowerPoint & Google Slides

Description
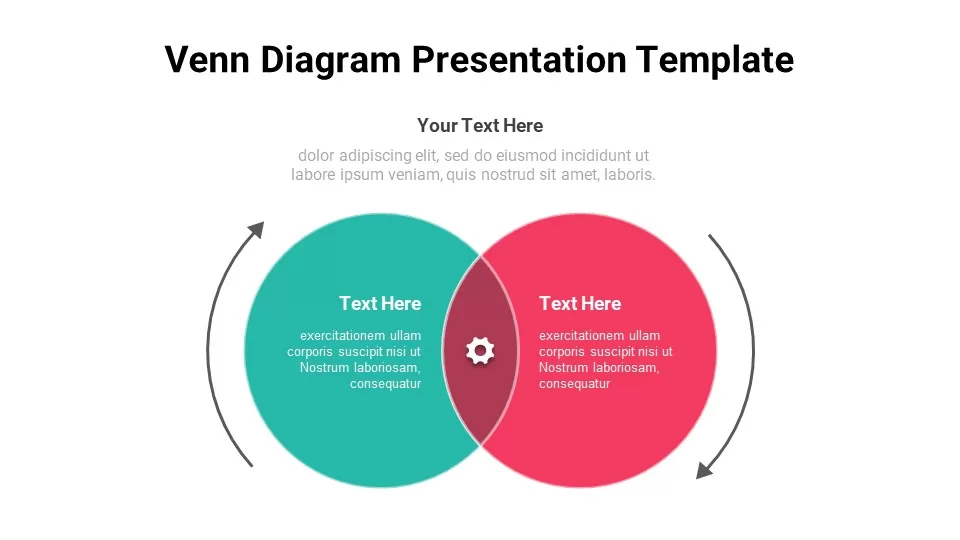
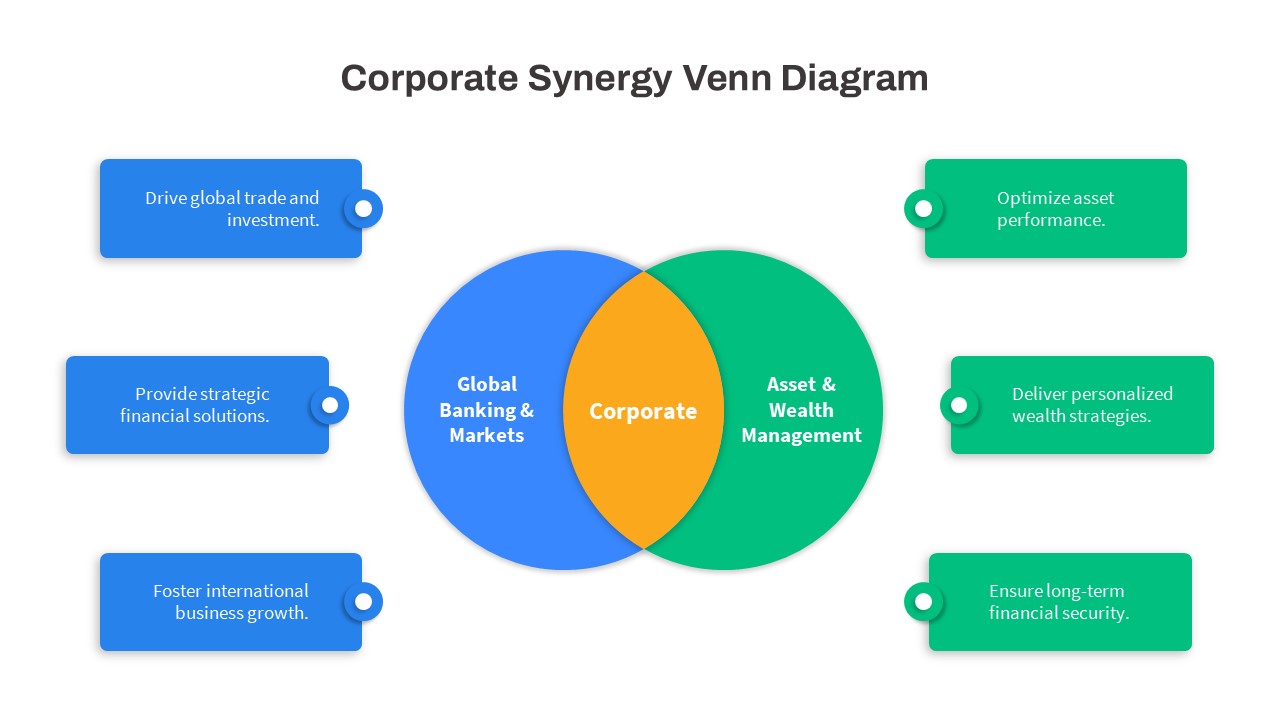
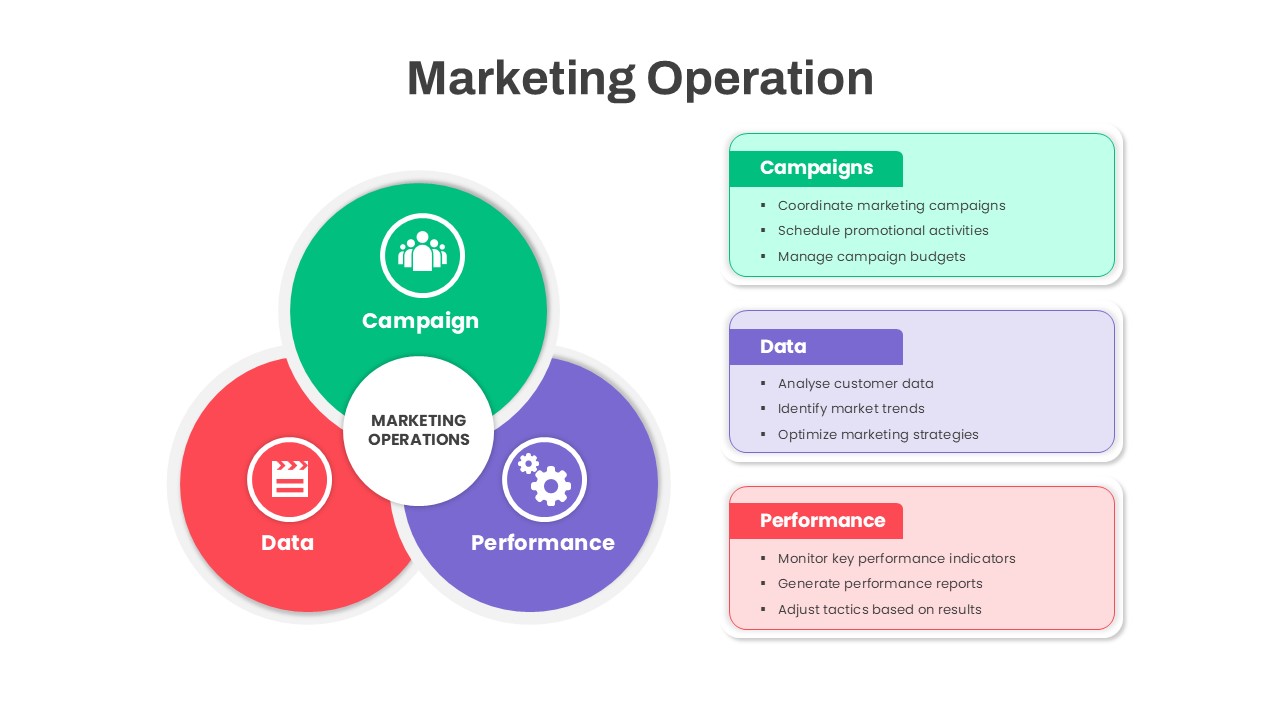
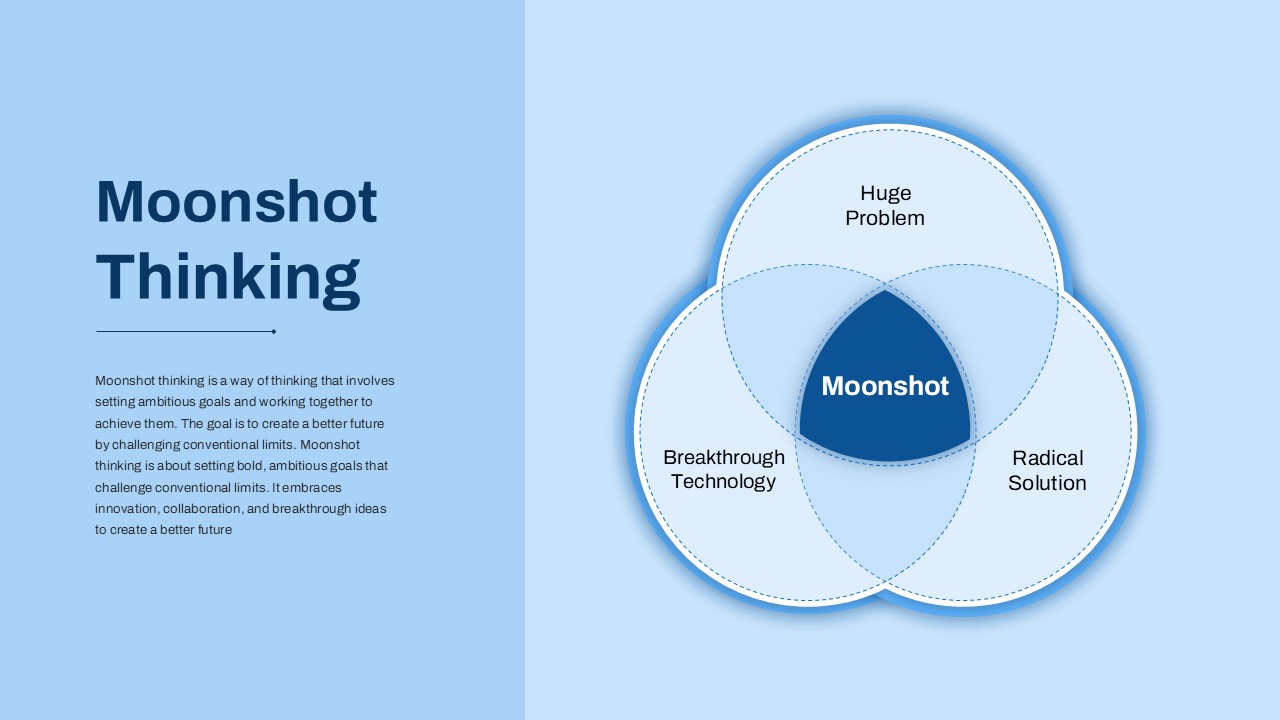
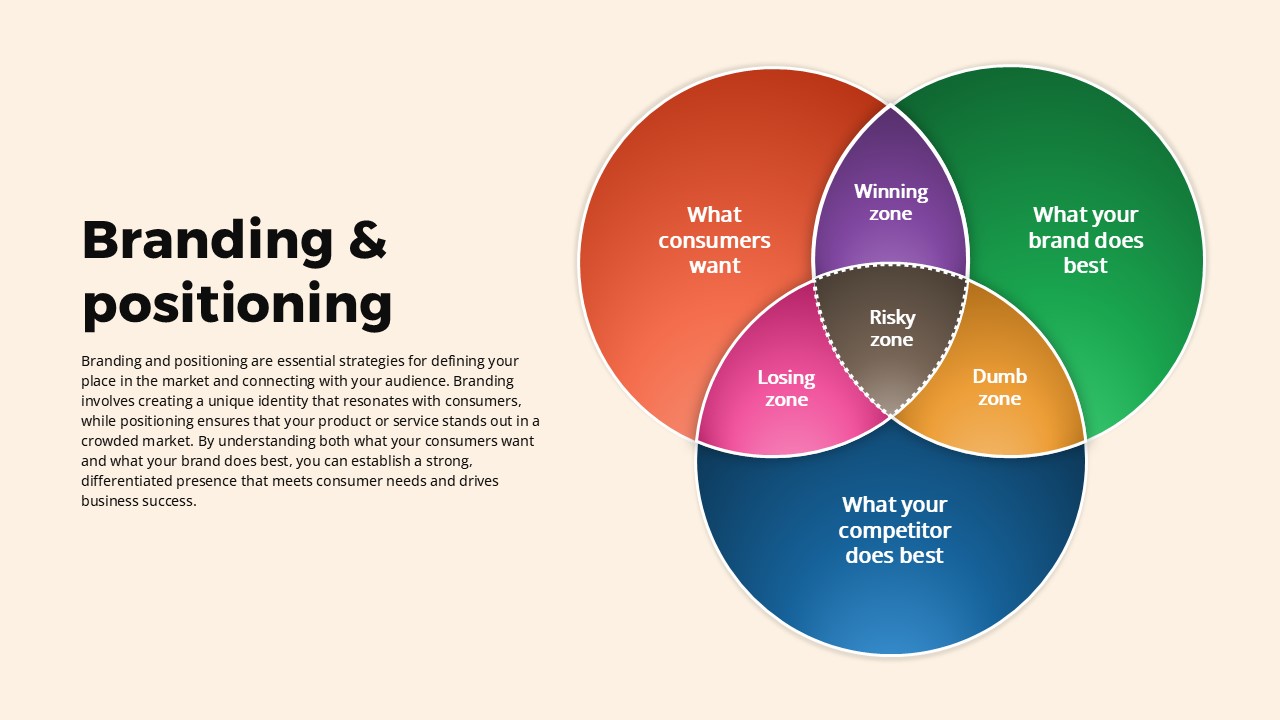
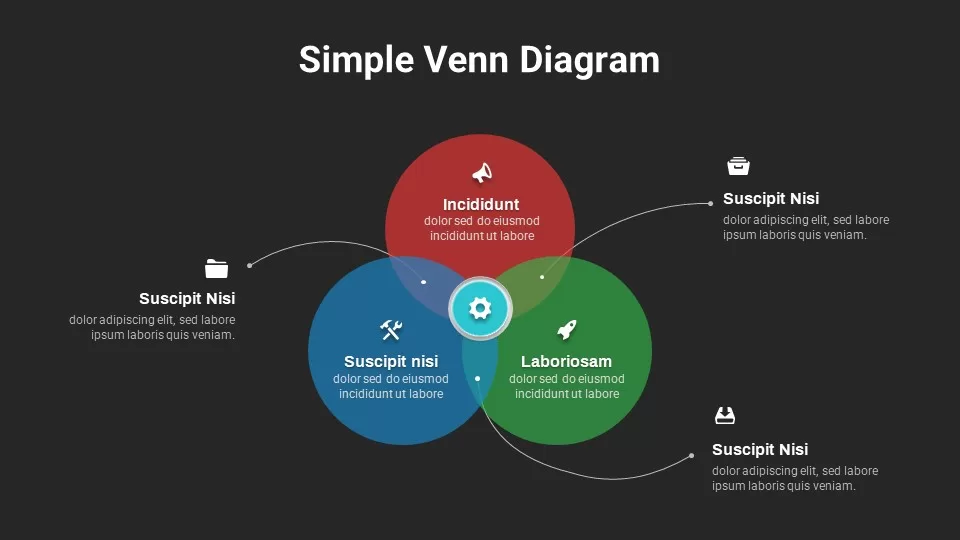
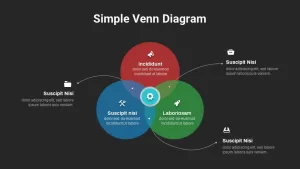
This simple yet effective Venn diagram slide visually represents the relationships between three distinct concepts with clarity and impact. Each of the three circles is color-coded—red, blue, and green—offering a clear distinction between the sets while their overlapping sections highlight the intersection of common points. Accompanying each circle are relevant icons, helping to reinforce the concepts represented in each area, and a clean, minimalist layout ensures easy comprehension.
This template is ideal for illustrating overlapping categories, comparisons, or shared traits between different elements. The Venn diagram’s straightforward design is perfect for data visualization in both professional and educational settings, such as business presentations, academic lectures, or project discussions.
Editable in both PowerPoint and Google Slides, the slide allows you to quickly change the text, color scheme, or icons to suit your needs. Whether you’re comparing product features, analyzing market segments, or exploring conceptual overlaps, this diagram offers an easy and visually appealing way to communicate your ideas.
Who is it for
This Venn diagram slide is suited for professionals, educators, and students who need to display the relationships between three concepts or categories. It’s perfect for business analysts, project managers, or marketing teams, as well as academic instructors and researchers.
Other Uses
Apart from comparisons, this slide can be used to show intersections in data sets, explore shared opportunities or challenges, or illustrate decision-making processes. It’s also applicable for showing Venn diagrams of product features, market opportunities, or customer personas in various industries.
Login to download this file

Item ID
SB02620
Related Templates

Free Venn Diagram template for PowerPoint & Google Slides
Charts
Free

Simple Agenda Slide Deck Overview Template for PowerPoint & Google Slides
Agenda
Four-Circle Venn Process Diagram template for PowerPoint & Google Slides
Process
Venn Diagram Infographics Pack Template for PowerPoint & Google Slides
Circular
Creative Three-Circle Venn Diagram Template for PowerPoint & Google Slides
Comparison
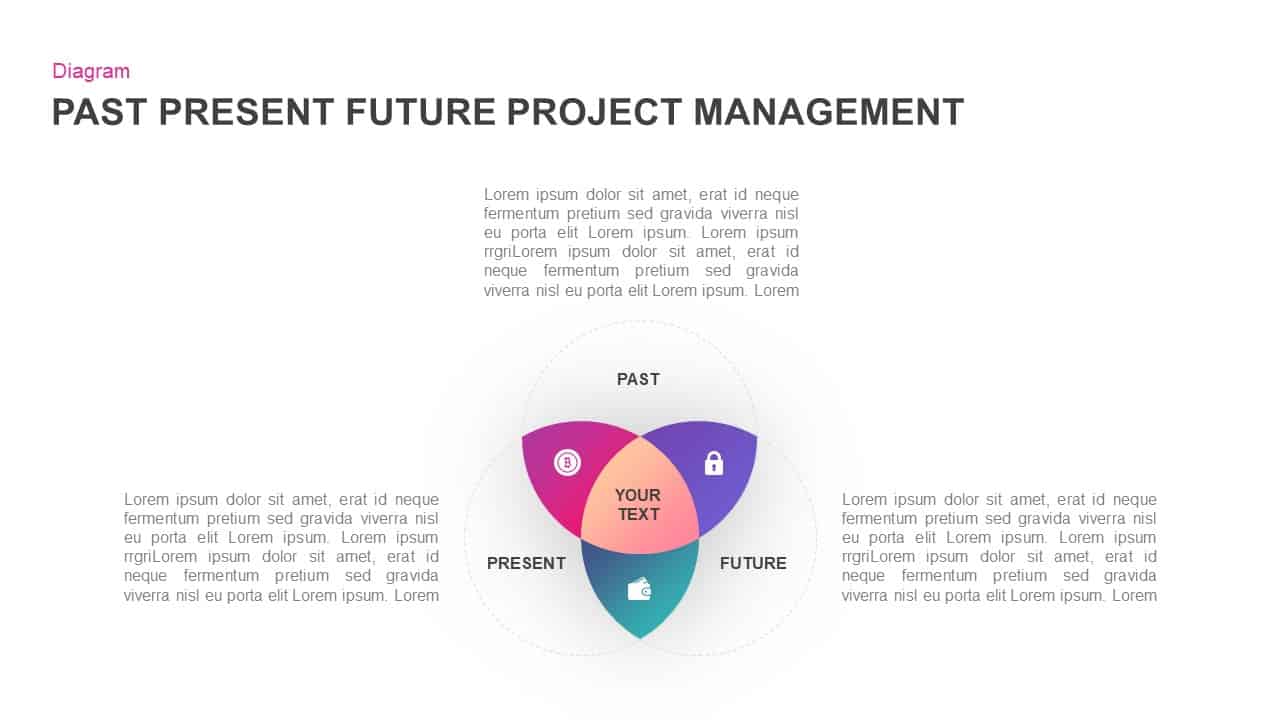
Past, Present & Future Venn Diagram Template for PowerPoint & Google Slides
Comparison
Colorful Venn Diagram Infographics Template for PowerPoint & Google Slides
Circular
Modern Gear Venn Diagram Infographic Template for PowerPoint & Google Slides
Comparison
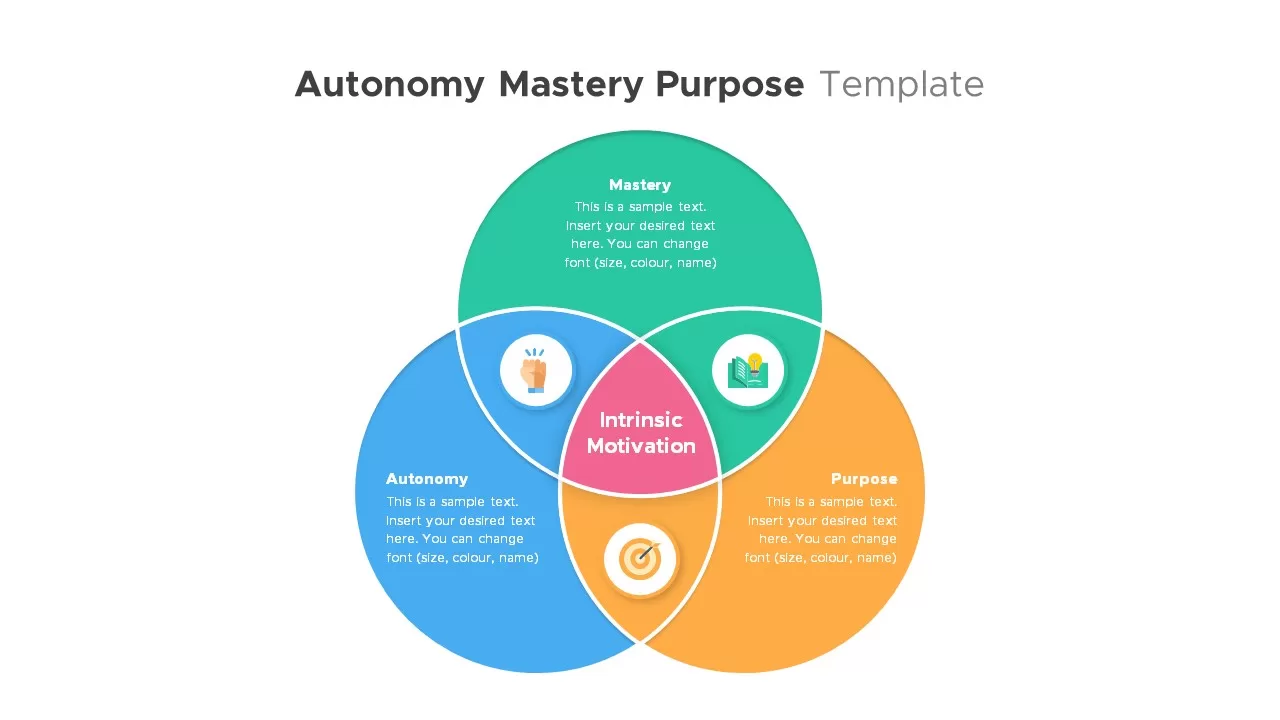
Autonomy, Mastery & Purpose Venn Diagram Template for PowerPoint & Google Slides
Circular
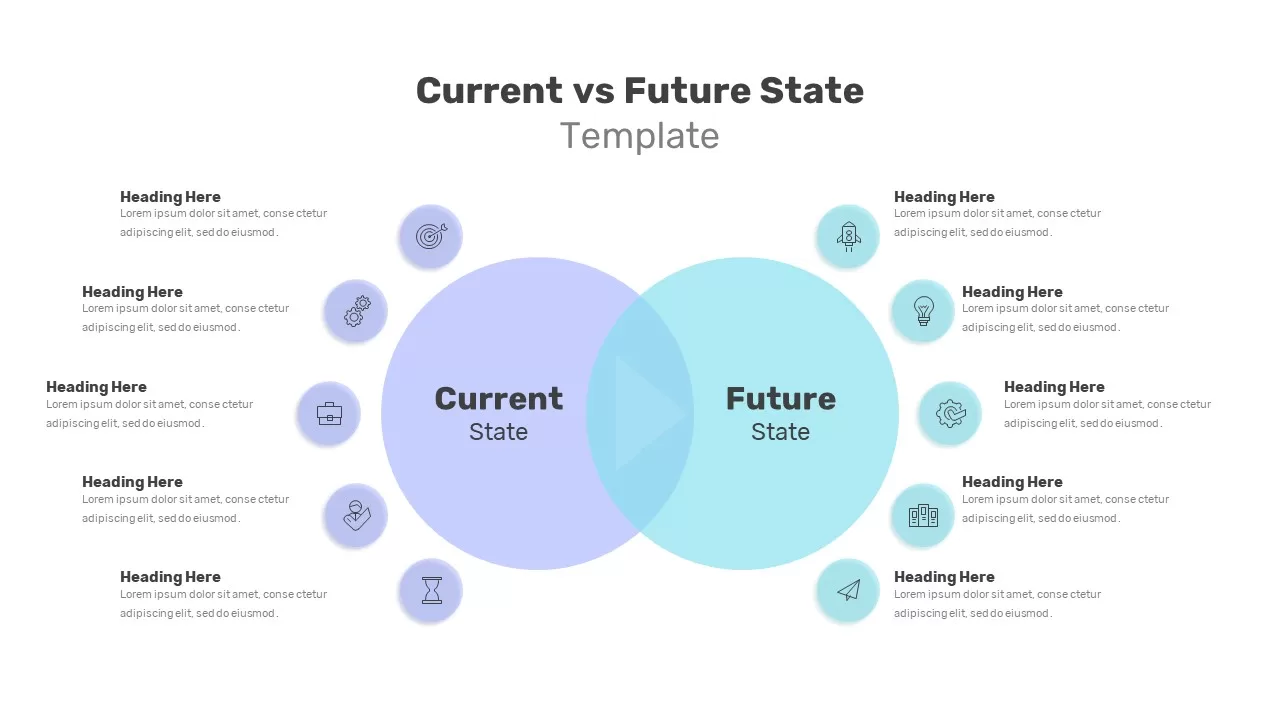
Current vs Future State Venn Diagram Template for PowerPoint & Google Slides
Comparison
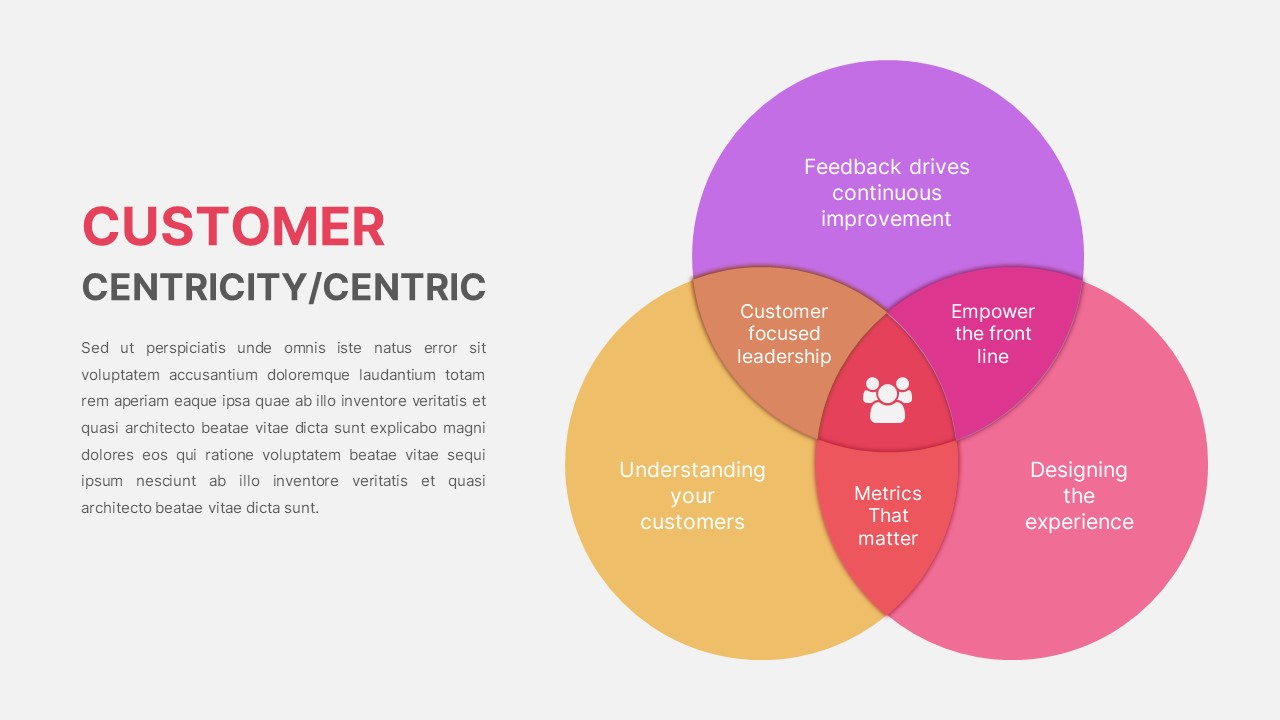
Customer Centricity Venn Diagram template for PowerPoint & Google Slides
Infographics
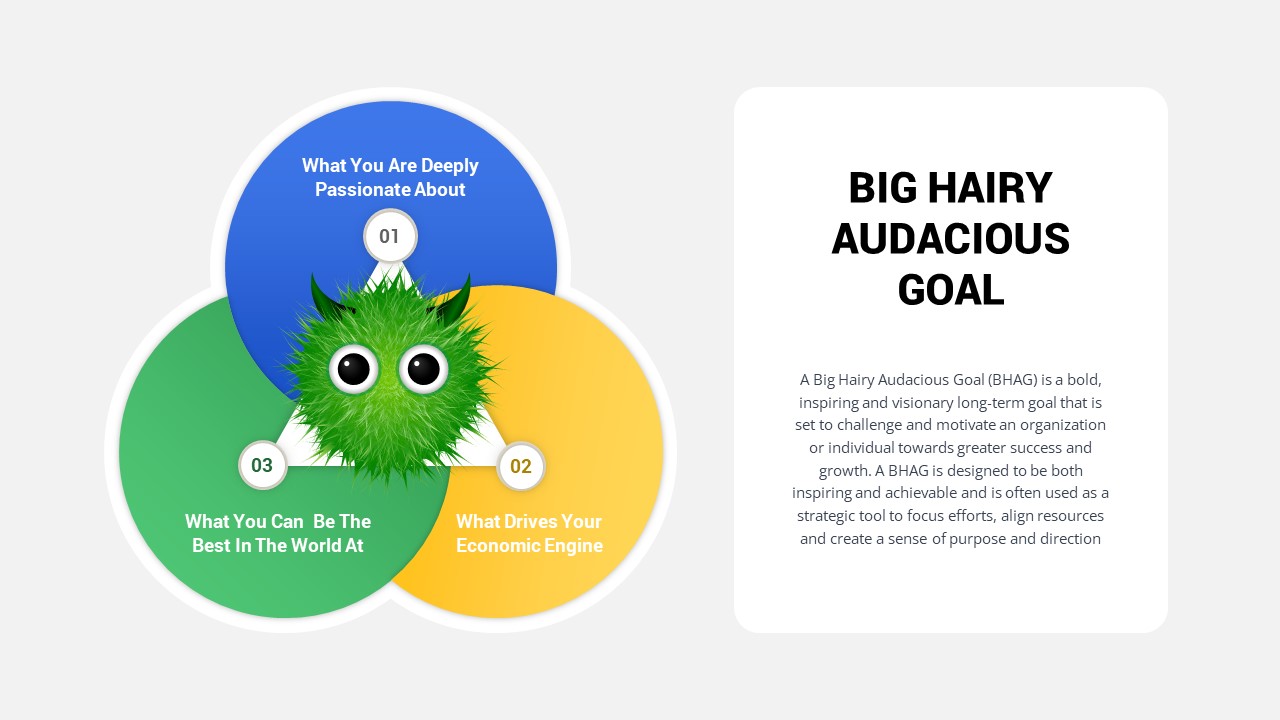
Big Hairy Audacious Goal Venn Diagram Template for PowerPoint & Google Slides
Circular
Five Circle Venn Diagram for Template for PowerPoint & Google Slides
Circular
8 Circle Venn Diagram Infographic Design Template for PowerPoint & Google Slides
Circular
Professional 6 Circle Venn Diagram Template for PowerPoint & Google Slides
Circular
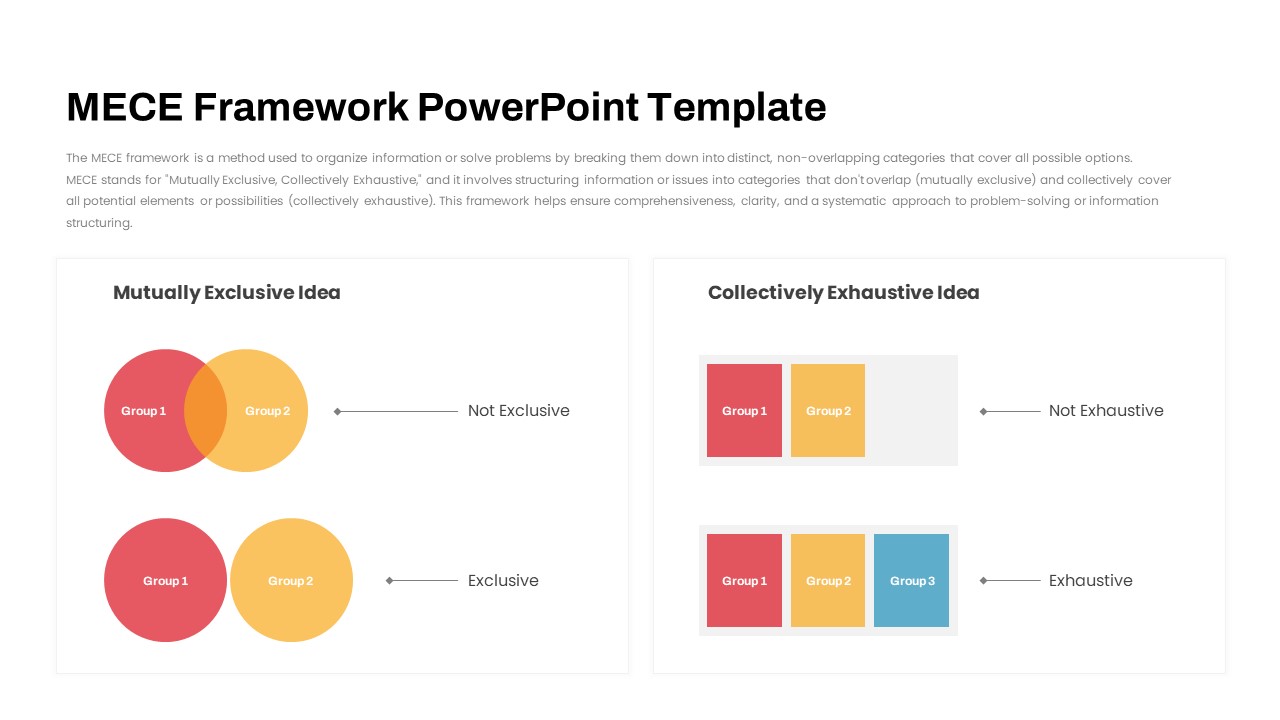
MECE Framework Venn & Block Diagram Template for PowerPoint & Google Slides
Comparison
Corporate Synergy Venn Diagram Template for PowerPoint & Google Slides
Comparison
Salience Model Venn Diagram Infographic Template for PowerPoint & Google Slides
Circular
Modern Growth Hacking Venn Diagram Template for PowerPoint & Google Slides
Circular
Marketing Operations Venn Diagram Template for PowerPoint & Google Slides
Circular
3Ps Triple Bottom Line Venn Diagram Template for PowerPoint & Google Slides
Circular
Bold Moonshot Thinking Venn Diagram Template for PowerPoint & Google Slides
Circular
Branding and Positioning Venn Diagram Template for PowerPoint & Google Slides
Comparison
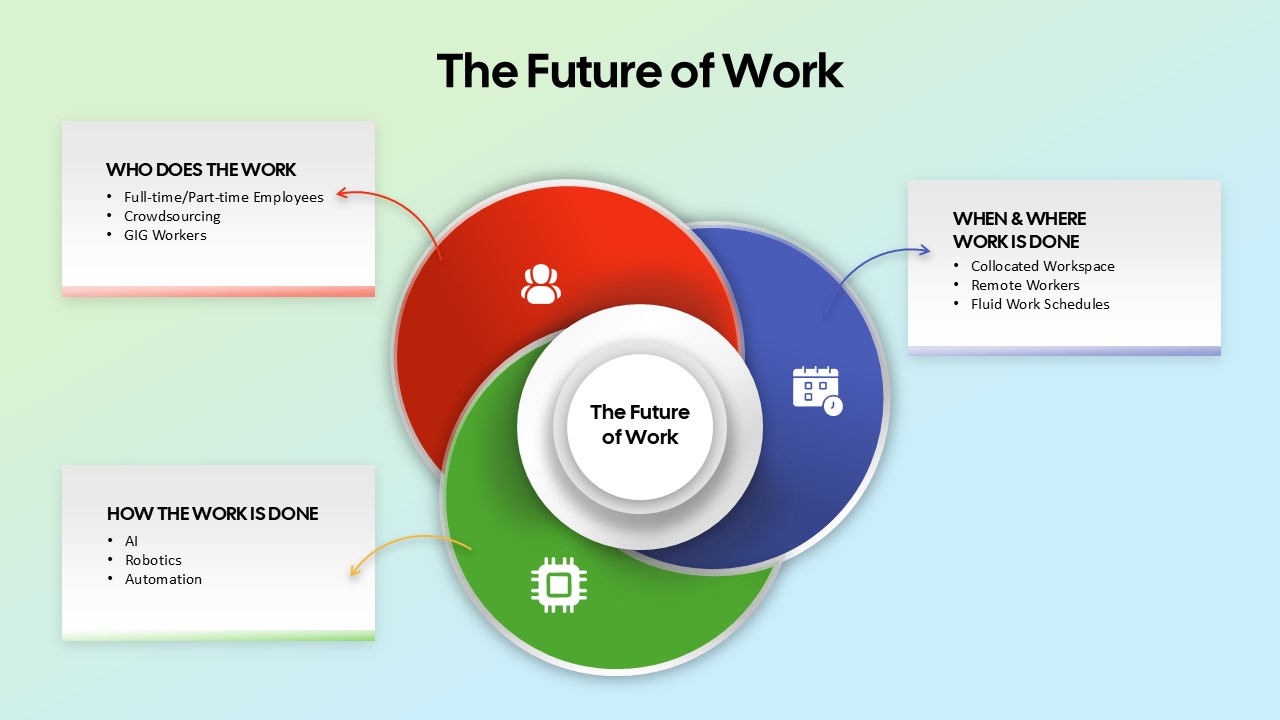
The Future of Work Venn Diagram Template for PowerPoint & Google Slides
Circular
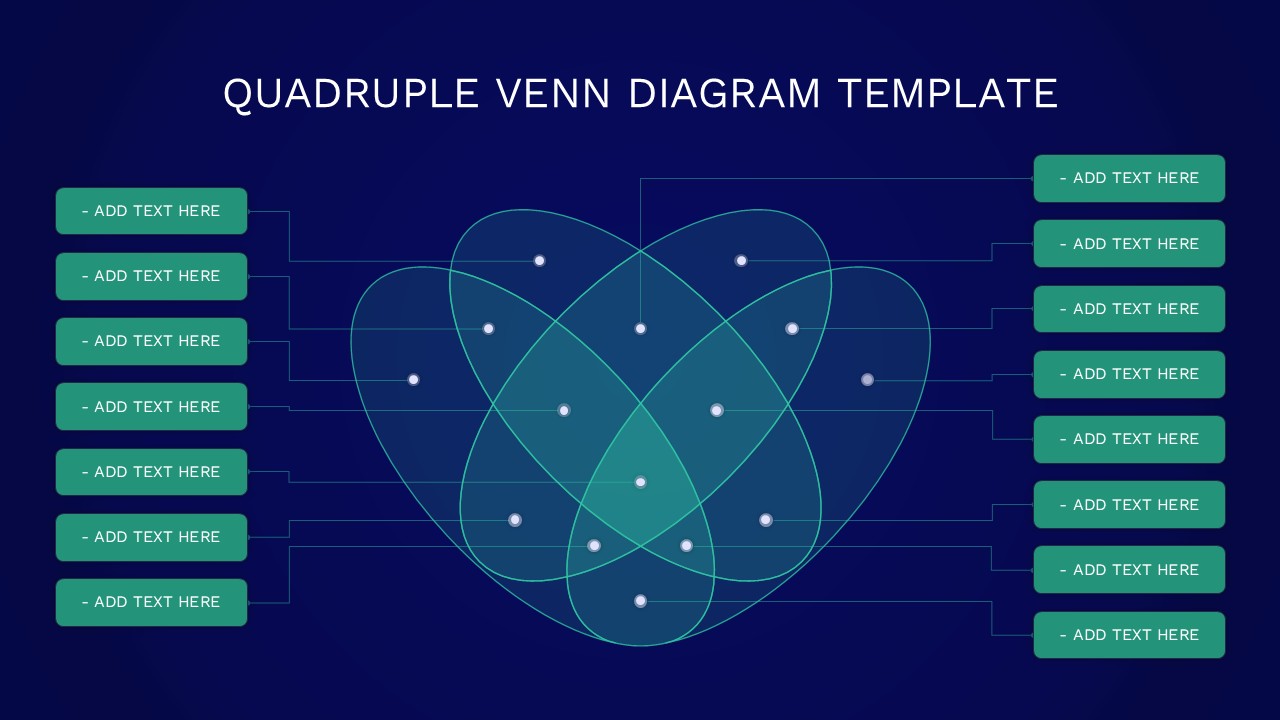
Quadruple Venn Diagram Template for PowerPoint & Google Slides
Circular
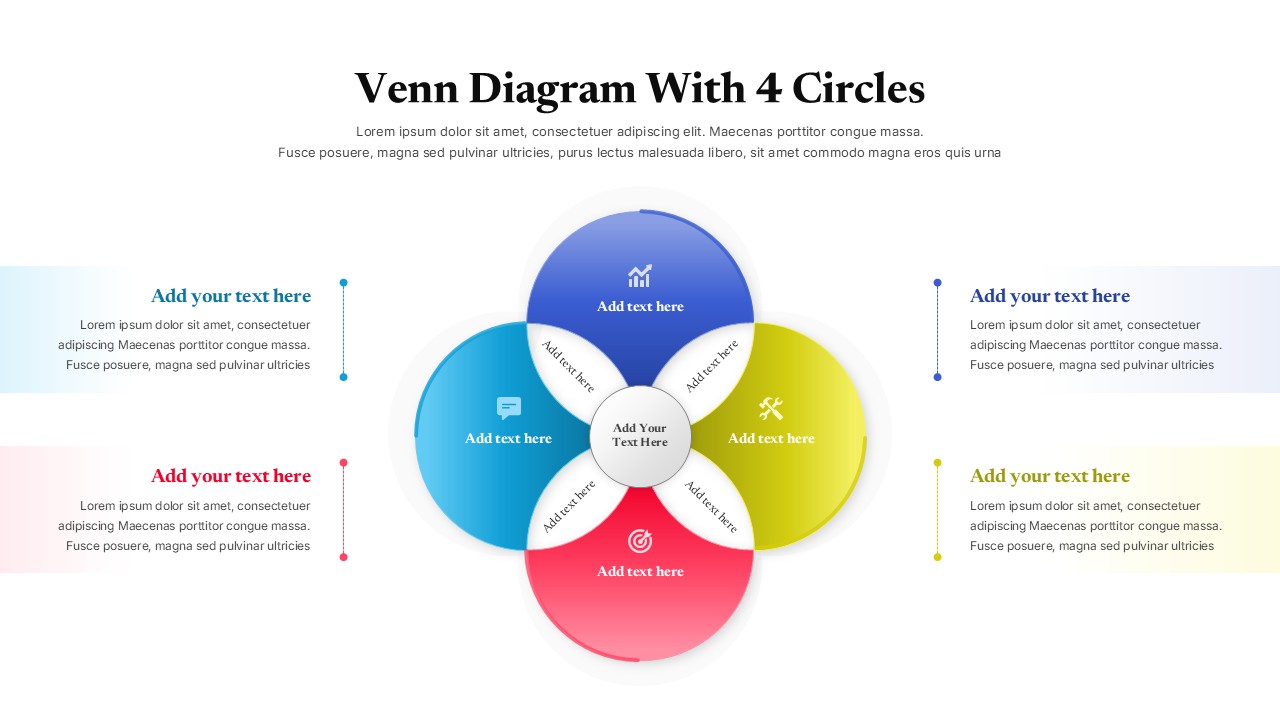
Colorful Venn Diagram with 4 Circle for PowerPoint & Google Slides
Circular
Free Editable Simple Column Chart Slide Template for PowerPoint & Google Slides
Bar/Column
Free

Free Simple Green Plant Company Profile Deck Template for PowerPoint & Google Slides
Company Profile
Free
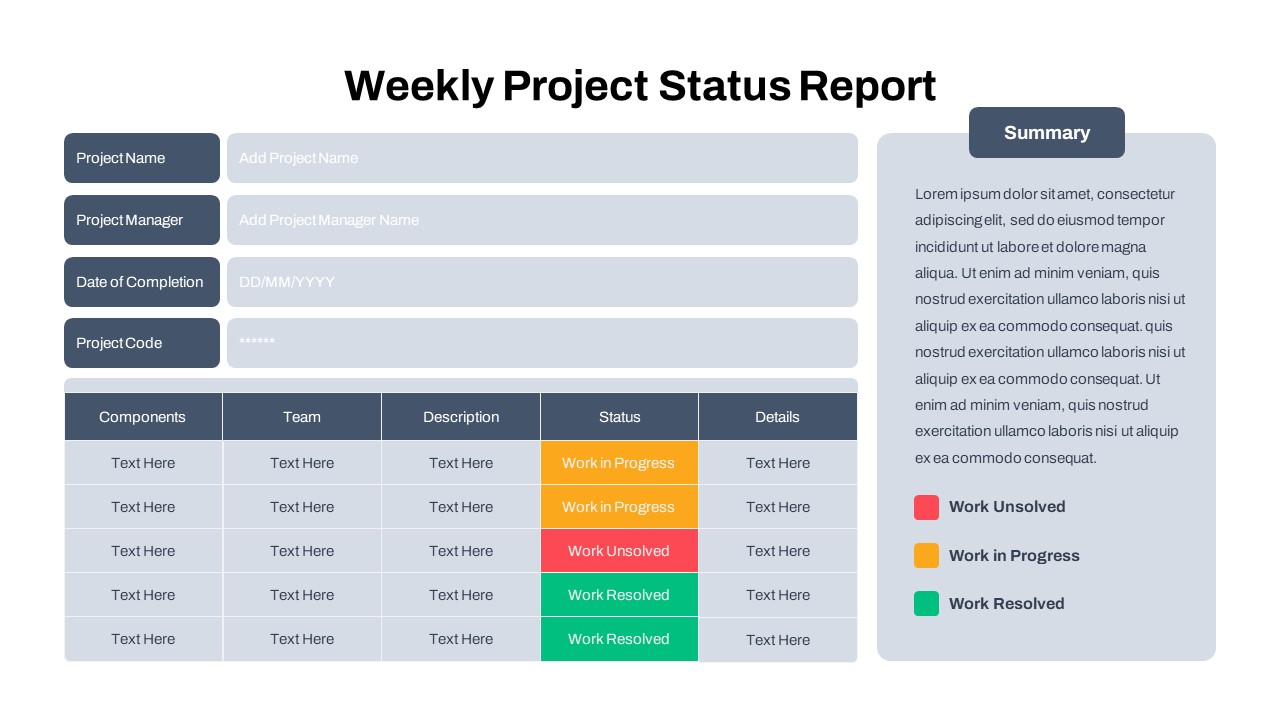
Free Simple Weekly Project Status Report Template for PowerPoint & Google Slides
Project Status
Free
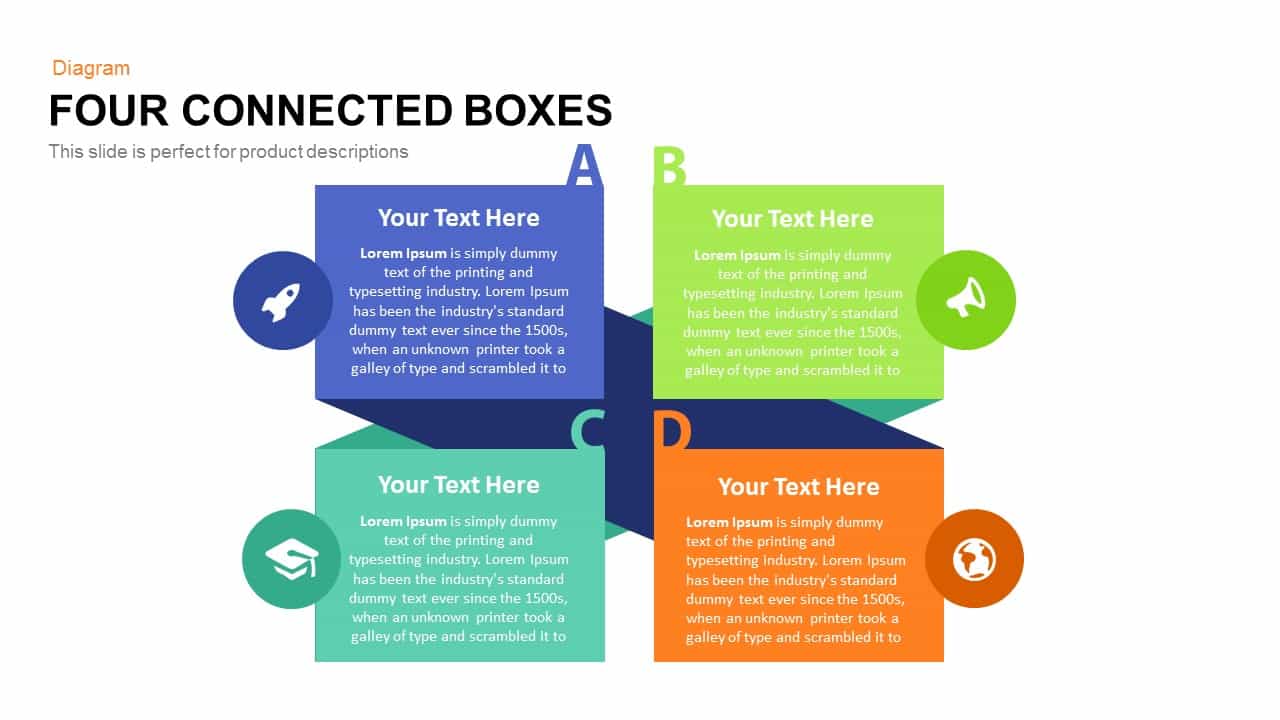
Simple Four Connected Boxes Diagram Template for PowerPoint & Google Slides
Business Models
Simple Flowchart Process Diagram Template for PowerPoint & Google Slides
Flow Charts
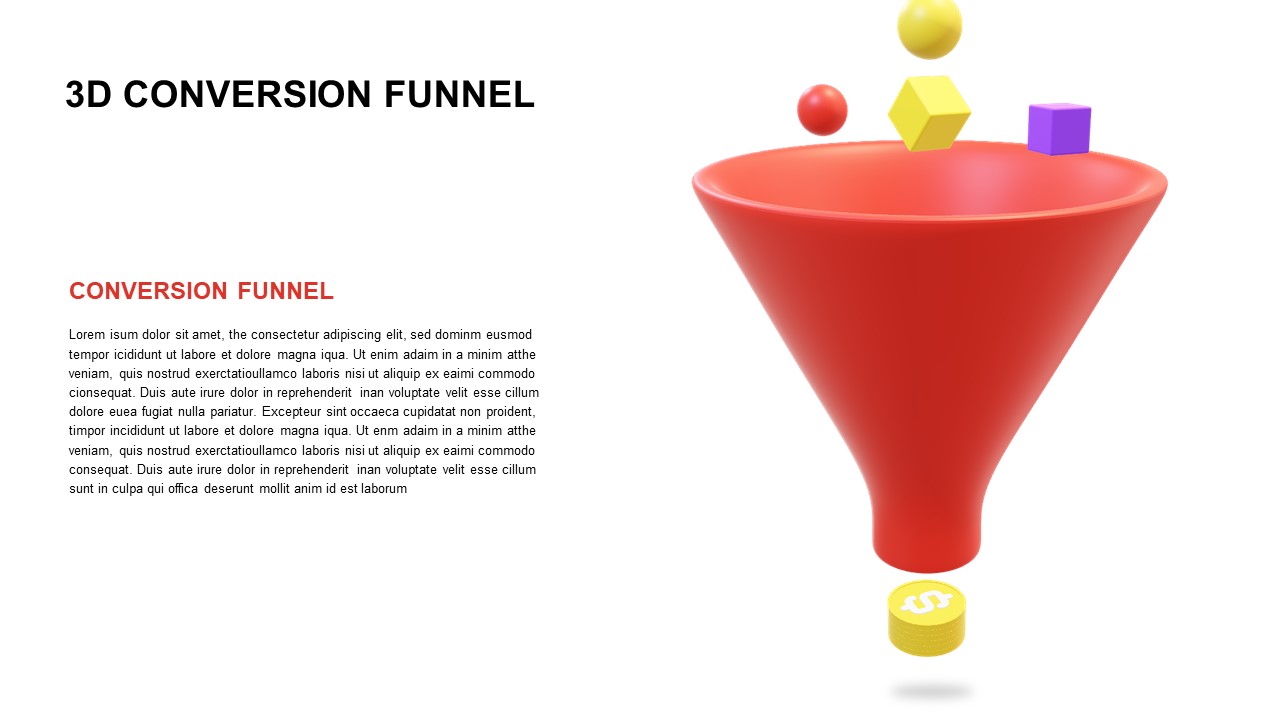
Free 3D Conversion Funnel Overview template for PowerPoint & Google Slides
Funnel
Free
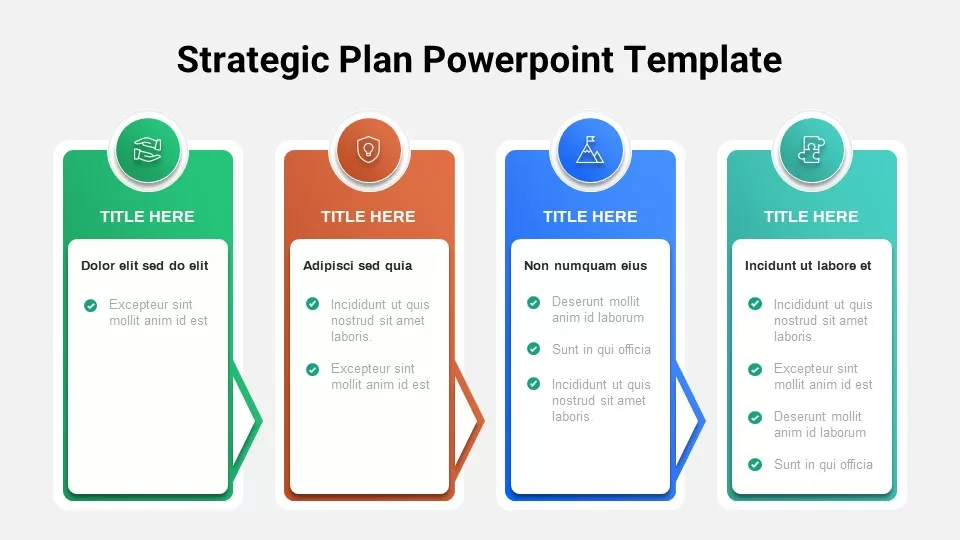
Free Strategic Plan Overview template for PowerPoint & Google Slides
Business Strategy
Free
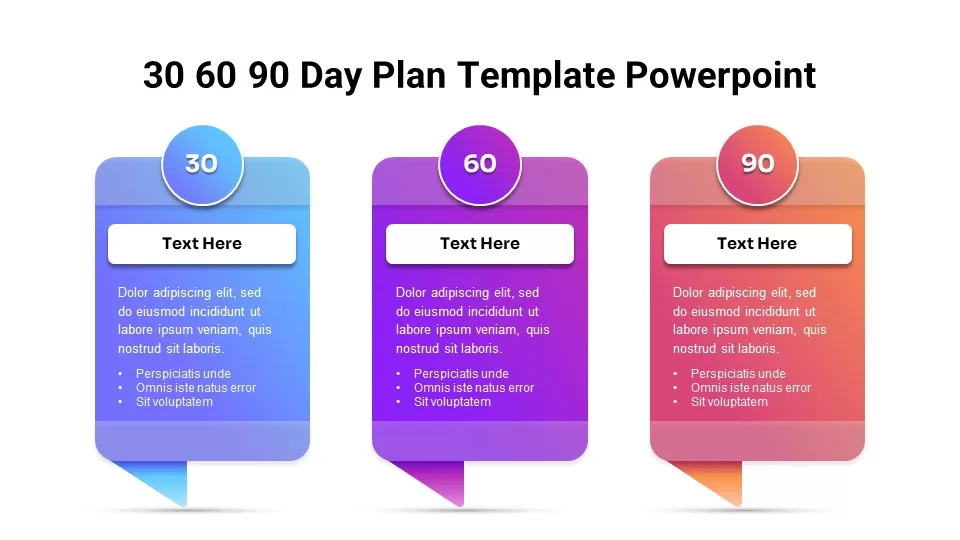
Free 30 60 90 Day Plan Overview template for PowerPoint & Google Slides
Business Plan
Free
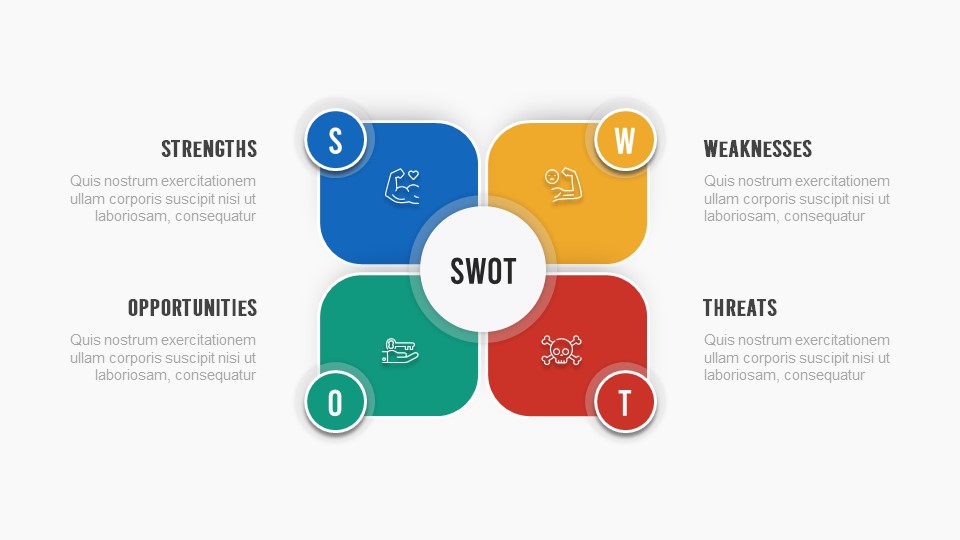
Free SWOT Analysis Overview template for PowerPoint & Google Slides
SWOT
Free
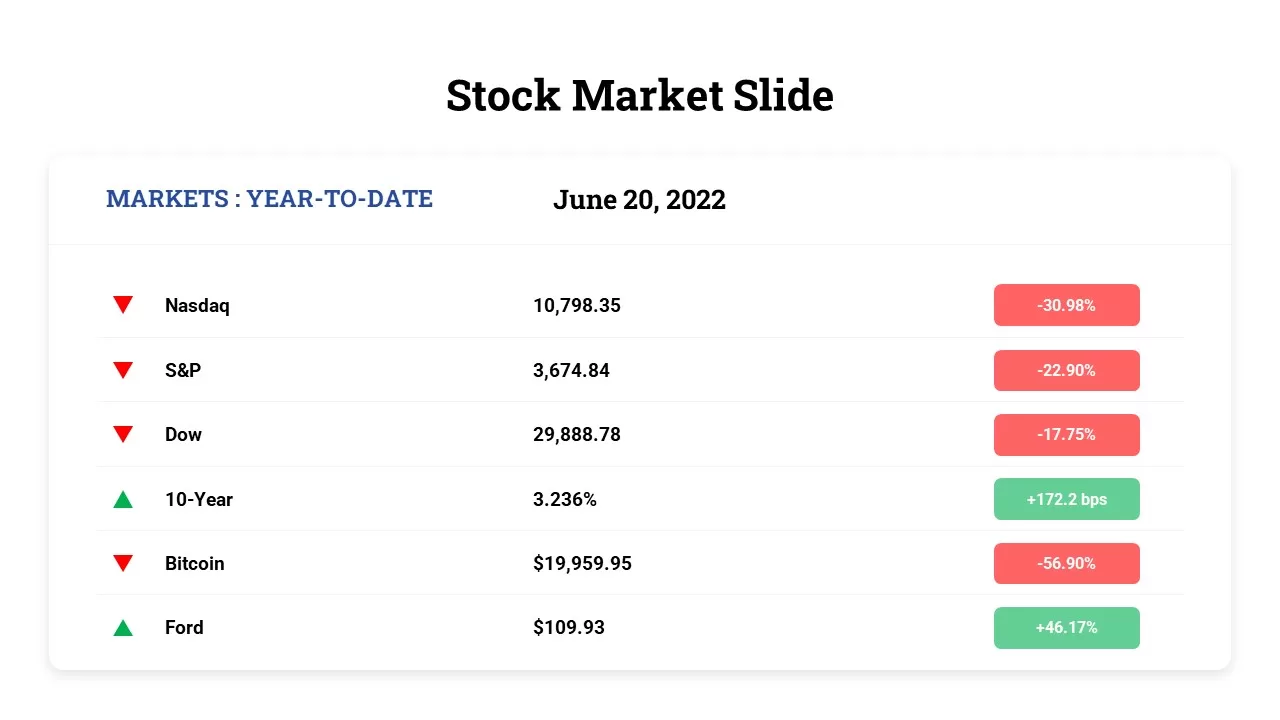
Free Stock Market Performance Overview template for PowerPoint & Google Slides
Finance
Free
Free TikTok Marketing Analytics Overview Template for PowerPoint & Google Slides
Company Profile
Free
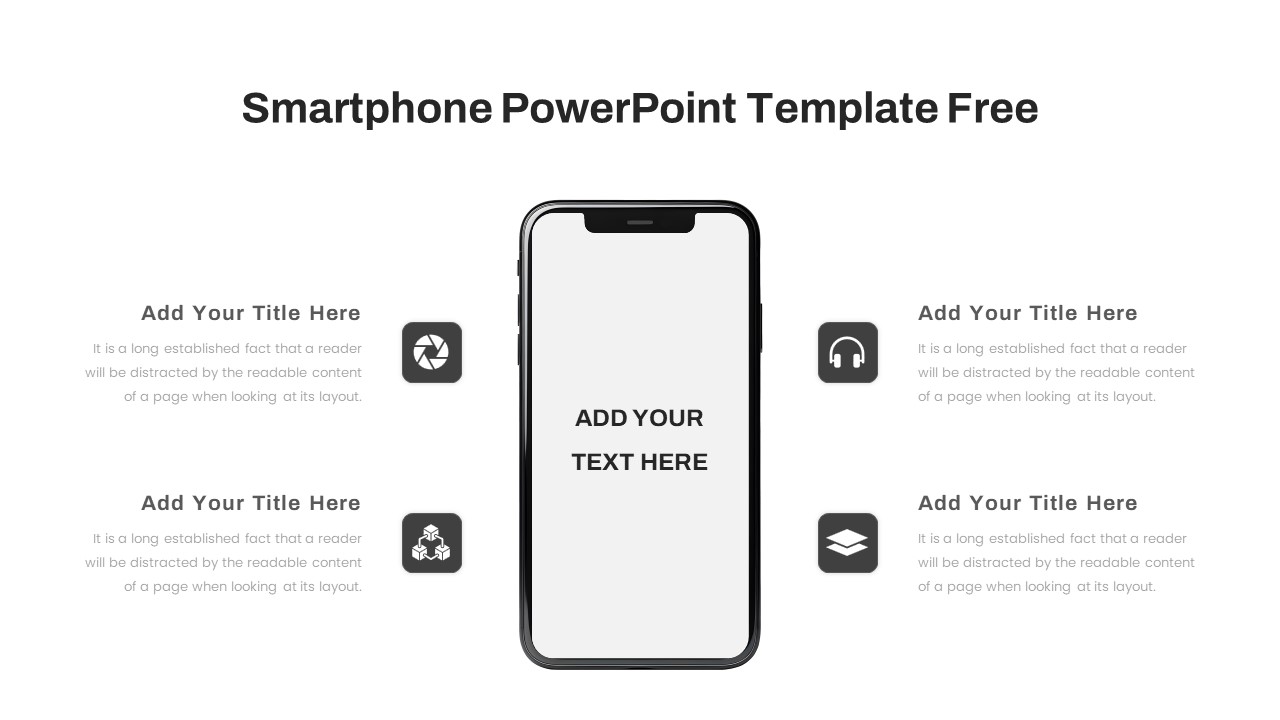
Free Minimal Smartphone Feature Overview Slide for PowerPoint & Google Slides
Information Technology
Free
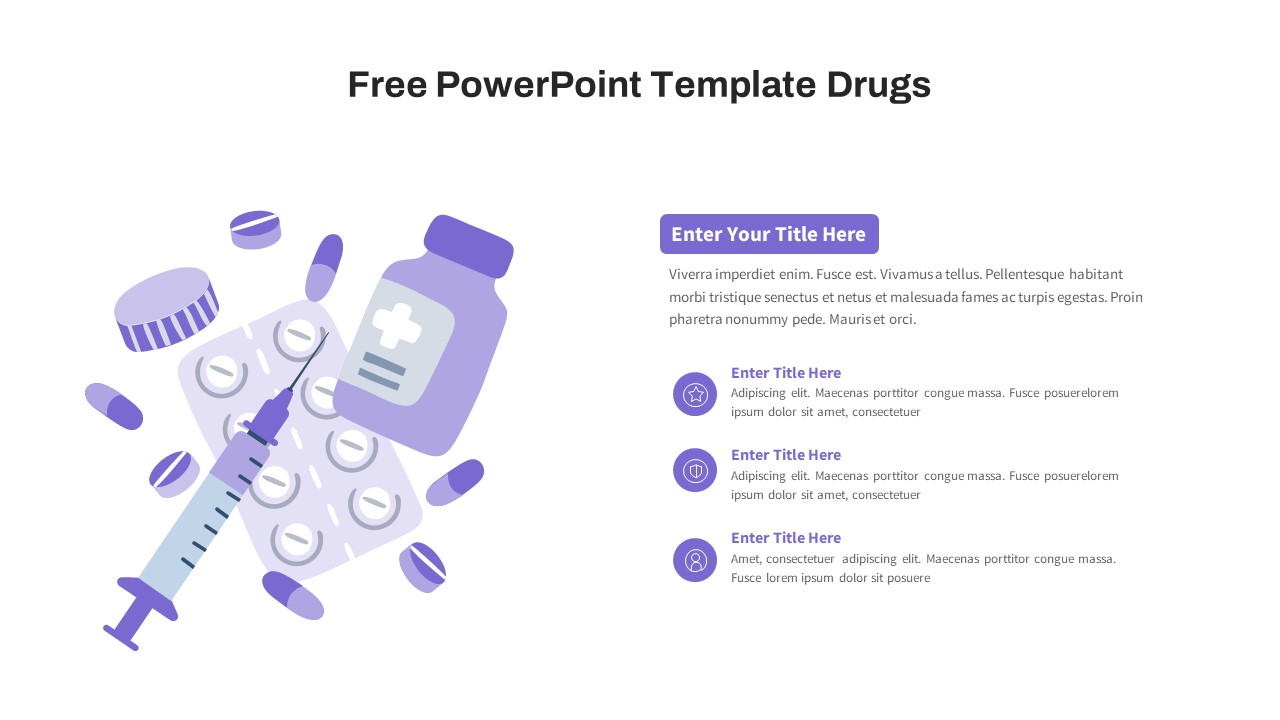
Free Drug and Medication Overview Slide for PowerPoint & Google Slides
Health
Free
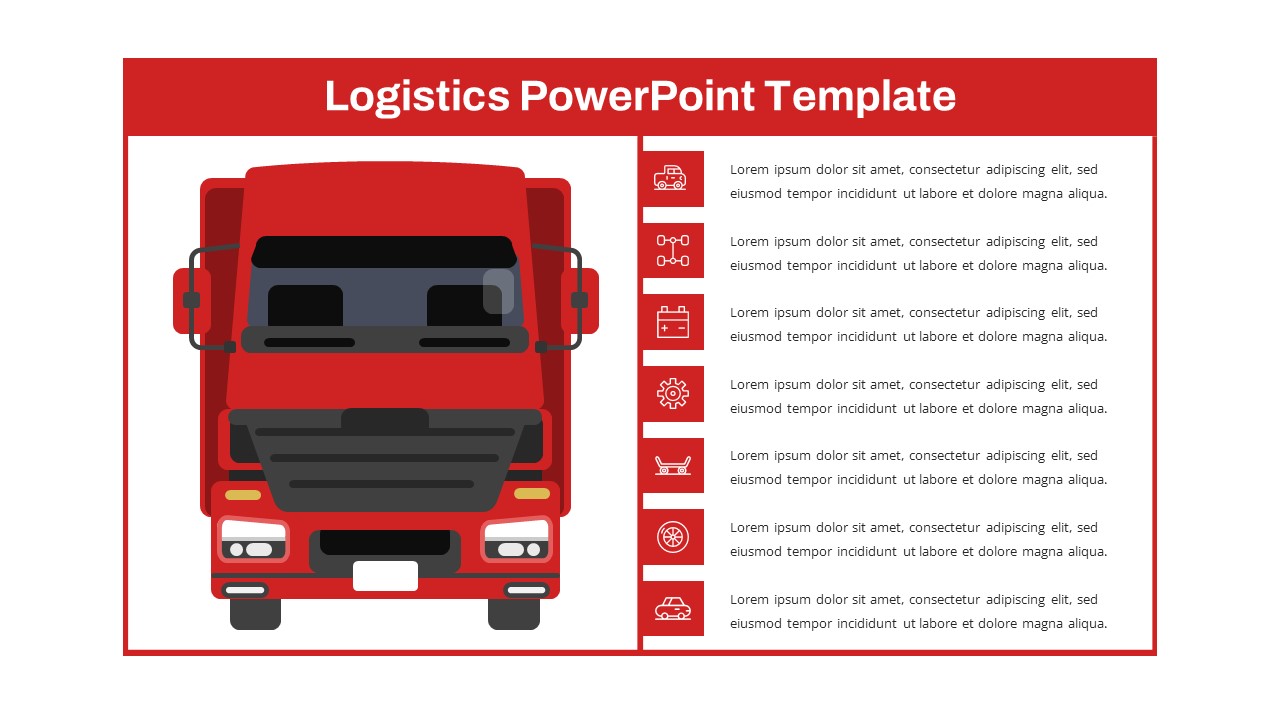
Free Red Truck Logistics Overview Slide for PowerPoint & Google Slides
Infographics
Free
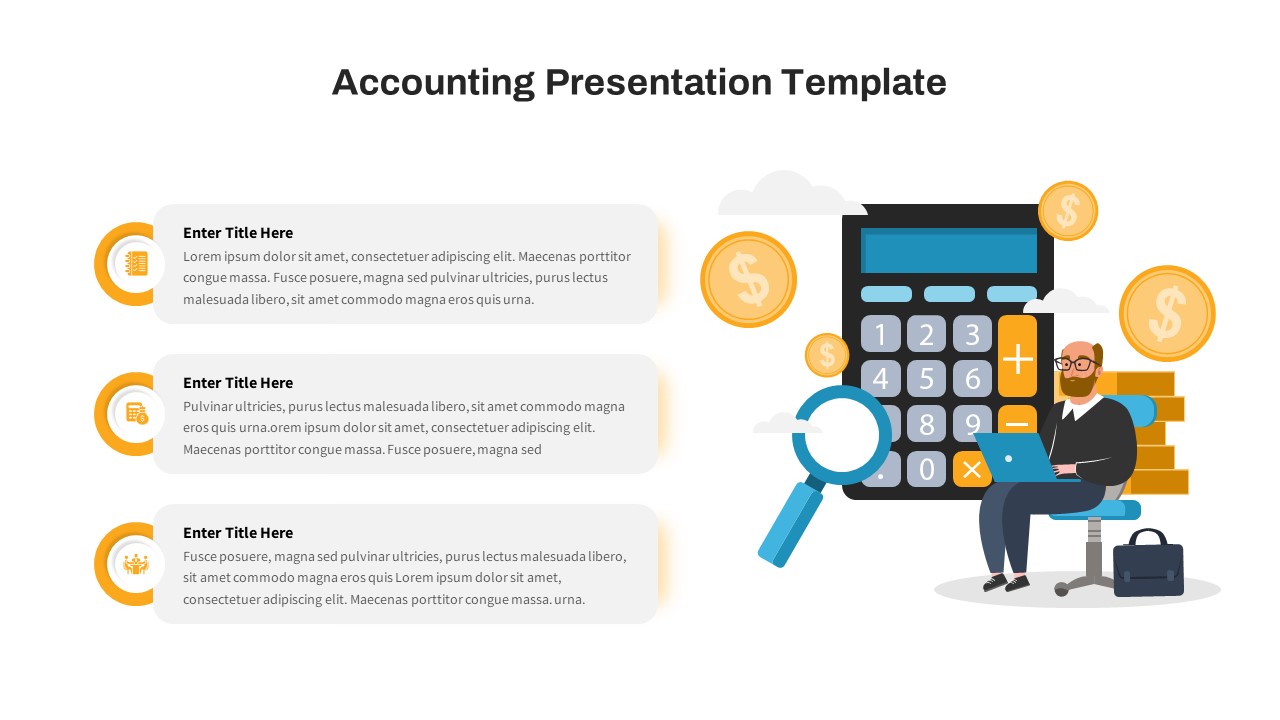
Free Financial Accounting Overview Slide for PowerPoint & Google Slides
Accounting
Free
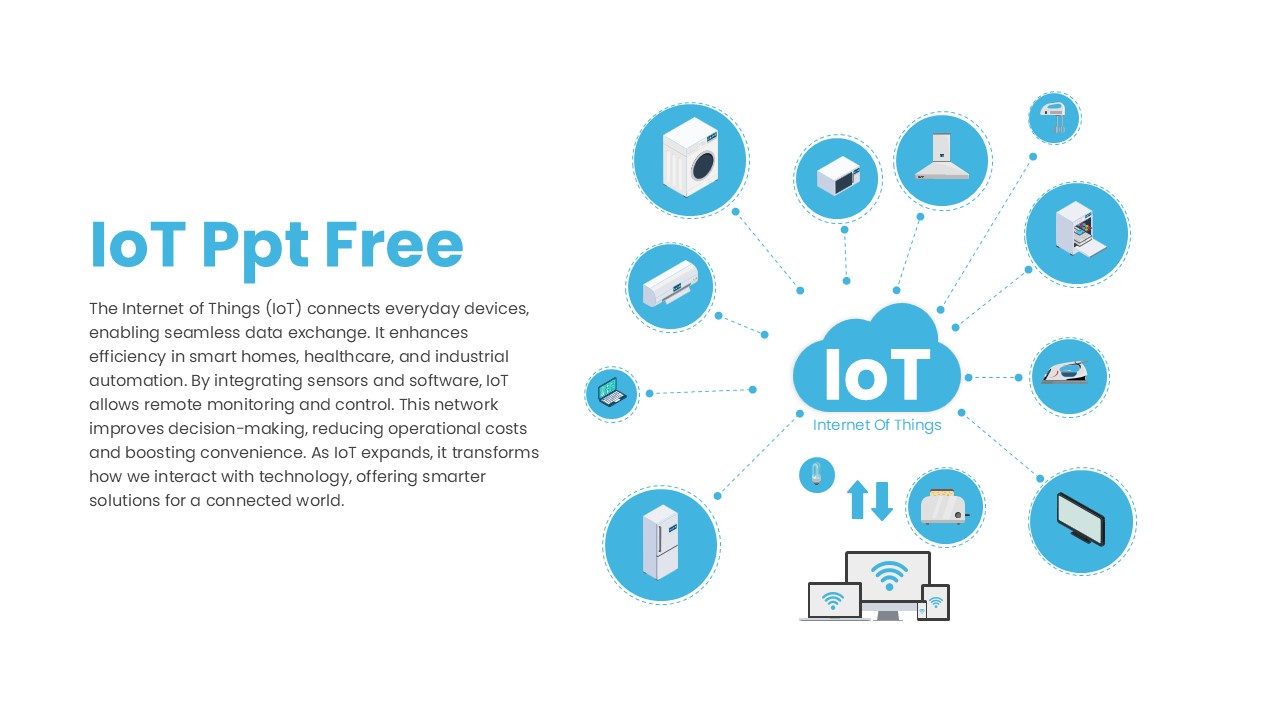
Free IoT Overview for PowerPoint & Google Slides
Technology
Free
5 Stage Process Diagram Slide Overview Template for PowerPoint & Google Slides
Process
Two-Stage Semi-Circle Diagram Overview Template for PowerPoint & Google Slides
Circular
Fishbone Diagram Overview template for PowerPoint & Google Slides
Infographics
Process Methodology Overview Diagram Template for PowerPoint & Google Slides
Process
Process Overview Funnel Diagram Template for PowerPoint & Google Slides
Funnel
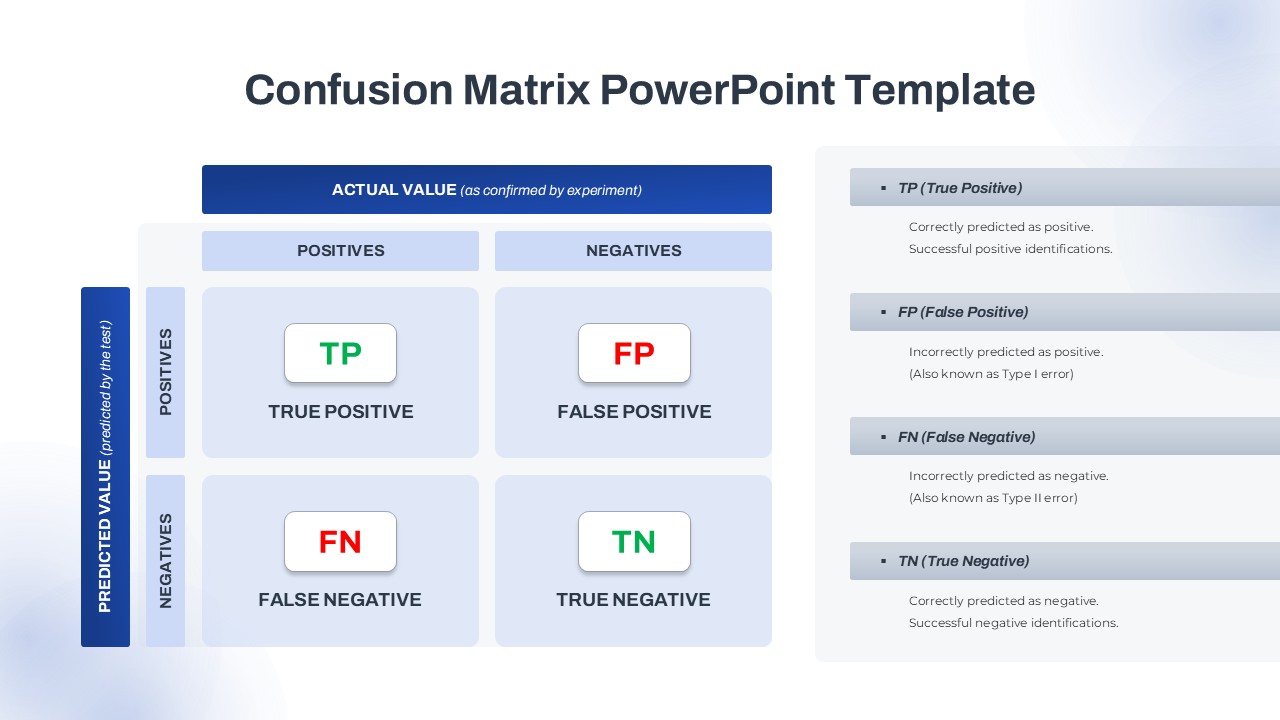
Confusion Matrix Diagram Overview Template for PowerPoint & Google Slides
Comparison
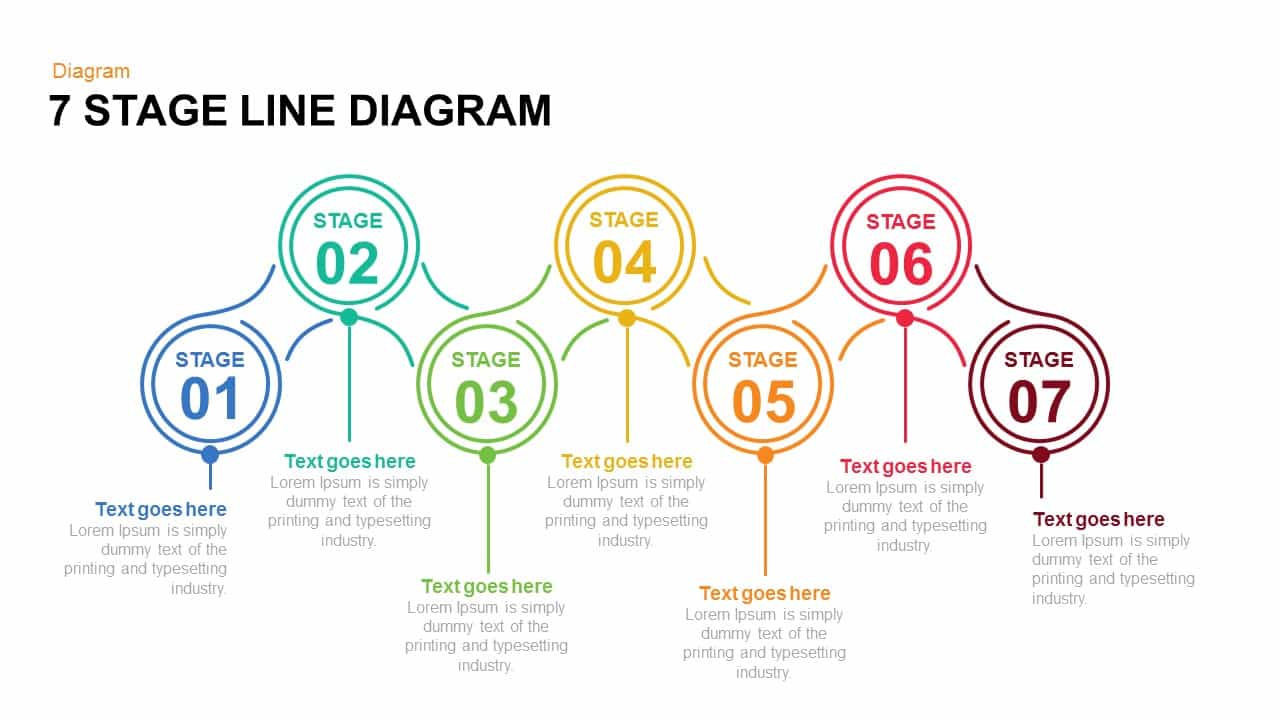
7 and 6 Stage Line Diagram Overview for PowerPoint & Google Slides
Infographics
Simple Comparison Table Template for PowerPoint & Google Slides
Comparison
Simple Organizational Chart Infographic Template for PowerPoint & Google Slides
Org Chart

Simple Multi-Branch Mind Map Template for PowerPoint & Google Slides
Mind Maps
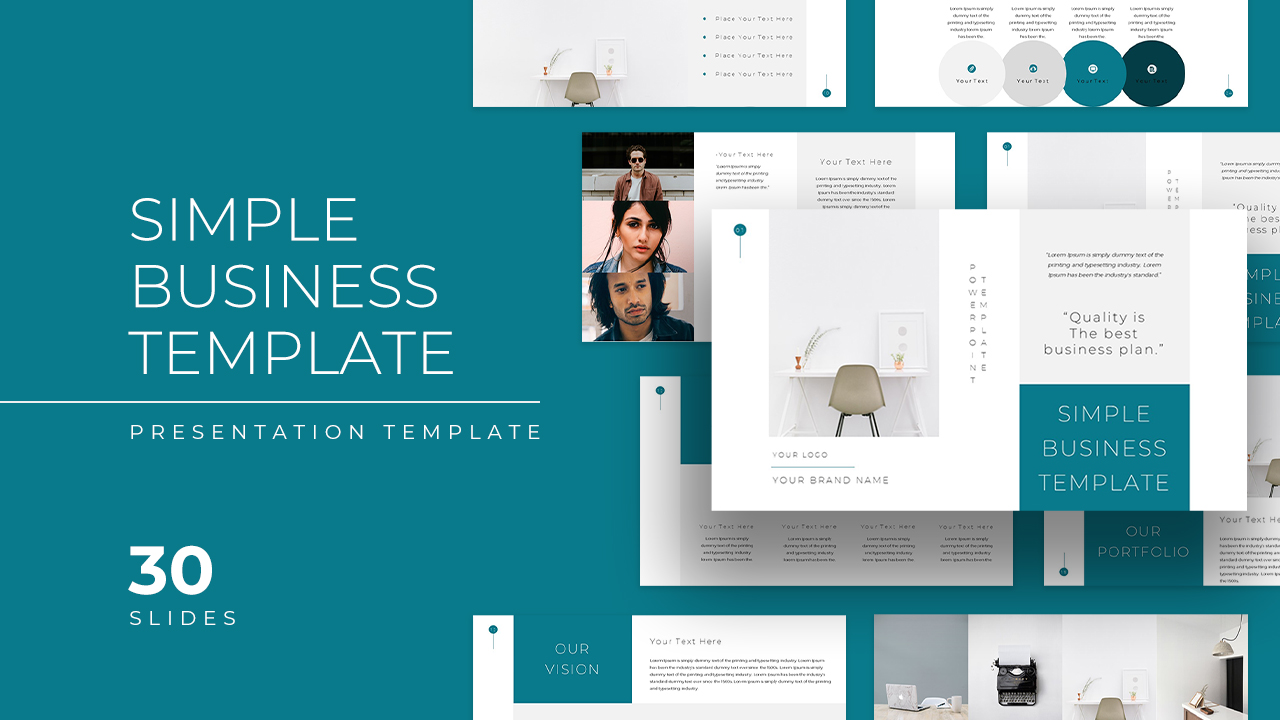
Simple Business Company Profile Deck Template for PowerPoint & Google Slides
Company Profile
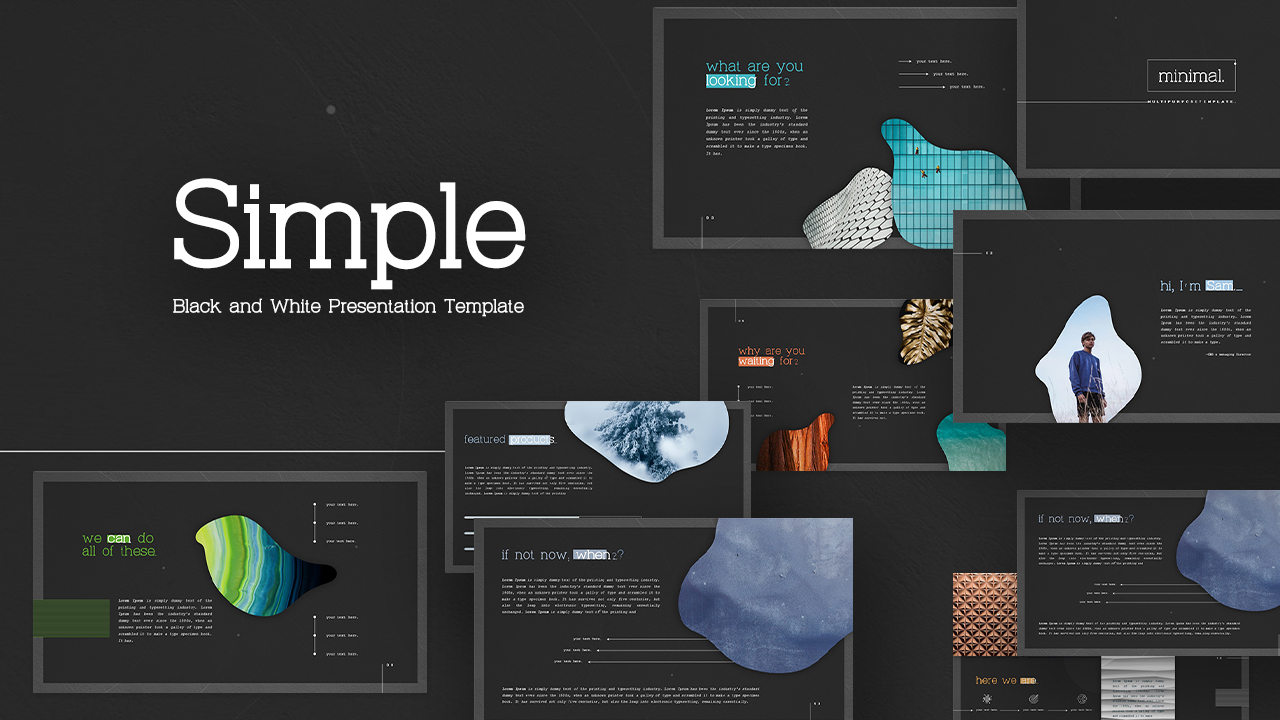
Simple Black and White Presentation Template for PowerPoint & Google Slides
Pitch Deck
Simple Bar Chart Data Visualization Template for PowerPoint & Google Slides
Bar/Column
Simple Scatter Chart Analysis Template for PowerPoint & Google Slides
Comparison Chart
Simple Area Chart Data Trends Analysis Template for PowerPoint & Google Slides
Comparison Chart
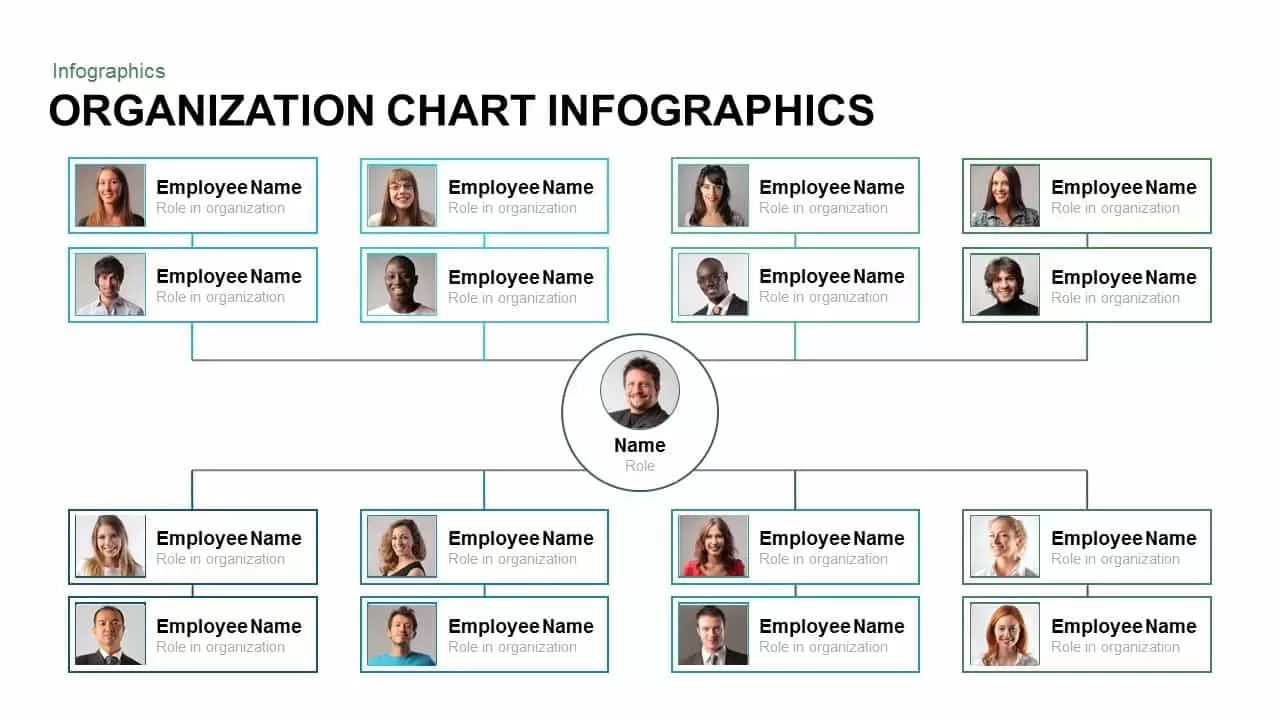
Organization Chart Overview template for PowerPoint & Google Slides
Org Chart
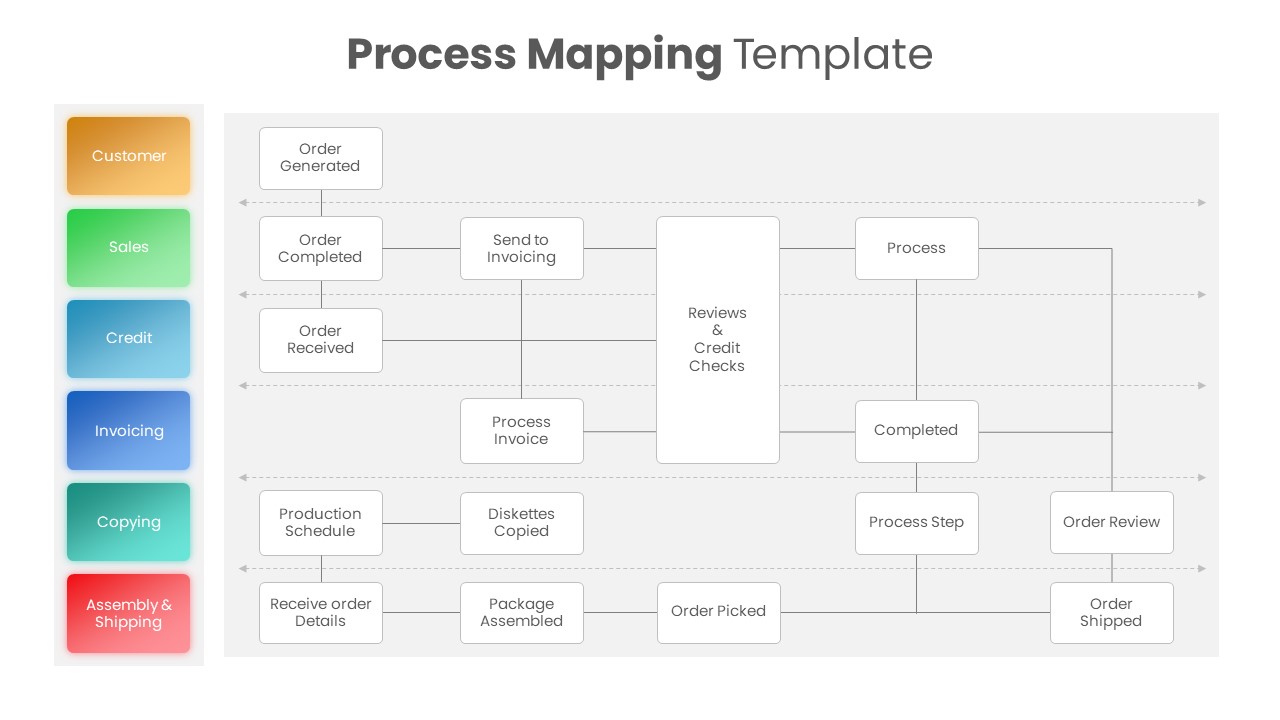
Process Mapping Overview template for PowerPoint & Google Slides
Business Plan
Recruitment Process Overview Template for PowerPoint & Google Slides
Recruitment
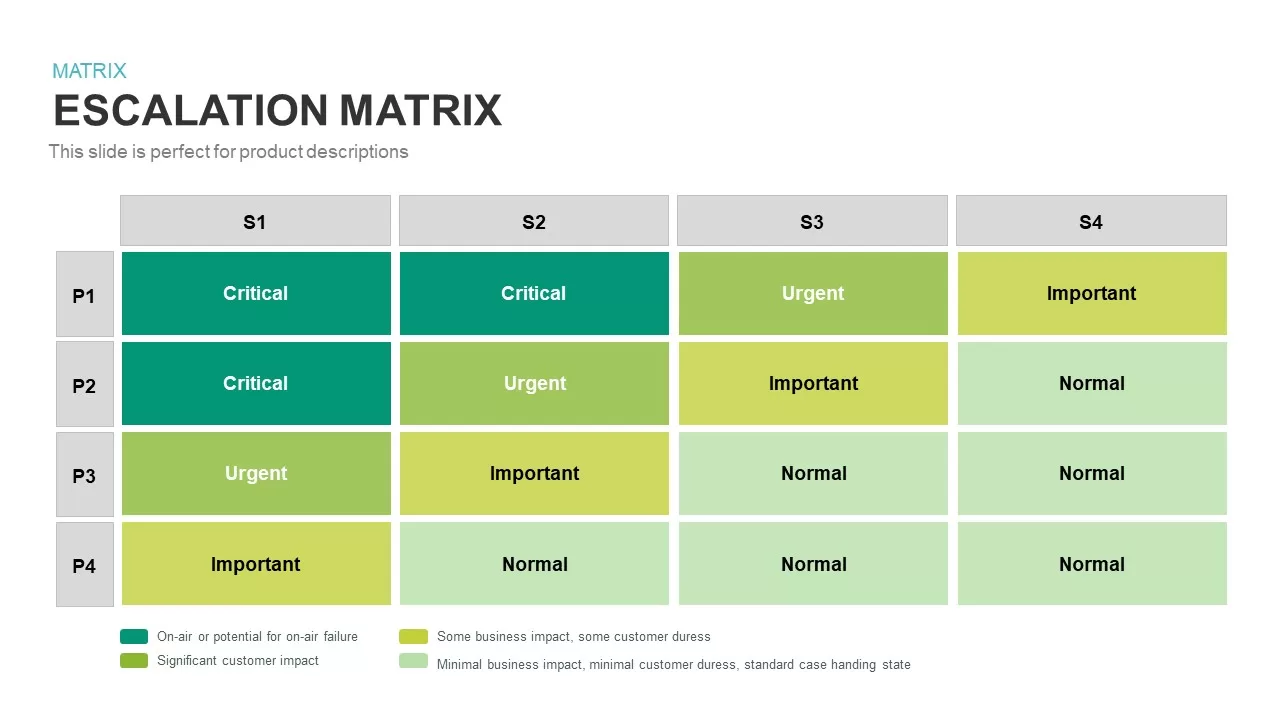
Escalation Matrix template for PowerPoint & Google Slides
Business
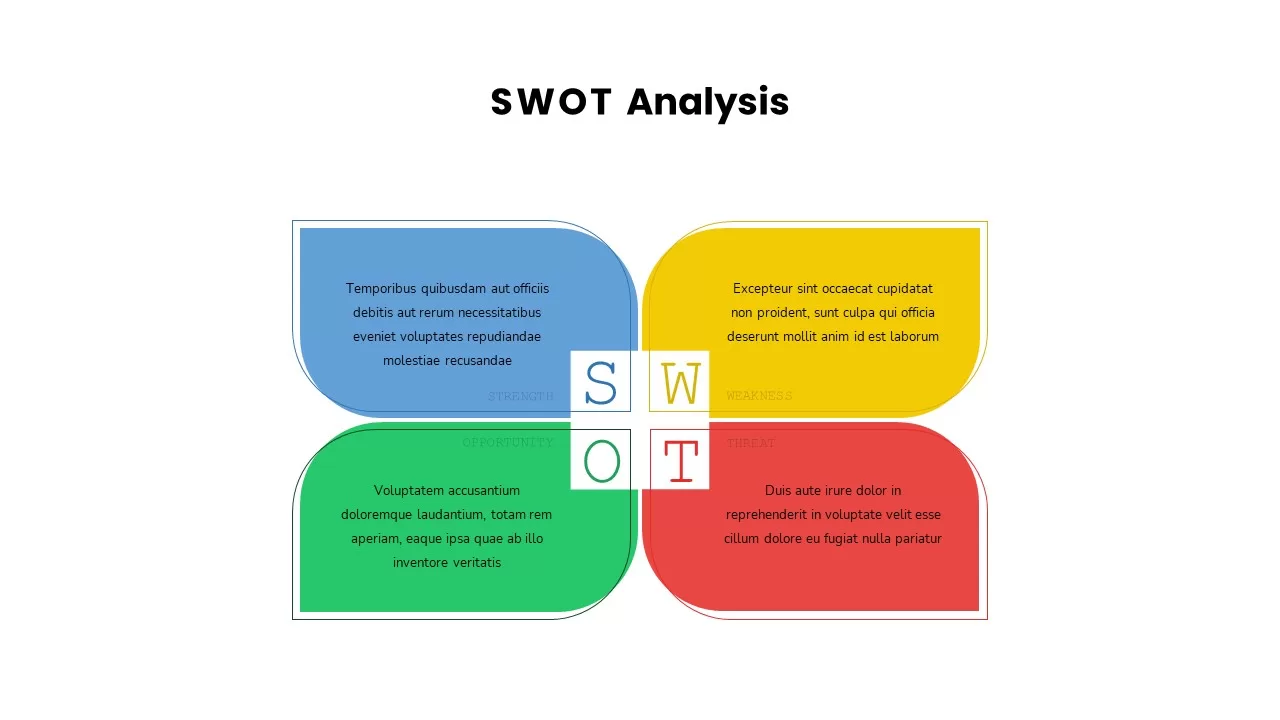
SWOT Analysis Overview template for PowerPoint & Google Slides
Business
Process Flow Overview template for PowerPoint & Google Slides
Business
Organizational Chart Overview template for PowerPoint & Google Slides
Org Chart
Conclusion Overview template for PowerPoint & Google Slides
Business Report
Job Description Overview template for PowerPoint & Google Slides
Recruitment
KPI Dashboard Data Overview Slide Template for PowerPoint & Google Slides
Bar/Column
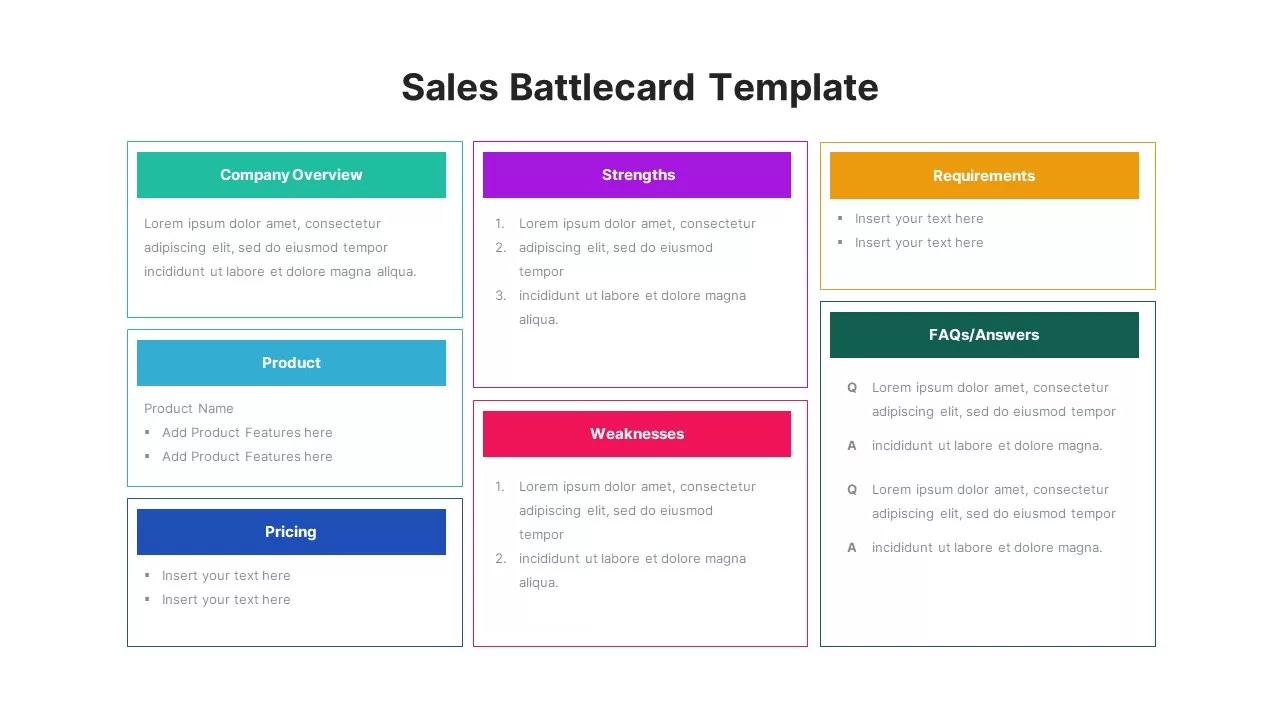
Sales Battlecard Overview Template for PowerPoint & Google Slides
Marketing
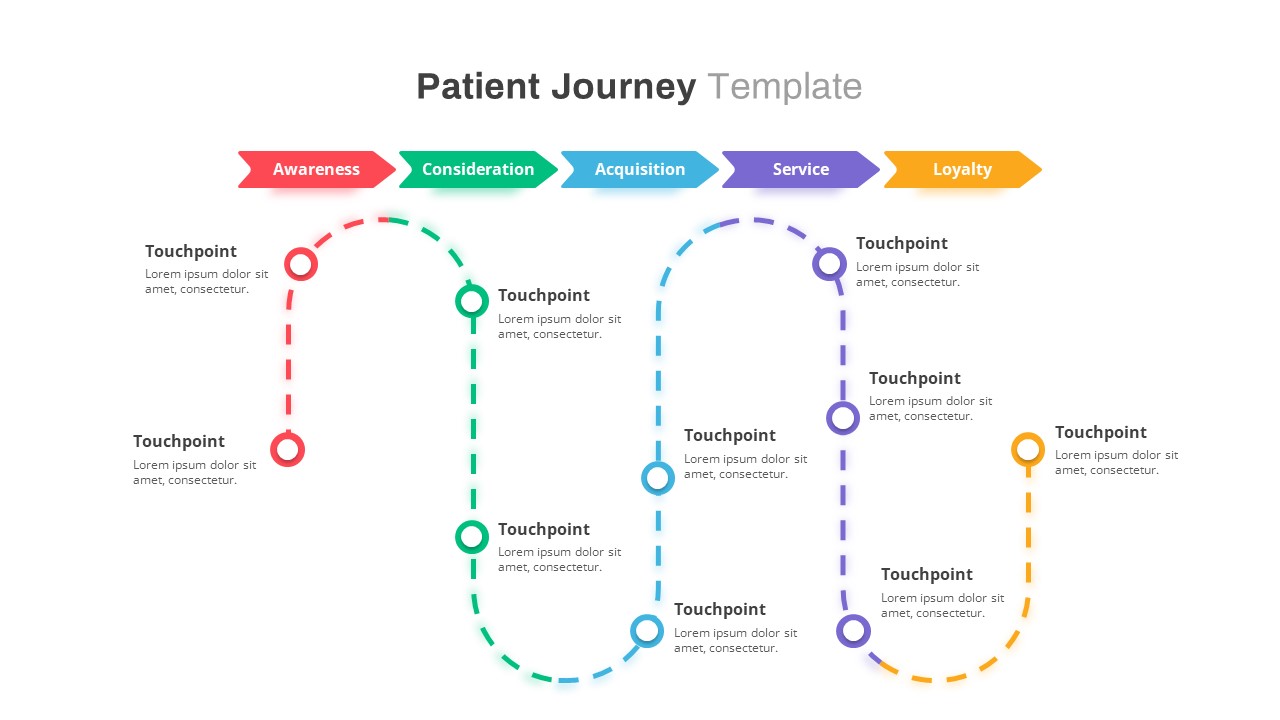
Healthcare Patient Journey Map Overview Template for PowerPoint & Google Slides
Health
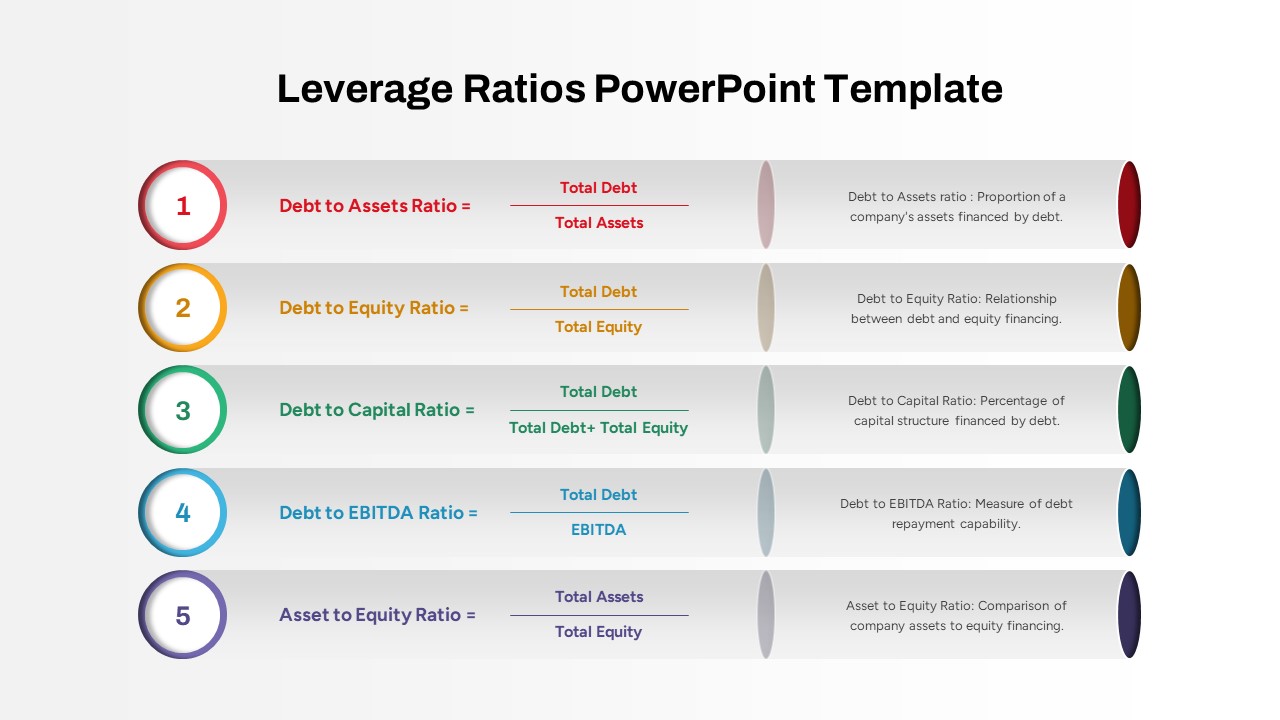
Five Key Leverage Ratios Overview Template for PowerPoint & Google Slides
Finance
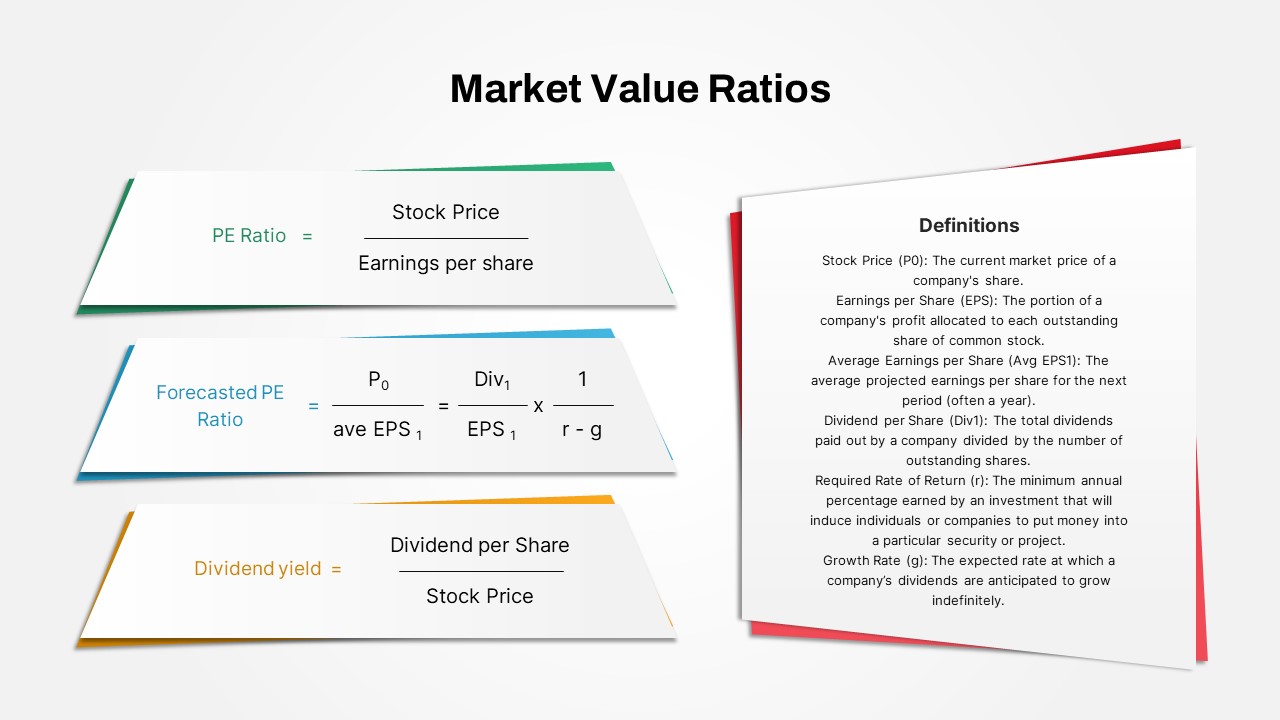
Market Value Ratios Formula Overview Template for PowerPoint & Google Slides
Business Report
Banking Financial Overview Dashboard Template for PowerPoint & Google Slides
Finance
Regional Revenue Comparison Overview Template for PowerPoint & Google Slides
Comparison
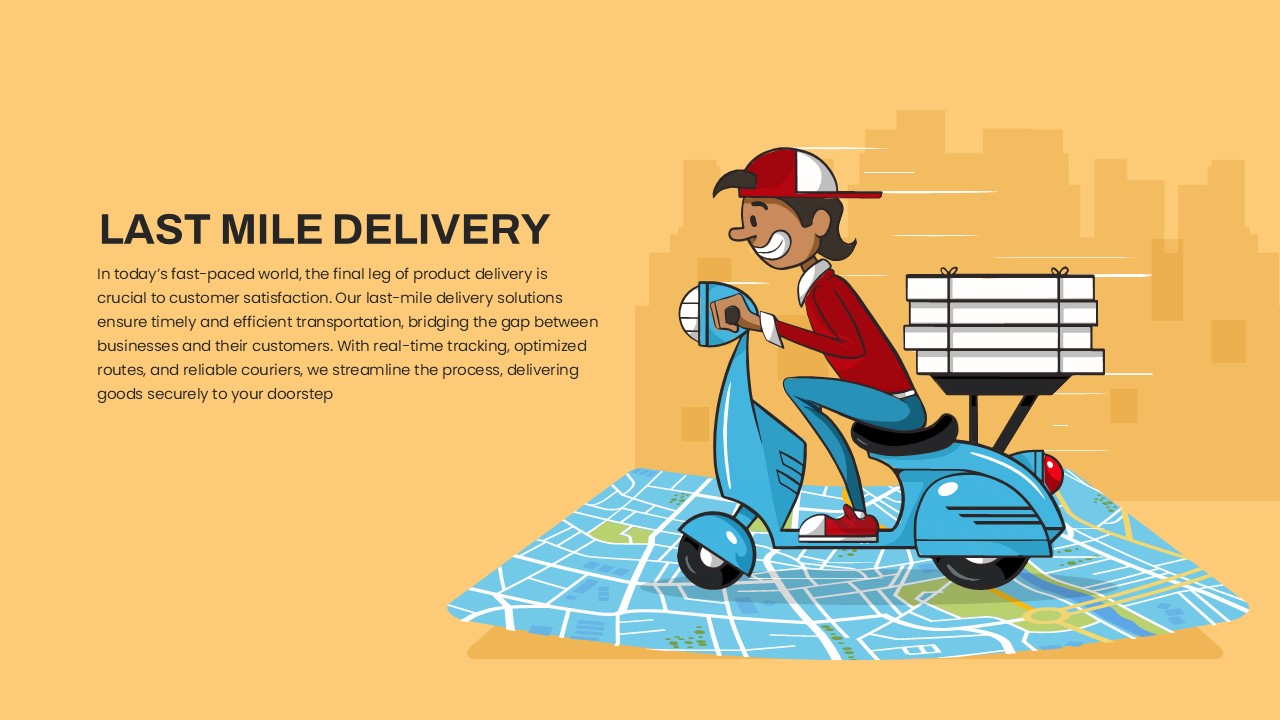
Last Mile Delivery Overview template for PowerPoint & Google Slides
Advertising
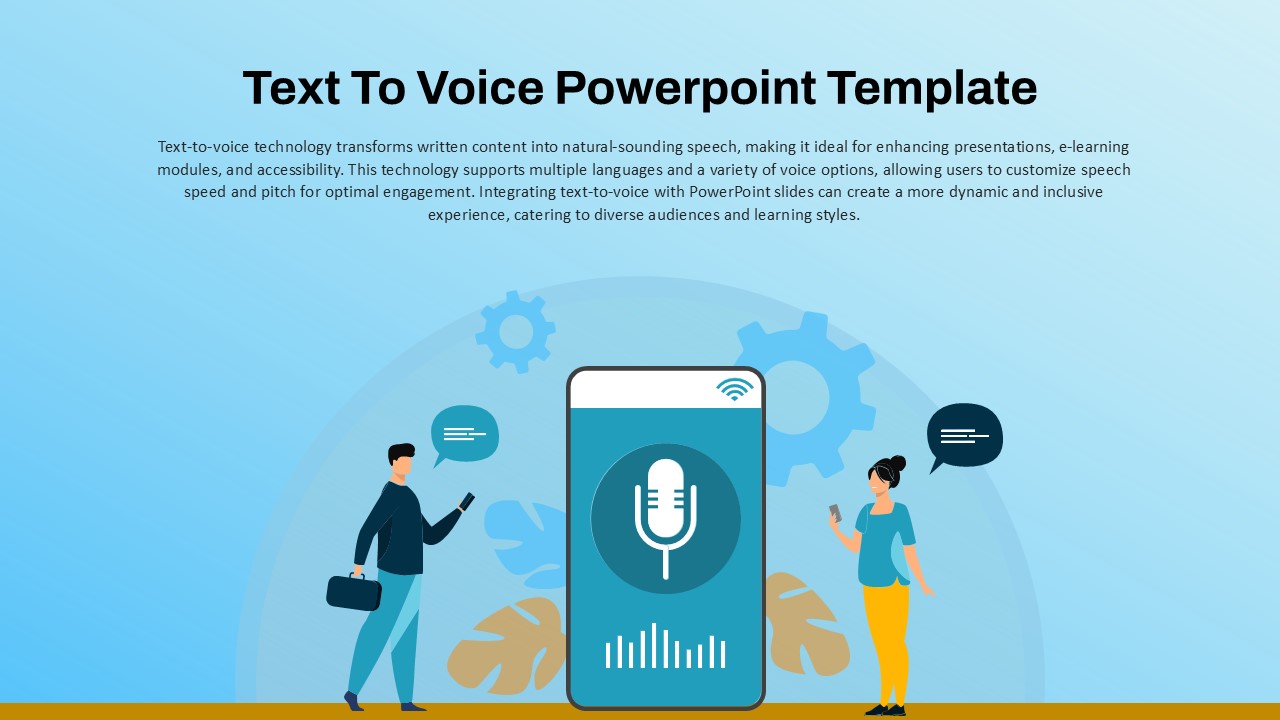
Text to Voice Technology overview template for PowerPoint & Google Slides
Technology
Neo Banking Overview template for PowerPoint & Google Slides
Technology
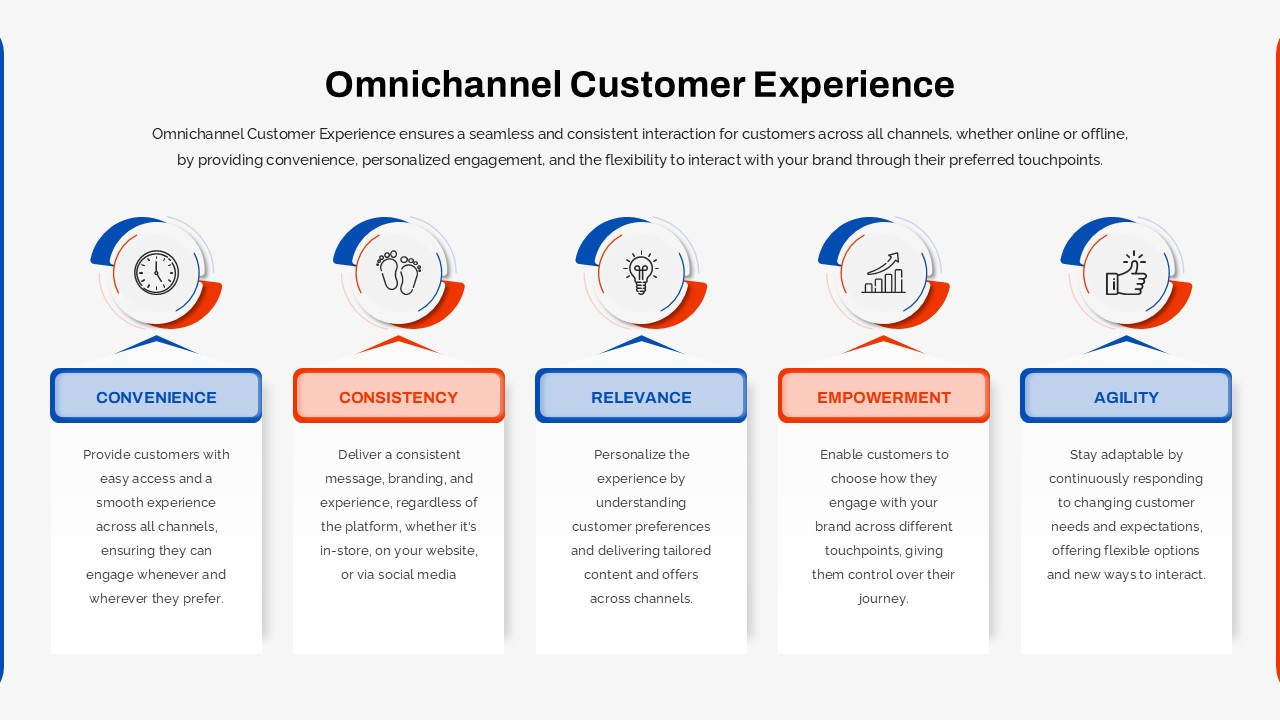
Omnichannel Customer Experience Overview Template for PowerPoint & Google Slides
Customer Journey
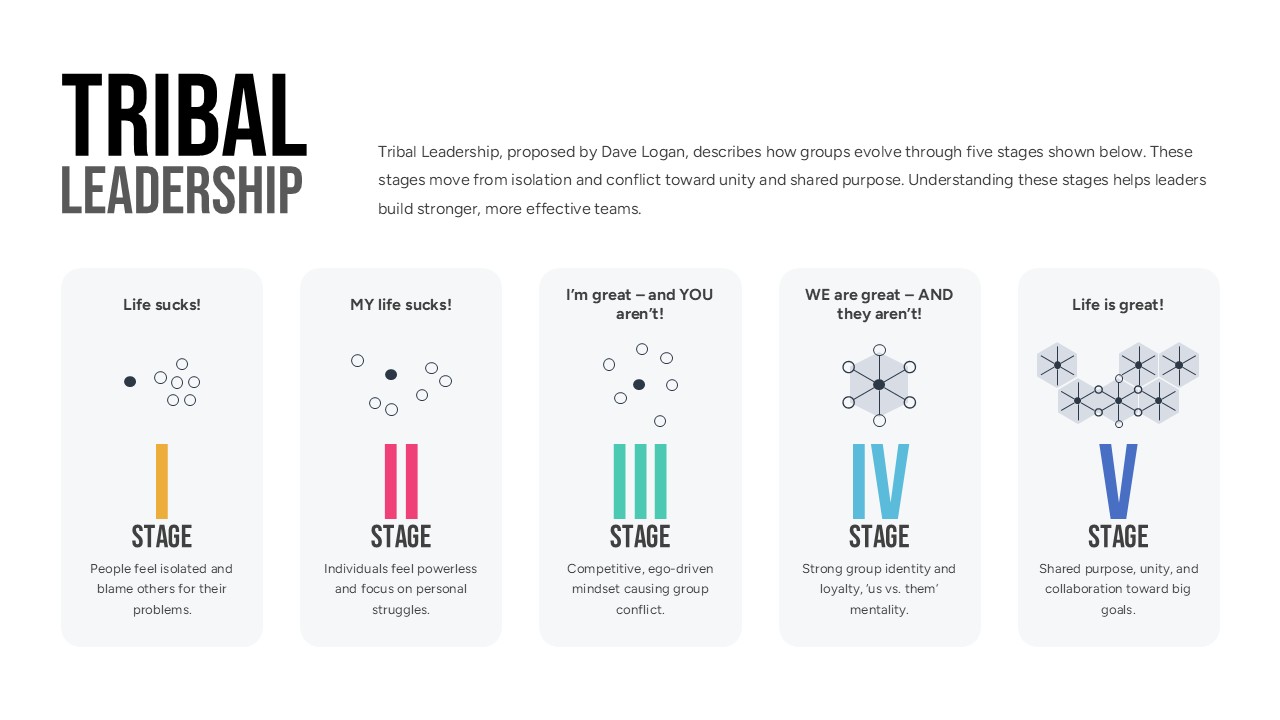
Tribal Leadership Stages Overview template for PowerPoint & Google Slides
Business
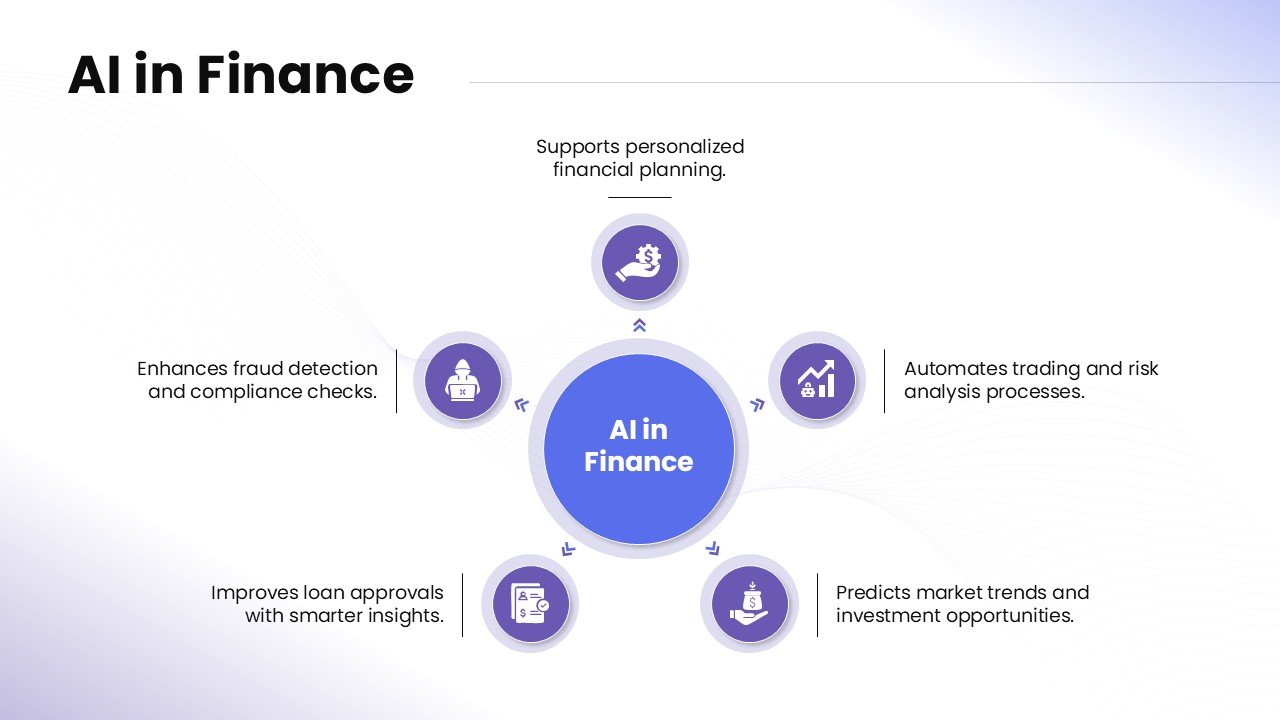
AI in Finance Overview template for PowerPoint & Google Slides
AI
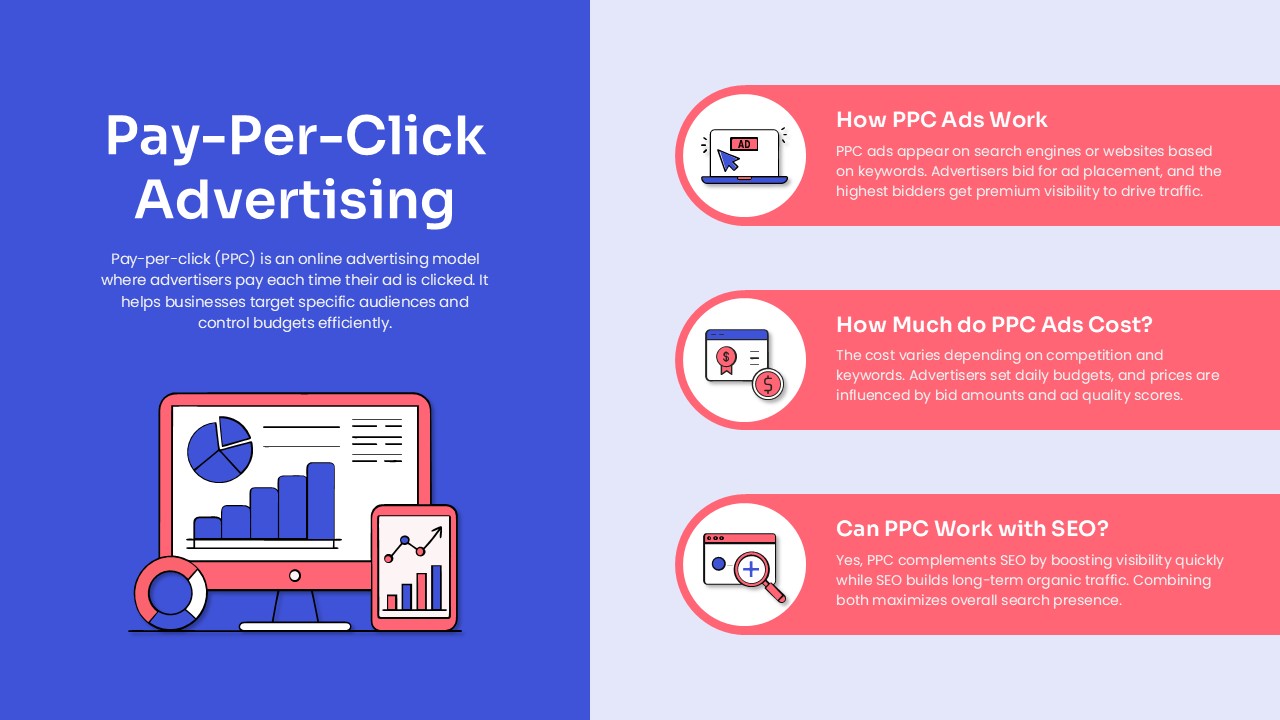
Pay-Per-Click Advertising Overview template for PowerPoint & Google Slides
Business
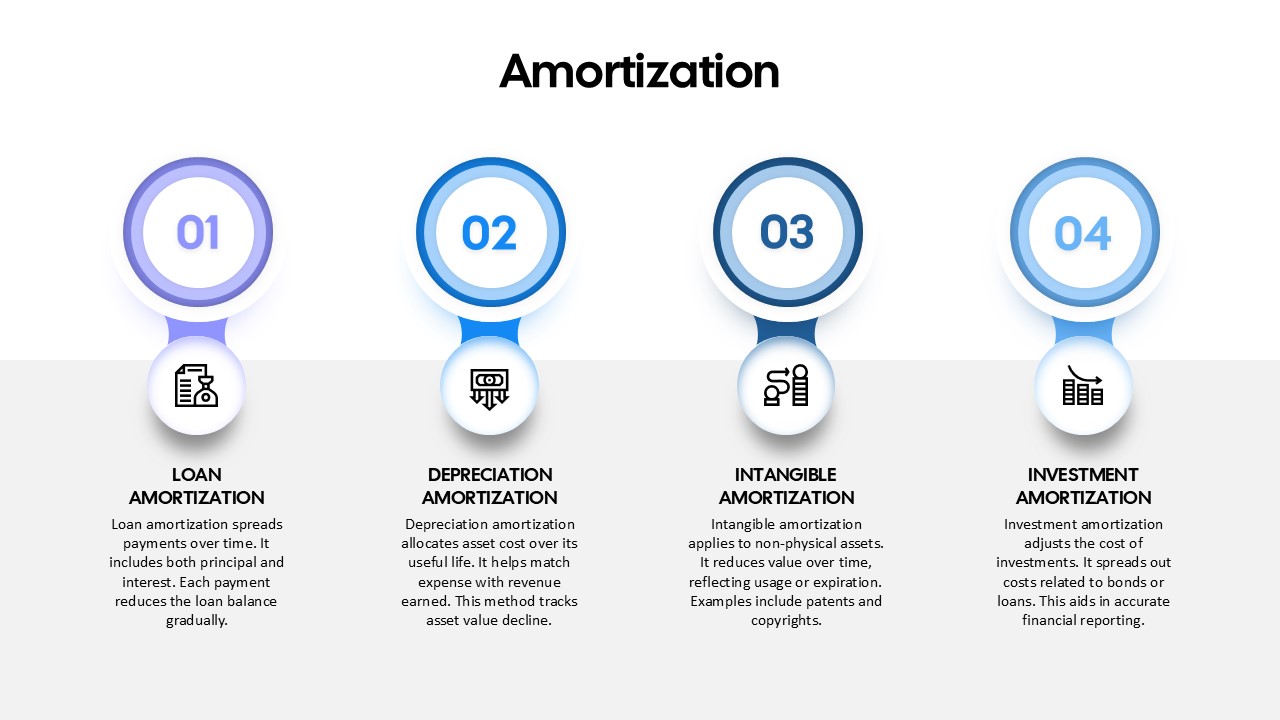
Amortization Breakdown Overview template for PowerPoint & Google Slides
Finance
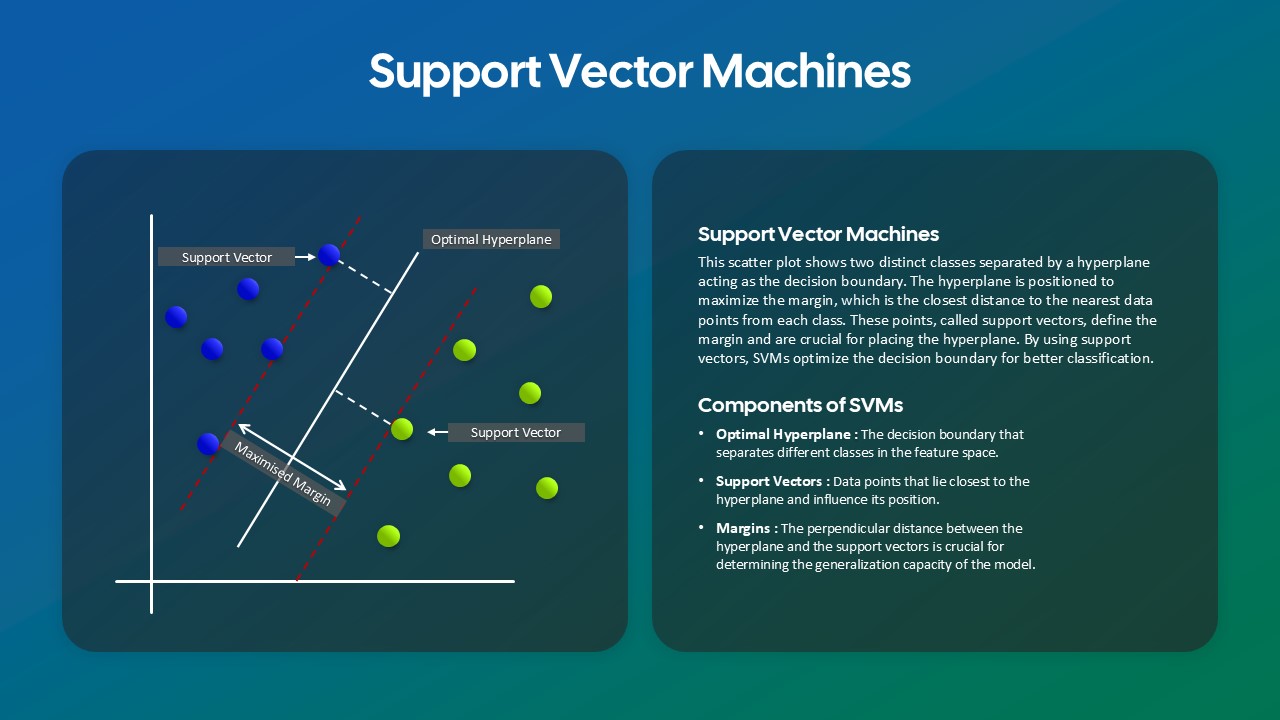
Support Vector Machines (SVM) Overview template for PowerPoint & Google Slides
Technology
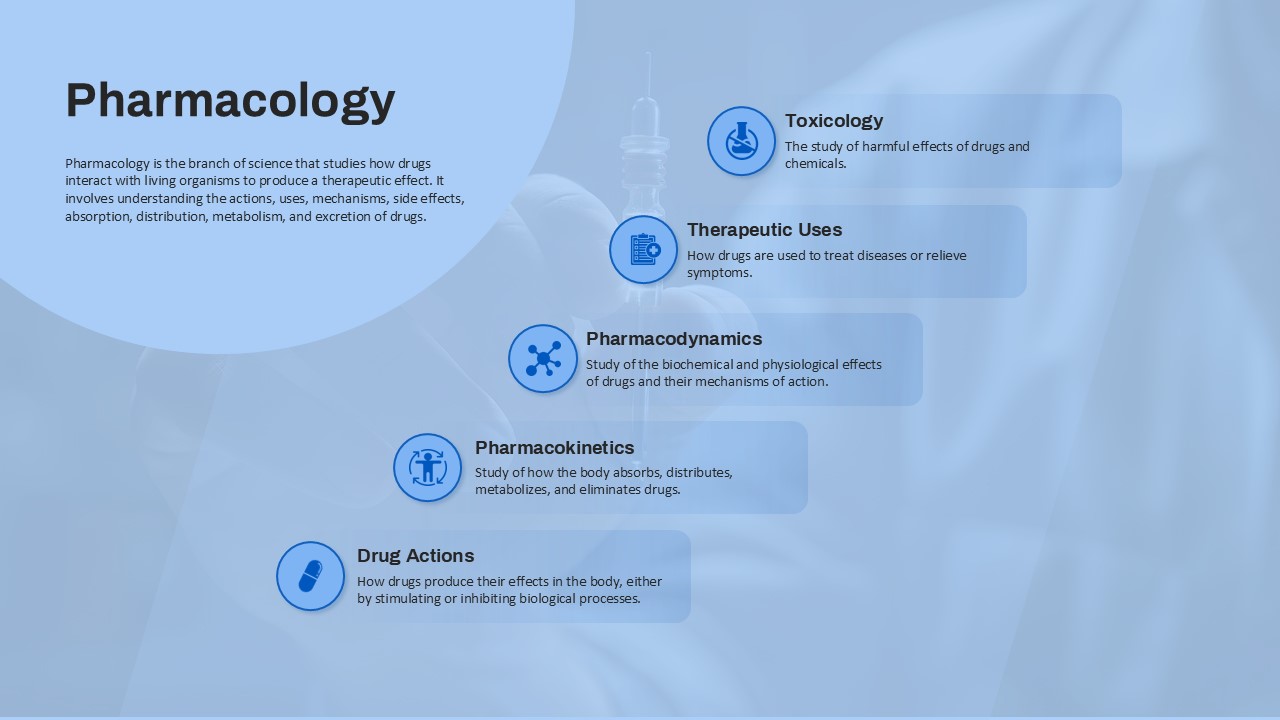
Pharmacology Overview template for PowerPoint & Google Slides
Health
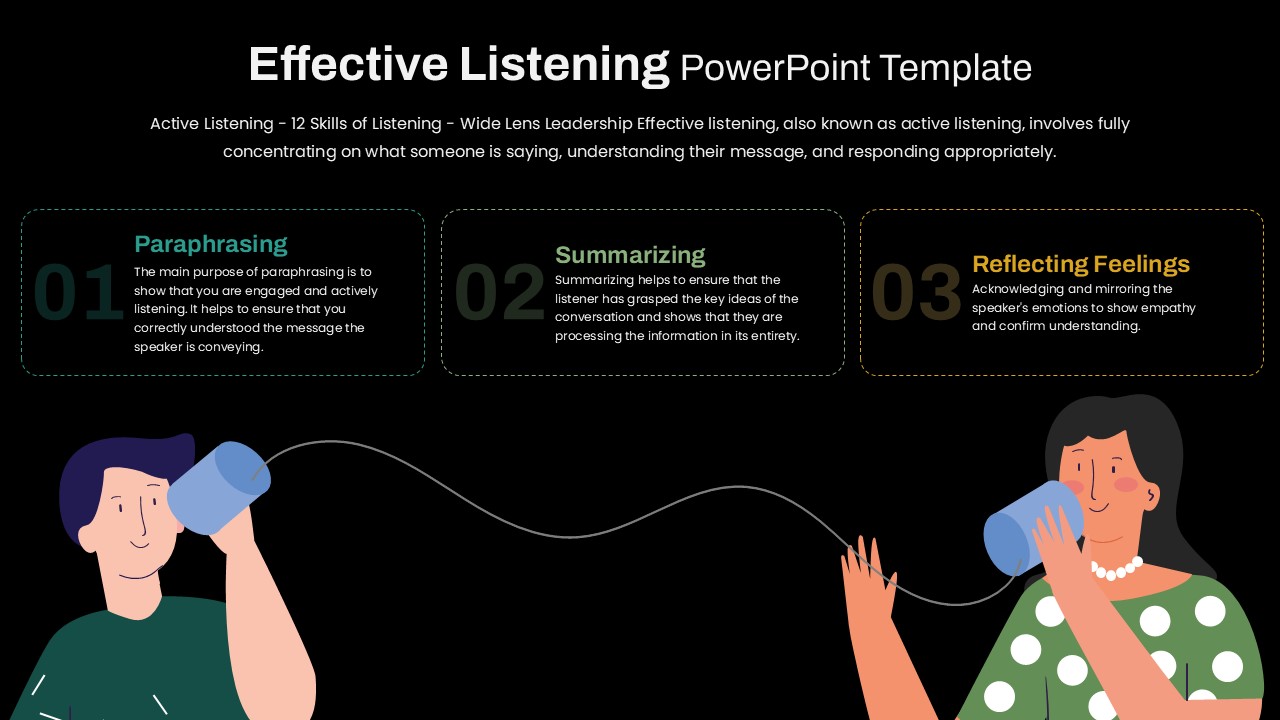
Effective Listening Skills Overview Template for PowerPoint & Google Slides
Process
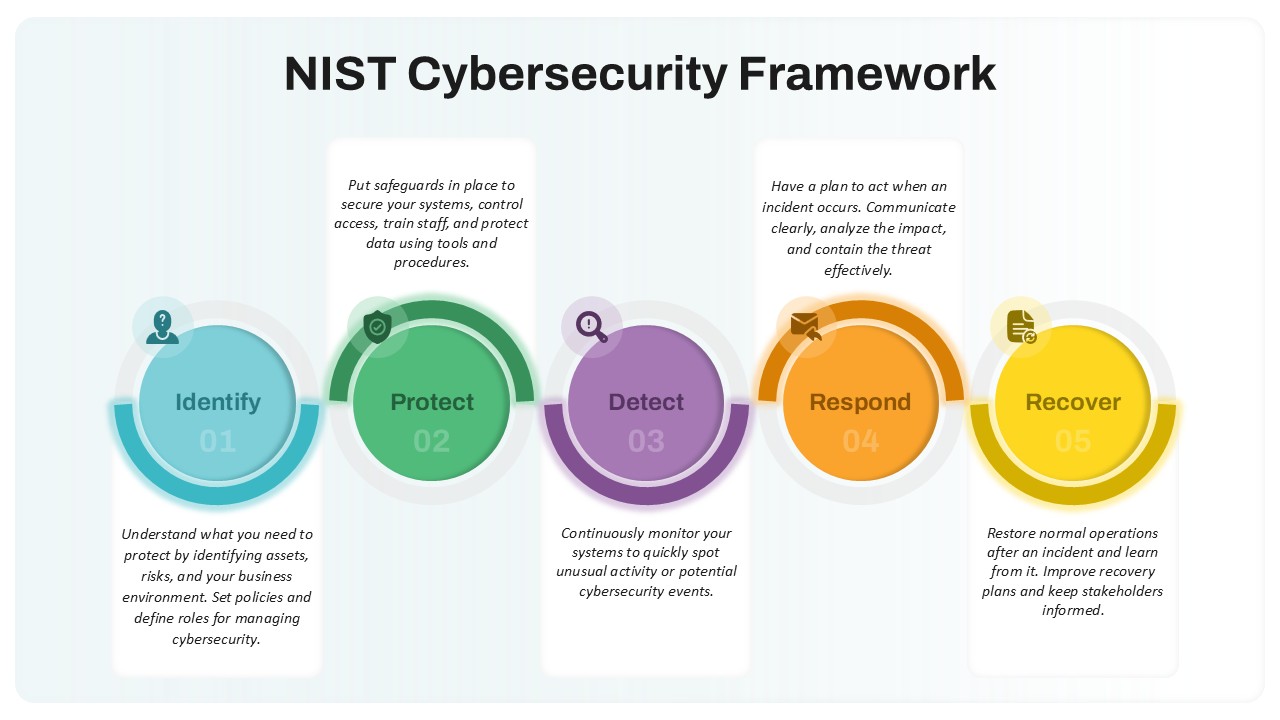
NIST Cybersecurity Framework Overview template for PowerPoint & Google Slides
Technology
Data Protection & Encryption in the Cloud Overview template for PowerPoint & Google Slides
Cloud Computing
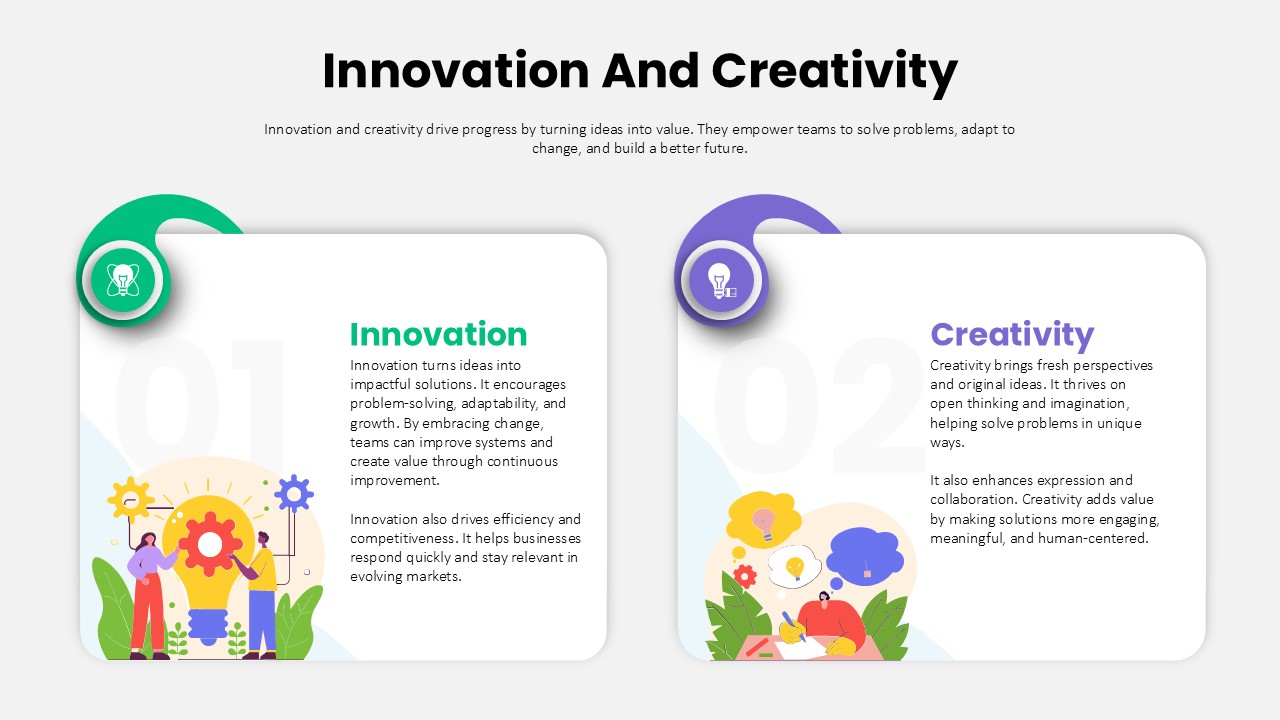
Innovation and Creativity Overview template for PowerPoint & Google Slides
Process
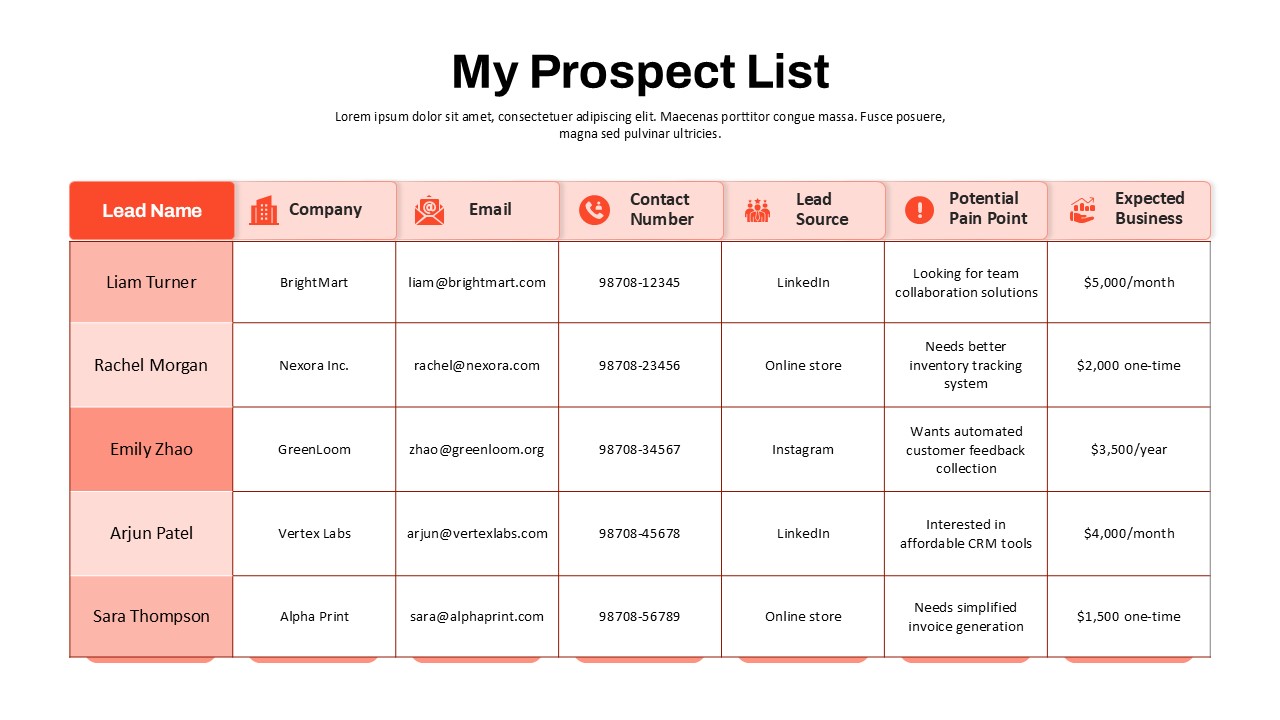
Prospect List Overview Template for PowerPoint & Google Slides
Business Report
Cyber Security Case Study Overview Template for PowerPoint & Google Slides
Information Technology
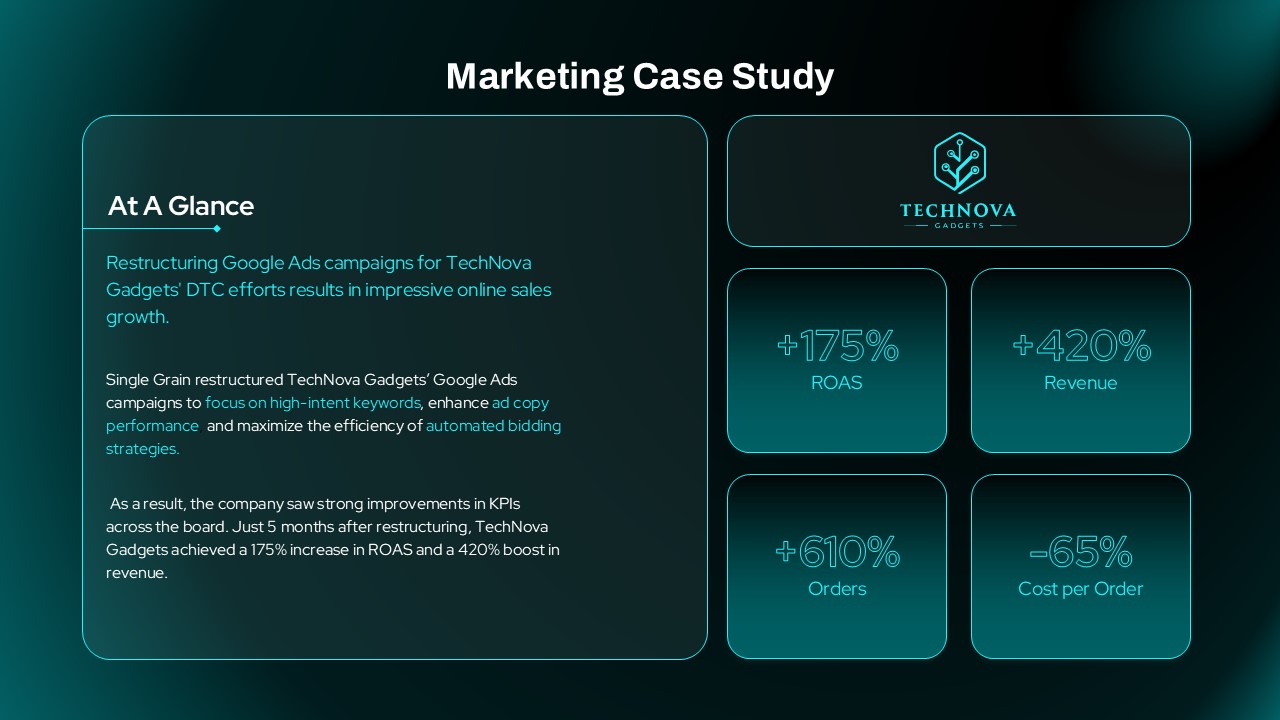
Marketing Case Study Overview template for PowerPoint & Google Slides
Digital Marketing
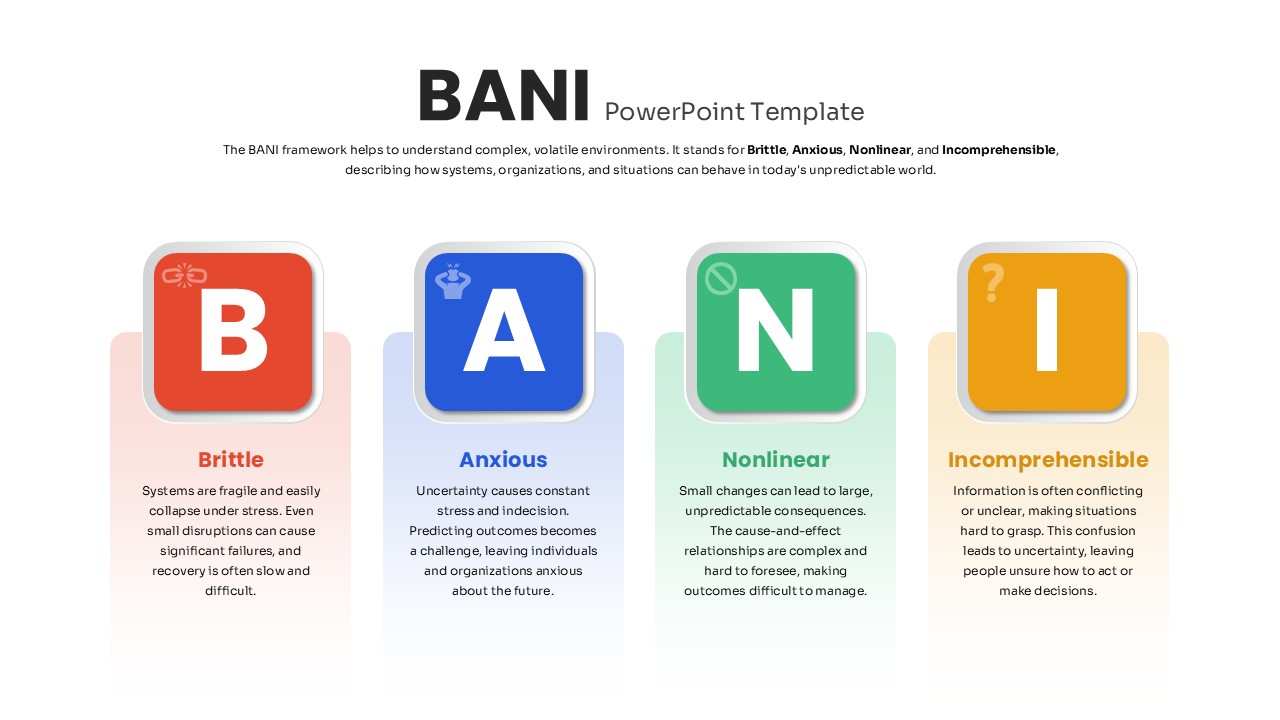
Four-Part BANI Framework Overview Template for PowerPoint & Google Slides
PEST
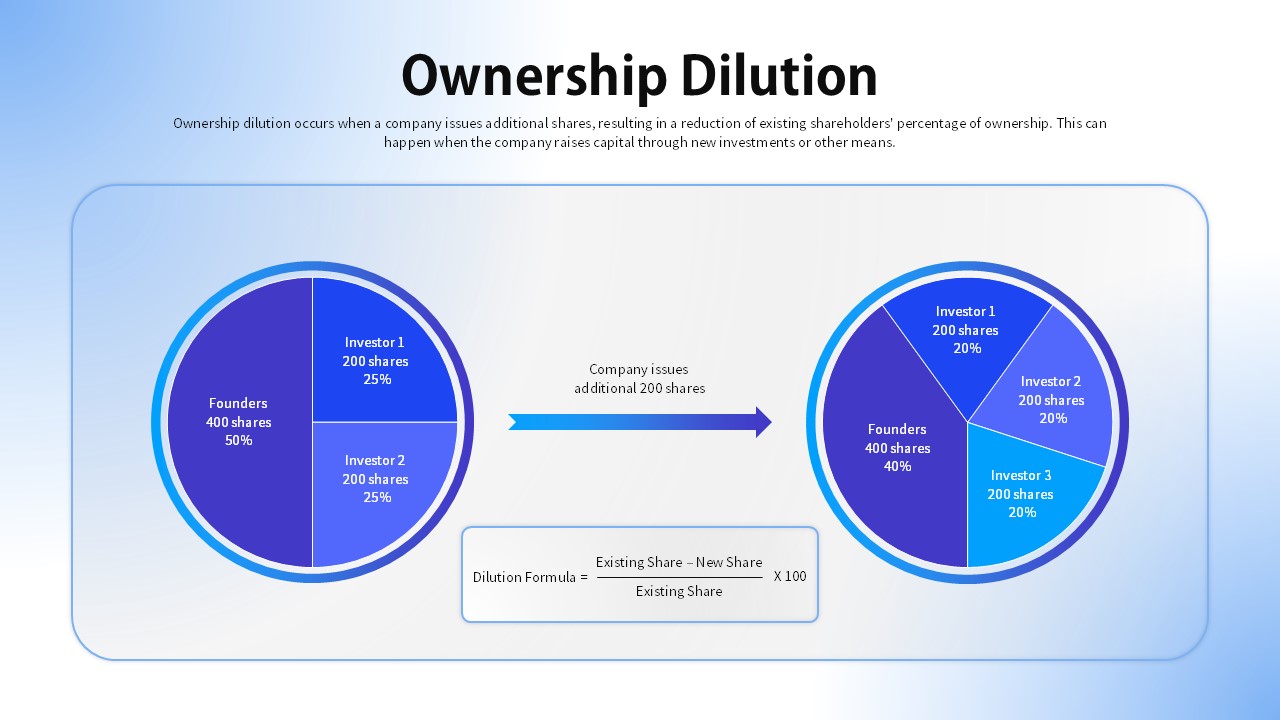
Ownership Dilution Overview template for PowerPoint & Google Slides
Business Proposal
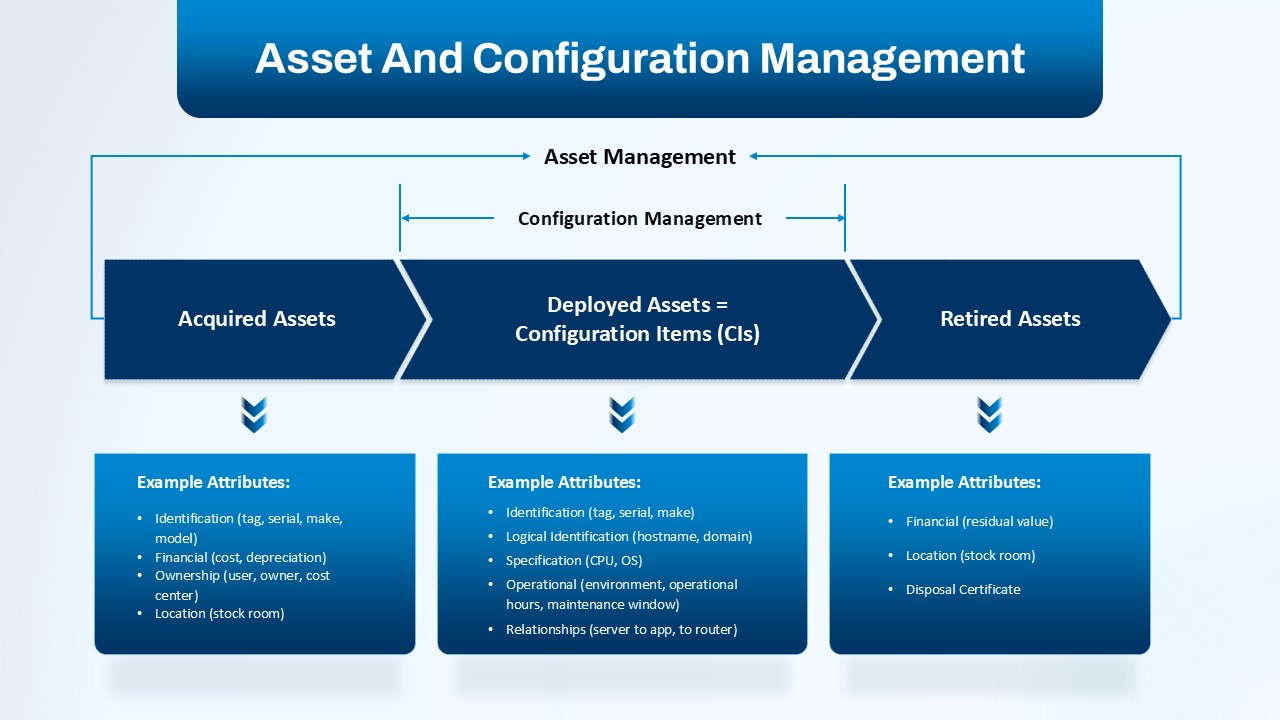
Asset and Configuration Management Overview template for PowerPoint & Google Slides
Information Technology
First Party Data Overview Template for PowerPoint & Google Slides
Business
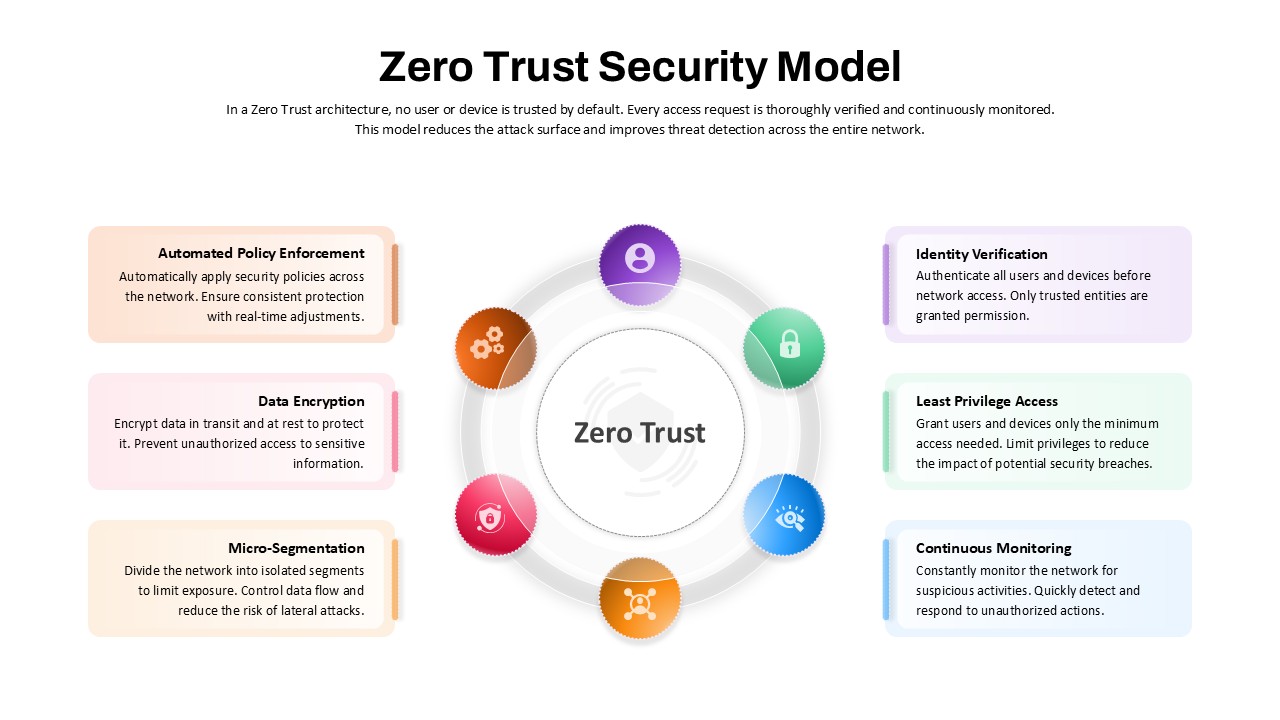
Zero Trust Security Model Overview template for PowerPoint & Google Slides
Risk Management
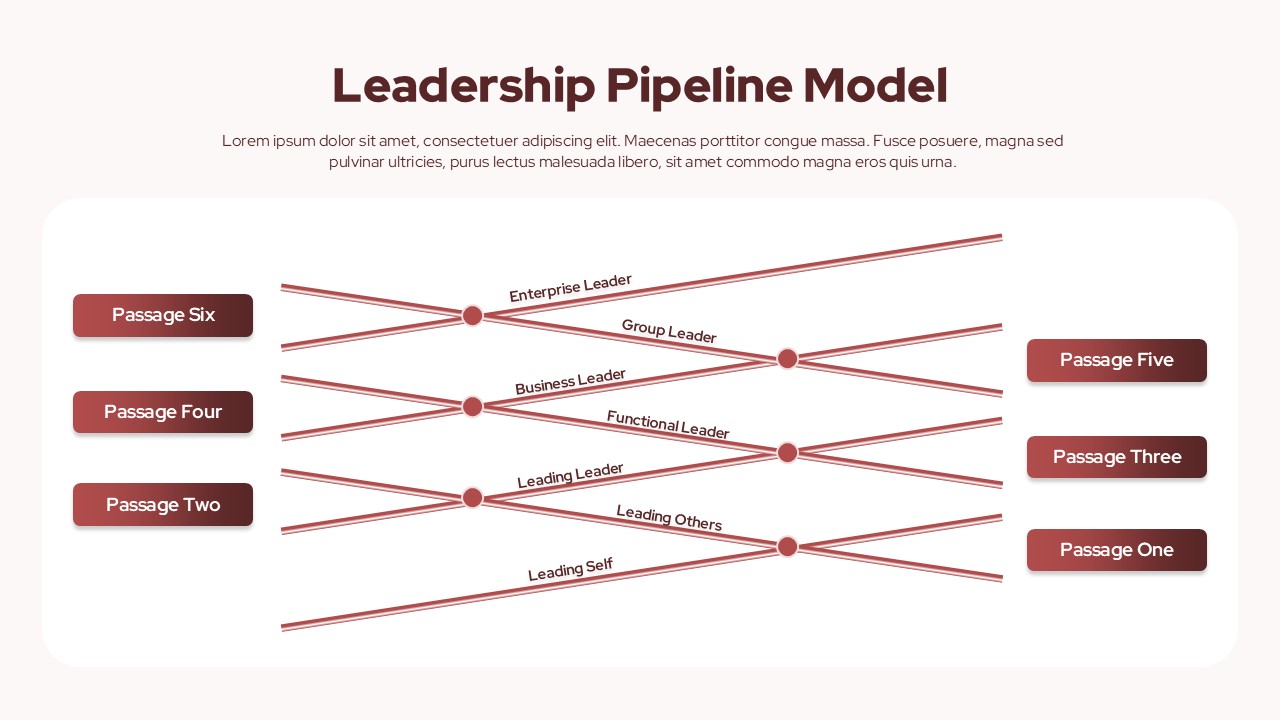
Leadership Pipeline Model Overview template for PowerPoint & Google Slides
Leadership
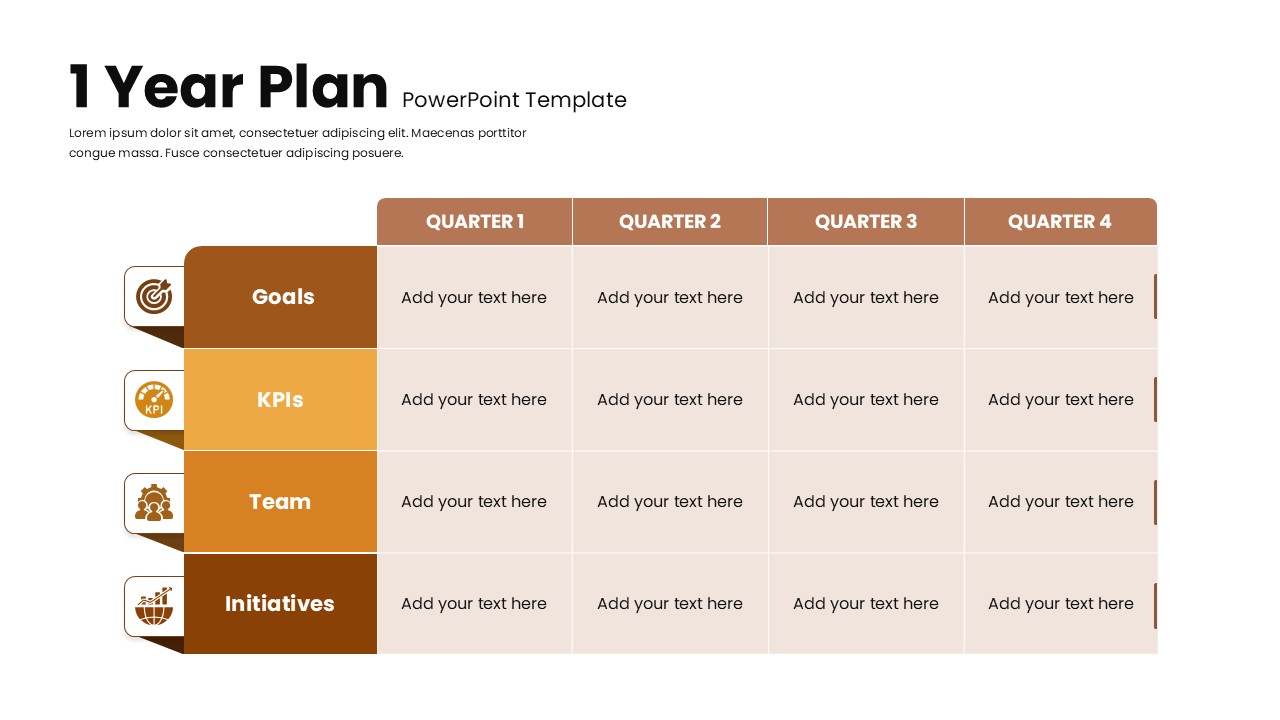
1 Year Plan Overview template for PowerPoint & Google Slides
Business Plan
Digital Transformation Consulting Overview Template for PowerPoint & Google Slides
Information Technology
Futuristic Machine Learning Types Overview Template for PowerPoint & Google Slides
AI
Surveillance Camera Security Overview Template for PowerPoint & Google Slides
Information Technology