Free Cloud Computing Six-Step Circular Template for PowerPoint & Google Slides
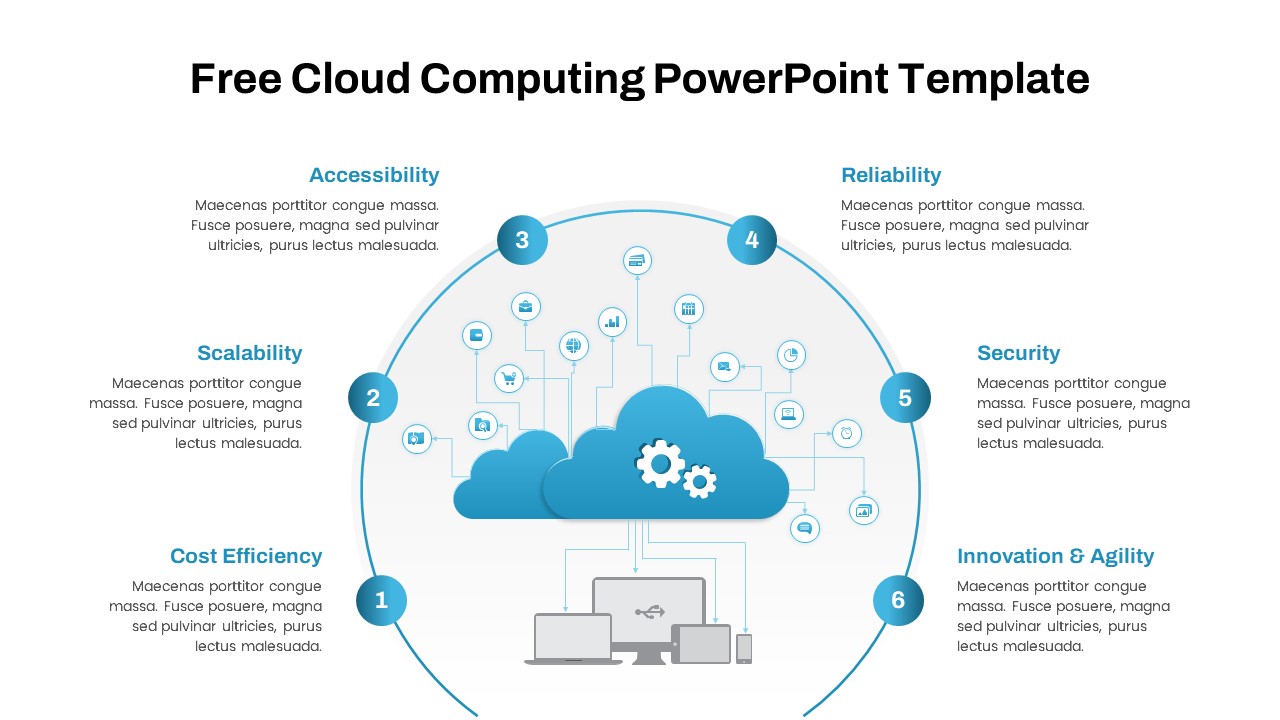
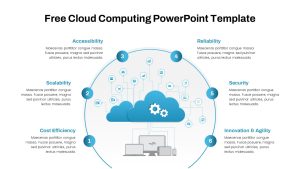

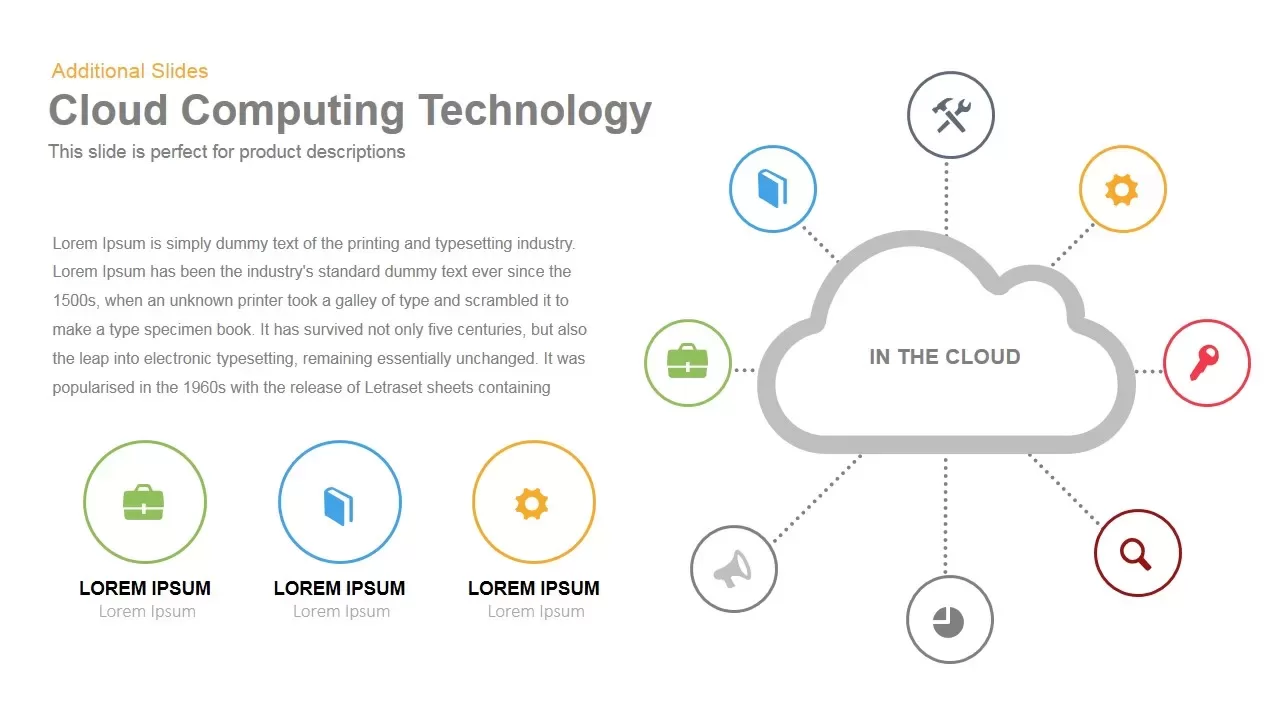
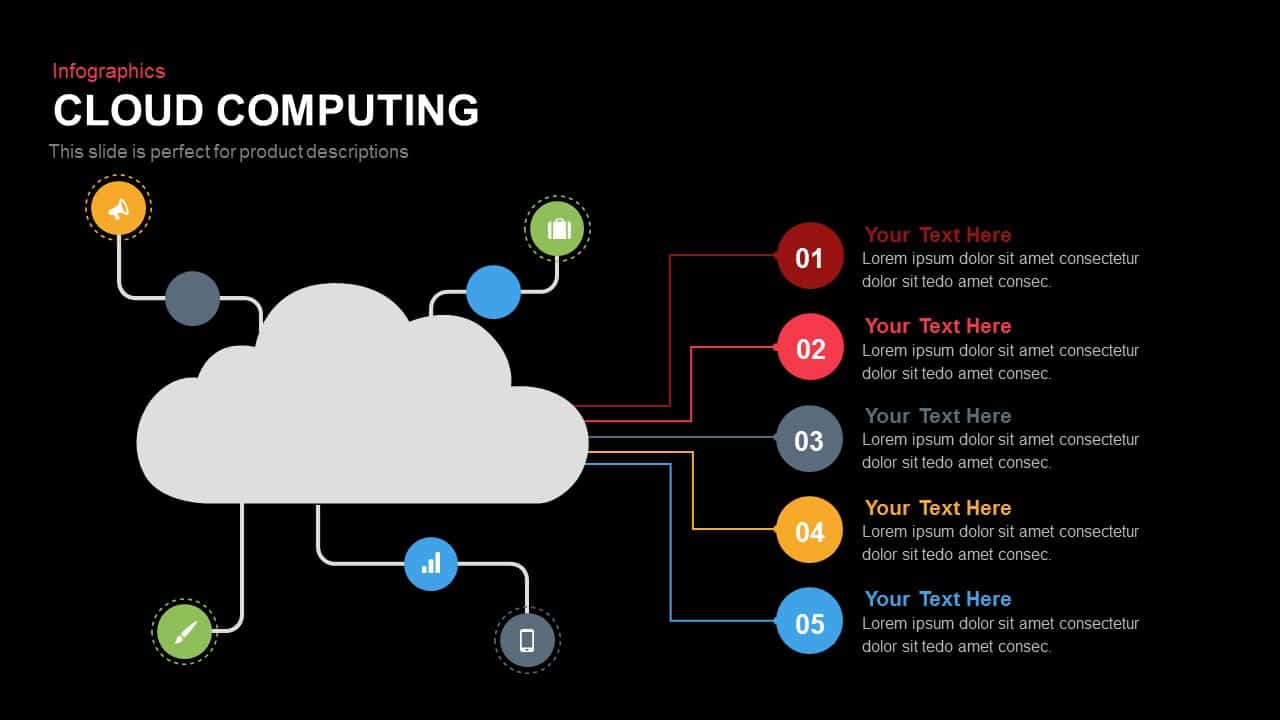
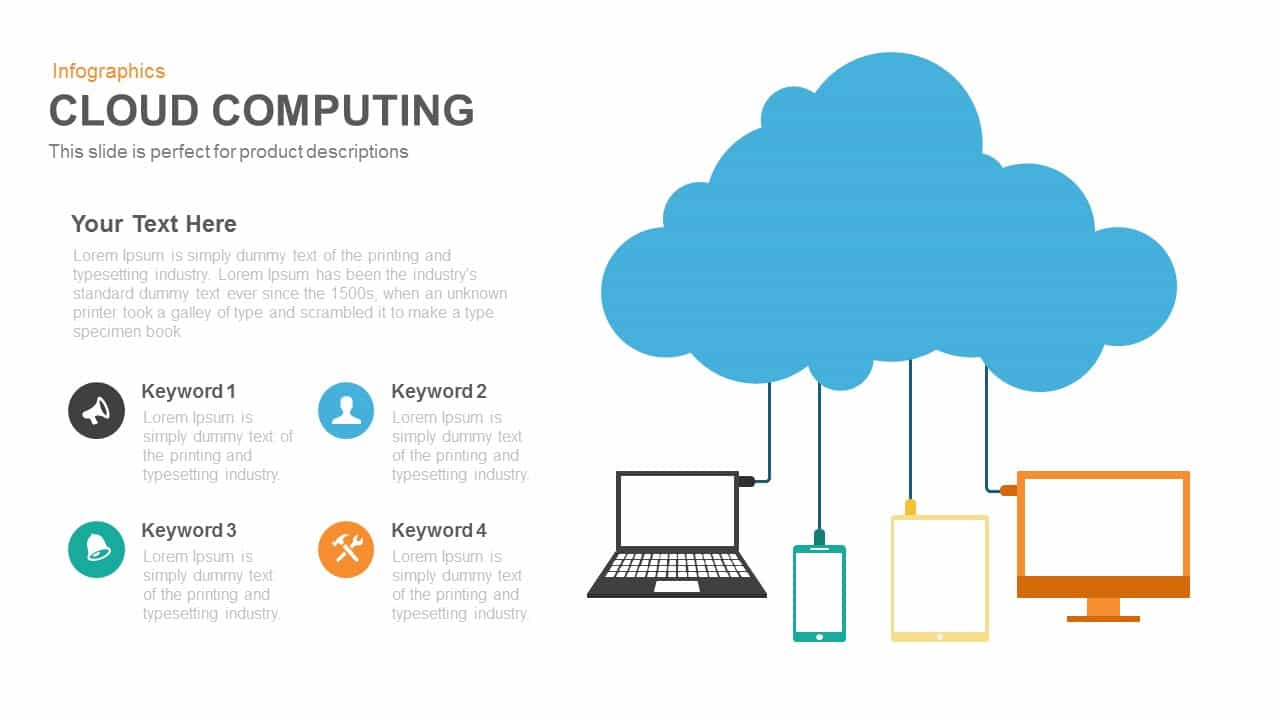
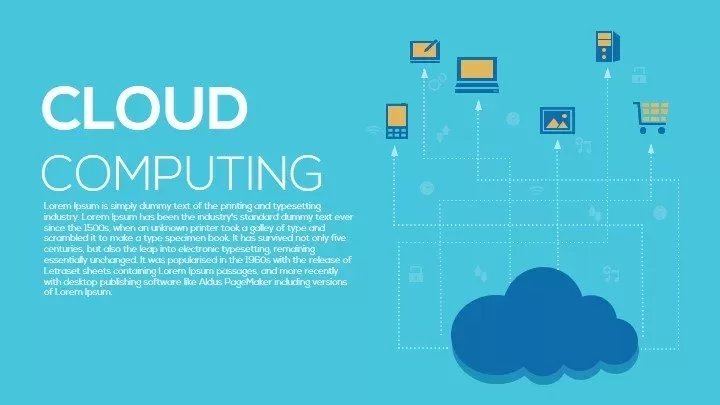
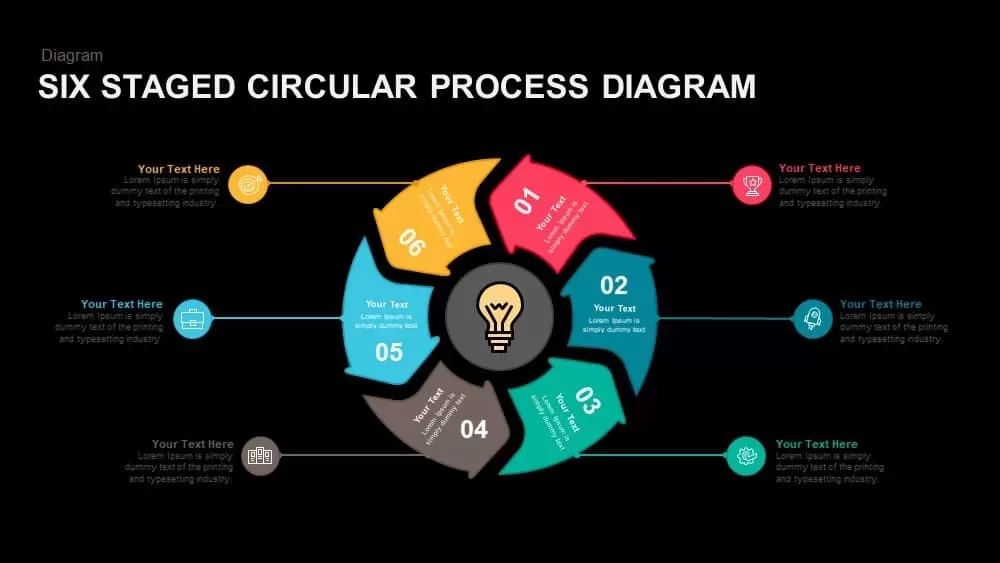
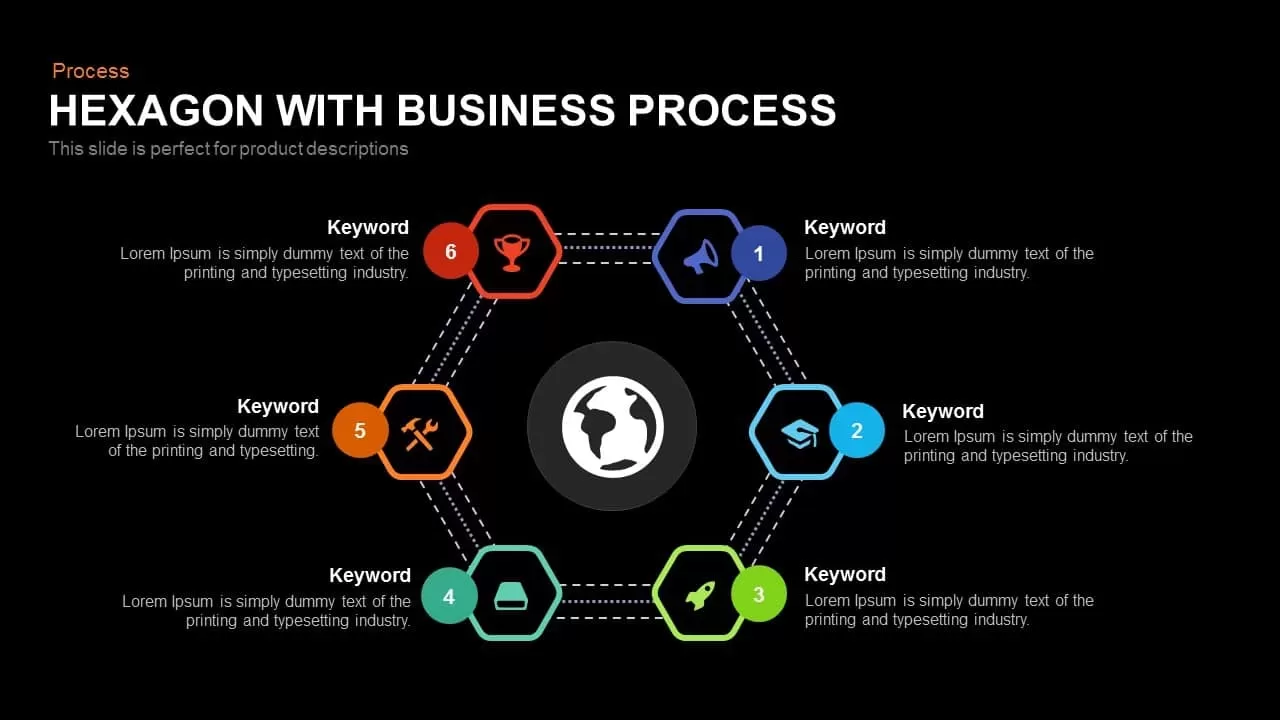
This slide delivers a clear, six-step circular infographic to present cloud computing benefits and processes at a glance. At the center, two layered cloud icons—one solid blue and one gradient—connect to peripheral devices (desktop, laptop, tablet, smartphone) and service icons via fine vector lines, illustrating a unified cloud network. Encircling this hub, a semi-transparent blue arc features six numbered nodes representing Cost Efficiency, Scalability, Accessibility, Reliability, Security, and Innovation & Agility. Each node aligns with a header and descriptive text block positioned alternately on the left and right, allowing you to expand on each advantage with concise bullets or brief narratives.
The design leverages a white background for maximum contrast, vibrant blue hues for focal elements, and muted gray for connectors and devices. Crisp sans-serif typography, generous white space, and subtle drop shadows ensure readability and a polished, professional appearance. Editable master slides let you swap node colors, replace icons from an integrated library, adjust text placeholders, and update connector paths without disrupting the layout. Vector-based graphics guarantee lossless scalability for large-format displays or printed handouts.
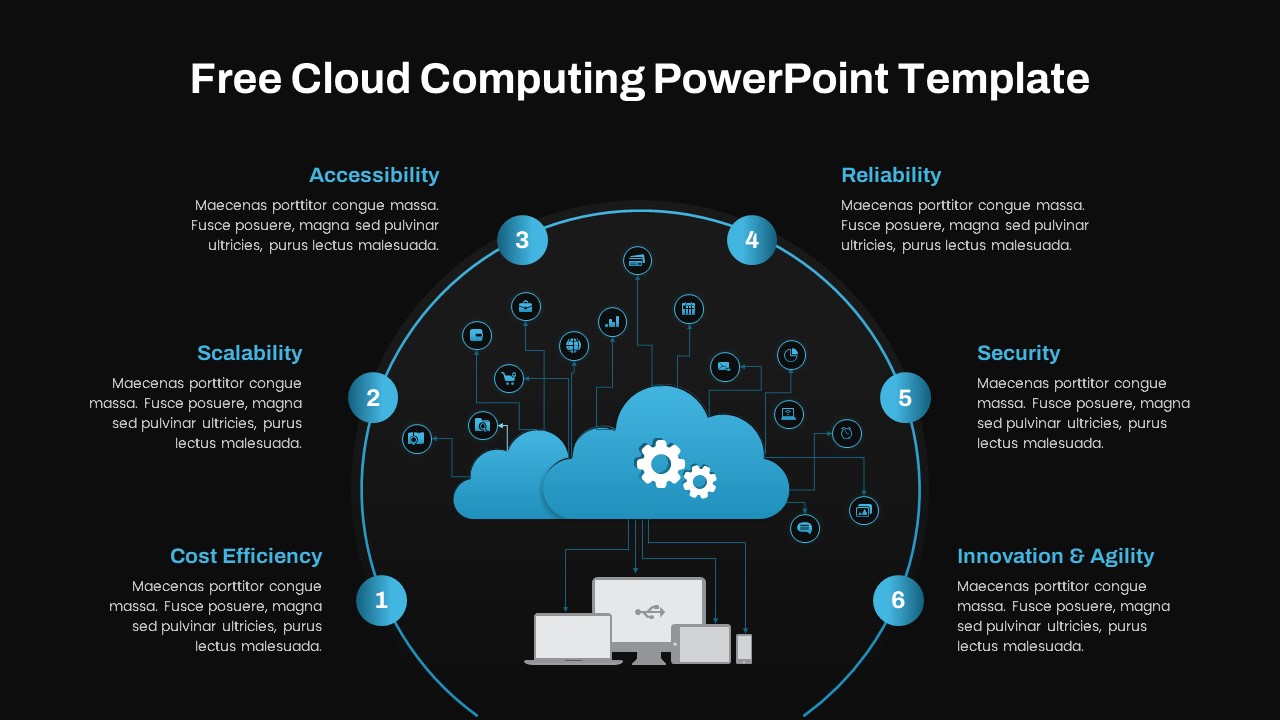
Optimized for both PowerPoint and Google Slides, the template maintains pixel-perfect fidelity across devices and screen resolutions, supporting real-time collaborative editing in cloud environments. Accessibility-focused color contrasts and optional light/dark variants accommodate diverse audience needs. Whether illustrating a cloud service proposal, network architecture overview, or digital transformation roadmap, this six-step circular diagram provides a versatile framework to communicate complex concepts with clarity and impact. Preconfigured layout variations—including single-node focus, grouped node clusters, or full-circle overviews—streamline slide creation. You can also insert custom imagery (company logos or system diagrams) at the center for branding or technical deep dives, and easily add or remove nodes to match shorter or extended feature lists.
Who is it for
IT leaders, cloud architects, and infrastructure managers can use this slide to explain service advantages, deployment models, or migration plans. Product managers, sales engineers, and technology consultants will appreciate its structured visual flow for proposals, training sessions, or executive briefings.
Other Uses
Repurpose this circular infographic for network topology mapping, DevOps workflow overviews, service-tier breakdowns, or IoT connectivity diagrams. It also works for SaaS feature roadmaps, security framework presentations, or any context where a radial layout clarifies multi-facet relationships.
Login to download this file

Item ID
SB04190
Related Templates

Cloud Computing Diagram template for PowerPoint & Google Slides
Technology
Cloud Computing Infographics template for PowerPoint & Google Slides
Cloud Computing
Cloud Computing Infographics template for PowerPoint & Google Slides
Cloud Computing

Cloud Computing Hub and Spoke Diagram Template for PowerPoint & Google Slides
Cloud Computing
Gradient Cloud Computing Dark Cover Template for PowerPoint & Google Slides
Pitch Deck
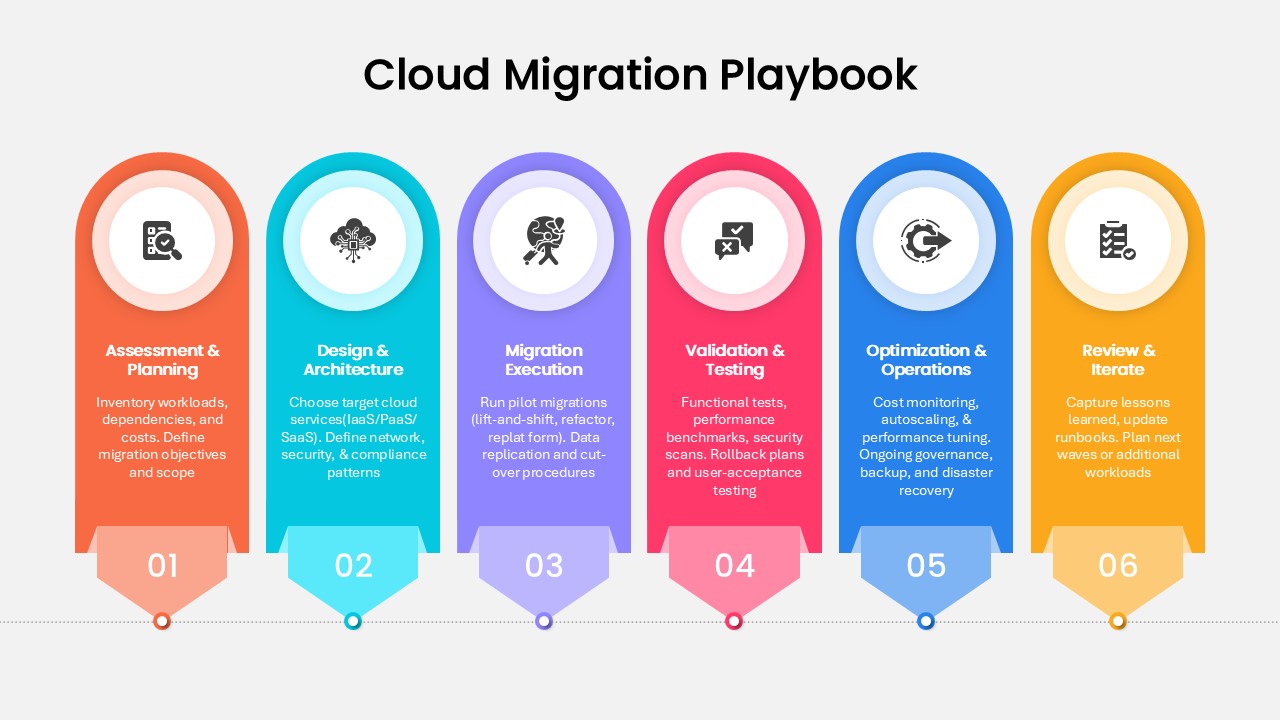
Step-by-Step Cloud Migration Playbook Template for PowerPoint & Google Slides
Cloud Computing
Six Step Creative Circular Diagram Template for PowerPoint & Google Slides
Circular
Six-Step Circular Diagram Infographics Template for PowerPoint & Google Slides
Circular
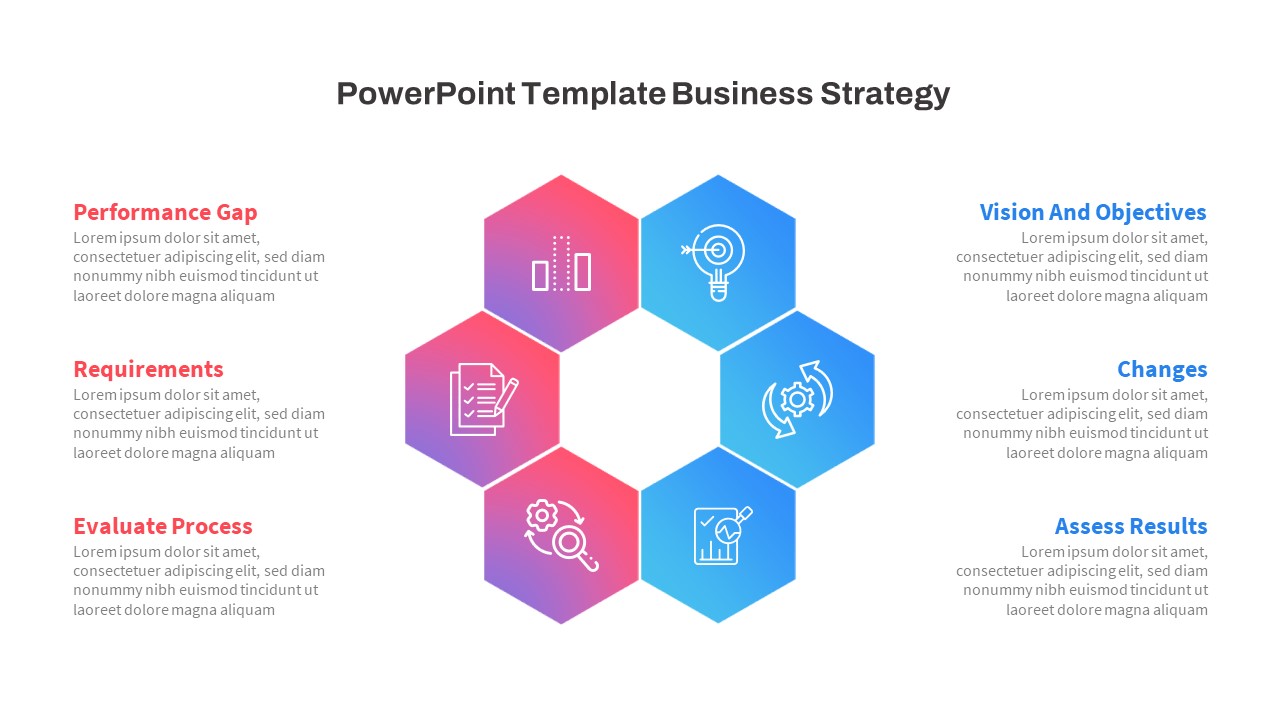
Free Hexagonal Six-Step Business Strategy Template for PowerPoint & Google Slides
Process
Free
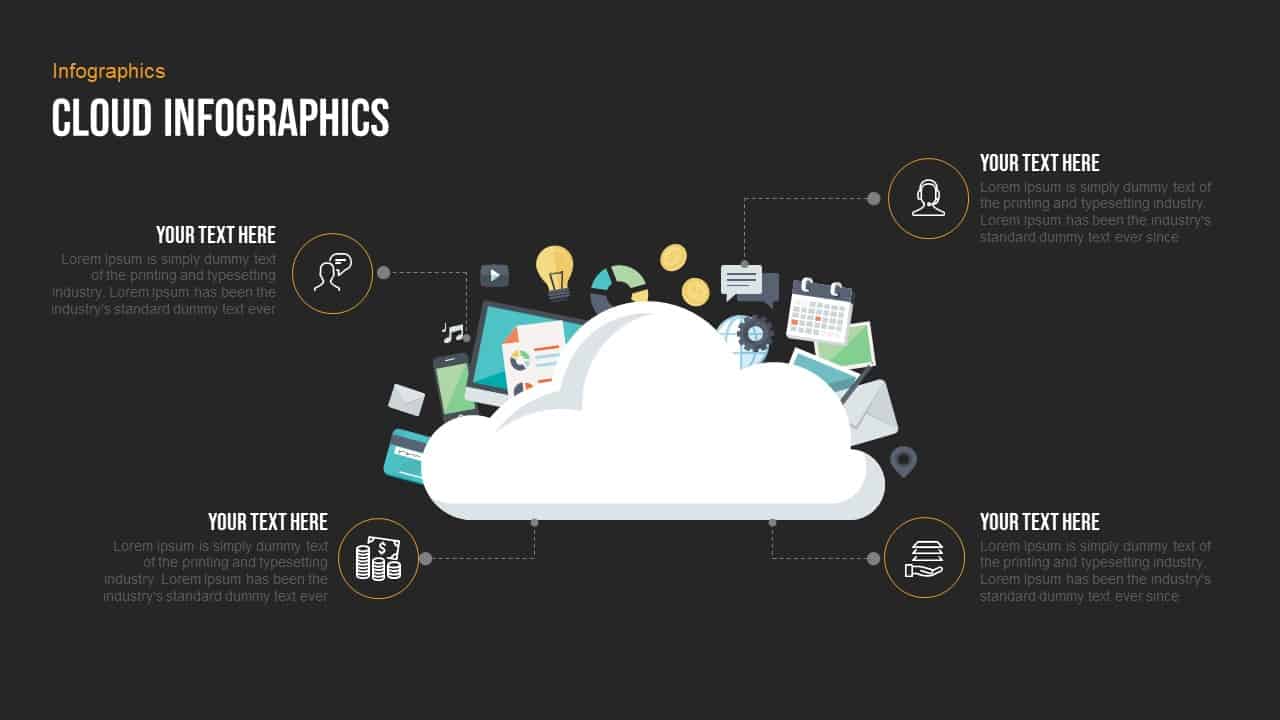
Free Professional Cloud Infographics Template for PowerPoint & Google Slides
Process
Free
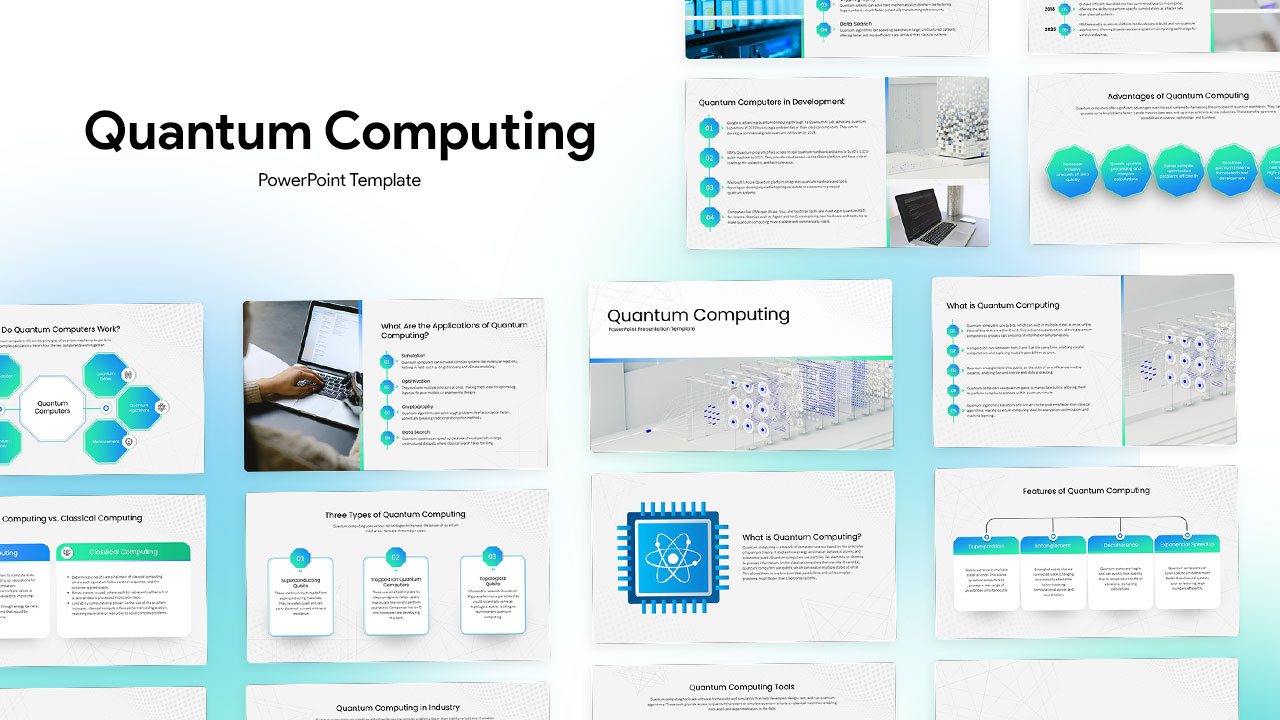
Quantum Computing PowerPoint Template & Google Slides
Information Technology
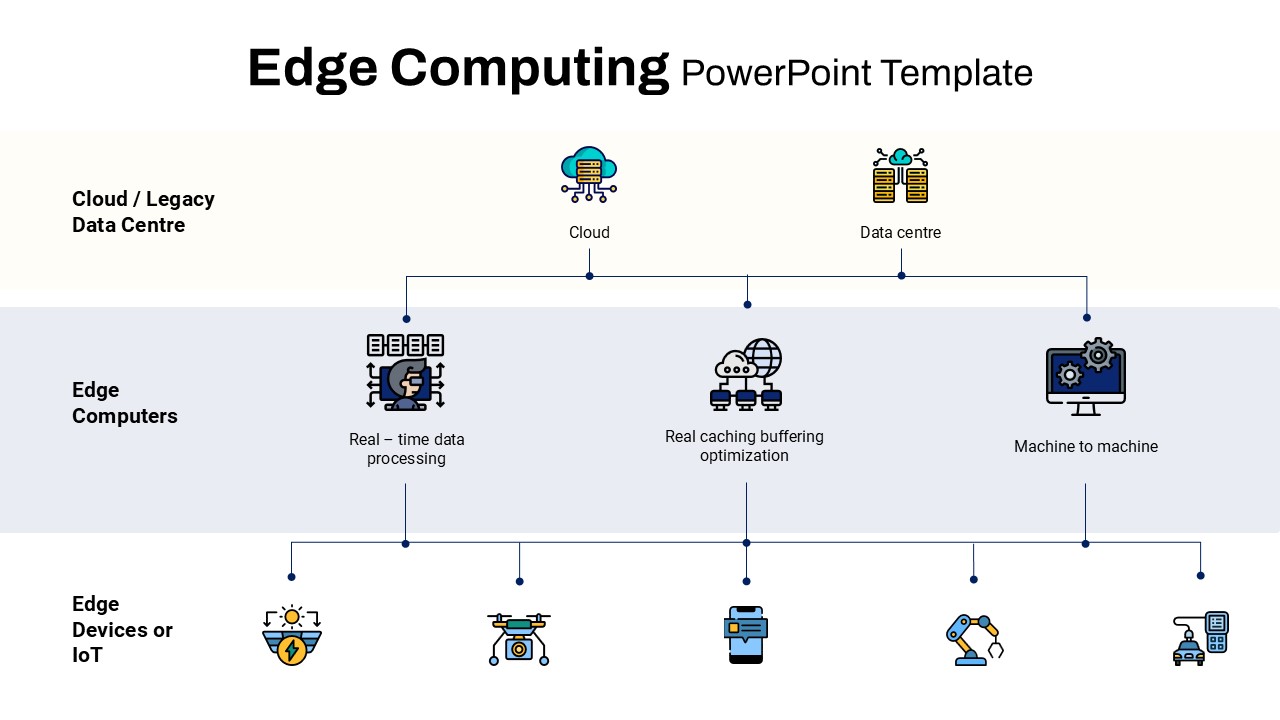
Edge Computing Overview template for PowerPoint & Google Slides
Technology
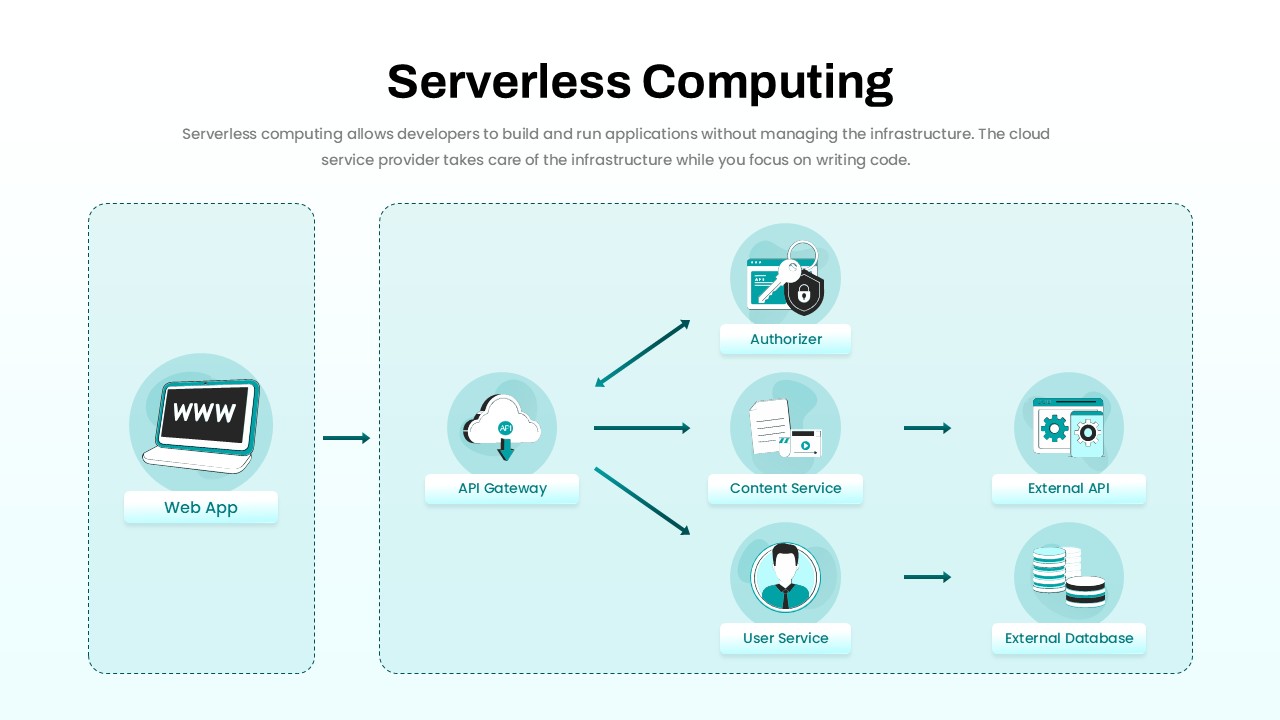
Serverless Computing Architecture for PowerPoint & Google Slides
Software Development
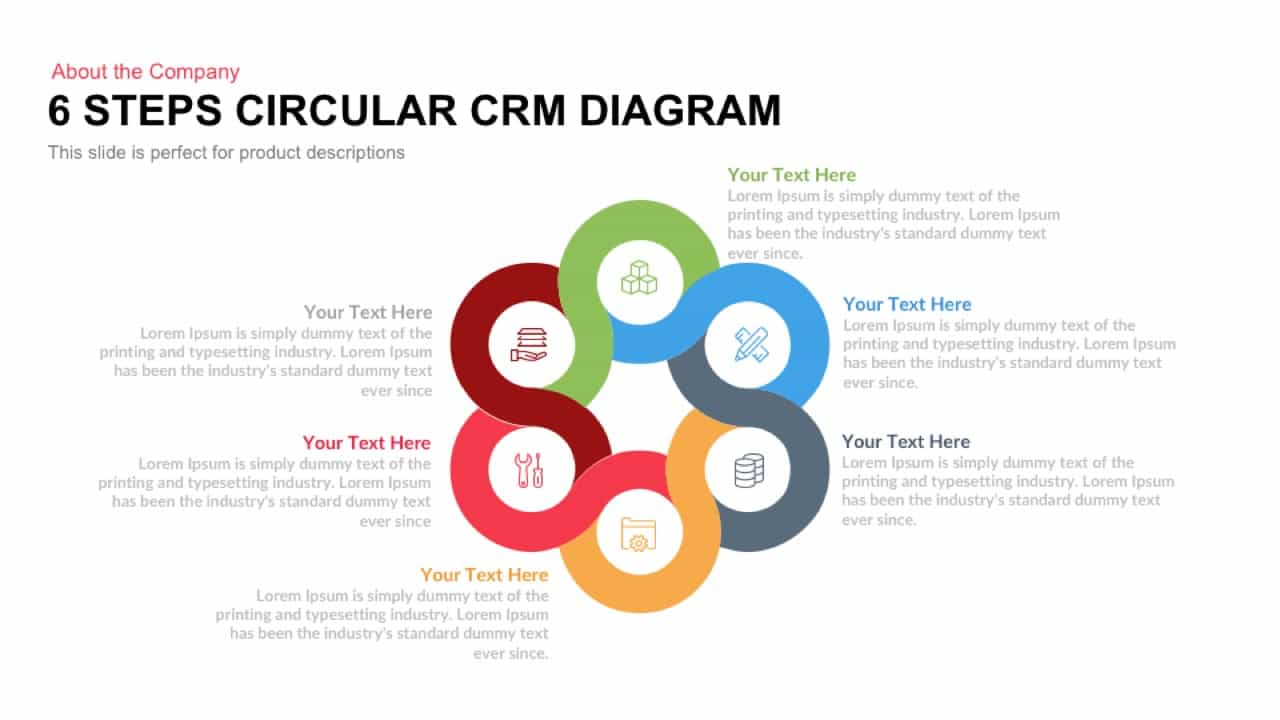
Six Steps Circular CRM Diagram Template for PowerPoint & Google Slides
Customer Journey
Six Section Circular Infographic Diagram Template for PowerPoint & Google Slides
Circular
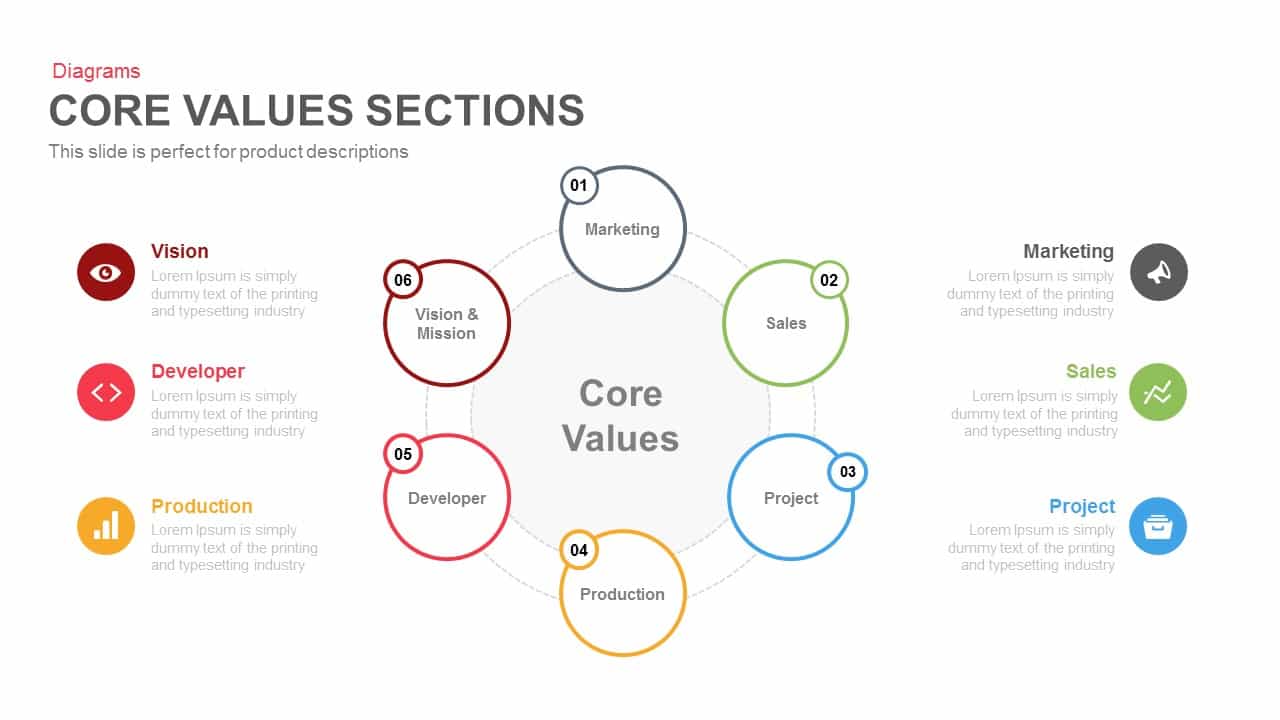
Six-Part Core Values Circular Diagram Template for PowerPoint & Google Slides
Circular
Six-Stage Circular Cycle Diagram Template for PowerPoint & Google Slides
Process
Six-Segment Circular Hub Infographic Template for PowerPoint & Google Slides
Circular

Six-Process Circular Arrow Diagram Template for PowerPoint & Google Slides
Circular

Six-Stage Circular Process Diagram Template for PowerPoint & Google Slides
Process
Six Stage Circular Diagram with Icons Template for PowerPoint & Google Slides
Circular
Six Segment Hexagon Circular Diagram Template for PowerPoint & Google Slides
Circular
Three to Six Staged Circular Diagram Template for PowerPoint & Google Slides
Process
Six-Stage Circular Diagram Process Template for PowerPoint & Google Slides
Circular
Six-Stage Clockwise Circular Diagram Template for PowerPoint & Google Slides
Circular
Six-Stage Circular Flow Diagram Template for PowerPoint & Google Slides
Circular
Circular 3D Cube Six-Segment Diagram Template for PowerPoint & Google Slides
Infographics
Six-Segment Circular Arrow Cycle Template for PowerPoint & Google Slides
Circular
Six-Segment Circular Arrow Infographic Template for PowerPoint & Google Slides
Circular

Free Five-Step Circular Timeline Infographic Template for PowerPoint & Google Slides
Timeline
Free
Free Circular Multi-Step Flow Chart Diagram Template for PowerPoint & Google Slides
Flow Charts
Free
Six-Step Infographics Template for PowerPoint & Google Slides
Process
Roadmap Six-Step Process Diagram Template for PowerPoint & Google Slides
Roadmap
Global Hexagon Six-Step Business Process Template for PowerPoint & Google Slides
Process
Editable Six-Step Bubble Process Diagram Template for PowerPoint & Google Slides
Process
Six-Step Hexagon Process Diagram Template for PowerPoint & Google Slides
Process
Six-Step Two-Sided Arrow Diagram Template for PowerPoint & Google Slides
Process
Six-Step Hexagonal Diagram Slide Template for PowerPoint & Google Slides
Circular
Six-Step Vertical Process Diagram Template for PowerPoint & Google Slides
Process
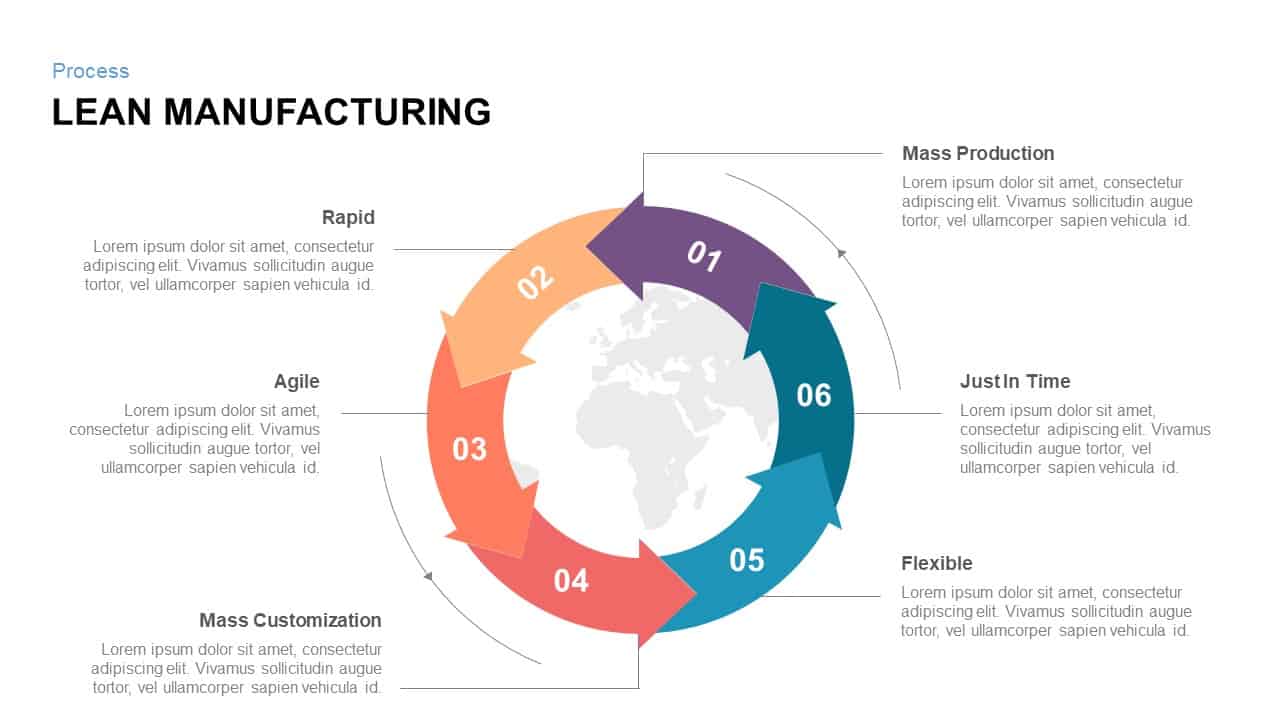
Six-Step Lean Manufacturing Process Template for PowerPoint & Google Slides
Process
Six-Step Linear Arrow Process Diagram Template for PowerPoint & Google Slides
Process
Six-Step Hexagon Process Flow Diagram Template for PowerPoint & Google Slides
Process
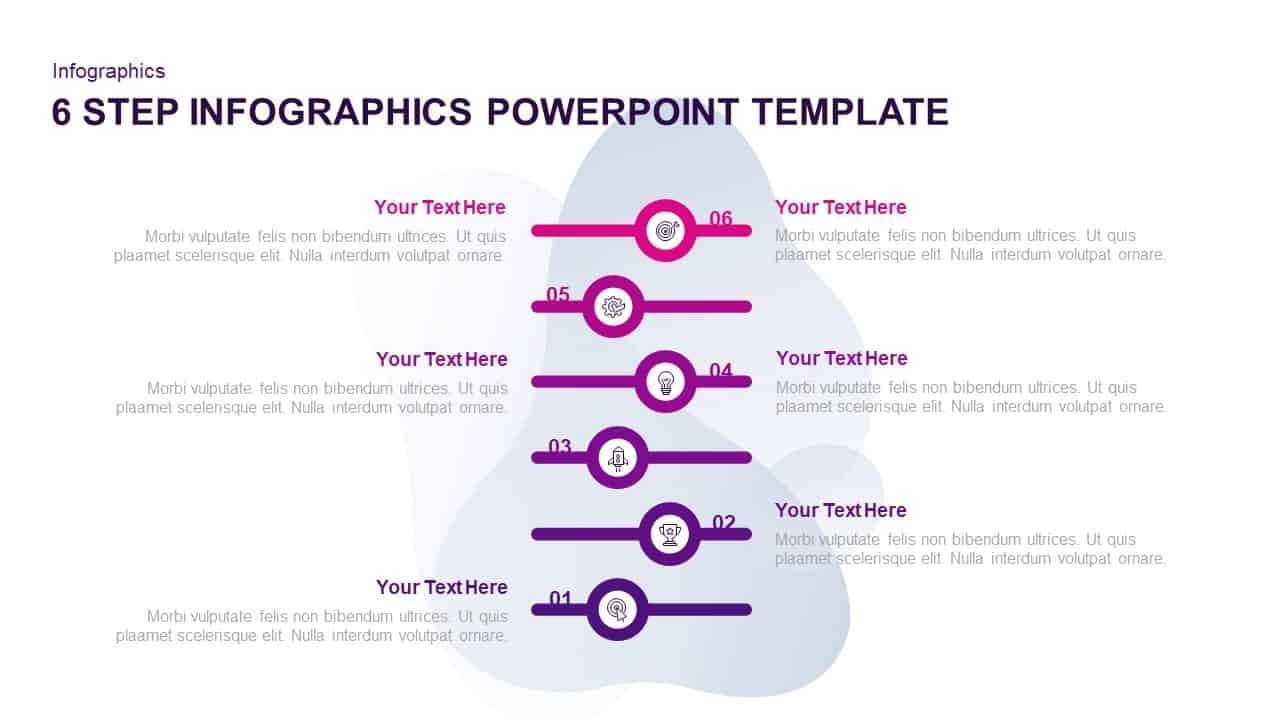
Six-Step Purple Gradient Infographics Template for PowerPoint & Google Slides
Process
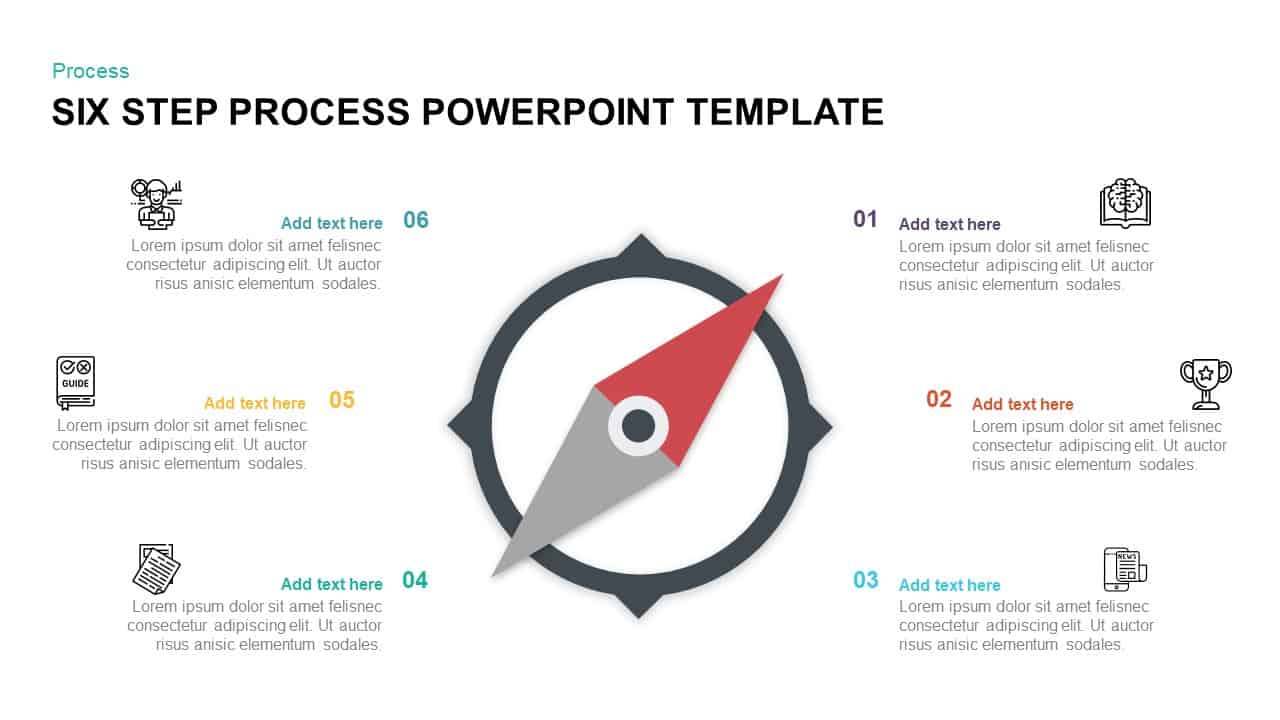
Compass-Themed Six-Step Process Diagram Template for PowerPoint & Google Slides
Process
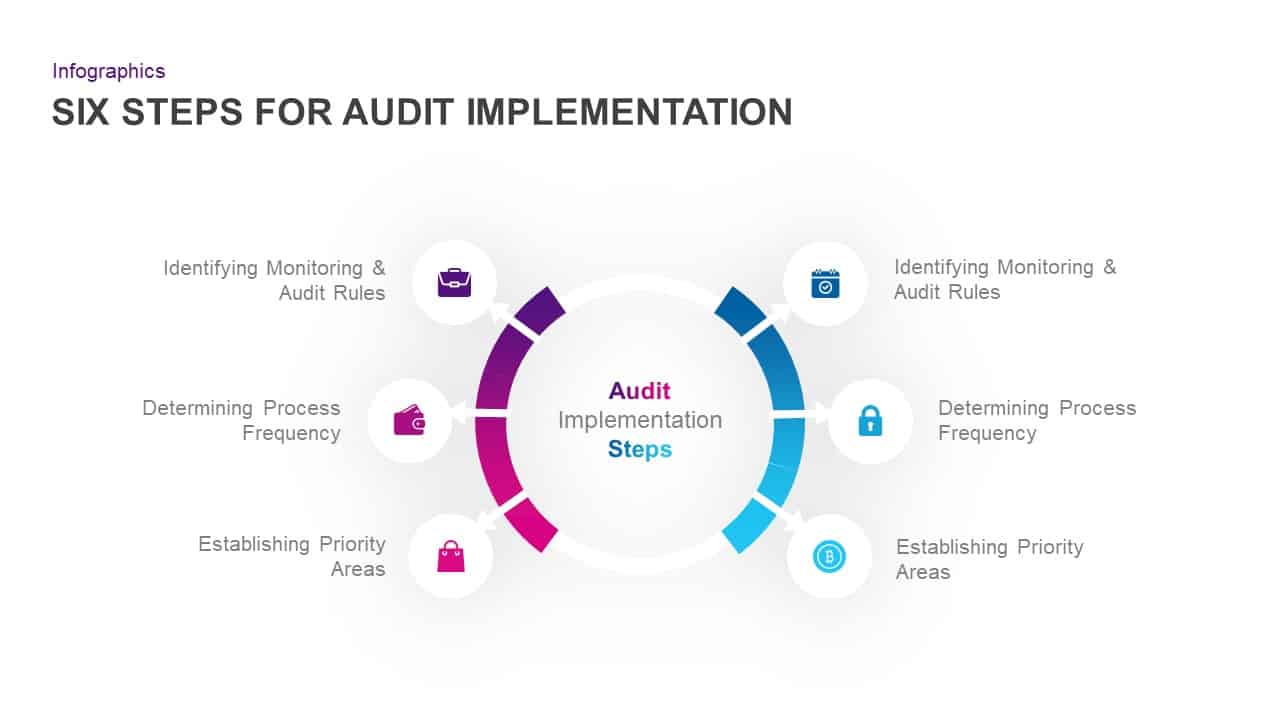
Six-Step Audit Implementation Chart Template for PowerPoint & Google Slides
Circular
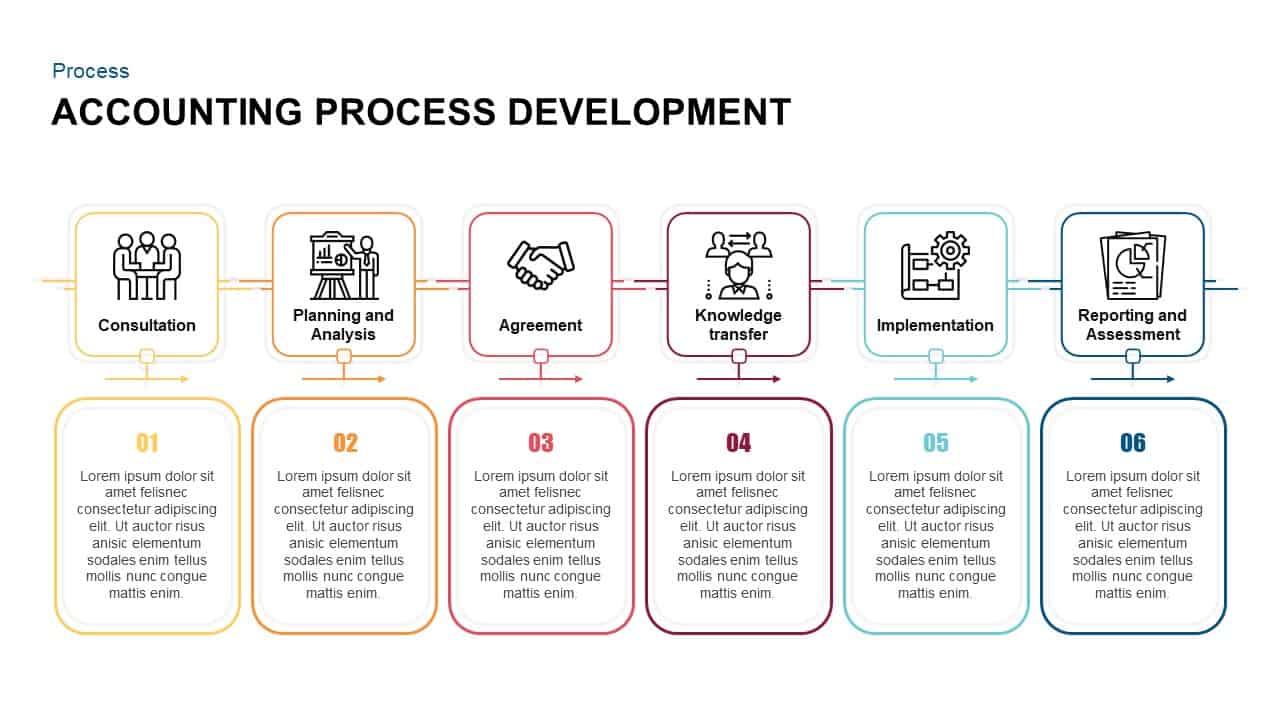
Six-Step Accounting Process Development Template for PowerPoint & Google Slides
Process
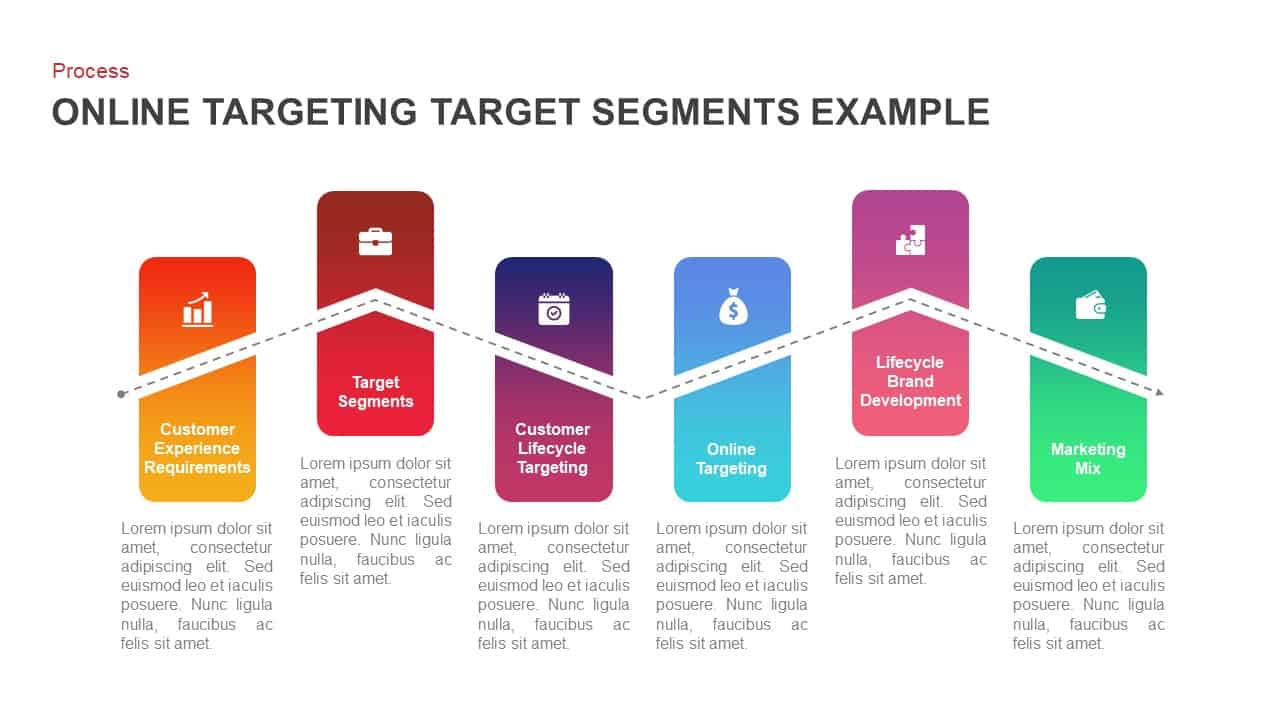
Online Targeting Lifecycle Six-Step Template for PowerPoint & Google Slides
Digital Marketing
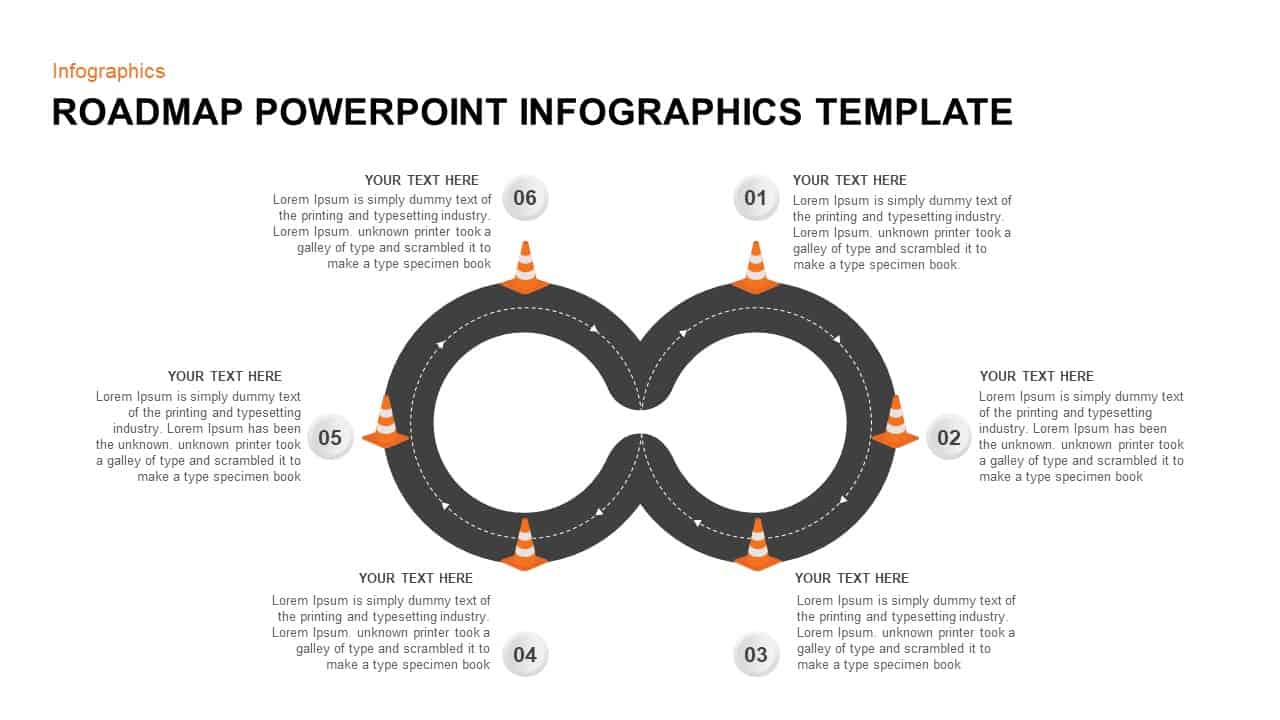
Six-Step Roadmap Infographic Template for PowerPoint & Google Slides
Roadmap
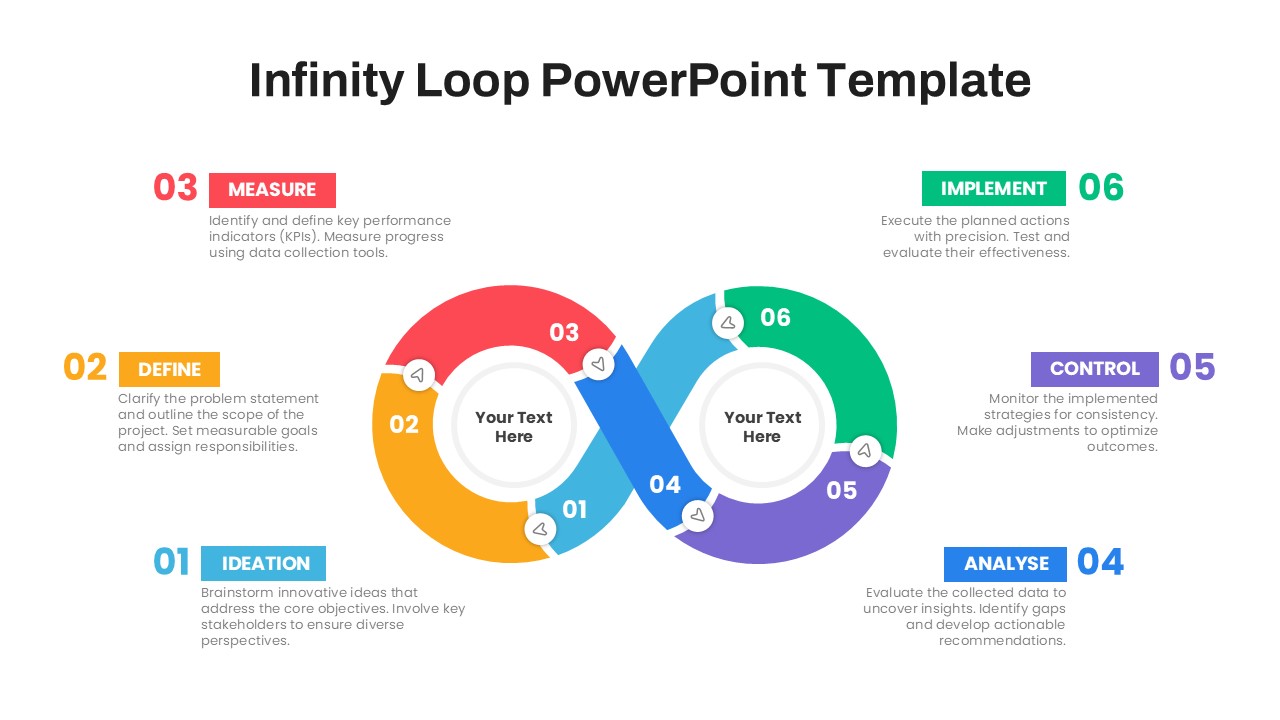
Six-Step Infinity Loop Process Diagram Template for PowerPoint & Google Slides
Process
Six-Step Tree Diagram Infographic Template for PowerPoint & Google Slides
Infographics

Six-Step Output Process Diagram Template for PowerPoint & Google Slides
Process
Six-Step Hexagon Design Thinking Models Template for PowerPoint & Google Slides
Circular
Modern Ribbon Six-Step Agenda Slide Template for PowerPoint & Google Slides
Agenda
Six-Step Color-Coded Table of Contents Template for PowerPoint & Google Slides
Agenda
Six-Step Table of Contents Infographic Template for PowerPoint & Google Slides
Agenda
Six-Step Accomplishment Radial Infographic Template for PowerPoint & Google Slides
Accomplishment
Six-Step Hexagon Infographic Layout Template for PowerPoint & Google Slides
Infographics
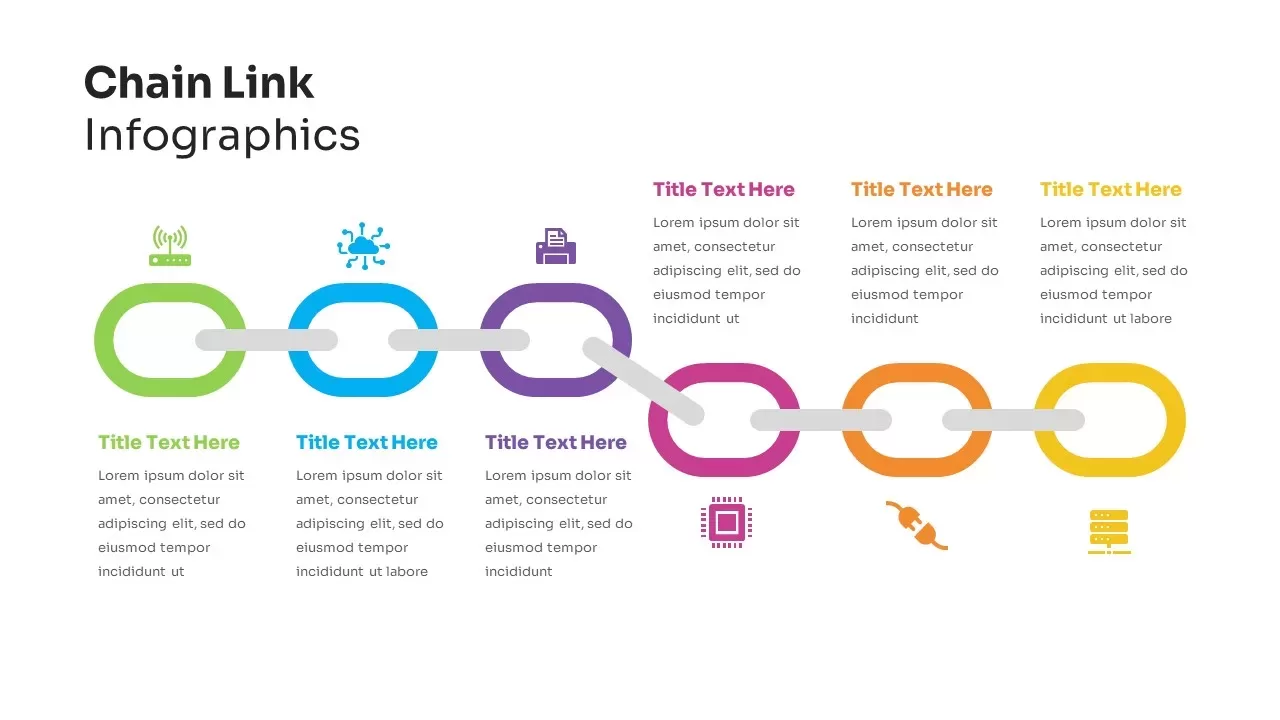
Six-Step Chain Link Technology Process Template for PowerPoint & Google Slides
Process
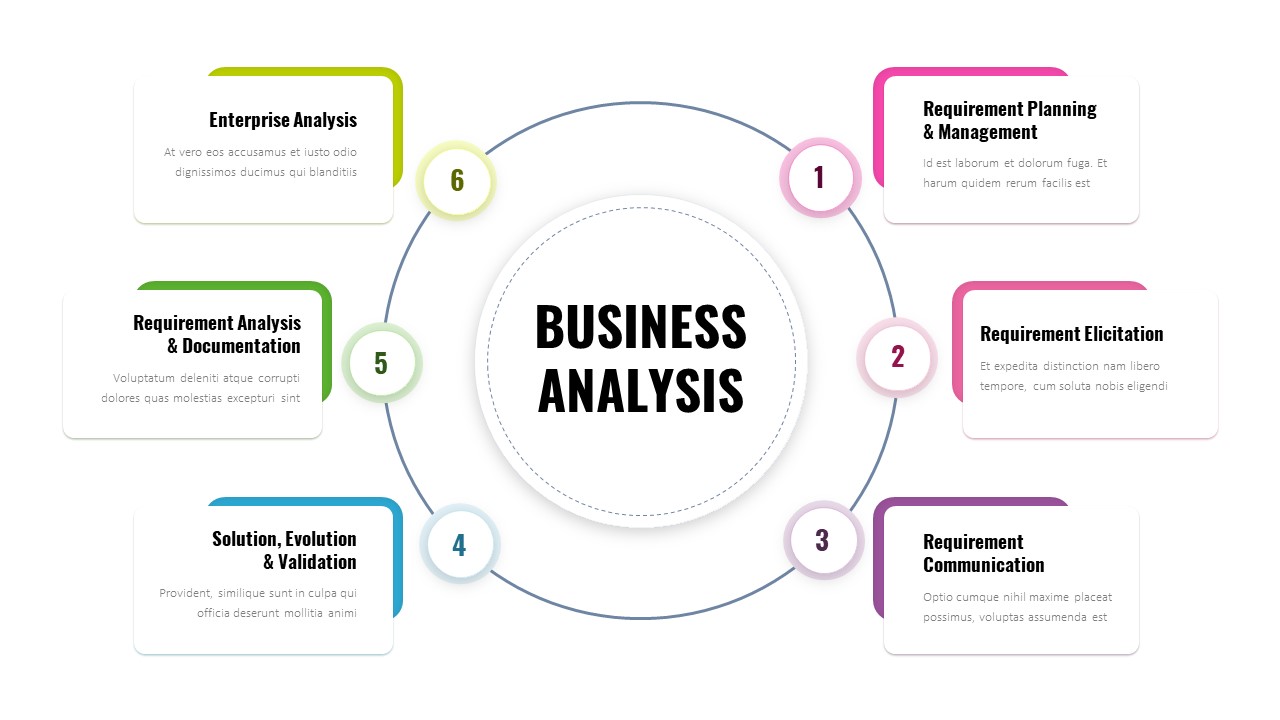
Six-Step Business Analysis Diagram template for PowerPoint & Google Slides
Circular
Six-Step Colorful Flywheel Diagram Template for PowerPoint & Google Slides
Circular
Six-Step Business Analysis Template for PowerPoint & Google Slides
Process
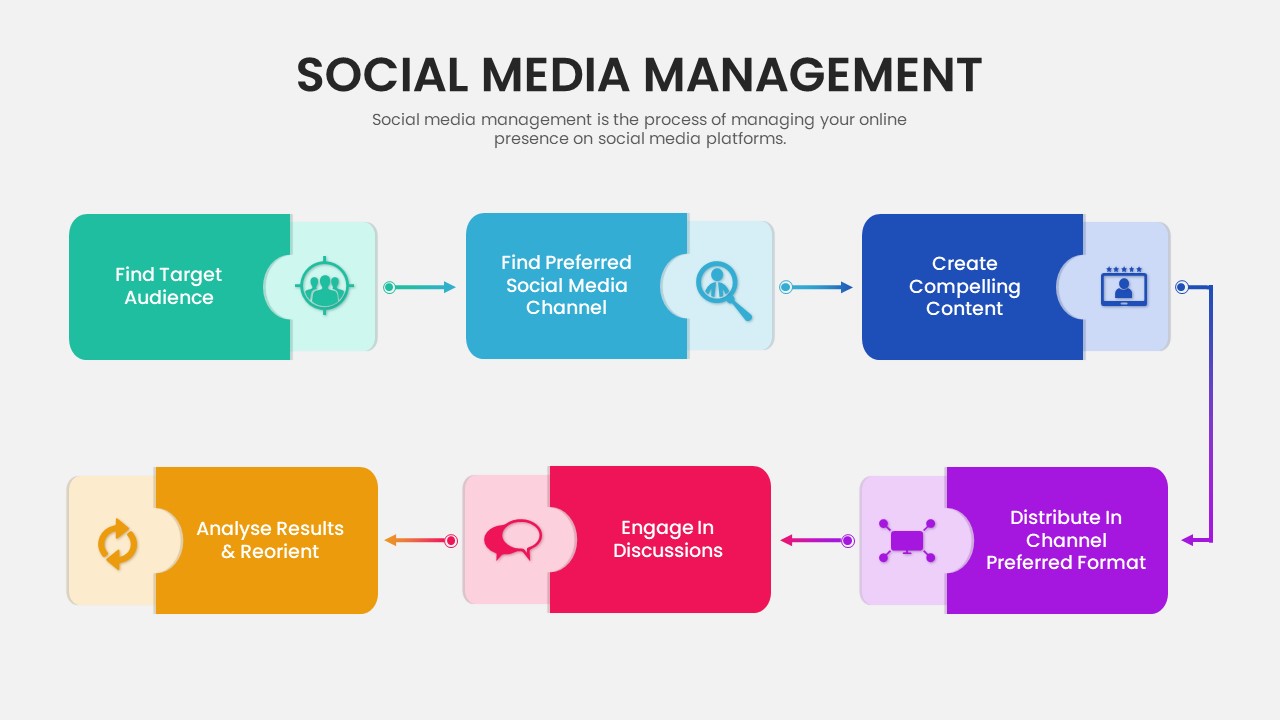
Six-Step Social Media Management Process Template for PowerPoint & Google Slides
Process
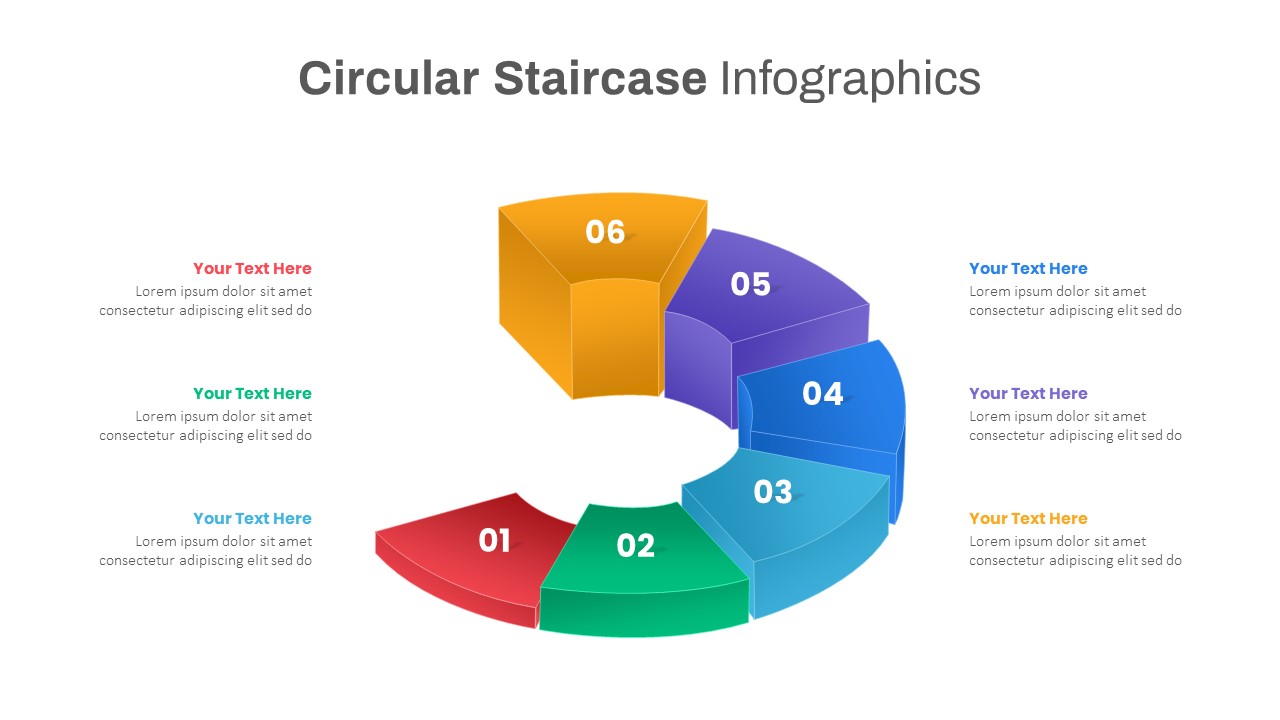
Six-Step Staircase Infographic Template for PowerPoint & Google Slides
Circular
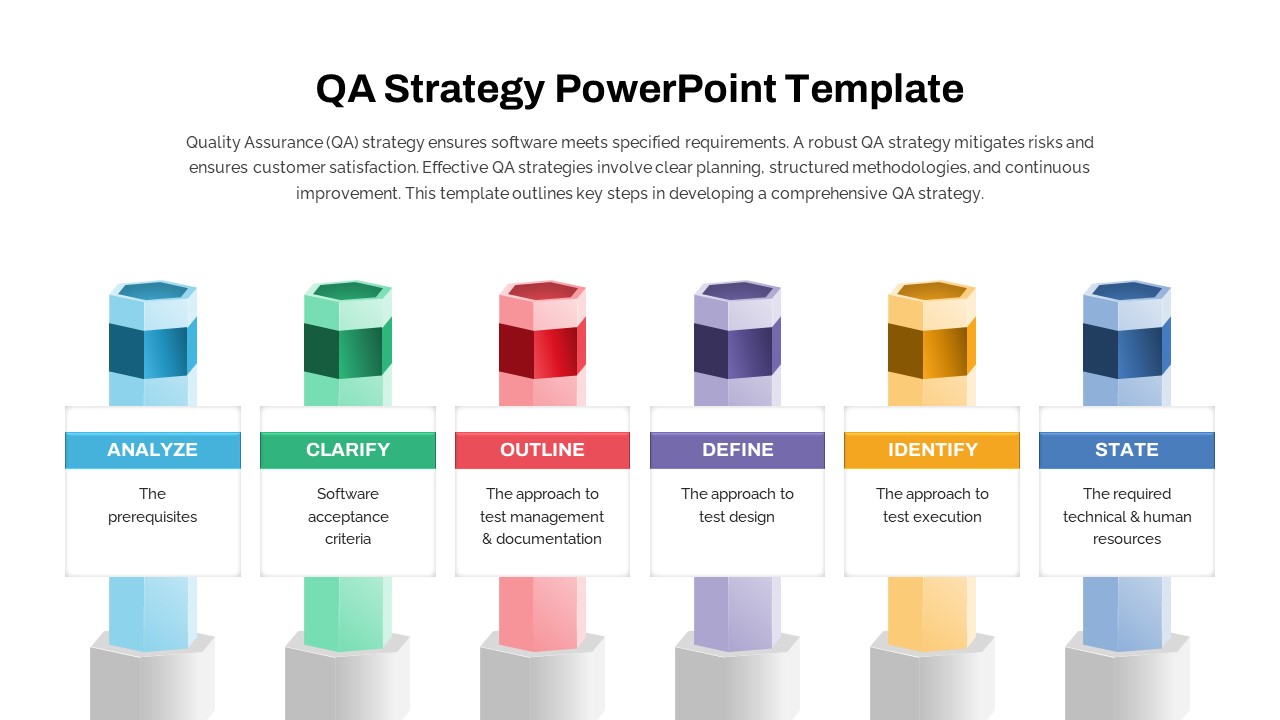
Six-Step QA Strategy Pillar Diagram Template for PowerPoint & Google Slides
Software Development
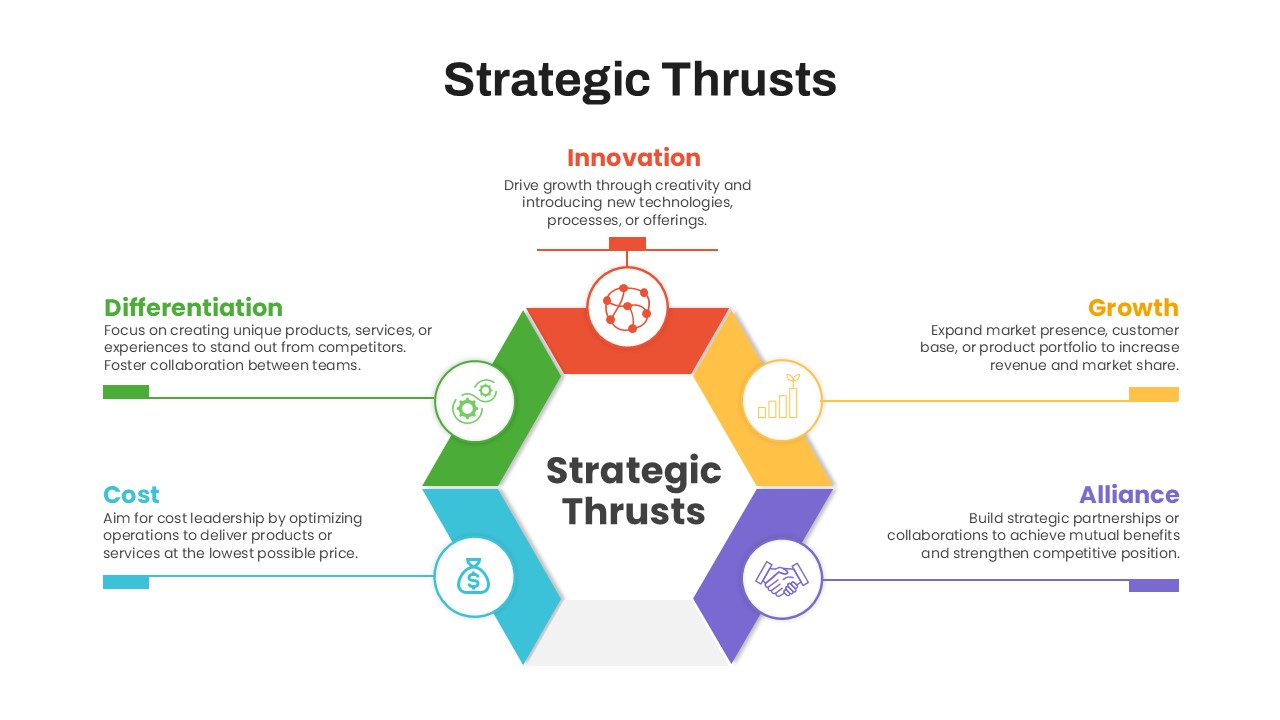
Six-Step Strategic Thrusts Diagram Slide Template for PowerPoint & Google Slides
Process
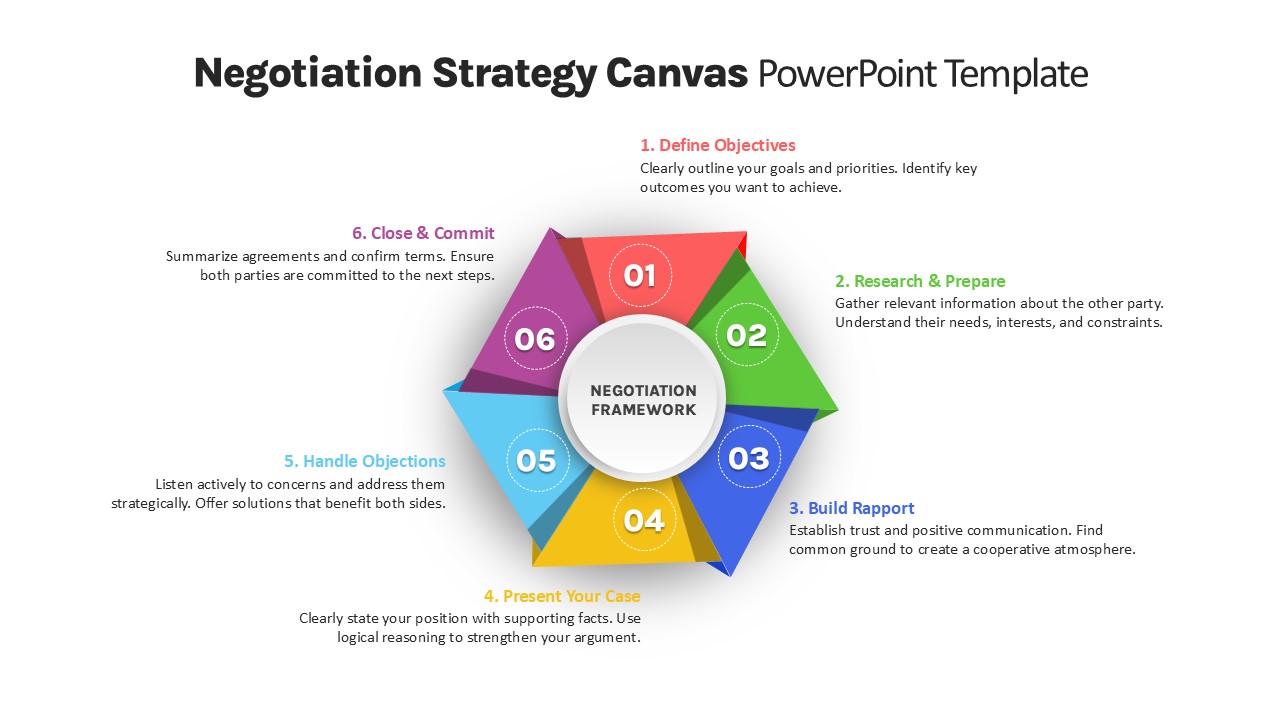
Six-Step Negotiation Strategy Canvas Template for PowerPoint & Google Slides
Process
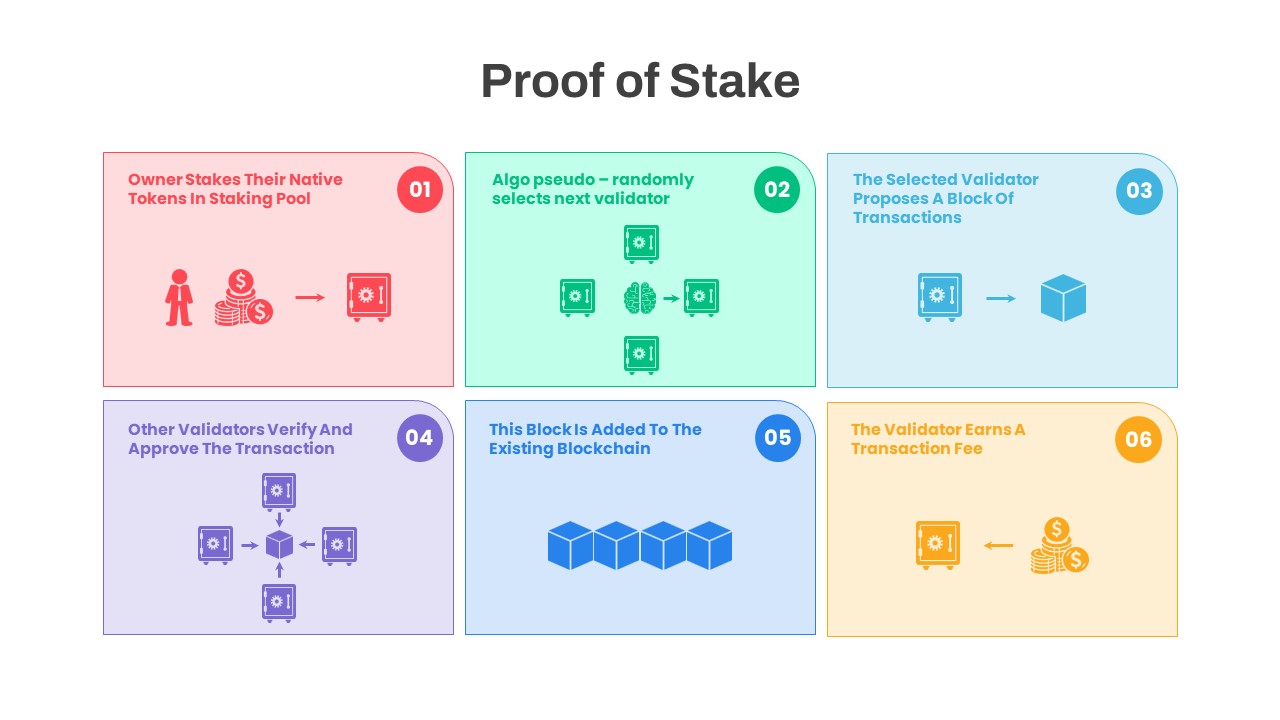
Proof of Stake Six-Step Consensus Template for PowerPoint & Google Slides
Machine Learning
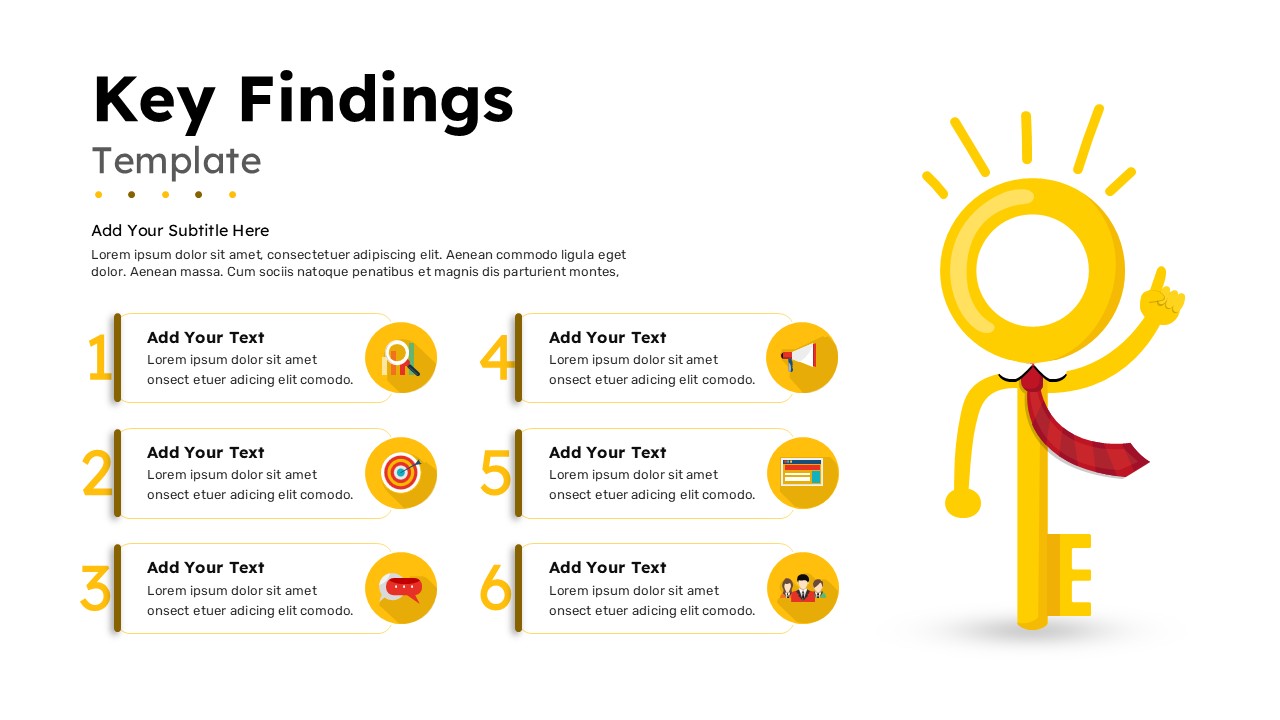
Key Findings Six-Step Diagram Template for PowerPoint & Google Slides
Business Report
Six Step Project Workflow Template for PowerPoint & Google Slides
Project
Five and Six Step Line Linear Stage Diagram for PowerPoint & Google Slides
Infographics
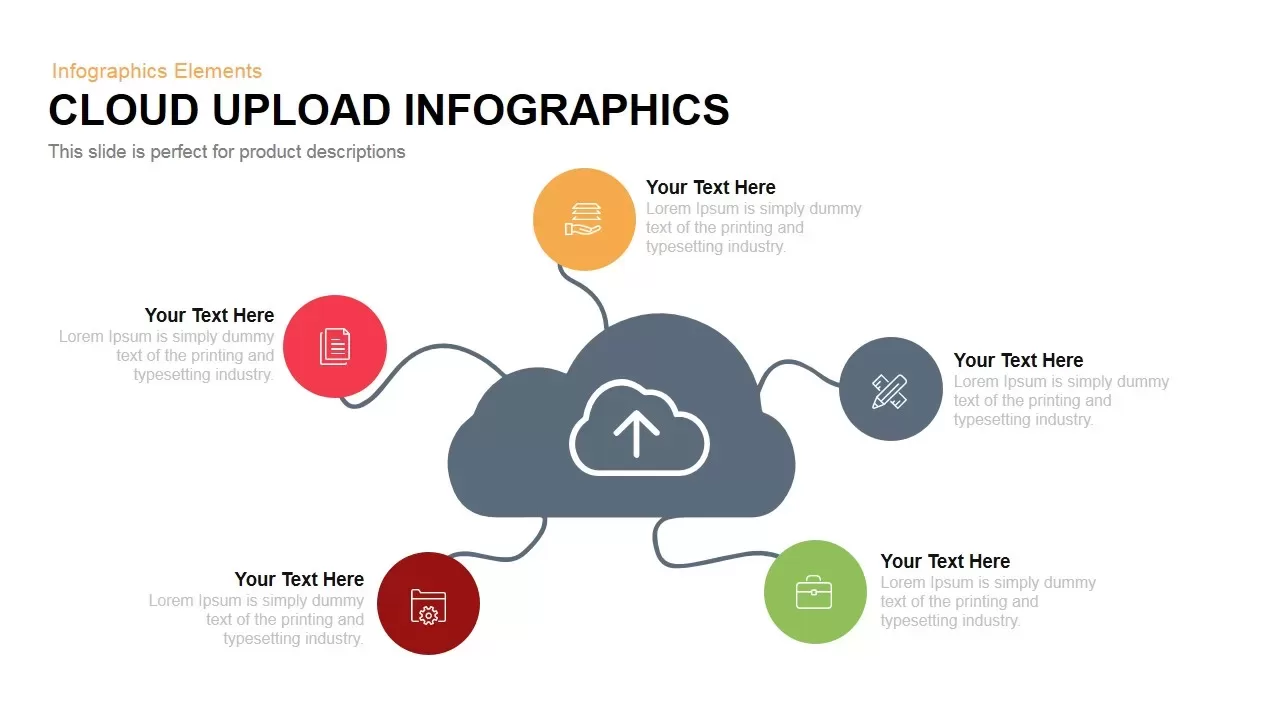
Cloud Upload Hub-and-Spoke Infographic Template for PowerPoint & Google Slides
Circular
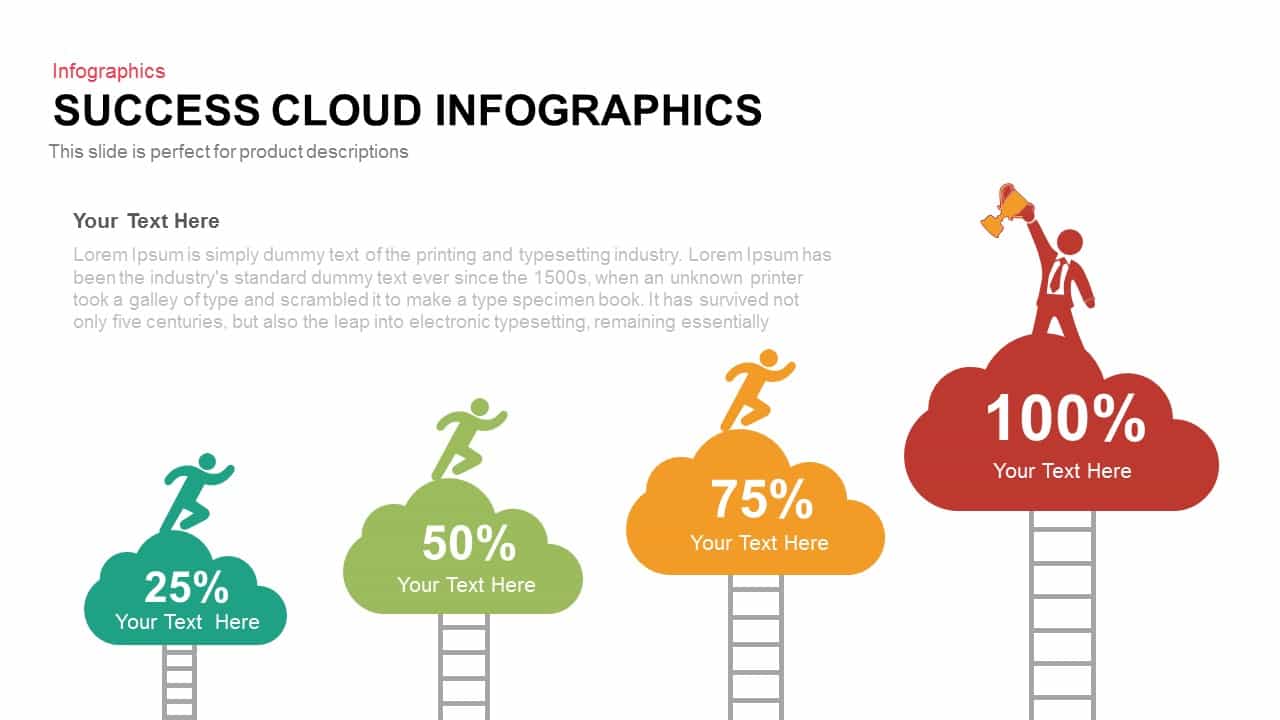
Success Cloud Progress Infographics Template for PowerPoint & Google Slides
Charts
Minimalist Cloud Illustration Slide Template for PowerPoint & Google Slides
Infographics
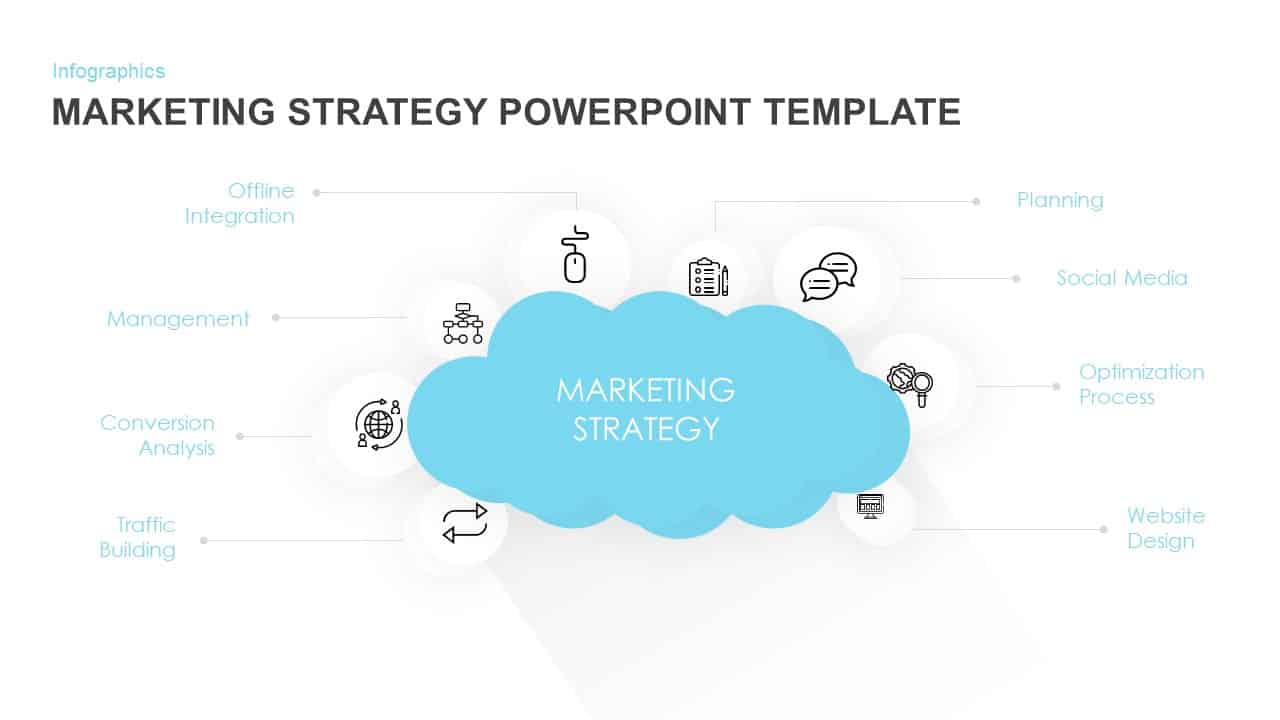
Marketing Strategy Cloud Diagram Template for PowerPoint & Google Slides
Digital Marketing
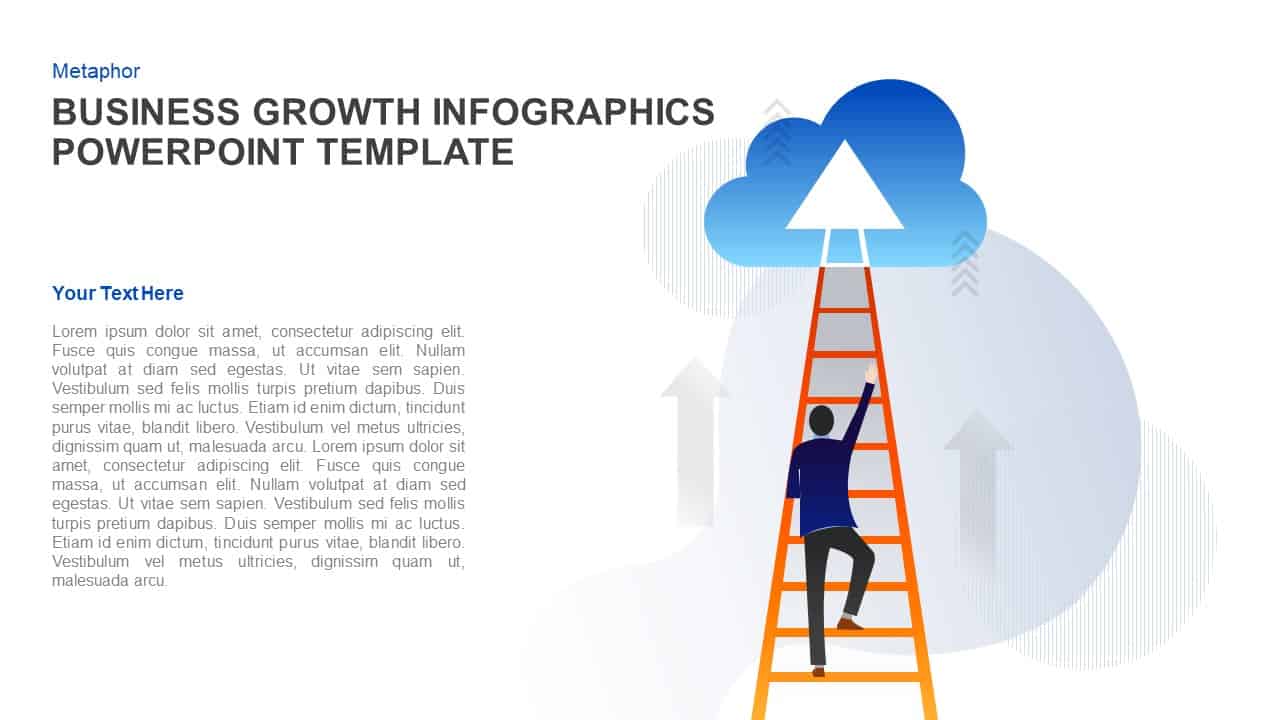
Business Growth Ladder to Cloud Metaphor Template for PowerPoint & Google Slides
Vision and Mission
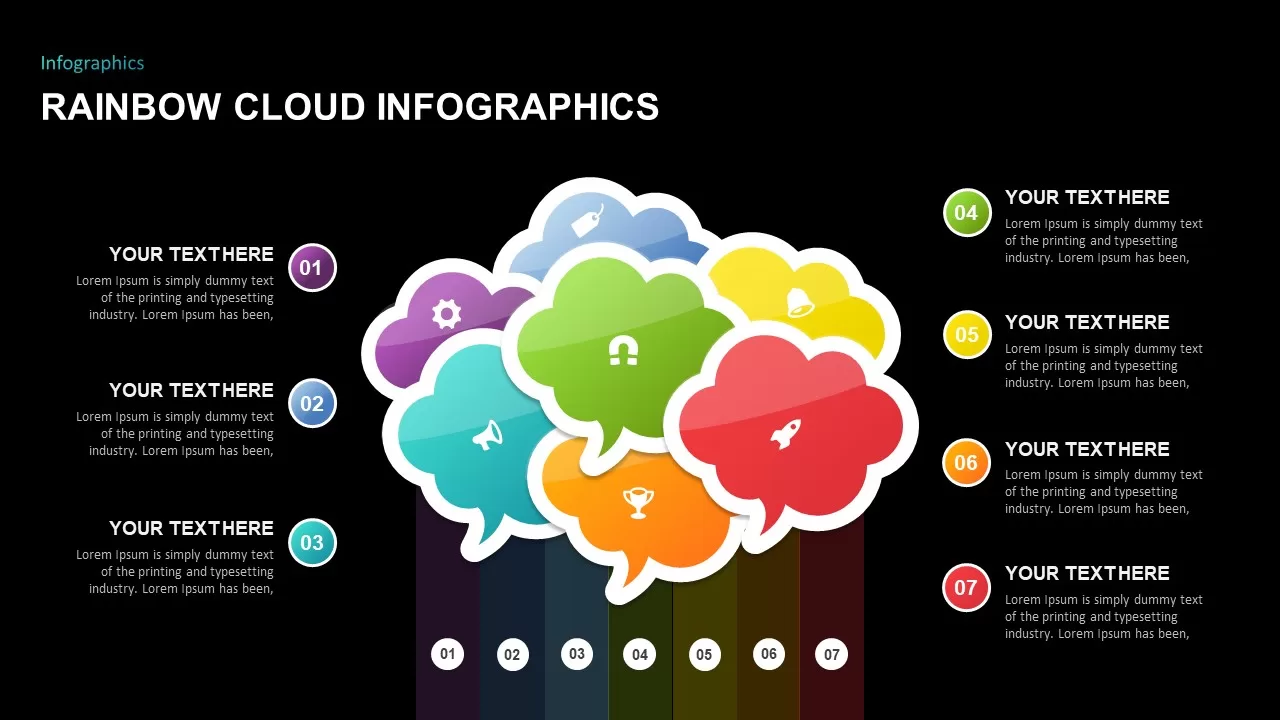
Rainbow Cloud Infographics Diagram Template for PowerPoint & Google Slides
Process
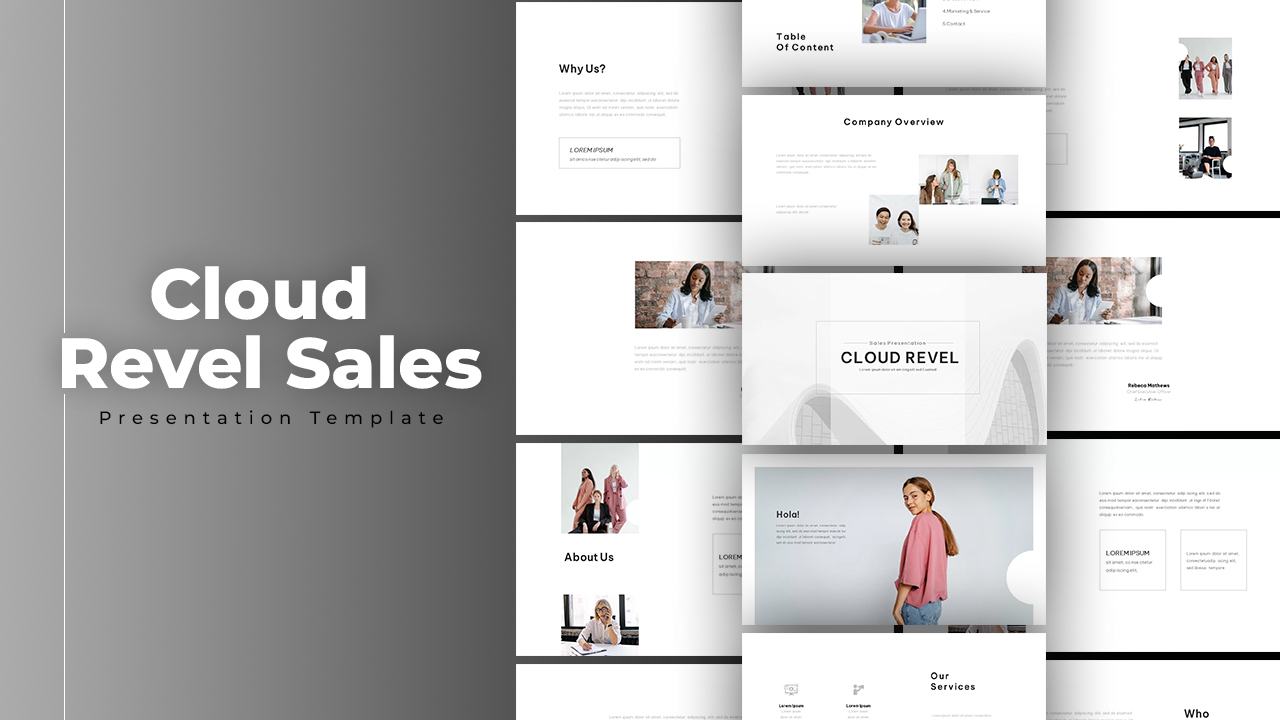
Cloud Revel Sales Presentation Template for PowerPoint & Google Slides
Marketing
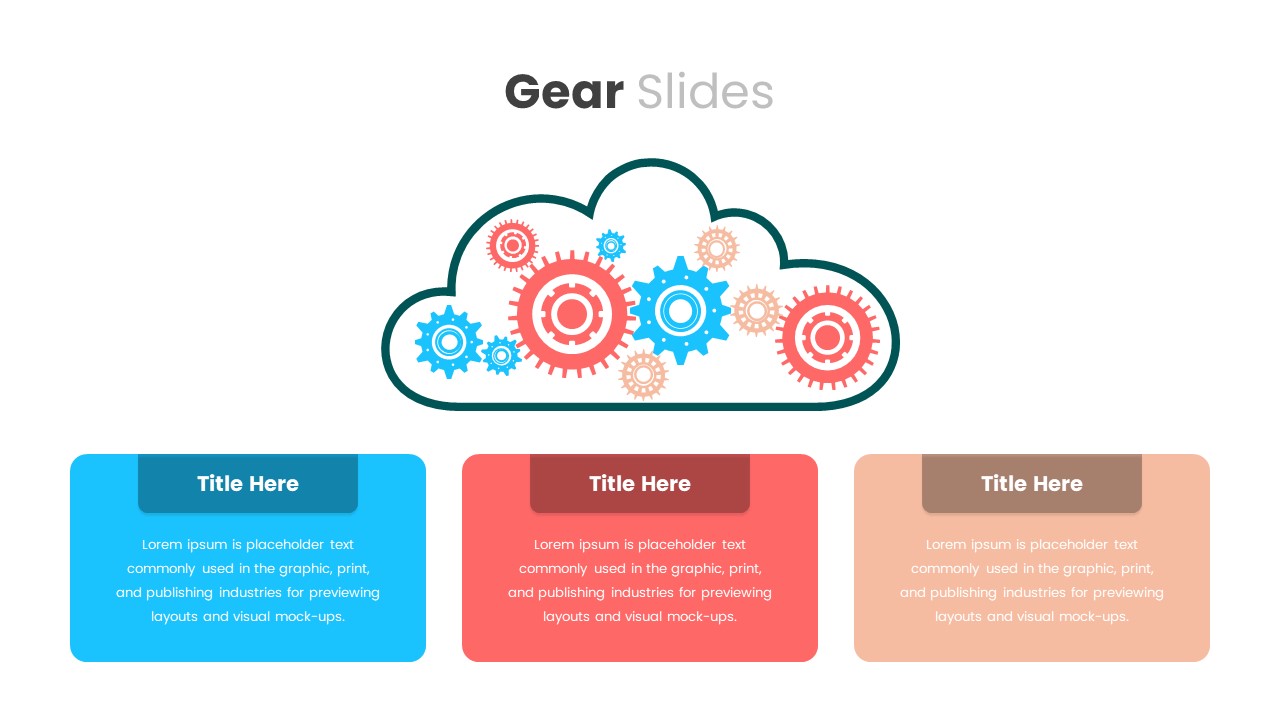
Cloud Gear Automation Diagram Template for PowerPoint & Google Slides
Cloud Computing
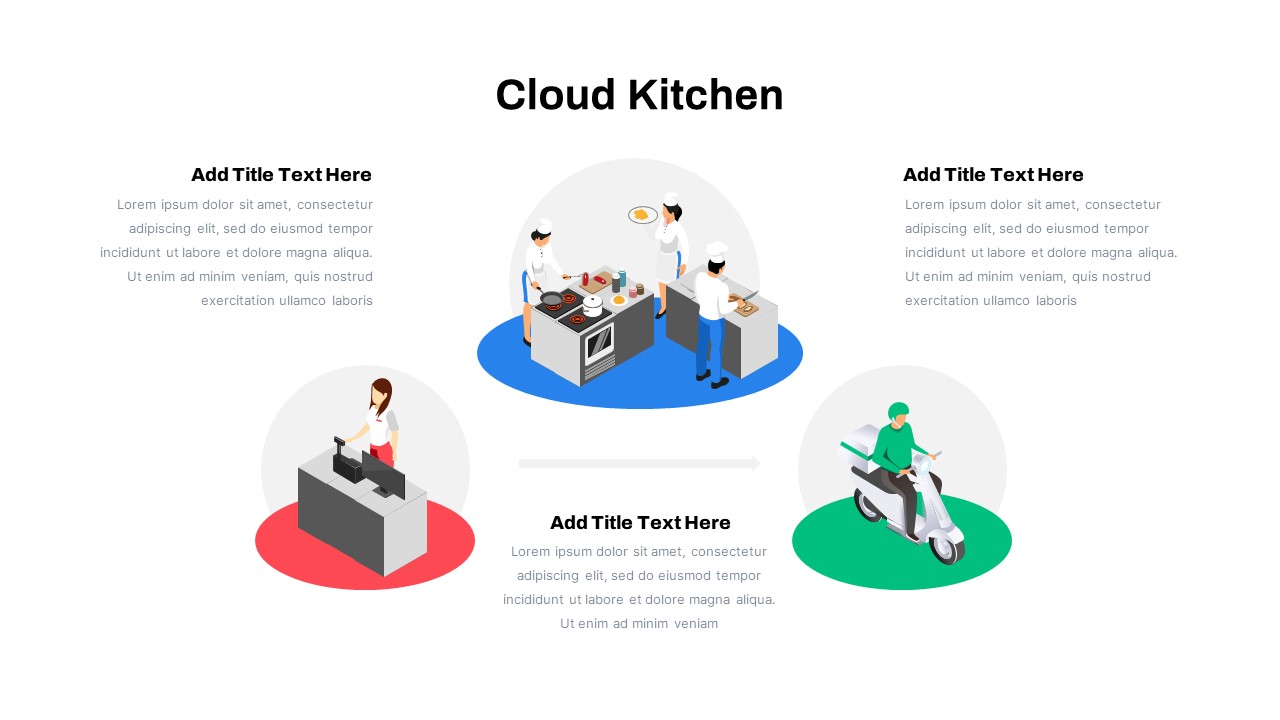
Cloud Kitchen Business Process Diagram Template for PowerPoint & Google Slides
Process
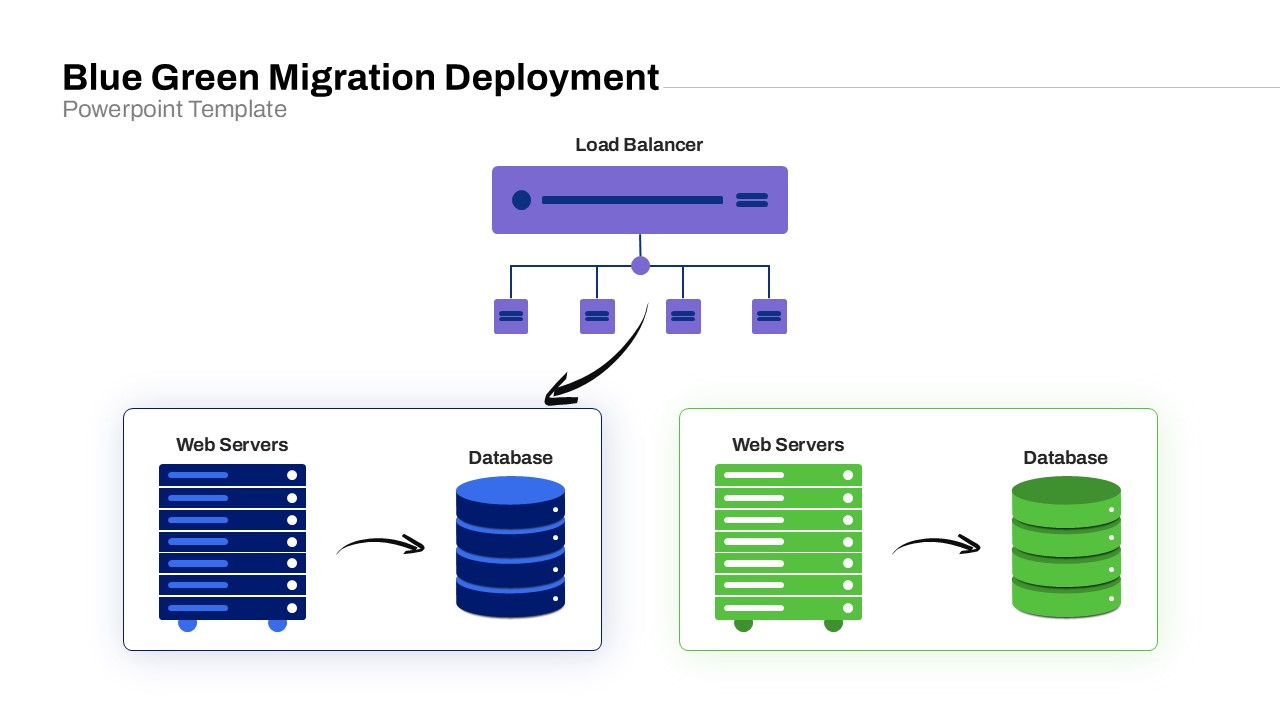
Blue-Green Cloud Deployment Diagram Template for PowerPoint & Google Slides
Cloud Computing
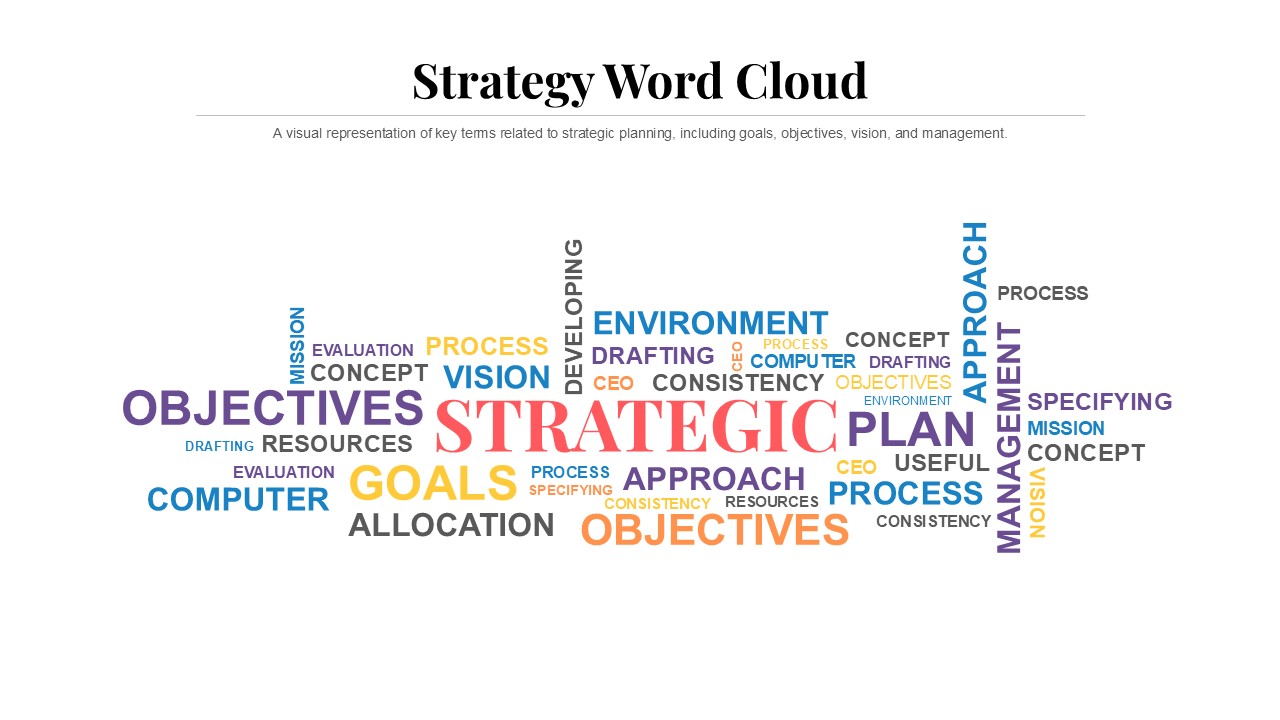
Strategy Word Cloud Infographic Template for PowerPoint & Google Slides
Infographics
Free
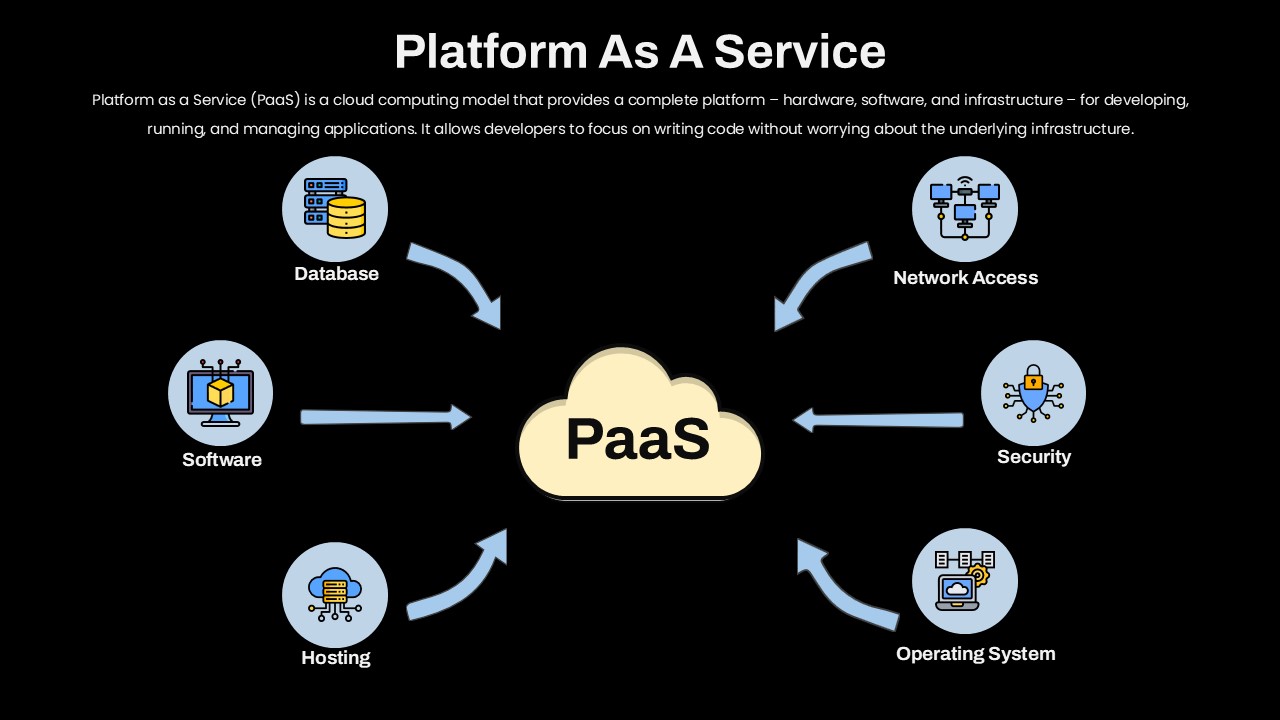
Platform as a Service Cloud Diagram Template for PowerPoint & Google Slides
Cloud Computing
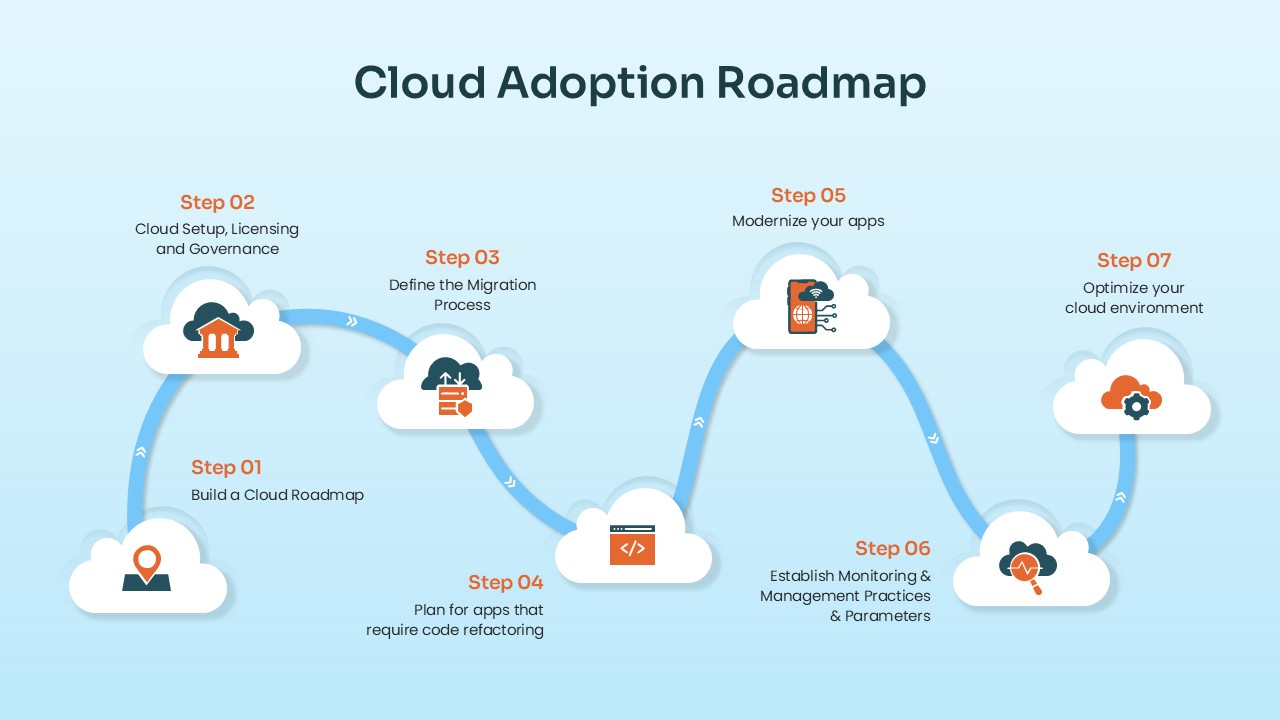
Cloud Adoption Roadmap Steps template for PowerPoint & Google Slides
Cloud Computing
Data Protection & Encryption in the Cloud Overview template for PowerPoint & Google Slides
Cloud Computing
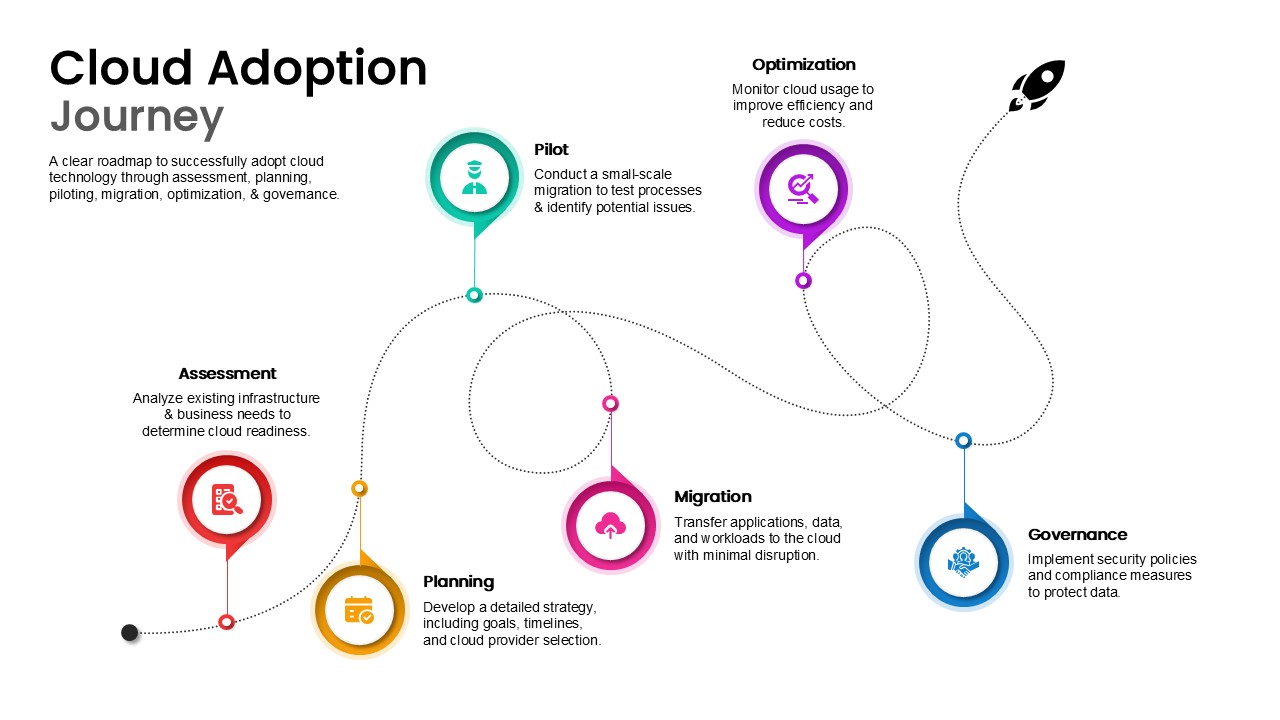
Cloud Adoption Journey Roadmap Template for PowerPoint & Google Slides
Cloud Computing
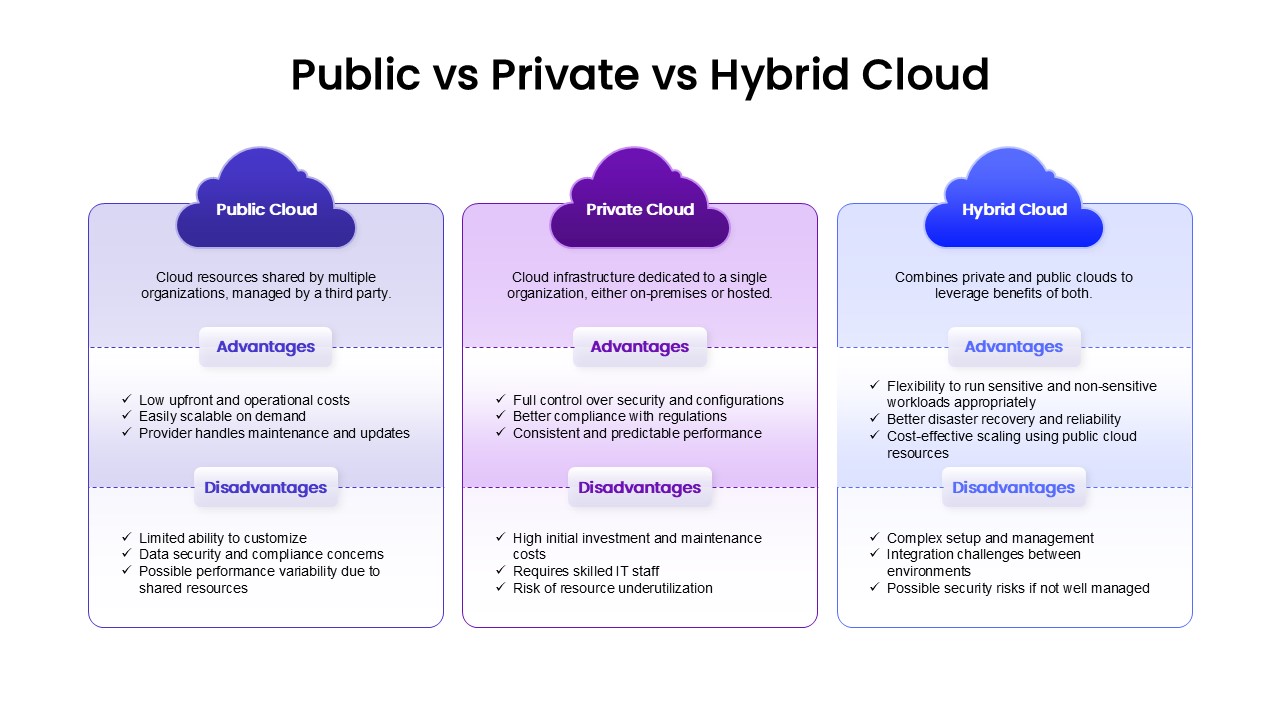
Public, Private & Hybrid Cloud Comparison Template for PowerPoint & Google Slides
Cloud Computing
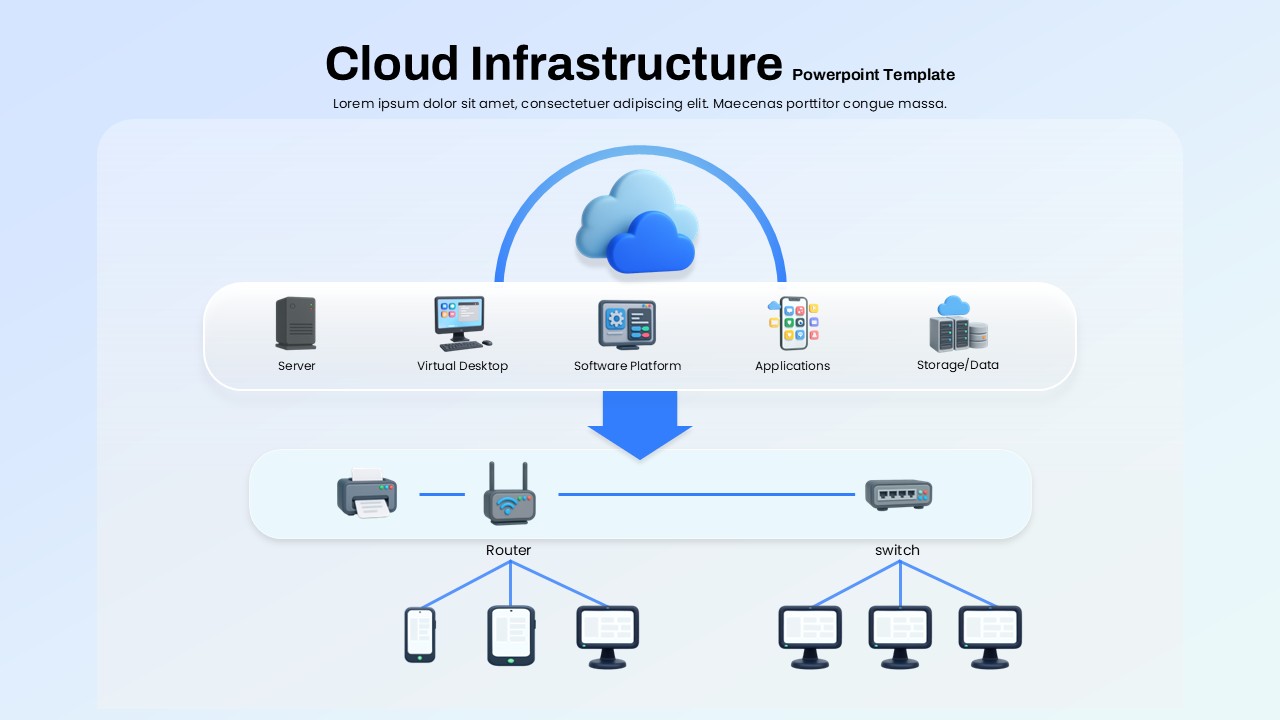
Cloud Infrastructure Overview template for PowerPoint & Google Slides
Information Technology
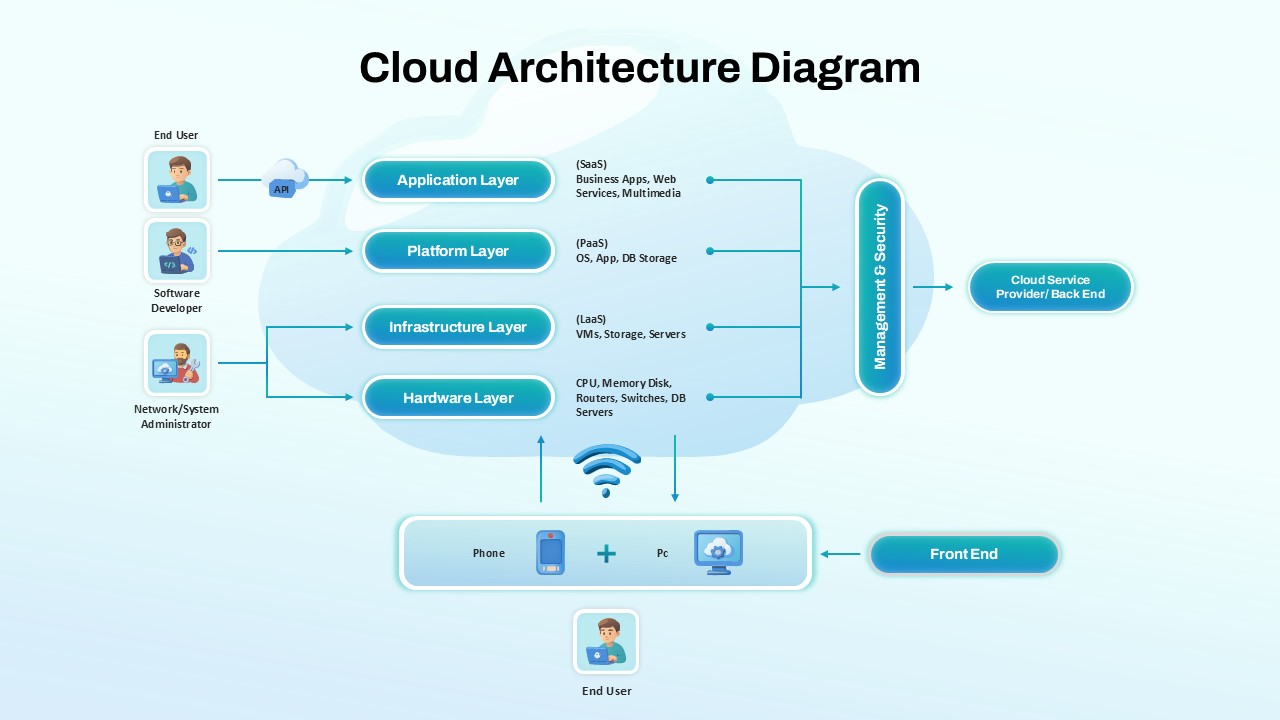
Cloud Architecture Diagram template for PowerPoint & Google Slides
Cloud Computing
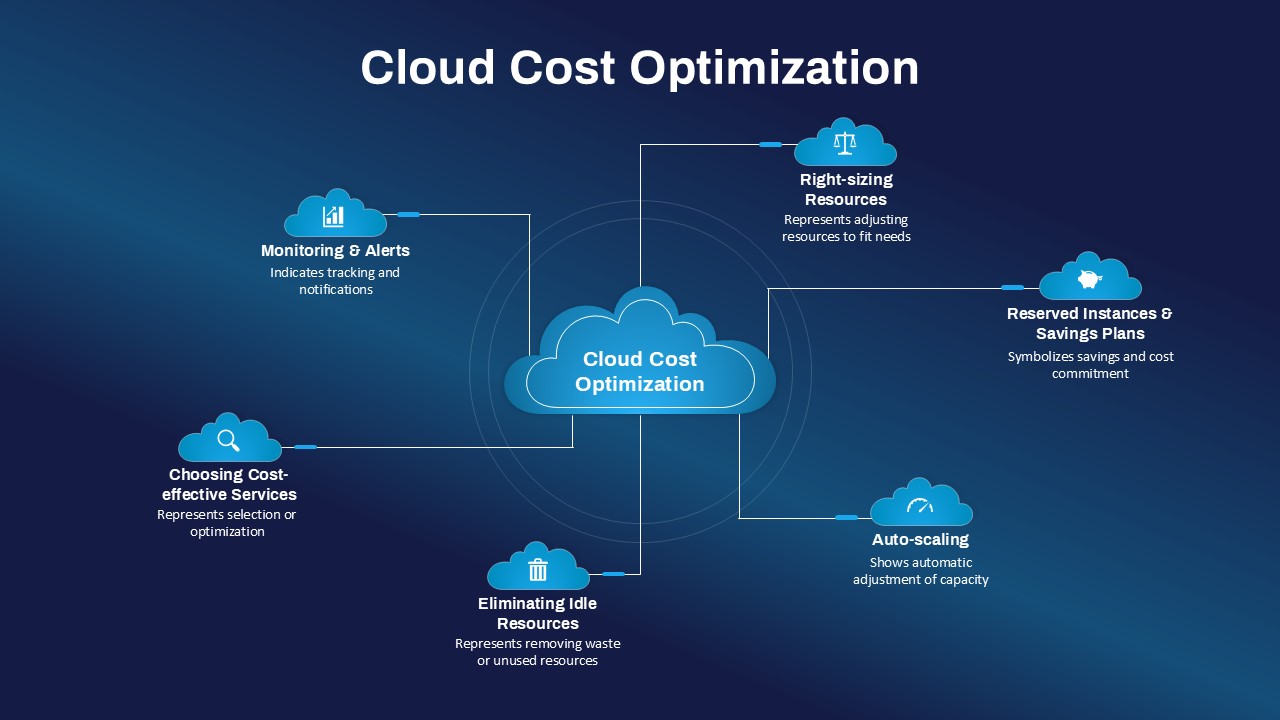
Cloud Cost Optimization Hub-and-Spoke Template for PowerPoint & Google Slides
Cloud Computing
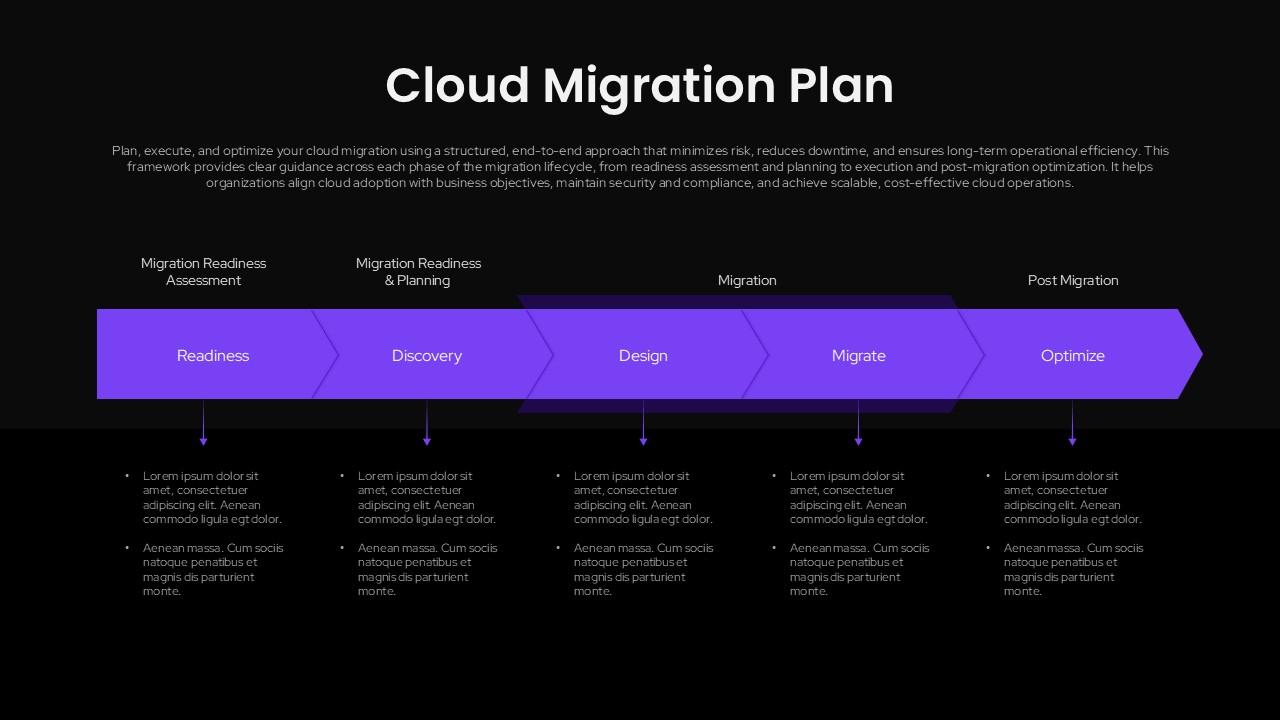
Cloud Migration Plan Chevron Process Template for PowerPoint & Google Slides
Cloud Computing
Free Six Stage Bubble Process Diagram template for PowerPoint & Google Slides
Process
Free
Free Six-Stage Arrow Process Diagram Template for PowerPoint & Google Slides
Process
Free
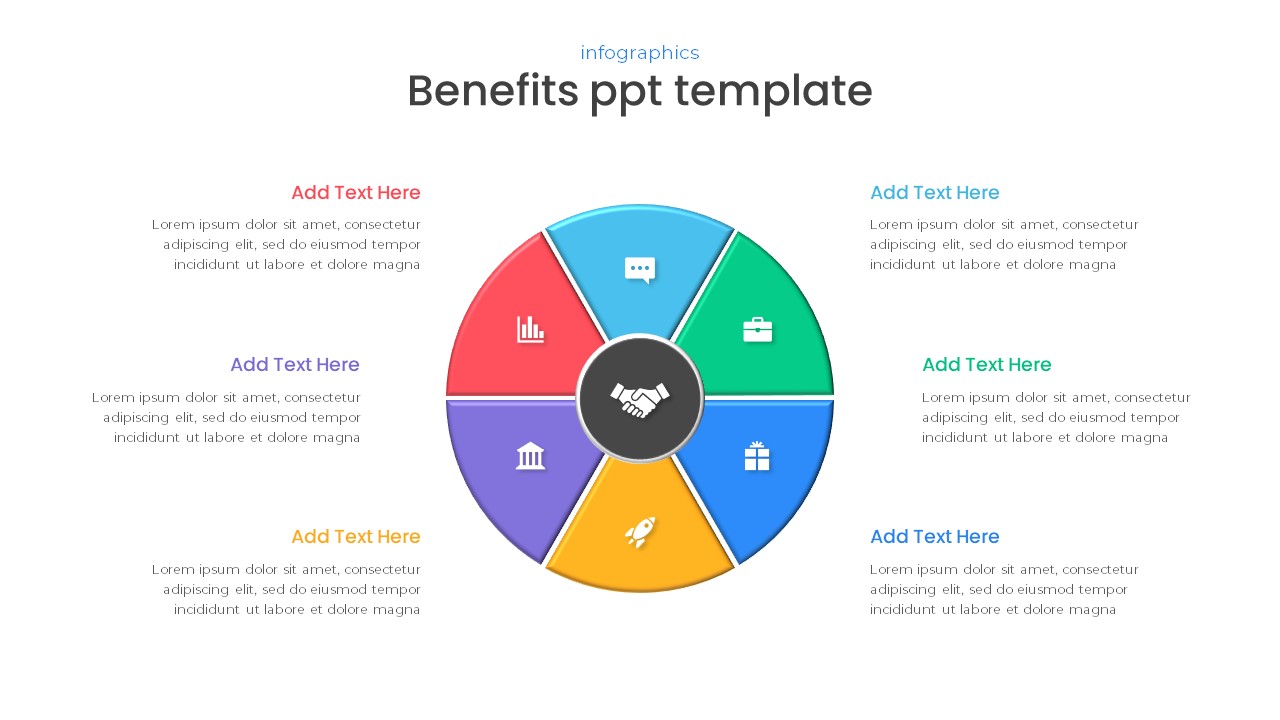
Free Six-Part Hub-and-Spoke Benefits Template for PowerPoint & Google Slides
Circular
Free
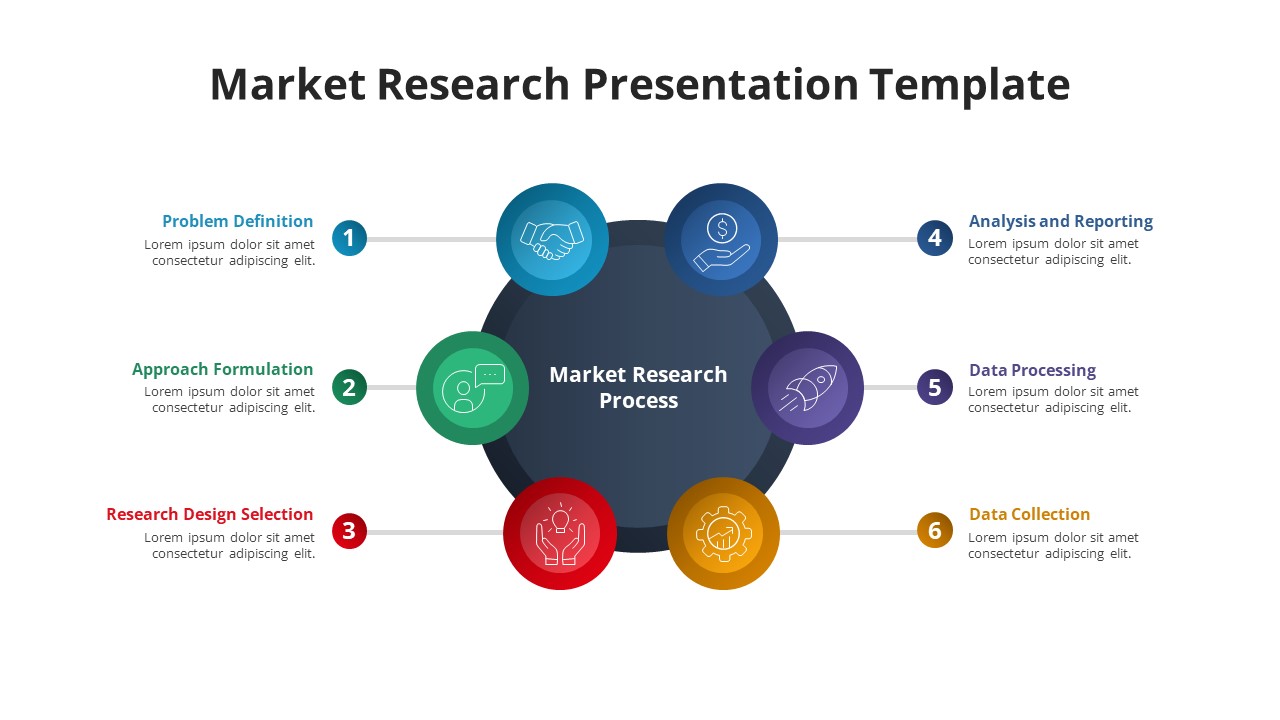
Free Six-Phase Market Research Process Template for PowerPoint & Google Slides
Process
Free
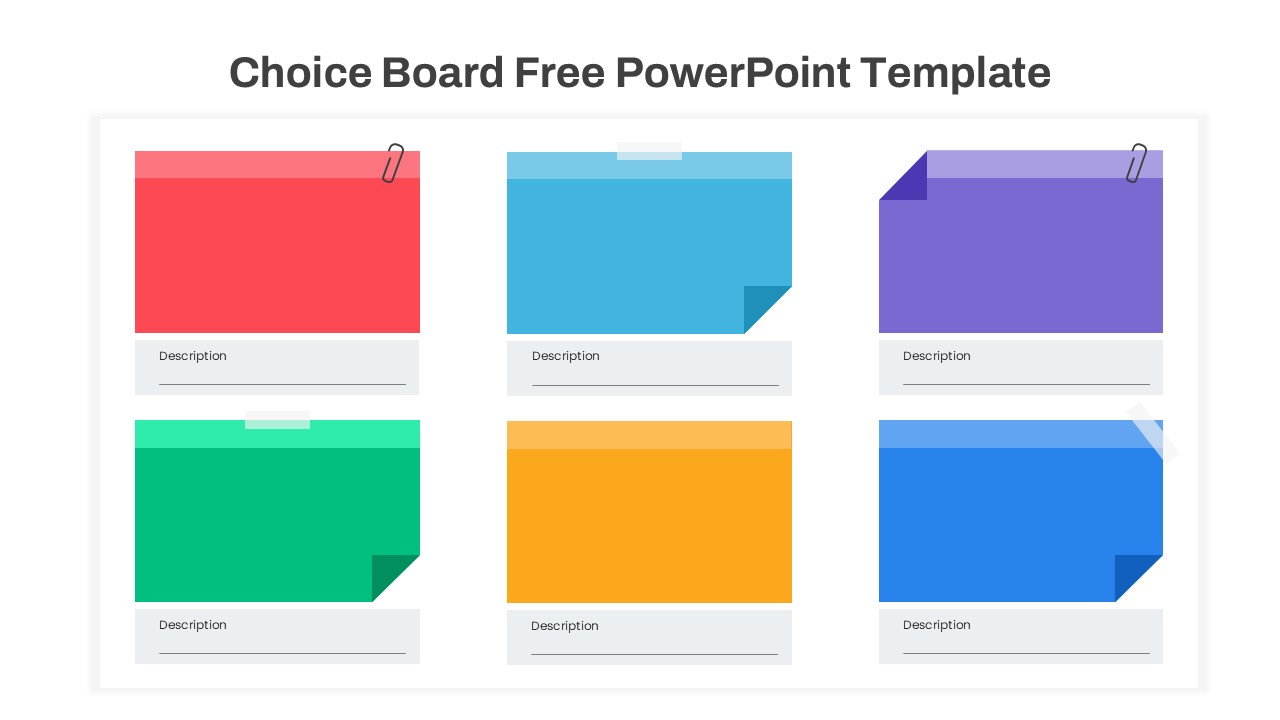
Free Choice Board Six-Option Layout Template for PowerPoint & Google Slides
Comparison
Free
Eight-Step Circular Diagram Infographic Template for PowerPoint & Google Slides
Circular
Five-Step Circular Process Diagram Template for PowerPoint & Google Slides
Circular
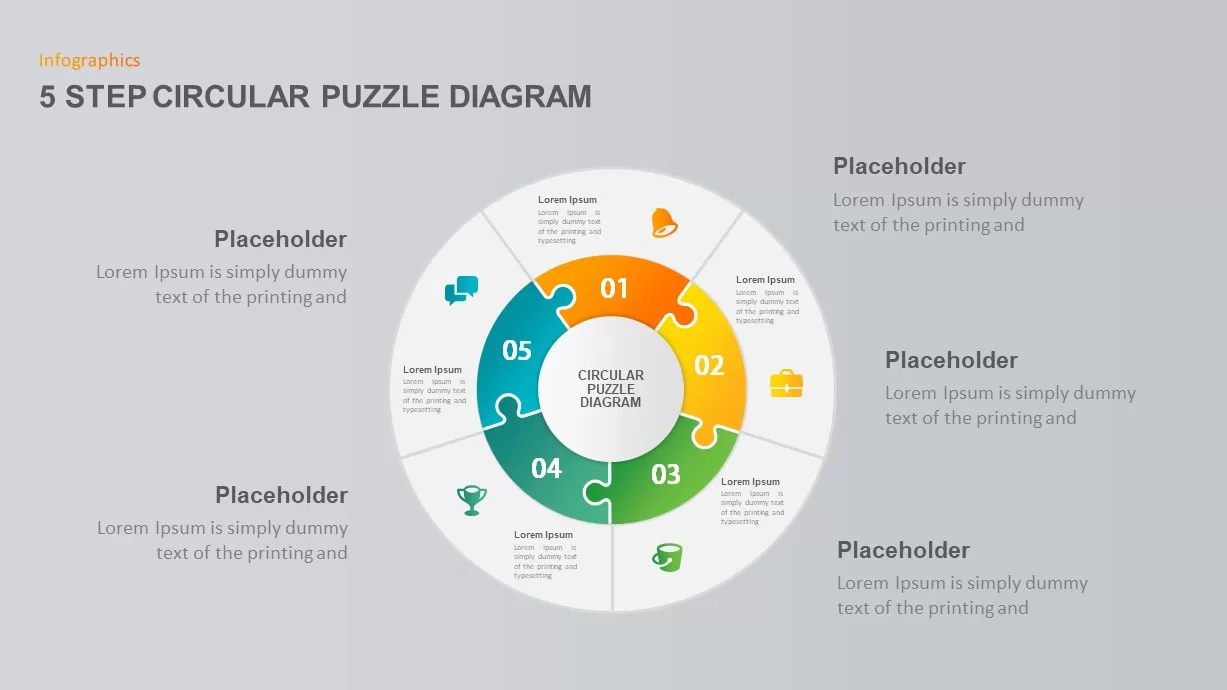
5-Step Circular Puzzle Diagram Template for PowerPoint & Google Slides
Circular
Ten Step Circular Process Infographic Template for PowerPoint & Google Slides
Process
Modern 11-Step Circular Timeline Template for PowerPoint & Google Slides
Timeline