Four-Segment Flywheel Infographic Model Template for PowerPoint & Google Slides

Description
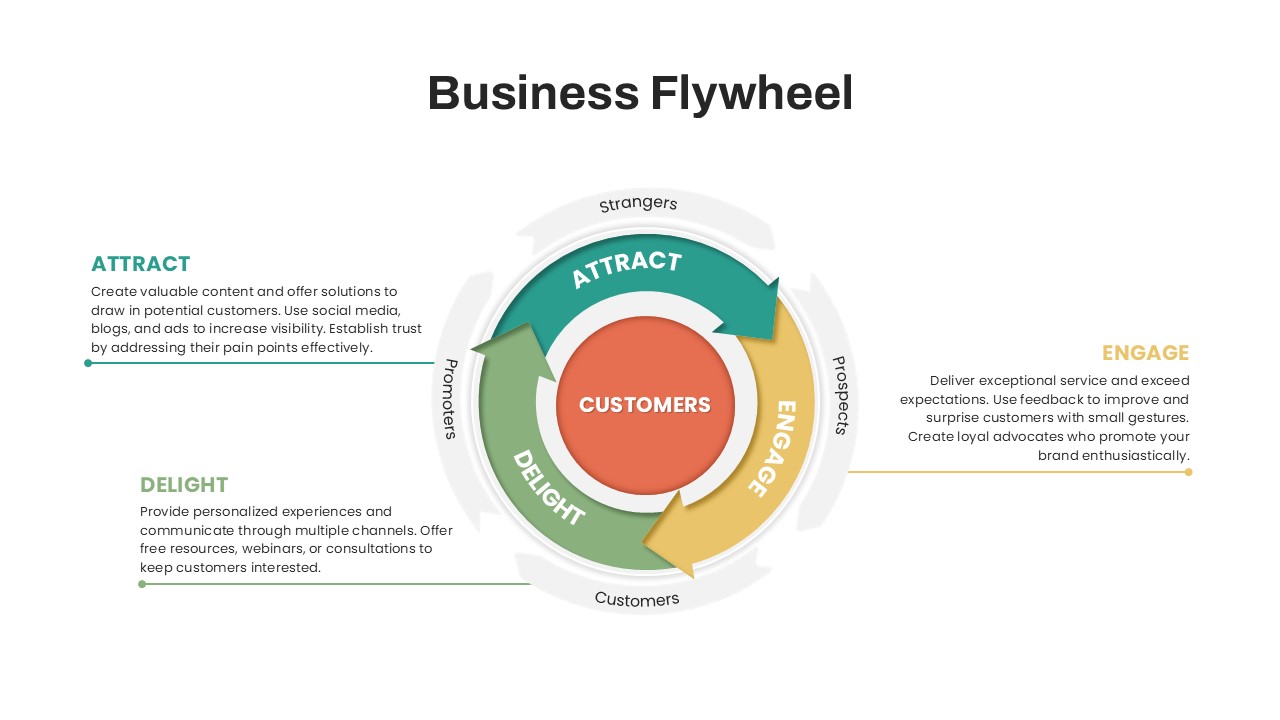
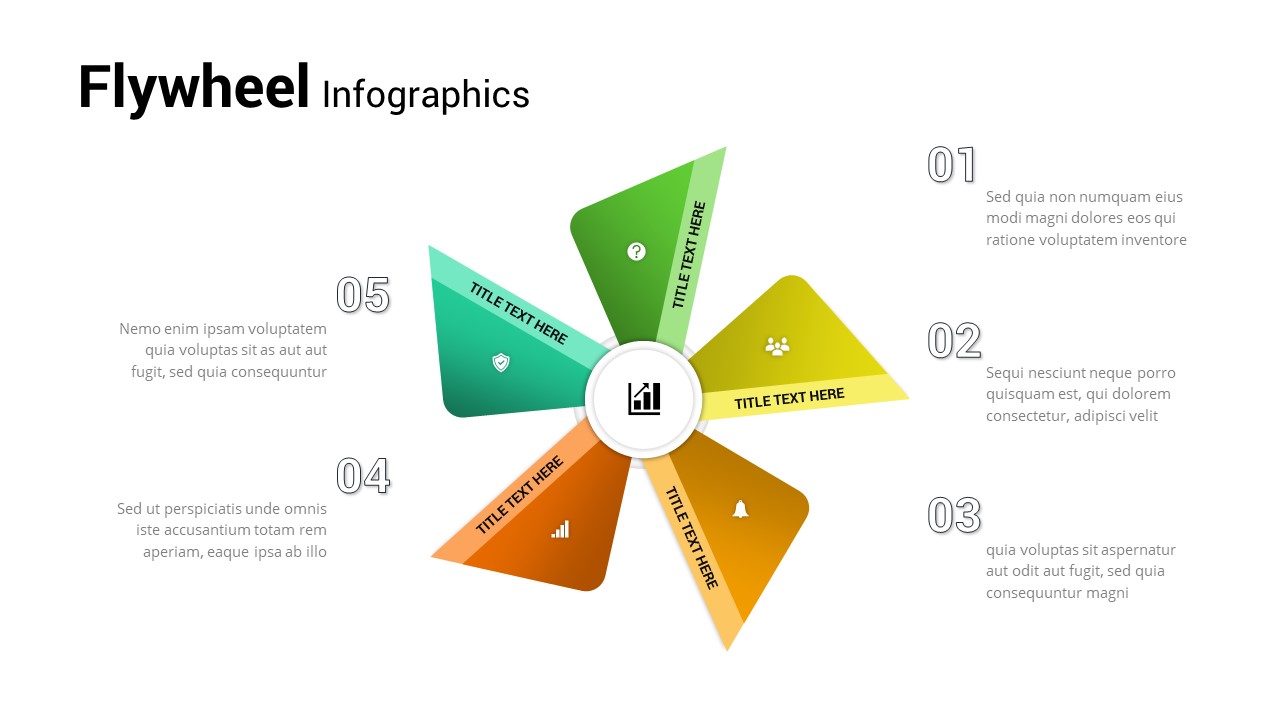
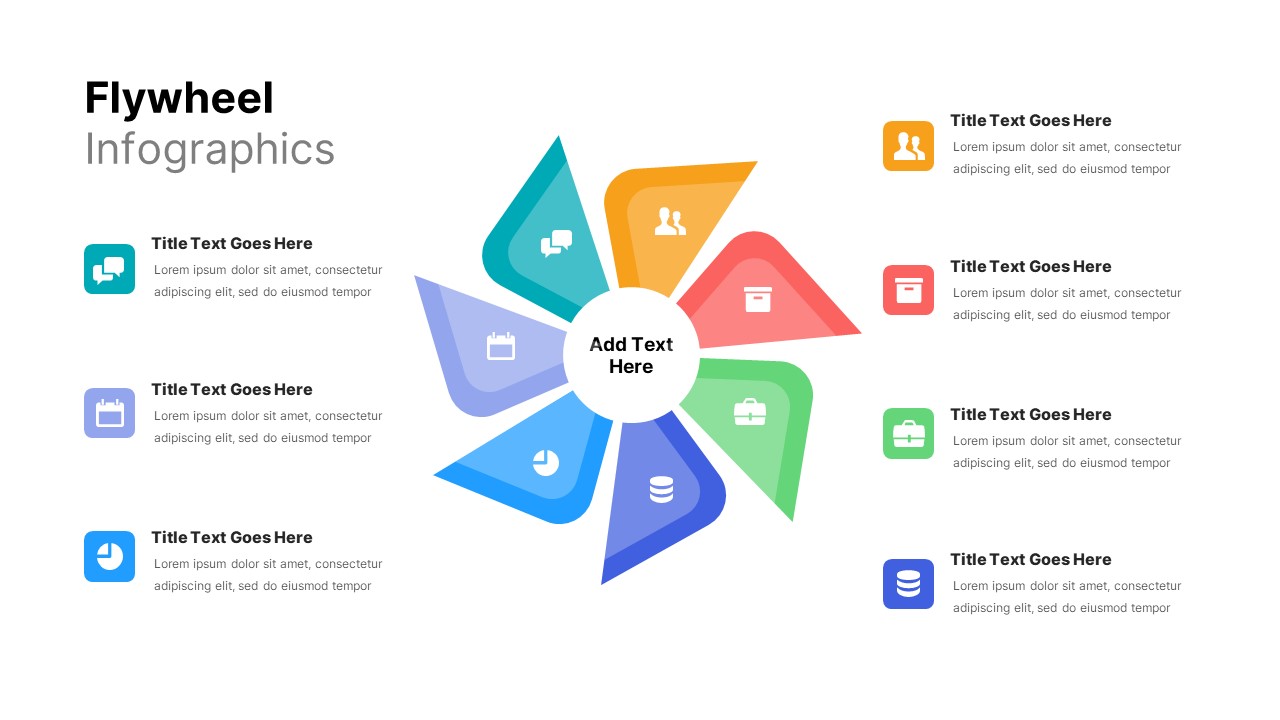
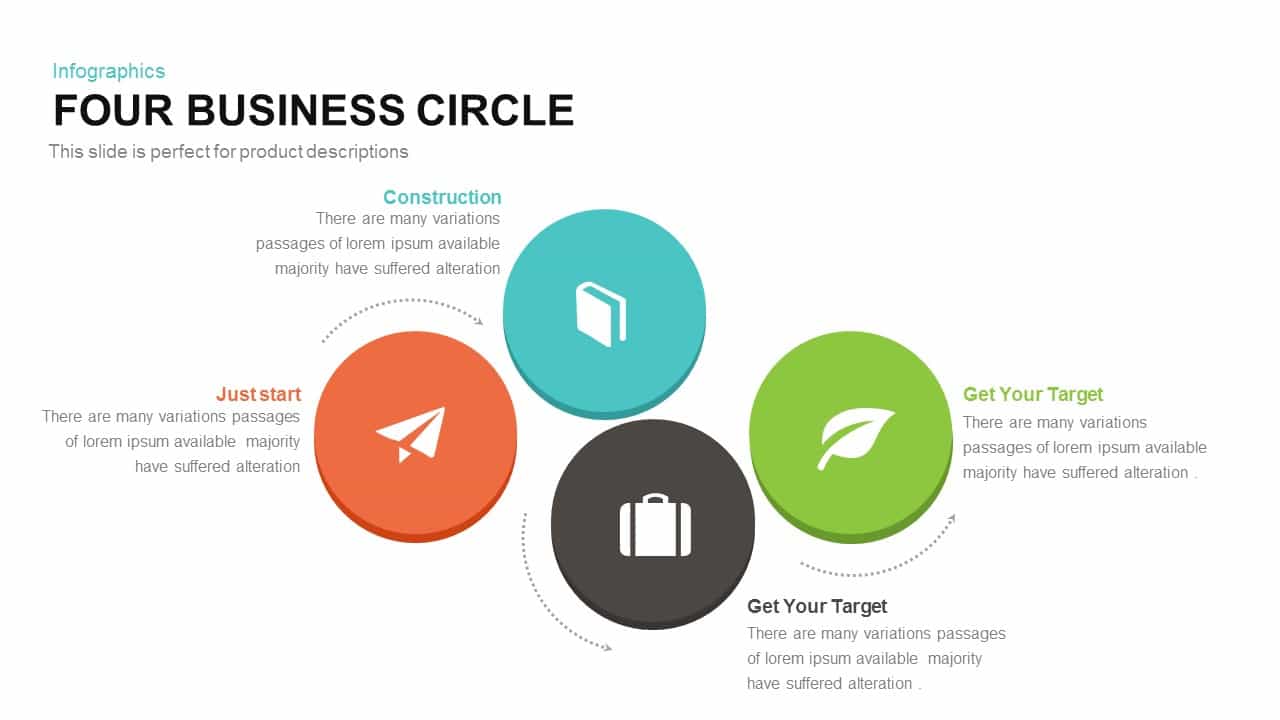
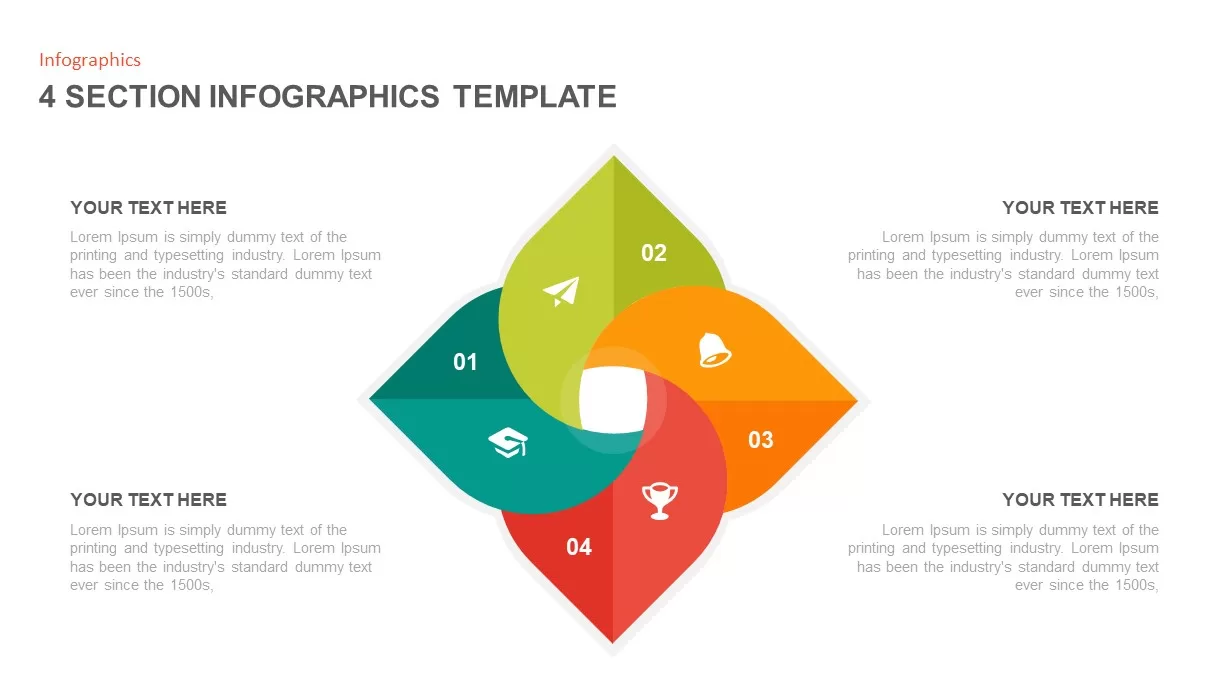
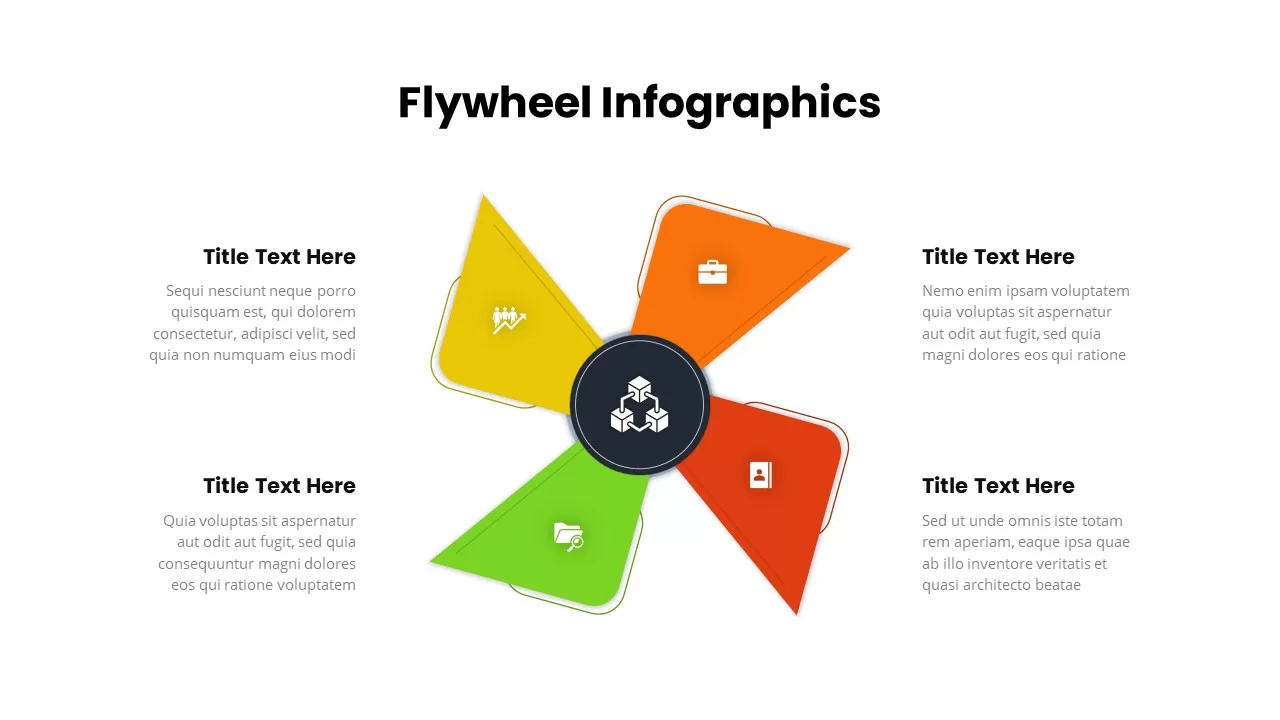
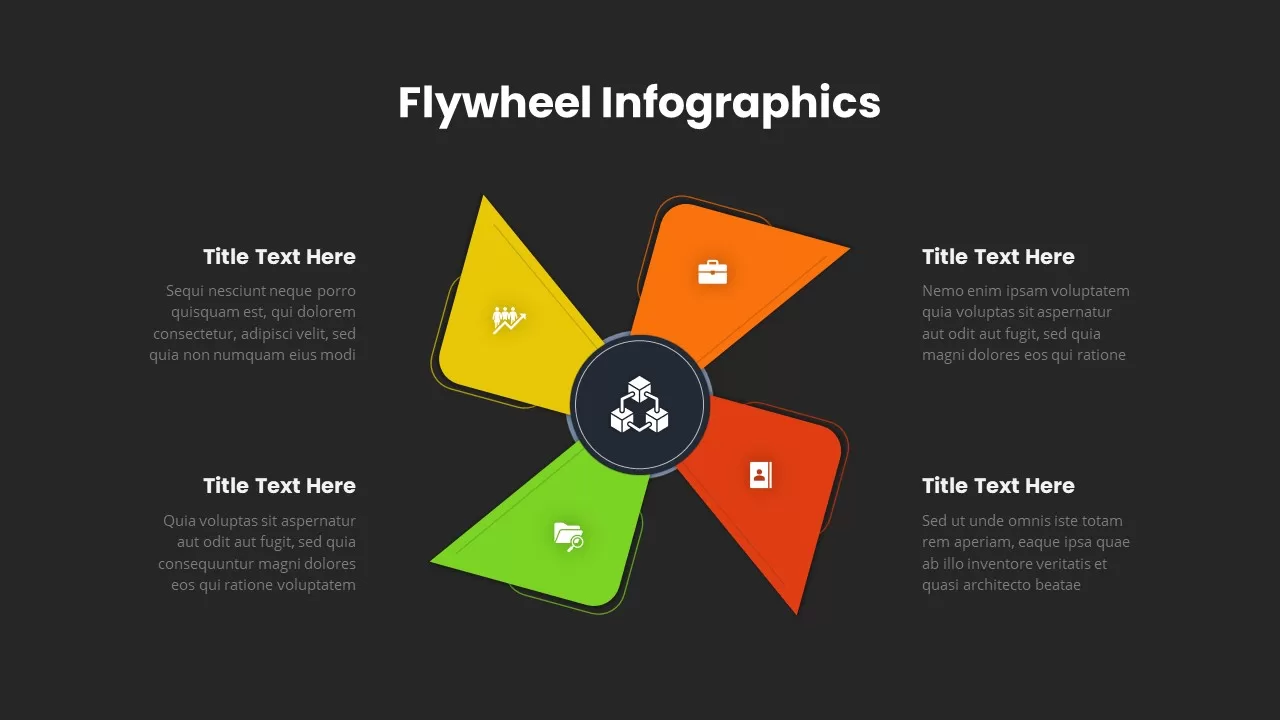
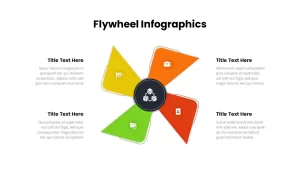
Leverage this dynamic four-segment flywheel infographic slide to visualize cyclical processes, growth loops, or feedback mechanisms with clarity and impact. The centerpiece features a bold dark circle housing an icon placeholder, surrounded by four vibrant petals in yellow, orange, red, and green. Each triangular segment includes its own icon area and connects to adjacent explanatory text blocks, enabling you to highlight distinct phases—such as acquisition, engagement, conversion, and retention—in a seamless circular flow. Crisp white background, modern typography, and subtle drop shadows ensure maximum readability and a polished professional aesthetic.
All graphics are fully vector-based and easily editable in both PowerPoint and Google Slides. Swap segment colors, replace icons, adjust petal shapes, or update label text without losing resolution. Master-slide compatibility guarantees consistent styling across your deck, while intuitive placeholders streamline content insertion and minimize formatting errors. Whether you need to emphasize quarterly performance loops, customer journey cycles, or operational workflows, this slide adapts effortlessly to your content requirements and brand guidelines.
Engineered for efficiency, the layout reduces design bottlenecks and mitigates version-control issues by consolidating process visuals into a single, reusable asset. Duplicate segments to expand your cycle, reposition text boxes to fit varying screen sizes, or integrate your corporate palette in seconds. This ready-to-use flywheel model empowers teams to present complex, iterative concepts in an accessible format that resonates with stakeholders and keeps audiences engaged.
Beyond core business applications, repurpose this infographic for marketing funnels, product development lifecycles, risk assessment loops, or project management cycles. The four-segment structure also supports training modules, sprint retrospectives, and KPI monitoring dashboards—providing a versatile visual tool for any recurring process narrative.
Who is it for
Project managers, marketing leaders, and product teams will benefit from this slide when illustrating growth loops, customer journeys, or iterative workflows to align stakeholders during strategy meetings or performance reviews.
Other Uses
Use this slide to depict marketing funnels, product development cycles, risk assessment loops, or agile sprint retrospectives. Swap icons and labels to adapt the flywheel for training modules, KPI dashboards, or internal communications—ensuring versatile application across departments and industries.
Login to download this file

Item ID
SB03158
Related Templates

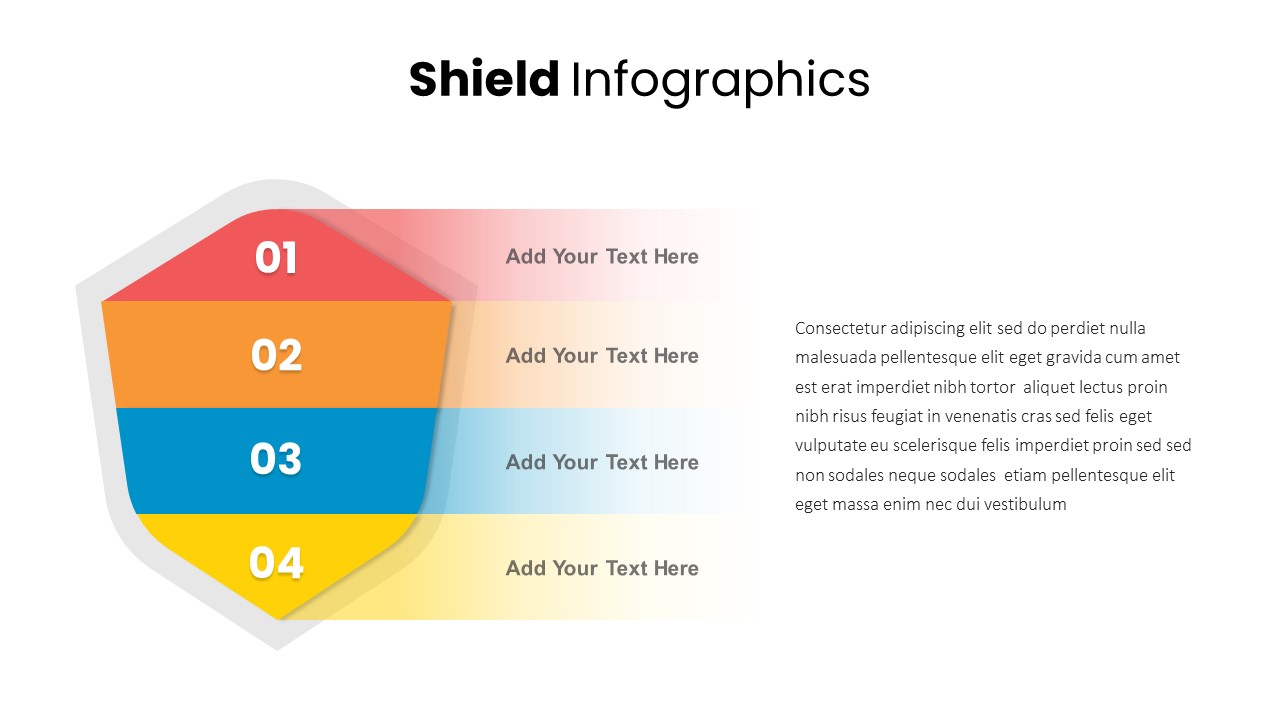
Shield Four-Segment Infographic Template for PowerPoint & Google Slides
Process
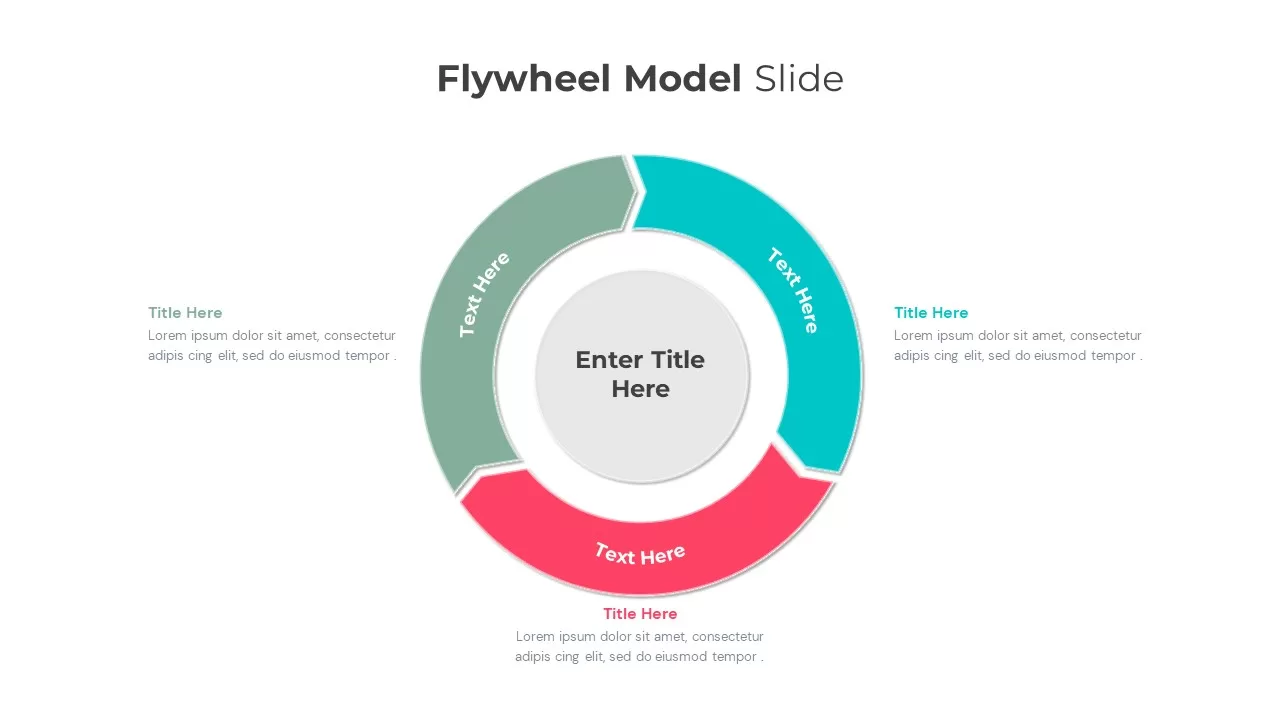
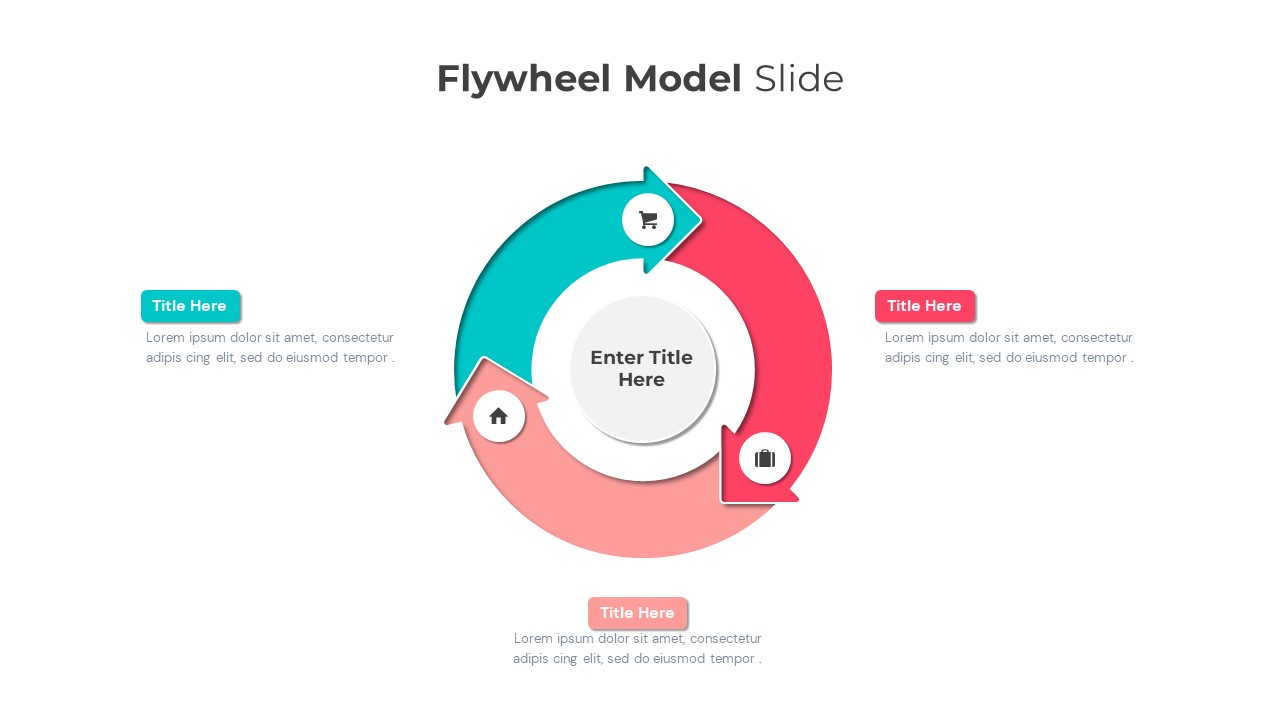
Flywheel Model Infographic Template for PowerPoint & Google Slides
Process

Pie Segment Diagram Four-Step Process Template for PowerPoint & Google Slides
Pie/Donut
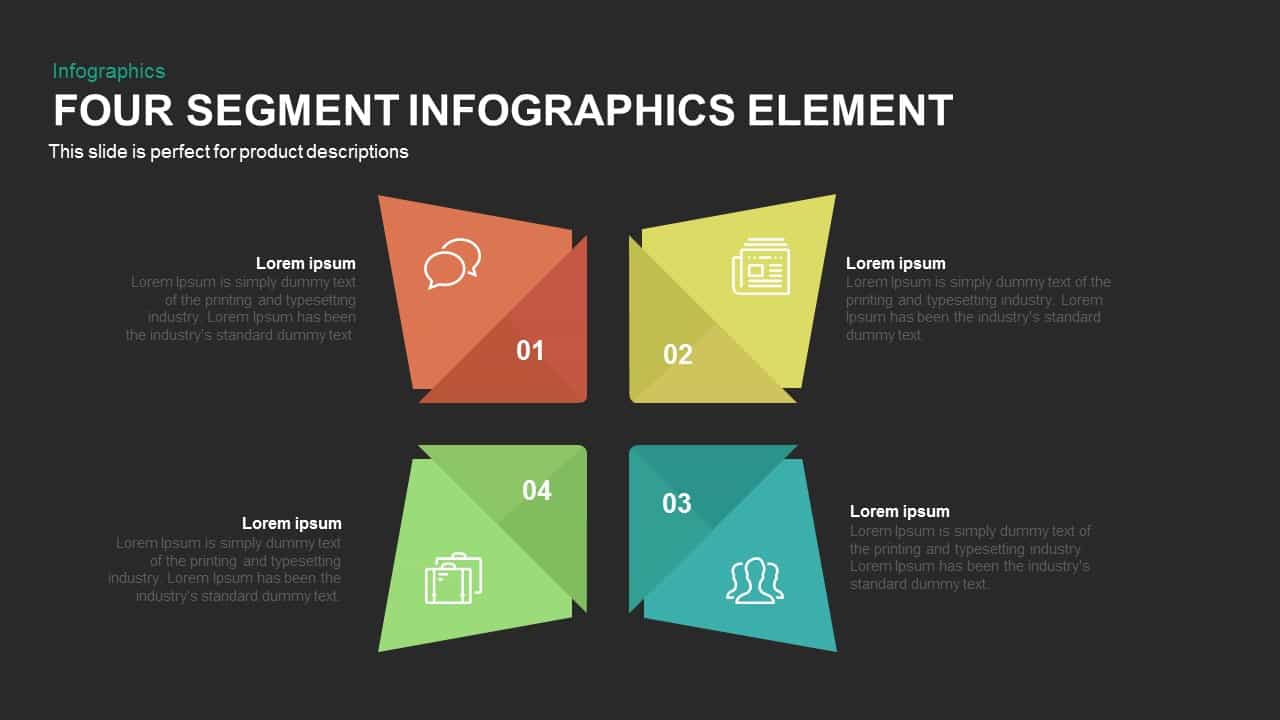
Four Segment Infographics Element Template for PowerPoint & Google Slides
Comparison
Four-Segment Circular Arrow Cycle Template for PowerPoint & Google Slides
Circular
Colorful Four-Segment Wheel Chart Template for PowerPoint & Google Slides
Circular
Business Flywheel Lifecycle Model Template for PowerPoint & Google Slides
Circular
Five-Step Flywheel Infographic Diagram Template for PowerPoint & Google Slides
Process
Circle Segment Sales Metrics Infographic Template for PowerPoint & Google Slides
Circular
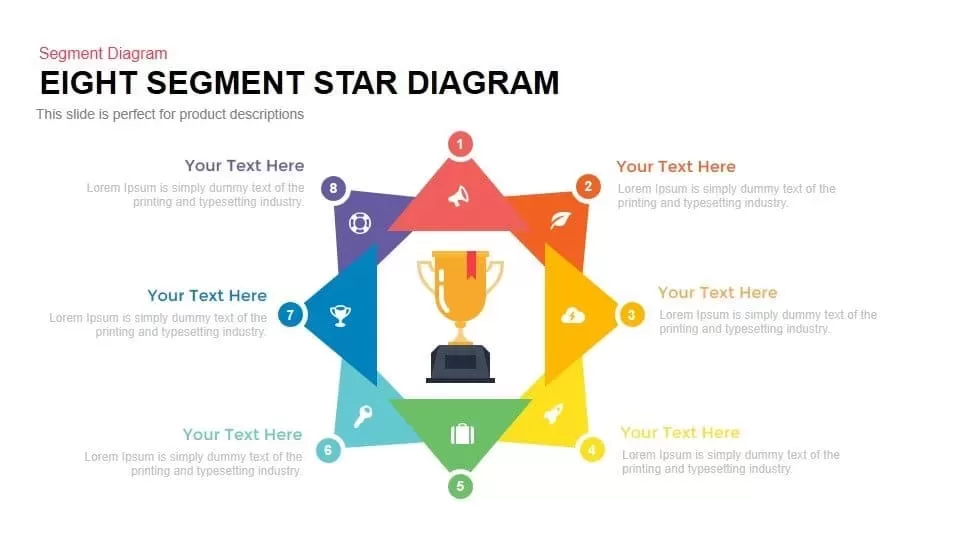
Eight Segment Star Diagram Infographic Template for PowerPoint & Google Slides
Process
Six-Segment Circular Hub Infographic Template for PowerPoint & Google Slides
Circular
Six-Segment Circular Arrow Infographic Template for PowerPoint & Google Slides
Circular
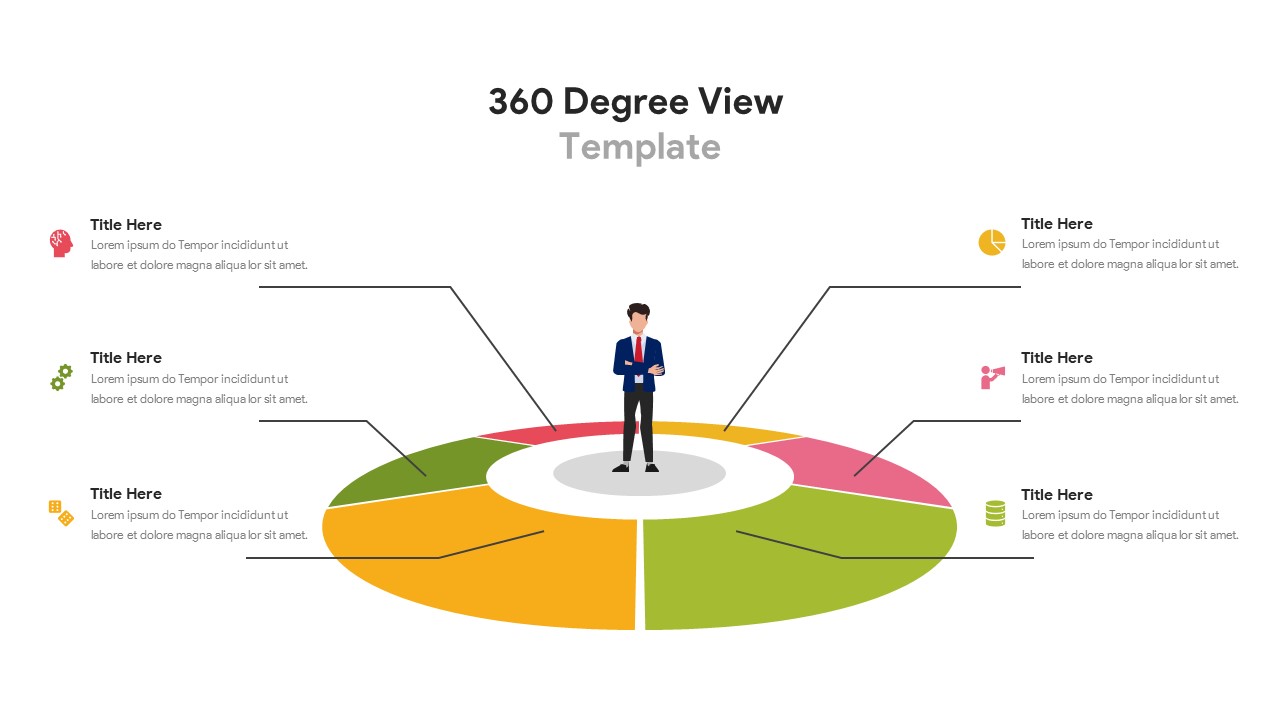
Six-Segment 360 Degree View Infographic Template for PowerPoint & Google Slides
Circular
Three Segment Donut Chart KPI Infographic Template for PowerPoint & Google Slides
Pie/Donut
Six-Step Colorful Flywheel Diagram Template for PowerPoint & Google Slides
Circular
Flywheel Infographics Pack Template for PowerPoint & Google Slides
Circular
Flywheel Infographics template for PowerPoint & Google Slides
Process
Flywheel Infographics template for PowerPoint & Google Slides
Business Strategy
Flywheel Infographics template for PowerPoint & Google Slides
Business Strategy
Flywheel Infographics template for PowerPoint & Google Slides
Business Strategy
Data Flywheel Strategy template for PowerPoint & Google Slides
Business
Funnel and Flywheel Thinking Comparison template for PowerPoint & Google Slides
Infographics
Flywheel Growth Cycle Diagram Template for PowerPoint & Google Slides
Circular
Multi-Segment Circle Split Diagram template for PowerPoint & Google Slides
Circular

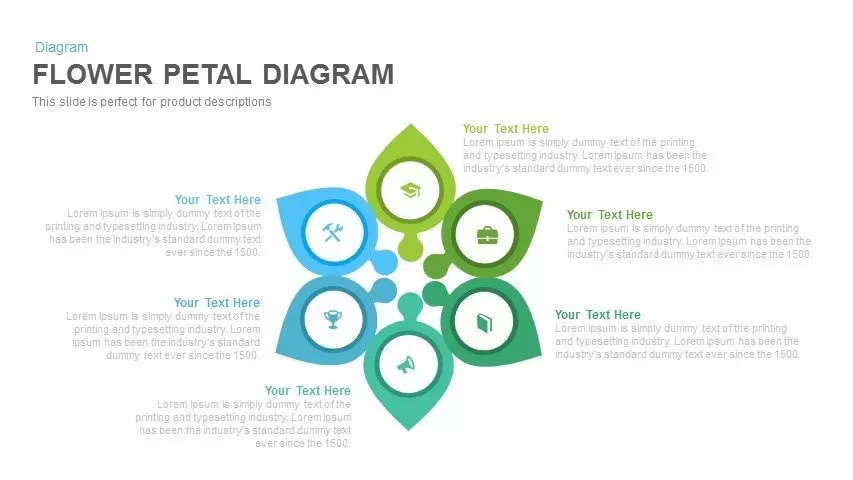
Six-Segment Flower Petal Diagram Template for PowerPoint & Google Slides
Circular
Eight-Segment 3D Arrow Infographics Template for PowerPoint & Google Slides
Arrow
Seven-Segment Circular Arrow Diagram Template for PowerPoint & Google Slides
Arrow
Six Segment Hexagon Circular Diagram Template for PowerPoint & Google Slides
Circular
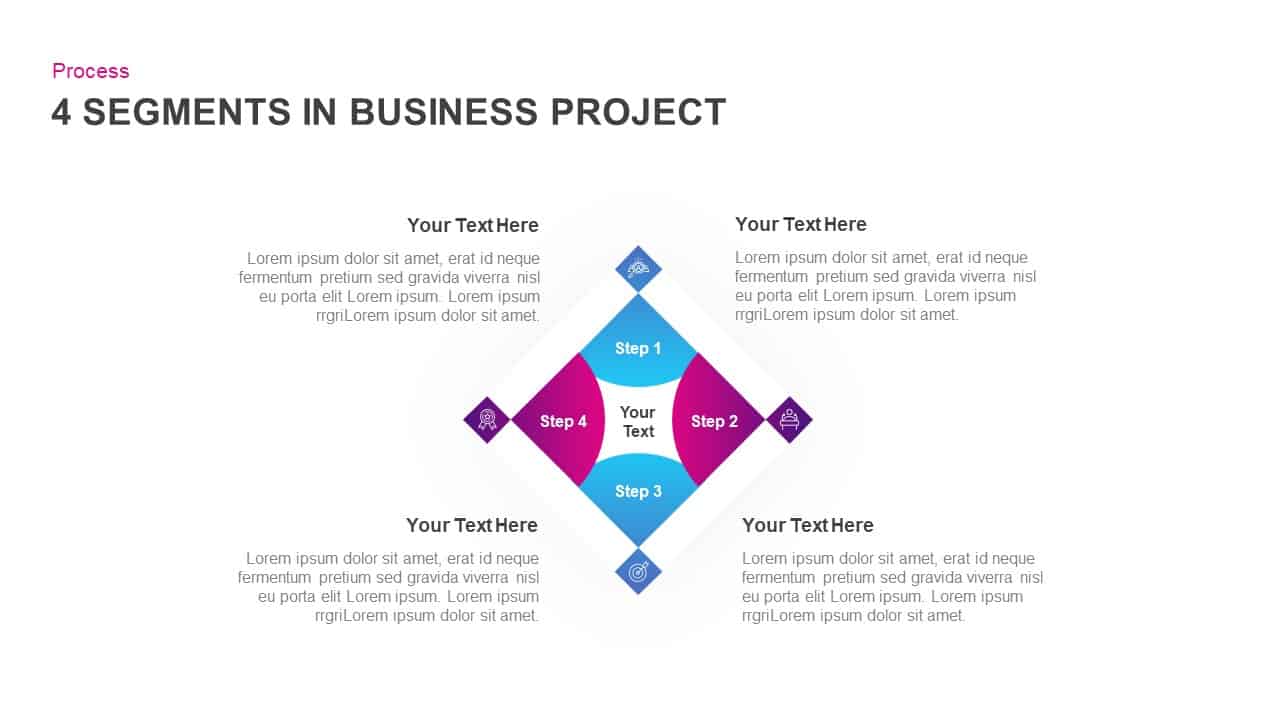
4-Segment Business Project Diamond Diagram Template for PowerPoint & Google Slides
Process
Circular 3D Cube Six-Segment Diagram Template for PowerPoint & Google Slides
Infographics
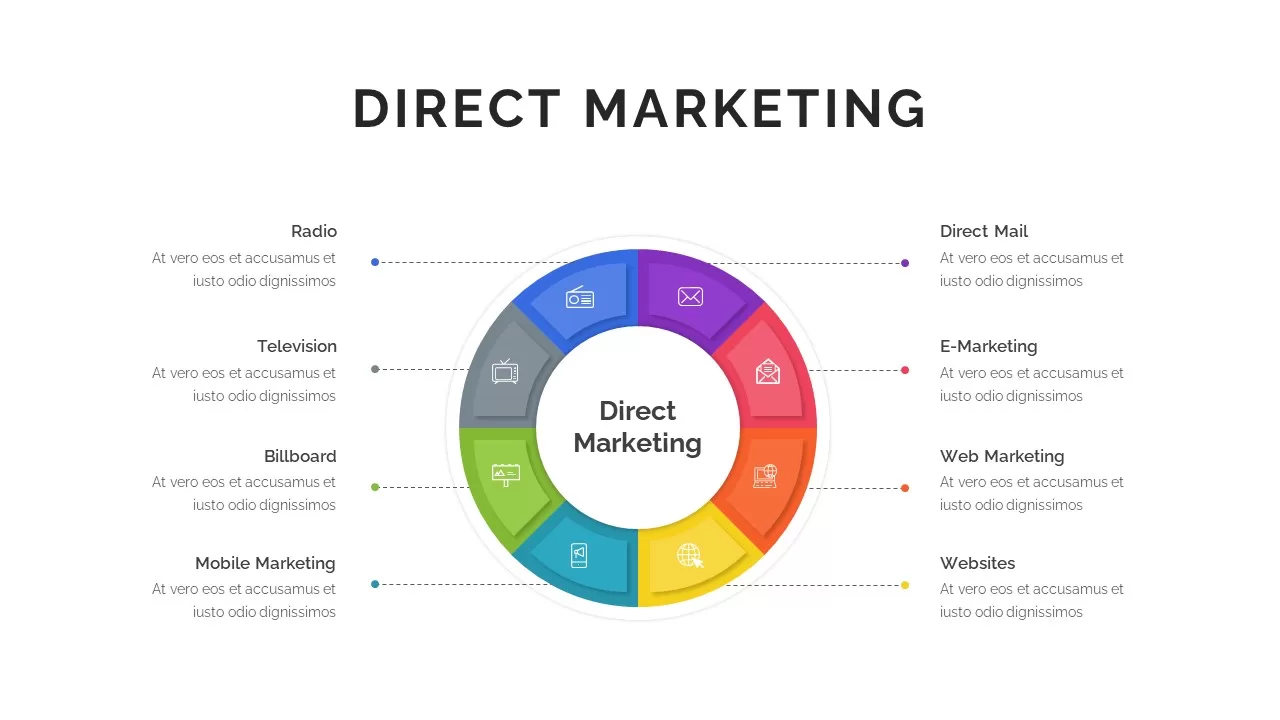
Eight-Segment Direct Marketing Wheel Template for PowerPoint & Google Slides
Circular
Three-Segment Circular Arrow Cycle Template for PowerPoint & Google Slides
Circular
Six-Segment Circular Arrow Cycle Template for PowerPoint & Google Slides
Circular
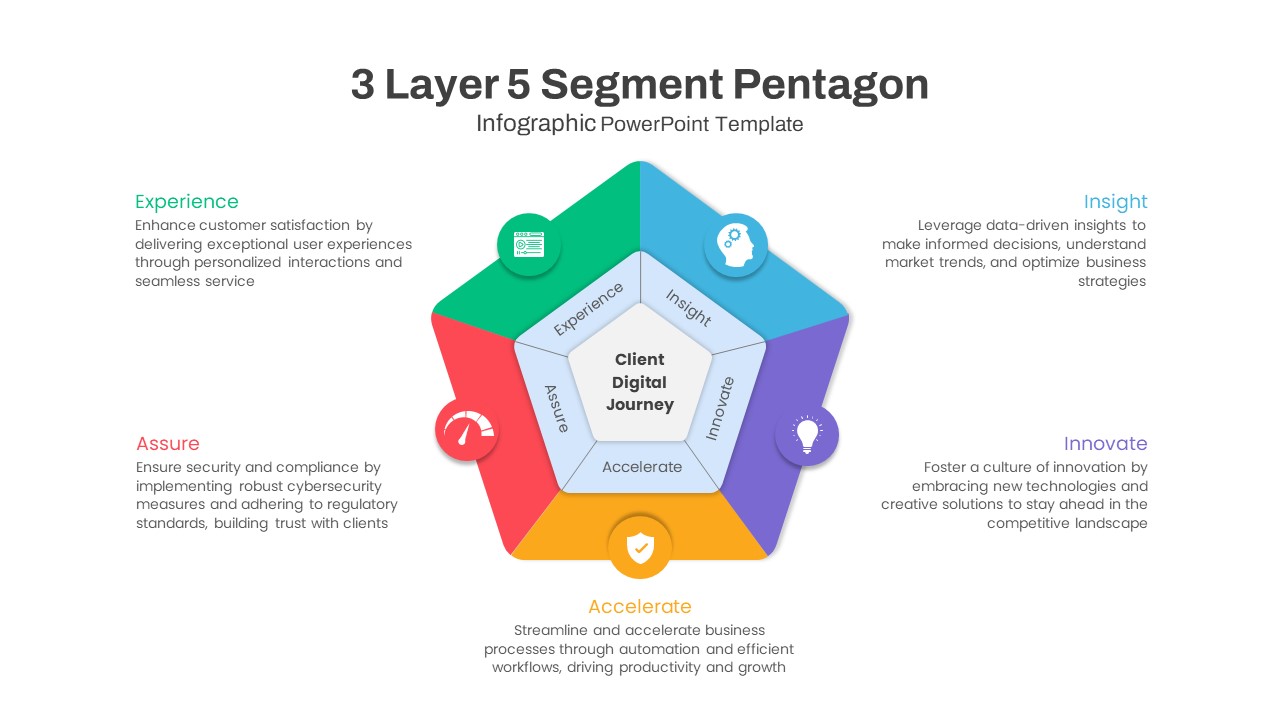
Five-Segment Pentagon Digital Journey Template for PowerPoint & Google Slides
Process
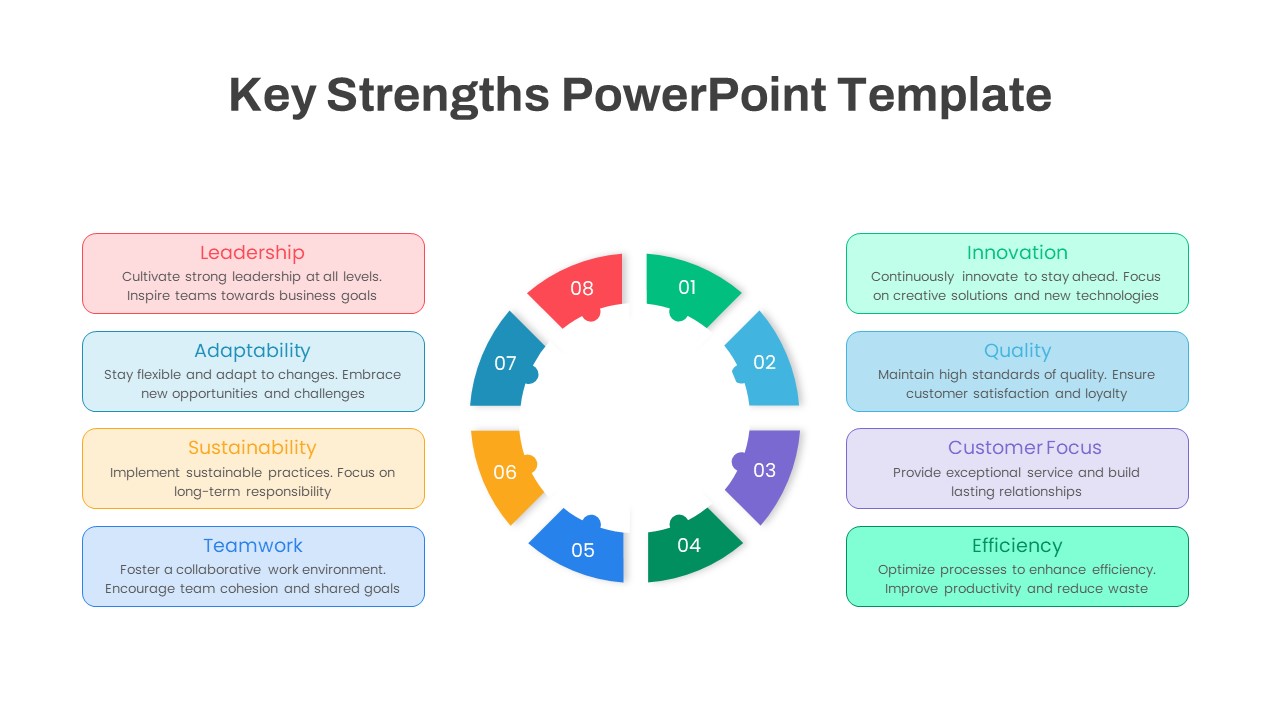
Eight-Segment Key Strengths Diagram Template for PowerPoint & Google Slides
Circular
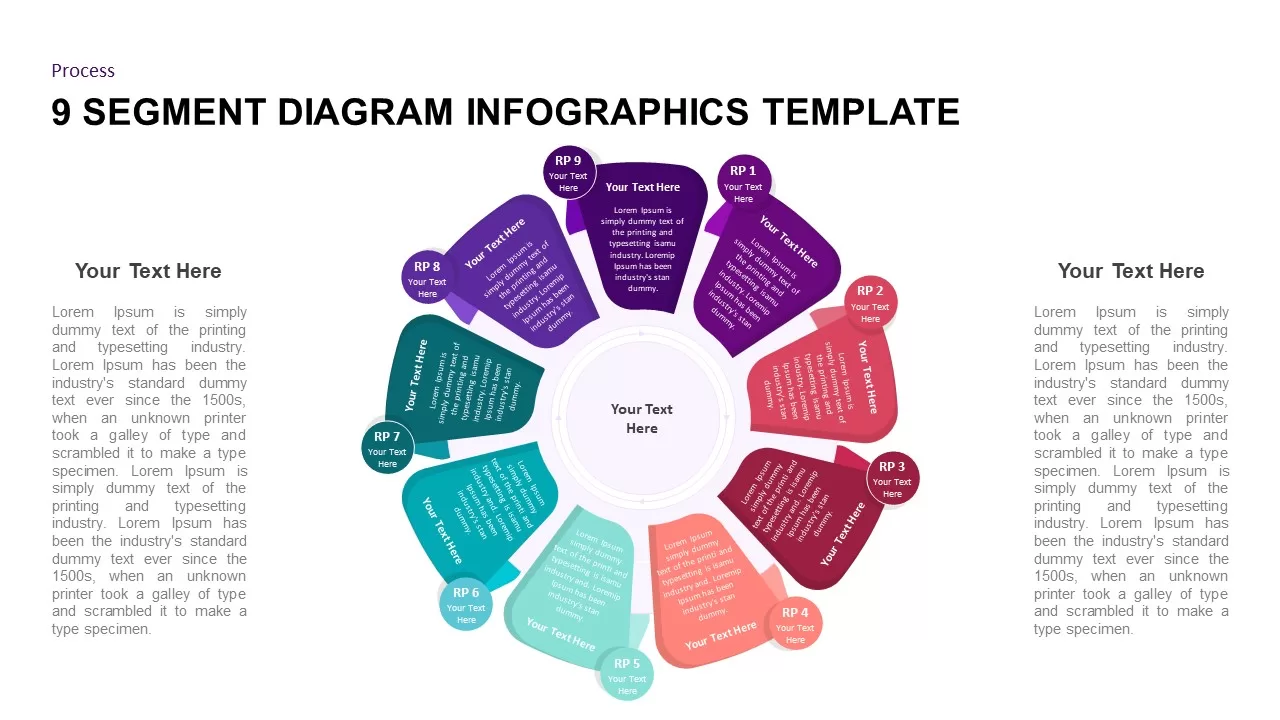
9 Segment Diagram Infographics for PowerPoint & Google Slides
Process
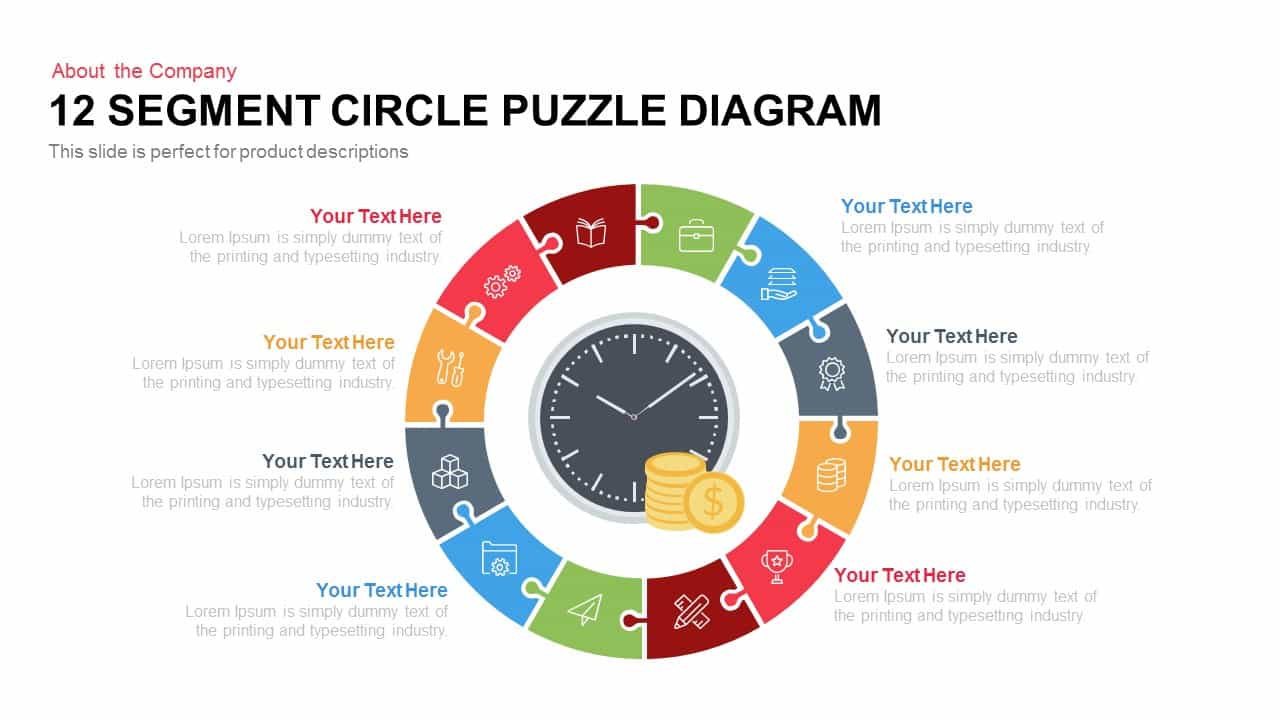
12 Segment Circle Puzzle Diagram Template for PowerPoint and Keynote
Circular
Four Options Infographic Slides Template for PowerPoint & Google Slides
Comparison

Four-Phase Maturity Model Diagram Template for PowerPoint & Google Slides
Process
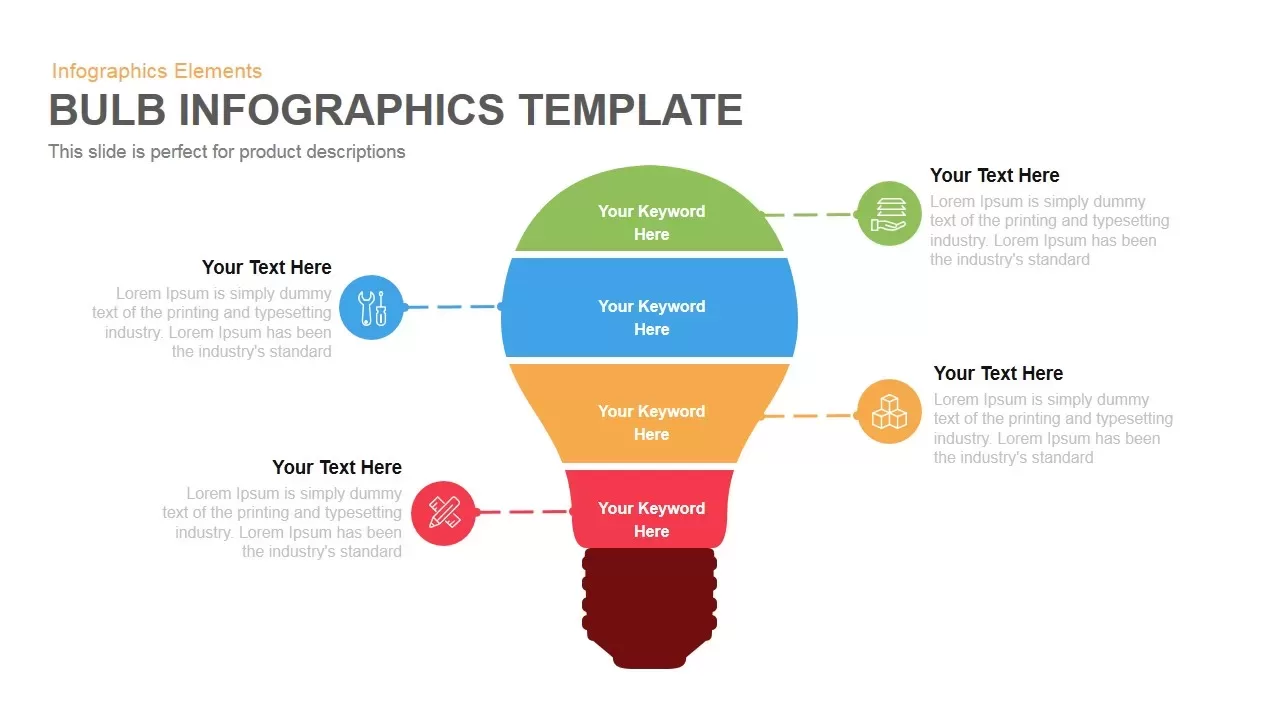
Layered Bulb Infographic Four Segments Template for PowerPoint & Google Slides
Funnel
Four-Circle Business Process Infographic Template for PowerPoint & Google Slides
Circular
Three Four Five Stage Timeline Infographic Template for PowerPoint & Google Slides
Timeline
Four-Level 3D Pyramid Infographic Template for PowerPoint & Google Slides
Pyramid
Four-Stage Linear Infographic Diagram Template for PowerPoint & Google Slides
Process
Four-Tag Section Ribbon Infographic Template for PowerPoint & Google Slides
Comparison
Four-Staged Textbox Infographic Template for PowerPoint & Google Slides
Process
Colorful Four-Stage Infographic Process Template for PowerPoint & Google Slides
Process
Four Arrows Layout Infographic with Icon Template for PowerPoint & Google Slides
Arrow
Four-Section Colored Circle Infographic Template for PowerPoint & Google Slides
Circular
Four Staged Inward Arrows Infographic Template for PowerPoint & Google Slides
Arrow
Four-Section Arrow Infographic Diagram Template for PowerPoint & Google Slides
Arrow
Four-Step Arrow Process Infographic Template for PowerPoint & Google Slides
Arrow
Four-Option 4-Step Arrow Infographic Template for PowerPoint & Google Slides
Arrow
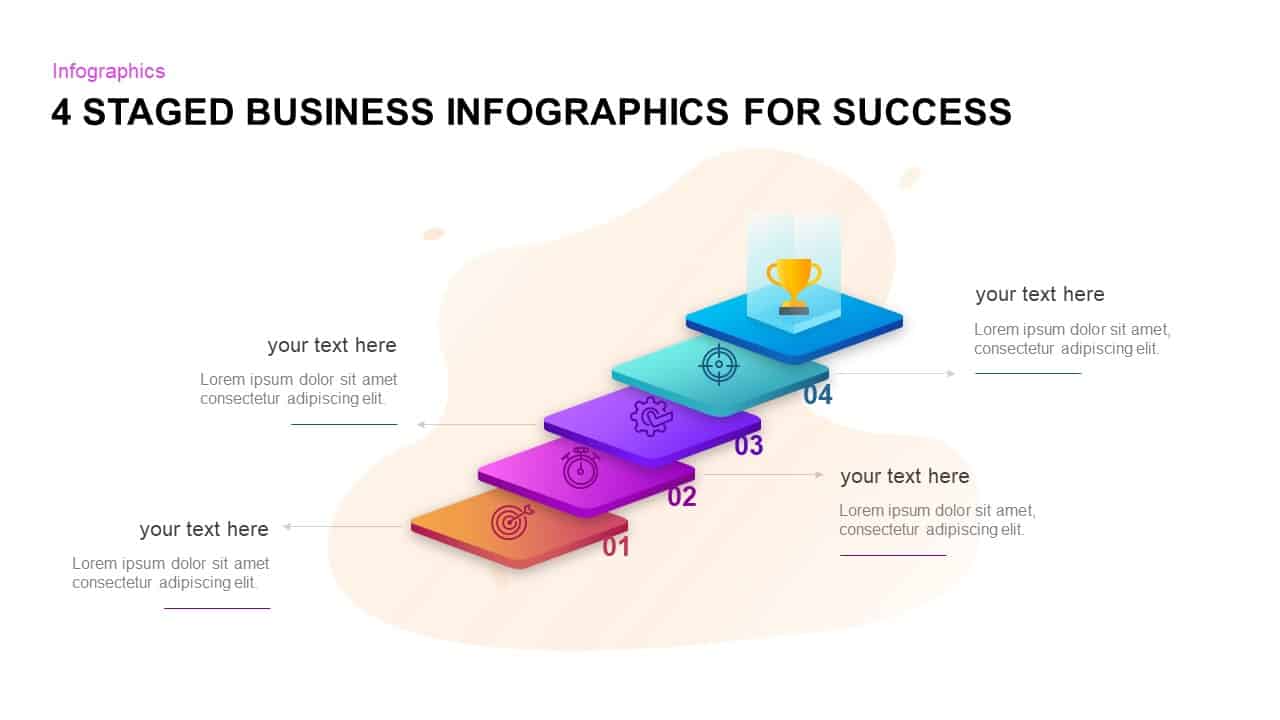
Four-Stage Business Success Infographic Template for PowerPoint & Google Slides
Process
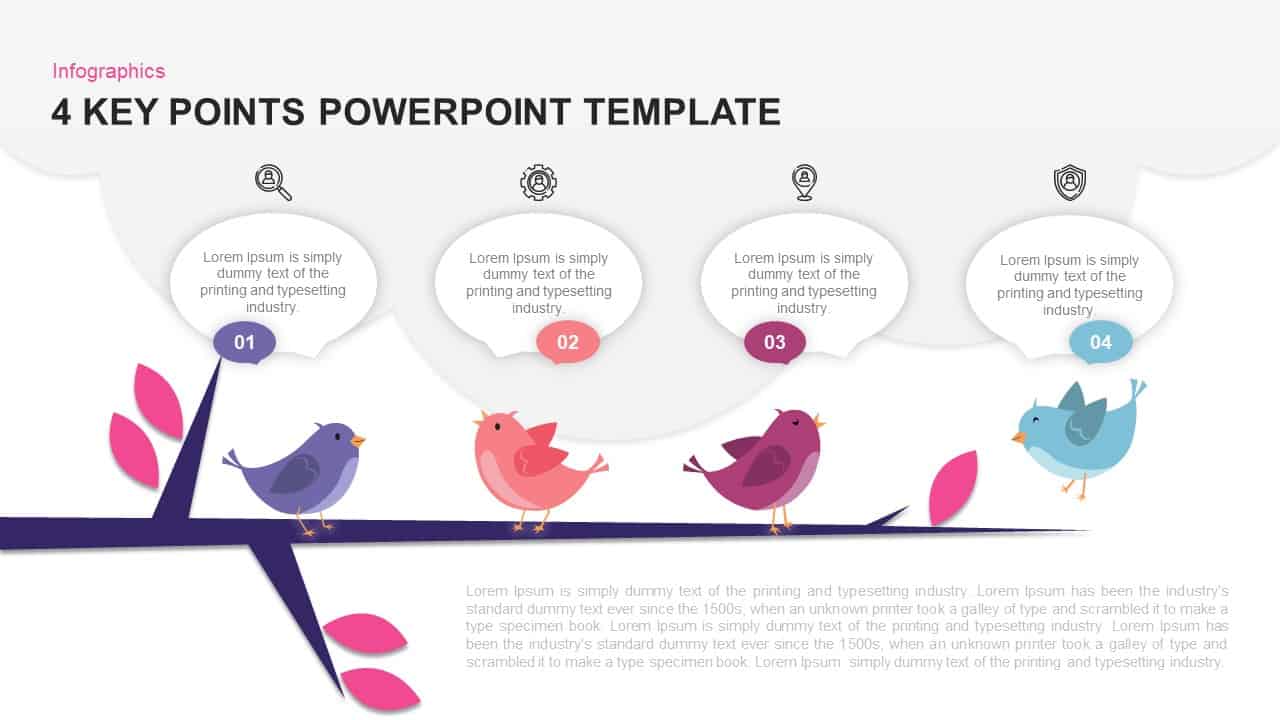
Bird Branch Four Key Points Infographic Template for PowerPoint & Google Slides
Agenda
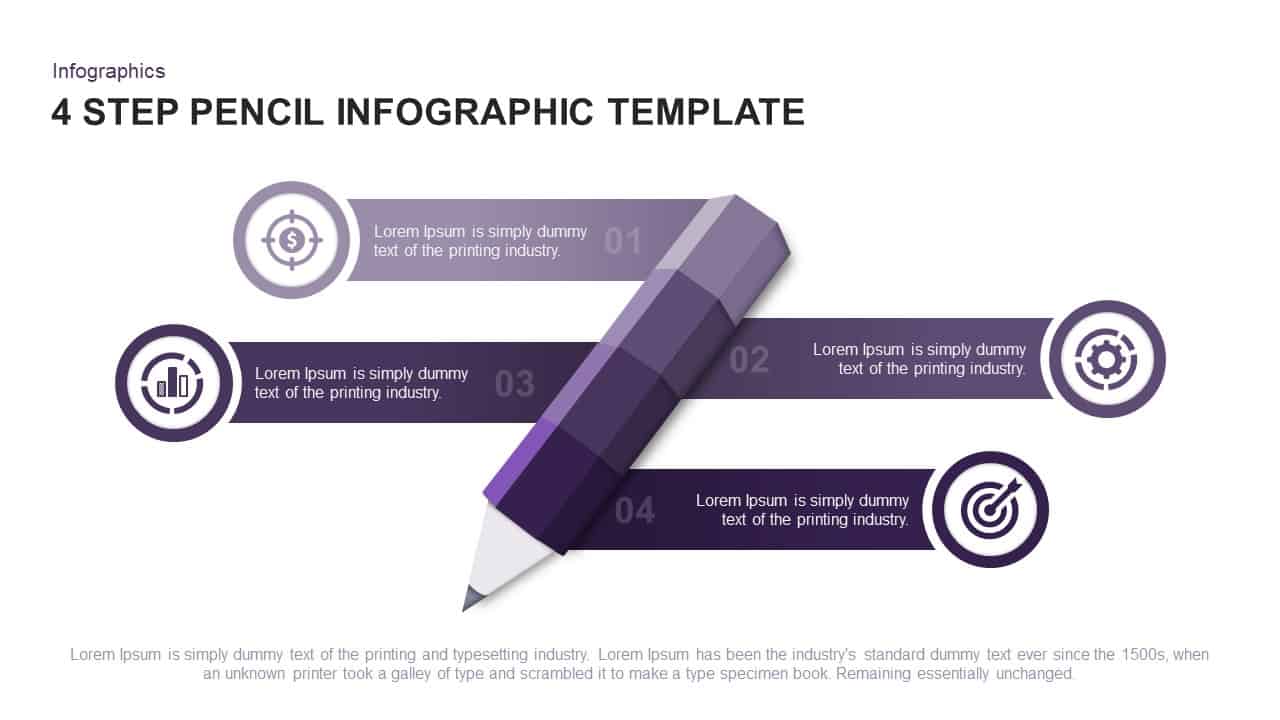
Four-Step Pencil Infographic Process Template for PowerPoint & Google Slides
Process
Four-Stage Circular Diagram Infographic Template for PowerPoint & Google Slides
Circular
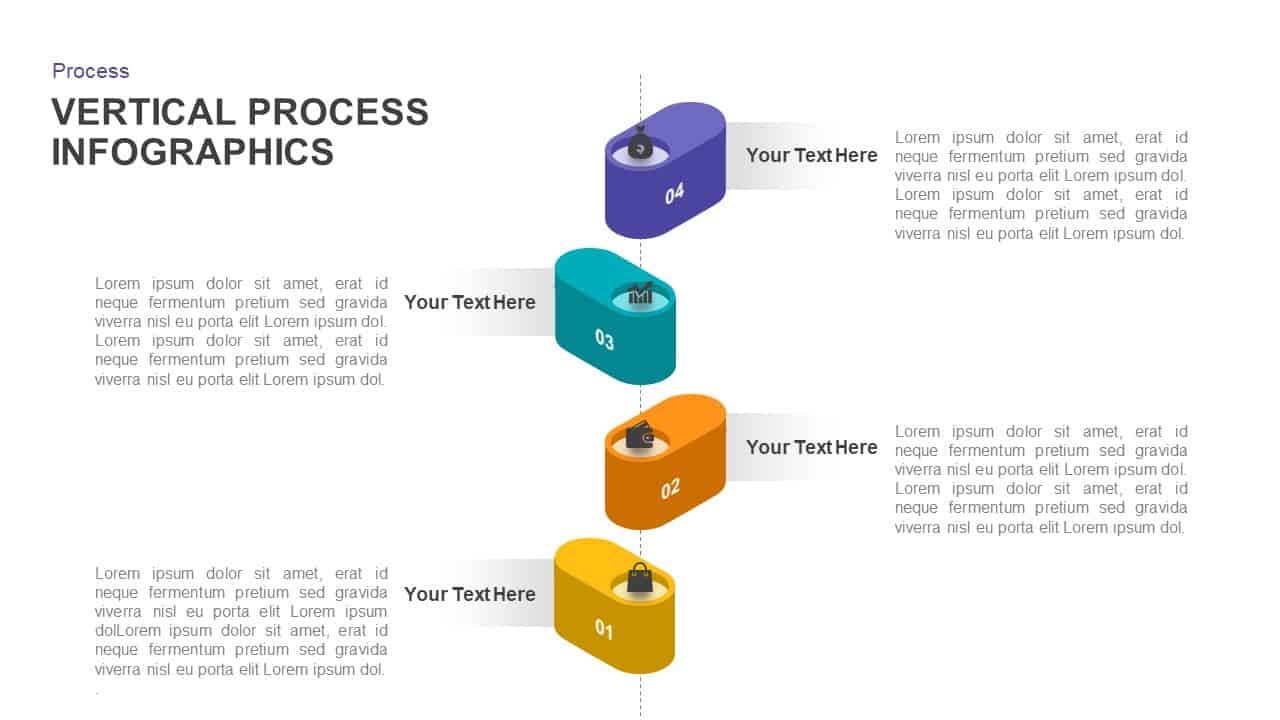
Vertical Four-Step Process Infographic Template for PowerPoint & Google Slides
Process
Four-Stage Funnel Diagram Infographic Template for PowerPoint & Google Slides
Funnel
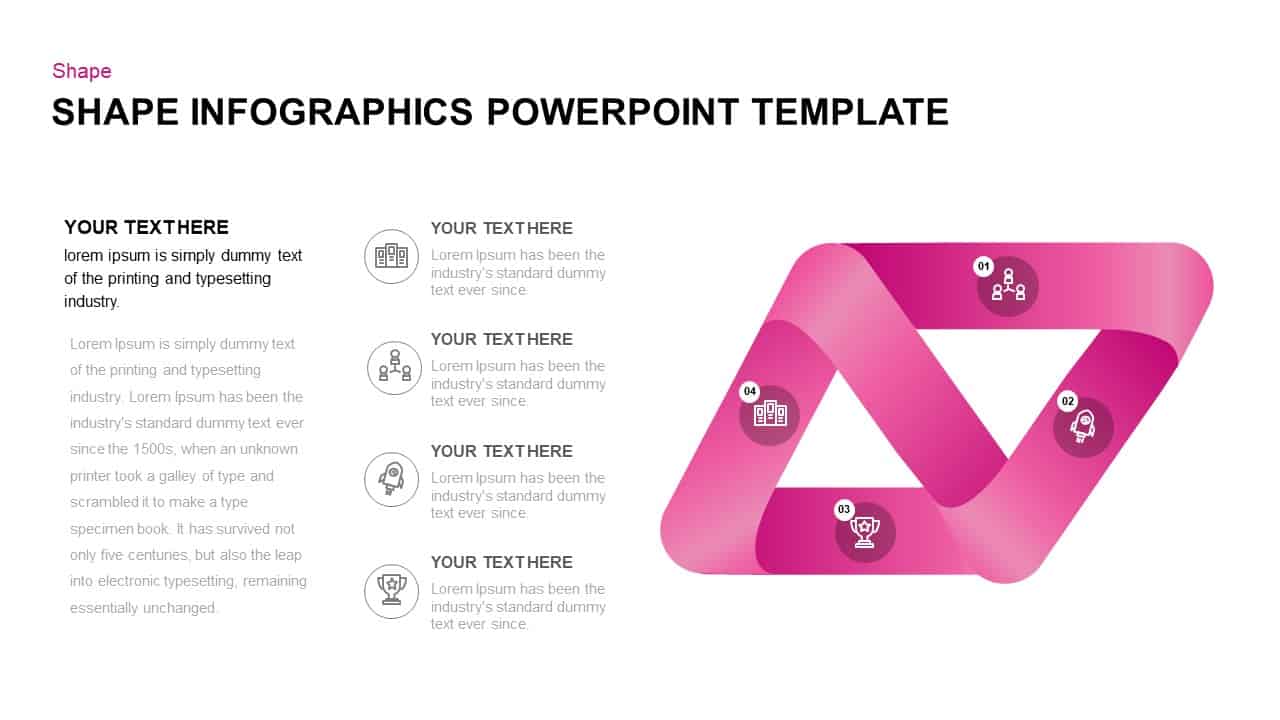
Shape Loop Four-Step Infographic Slide Template for PowerPoint & Google Slides
Process
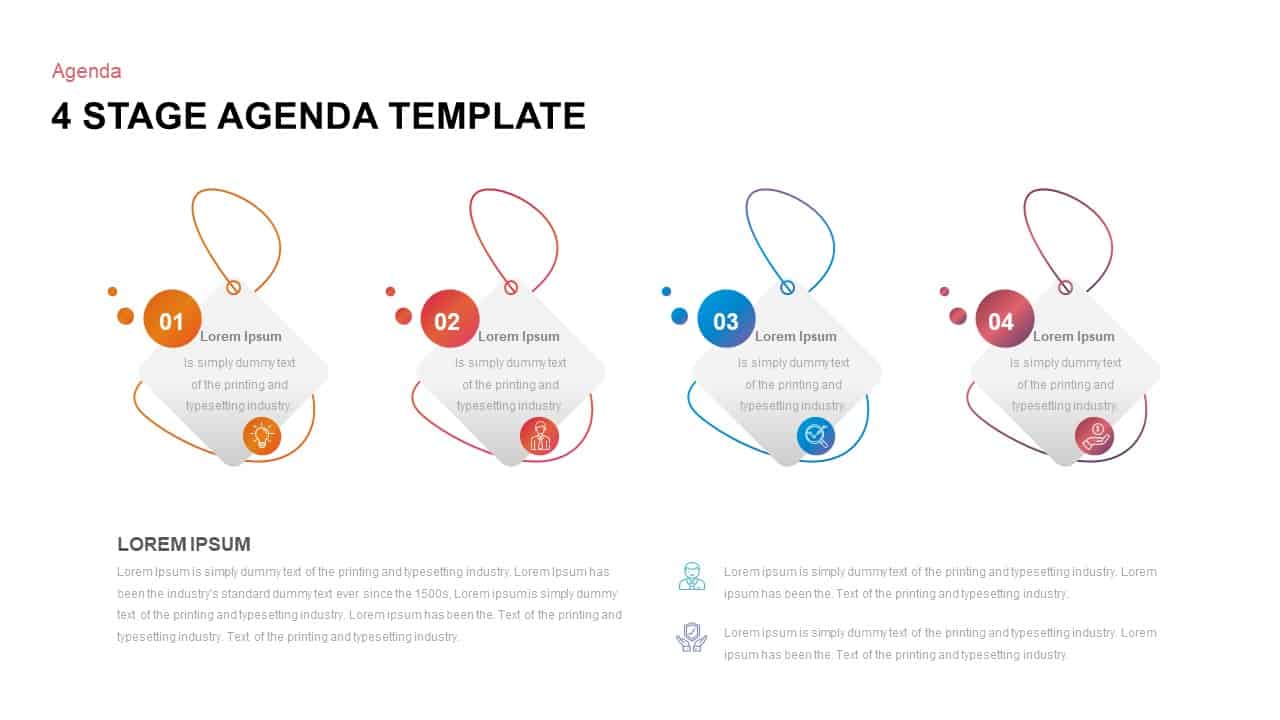
Four-Stage Agenda Infographic Slide Template for PowerPoint & Google Slides
Agenda
Four Step Process Infographic Slide Template for PowerPoint & Google Slides
Process
Four-Step Hexagon Process Infographic Template for PowerPoint & Google Slides
Process
Four-Step Funnel Infographic Pack Template for PowerPoint & Google Slides
Funnel
Four-Step Puzzle Diagram Infographic Template for PowerPoint & Google Slides
Process
Four-Stage Funnel Diagram Infographic Template for PowerPoint & Google Slides
Funnel
Four-Step Meeting Agenda Infographic Template for PowerPoint & Google Slides
Agenda
Four Section Infographic Diagram Template for PowerPoint & Google Slides
Circular
Four-Step Isometric Process Infographic Template for PowerPoint & Google Slides
Process
Four-Option Cross Infographic Diagram Template for PowerPoint & Google Slides
Comparison
Four-Part Puzzle Piece Infographic Template for PowerPoint & Google Slides
Infographics
Free Modern Four-Step Agenda Infographic Template for PowerPoint & Google Slides
Agenda
Free
Four-Part Table of Contents Infographic Template for PowerPoint & Google Slides
Agenda
Four-Stage Circle Arrow Infographic Template for PowerPoint & Google Slides
Circular
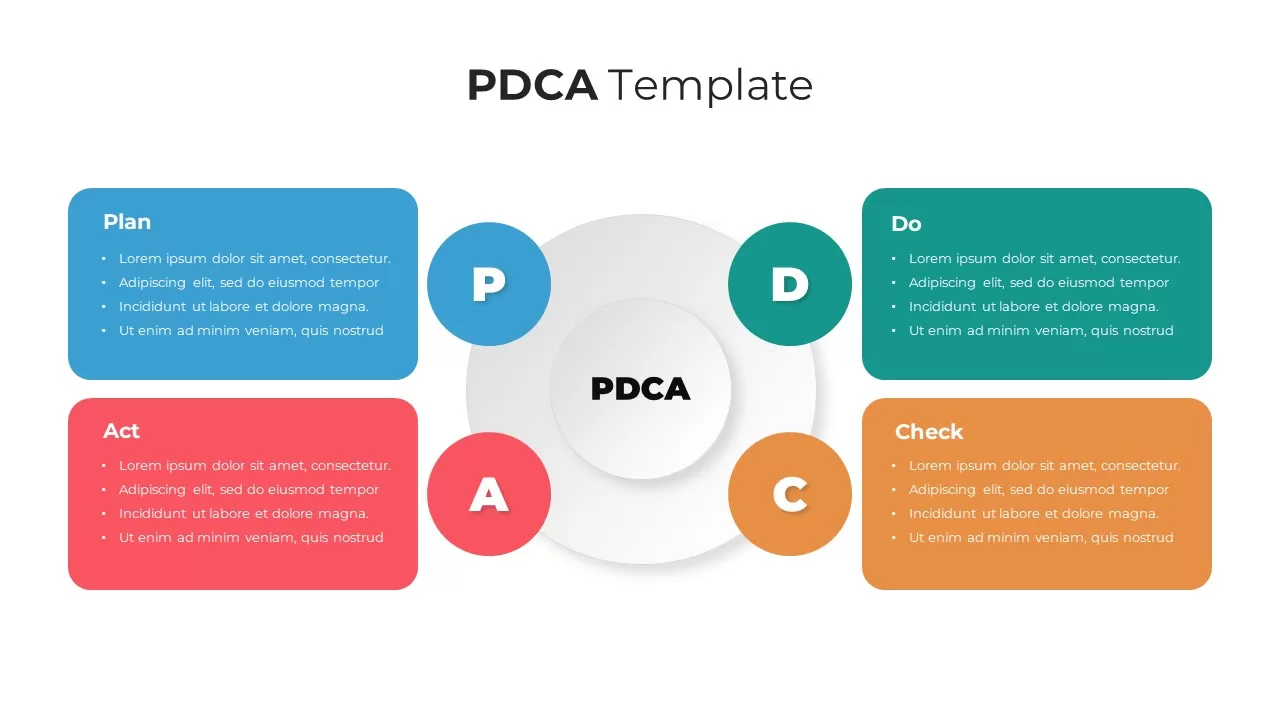
PDCA Cycle Infographic with Four Stages Template for PowerPoint & Google Slides
Process
Four-Stage Circle Arrow Infographic Template for PowerPoint & Google Slides
Circular
PDCA Four-Stage Cycle Infographic Template for PowerPoint & Google Slides
Process
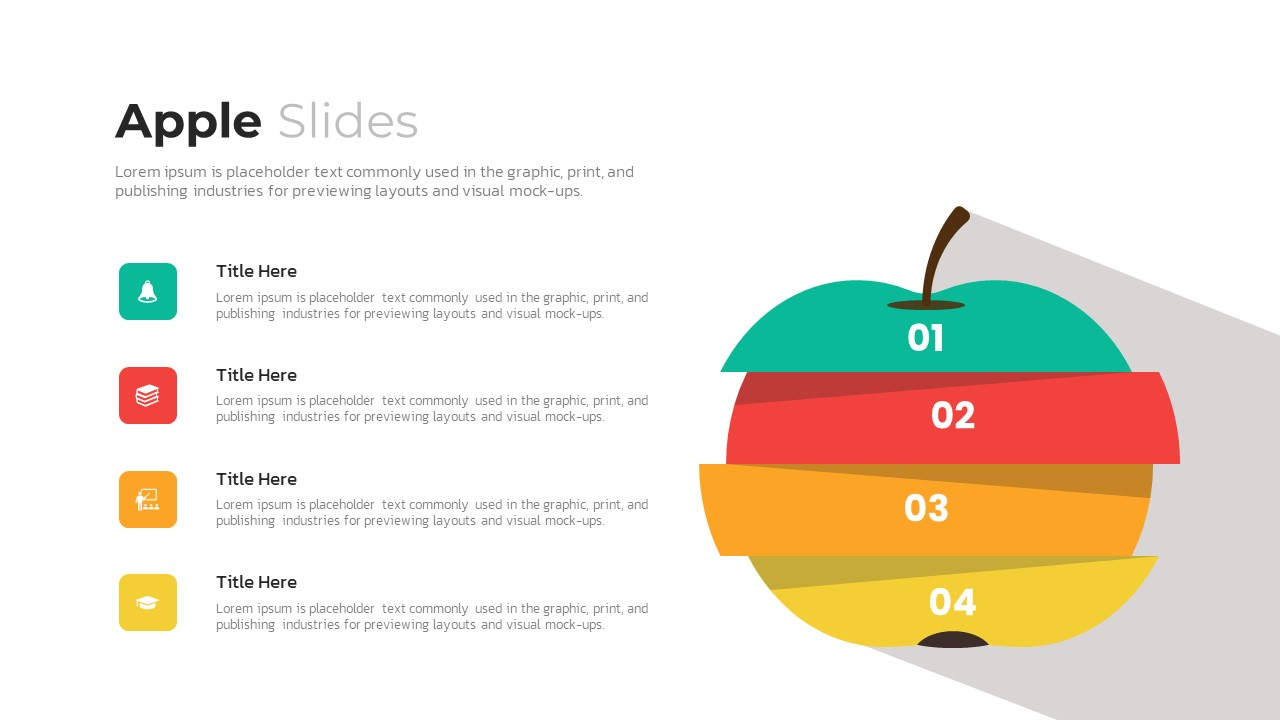
Apple Four-Step Process Infographic Template for PowerPoint & Google Slides
Process
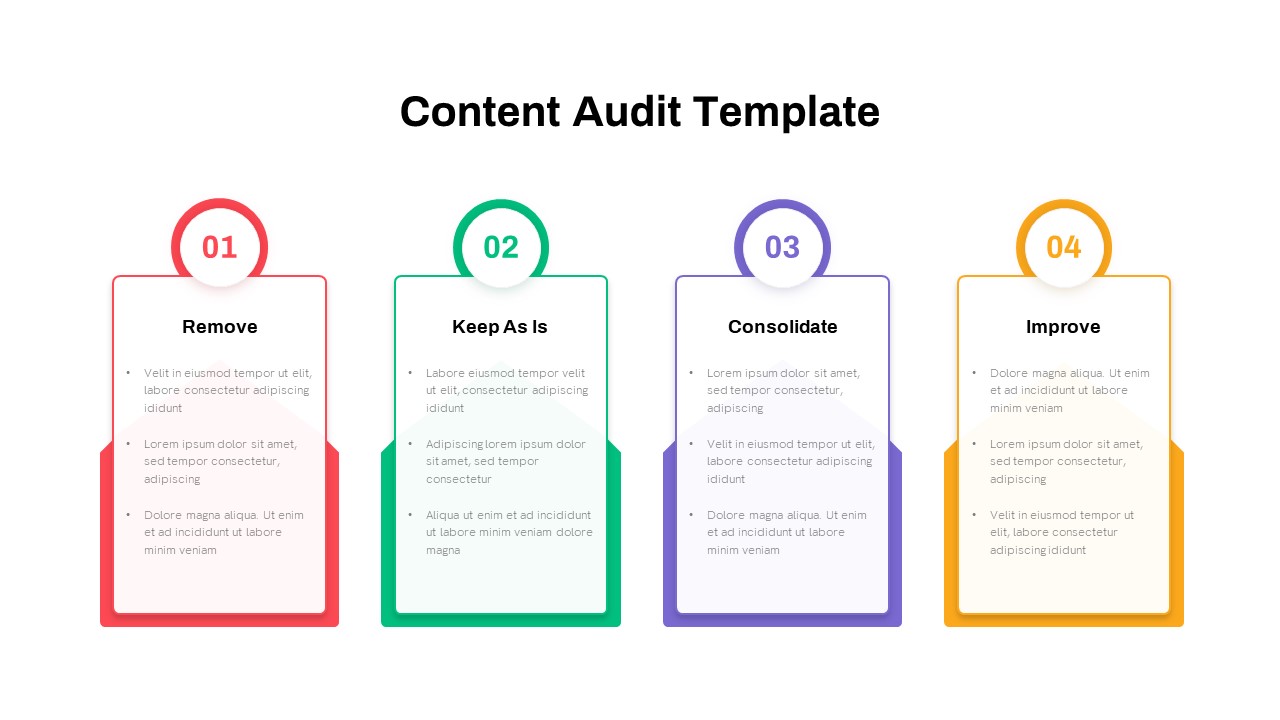
Four-Step Content Audit Infographic Template for PowerPoint & Google Slides
Process
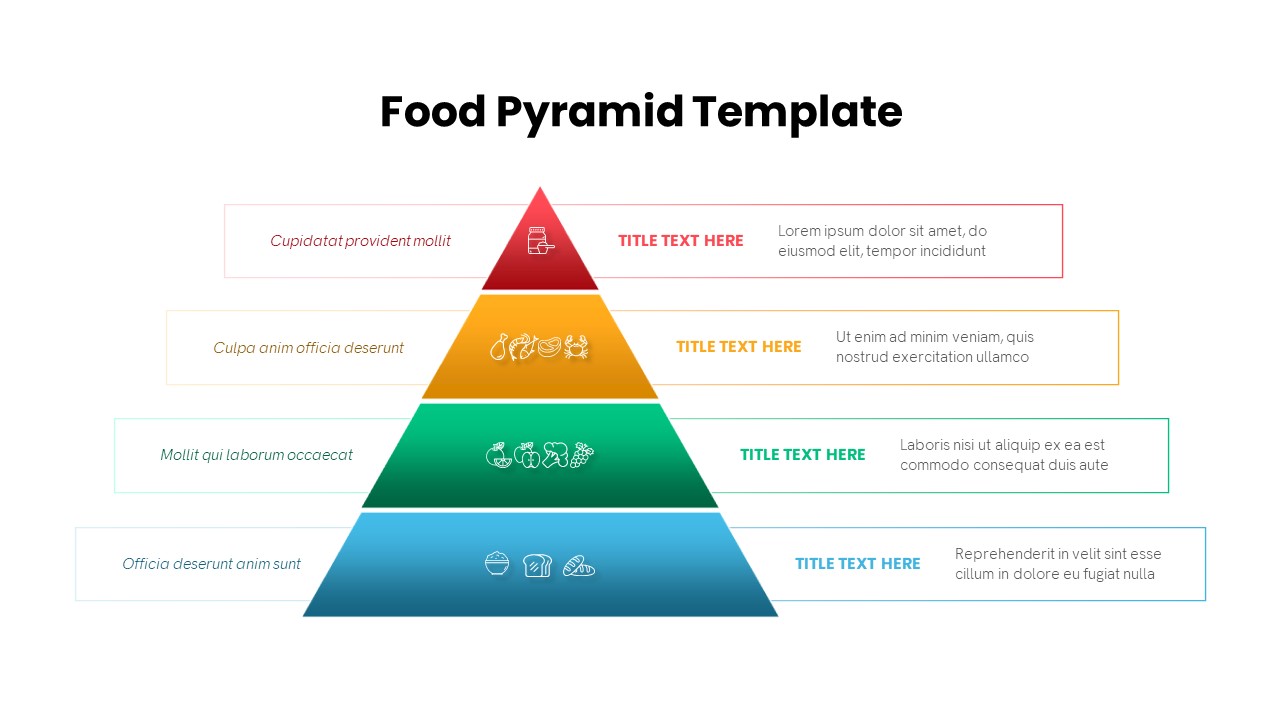
Four-Level Food Pyramid Infographic Template for PowerPoint & Google Slides
Pyramid
Free Three and Four Pillar Infographic Pack Template for PowerPoint & Google Slides
Process
Free
Pesticide Four-Step Process Infographic Template for PowerPoint & Google Slides
Process
Four Level Pyramid Infographic Template for PowerPoint & Google Slides
Pyramid
Four SIPOC Diagram Infographic Templates for PowerPoint & Google Slides
Business Plan
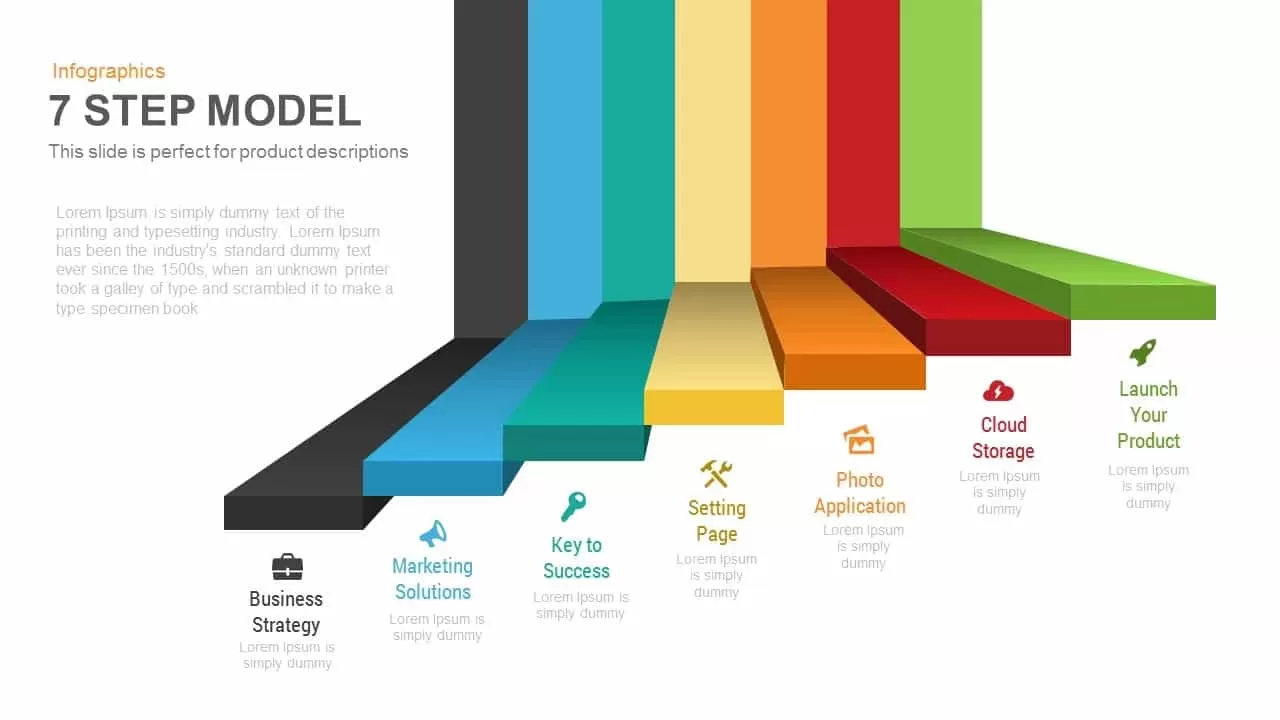
7-Step 3D Process Infographic Model template for PowerPoint & Google Slides
Process

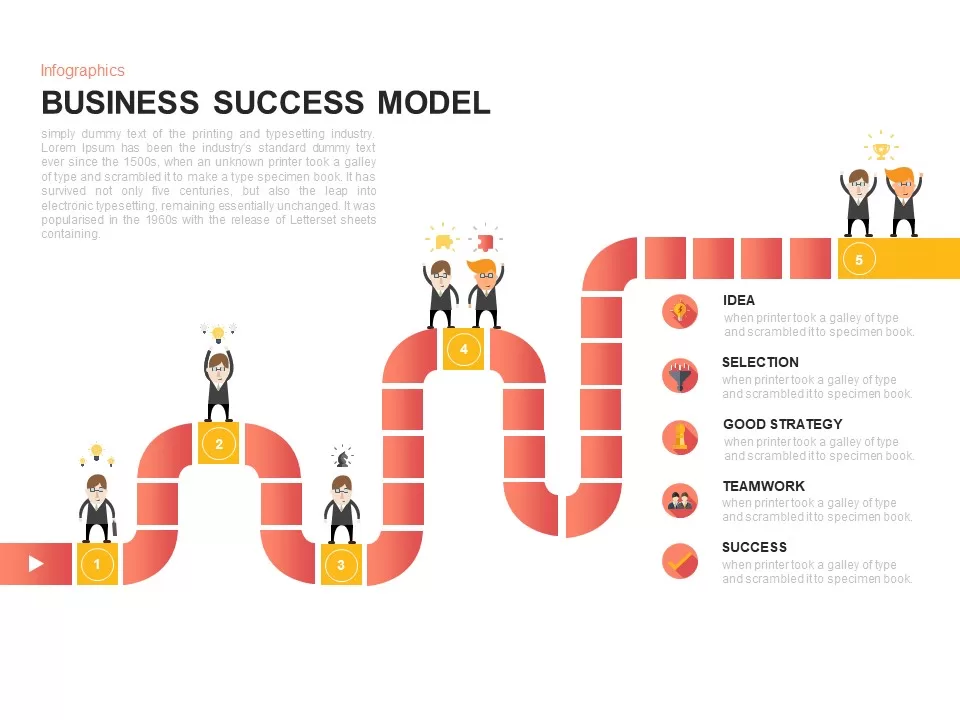
Business Success Model Infographic Template for PowerPoint & Google Slides
Roadmap
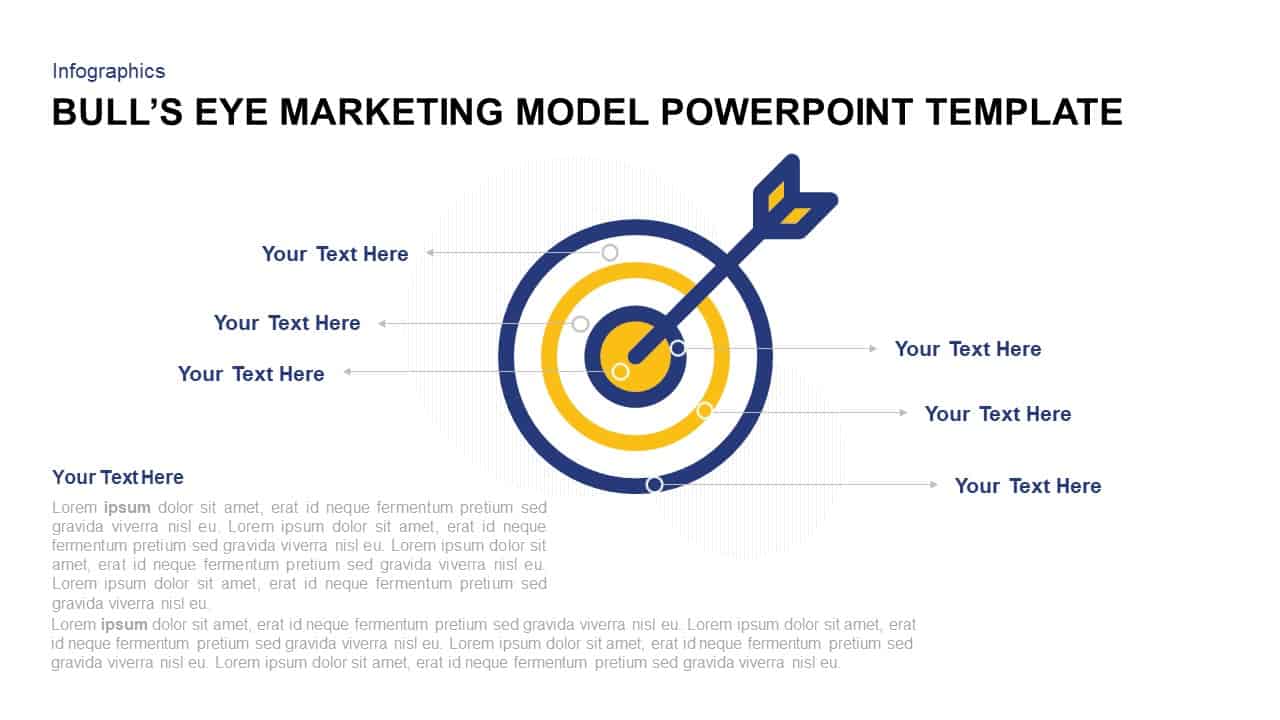
Bull’s Eye Marketing Model Infographic Template for PowerPoint & Google Slides
Circular
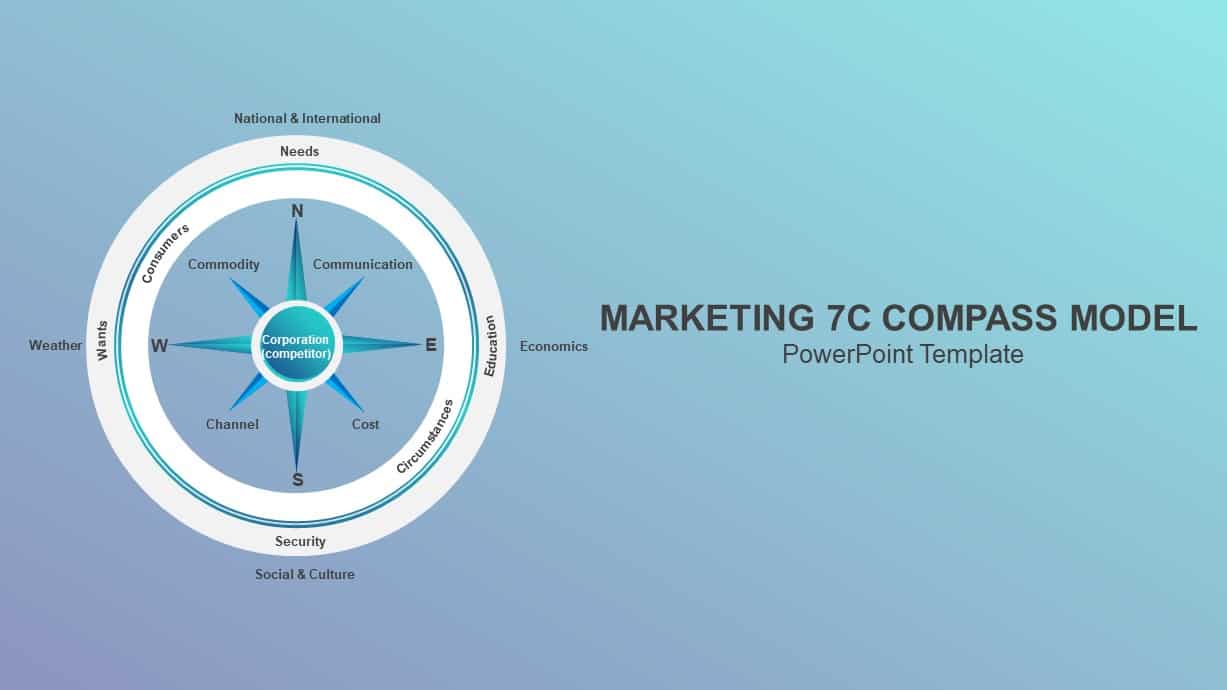
Marketing 7C Compass Model Infographic Template for PowerPoint & Google Slides
Circular
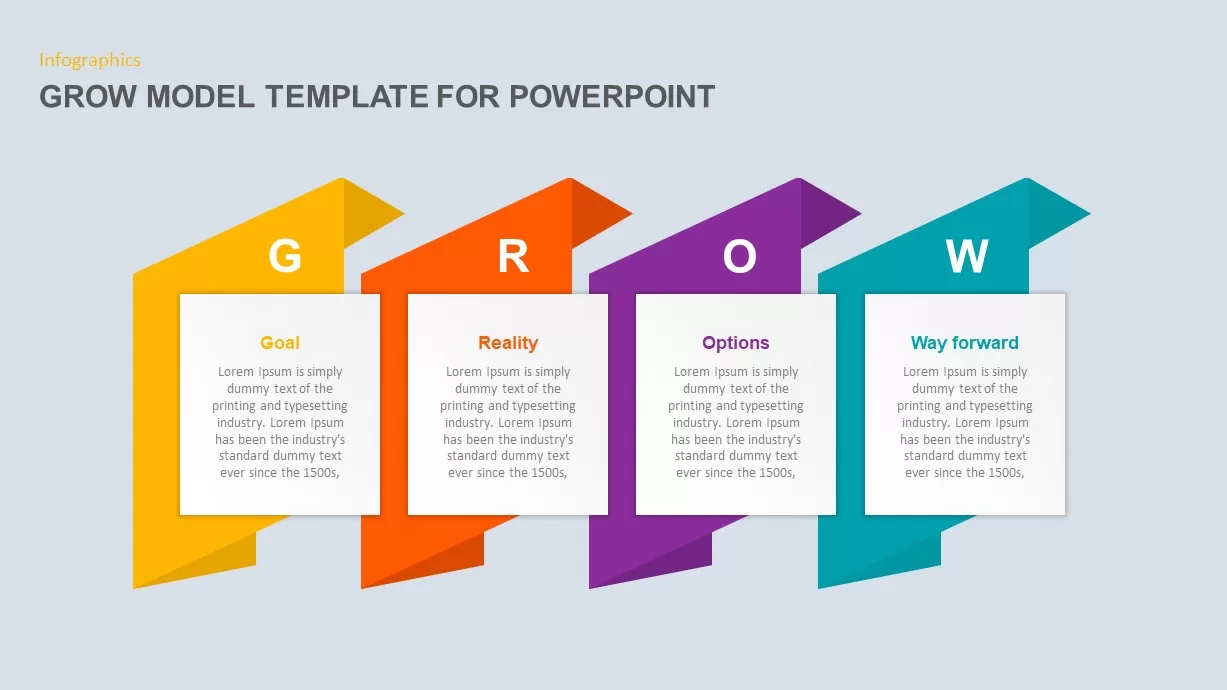
GROW Model Coaching Infographic Template for PowerPoint & Google Slides
Process
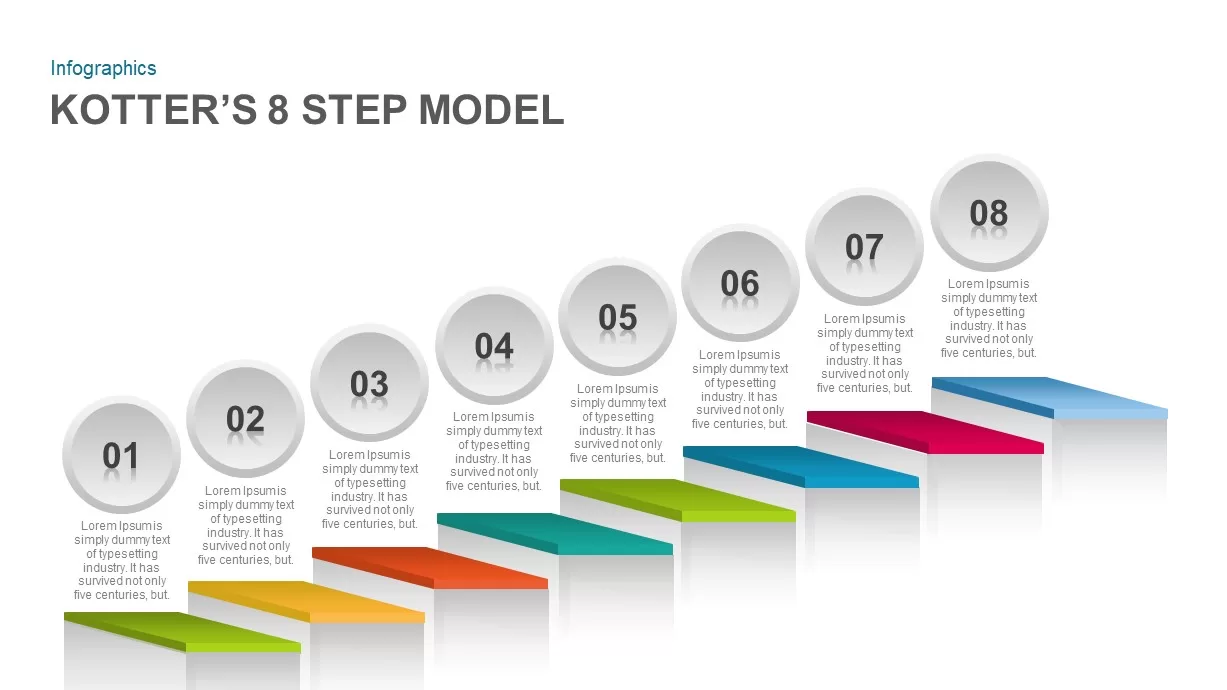
Kotter’s 8-Step Model Infographic Template for PowerPoint & Google Slides
Process
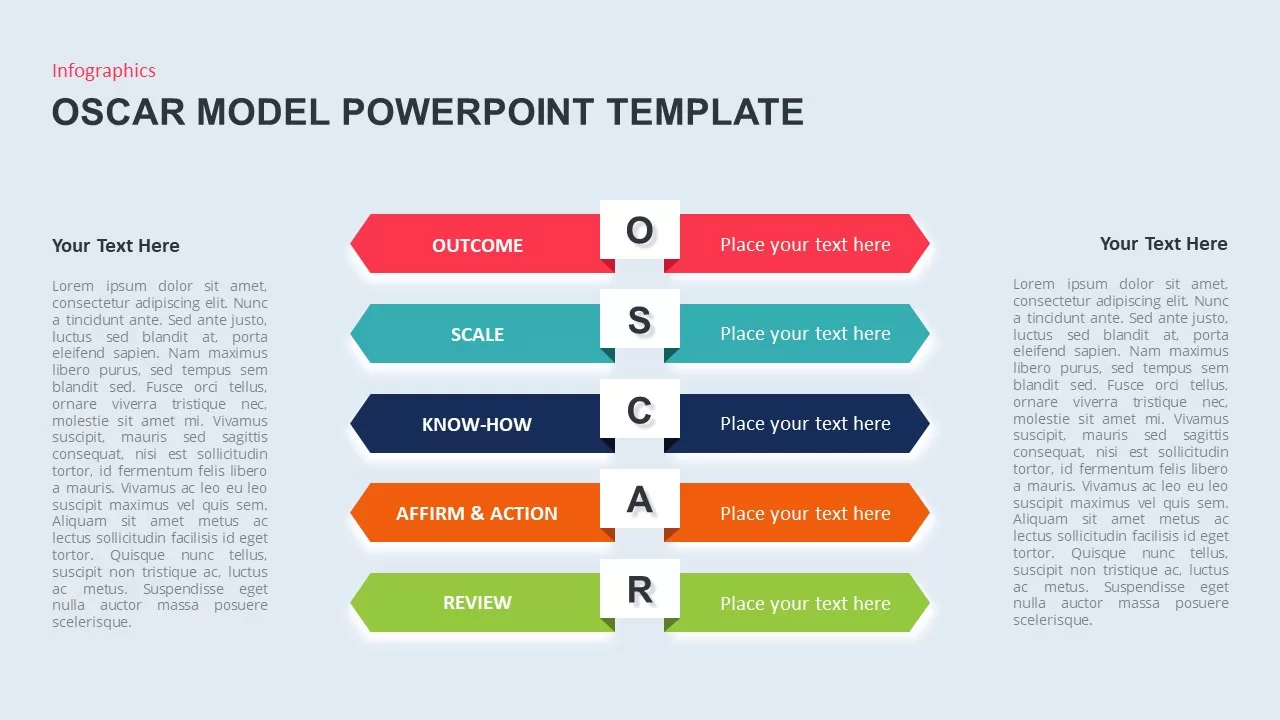
OSCAR Behavior Model Infographic Template for PowerPoint & Google Slides
HR
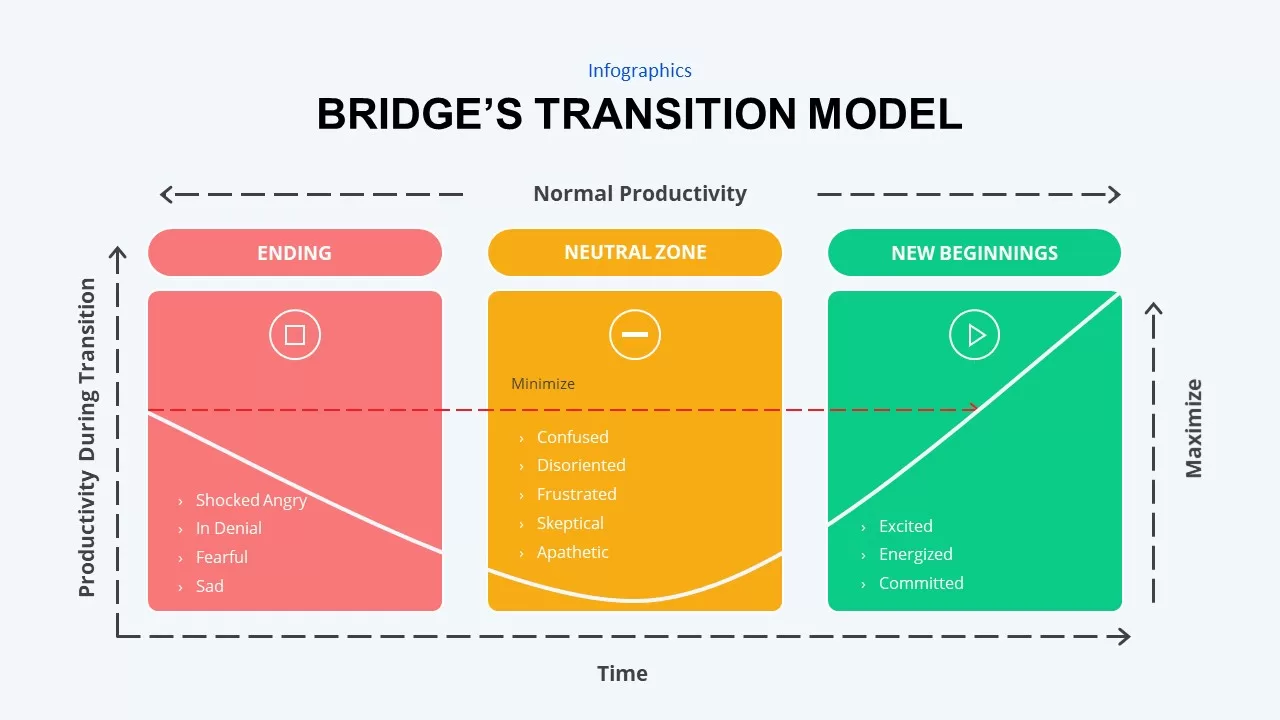
Bridge’s Transition Model Infographic Template for PowerPoint & Google Slides
HR
Run Grow Transform Model Infographic Template for PowerPoint & Google Slides
Business
Operating Model Canvas Infographic Template for PowerPoint & Google Slides
Business Models
Simon Sinek Circles Model Infographic template for PowerPoint & Google Slides
Business Strategy
8Ps of Marketing Model Infographic Template for PowerPoint & Google Slides
Marketing
8Ps of Marketing Infographic Model Template for PowerPoint & Google Slides
Comparison
Sustainable Business Model Circular Infographic Template for PowerPoint & Google Slides
Business Strategy
Salience Model Venn Diagram Infographic Template for PowerPoint & Google Slides
Circular
Pricing Model Types Comparison Infographic Template for PowerPoint & Google Slides
Pitch Deck