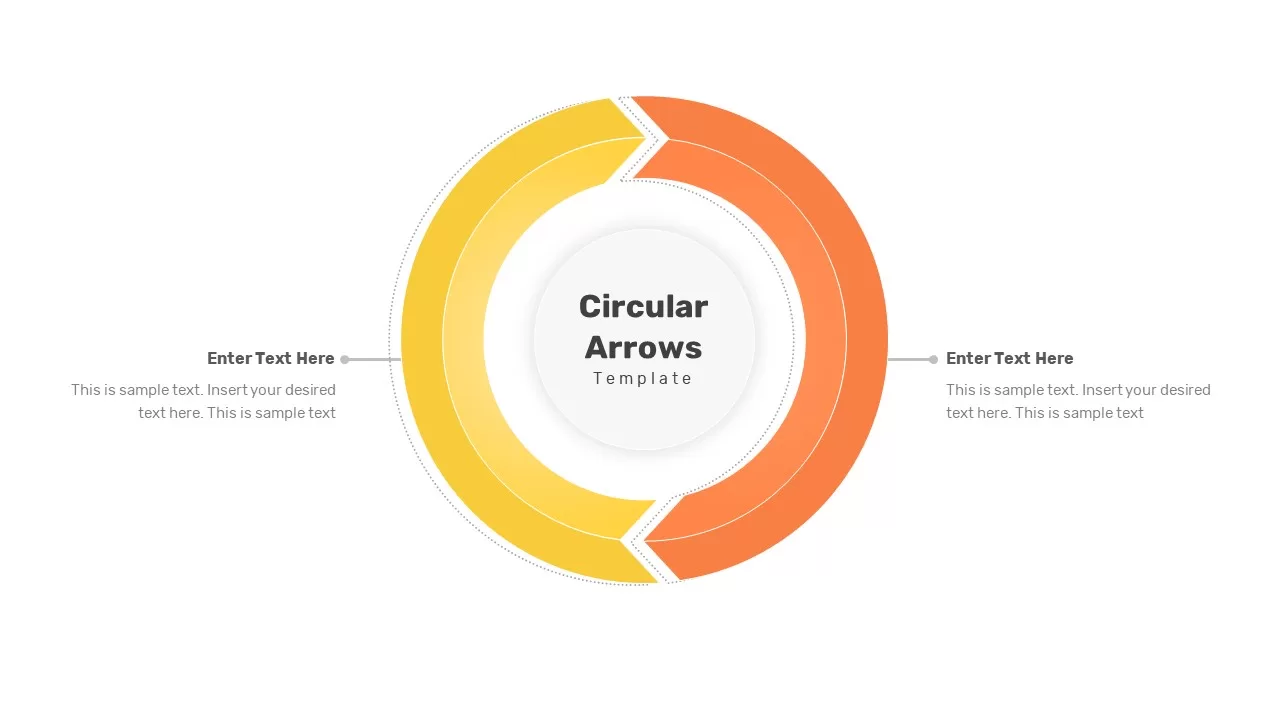
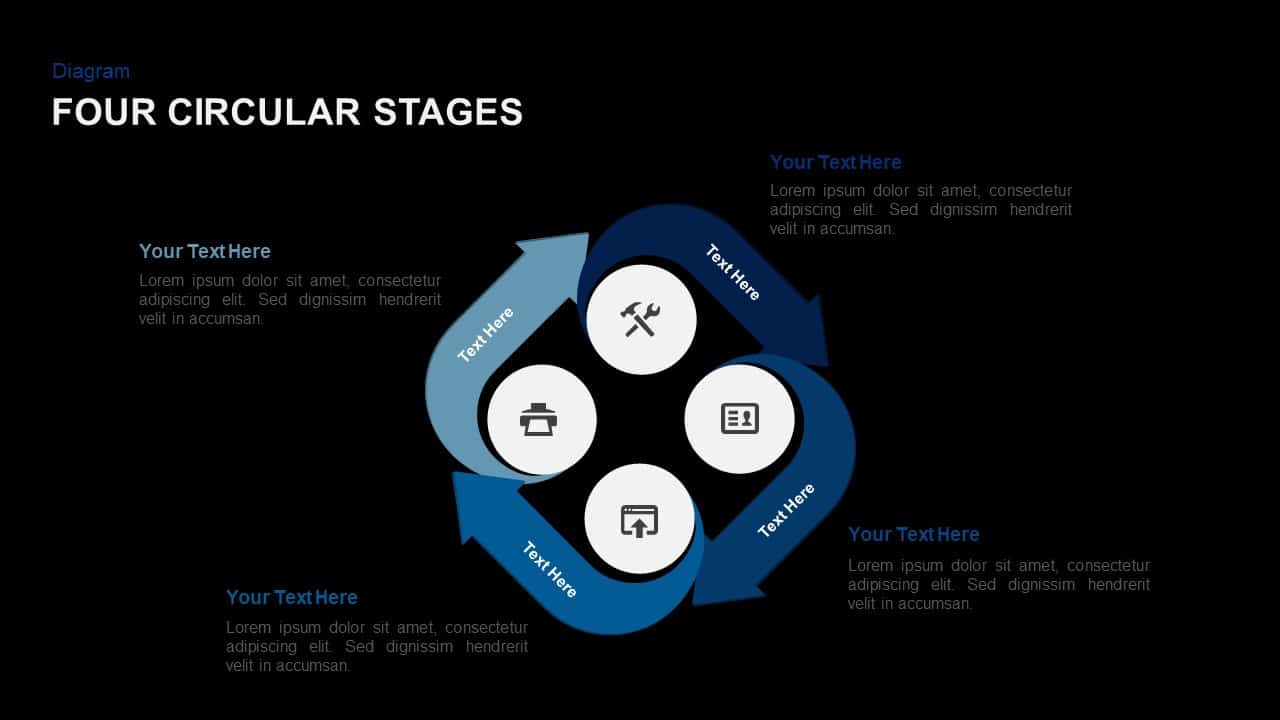
Four-Segment Circular Arrow Cycle Template for PowerPoint & Google Slides
Description
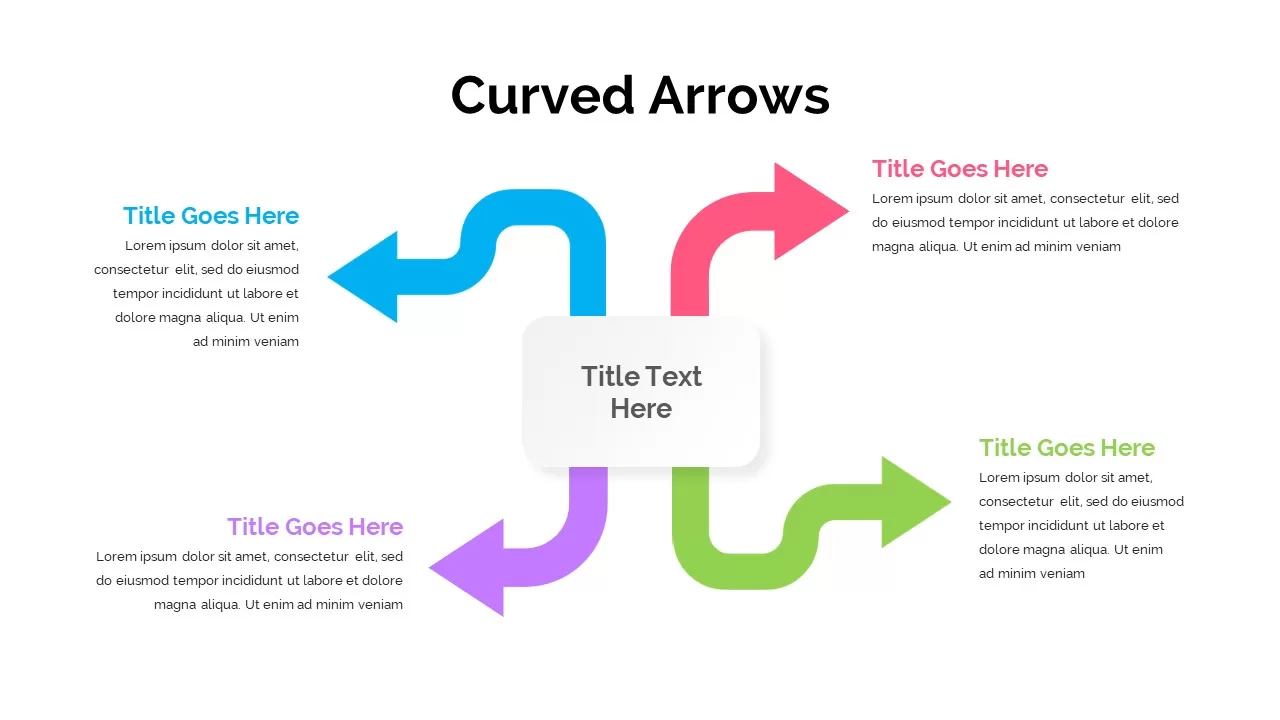
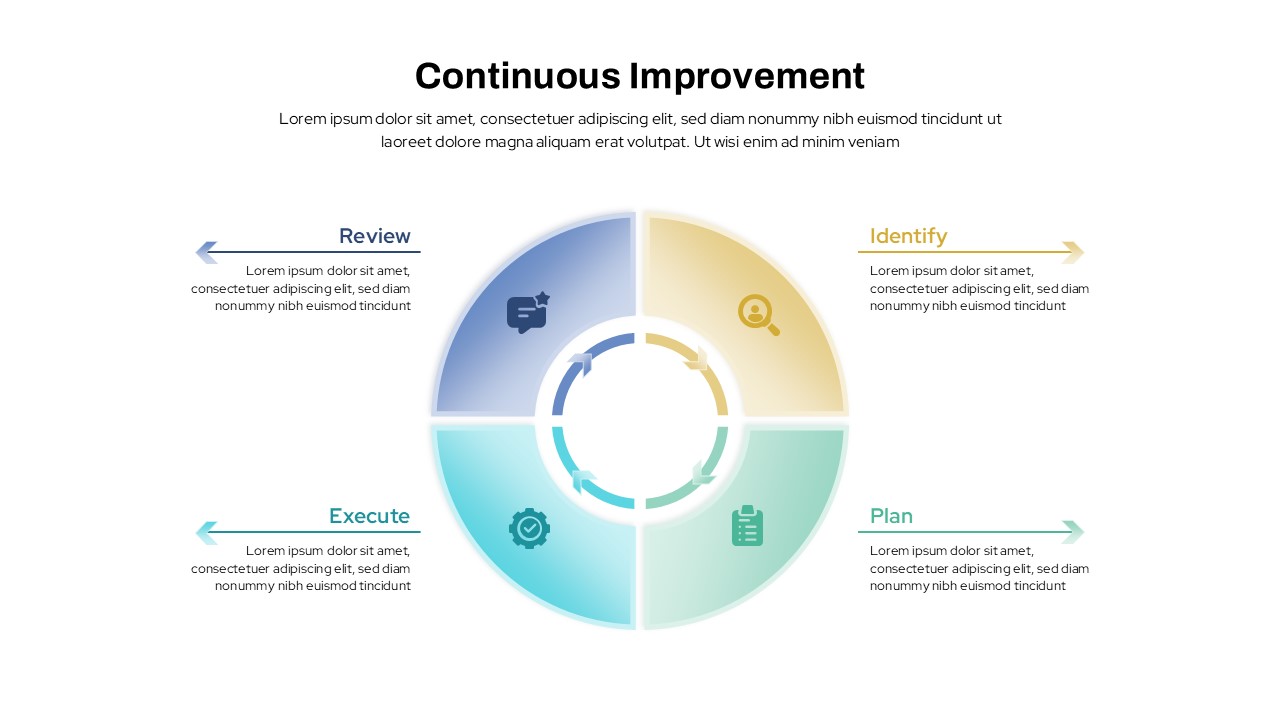
This slide features a vibrant four-segment circular arrow cycle infographic built to visualize continuous workflows, feedback loops, or iterative processes. Four gradient-filled arcs—rendered in teal, orange, yellow, and lime green—curve seamlessly around a central raised circle, each culminating in a distinct arrowhead that reinforces directional flow. Surrounding the ring, fine dotted outlines and subtle drop shadows add dimension, while slender connector lines guide viewers to four adjacent callout areas. Each callout includes a bold heading placeholder and supporting text box, all set in a clean sans-serif typeface to ensure maximum readability.
Developed as a fully editable master slide for PowerPoint and Google Slides, this design leverages vector shapes and gradient fills for crisp, scalable graphics. Built-in snap-to-grid alignment guides and optimized layer grouping preserve pixel-perfect placement, even when resizing or rearranging elements. Users can easily adjust arc thickness, swap gradient hues to match corporate branding, or replace connector lines with custom icons. Predefined color themes and text styles mean you can update slide content in seconds without manual formatting or alignment.
The central circle provides an ideal focal point for a headline, core statistic, or company logo, anchoring the visual narrative. Generous white space and balanced composition maintain clarity, while subtle drop shadows reinforce a modern, professional aesthetic. Cross-platform compatibility ensures consistent rendering across Windows, macOS, and web-based editors, eliminating version control issues and formatting errors.
Additionally, hidden placeholder layers allow you to integrate icons or imagery onto each arrow segment for visual milestones or KPI tracking. Drag-and-drop functionality and lightweight file sizing ensure smooth performance in large decks and quick loading on tablets or web viewers.
Who is it for
Project managers, process improvement specialists, and business analysts who need to depict iterative workflows, continuous improvement models, or lifecycle stages with clarity and visual impact.
Other Uses
Repurpose this circular diagram to map customer journey loops, sustainability cycles, KPI dashboards, or risk assessment phases. Hide or duplicate callouts to suit any number of stages.
Login to download this file

Item ID
SB02760
Related Templates

Three-Segment Circular Arrow Cycle Template for PowerPoint & Google Slides
Circular
Six-Segment Circular Arrow Cycle Template for PowerPoint & Google Slides
Circular
Seven-Segment Circular Arrow Diagram Template for PowerPoint & Google Slides
Arrow
Six-Segment Circular Arrow Infographic Template for PowerPoint & Google Slides
Circular
Four-Point Arrow Cycle Diagram Template for PowerPoint & Google Slides
Arrow

Pie Segment Diagram Four-Step Process Template for PowerPoint & Google Slides
Pie/Donut
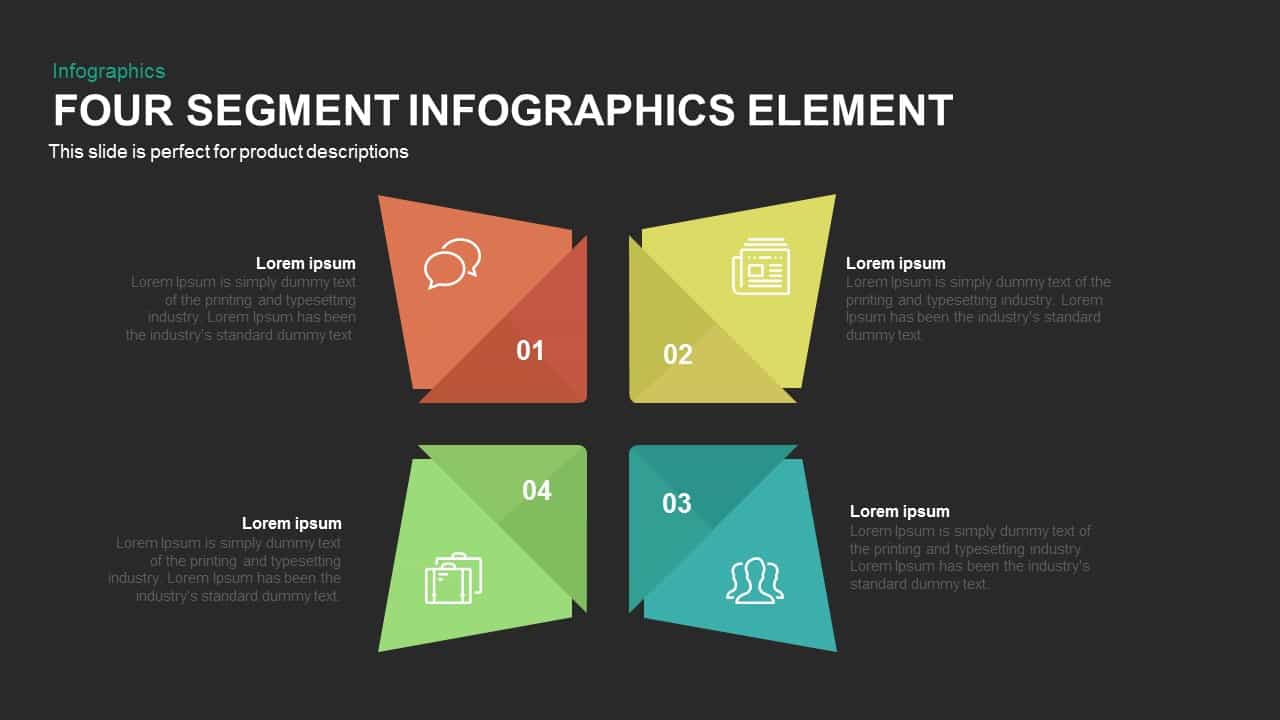
Four Segment Infographics Element Template for PowerPoint & Google Slides
Comparison
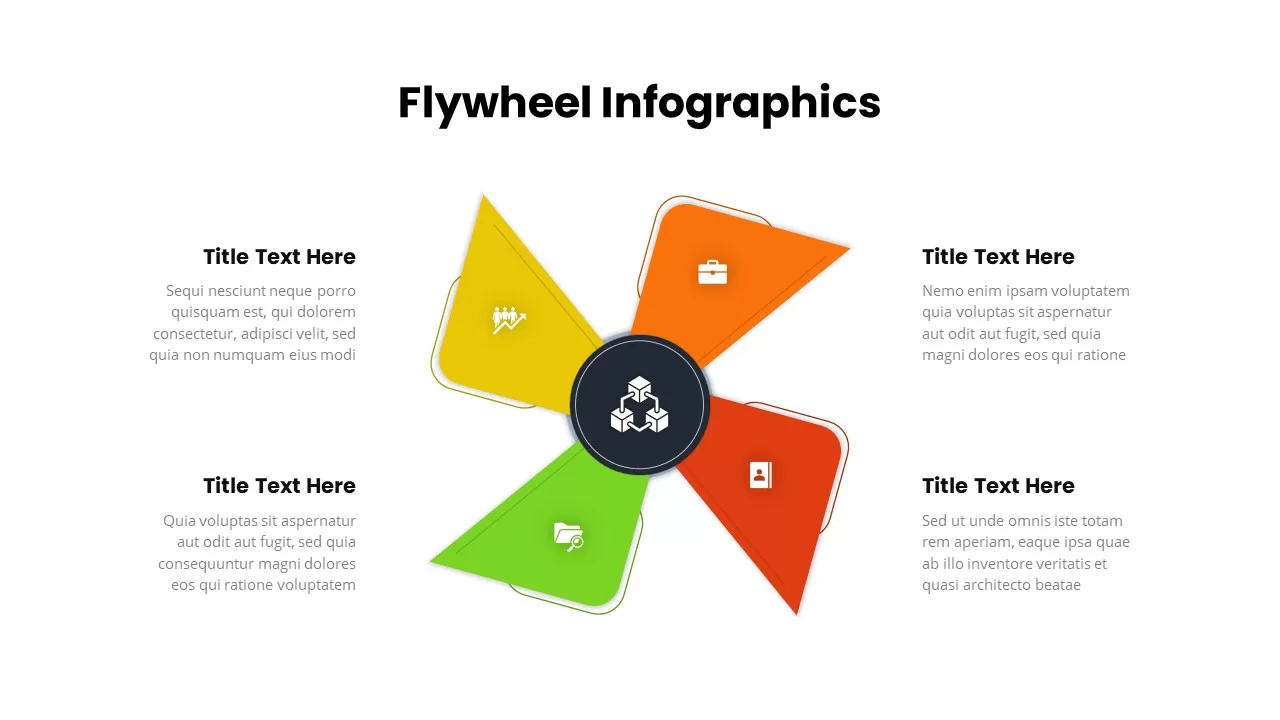
Four-Segment Flywheel Infographic Model Template for PowerPoint & Google Slides
Process
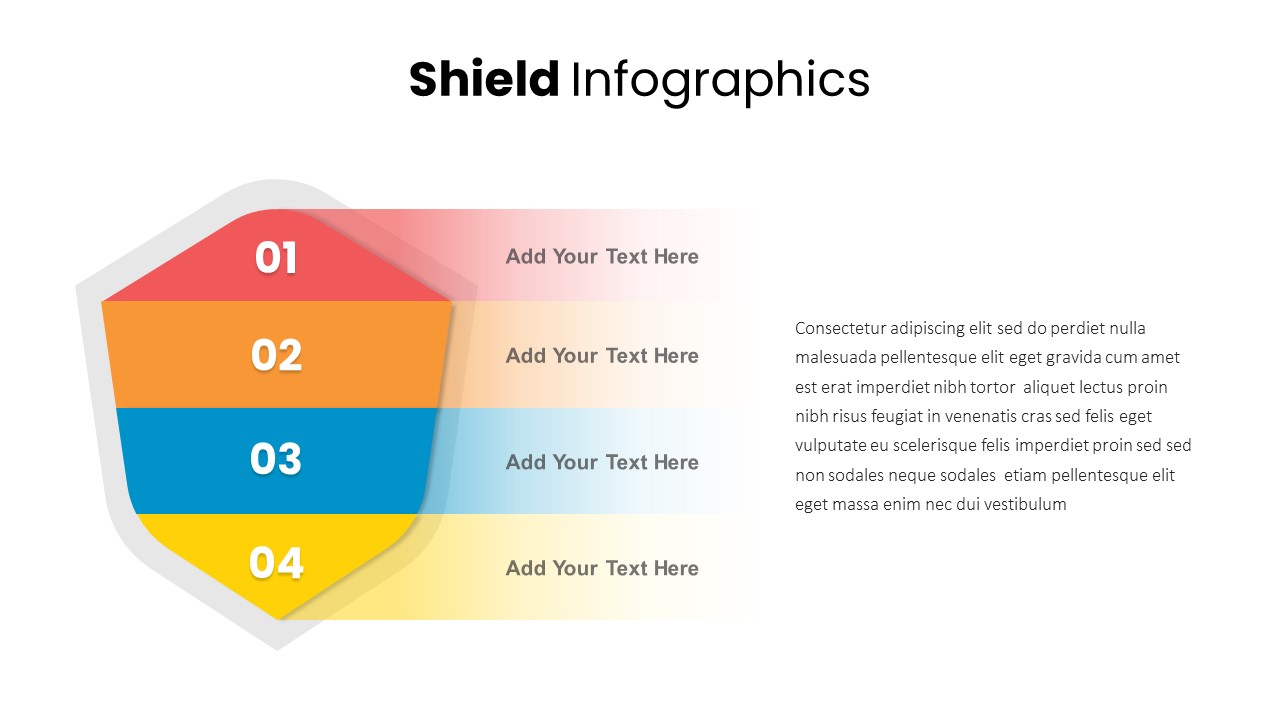
Shield Four-Segment Infographic Template for PowerPoint & Google Slides
Process
Colorful Four-Segment Wheel Chart Template for PowerPoint & Google Slides
Circular
Concentric Circular Arrow Cycle Diagram Template for PowerPoint & Google Slides
Process
Dual-Stage Circular Arrow Cycle Template for PowerPoint & Google Slides
Process
Eight-Segment 3D Arrow Infographics Template for PowerPoint & Google Slides
Arrow
Six-Segment Circular Hub Infographic Template for PowerPoint & Google Slides
Circular
Six Segment Hexagon Circular Diagram Template for PowerPoint & Google Slides
Circular
Circular 3D Cube Six-Segment Diagram Template for PowerPoint & Google Slides
Infographics
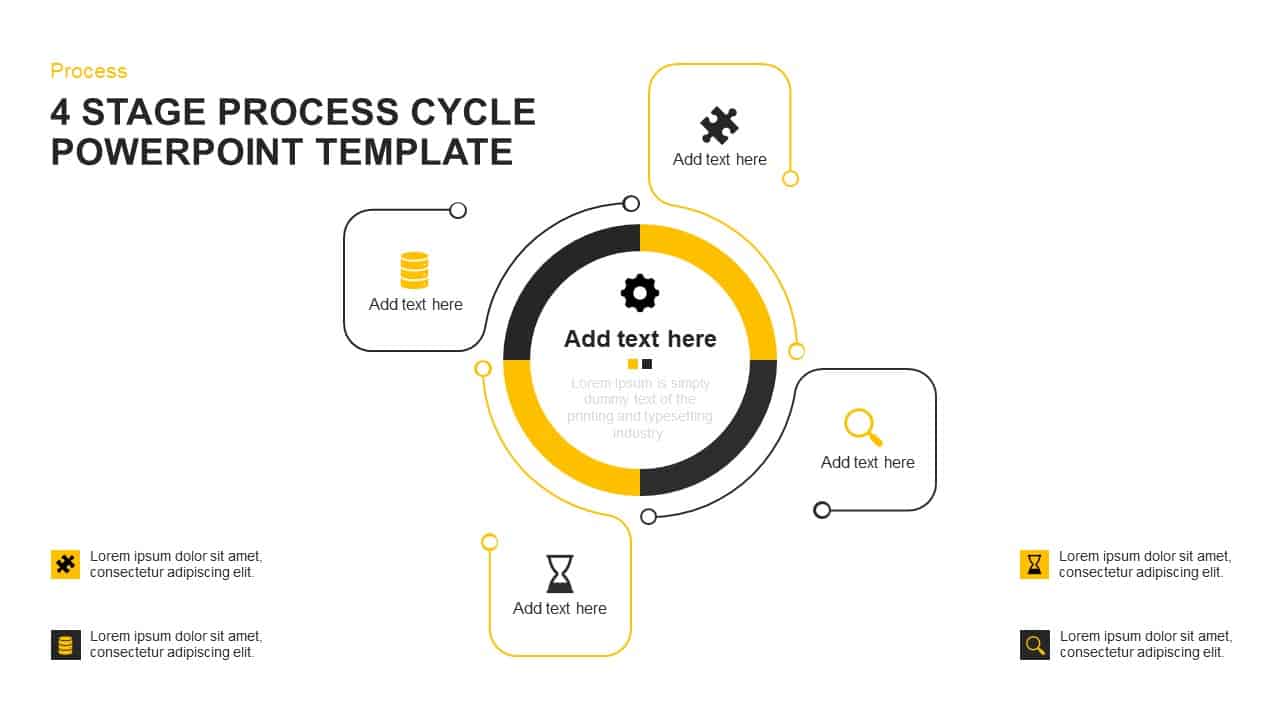
Four-Stage Cycle Process Diagram Template for PowerPoint & Google Slides
Process
Four-Stage Process Cycle Variations Pack Template for PowerPoint & Google Slides
Process
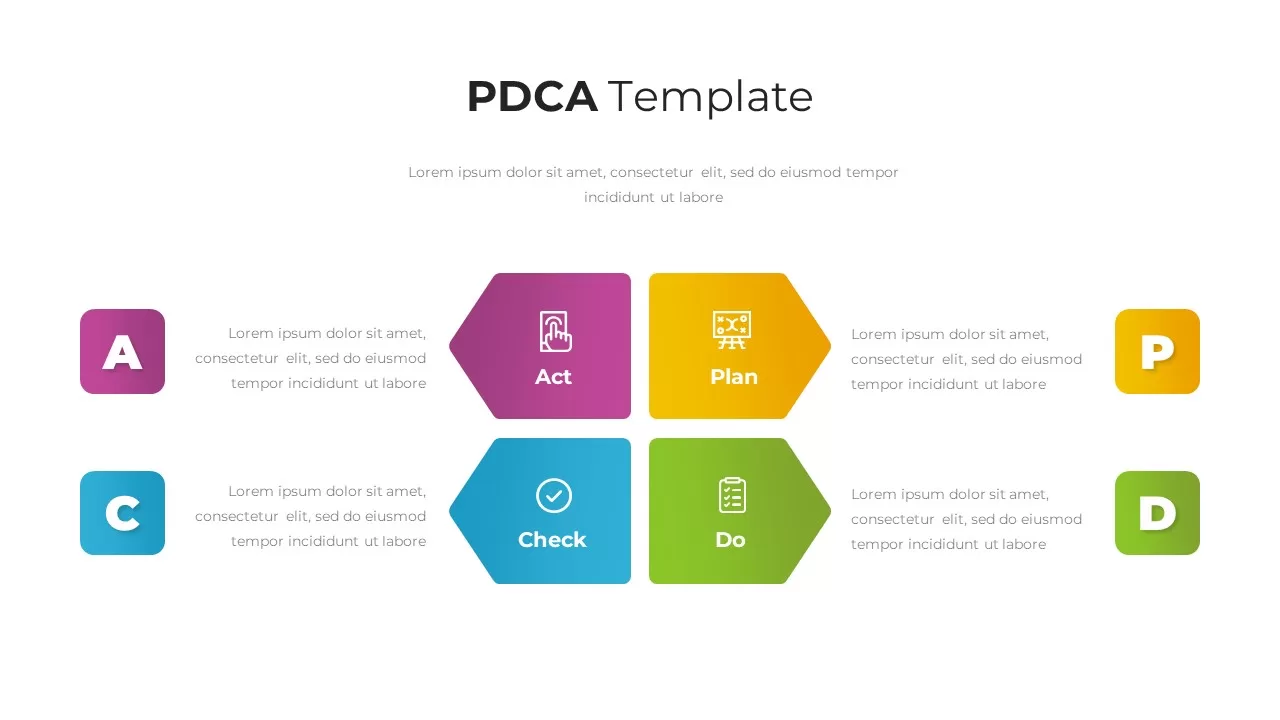
PDCA Cycle Infographic with Four Stages Template for PowerPoint & Google Slides
Process
PDCA Four-Stage Cycle Infographic Template for PowerPoint & Google Slides
Process
Six-Stage Circular Cycle Diagram Template for PowerPoint & Google Slides
Process
3, 4 & 5 Circular Stages Cycle Diagram Deck Template for PowerPoint & Google Slides
Circular
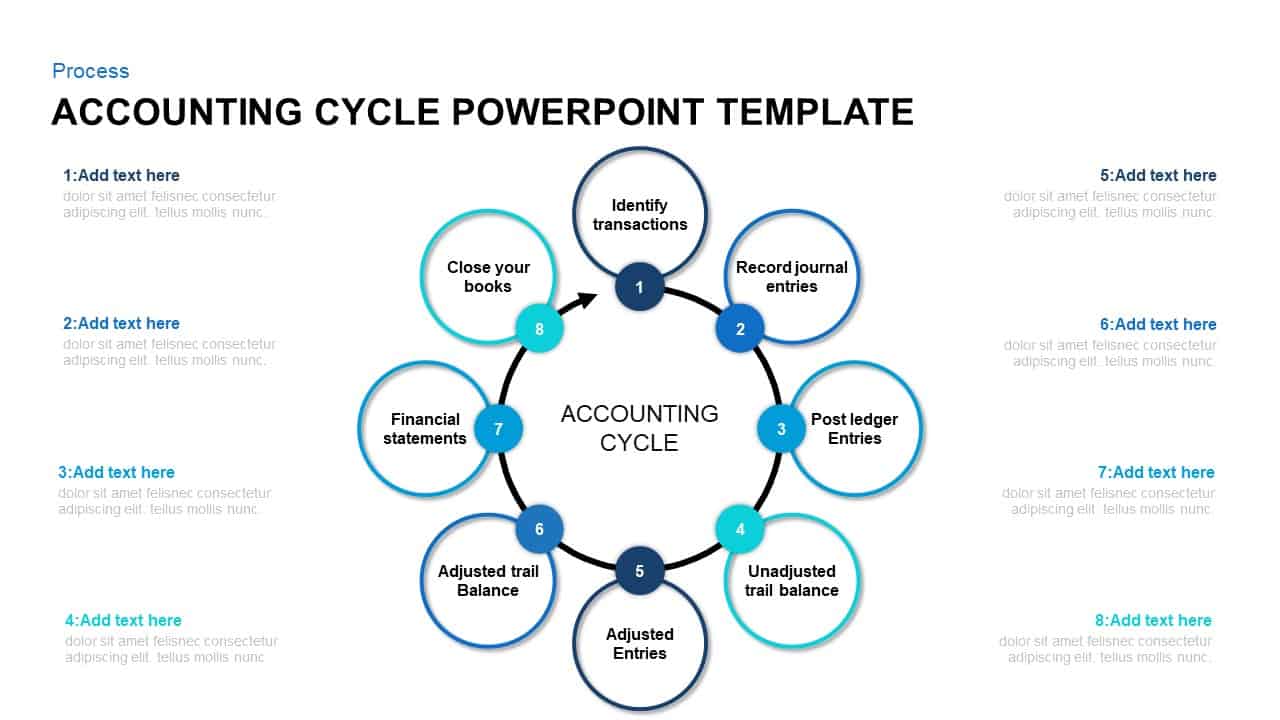
8-Step Circular Accounting Cycle Diagram Template for PowerPoint & Google Slides
Accounting

4MAT Learning Cycle Circular Diagram Template for PowerPoint & Google Slides
Circular
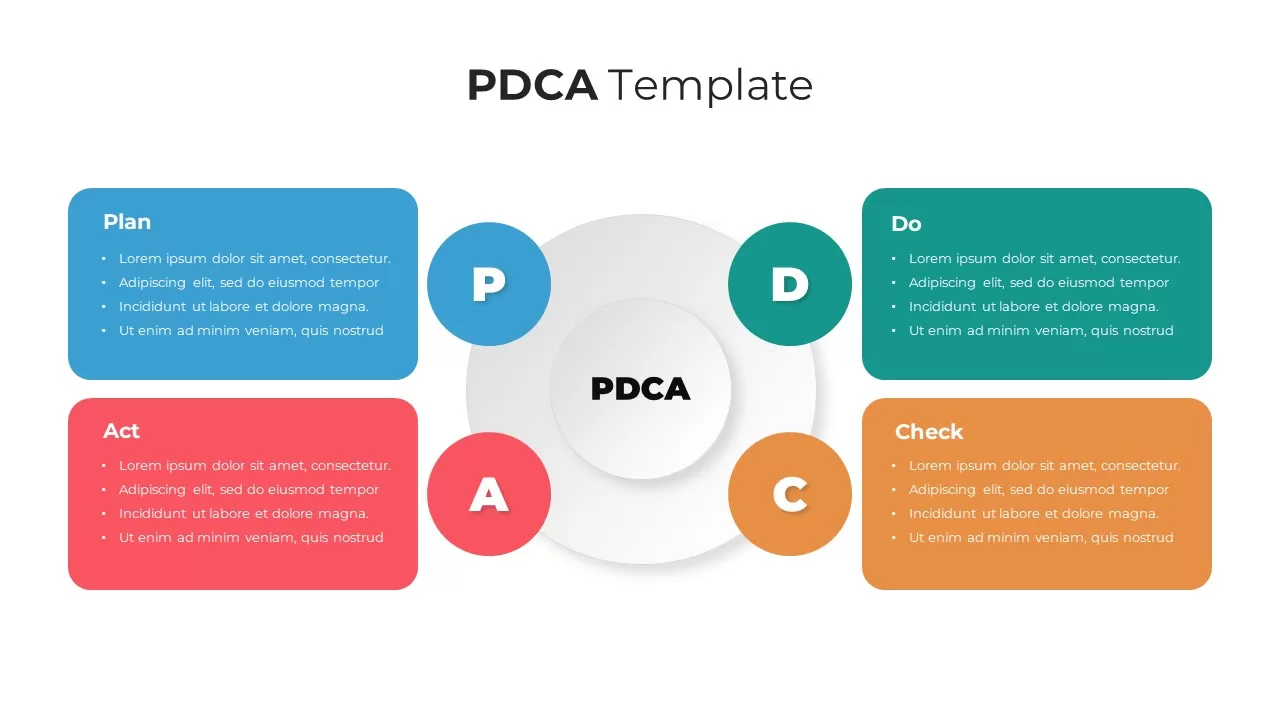
4-Step Circular PDCA Cycle Diagram Template for PowerPoint & Google Slides
Process
Release Management Cycle Circular Diagram Template for PowerPoint & Google Slides
Software Development
Circle Segment Sales Metrics Infographic Template for PowerPoint & Google Slides
Circular
Multi-Segment Circle Split Diagram template for PowerPoint & Google Slides
Circular

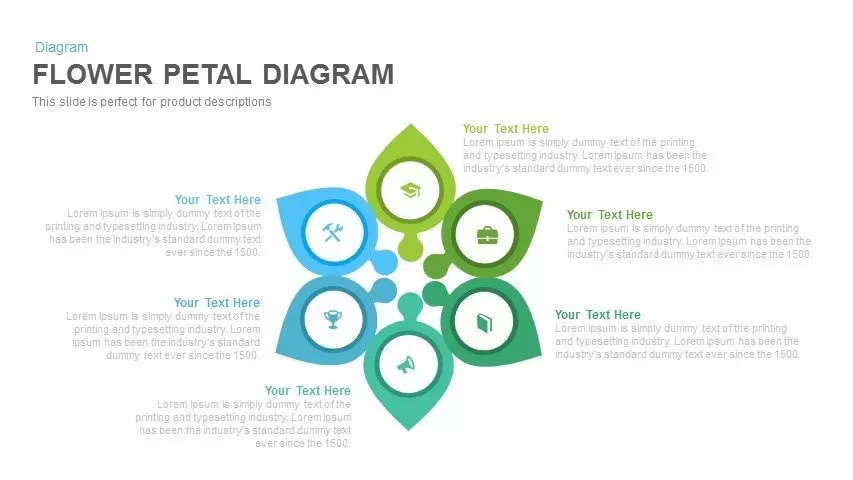
Six-Segment Flower Petal Diagram Template for PowerPoint & Google Slides
Circular
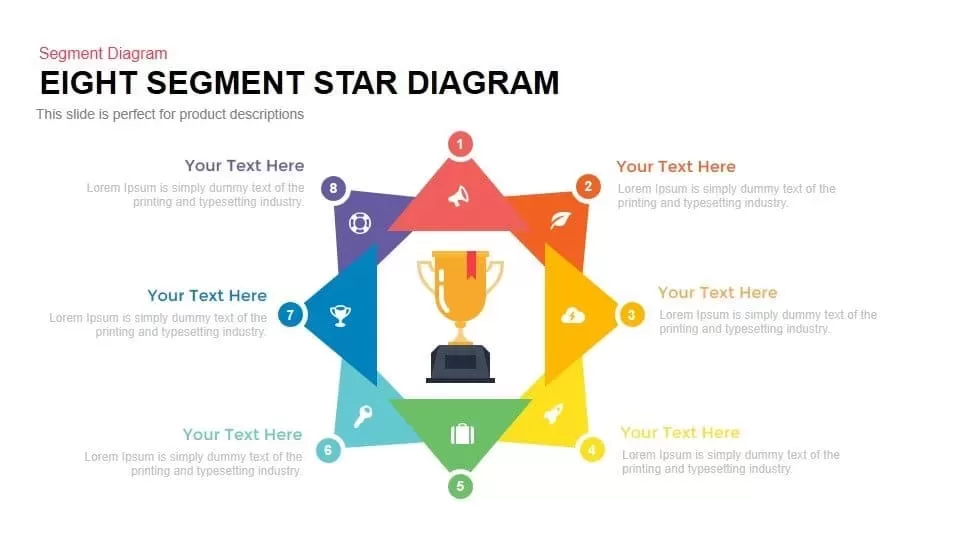
Eight Segment Star Diagram Infographic Template for PowerPoint & Google Slides
Process
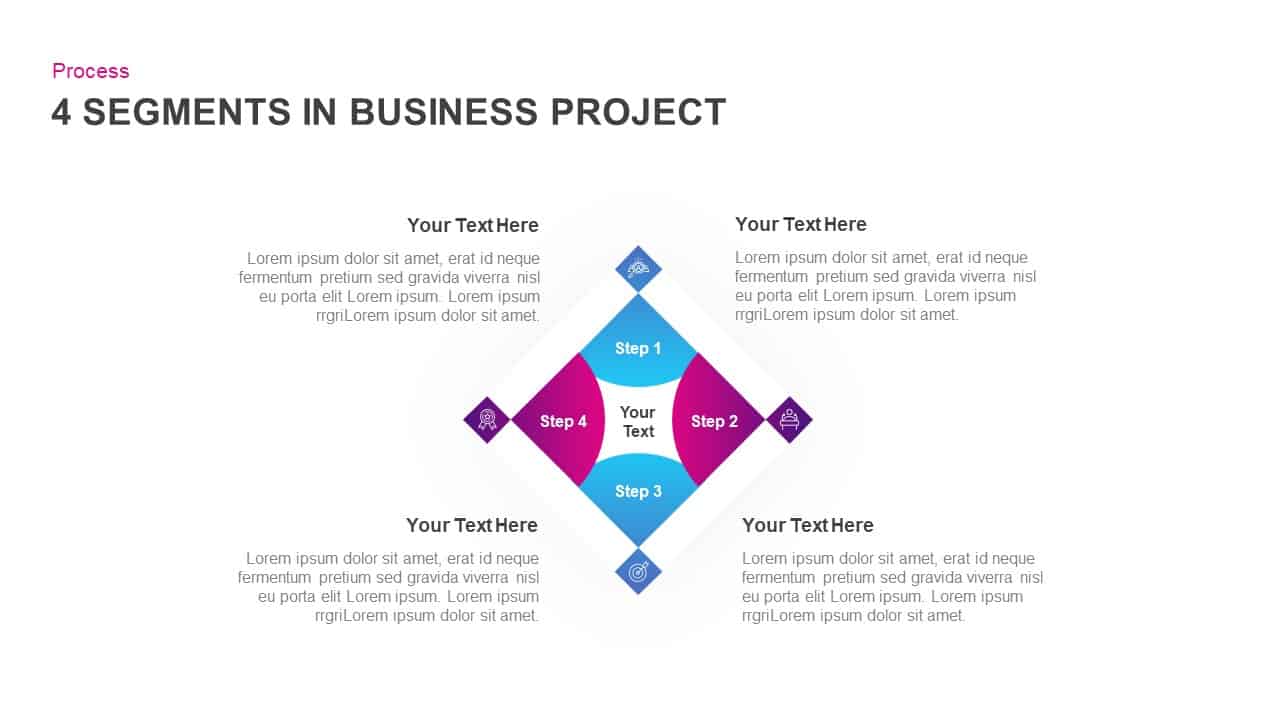
4-Segment Business Project Diamond Diagram Template for PowerPoint & Google Slides
Process
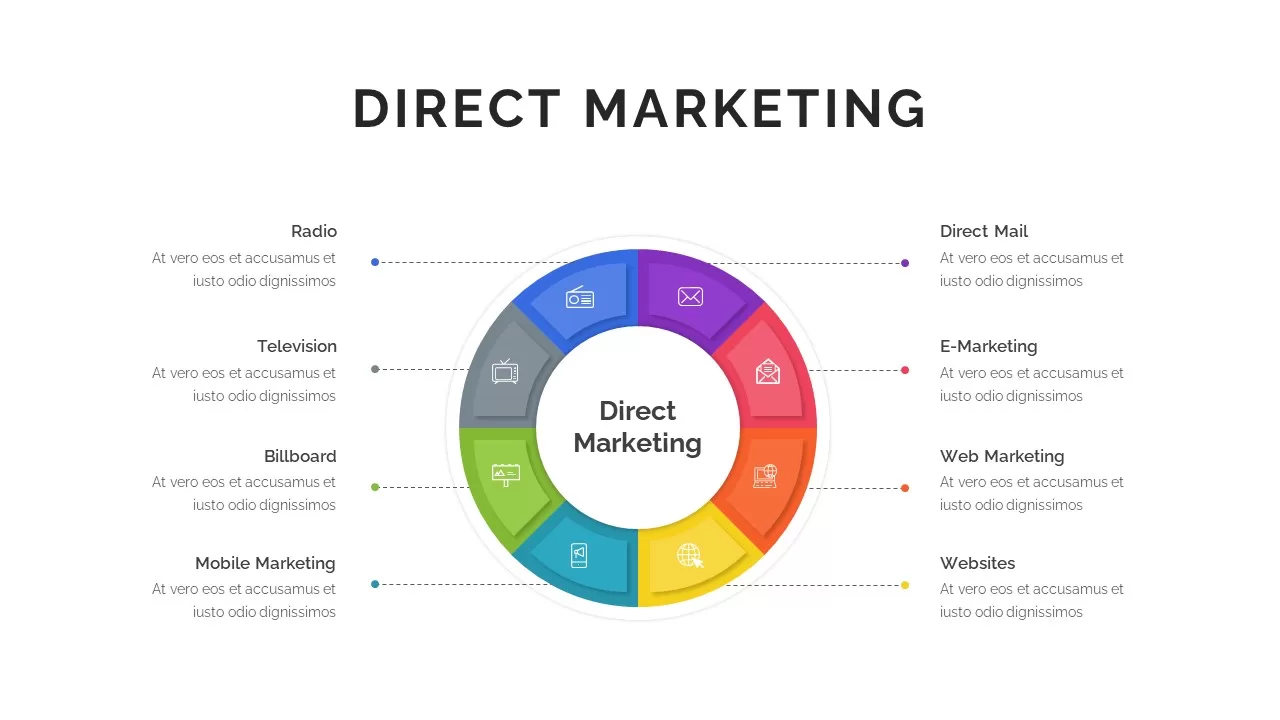
Eight-Segment Direct Marketing Wheel Template for PowerPoint & Google Slides
Circular
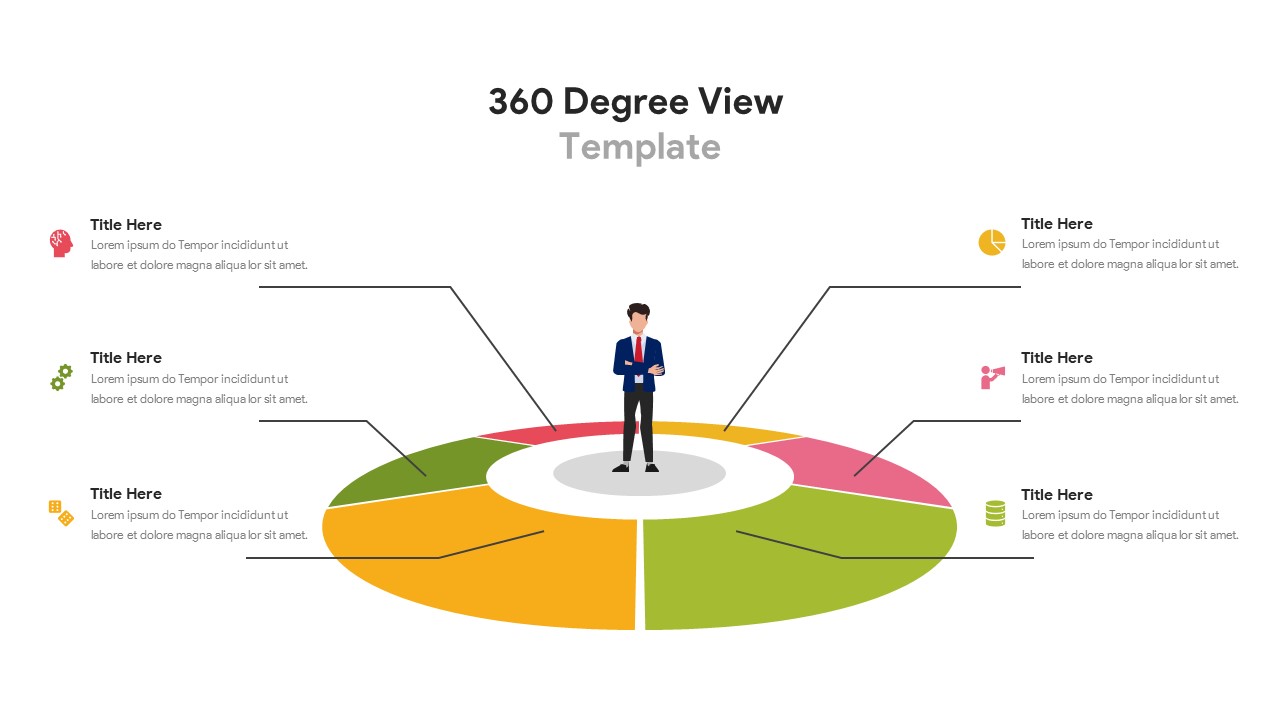
Six-Segment 360 Degree View Infographic Template for PowerPoint & Google Slides
Circular
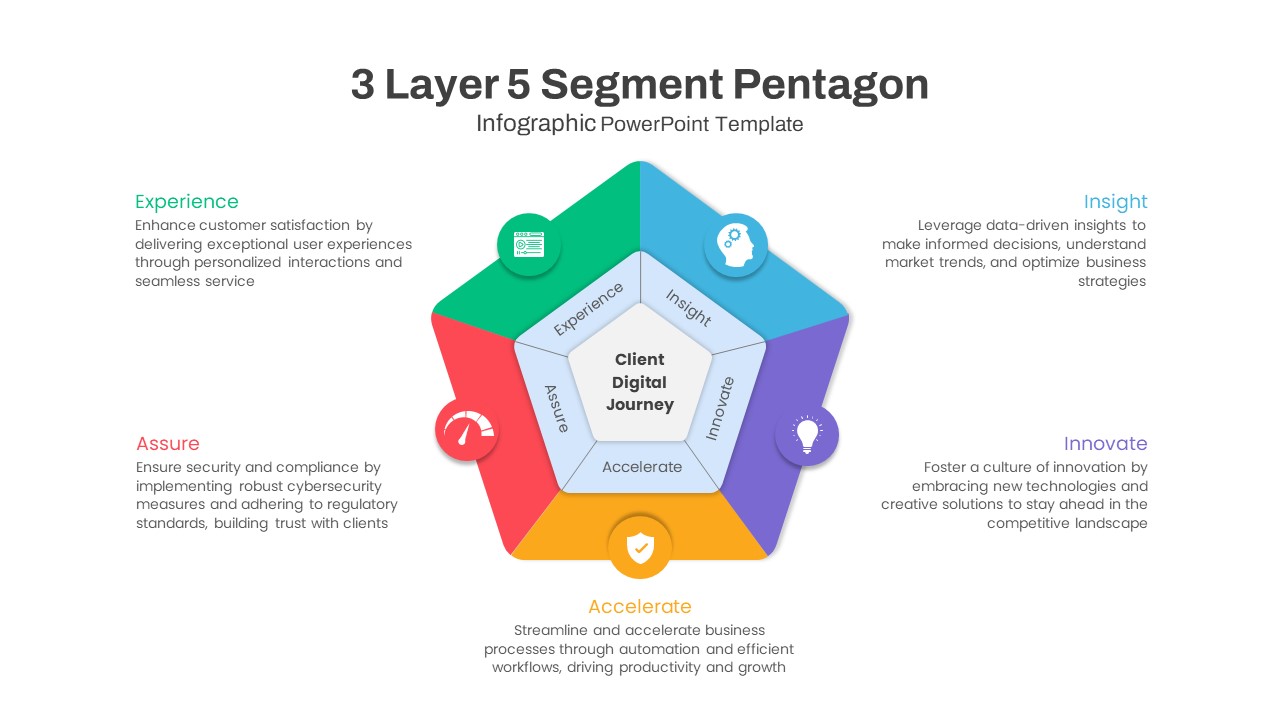
Five-Segment Pentagon Digital Journey Template for PowerPoint & Google Slides
Process
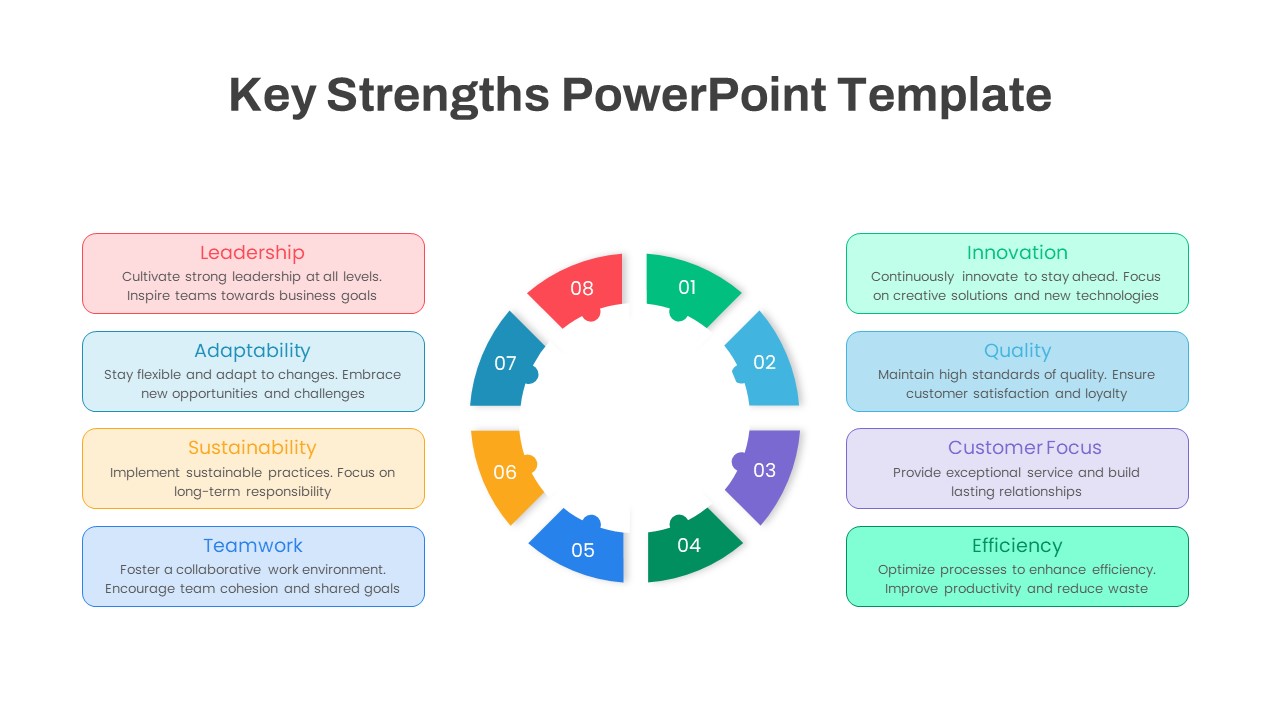
Eight-Segment Key Strengths Diagram Template for PowerPoint & Google Slides
Circular
Three Segment Donut Chart KPI Infographic Template for PowerPoint & Google Slides
Pie/Donut
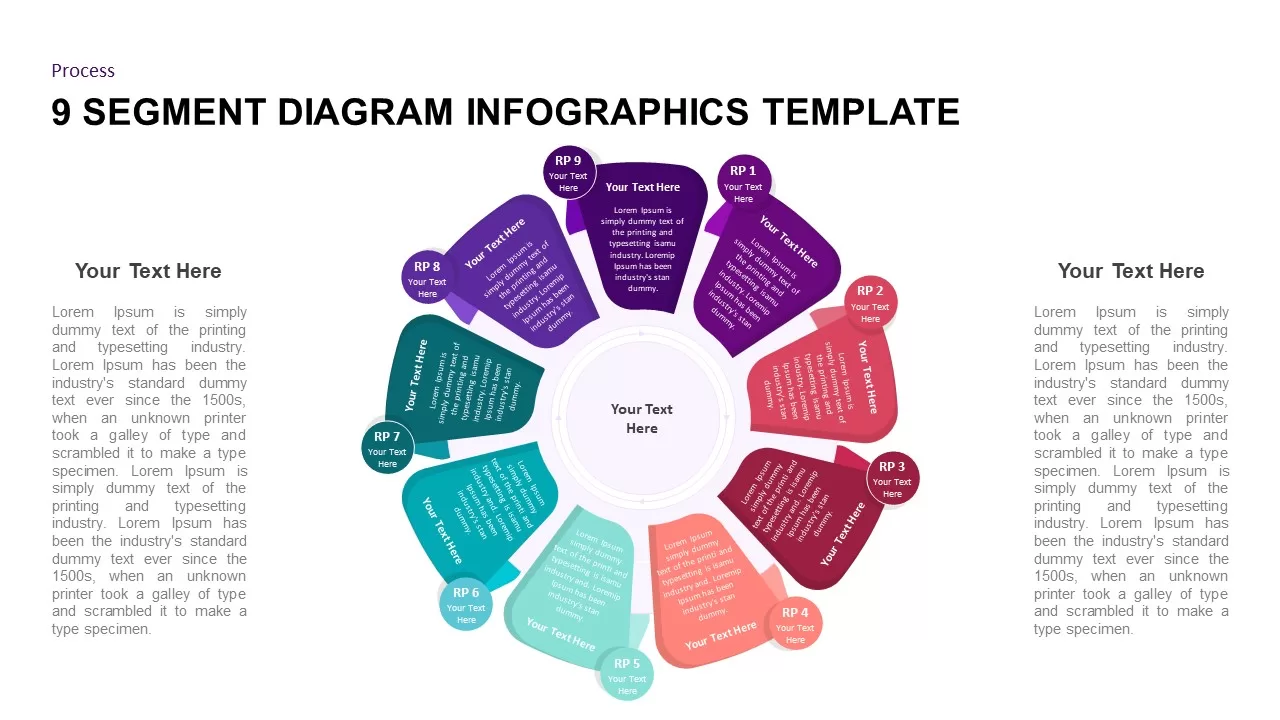
9 Segment Diagram Infographics for PowerPoint & Google Slides
Process
3D Four Arrow Infographics Diagram Template for PowerPoint & Google Slides
Arrow
Four Arrow Square Infographics Template for PowerPoint & Google Slides
Arrow
Four Swoosh Arrow Infographics template for PowerPoint & Google Slides
Arrow
Four Directional Arrow Diagram Template for PowerPoint & Google Slides
Arrow
3D Four-Directional Arrow Infographics Template for PowerPoint & Google Slides
Arrow
Four-Way Directional Arrow Diagram Template for PowerPoint & Google Slides
Arrow
Four-Section Arrow Infographic Diagram Template for PowerPoint & Google Slides
Arrow

Four-Staged Business Arrow Diagram Template for PowerPoint & Google Slides
Process
Four-Step Arrow Process Infographic Template for PowerPoint & Google Slides
Arrow
Four-Option 4-Step Arrow Infographic Template for PowerPoint & Google Slides
Arrow
Four-Step Curved Arrow Process Template for PowerPoint & Google Slides
Process
Four-Stage Circle Arrow Infographic Template for PowerPoint & Google Slides
Circular
Four-Arrow Curved Hub-and-Spoke Diagram Template for PowerPoint & Google Slides
Arrow
Hand-Drawn Four-Step Curved Arrow Diagram Template for PowerPoint & Google Slides
Arrow
Four-Stage Circle Arrow Infographic Template for PowerPoint & Google Slides
Circular
Four-Step Curved Arrow Diagram Template for PowerPoint & Google Slides
Arrow
Four-Step Arrow Reference Diagram Slide Template for PowerPoint & Google Slides
Arrow
Four-Stage Business Circular Diagram Template for PowerPoint & Google Slides
Process
Four Section Circular Text Boxes Diagram Template for PowerPoint & Google Slides
Circular
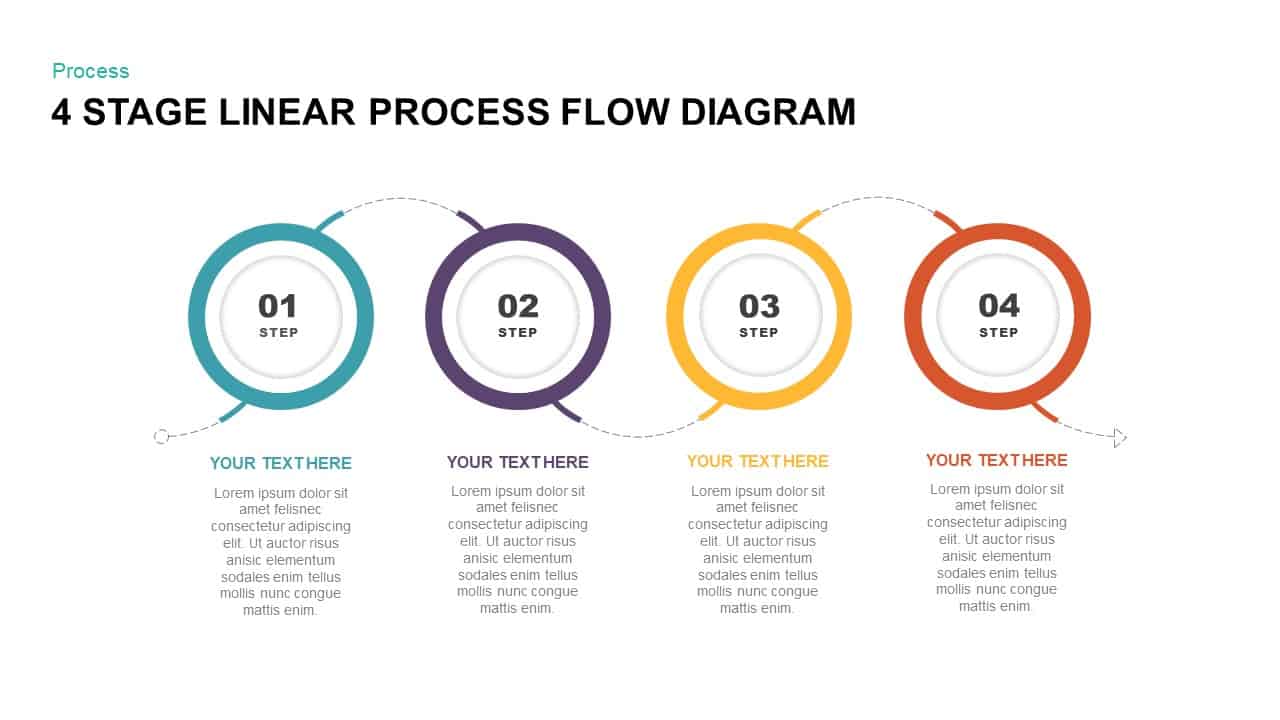
Four-Stage Circular Process Flow Template for PowerPoint & Google Slides
Process
Four-Stage Circular Diagram Infographic Template for PowerPoint & Google Slides
Circular
Four-Stage Circular Flow Diagram Template for PowerPoint & Google Slides
Circular
Four-Step Circular Process Infographics Template for PowerPoint & Google Slides
Circular
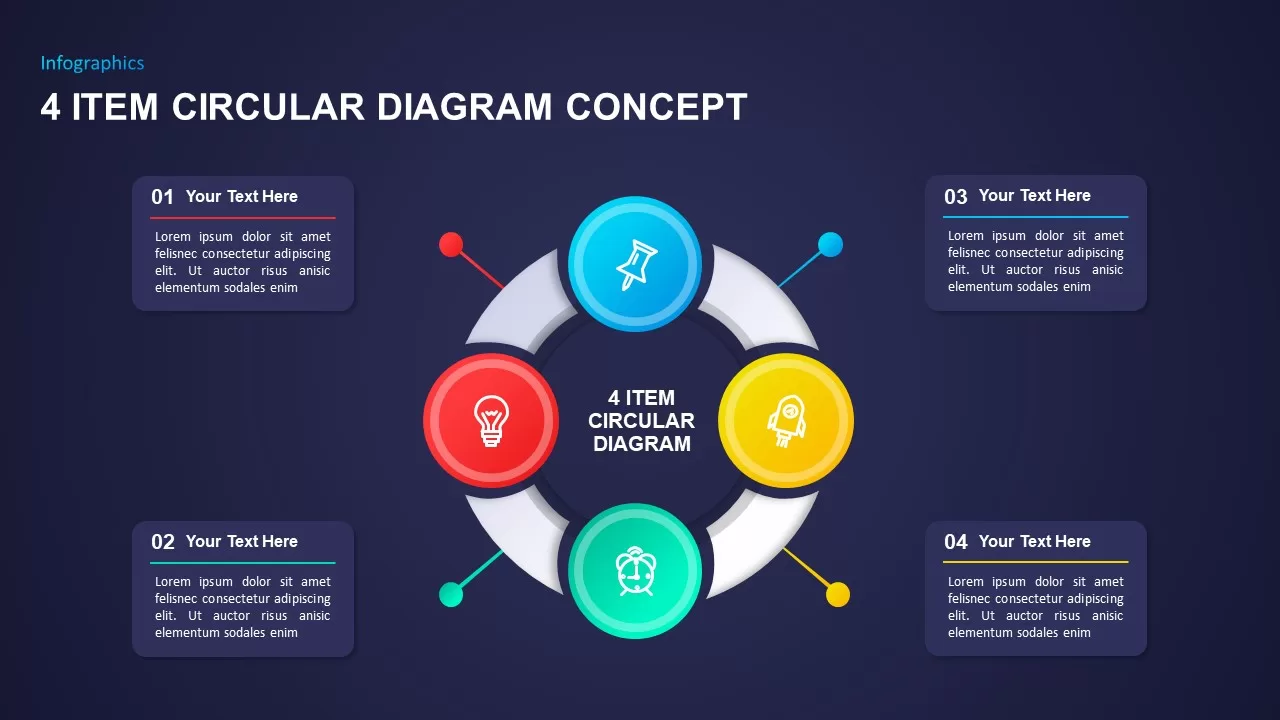
Four-Item Circular Diagram Concept Template for PowerPoint & Google Slides
Circular
Layered Circular Four-Step Agenda Slide Layout Template for PowerPoint & Google Slides
Agenda
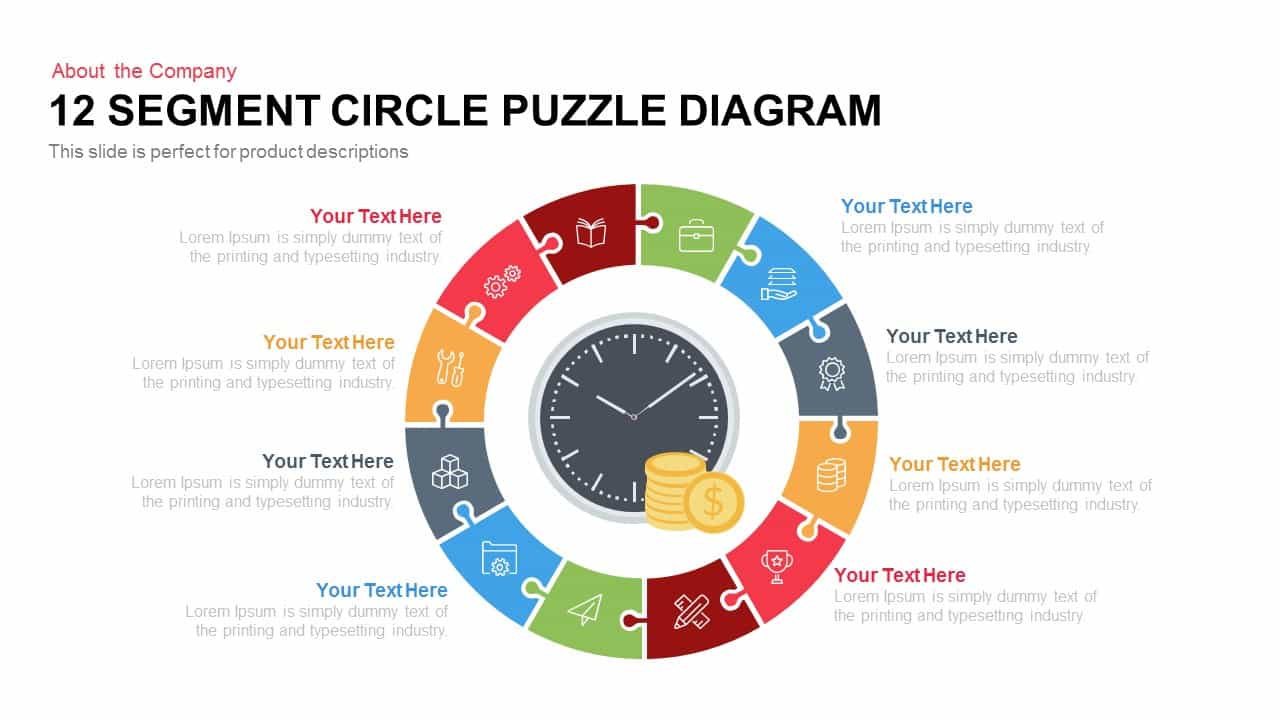
12 Segment Circle Puzzle Diagram Template for PowerPoint and Keynote
Circular
3D Arrow Infographics Circular Flow Template for PowerPoint & Google Slides
Arrow
Five-Section Circular Arrow Diagram Template for PowerPoint & Google Slides
Circular
8-Step Circular Arrow Diagram Template for PowerPoint & Google Slides
Arrow
Six-Process Circular Arrow Diagram Template for PowerPoint & Google Slides
Circular
Five Stage Circular Arrow Diagram Template for PowerPoint & Google Slides
Process
Five-Stage Circular Arrow Infographic Template for PowerPoint & Google Slides
Circular
Circular Arrow Process Diagram Template for PowerPoint & Google Slides
Circular

Five Circular Flow Arrow Diagram for PowerPoint & Google Slides
Arrow
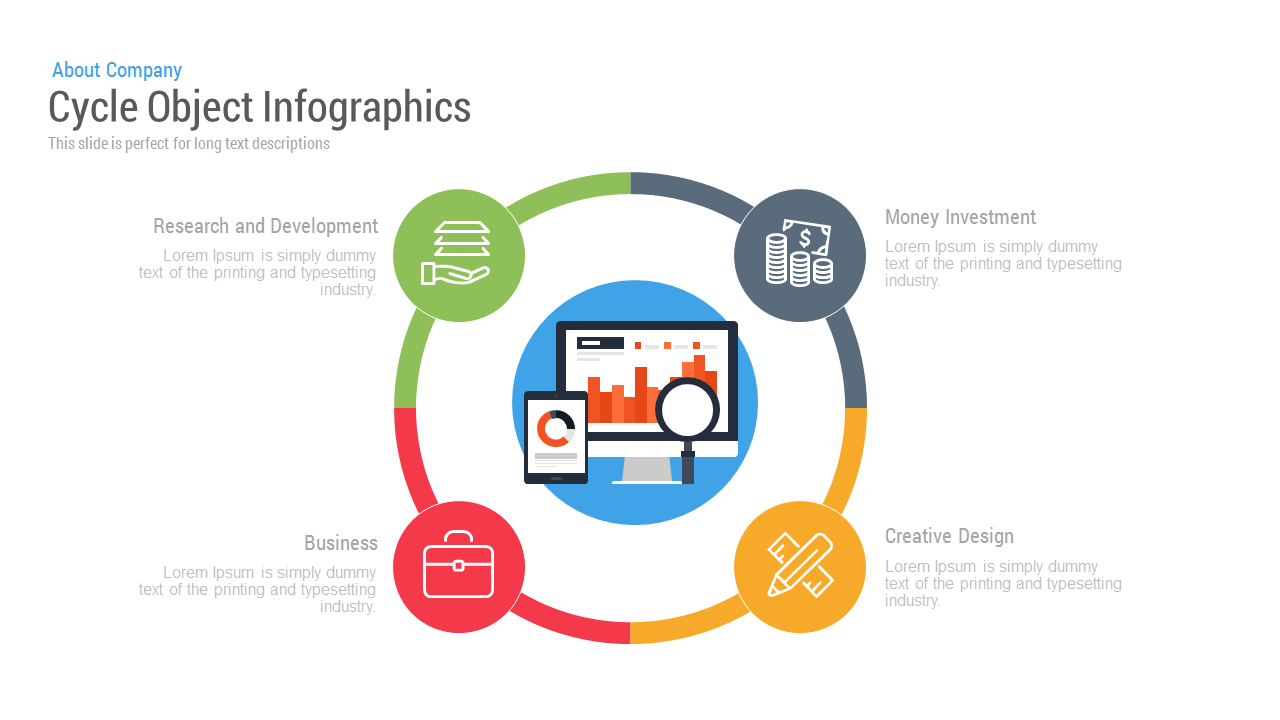
Free Cycle Object Infographics template for PowerPoint & Google Slides
Process
Free
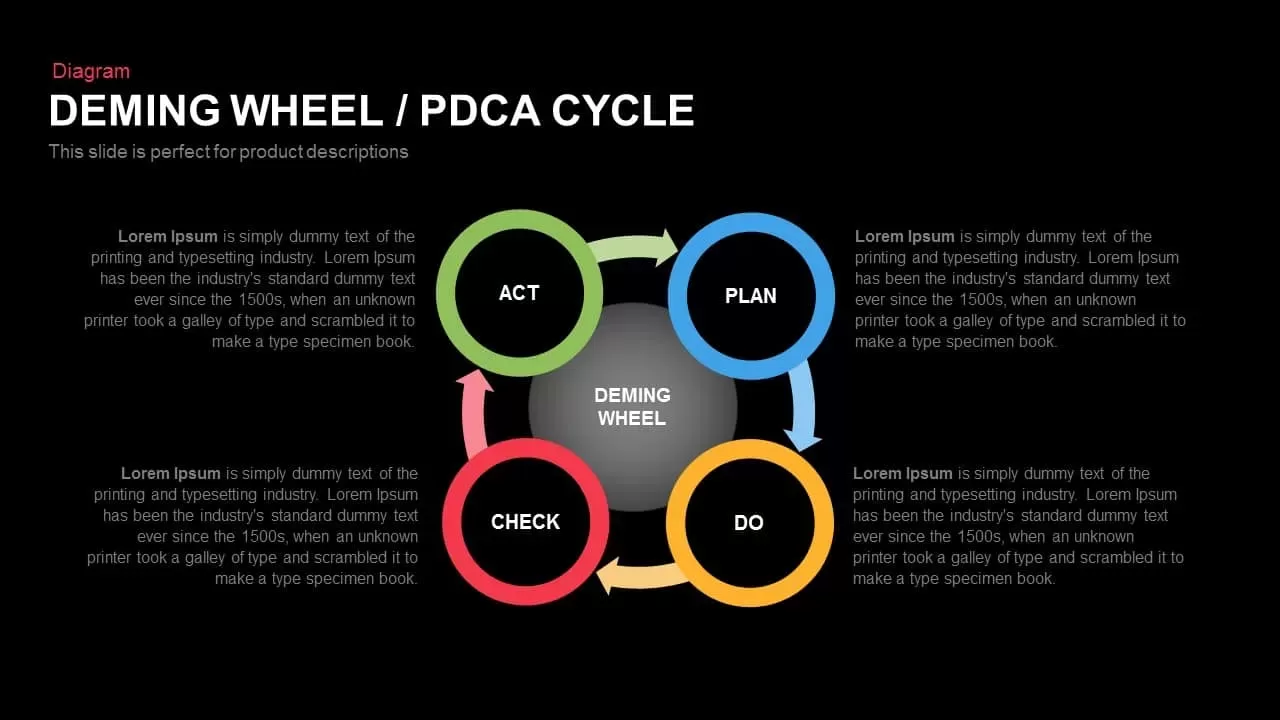
Deming Wheel PDCA Cycle Diagram Template for PowerPoint & Google Slides
Business Plan
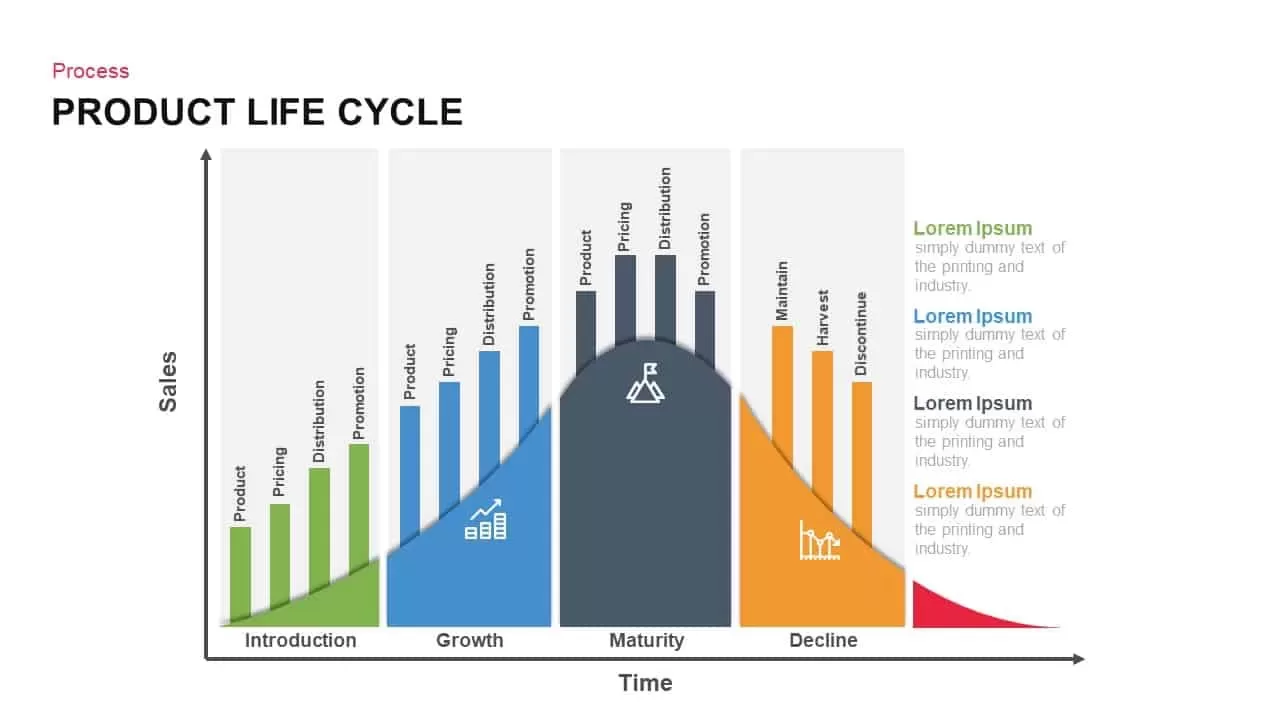
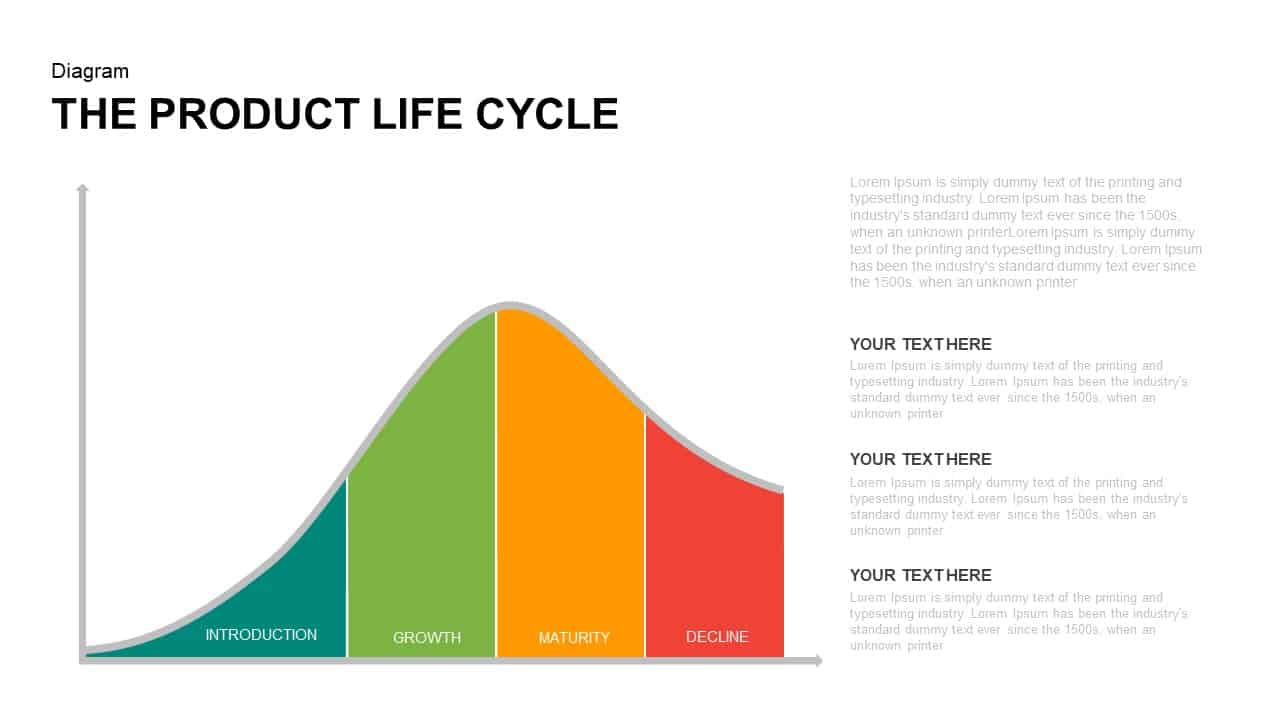
Product Life Cycle Infographics template for PowerPoint & Google Slides
Business
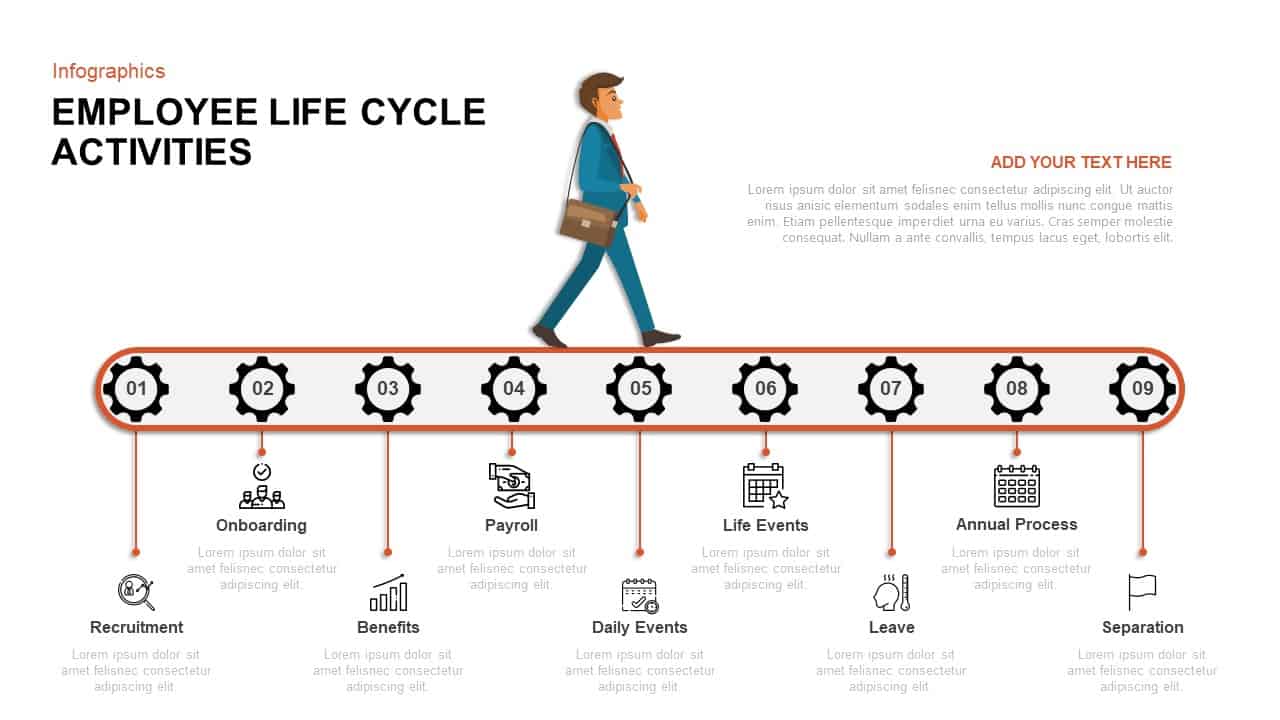
Employee Life Cycle Activities Template for PowerPoint & Google Slides
Timeline
Multi-Style Project Life Cycle Diagram Template for PowerPoint & Google Slides
Process
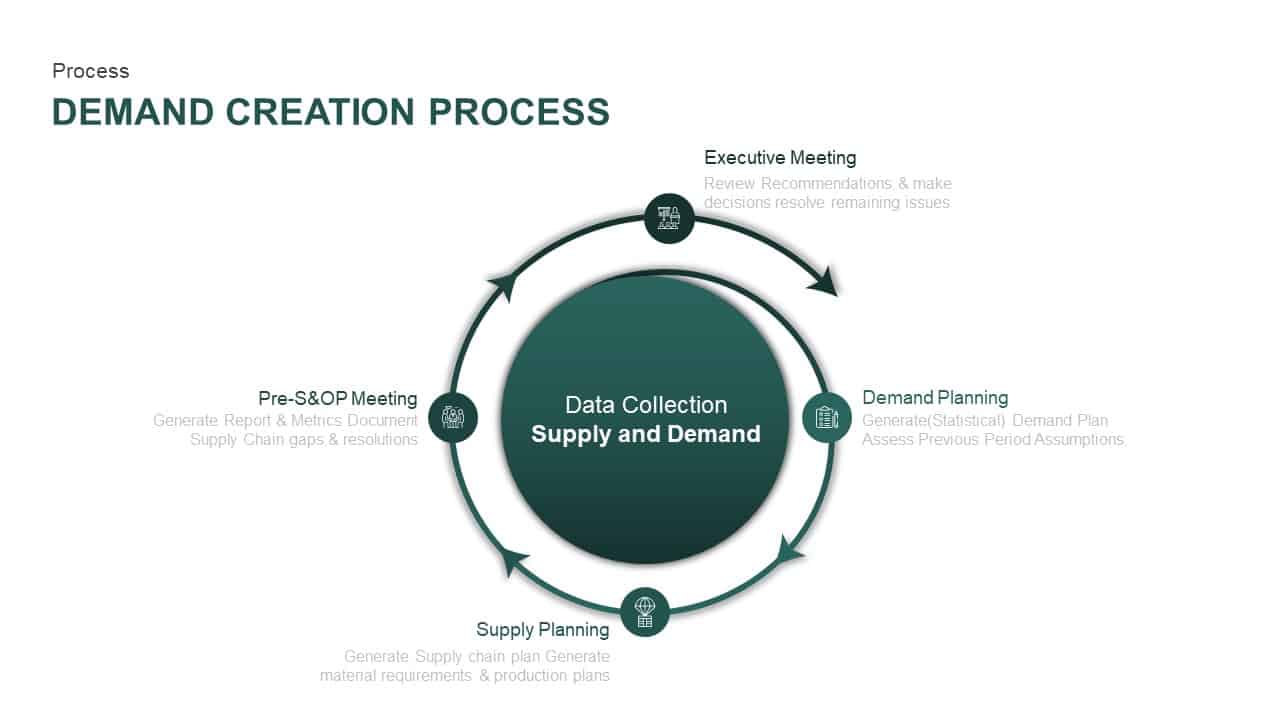
Supply and Demand Creation Cycle Diagram Template for PowerPoint & Google Slides
Process
Strategic ADL Matrix by Industry Life Cycle & Position Template for PowerPoint & Google Slides
Business Strategy
Corporate Product Life Cycle Diagram Template for PowerPoint & Google Slides
Process
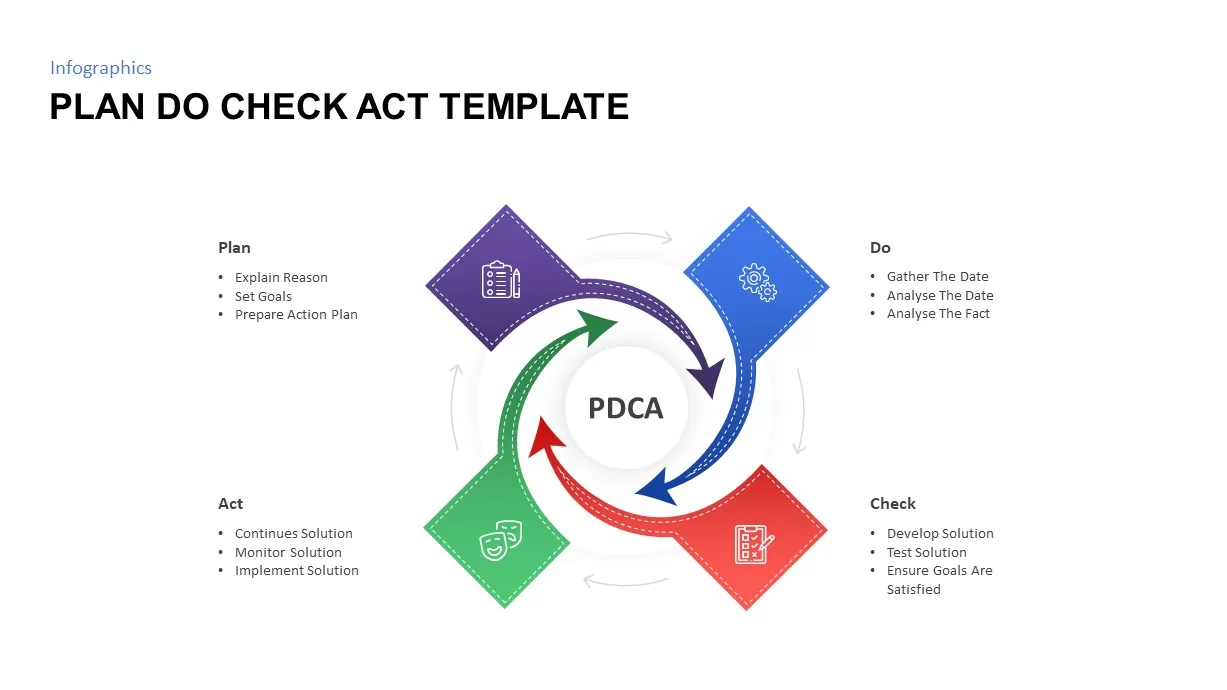
Plan Do Check Act PDCA Cycle Infographic Template for PowerPoint & Google Slides
Process
Enterprise Risk Management Cycle Diagram Template for PowerPoint & Google Slides
Process
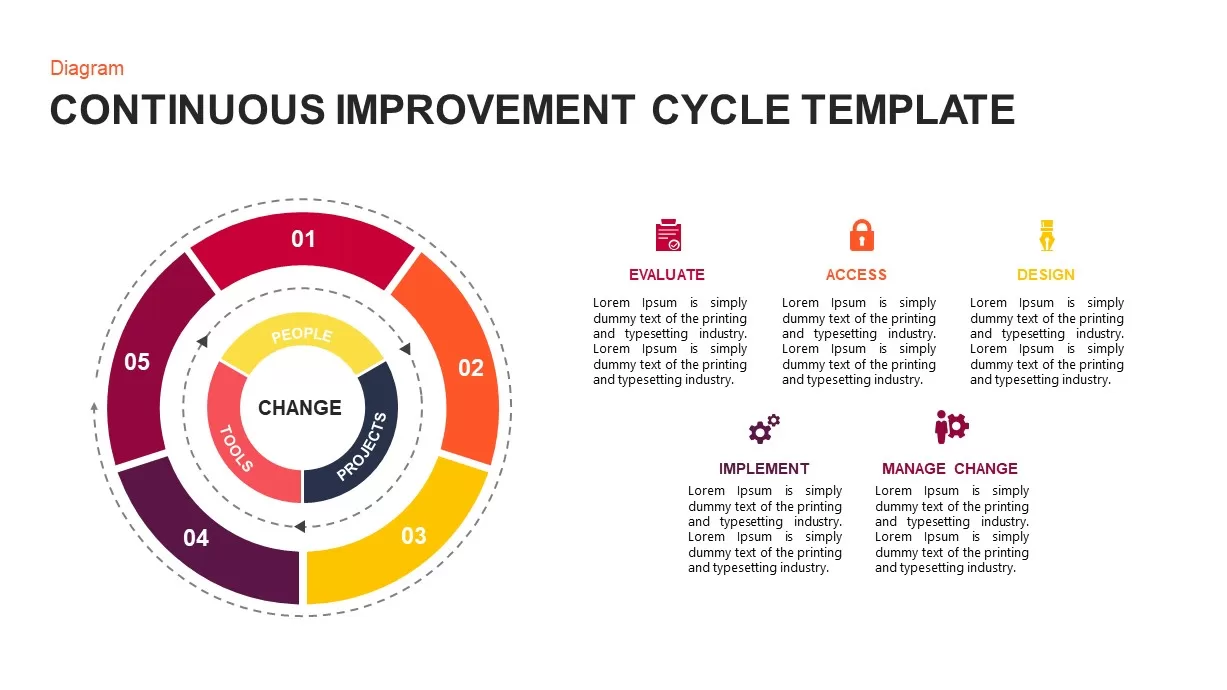
Continuous Improvement Cycle Diagram Template for PowerPoint & Google Slides
Process
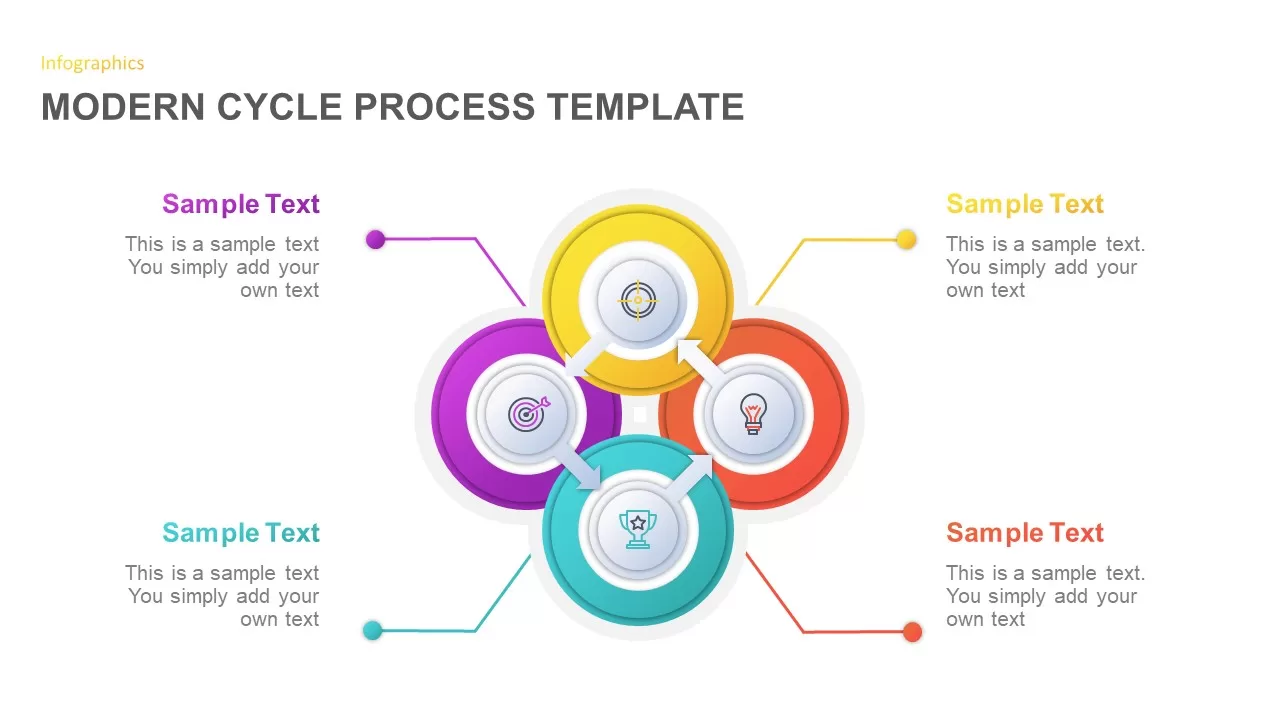
Modern Cycle Process Template for PowerPoint & Google Slides
Business Proposal
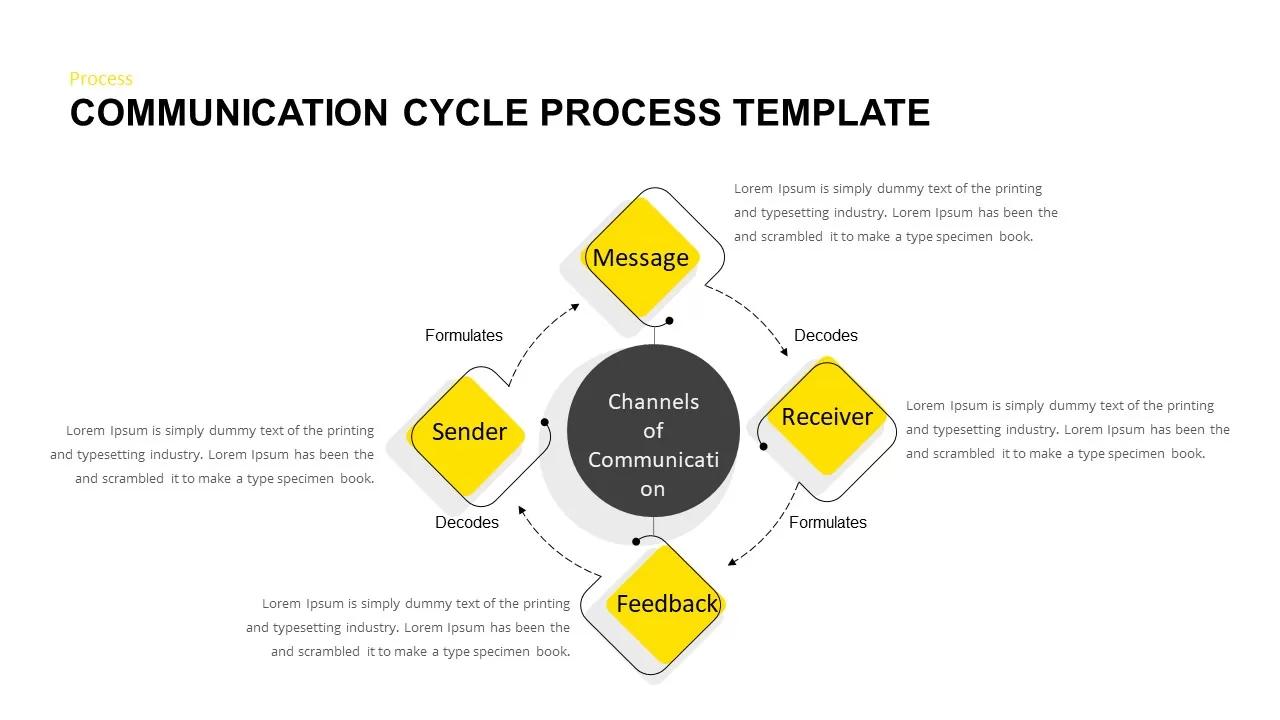
Communication Cycle Process Diagram template for PowerPoint & Google Slides
Business
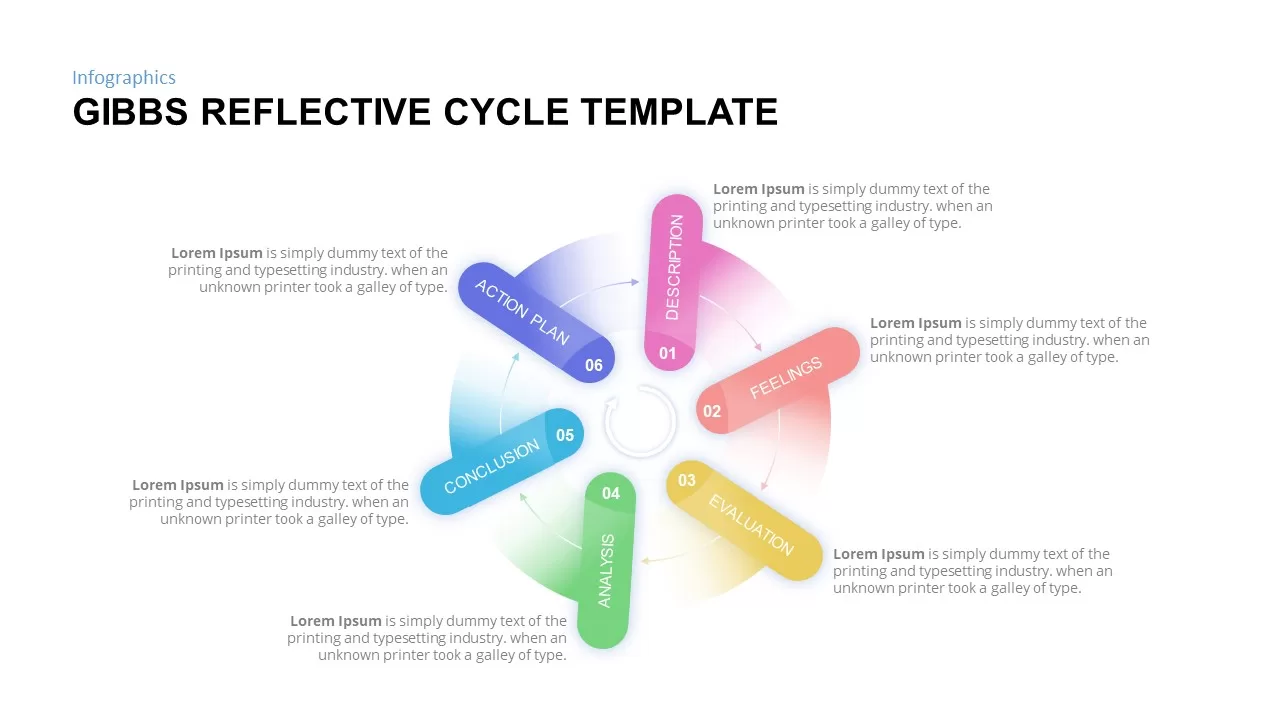
Gibbs Reflective Cycle Overview Template for PowerPoint & Google Slides
Process
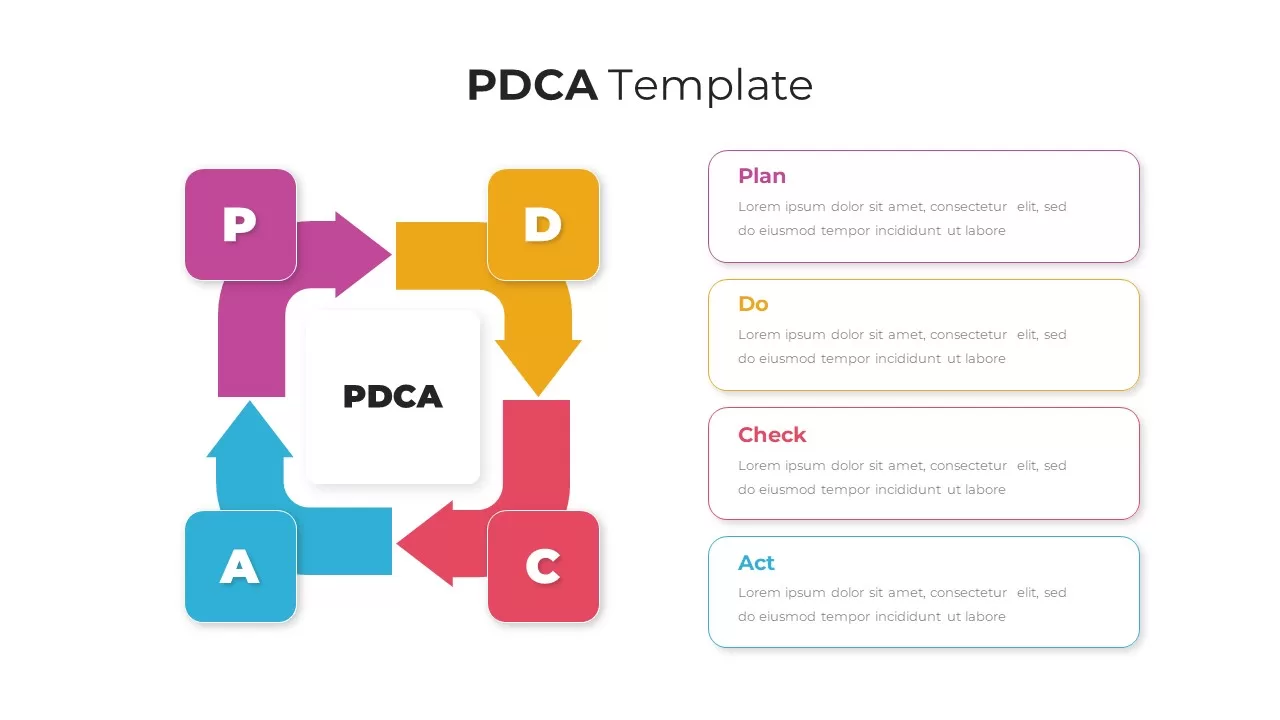
PDCA Plan Do Check Act Cycle Infographic Template for PowerPoint & Google Slides
Process
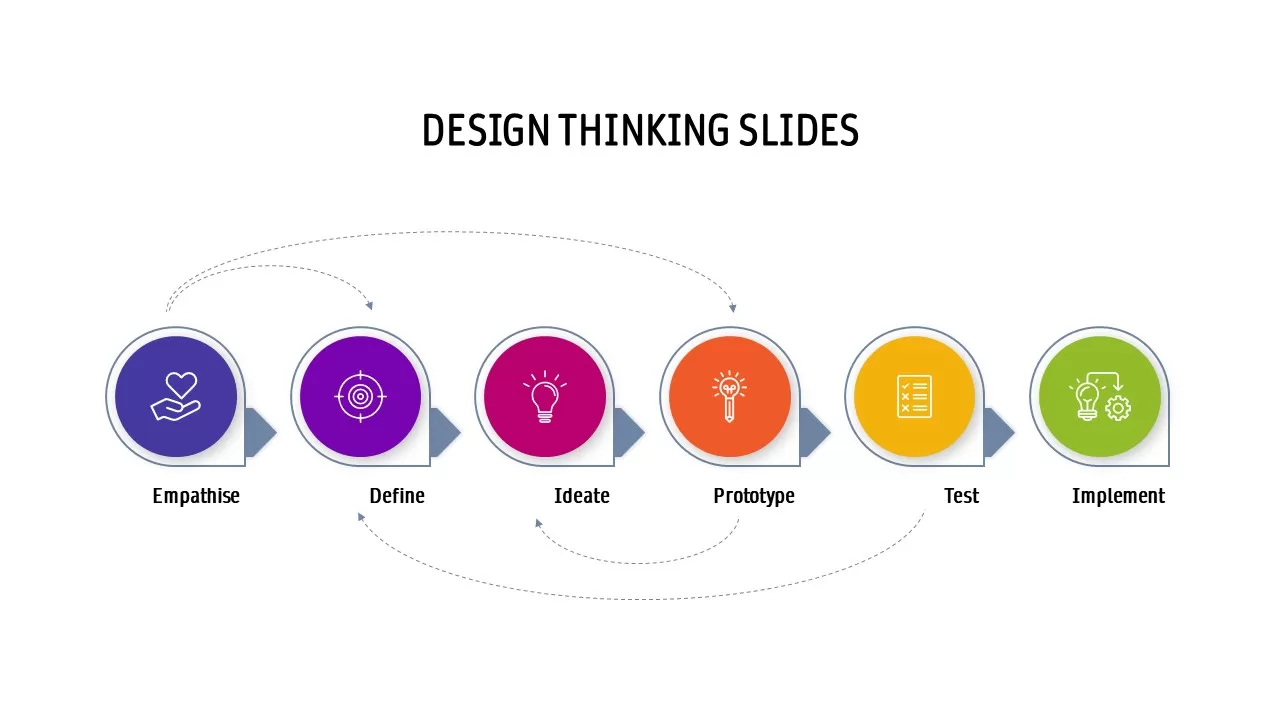
Design Thinking Process Cycle Slide Template for PowerPoint & Google Slides
Process
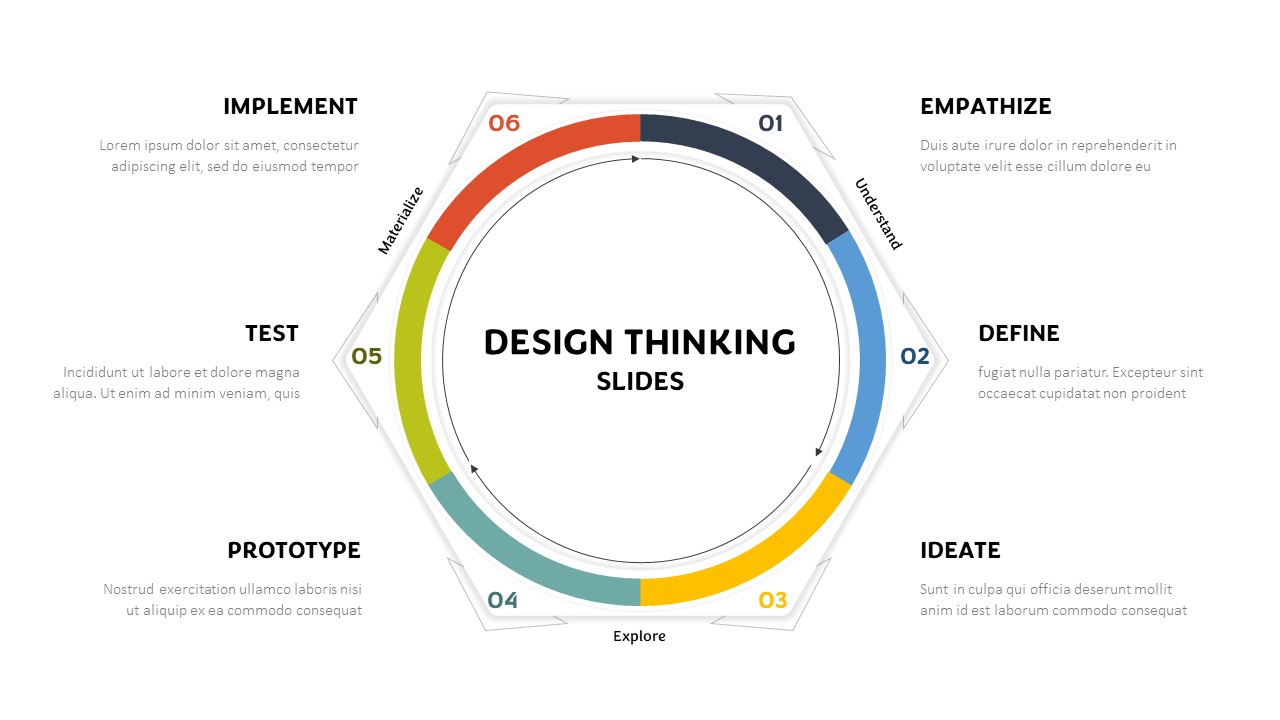
Hexagonal Design Thinking Cycle Template for PowerPoint & Google Slides
Process
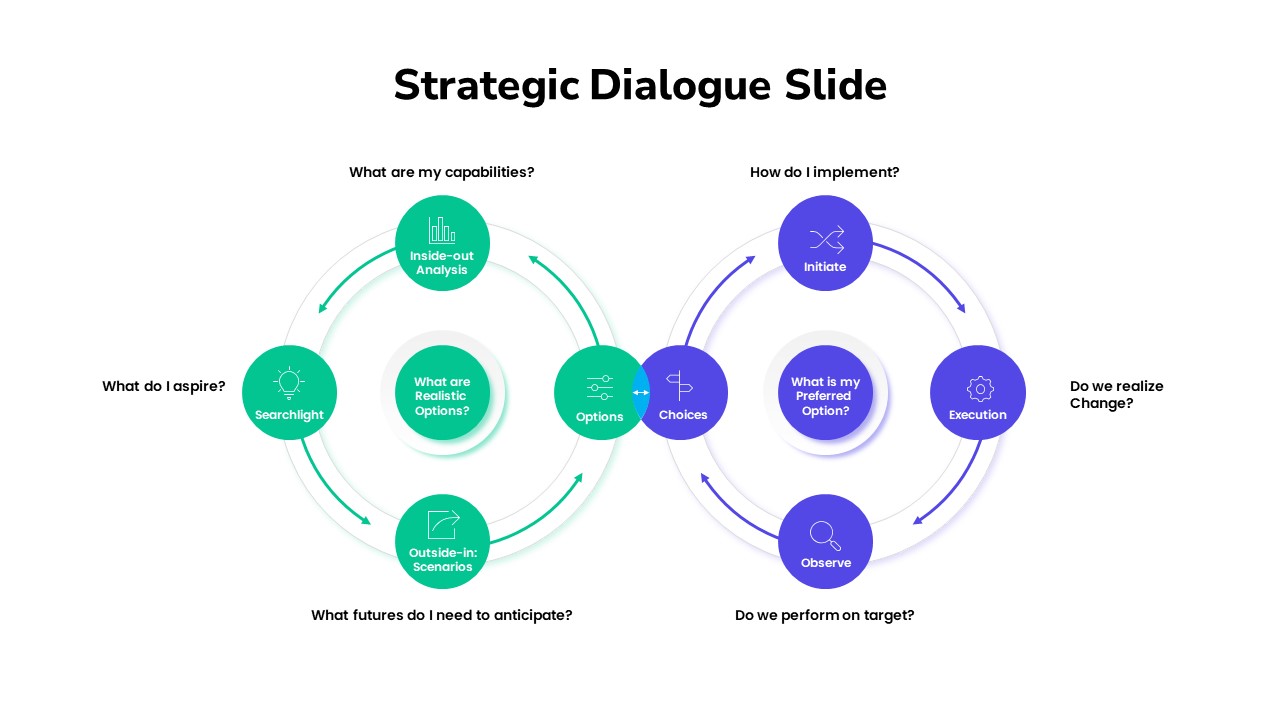
Strategic Dialogue Model Cycle Template for PowerPoint & Google Slides
Circular
Business Process Analysis Cycle Diagram Template for PowerPoint & Google Slides
Business Strategy
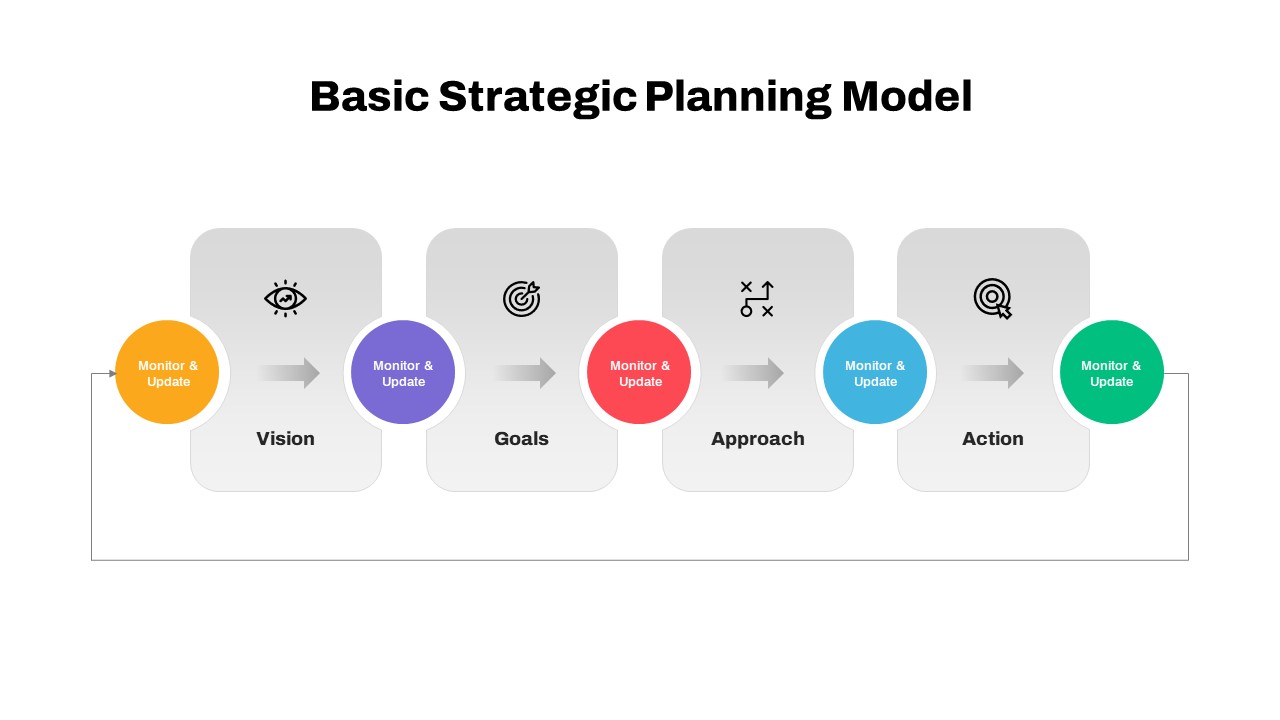
Iterative Strategic Planning Cycle Template for PowerPoint & Google Slides
Business Strategy
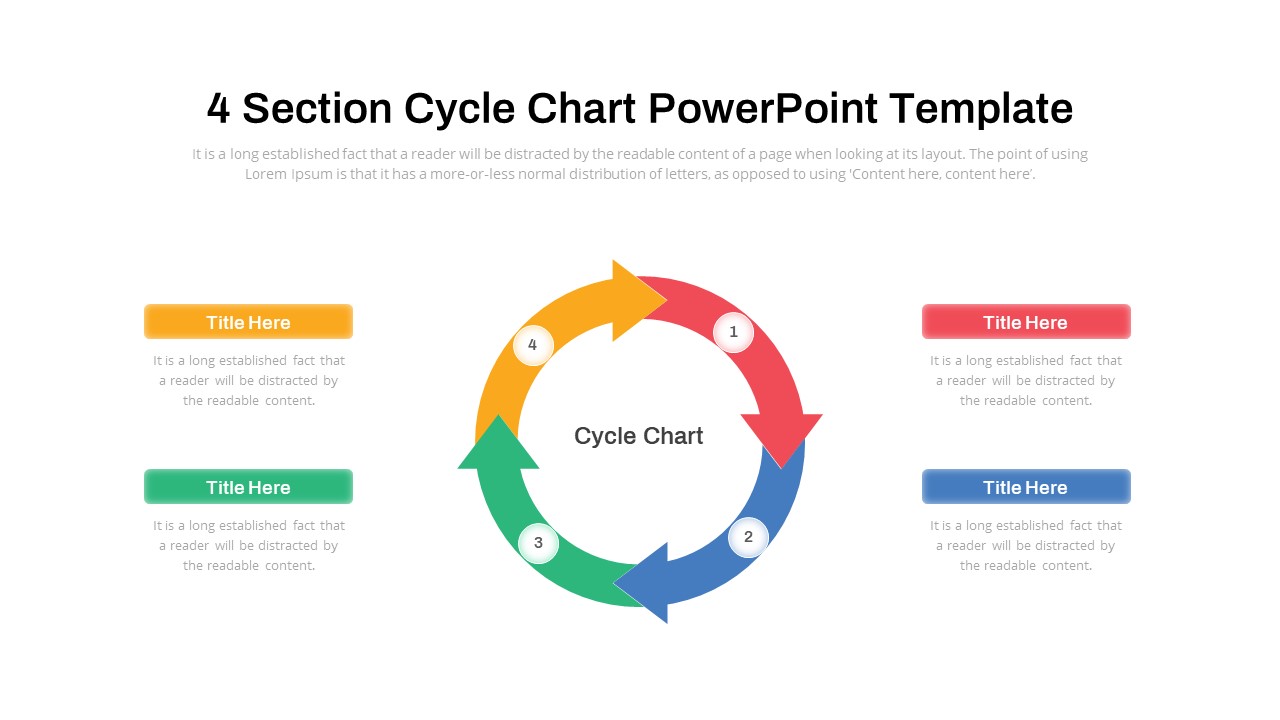
Cycle Chart Template for PowerPoint & Google Slides
Circular
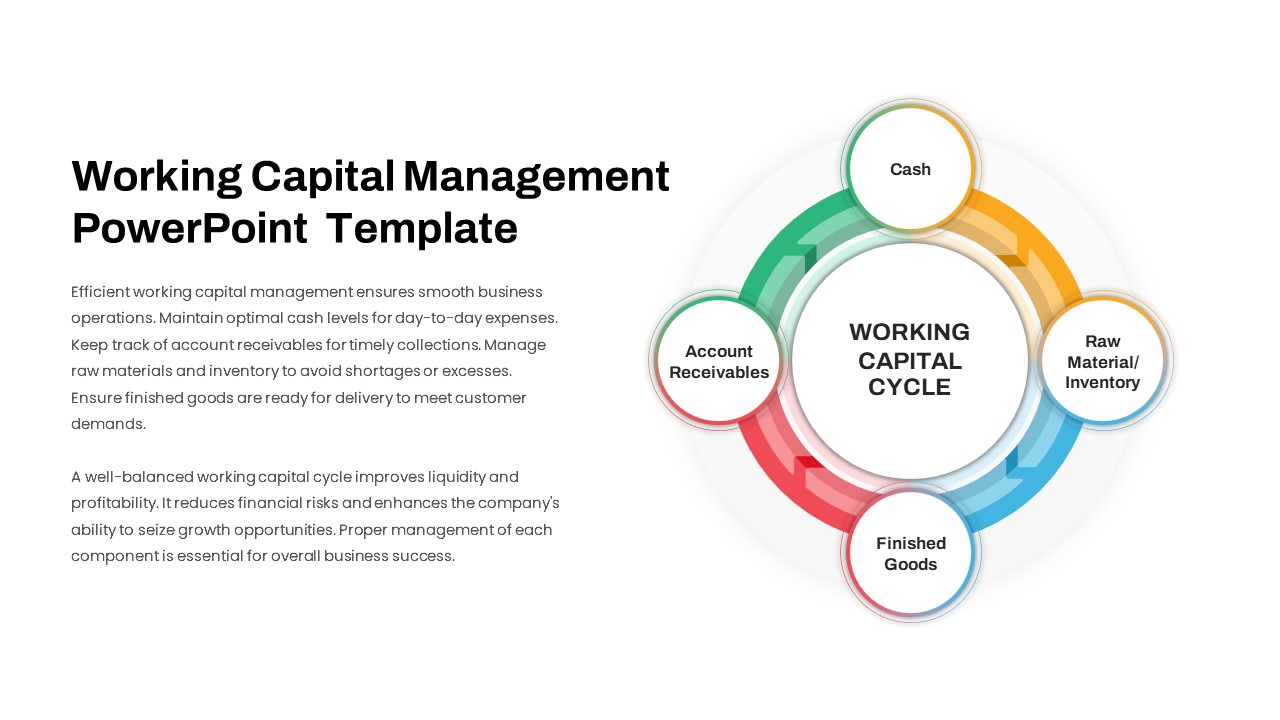
Working Capital Cycle Diagram Template for PowerPoint & Google Slides
Circular
Gartner Hype Cycle Adoption Curve Diagram Template for PowerPoint & Google Slides
Infographics
Colorful Startup Financing Cycle Diagram Template for PowerPoint & Google Slides
Finance
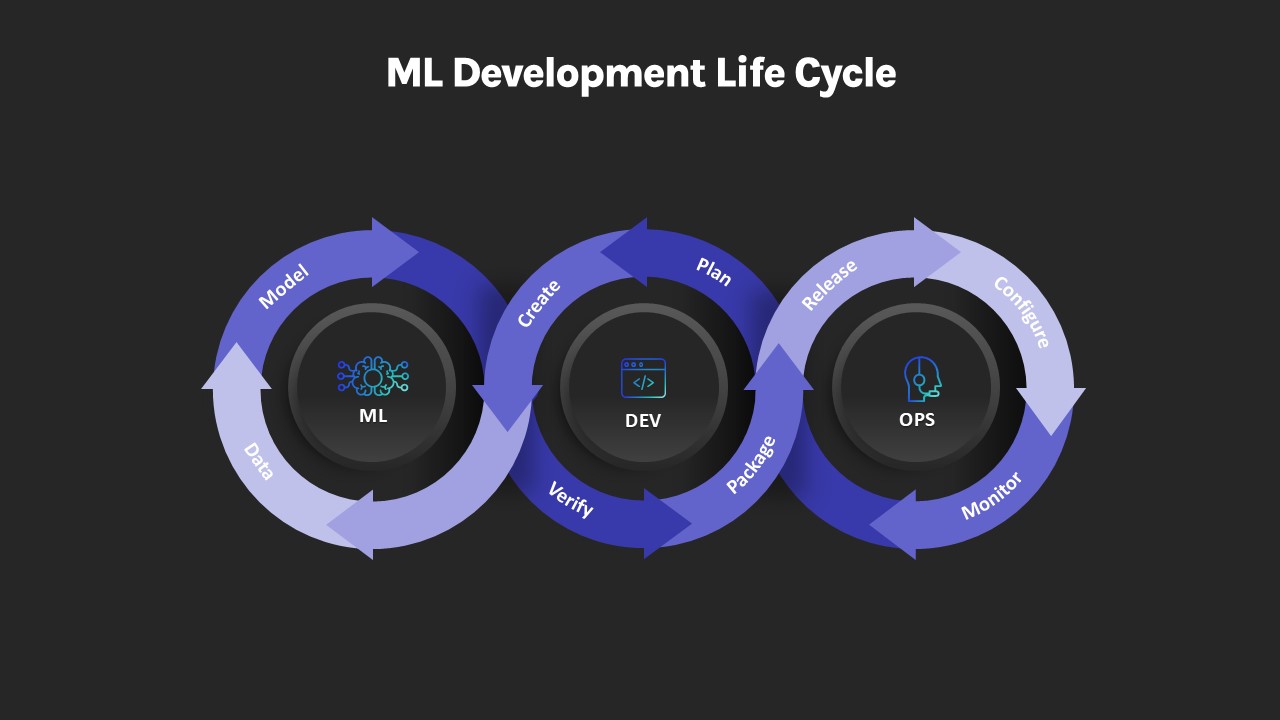
ML Development Life Cycle Diagram Template for PowerPoint & Google Slides
Machine Learning
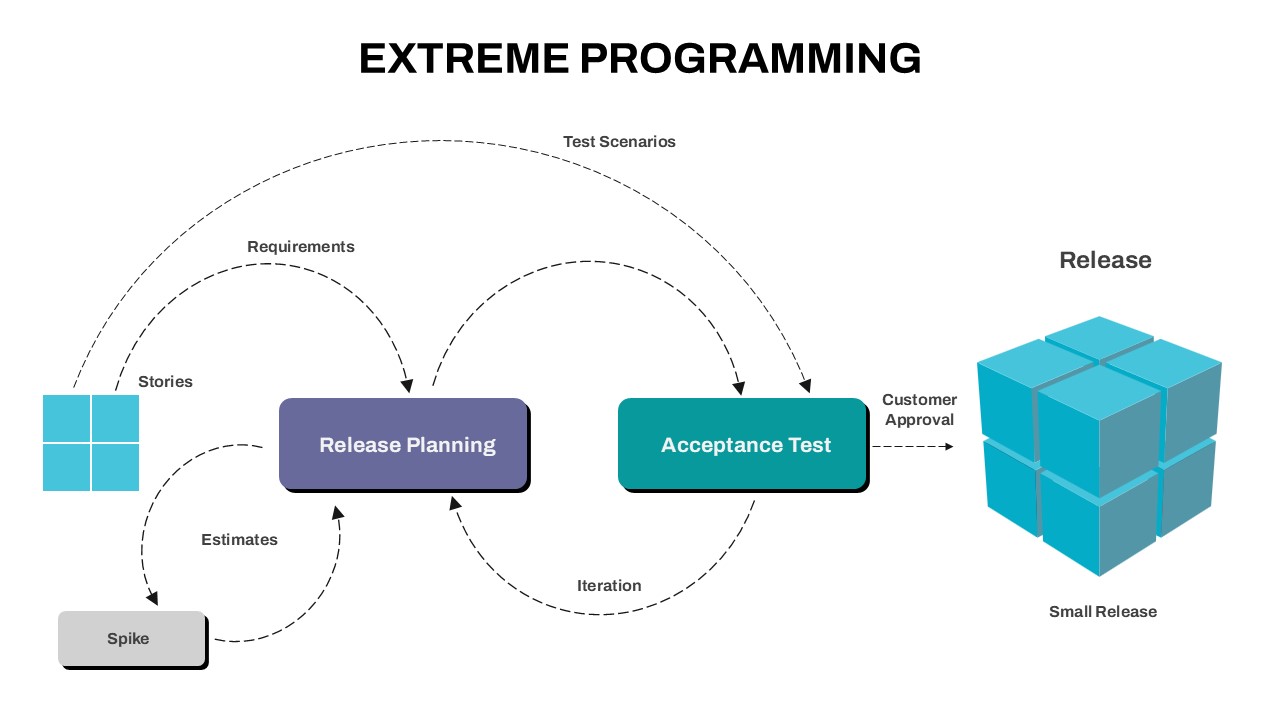
Extreme Programming Process Cycle Template for PowerPoint & Google Slides
Software Development
Flywheel Growth Cycle Diagram Template for PowerPoint & Google Slides
Circular
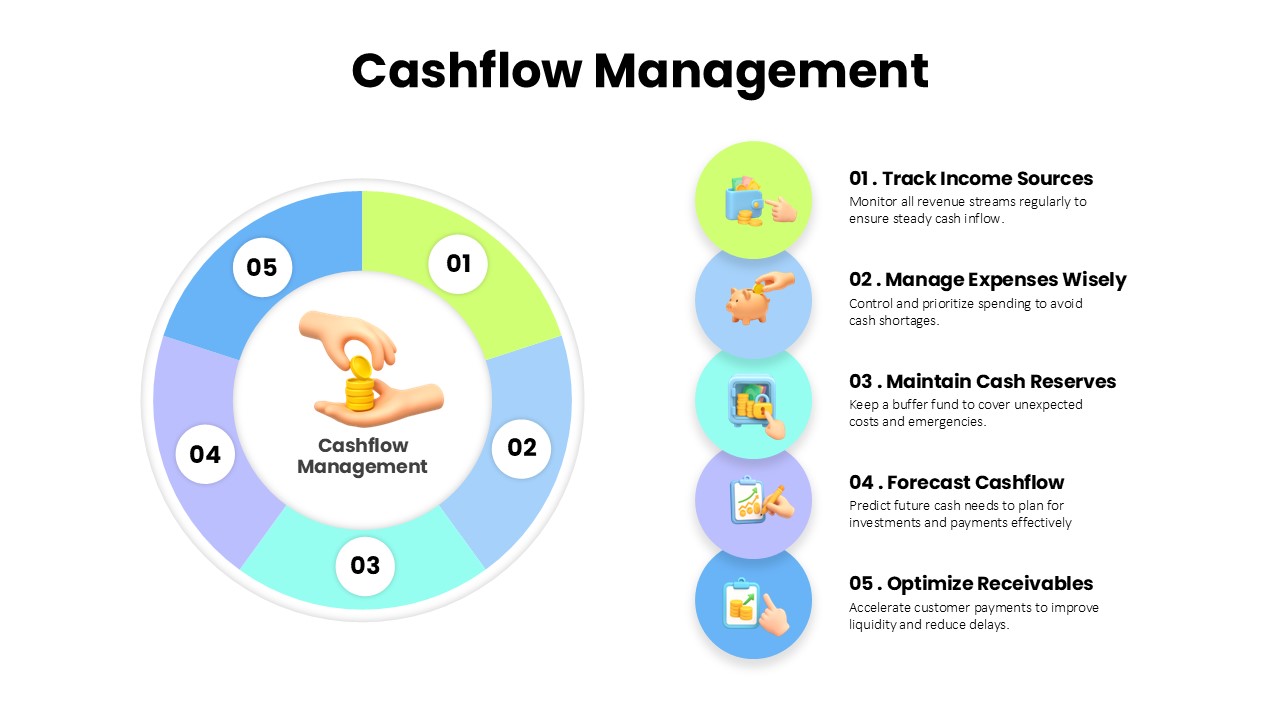
Cashflow Management Cycle Diagram Template for PowerPoint & Google Slides
Finance
Continuous Improvement Cycle Diagram Template for PowerPoint & Google Slides
Process