Simple Four Connected Boxes Diagram Template for PowerPoint & Google Slides


Description
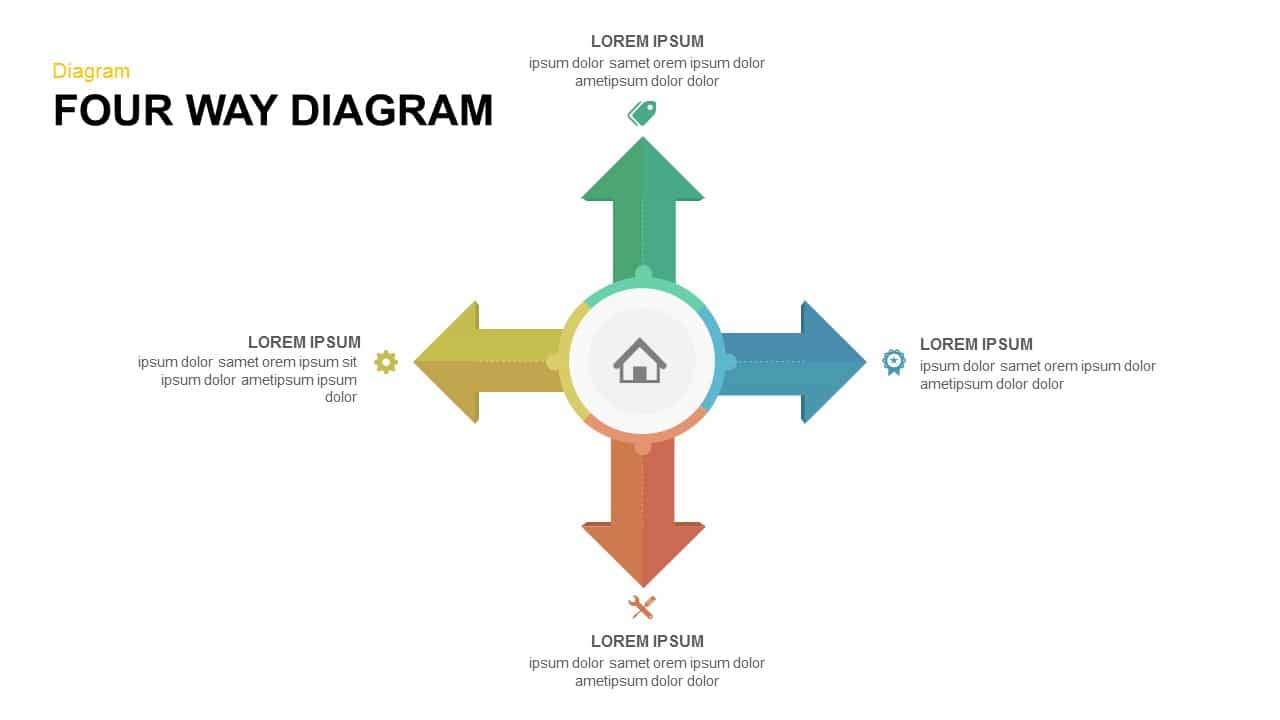
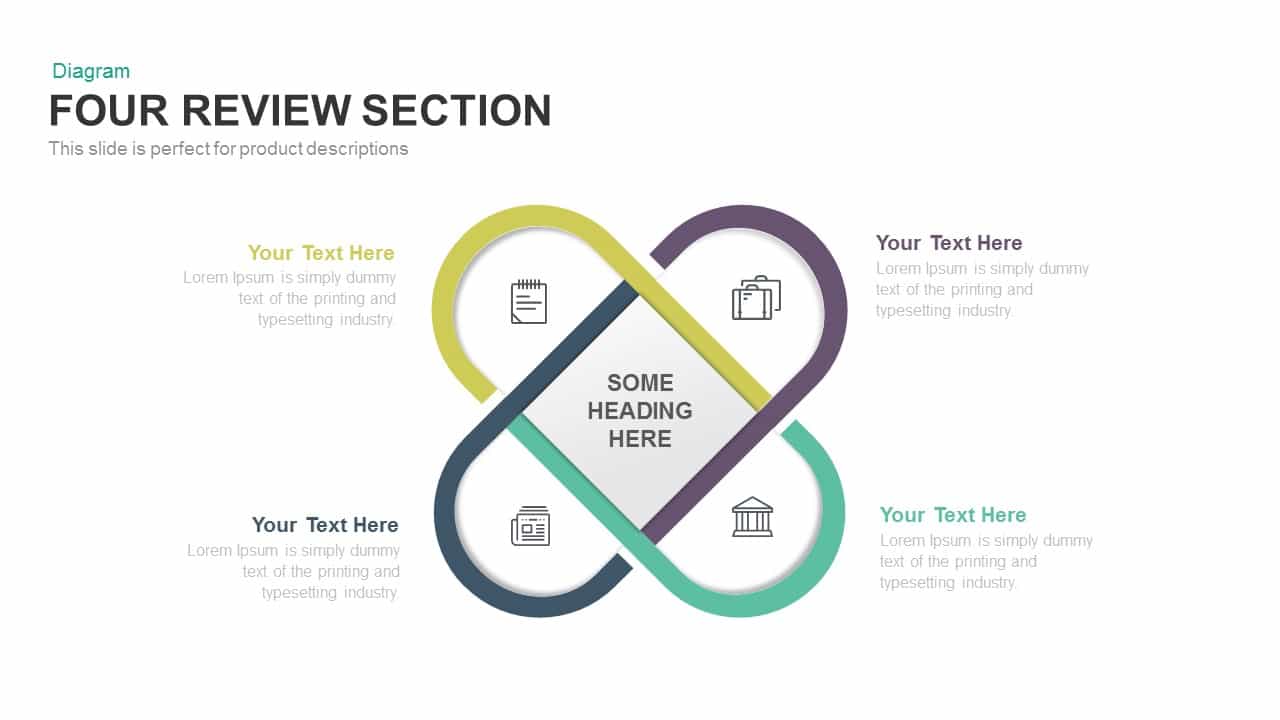
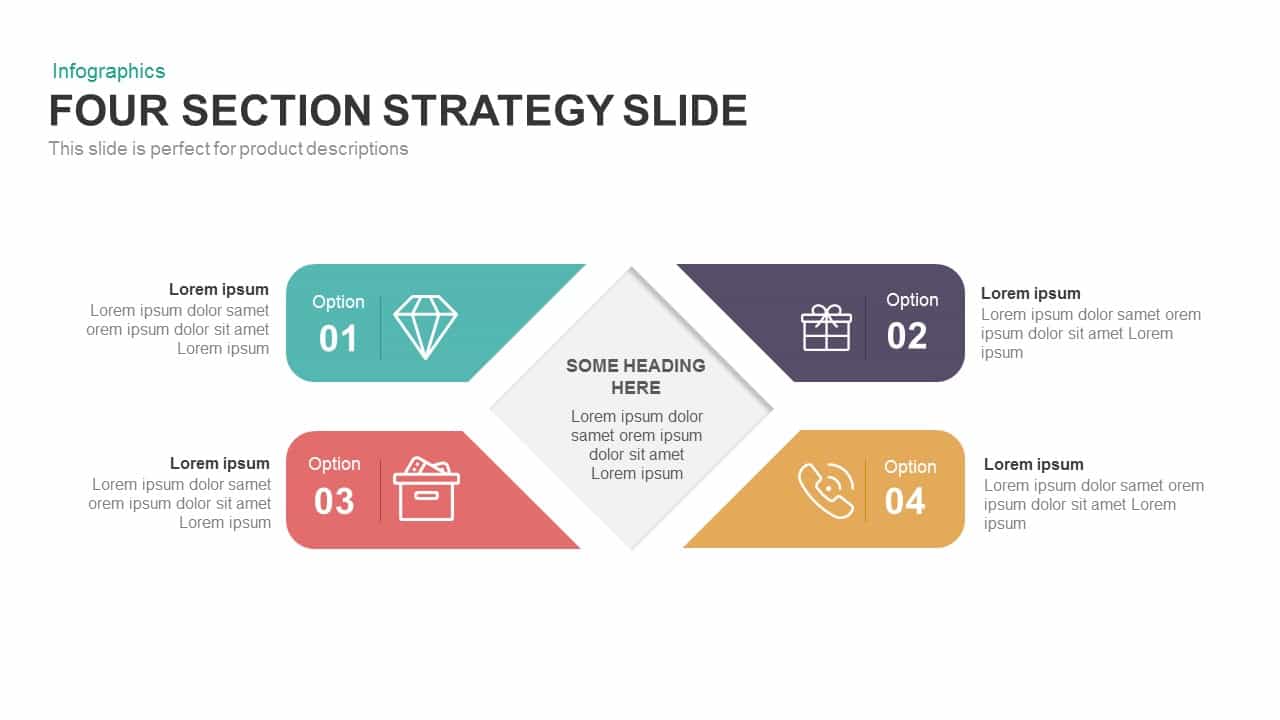
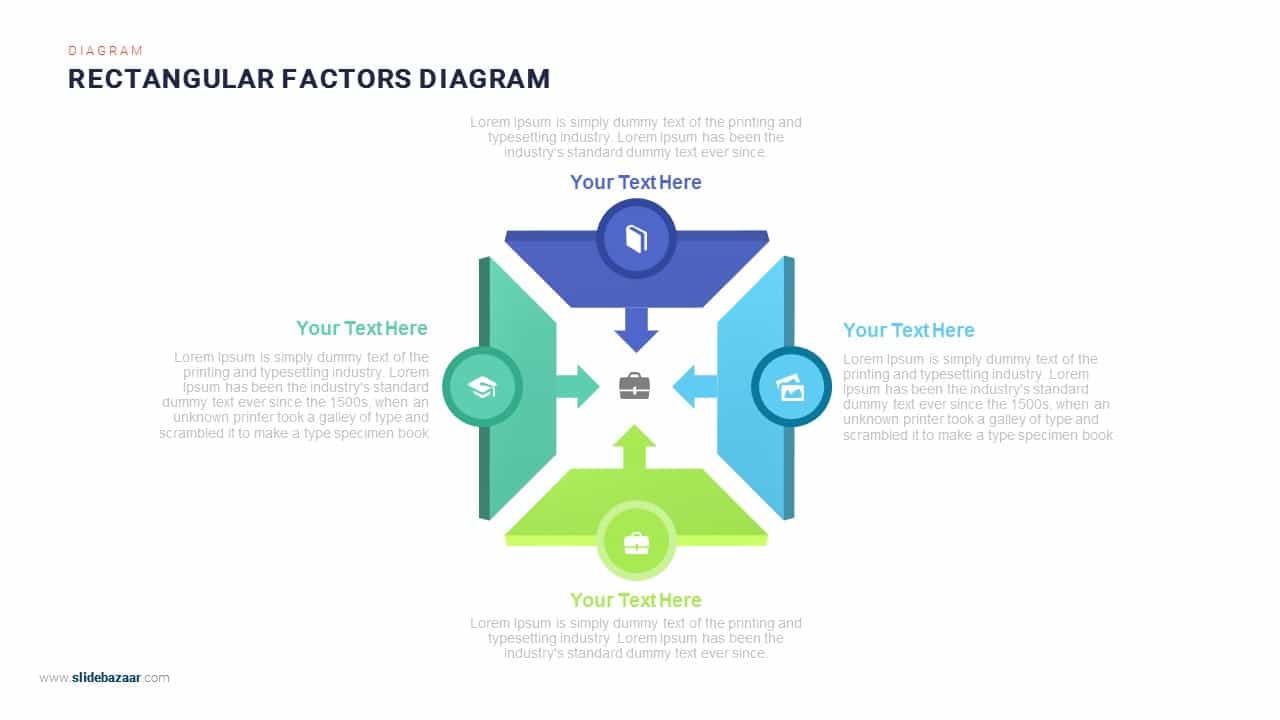
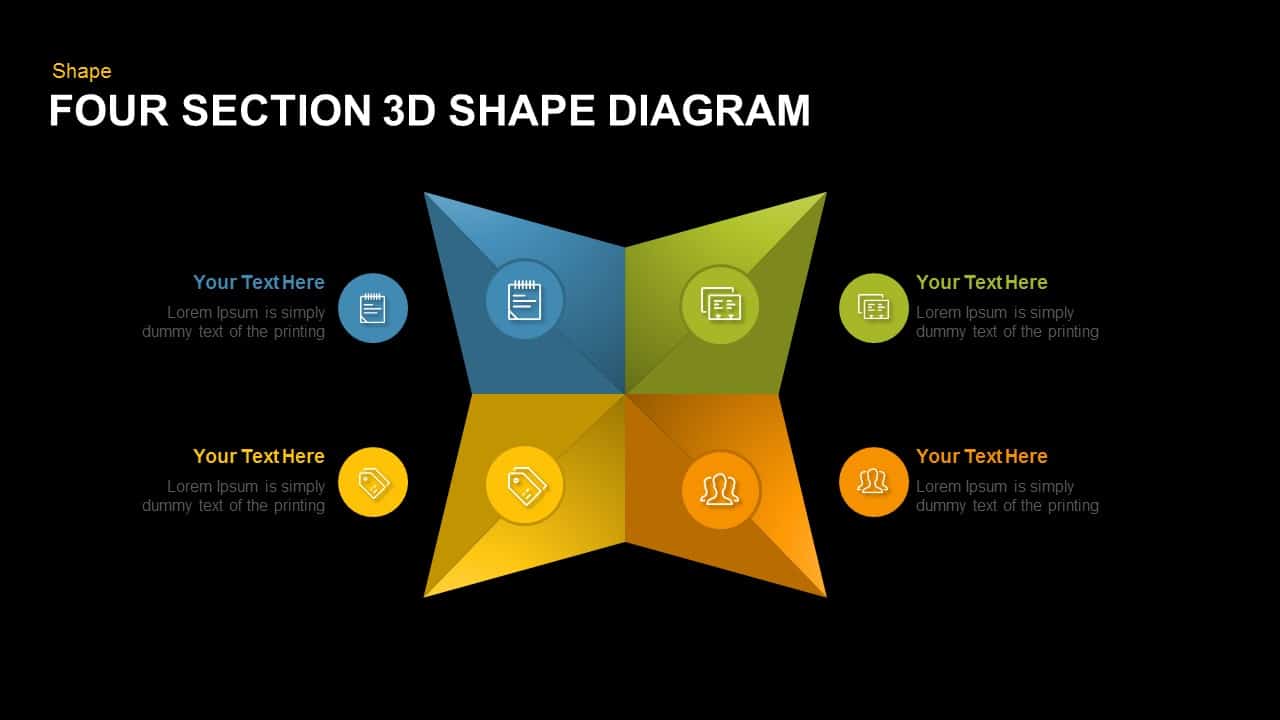
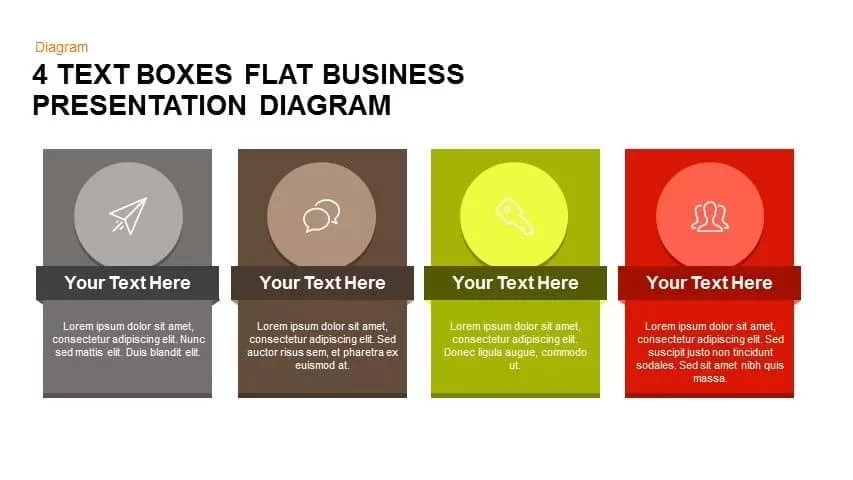
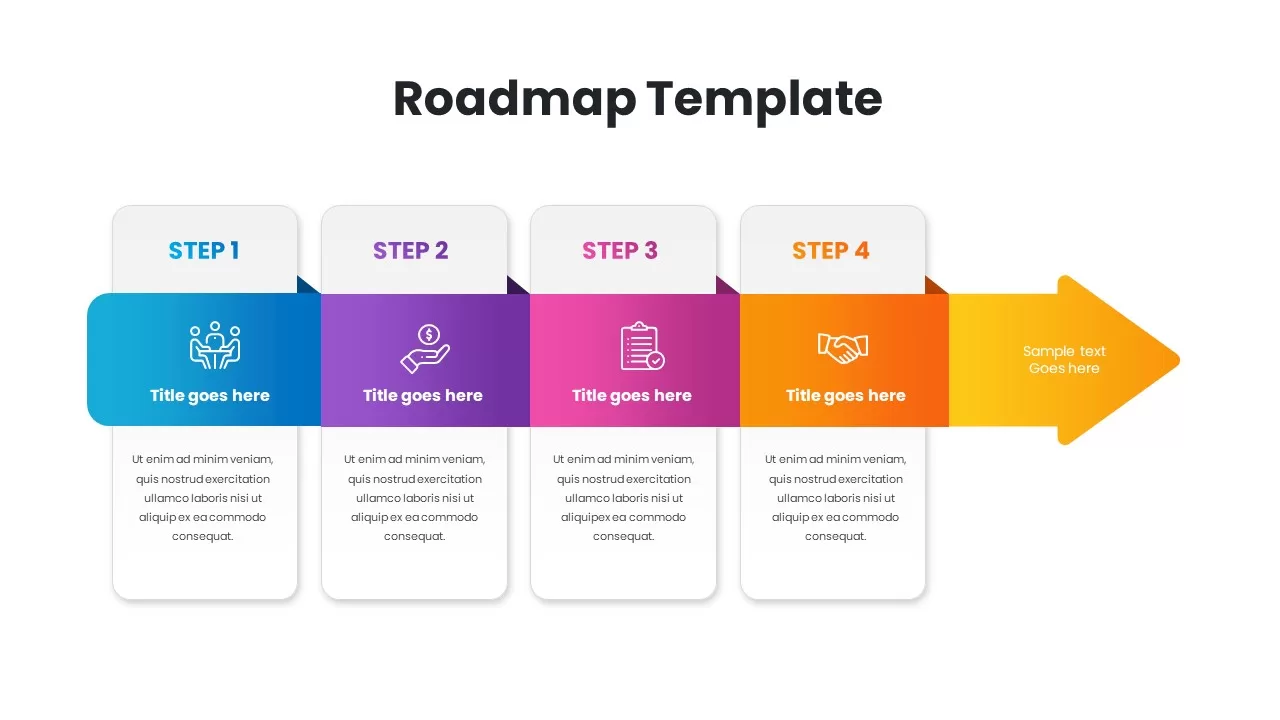
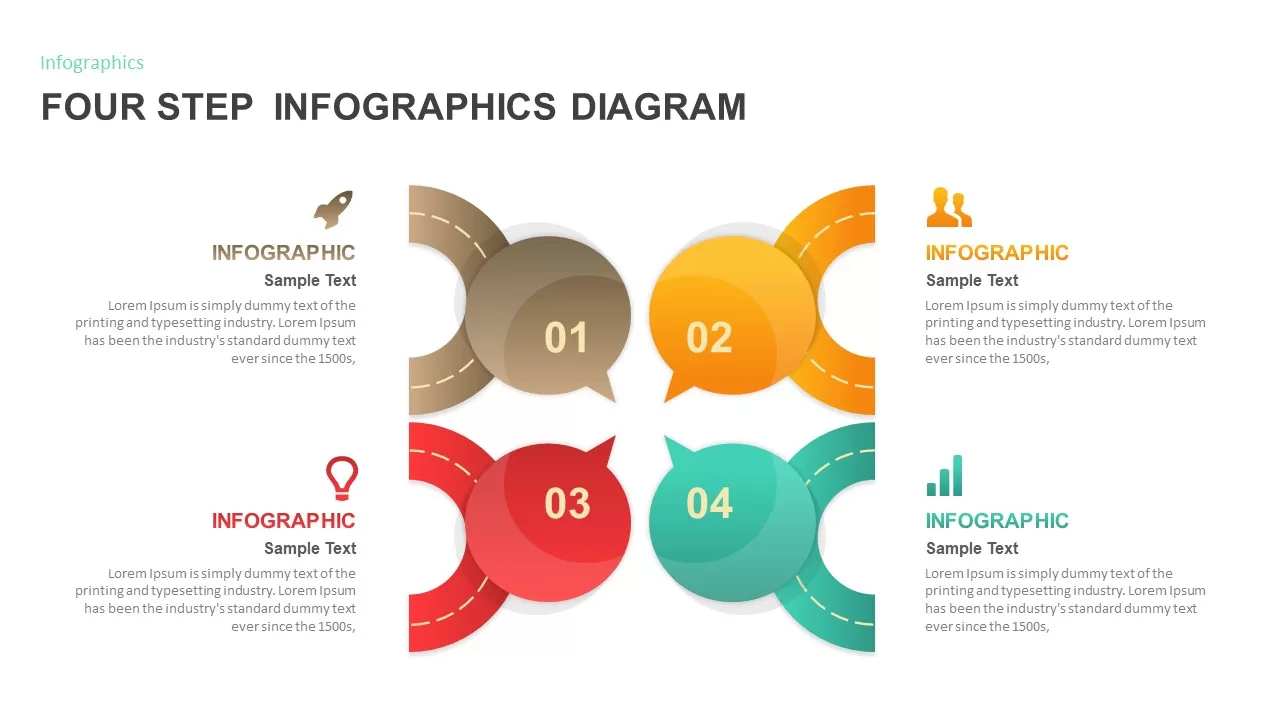
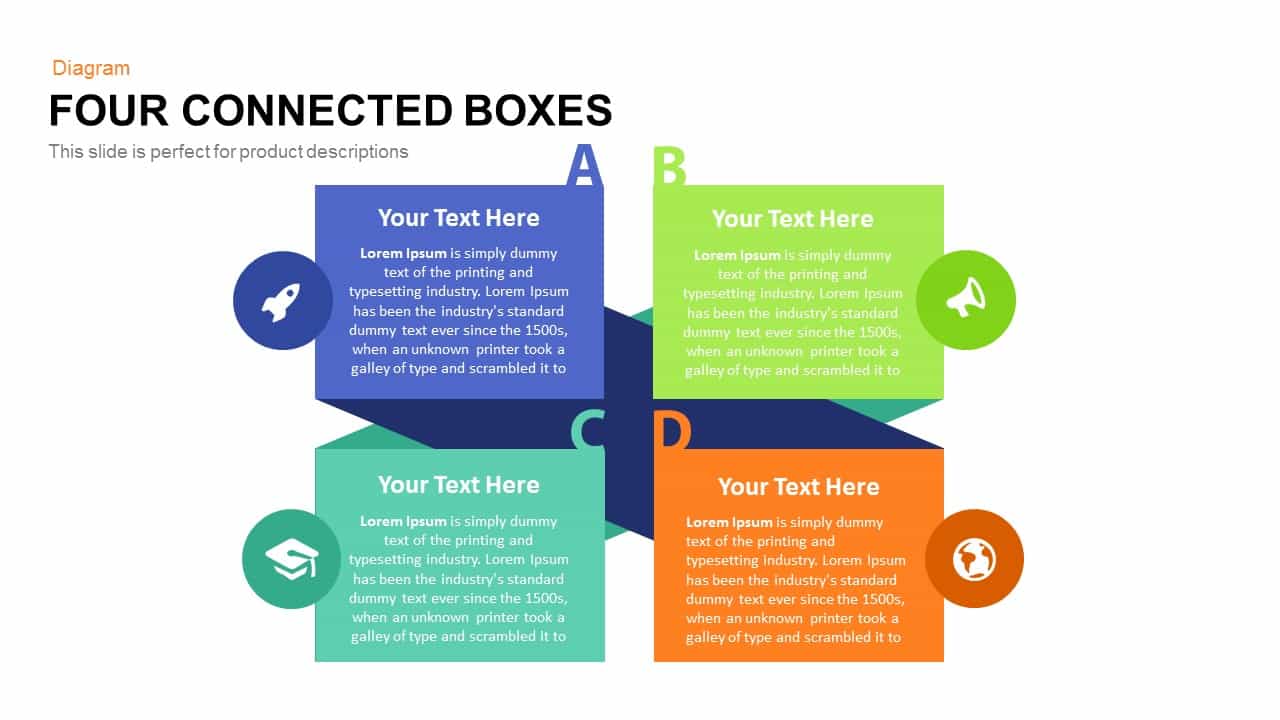
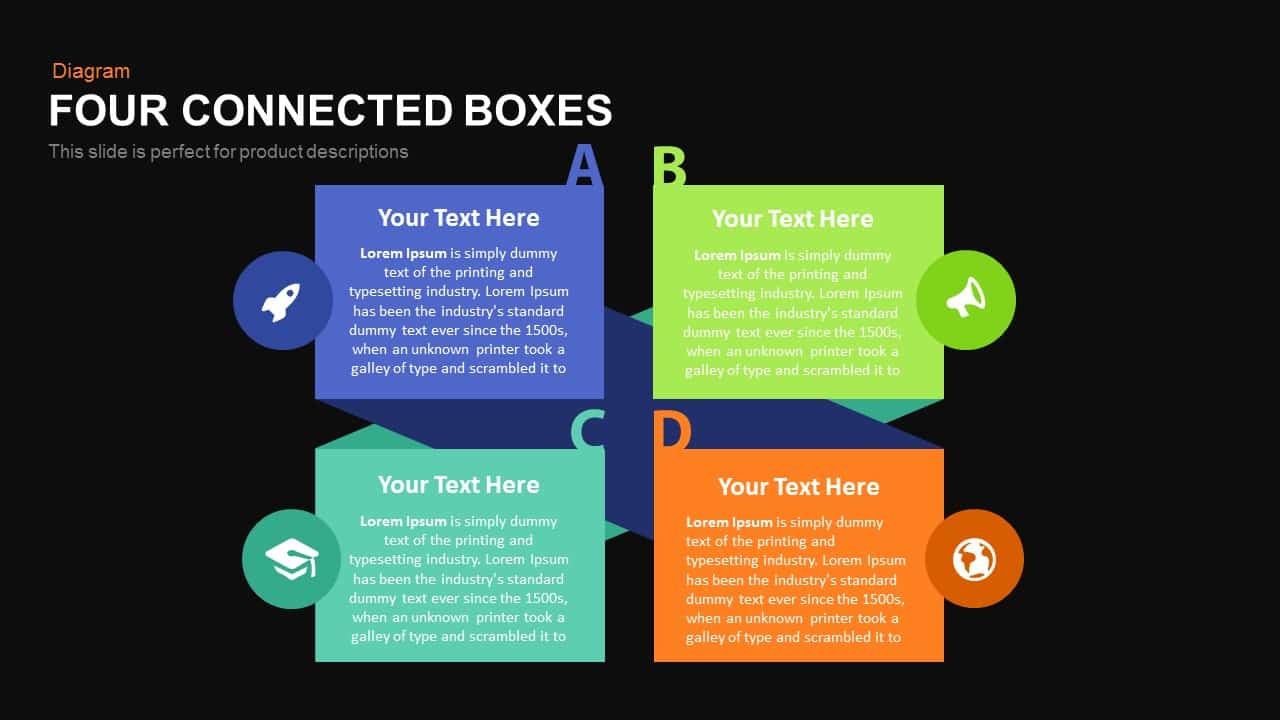
Enhance your presentations with this Four Connected Boxes diagram, designed to clarify complex processes and interrelated concepts in PowerPoint and Google Slides. The slide features four distinct, colored boxes aligned horizontally and joined by subtle connecting lines, emphasizing continuity and sequence. Each box includes an easily editable text placeholder and accompanying iconographic space, enabling you to label stages, strategies, or core ideas with precision. The vibrant color palette and flat-design aesthetic ensure visual appeal while maintaining professional clarity. Scalable vector shapes guarantee flawless resizing across widescreen (16:9) and standard (4:3) aspect ratios, and integrated master slides let you customize colors, typography, and spacing to match corporate branding or educational themes.
Ideal for mapping business models, workflow stages, or product features, the structure supports both linear and cyclical interpretations of data. Users can reorder or recolor boxes, adjust connector styles, and layer additional graphics such as arrows or labels to tailor the narrative flow. The clean layout leverages whitespace to focus attention on key messages, while subtle drop shadows add depth without distracting from content. Built-in animations including fade and wipe effects accentuate transitions between boxes, making your narrative dynamic and engaging during live presentations.
Fully editable in PowerPoint and Google Slides, this template uses vector icons and shape tools to simplify modifications. Replace default icons with custom imagery, tweak text styles, or add new placeholders to expand the slide’s utility. The template’s versatility spans strategic planning, project roadmaps, and data-driven analyses, offering a one-stop solution for directors, consultants, and educators seeking concise visual storytelling. With rapid customization and consistent design, this asset streamlines your workflow and elevates audience comprehension.
Who is it for
Consultants, business analysts, project managers, and educators can leverage this slide to map processes, illustrate business models, or present sequential stages with clarity and visual impact.
Other Uses
Repurpose this template for SWOT or PEST analyses, product feature comparisons, customer journey mapping, risk assessments, or roadmap visualizations by customizing labels, colors, and connectors to suit any context.
Login to download this file

Item ID
SB00523
Related Templates

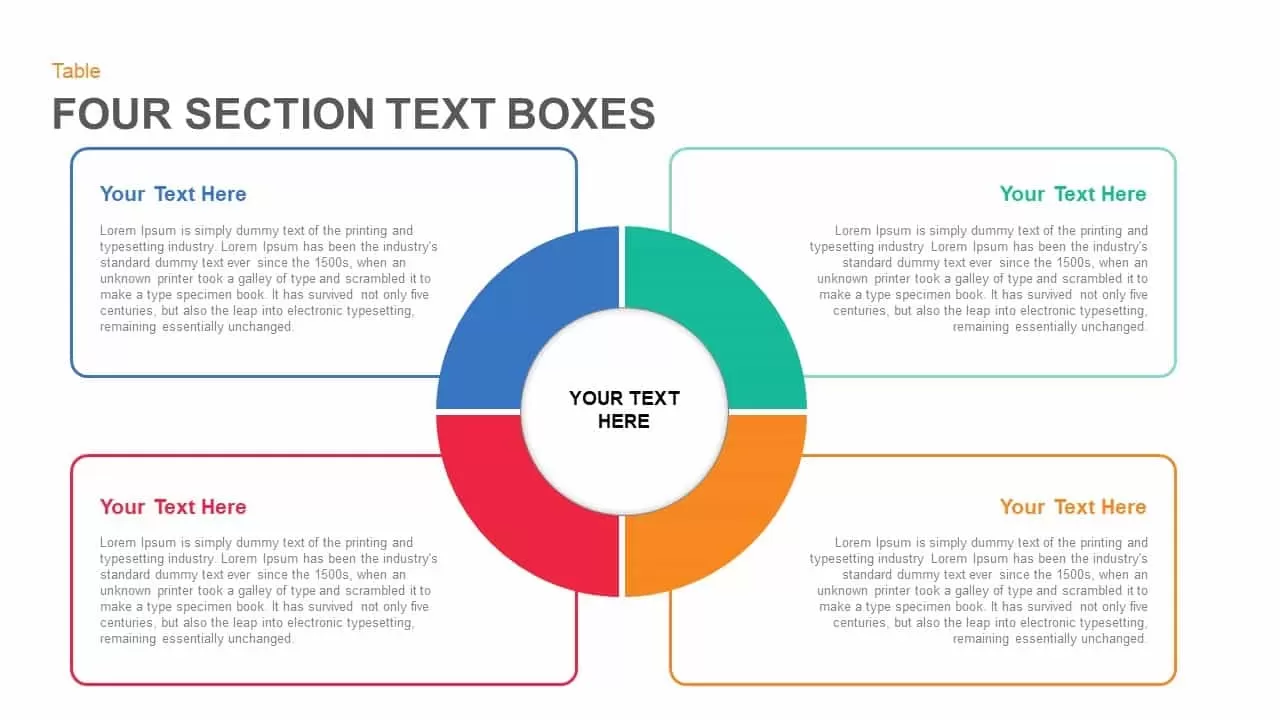
Four Section Circular Text Boxes Diagram Template for PowerPoint & Google Slides
Circular
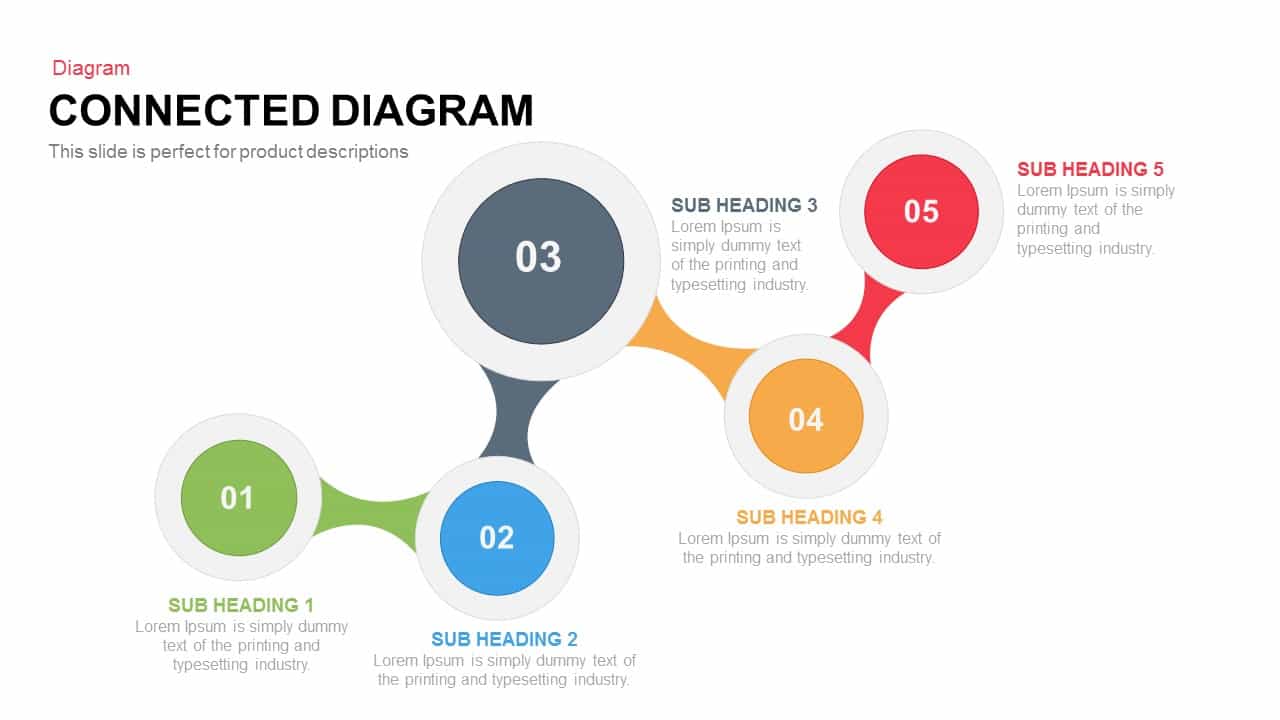
Interactive Connected Network Diagram Template for PowerPoint & Google Slides
Process
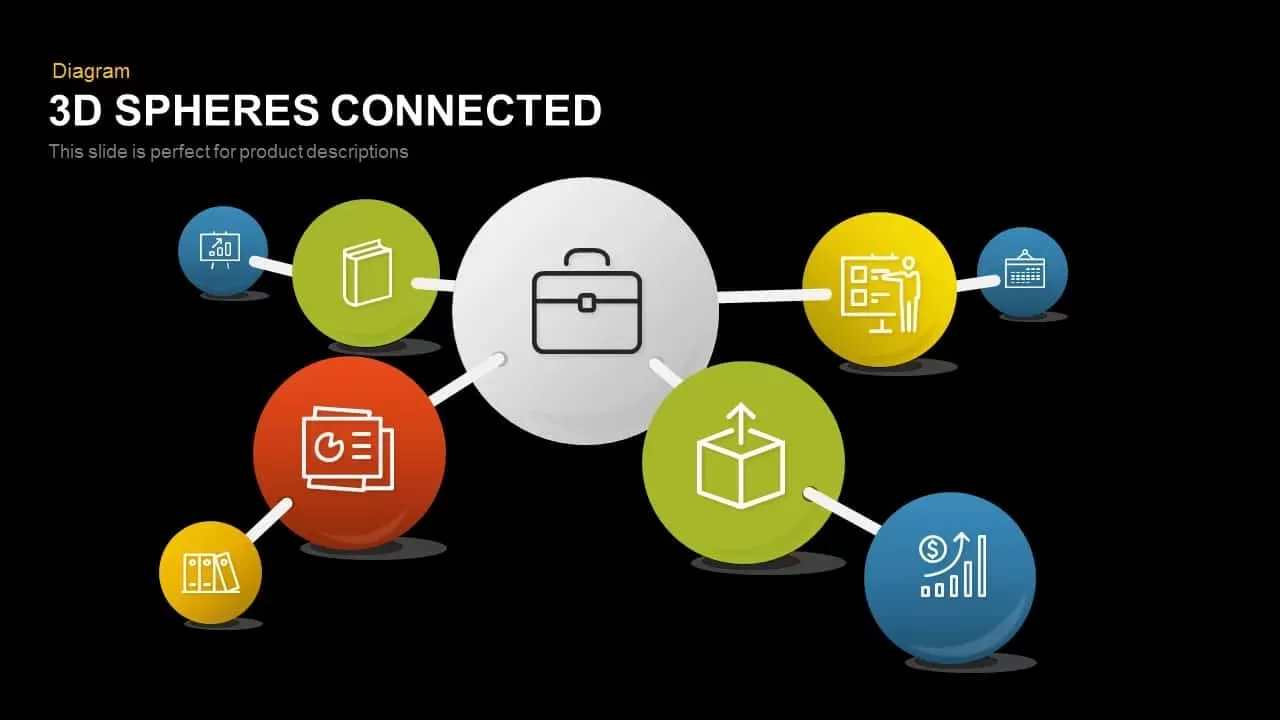
3D Spheres Connected Diagram for PowerPoint & Google Slides
Process
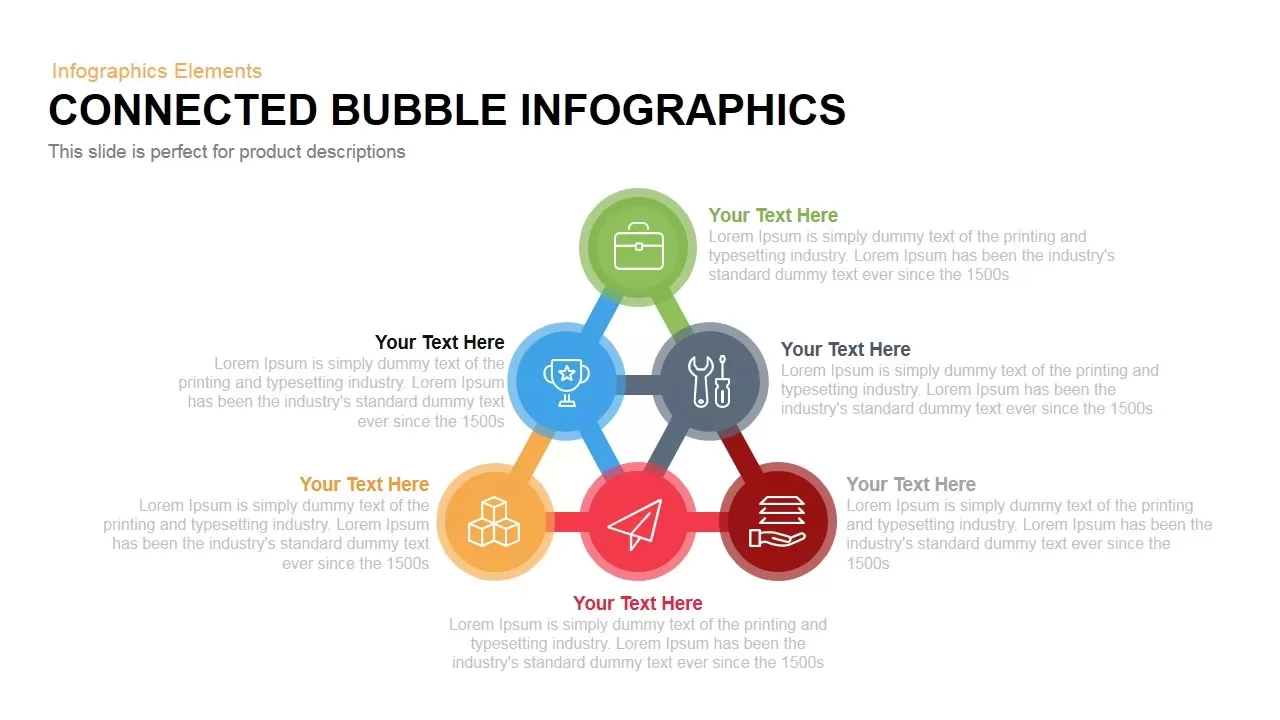
Connected Bubble Network Infographic Template for PowerPoint & Google Slides
Circular

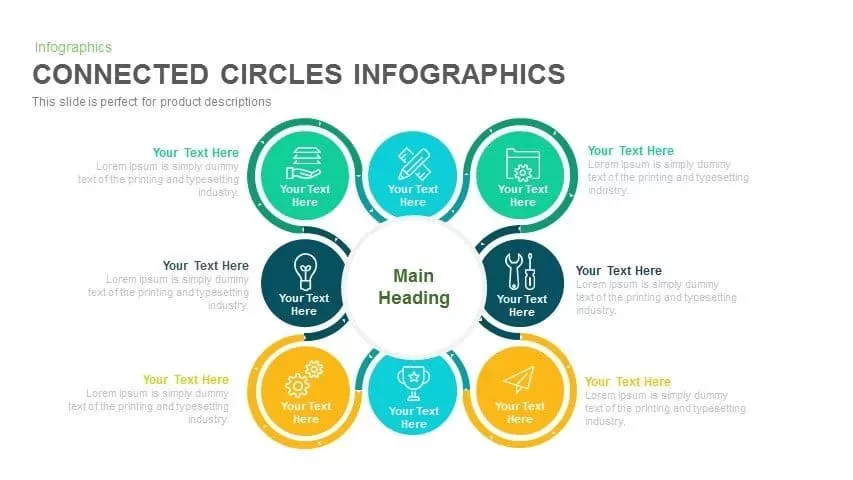
Radial Connected Circles Infographic Template for PowerPoint & Google Slides
Circular
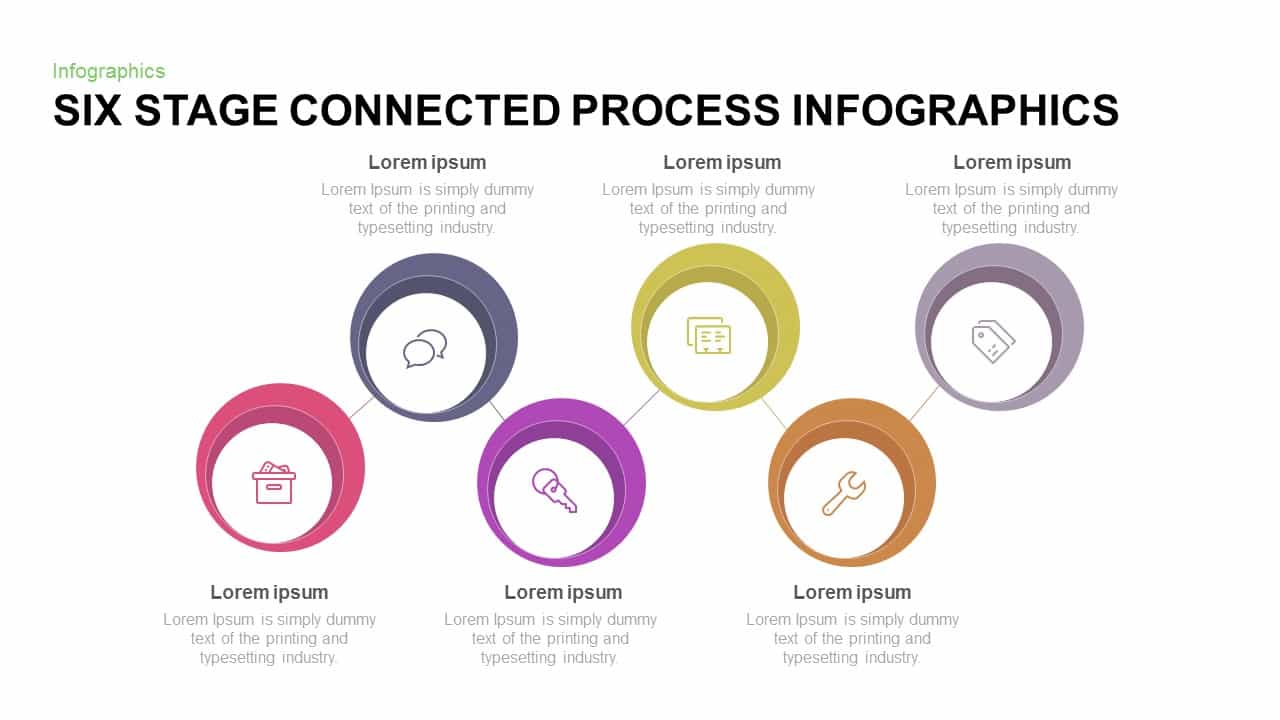
Six-Stage Connected Process Infographics Template for PowerPoint & Google Slides
Process
Content Boxes Diagram Template for PowerPoint & Google Slides
Comparison
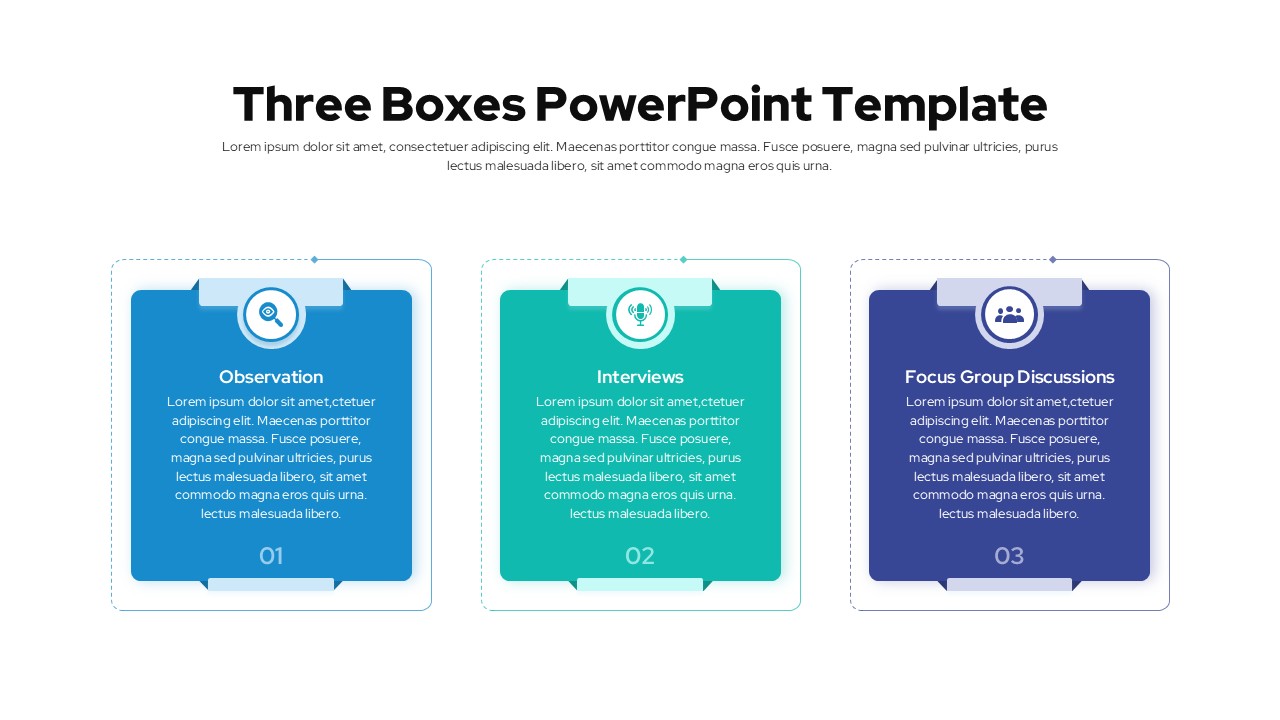
Three Boxes PowerPoint Template for PowerPoint & Google Slides
Business Report
Free Callout Boxes PowerPoint Shapes for PowerPoint & Google Slides
Infographics
Free
Vertical Timeline with Alternating Boxes Template for PowerPoint & Google Slides
Timeline
Five-Option Text Boxes Table Comparison Template for PowerPoint & Google Slides
Business Report
About Us Slide with Feature Boxes Template for PowerPoint & Google Slides
Marketing

Free Simple Venn Diagram Overview template for PowerPoint & Google Slides
Comparison Chart
Free
Simple Flowchart Process Diagram Template for PowerPoint & Google Slides
Flow Charts
3D Four Arrow Infographics Diagram Template for PowerPoint & Google Slides
Arrow
Four Step Ribbon Diagram Template for PowerPoint & Google Slides
Infographics
Four Segmented Hemisphere Diagram Template for PowerPoint & Google Slides
Process
Diamond Mind Map Diagram Four Branches Template for PowerPoint & Google Slides
Mind Maps
Four Section Comparison Chart Diagram Template for PowerPoint & Google Slides
Infographics
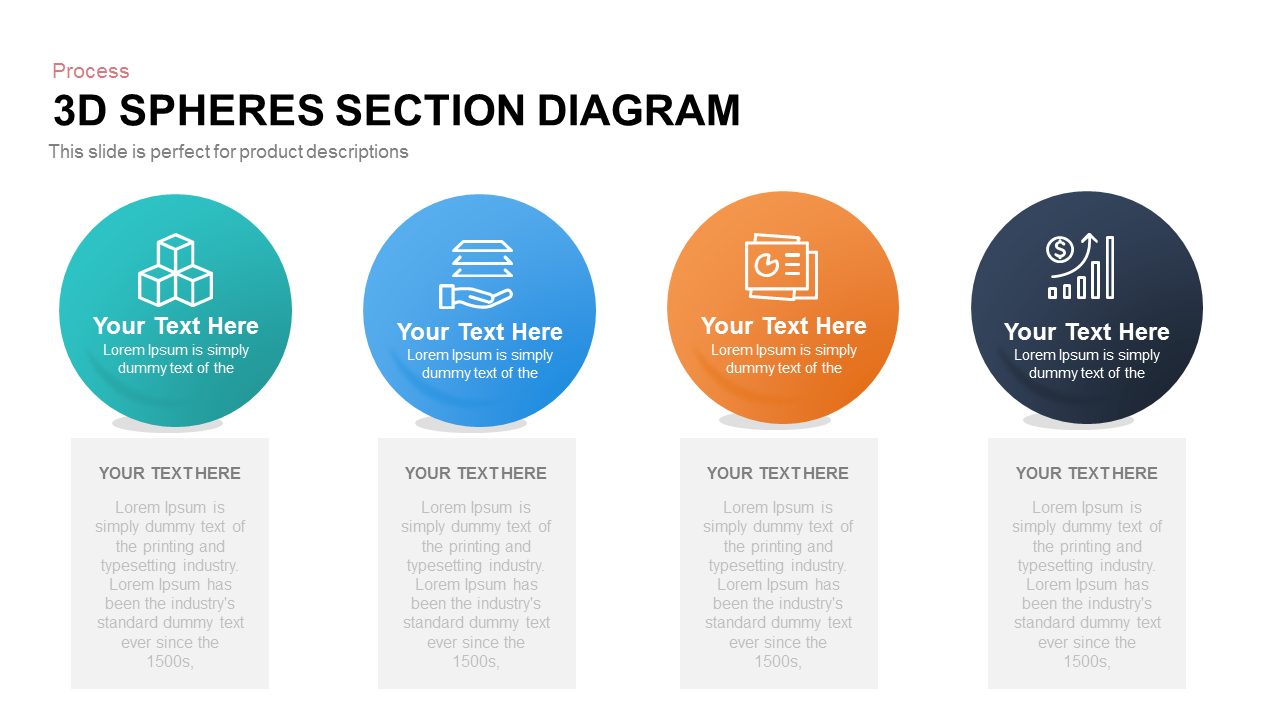
Four-Part 3D Spheres Section Diagram template for PowerPoint & Google Slides
Process
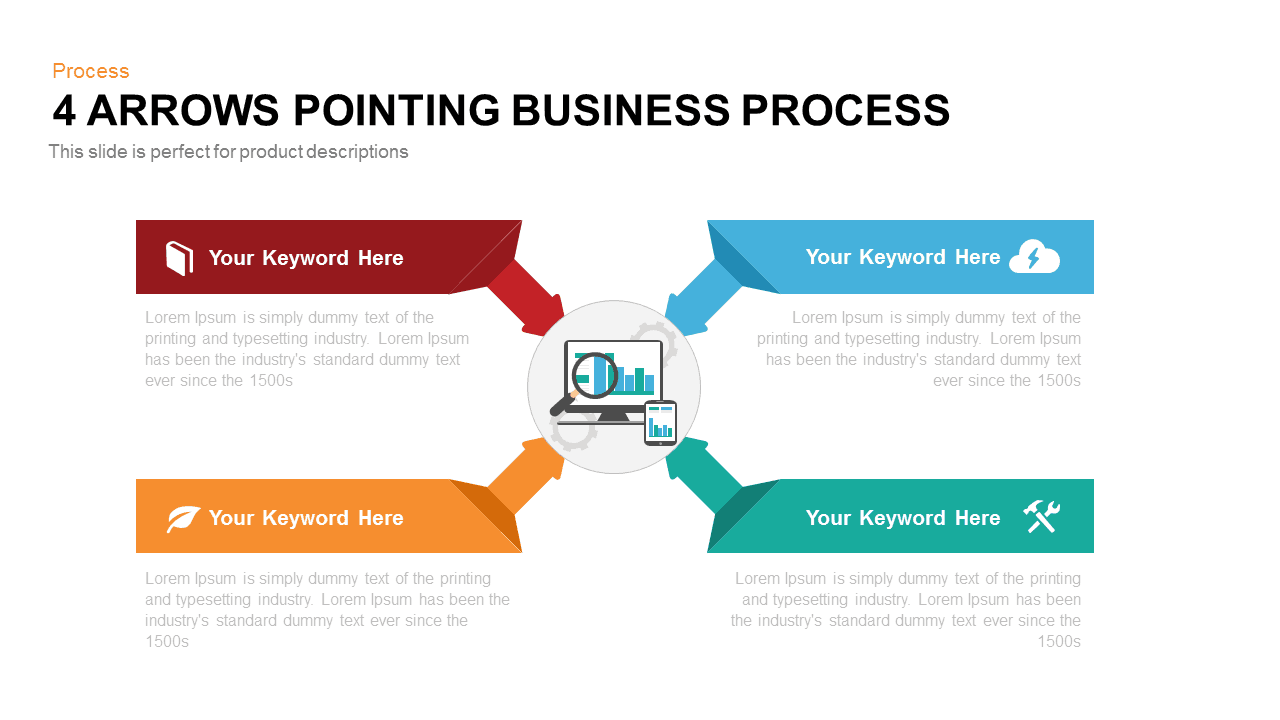
Four Arrows Business Process Diagram template for PowerPoint & Google Slides
Process
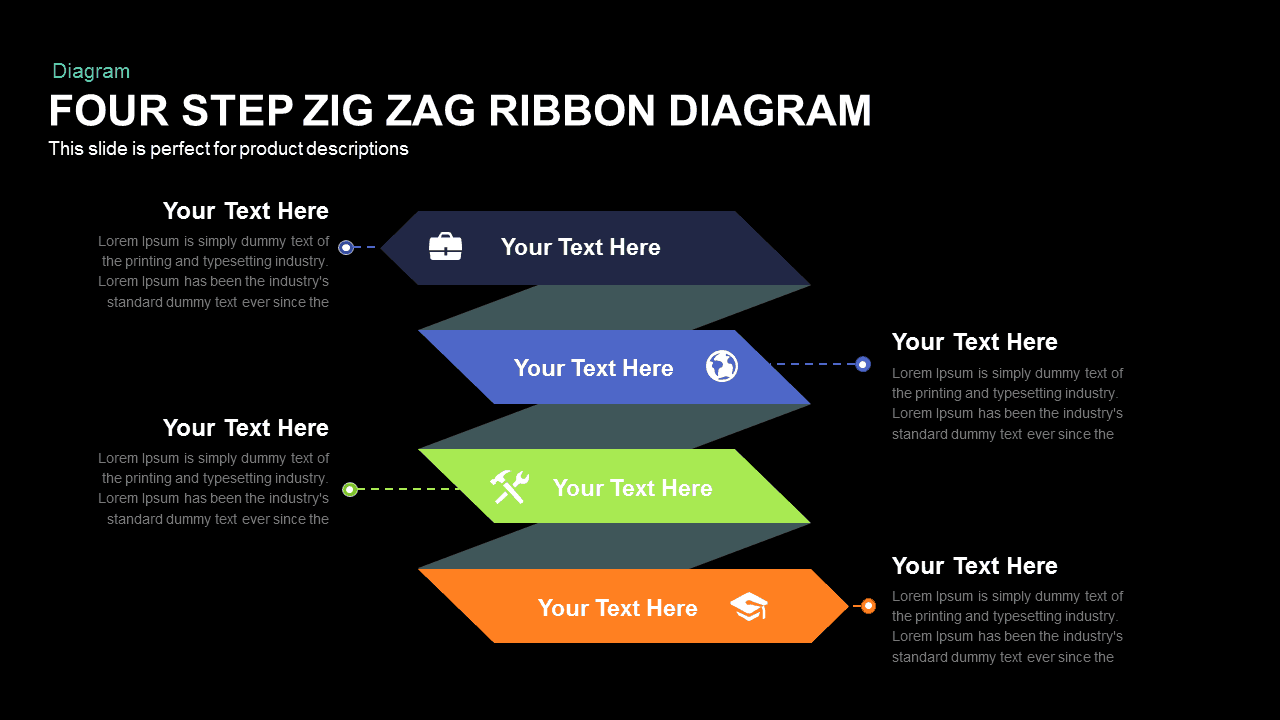
Four-Step Zigzag Ribbon Diagram template for PowerPoint & Google Slides
Arrow
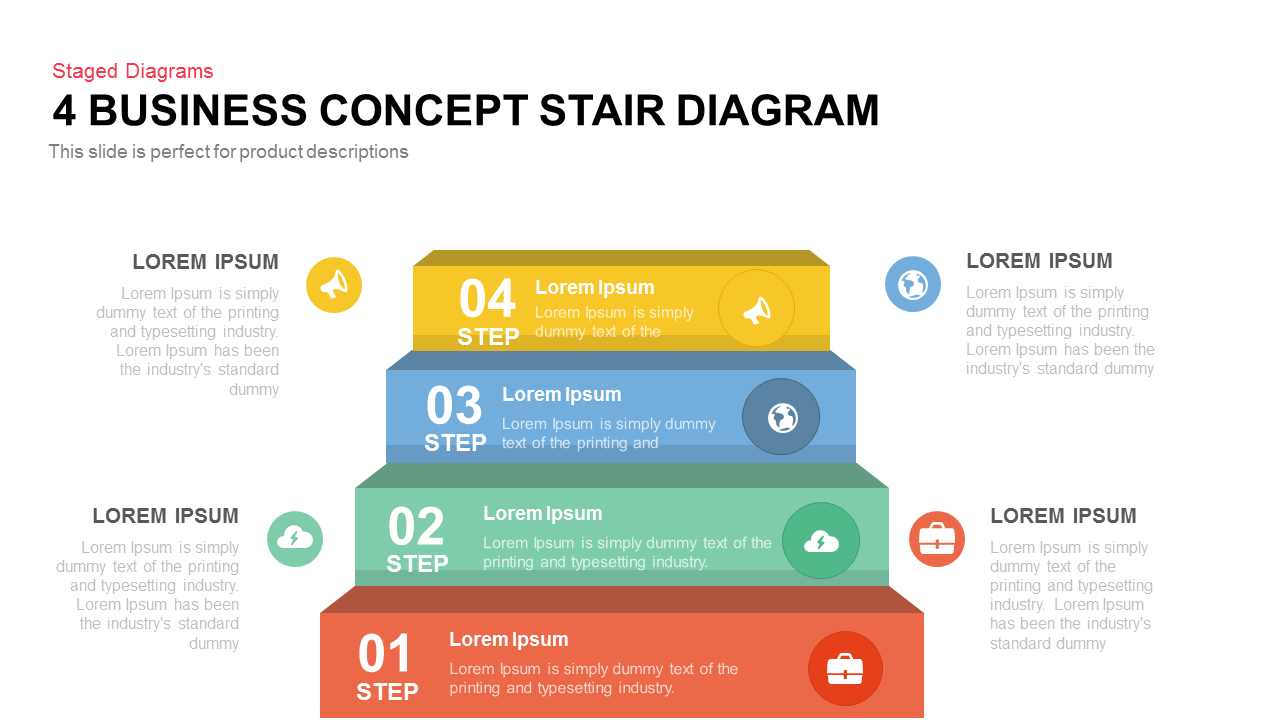
Four-Step Business Staircase Diagram template for PowerPoint & Google Slides
Process

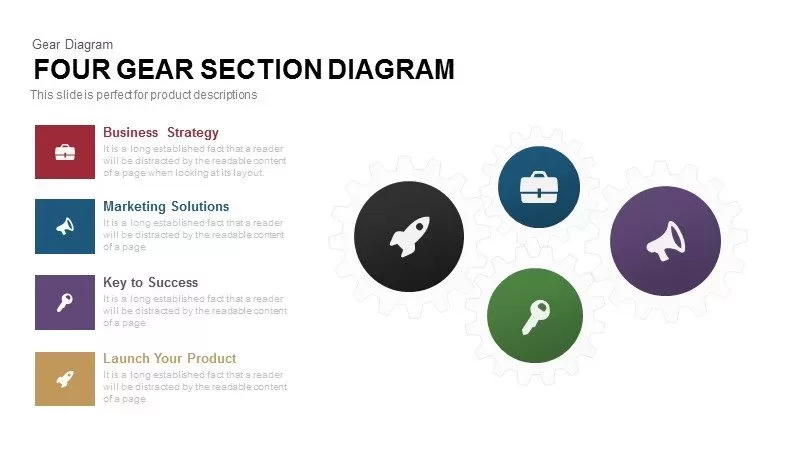
Four Gear Section Diagram Template for PowerPoint & Google Slides
Circular
Four-Circle Venn Process Diagram template for PowerPoint & Google Slides
Process
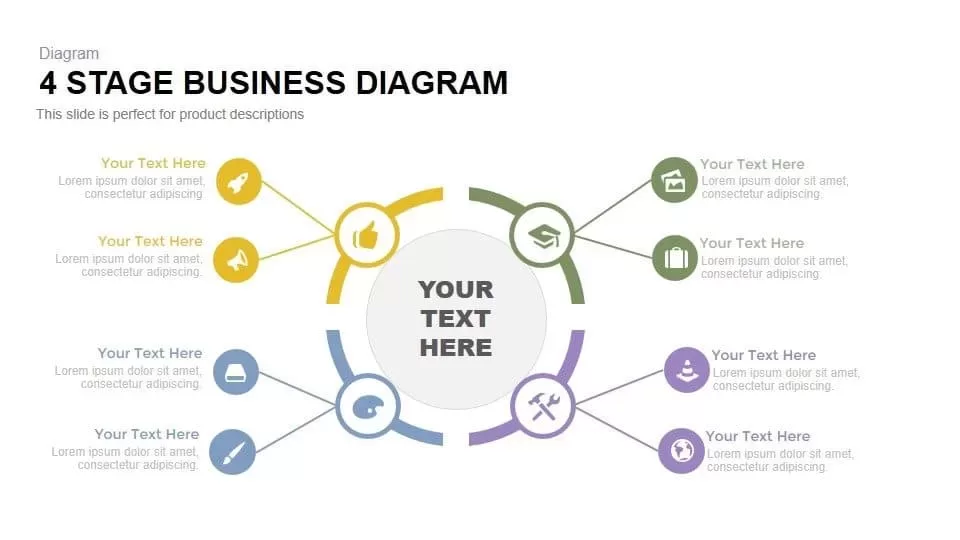
Four-Stage Business Circular Diagram Template for PowerPoint & Google Slides
Process
Pie Segment Diagram Four-Step Process Template for PowerPoint & Google Slides
Pie/Donut
Four Directional Arrow Diagram Template for PowerPoint & Google Slides
Arrow
Professional Four-Stage Funnel Diagram Template for PowerPoint & Google Slides
Funnel
Four-Stage Linear Infographic Diagram Template for PowerPoint & Google Slides
Process
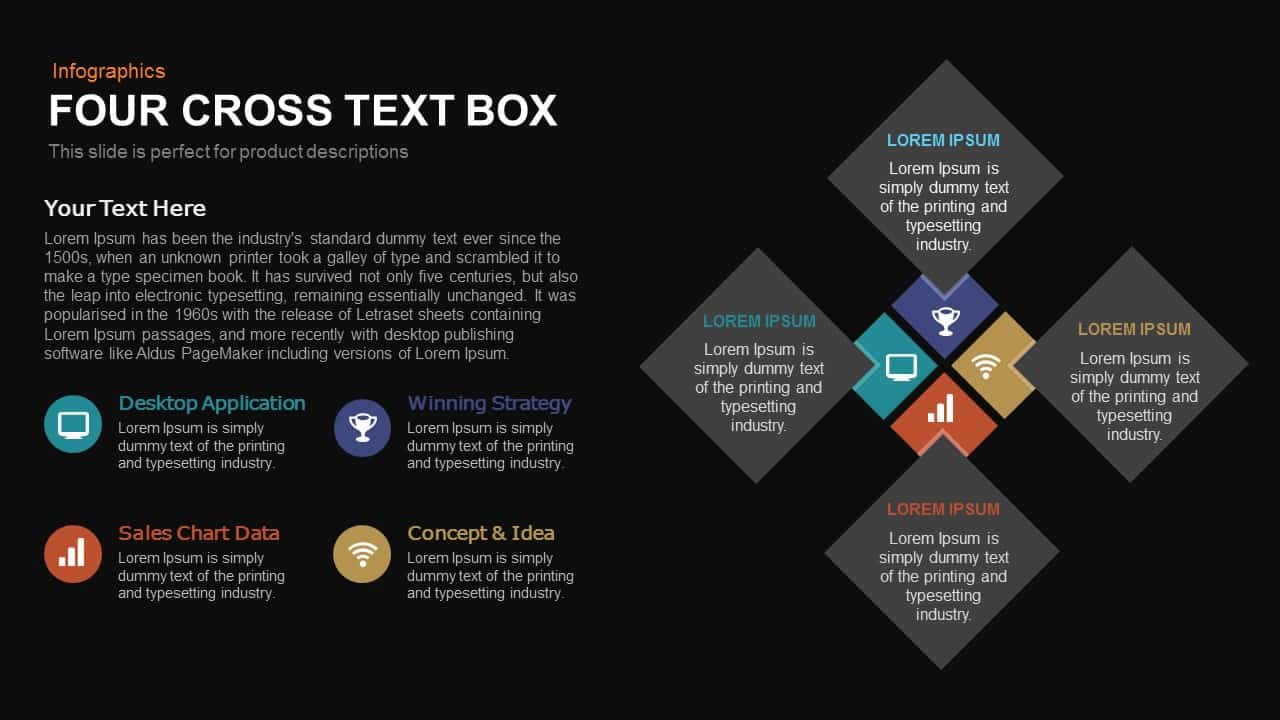
Four-Cross Text Box Diagram Template for PowerPoint & Google Slides
Comparison
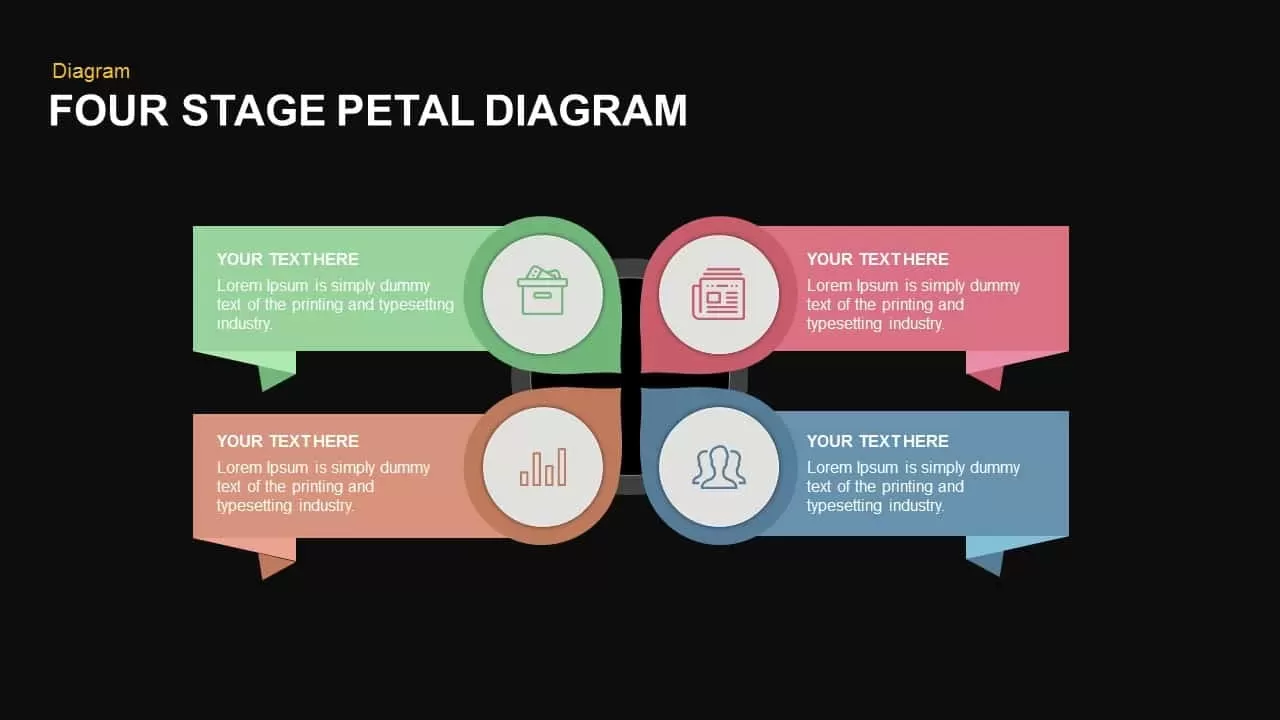
Modern Four-Stage Petal Diagram Template for PowerPoint & Google Slides
Circular
Four and Five-Stage Funnel Diagram Template for PowerPoint & Google Slides
Funnel
Four-Way Directional Arrow Diagram Template for PowerPoint & Google Slides
Arrow
Clean Four-Section Review Diagram Template for PowerPoint & Google Slides
Agenda
Four-Section Strategy Diagram Slide Template for PowerPoint & Google Slides
Business Strategy
Four-Arrows Rectangular Factors Diagram Template for PowerPoint & Google Slides
Process
Editable Four-Section 3D Shape Diagram Template for PowerPoint & Google Slides
Comparison
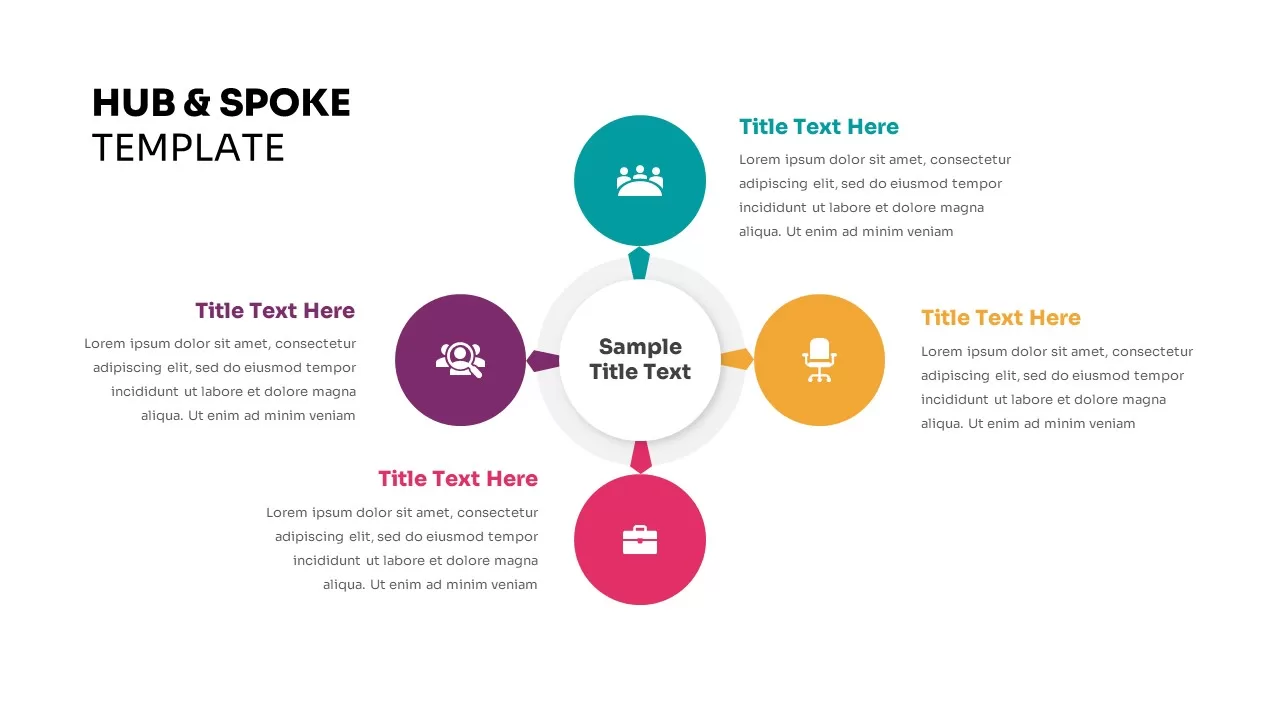
Four-Circle Hub and Spoke Diagram Template for PowerPoint & Google Slides
Process
Flat Four-Box Business Layout Diagram Template for PowerPoint & Google Slides
Process
Four-Section Arrow Infographic Diagram Template for PowerPoint & Google Slides
Arrow
Four-Point Arrow Cycle Diagram Template for PowerPoint & Google Slides
Arrow

Four-Level Business Pyramid Diagram Template for PowerPoint & Google Slides
Pyramid
Four-Staged Business Arrow Diagram Template for PowerPoint & Google Slides
Process
Four-Staged Puzzle Diagram Slide Template for PowerPoint & Google Slides
Process

Four-Plus Process Flow Diagram Template for PowerPoint & Google Slides
Process
Modern Four Stage Gear Diagram Template for PowerPoint & Google Slides
Process
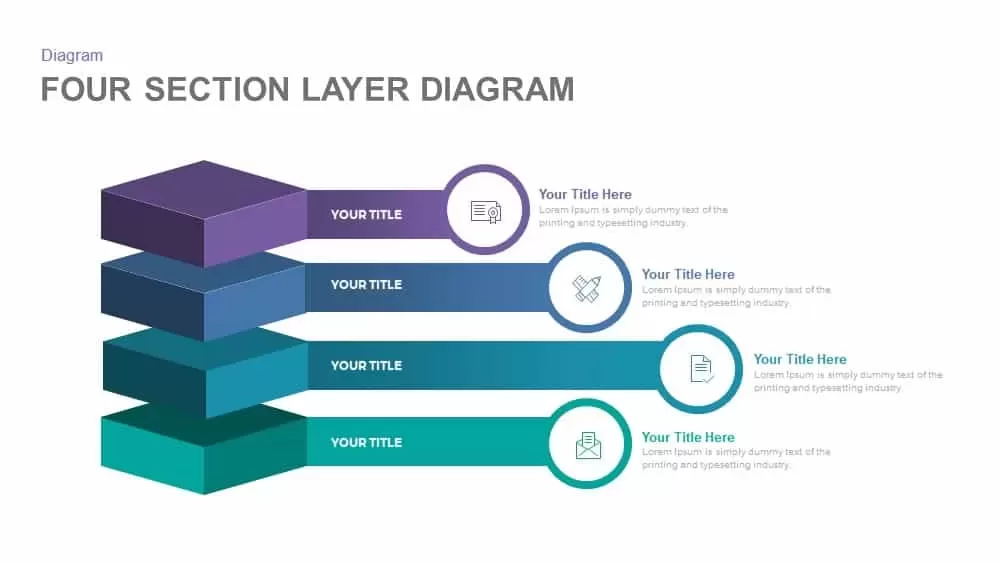
Professional Four-Section Layer Diagram Template for PowerPoint & Google Slides
Process
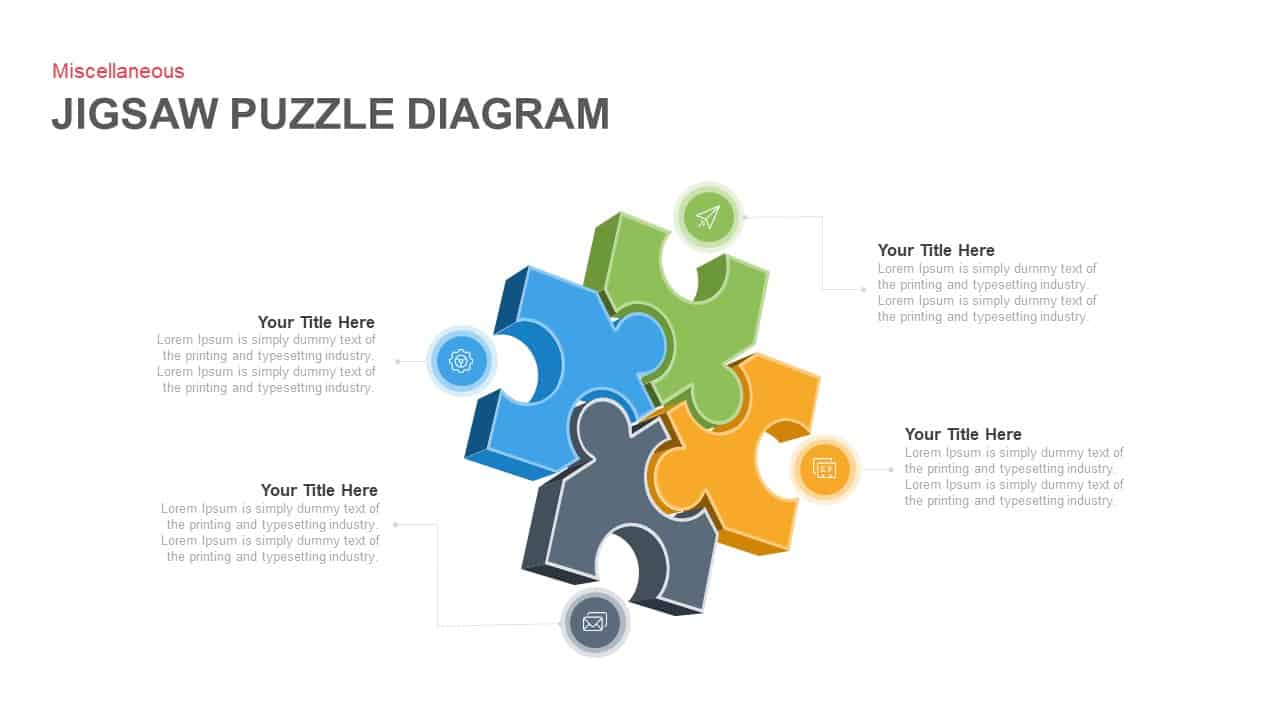
Four-Piece Jigsaw Puzzle Diagram Template for PowerPoint & Google Slides
Process
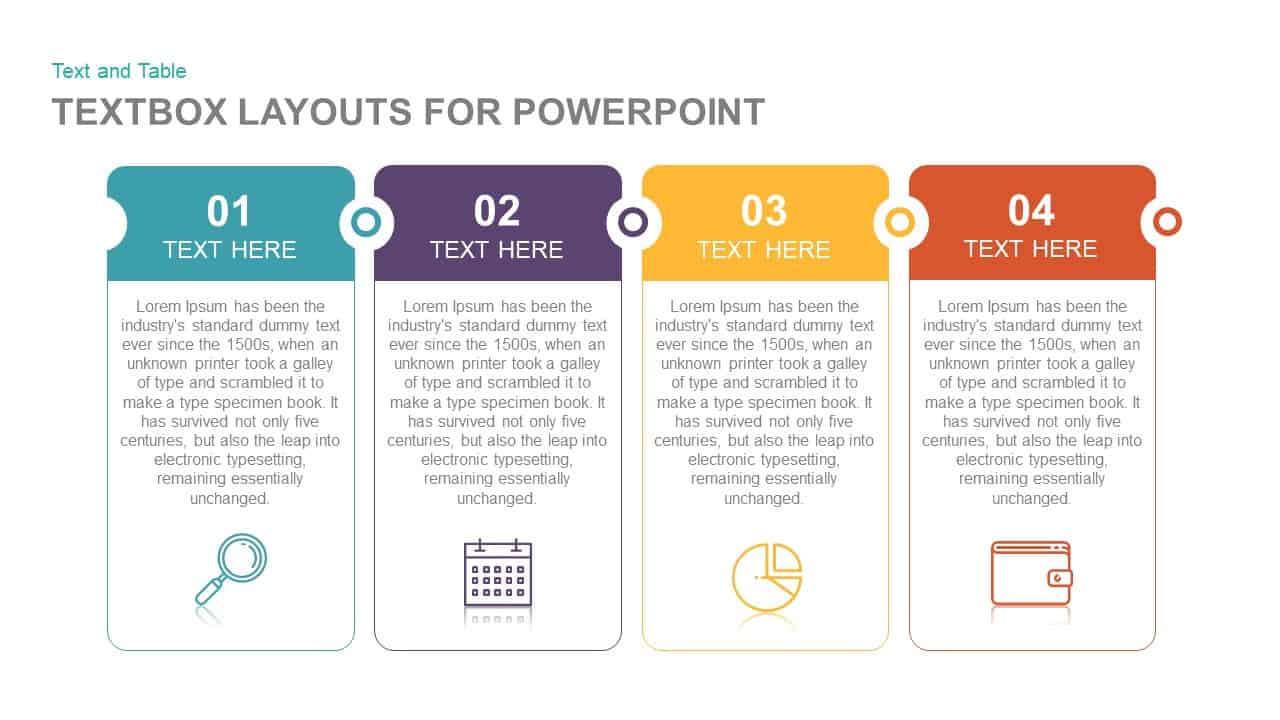
Four-Step Textbox Layout Diagram Template for PowerPoint & Google Slides
Business Report
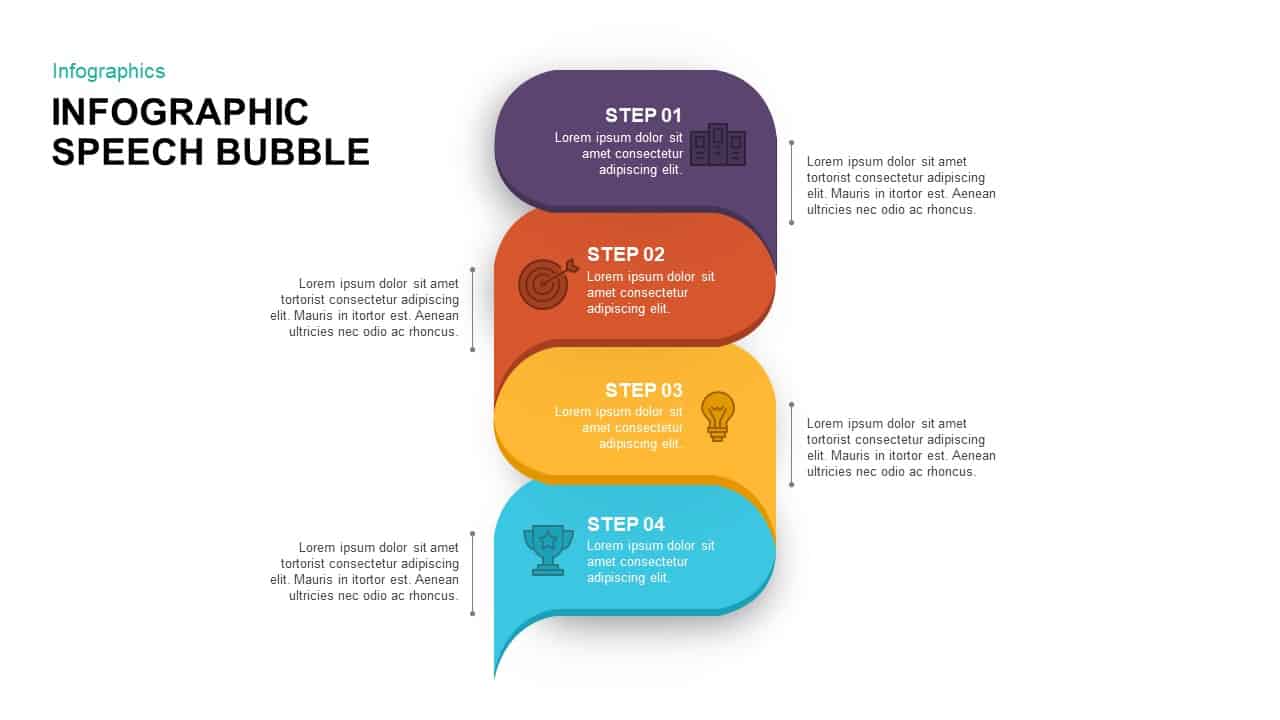
Four-Step Speech Bubble Diagram Template for PowerPoint & Google Slides
Process
Four-Stage Agenda Circle Diagram Slide Template for PowerPoint & Google Slides
Agenda
Four-Stage Circular Diagram Infographic Template for PowerPoint & Google Slides
Circular
Four-Stage Gear Process Diagram Template for PowerPoint & Google Slides
Process
Four-Stage Cycle Process Diagram Template for PowerPoint & Google Slides
Process
Four-Quadrant SWOT Analysis Diagram Template for PowerPoint & Google Slides
SWOT
Concentric Four-Layer Core Diagram Template for PowerPoint & Google Slides
Circular
Four-Stage Linear Process Flow Diagram Template for PowerPoint & Google Slides
Process
Four-Stage Circular Flow Diagram Template for PowerPoint & Google Slides
Circular
Hand-Held Four-Step Process Diagram Template for PowerPoint & Google Slides
Process
Four-Stage Start-Up Plan Arc Diagram Template for PowerPoint & Google Slides
Process
Four-Stage Funnel Diagram Infographic Template for PowerPoint & Google Slides
Funnel
Four-Step Spiral Funnel Diagram Template for PowerPoint & Google Slides
Funnel
Four-Part SWOT Analysis Diagram Template for PowerPoint & Google Slides
SWOT
Four-Step Puzzle Diagram Infographic Template for PowerPoint & Google Slides
Process
Four-Stage Funnel Diagram Infographic Template for PowerPoint & Google Slides
Funnel
Four Section Diagram Infographics template for PowerPoint & Google Slides
Process
Four Business Structure Types Comparison Diagram Template for PowerPoint & Google Slides
Business Strategy

Four Section Infographic Diagram Template for PowerPoint & Google Slides
Circular
Four-Phase Maturity Model Diagram Template for PowerPoint & Google Slides
Process
Four-Option Cross Infographic Diagram Template for PowerPoint & Google Slides
Comparison
Four-Item Circular Diagram Concept Template for PowerPoint & Google Slides
Circular
Gradient Four-Step Roadmap Diagram Template for PowerPoint & Google Slides
Roadmap
Four-Step Objective Goal Diagram Template for PowerPoint & Google Slides
Goals
Elegant PDCA Four-Step Process Diagram Template for PowerPoint & Google Slides
Process
Four-Arrow Curved Hub-and-Spoke Diagram Template for PowerPoint & Google Slides
Arrow
Hand-Drawn Four-Step Curved Arrow Diagram Template for PowerPoint & Google Slides
Arrow
Four-Step Curved Arrow Diagram Template for PowerPoint & Google Slides
Arrow
Four-Point Hub and Spoke Diagram Template for PowerPoint & Google Slides
Business Strategy
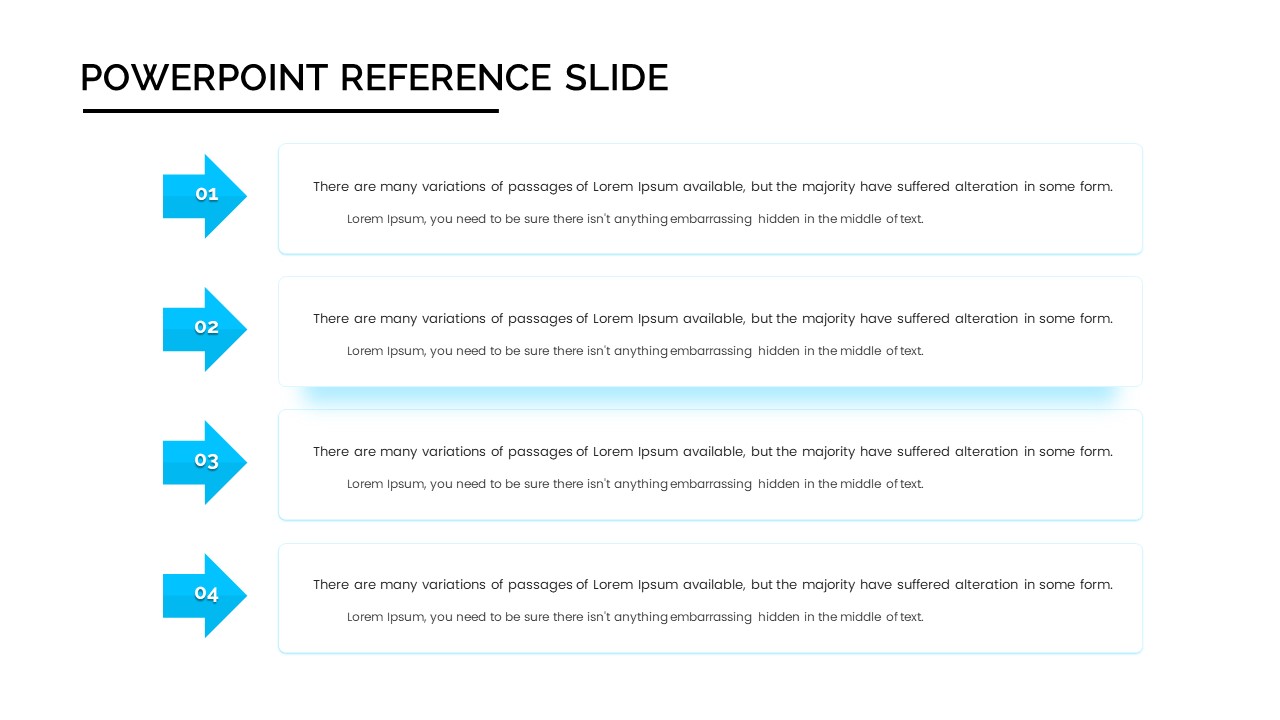
Four-Step Arrow Reference Diagram Slide Template for PowerPoint & Google Slides
Arrow
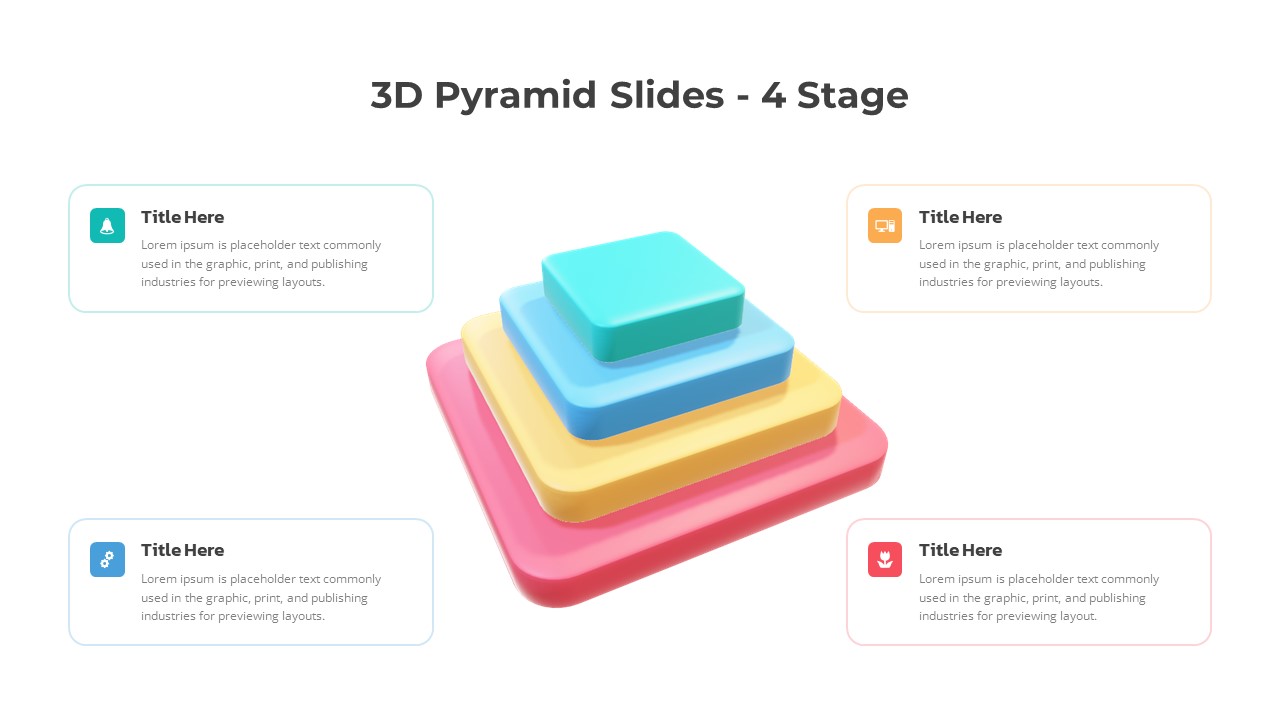
3D Four-Stage Pyramid Diagram Template for PowerPoint & Google Slides
Pyramid
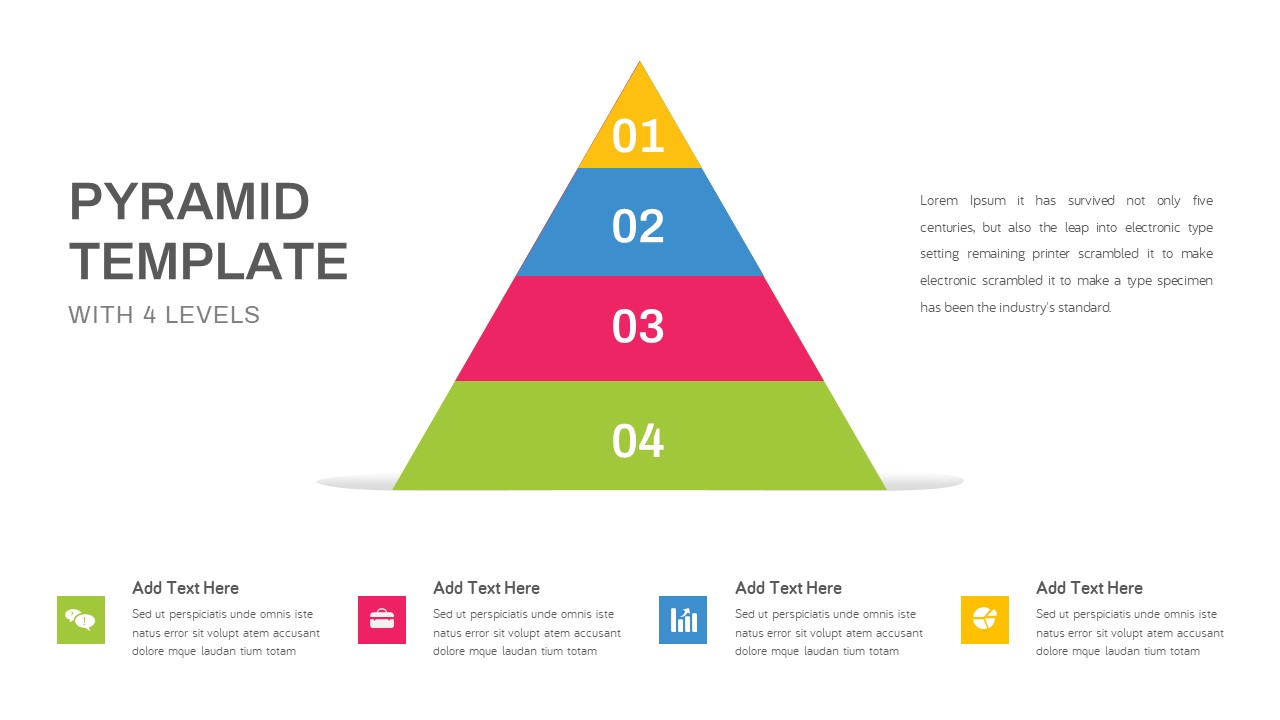
Four-Level Colorful Pyramid Diagram Template for PowerPoint & Google Slides
Pyramid
Modern Four-Level Pyramid Diagram Template for PowerPoint & Google Slides
Pyramid
Free Journey Slide with Four Icons Diagram Template for PowerPoint & Google Slides
Process
Free
Four-Phase Decarbonization Diagram Template for PowerPoint & Google Slides
Process
Revenue Streams: Four Channels Diagram Template for PowerPoint & Google Slides
Business Models
Engaging Four-Option Strategy Diagram Template for PowerPoint & Google Slides
Business Strategy
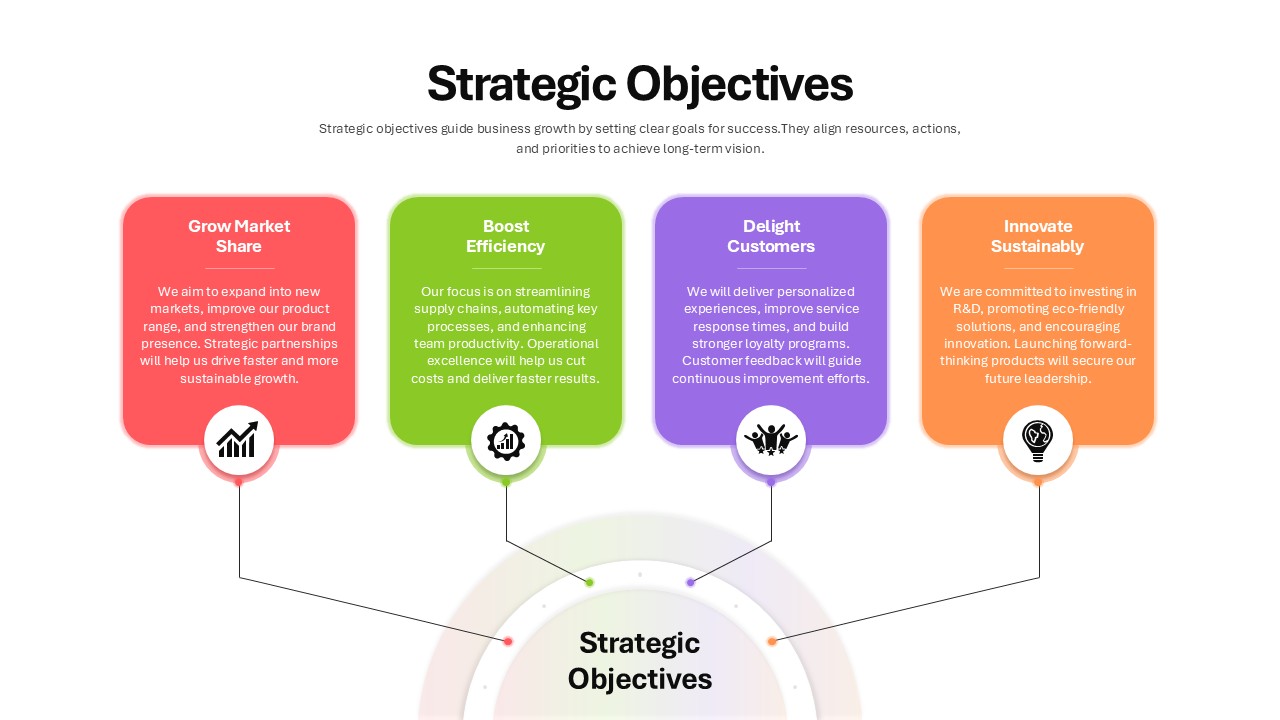
Four Strategic Objectives Radial Diagram Template for PowerPoint & Google Slides
Business Strategy
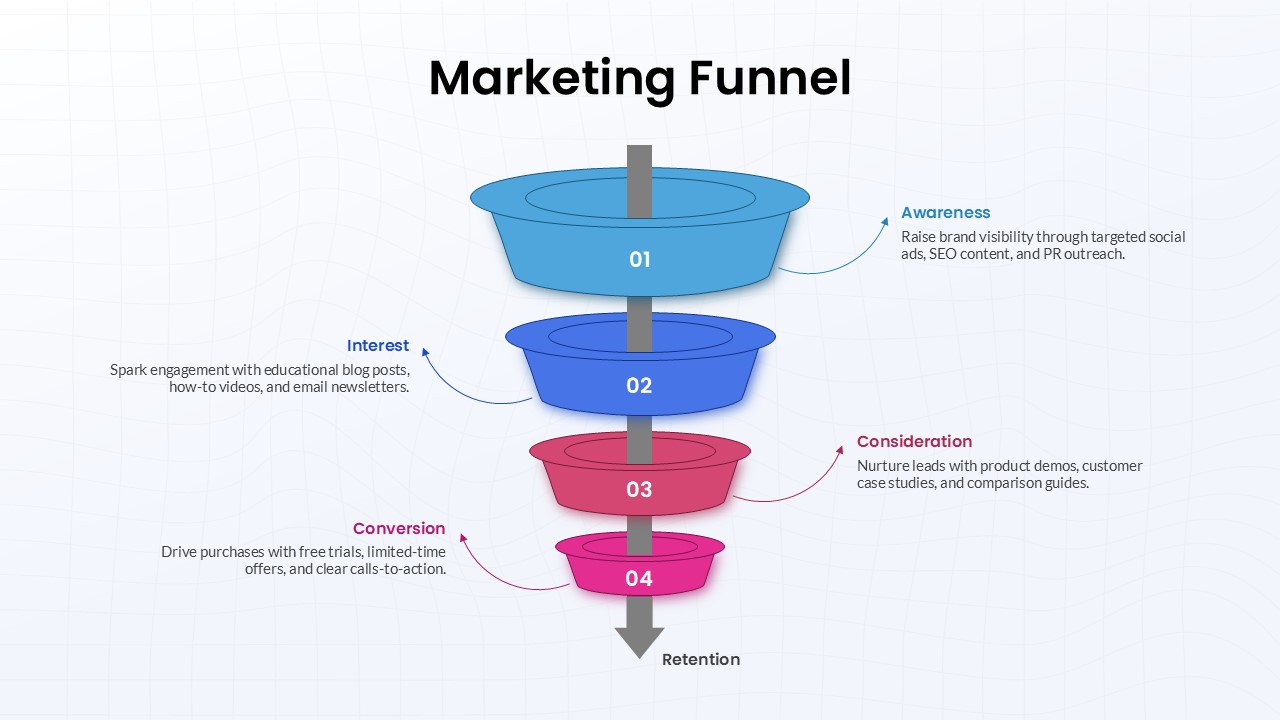
Four-Stage Marketing Funnel Diagram Template for PowerPoint & Google Slides
Marketing Funnel
Four-Level Colorful Pyramid Diagram Template for PowerPoint & Google Slides
Pyramid
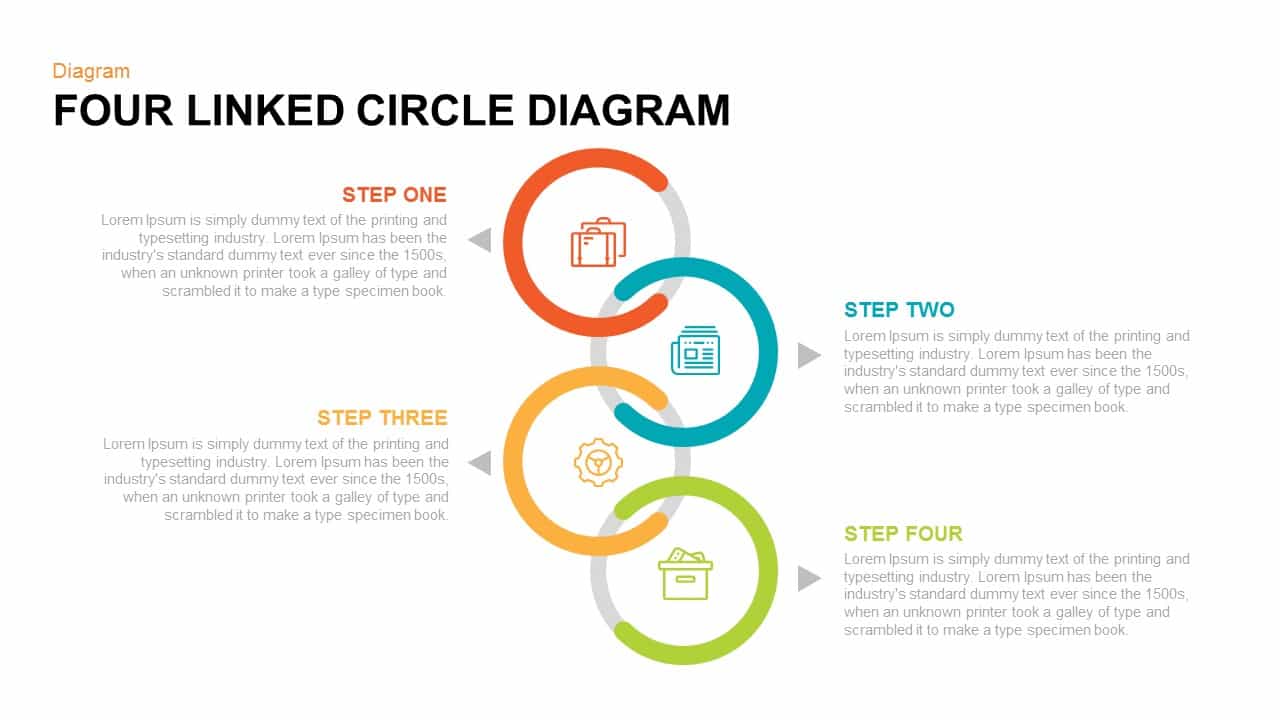
Four Linked Circle Diagram for PowerPoint & Google Slides
Process

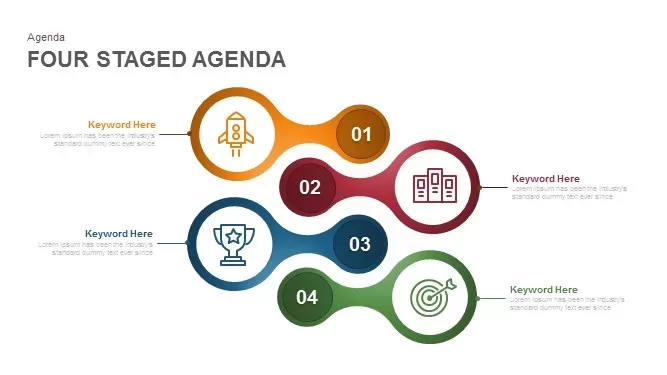
Four Staged Agenda Diagram for PowerPoint & Google Slides
Agenda
Four Step Infographics Diagram for PowerPoint & Google Slides
Process
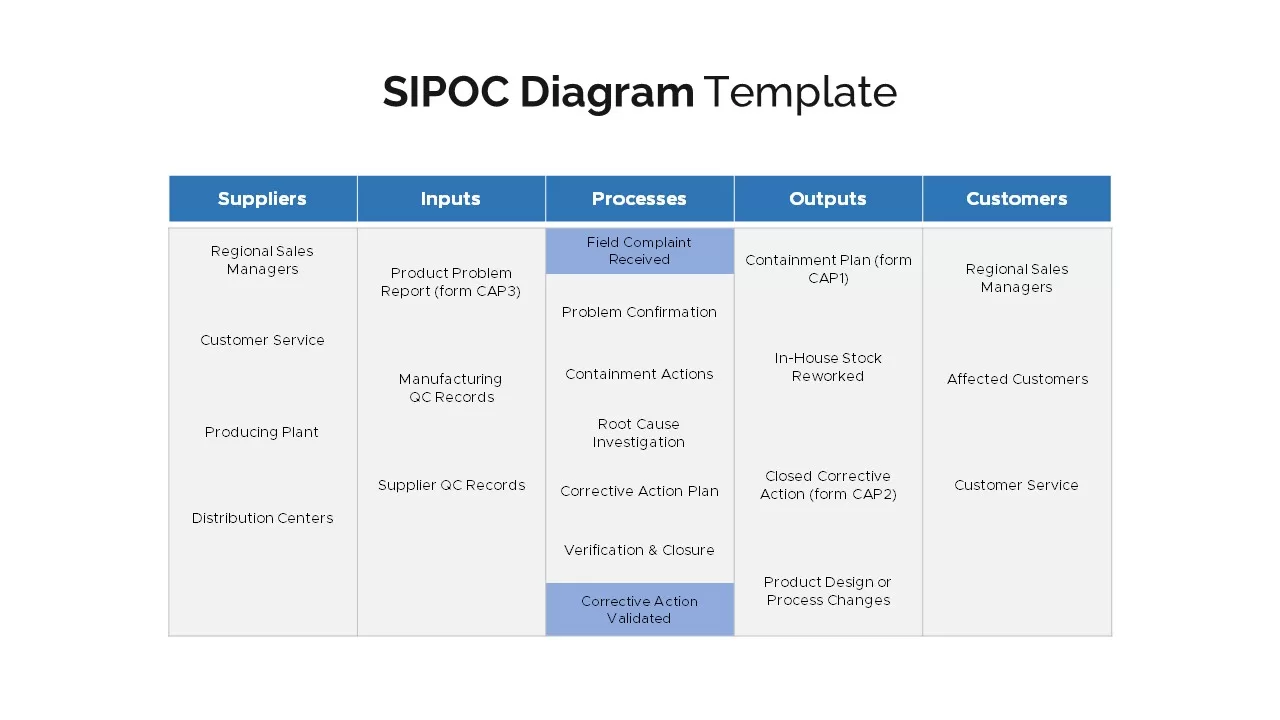
Four SIPOC Diagram Infographic Templates for PowerPoint & Google Slides
Business Plan
Simple Multi-Branch Mind Map Template for PowerPoint & Google Slides
Mind Maps
Simple Black and White Presentation Template for PowerPoint & Google Slides
Pitch Deck
Simple Agenda Slide Deck Overview Template for PowerPoint & Google Slides
Agenda
Free Editable Simple Column Chart Slide Template for PowerPoint & Google Slides
Bar/Column
Free
Simple Scatter Chart Analysis Template for PowerPoint & Google Slides
Comparison Chart

Free Simple Green Plant Company Profile Deck Template for PowerPoint & Google Slides
Company Profile
Free