Three-Section Fishbone Process Diagram template for PowerPoint & Google Slides


Description
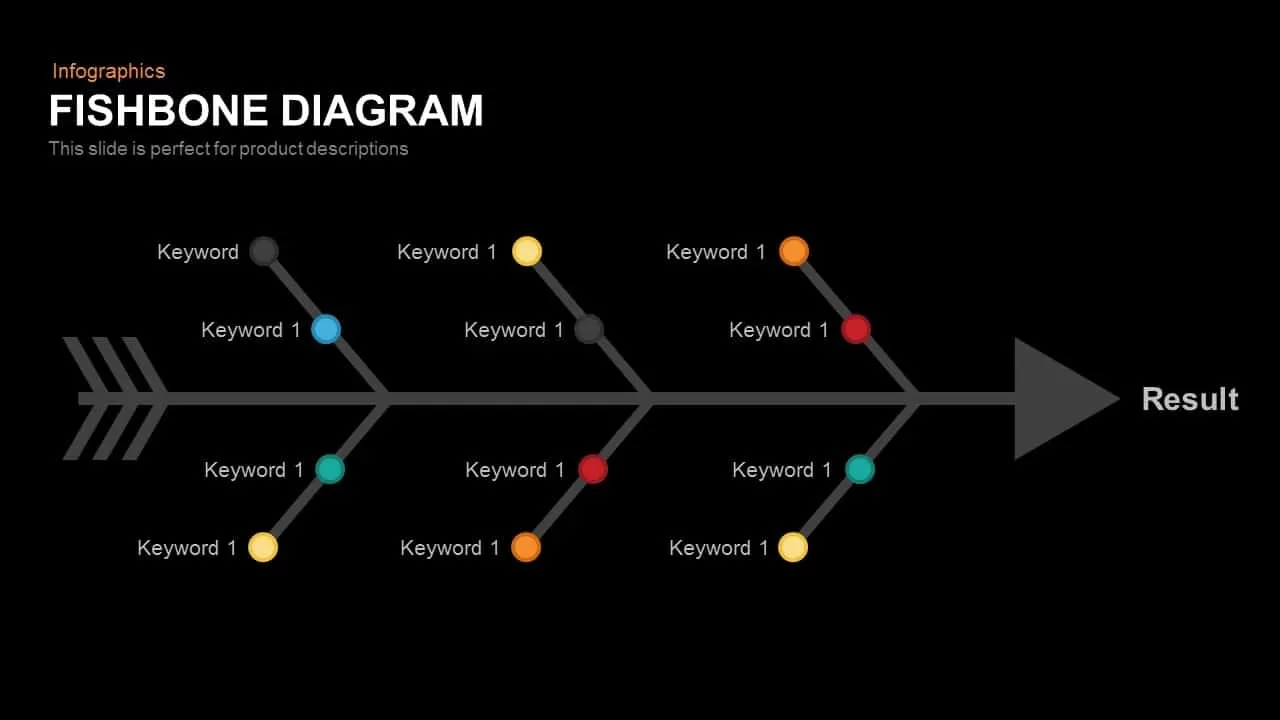
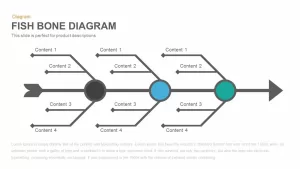
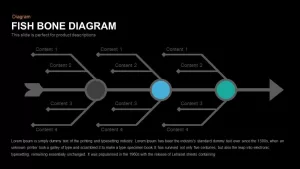
Harness the power of this three-section fishbone process diagram to conduct clear, structured root‐cause analyses and present complex cause‐and‐effect relationships with ease. The slide features a central spine with three color‐accented nodes—dark gray, blue, and green—each branching into four diamond‐tipped lines for listing key factors or issues. The flat‐design aesthetic, generous white space, and minimalist typography ensure your content takes center stage without visual clutter. Fully vectorized, all elements are easily editable: adjust node colors, swap icons, modify line weights, or relabel branches to match your brand palette and terminology in seconds.
Built on master layouts for both PowerPoint and Google Slides, this diagram slide streamlines your workflow with intuitive placeholders and scalable shapes that maintain crisp resolution at any display size. Leverage the three‐node structure to categorize primary problem areas, drill down into contributing factors, or map project risks and challenges. The clean, linear flow guided by the arrowhead tail keeps audiences’ attention focused on how individual components feed into overarching outcomes. Whether you’re facilitating a team workshop, preparing a stakeholder briefing, or teaching a quality‐management course, this fishbone diagram slide empowers you to visualize interdependencies, spark deeper discussions, and drive consensus around actionable solutions.
Who is it for
Quality managers, project leaders, process improvement specialists, and consultants will find this fishbone diagram slide invaluable for diagnosing root causes, structuring brainstorming sessions, or presenting systematic analyses. It also serves educators, trainers, and operational teams seeking a concise, professional‐grade tool to guide problem‐solving workshops, Six Sigma initiatives, or strategic reviews.
Other Uses
Beyond root‐cause analysis, repurpose this three‐node layout for risk assessments, stakeholder mapping, competitive benchmarking, or decision‐making frameworks. Customize branch labels to illustrate customer journey touchpoints, product feature comparisons, or project milestone dependencies—making this diagram a versatile asset across functions and industries.
Login to download this file

Item ID
SB00220
Related Templates

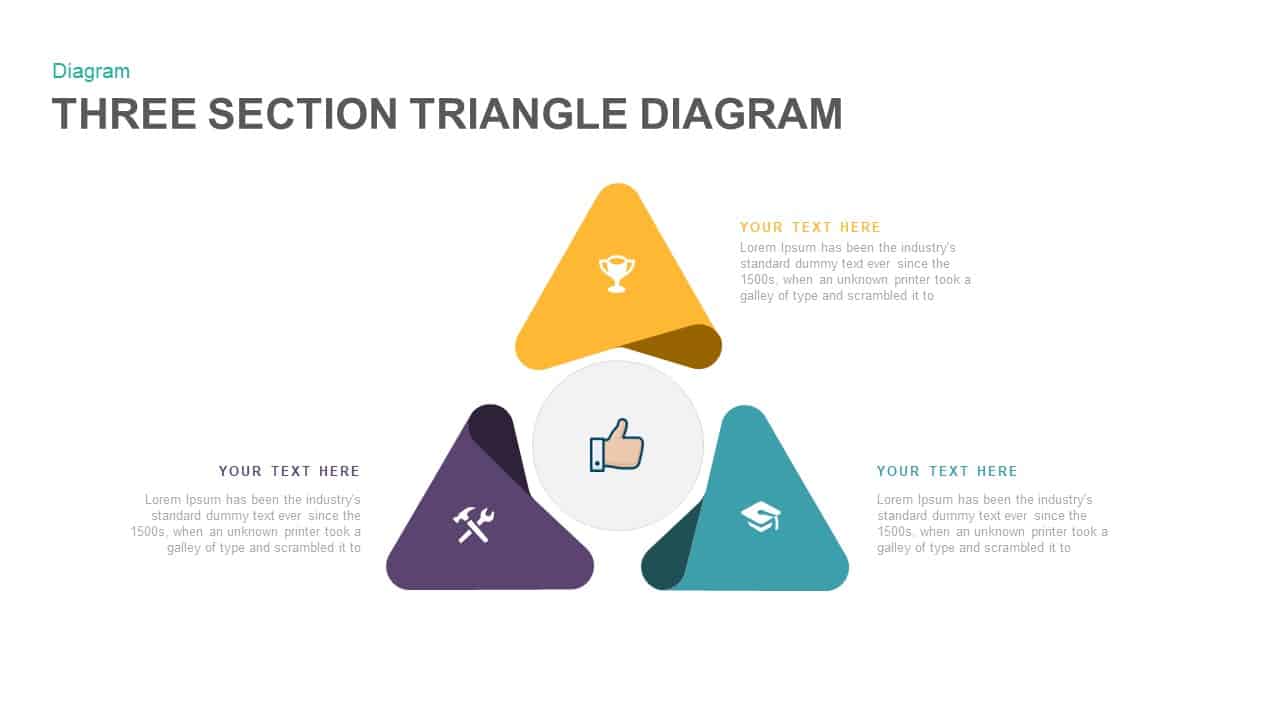
Three Section Triangle Diagram Template for PowerPoint & Google Slides
Process
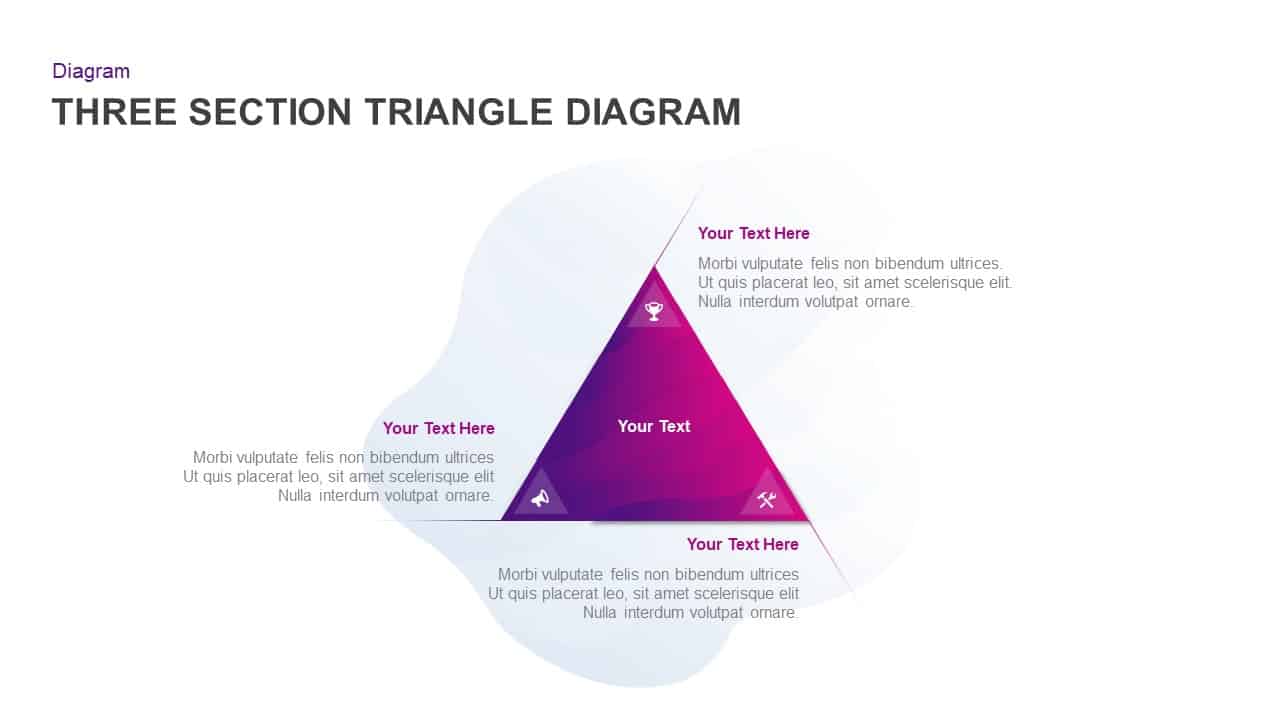
Three-Section Triangle Diagram Template for PowerPoint & Google Slides
Pyramid
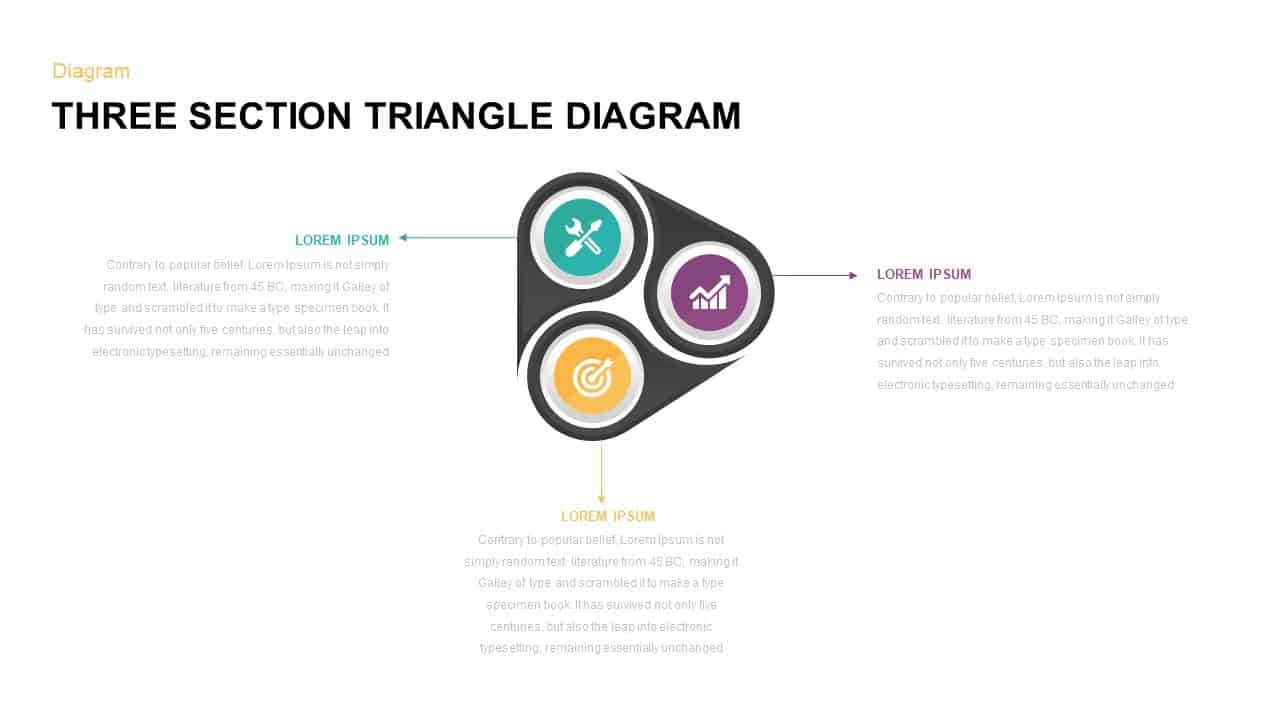
Three Section Triangle Diagram Template for PowerPoint & Google Slides
Process
Fishbone Process Diagram template for PowerPoint & Google Slides
Infographics
Three Circle Arrow Process Diagram template for PowerPoint & Google Slides
Circular

Three Stage 3D Arrow Process Diagram Template for PowerPoint & Google Slides
Process

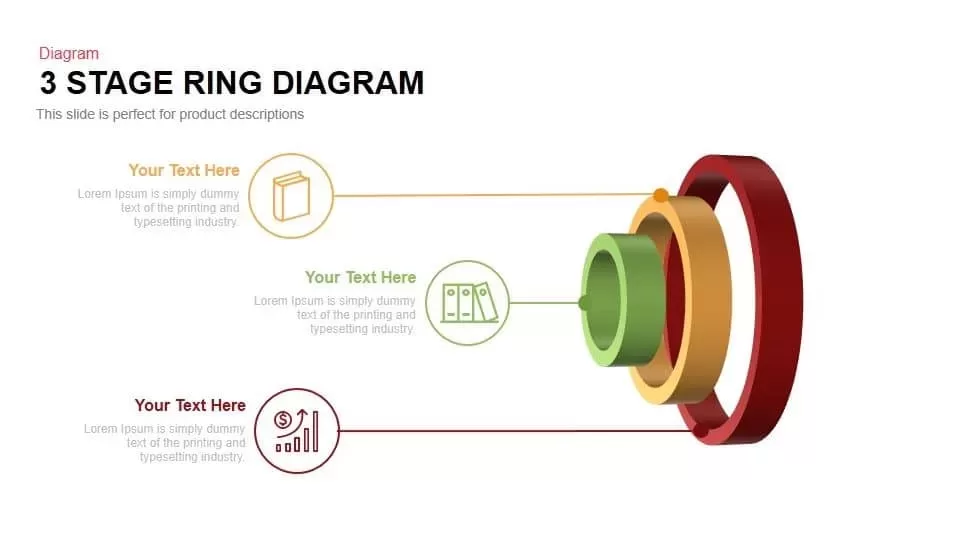
Three-Stage Ring Process Diagram Template for PowerPoint & Google Slides
Circular
Engaging Three-Stage Process Diagram Template for PowerPoint & Google Slides
Process
Three Level Funnel Process Diagram Template for PowerPoint & Google Slides
Funnel
Three-Way Decision Process Arrow Diagram Template for PowerPoint & Google Slides
Arrow
Three to Nine-Step Puzzle Ring Process Diagram Template for PowerPoint & Google Slides
Circular
Three-Step Flowchart Process Diagram Template for PowerPoint & Google Slides
Flow Charts
Three-Stage Loop Process Diagram Template for PowerPoint & Google Slides
Process
Three-Step Curved Arrow Process Diagram Template for PowerPoint & Google Slides
Arrow
Modern Three-Point Process Diagram Template for PowerPoint & Google Slides
Process
Fishbone RCA Diagram Template for PowerPoint & Google Slides
Business Strategy
Fishbone Diagram Overview template for PowerPoint & Google Slides
Infographics
Fishbone Diagram Cause-and-Effect Template for PowerPoint & Google Slides
Process
Free Color-Coded Fishbone Diagram Template for PowerPoint & Google Slides
Project
Free
Fishbone Cause and Effect Diagram Template for PowerPoint & Google Slides
Process
Fishbone Diagram Analysis Template for PowerPoint & Google Slides
Flow Charts
Fishbone Cause Analysis Diagram Template for PowerPoint & Google Slides
Process
Underwater Fishbone Cause-Effect Diagram Template for PowerPoint & Google Slides
Process
Free Root Cause Analysis Fishbone Diagram Template for PowerPoint & Google Slides
Process
Free
Fishbone (Ishikawa) Diagram for PowerPoint & Google Slides
Process
5 Why Fishbone Diagram for Root Cause Analysis in PowerPoint & Google Slides
Process

Three-Circle Process Infographic Template for PowerPoint & Google Slides
Circular
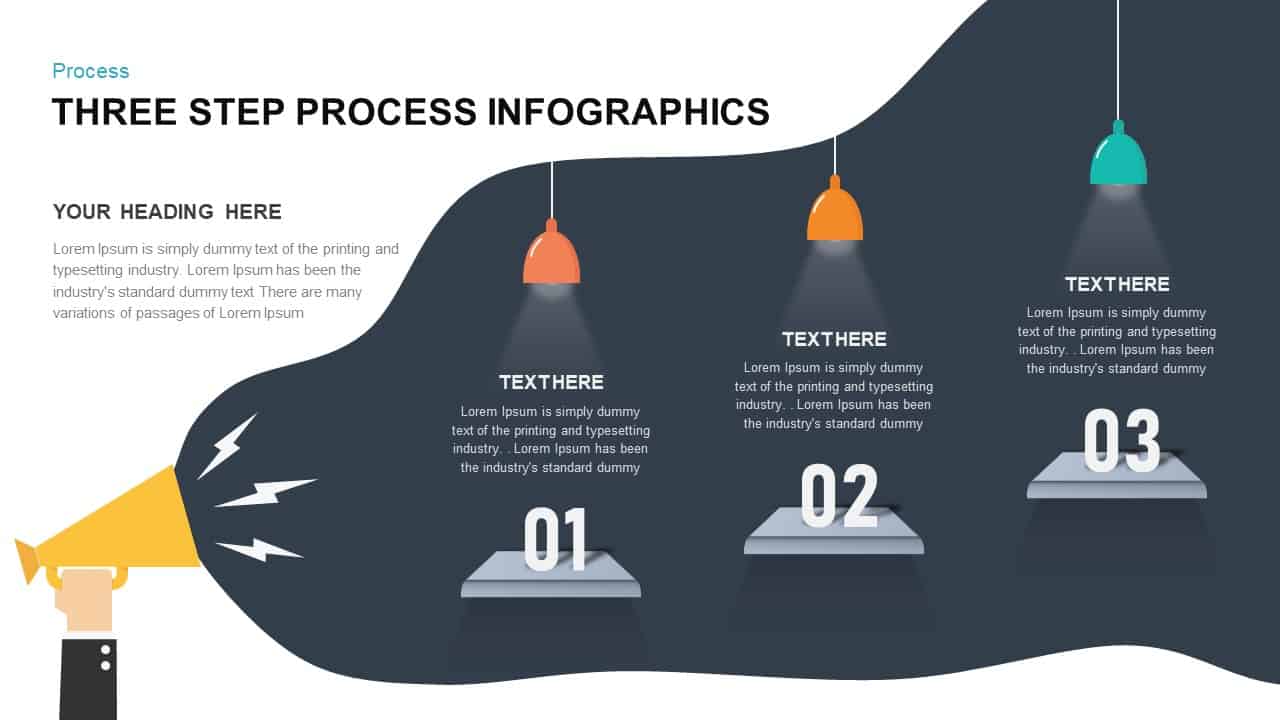
Three-Step Process Infographics Template for PowerPoint & Google Slides
Process
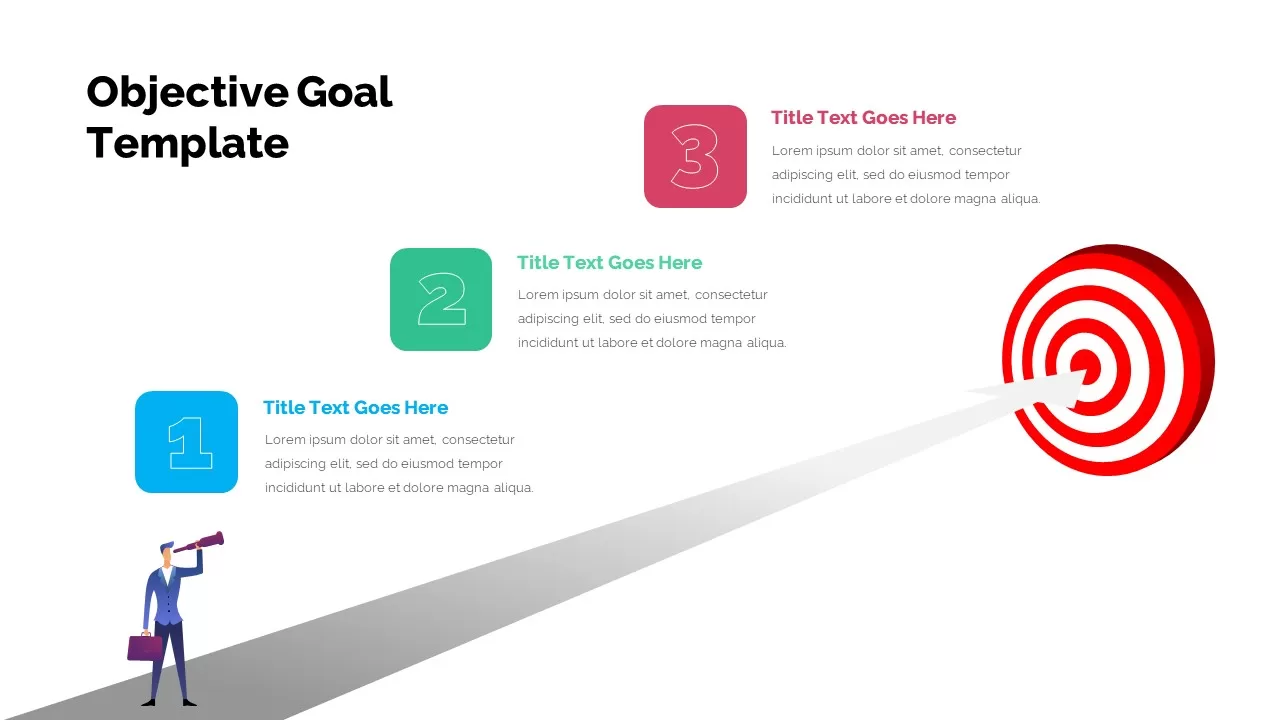
Three-Step Objective Goal Process Template for PowerPoint & Google Slides
Goals
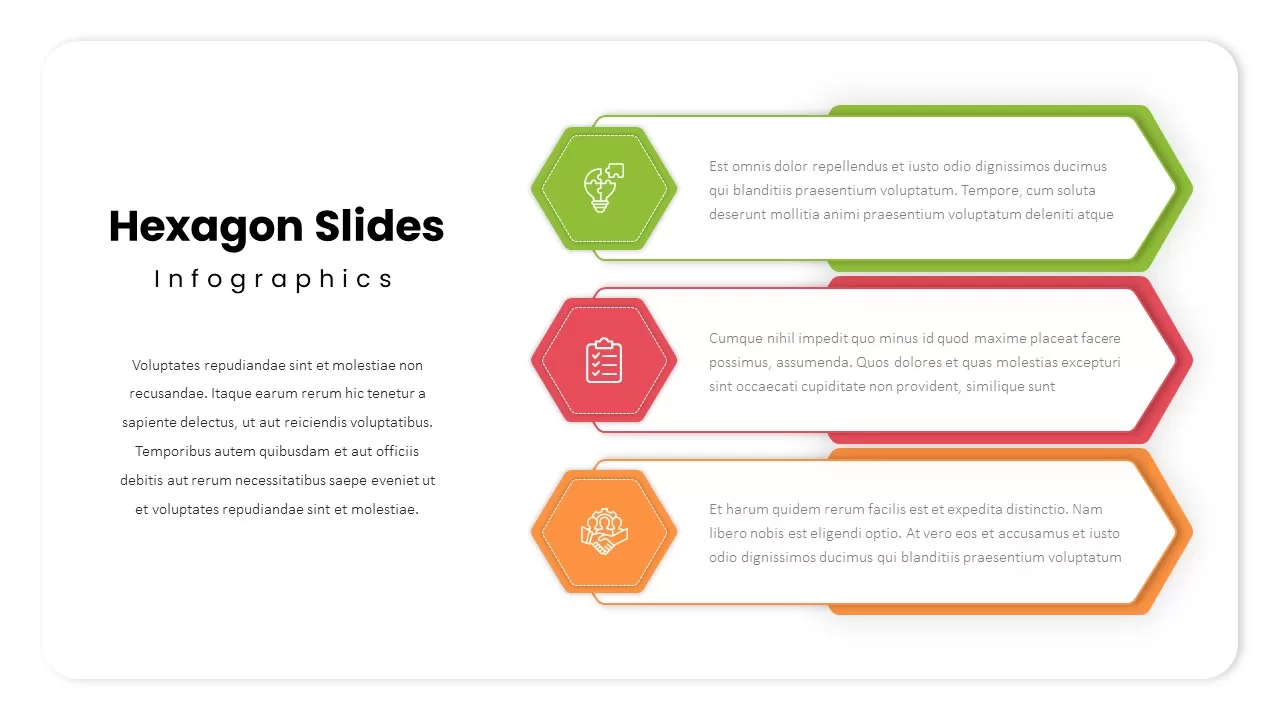
Three-Step Hexagon Infographic Process Template for PowerPoint & Google Slides
Process
Open Door Policy Three-Step Process Template for PowerPoint & Google Slides
Process
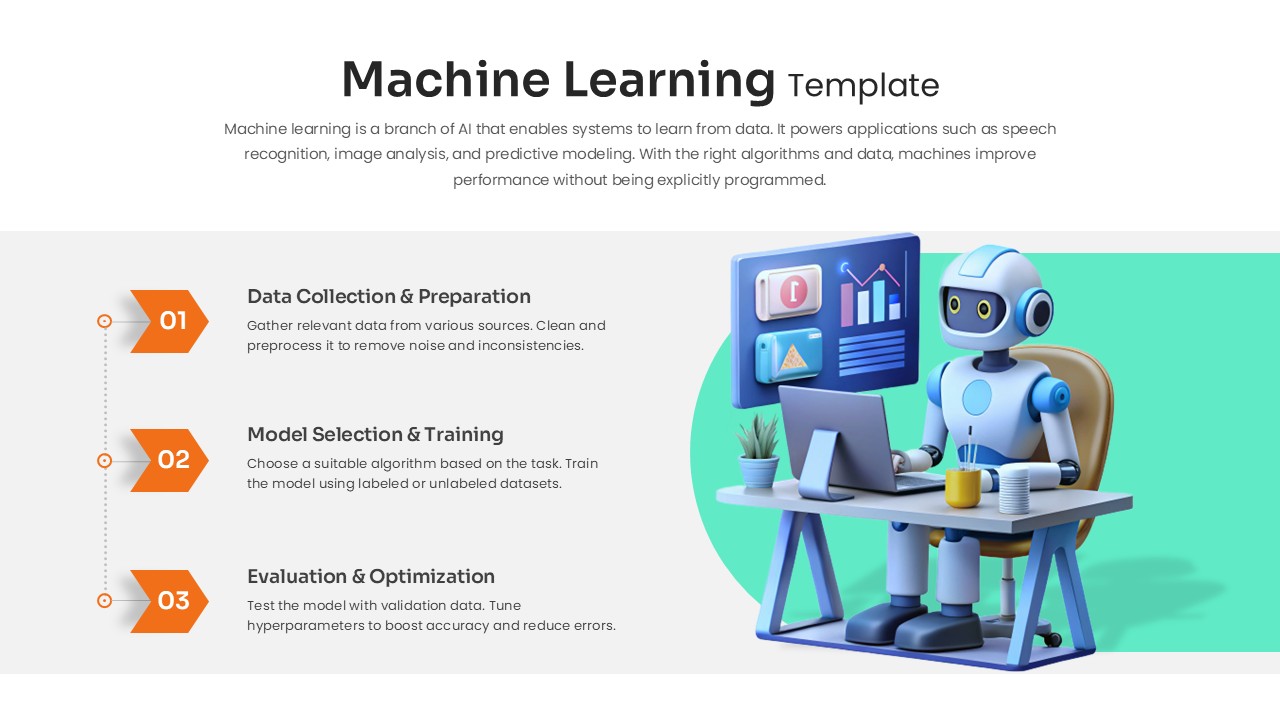
Machine Learning Three-Step Process Template for PowerPoint & Google Slides
Machine Learning
Fishbone Cause and Effect Infographic Template for PowerPoint & Google Slides
Infographics
Fishbone Timeline Infographic Series Template for PowerPoint & Google Slides
Manufacturing
4 Section Pipe Diagram Process Flow Template for PowerPoint & Google Slides
Process
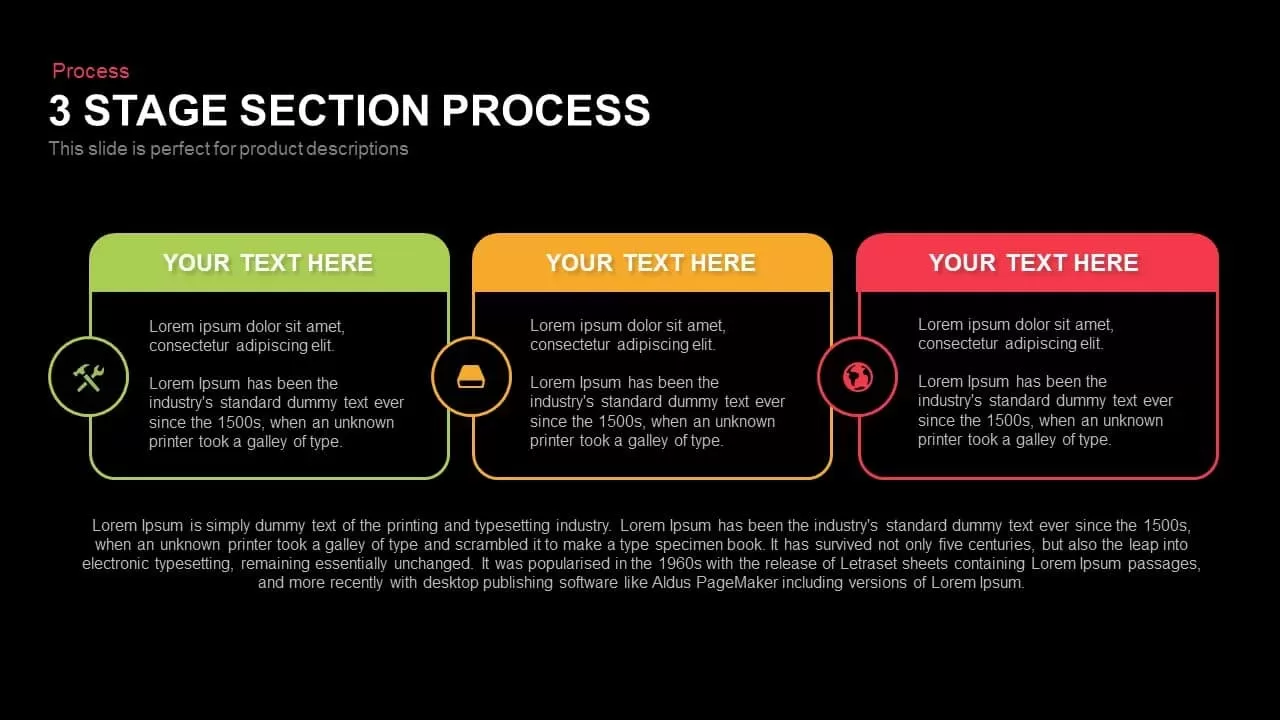
3 Stage Section Process Diagram Template for PowerPoint & Google Slides
Process
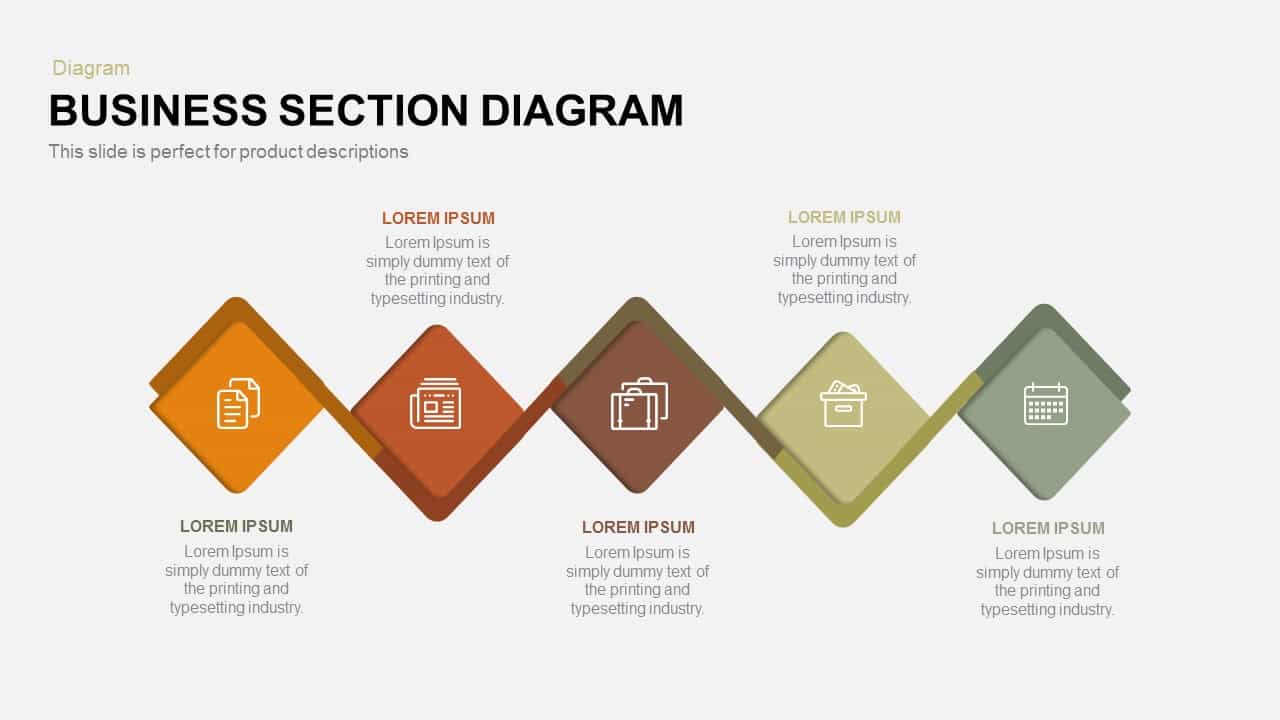
Business Section Diamond Process Diagram Template for PowerPoint & Google Slides
Process
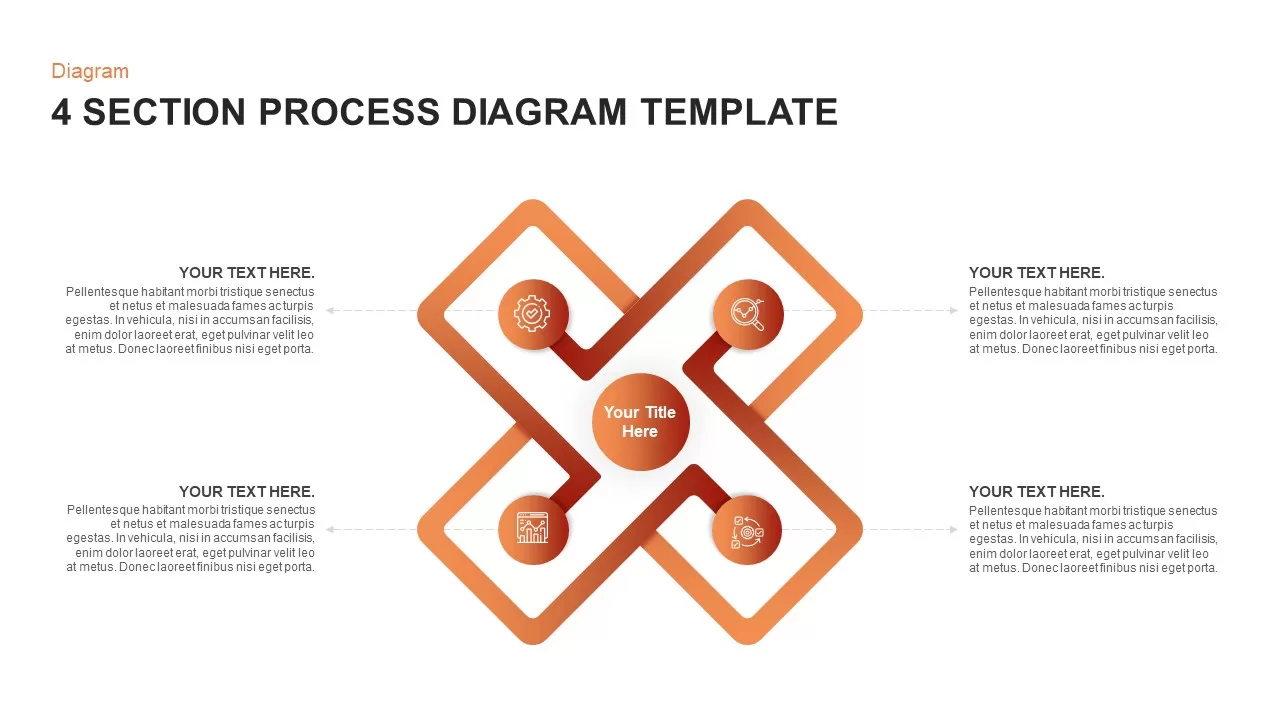
Modern 4 Section Process Diagram Template for PowerPoint & Google Slides
Process
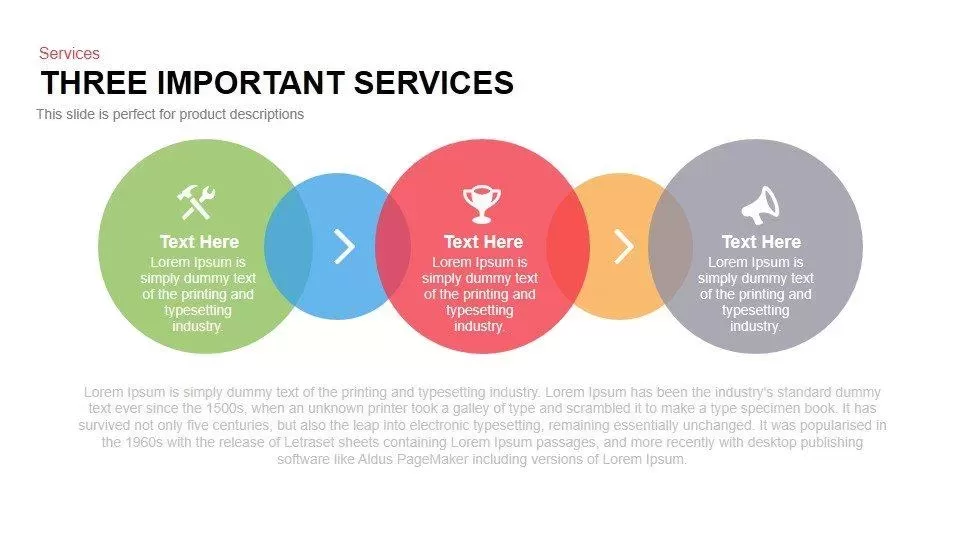
Three Important Services Flow Diagram Template for PowerPoint & Google Slides
Process
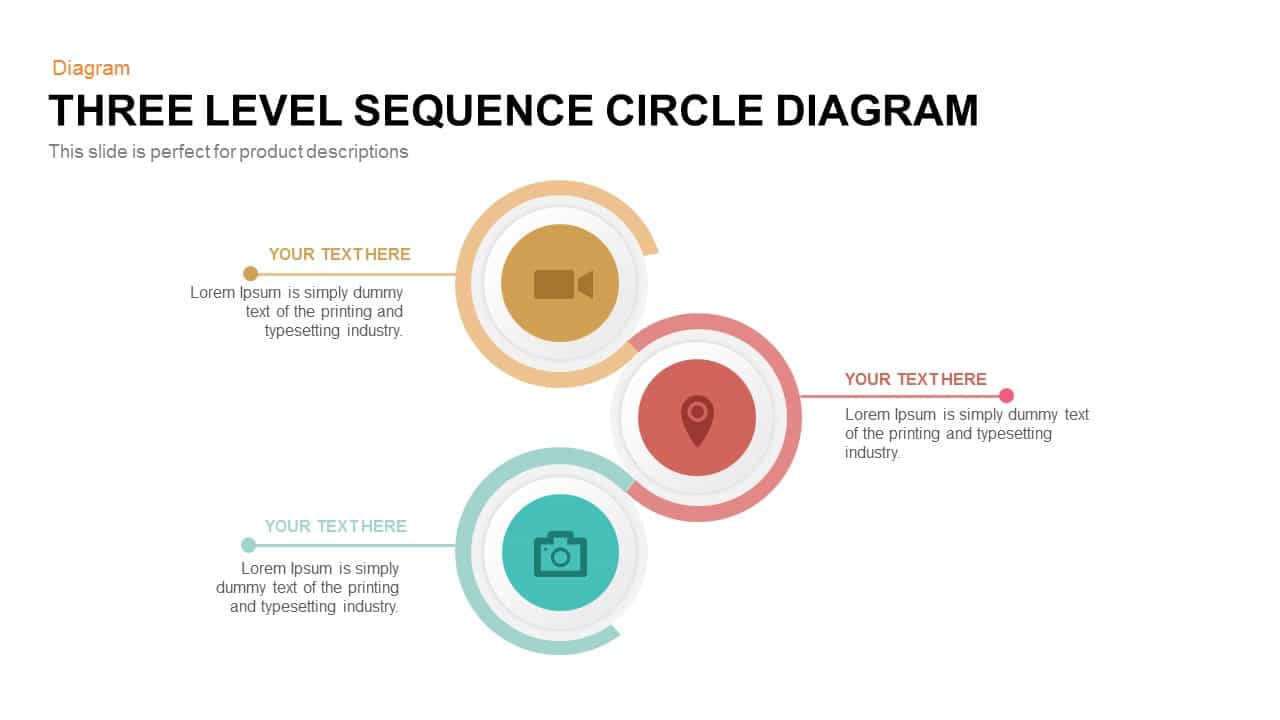
Three-Level Sequence Circle Diagram Template for PowerPoint & Google Slides
Circular
Three-Circle Diagram Infographic Template for PowerPoint & Google Slides
Circular
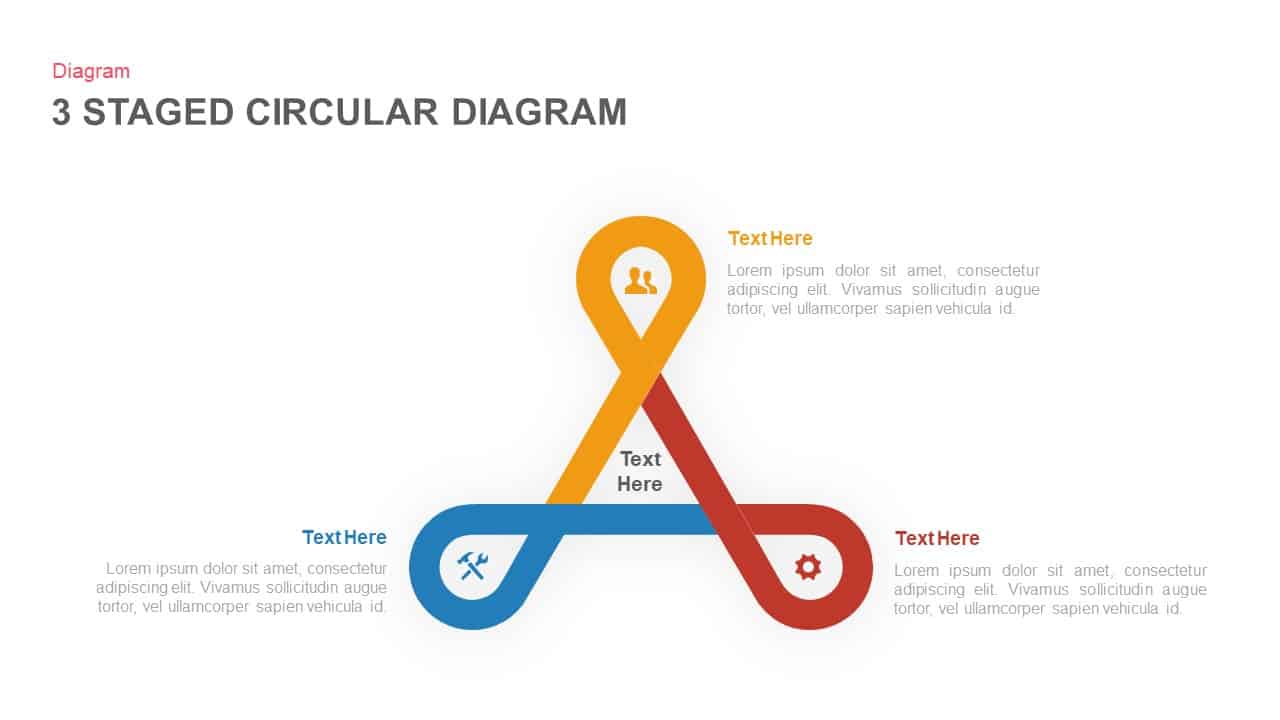
Three to Six Staged Circular Diagram Template for PowerPoint & Google Slides
Process
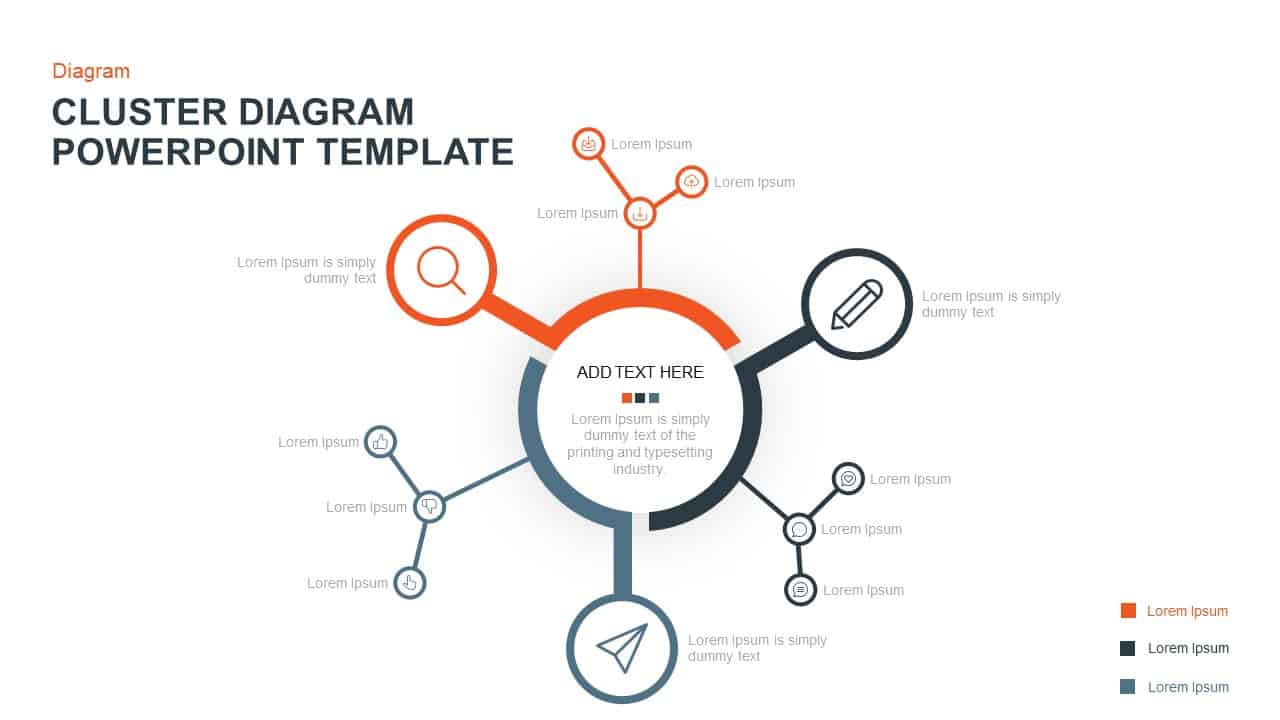
Three-Branch Cluster Diagram Presentation Template for PowerPoint & Google Slides
Mind Maps
Creative Three-Circle Venn Diagram Template for PowerPoint & Google Slides
Comparison
Circular Three-Step Infographic Diagram Template for PowerPoint & Google Slides
Circular

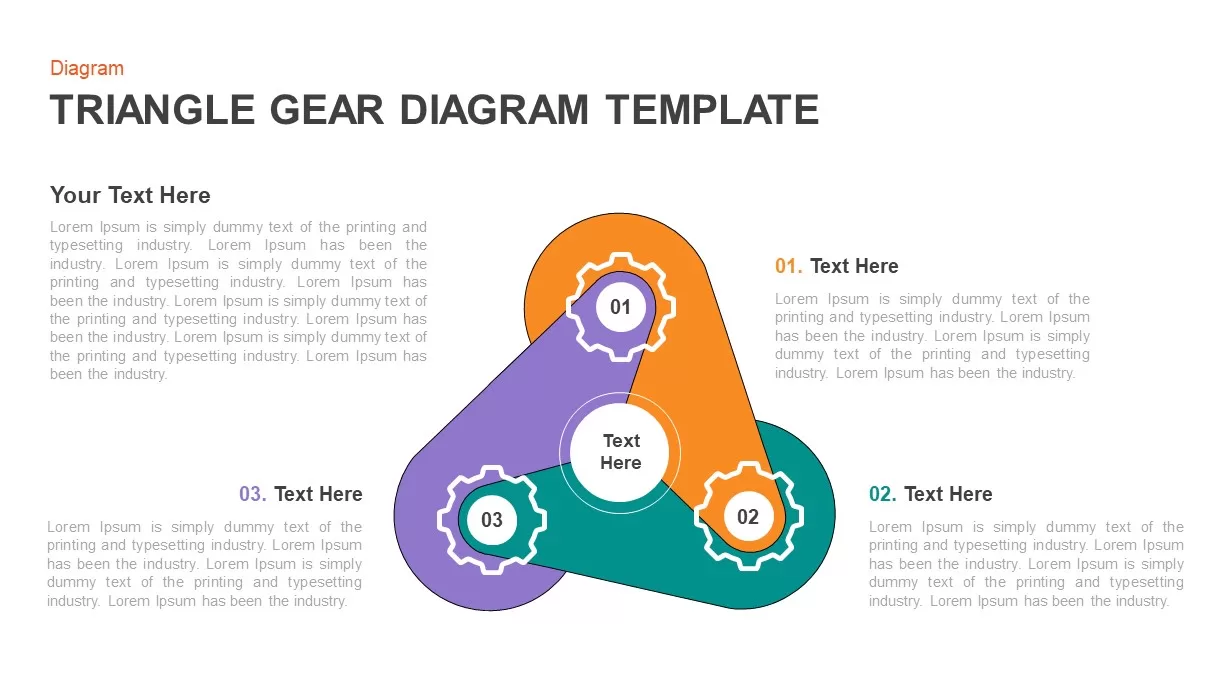
Three-Step Triangular Gear Diagram Template for PowerPoint & Google Slides
Process
Three-Step Result Diagram Infographic Template for PowerPoint & Google Slides
Process
Three-Part Puzzle Piece Diagram Template for PowerPoint & Google Slides
Process
Three-Step Circular Arrows Diagram Template for PowerPoint & Google Slides
Process
Three-Step Hub and Spoke Diagram Template for PowerPoint & Google Slides
Circular
Three-Stage S Curve Growth Diagram Template for PowerPoint & Google Slides
Process
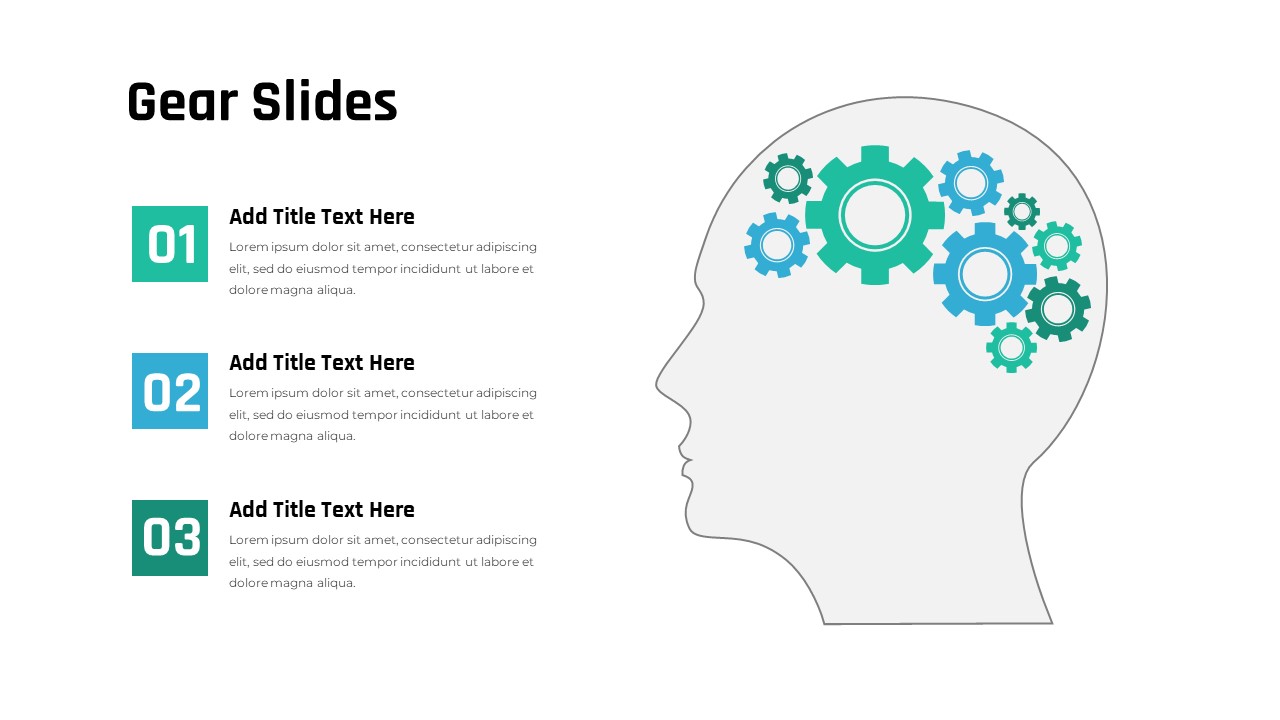
Three-Step Gears Brain Diagram Template for PowerPoint & Google Slides
Process
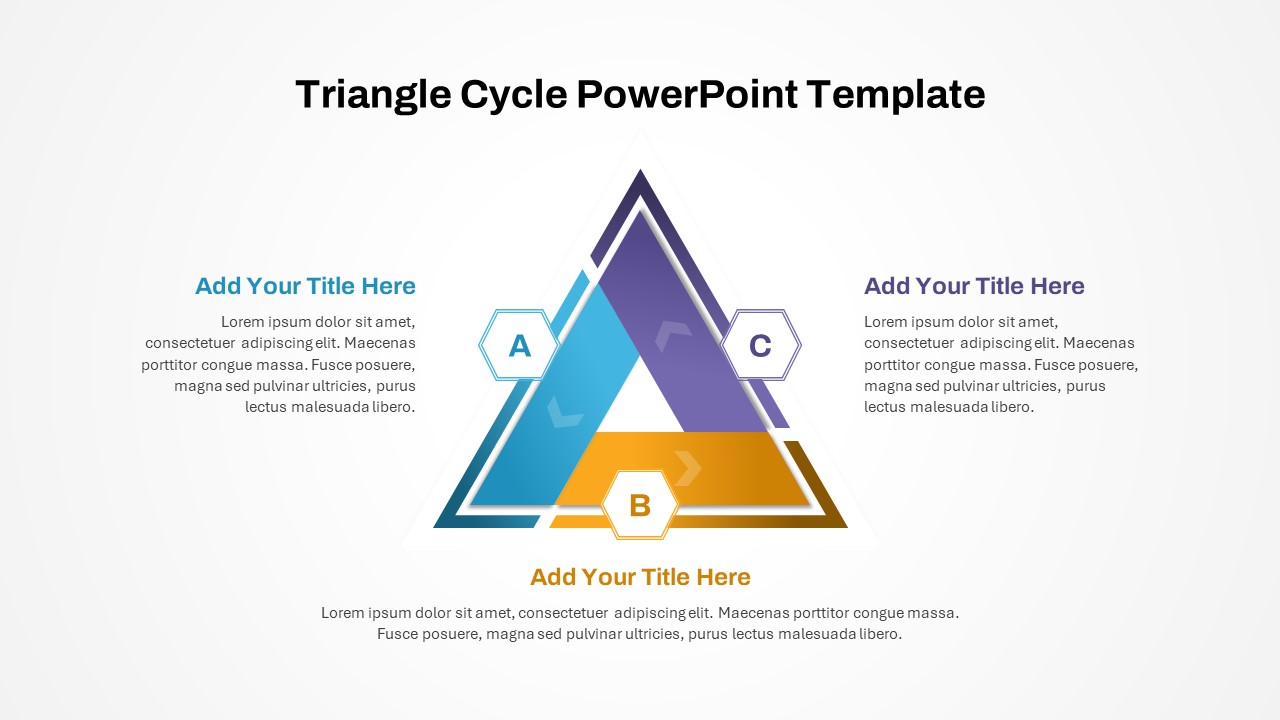
Three-Phase Triangle Cycle Diagram Template for PowerPoint & Google Slides
Infographics
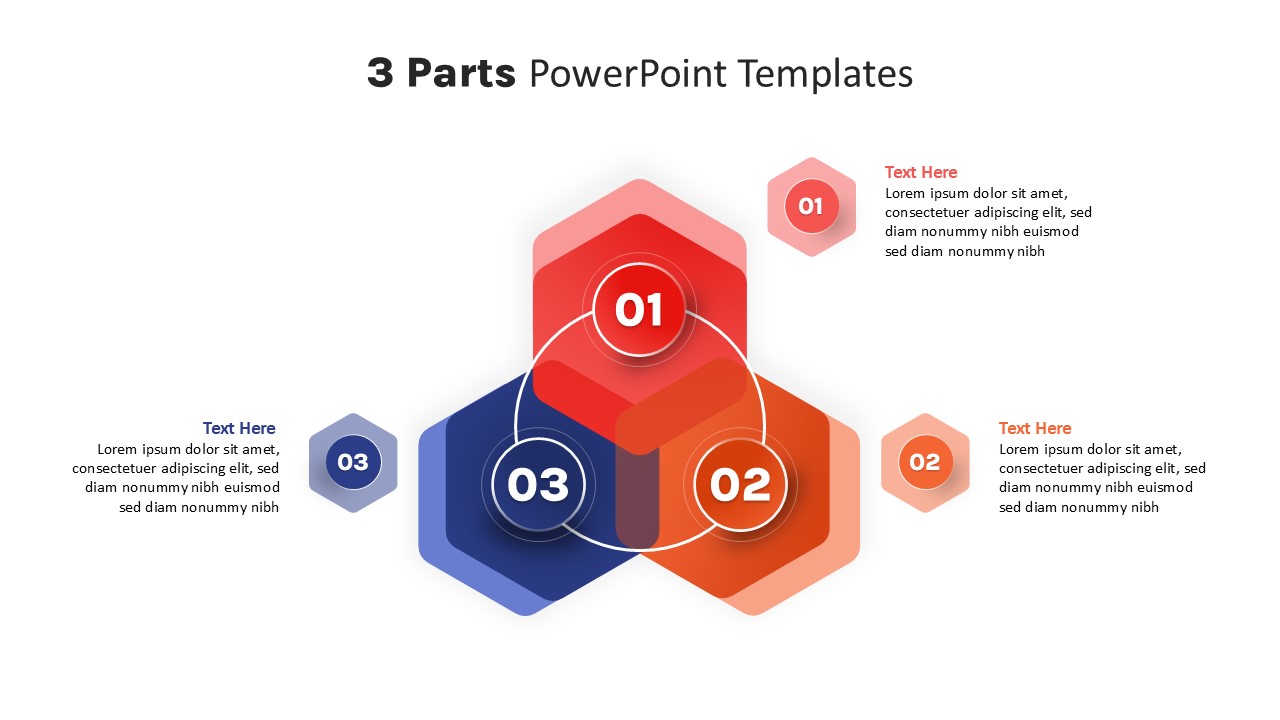
Three-Part Parts Infographic Diagram Template for PowerPoint & Google Slides
Process
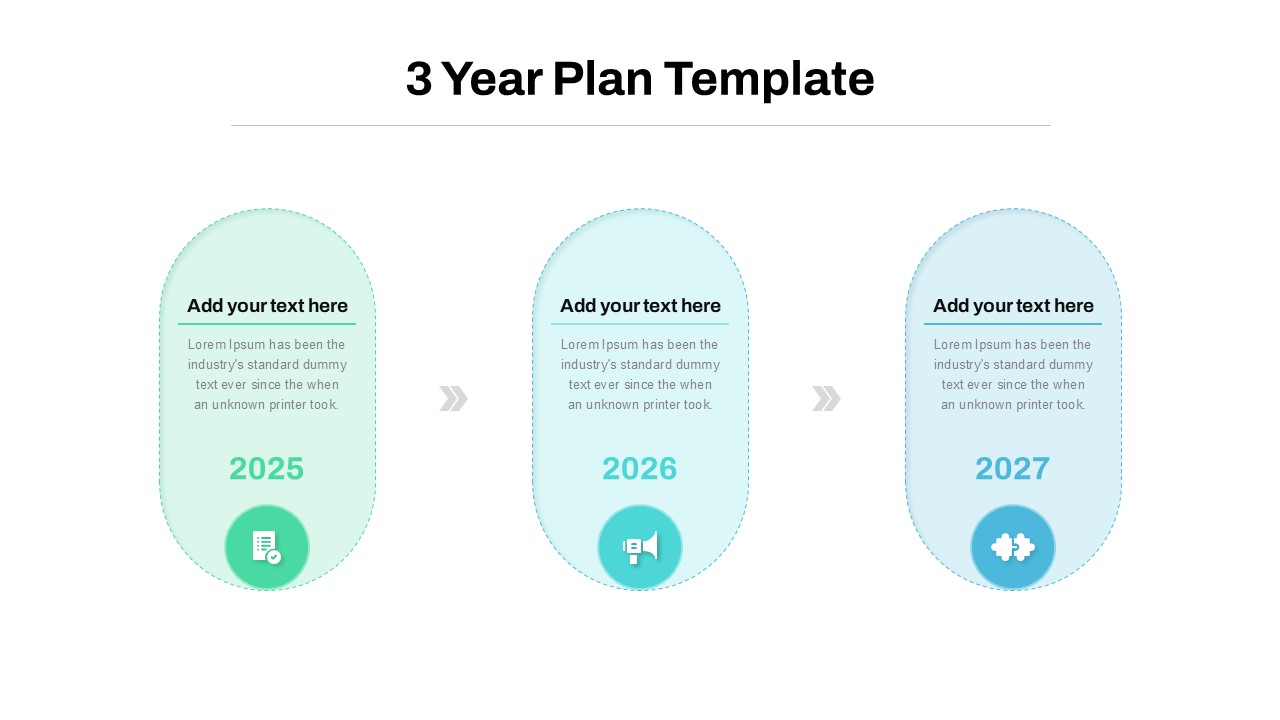
Three-Year Plan Timeline Diagram Template for PowerPoint & Google Slides
Timeline
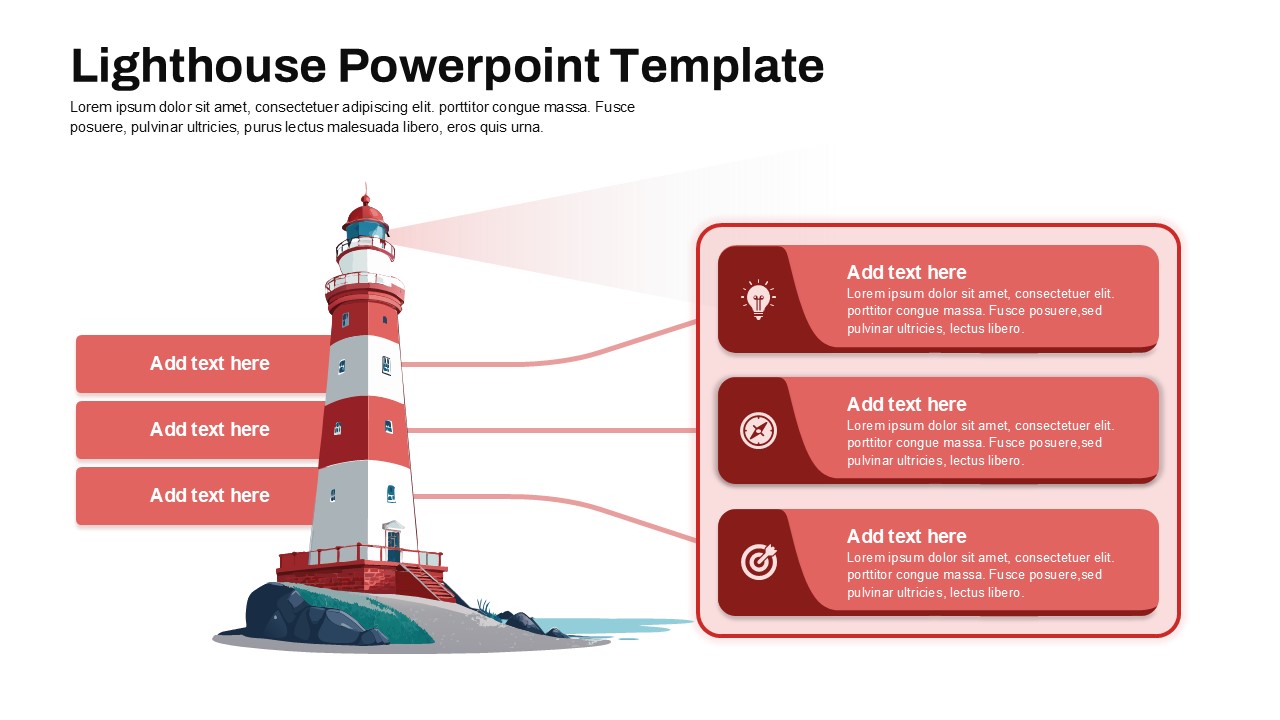
Lighthouse Three-Step Guidance Diagram Template for PowerPoint & Google Slides
Process
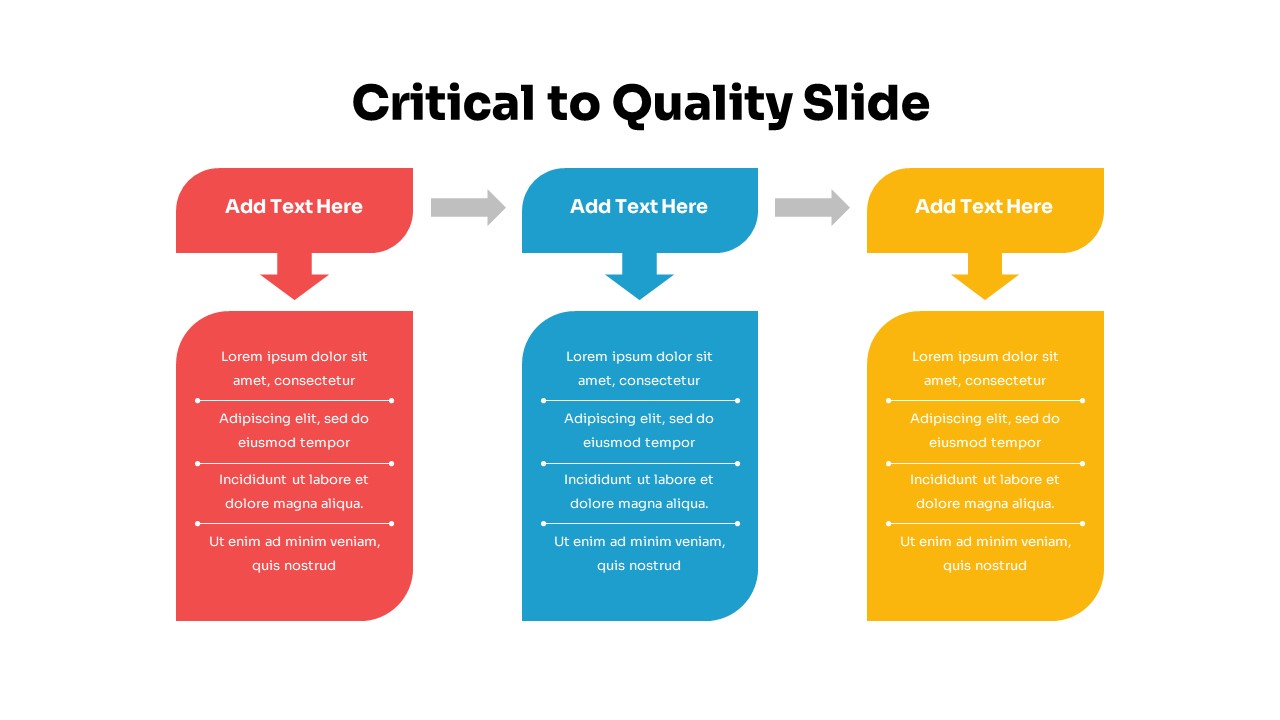
Three-Step Critical to Quality Slides Template for PowerPoint & Google Slides
Process
Four Section Medical Process template for PowerPoint & Google Slides
Process
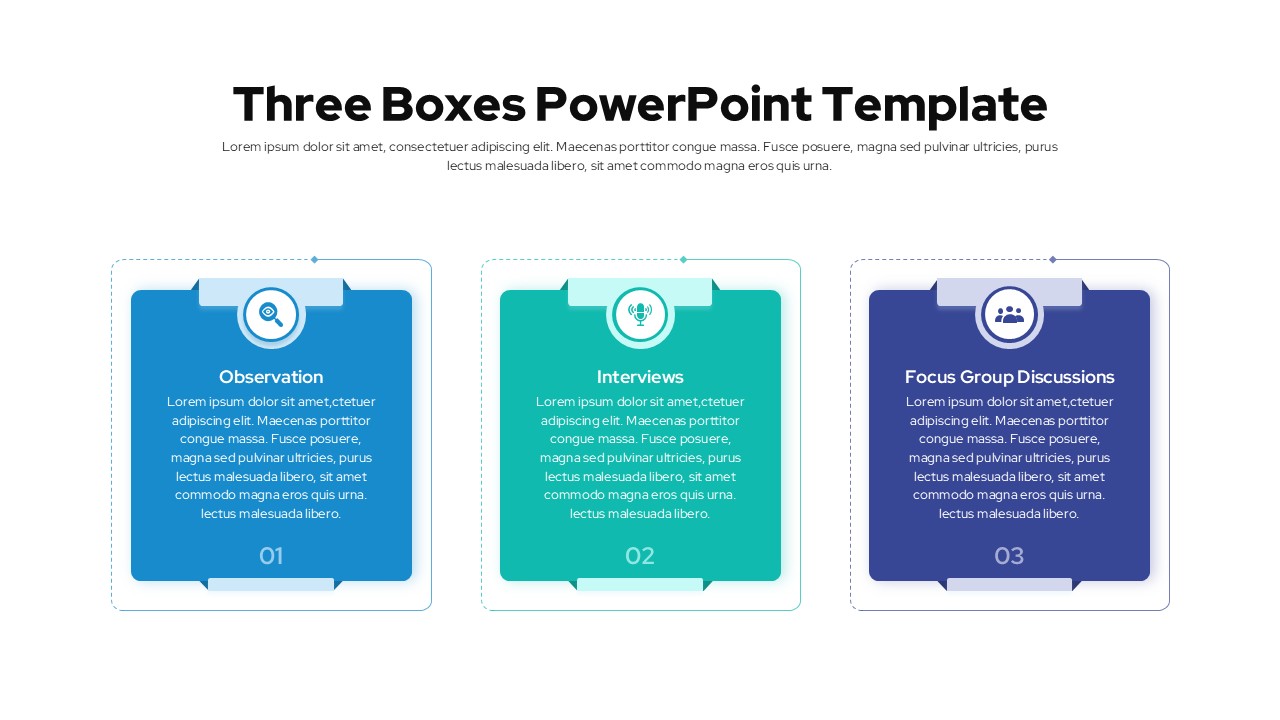
Three Boxes PowerPoint Template for PowerPoint & Google Slides
Business Report
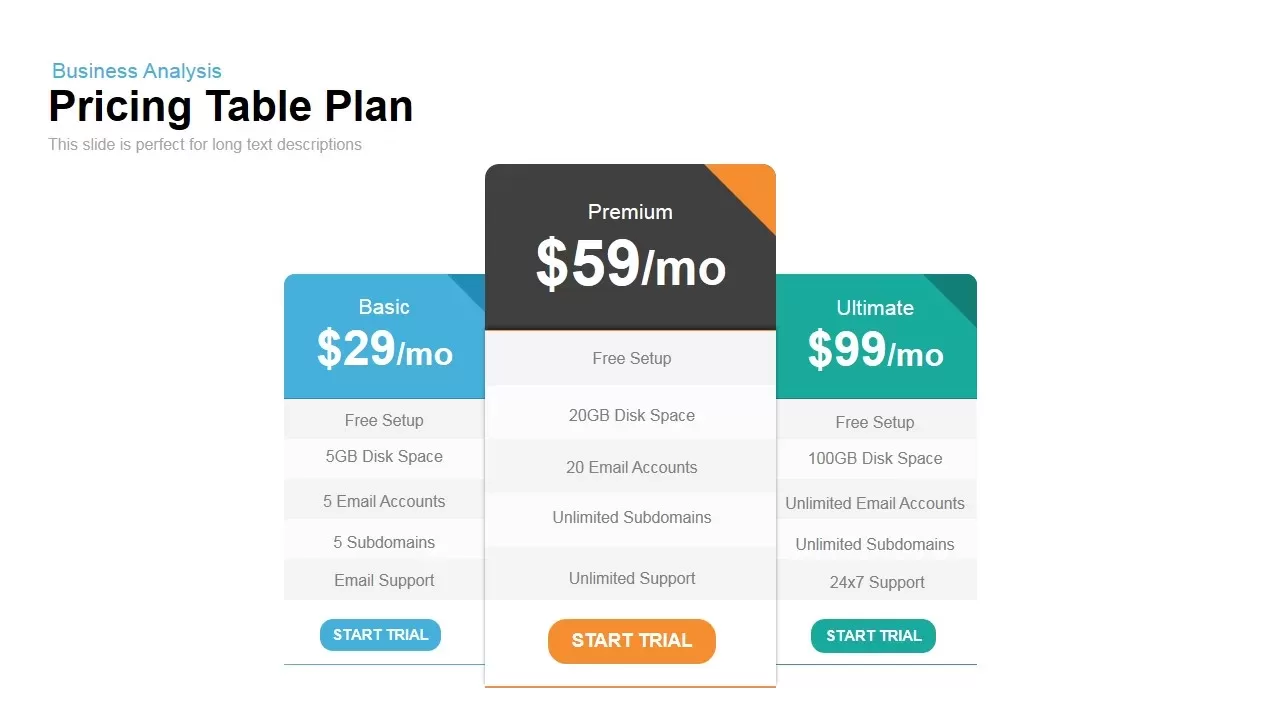
Three-Tier Pricing Table Slide Template for PowerPoint & Google Slides
Comparison
Three-Year Bar Chart template for PowerPoint & Google Slides
Charts
Three Four Five Stage Timeline Infographic Template for PowerPoint & Google Slides
Timeline

Three Subscription Pricing Plans Template for PowerPoint & Google Slides
Comparison
Three-Stage Circular Options Chart Template for PowerPoint & Google Slides
Comparison
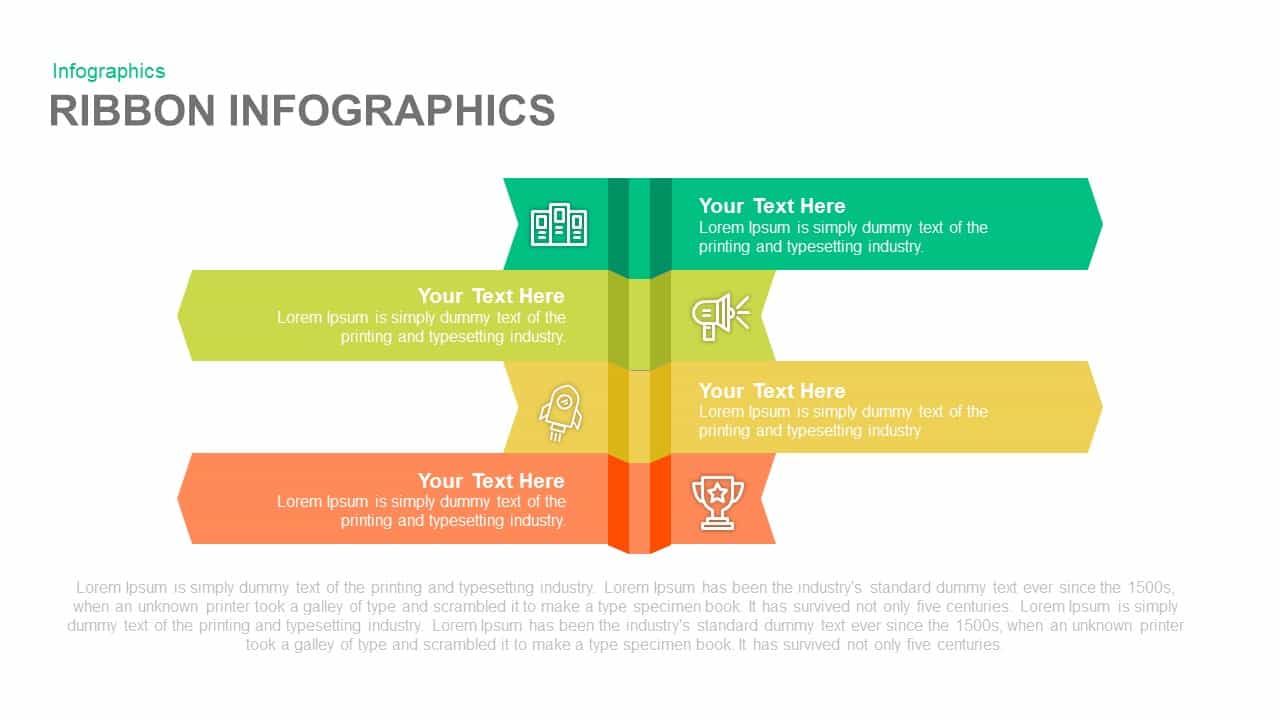
Dual-Side Three-Step Ribbon Infographic Template for PowerPoint & Google Slides
Comparison
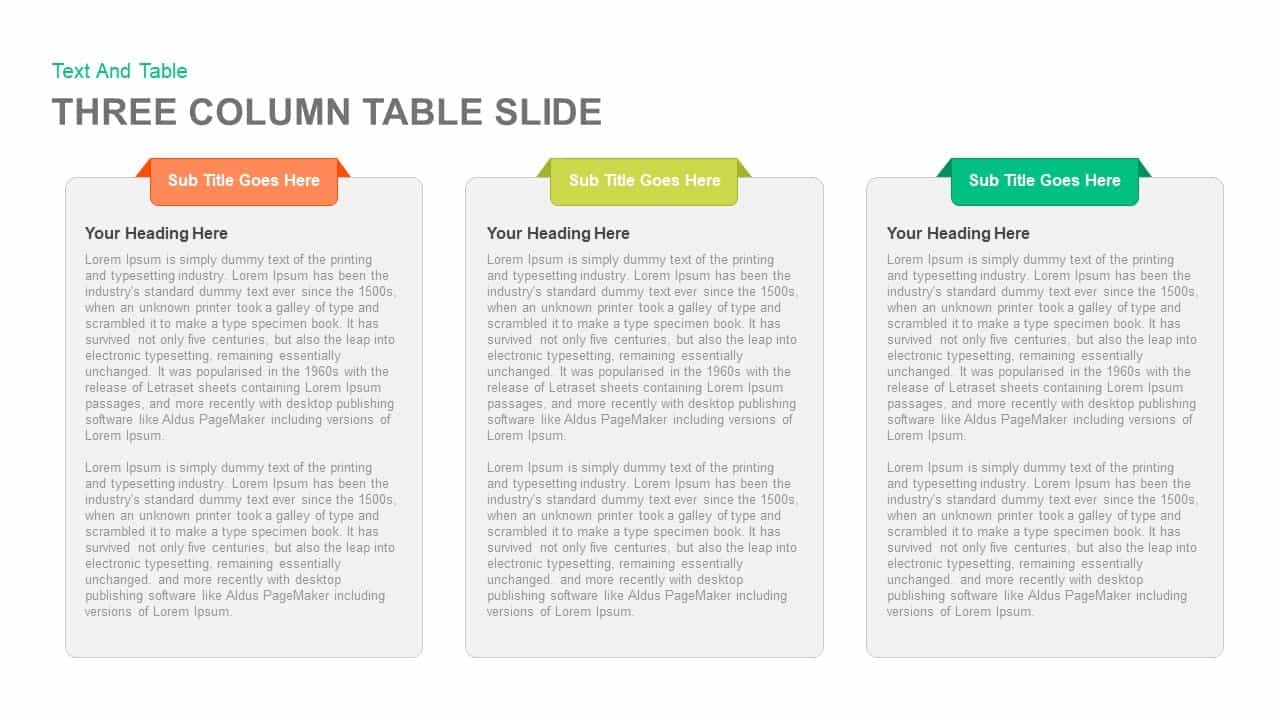
Clean Three-Four Column Table Slide Template for PowerPoint & Google Slides
Business Report
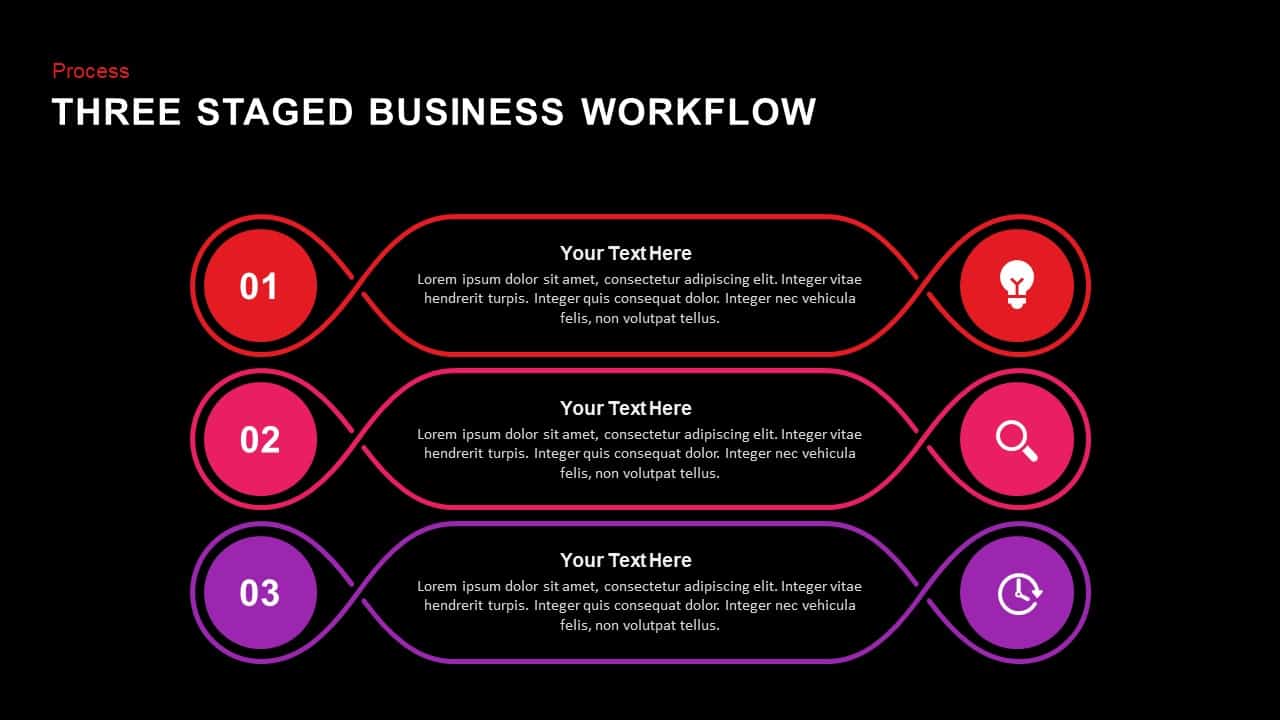
Three Staged Business Workflow template for PowerPoint & Google Slides
Business
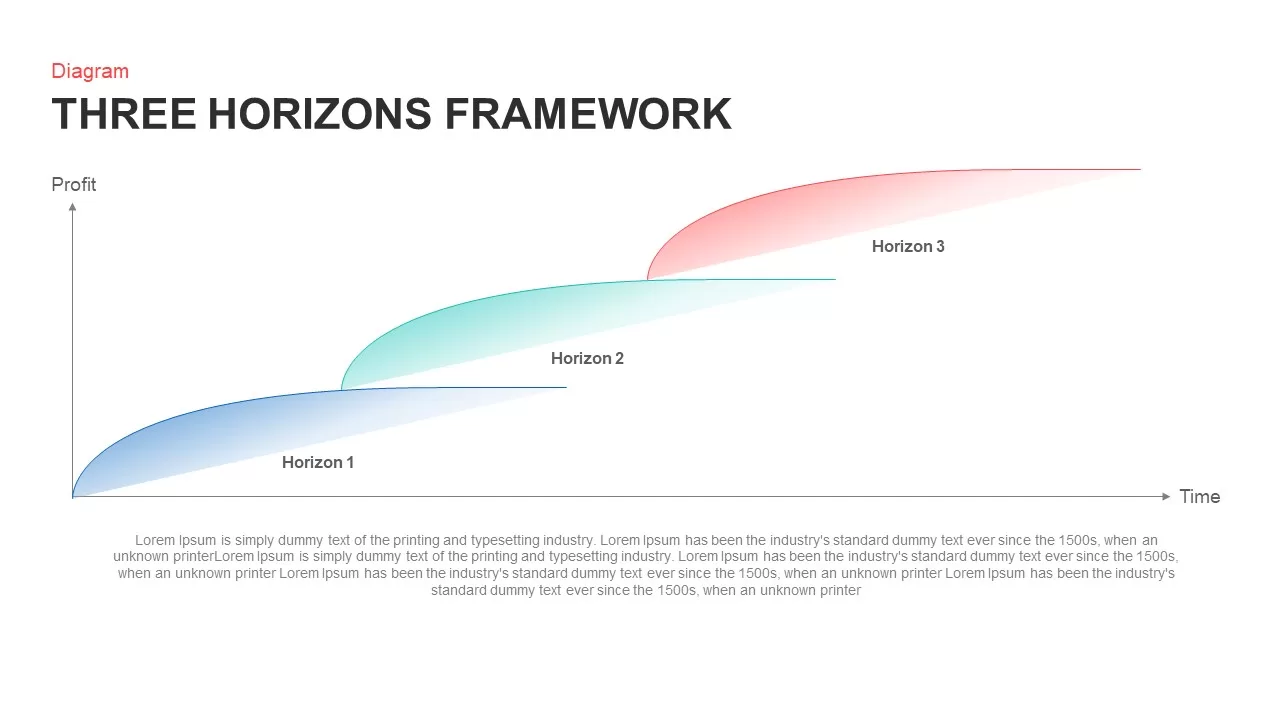
Strategic Three Horizons Framework Template for PowerPoint & Google Slides
Business Strategy
Three and Four-Column Card Layout Template for PowerPoint & Google Slides
Infographics
Three-Year Strategic Plan Matrix Template for PowerPoint & Google Slides
Timeline
Three-Option Gear Infographic Pro Template for PowerPoint & Google Slides
Process
Three-Phase Planning Gear Infographic Template for PowerPoint & Google Slides
Process
Three Pillars of Delight Template for PowerPoint & Google Slides
Business
Three-Year Plan Infographic Pack Template for PowerPoint & Google Slides
Timeline
Three-Segment Circular Arrow Cycle Template for PowerPoint & Google Slides
Circular
Three-Step Wavy Arrow Flow Template for PowerPoint & Google Slides
Process
Three-Path Curved Arrow Infographic Template for PowerPoint & Google Slides
Arrow
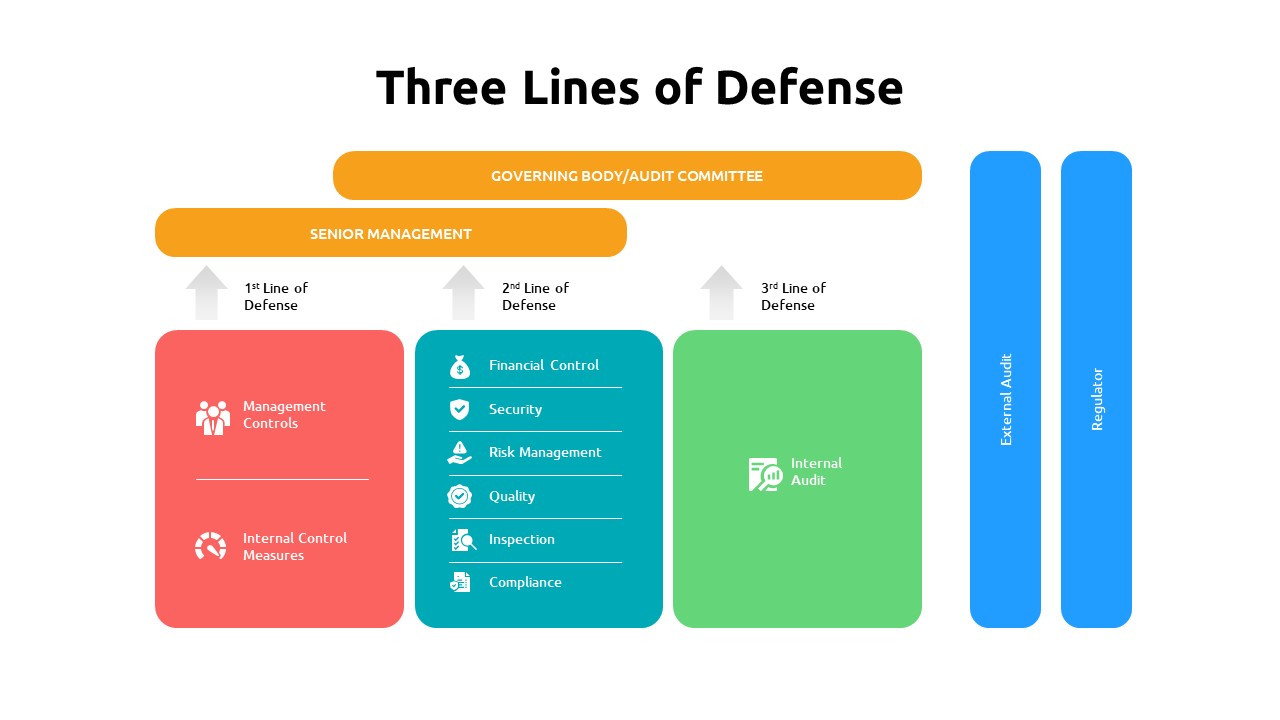
Three lines of defense template for PowerPoint & Google Slides
Risk Management
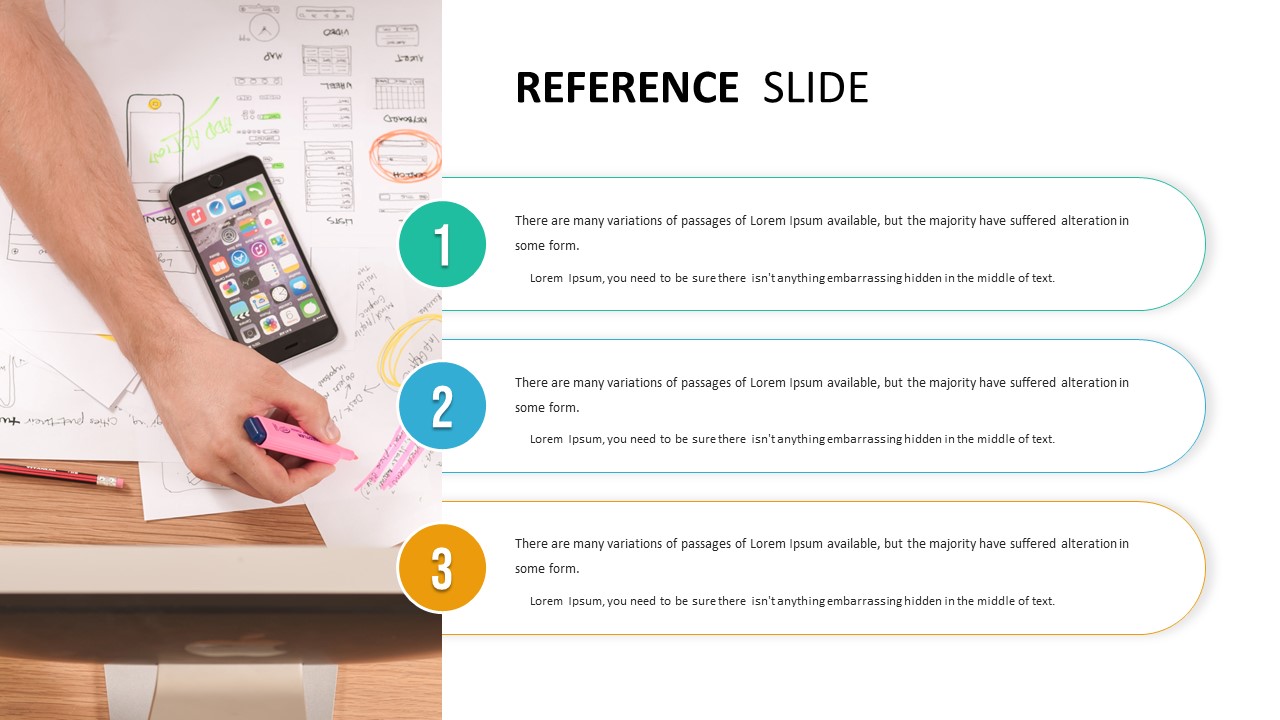
Three-Step Reference Slide Layout Template for PowerPoint & Google Slides
Infographics
Clean Three-Step Reference Slide Template for PowerPoint & Google Slides
Agenda
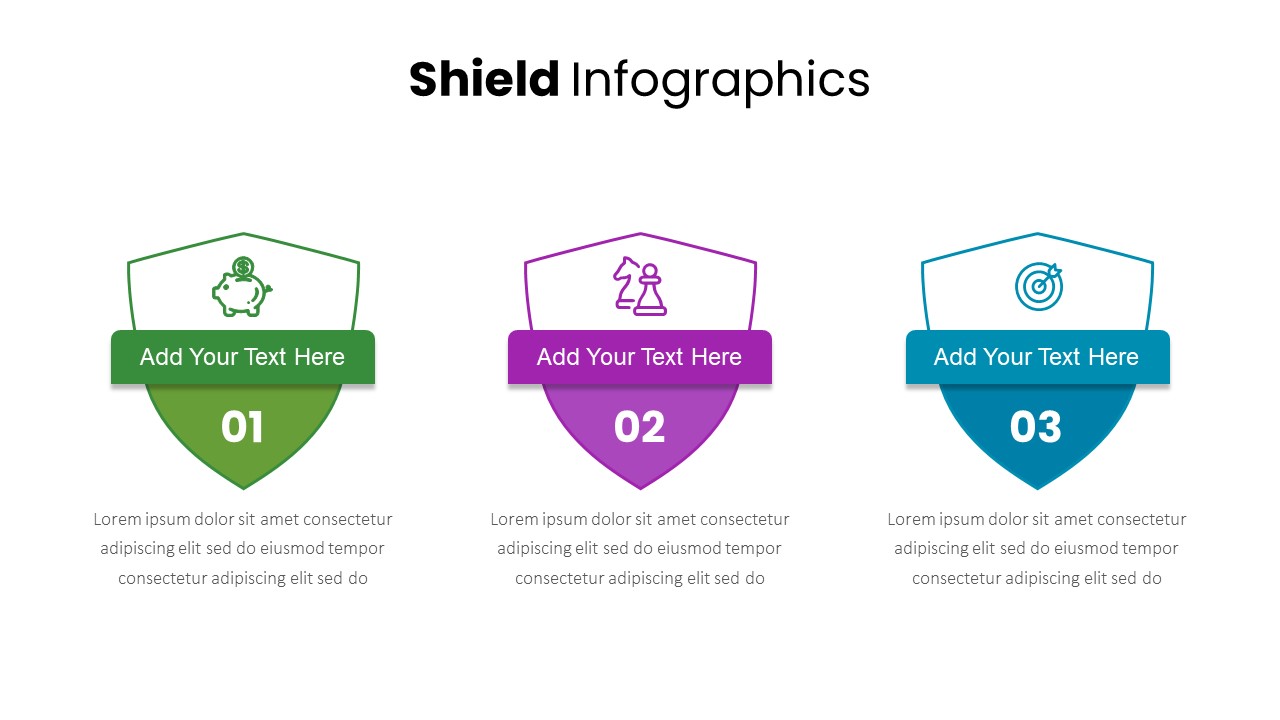
Three-Part Shield Infographics Template for PowerPoint & Google Slides
Comparison
Five-Phase and Three-Phase Phases Chart Template for PowerPoint & Google Slides
Charts
Three-Year Vertical Milestone Timeline Template for PowerPoint & Google Slides
Timeline
Three-Year Project Roadmap Timeline Template for PowerPoint & Google Slides
Timeline
Dynamic Three-Series Stacked Area Chart Template for PowerPoint & Google Slides
Comparison Chart
Three-Tier Pyramid Infographic Template for PowerPoint & Google Slides
Pyramid
Free Three and Four Pillar Infographic Pack Template for PowerPoint & Google Slides
Process
Free
Colorful Three-Presenter Profile Cards Template for PowerPoint & Google Slides
Our Team
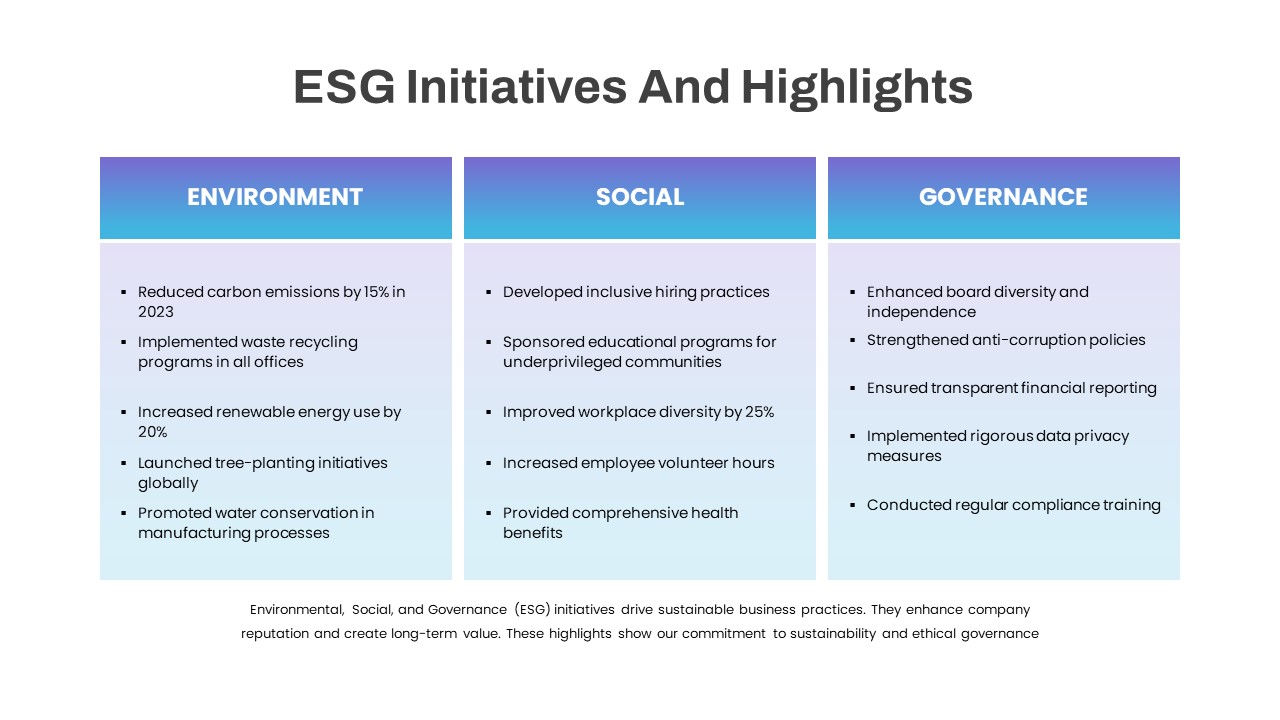
ESG Initiatives Three-Column Template for PowerPoint & Google Slides
Comparison
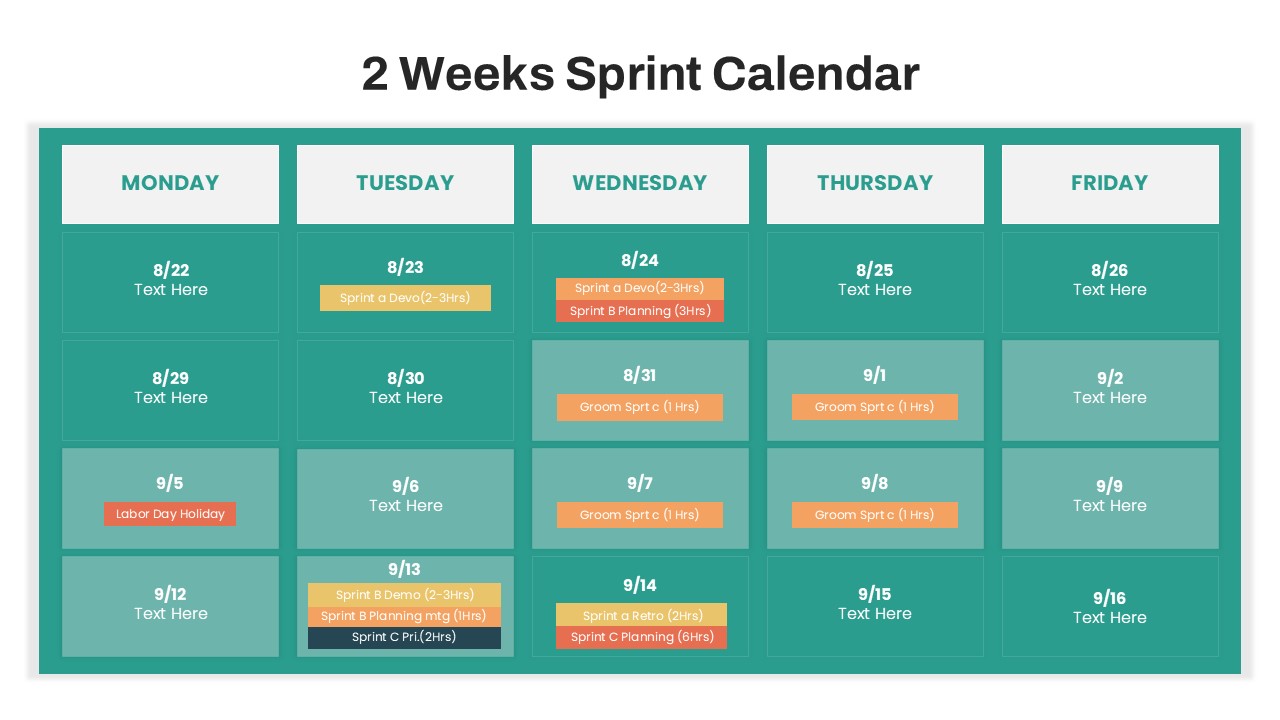
Two- and Three-Week Sprint Calendar Template for PowerPoint & Google Slides
Scrum
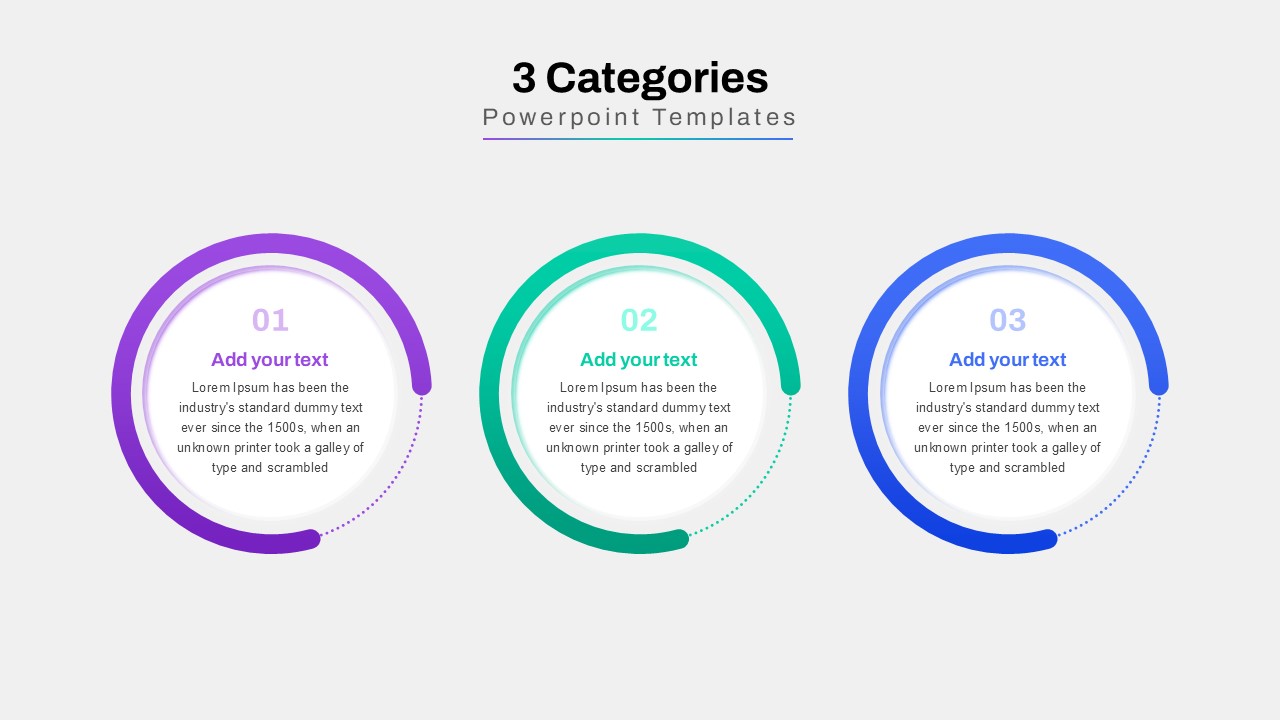
Three-Category Comparison Template for PowerPoint & Google Slides
Comparison
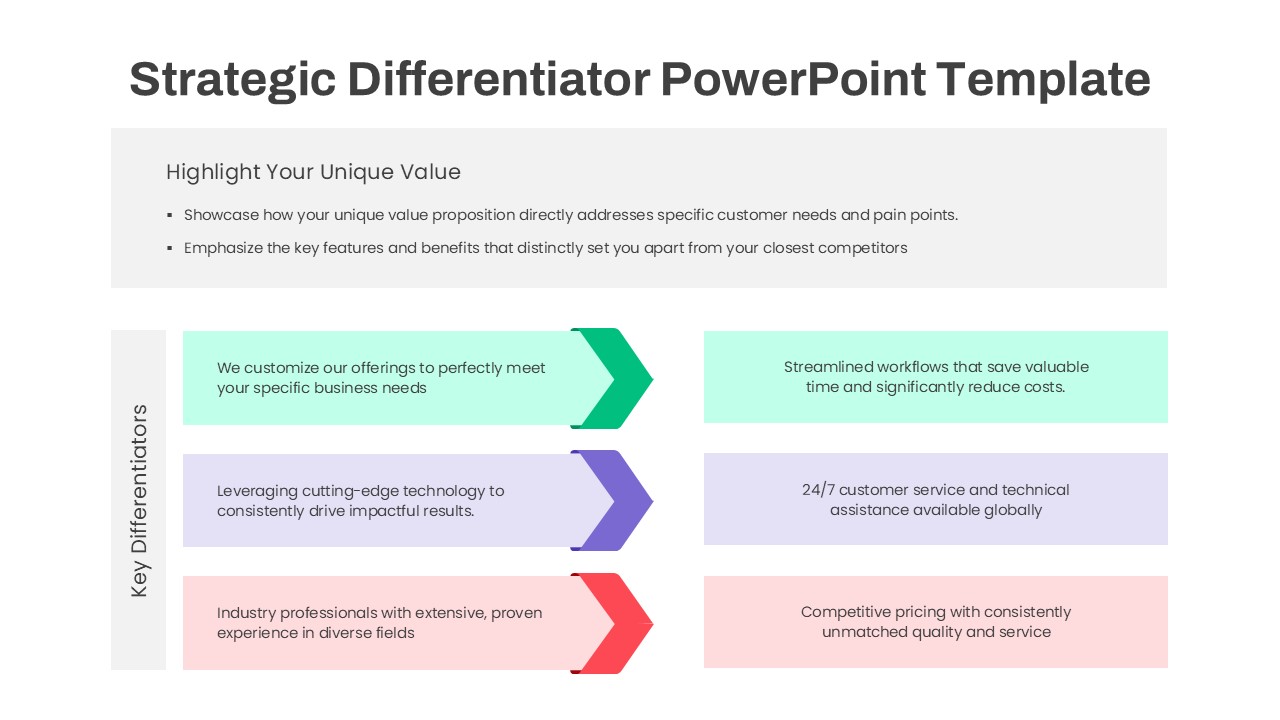
Three-Step Strategic Differentiator Template for PowerPoint & Google Slides
Competitor Analysis
Three Options Infographic Pack Template for PowerPoint & Google Slides
Process
Three-Step Servant Leadership Framework Template for PowerPoint & Google Slides
Leadership
QR Code Scan Me Three-Step Slide Template for PowerPoint & Google Slides
Infographics
Three Segment Donut Chart KPI Infographic Template for PowerPoint & Google Slides
Pie/Donut
Free Three-Option Comparison Slide for PowerPoint & Google Slides
Comparison
Free
Eight Section Circular Diagram Template for PowerPoint & Google Slides
Circular
Editable Four-Section 3D Shape Diagram Template for PowerPoint & Google Slides
Comparison
Four Section Diagram Infographics template for PowerPoint & Google Slides
Process